Article

A Novel Data-Driven Tool Based on Non-Linear Optimization for Offshore Wind Farm Siting

by
Marina Polykarpou
1,*,
Flora Karathanasi
1,2,*,
Takvor Soukissian
3,
Vasiliki Loukaidi
2,3 and
Ioannis Kyriakides
1,4
1
Cyprus Marine and Maritime Institute, Vasileos Pavlou Square, Larnaca 6023, Cyprus
2
Hellenic Hydrocarbons and Energy Resources Management Company, Dim. Margari 18, 115 25 Athens, Greece
3
Hellenic Centre for Marine Research, 46.7 km Athens Sounio Ave., 190 13 Anavyssos, Greece
4
Department of Engineering, School of Engineering, University of Nicosia, 46 Makedonitissas Ave., Nicosia 2417, Cyprus
*
Authors to whom correspondence should be addressed.
Energies 2023, 16(5), 2235; https://doi.org/10.3390/en16052235
Submission received: 29 January 2023 / Revised: 20 February 2023 / Accepted: 23 February 2023 / Published: 25 February 2023

Abstract

:
One preliminary key step for developing an offshore wind farm is identifying favorable sites. The process of sitting involves multiple requirements and constraints, and therefore, its feasible implementation requires either approximating assumptions or an optimization method that is capable of handling non-linear relationships and heterogeneous factors. A new optimization method is proposed to address this problem that efficiently and accurately combines essential technical criteria, such as wind speed, water depth, and distance from shore, to identify favorable areas for offshore wind farm development through a user-friendly data-driven tool. Appropriate ranks and weighting factors are carefully selected to obtain realistic results. The proposed methodology is applied in the central Aegean Sea, which has a high offshore wind energy potential. The application of the proposed optimization method reveals large areas suitable for developing floating wind energy structures. The algorithm matches the accuracy of the exhaustive search method. It, therefore, produces the optimum outcome, however, at a lower computational expense demonstrating the proposed method’s potential for larger spatial-scale analysis and use as a decision support tool.

1. Introduction

Allocating marine areas for human activities that include aquaculture, renewable energy generation, tourism, and shipping, requires geospatial data, expertise in relevant industry sectors, and the identification of the various interactions and constraints between sectors. For example, different types and sizes of aquaculture stations and renewable energy devices require different depths and sea-surface areas. Additionally, aquaculture and renewable energy installations cannot be collocated with shipping routes. Such interactions and constraints result in a complex problem of maritime spatial planning.
Among all types of “green” energy, wind power is one of the fast-growing and most cost-effective renewable energy sources. As an alternative to fossil fuels, wind energy can offer many advantages for human societies and the environment. Specifically, it can significantly decrease CO2 emissions, mitigate the effects of climate change, decouple energy costs from oil prices, improve competitiveness with an internal energy market, and ensure a secure energy supply, a key element in the EU energy policy. Wind turbines are considered one of the most competitive renewable technologies in terms of cost. Even though onshore wind farm deployment is more mature and still less expensive than offshore, offshore wind farms (OWFs) are rapidly expanding globally, becoming a prominent renewable energy source. Although OWFs demand higher construction and operational costs than onshore installations, the resource potential encountered offshore, and the ability to utilize vast spaces at sea with larger wind turbines are solid motives for investments [1].
Northern European countries have exploited offshore wind to a great extent, with 45% and 27% of the total installed capacity being connected in the United Kingdom and Germany, respectively [2]. On the other hand, in the Mediterranean countries, the development of such projects follows a relatively slow pace; the first OWF was inaugurated in 2022 offshore Taranto with a capacity of 30 MW [3]. A few years ago, investing was not an urgent priority despite Greece’s significantly high available offshore wind potential. The main reason for this was the lack of a solid legislation framework. However, very recently (July 2022), the Greek Parliament approved new legislation (Law No. 4964/2022, articles 65–80) focusing on developing offshore wind energy and simplifying the relevant licensing procedures. The national goal is to install at least 2 GW in offshore wind farms by 2030. According to this law, among the first steps in developing offshore wind in Greece are the approval of the National OWF Development Programme, which will propose potential zones for OWF development, followed by a presidential decree that will finalize the areas for the development of OWFs. In this context, it is clear that identifying suitable areas for OWF development is of utmost importance.
The OWF site selection problem presupposes the consideration of a multitude of, either qualitative or quantitative, parameters such as technical, environmental, and socio-economic factors that reflect the designer’s or decision maker’s priorities and preferences and involve constraints and expected impacts [4]. Moreover, this problem requires analyzing the above parameters using geographical features and implementing mathematical models for management and spatial planning purposes. On the other hand, multi-criteria decision analysis (MCDA) methods have been developed to provide a preferred alternative by determining and assessing the importance of the selected criteria in the decision-making (weighting process), aggregating all information usually into an impact matrix (alternatives vs. criteria), and ranking alternatives subjectively [5]. Thus, MCDA methods have supported decision-making through the joint consideration of multiple parameters and the evaluation of the characteristics of various sites for selecting the best among multiple alternatives. It should be noted that the final outcome for a given problem may differ when using either the same set of criteria and weighting/aggregation techniques with different MCDA methods or different criteria and weights with the same MCDA method.
Several MCDA methods have been introduced over the years, characterized by individual advantages and disadvantages. Although the rationale of the various MCDA methods is similar, the algorithms implemented to achieve the final goal, assumptions, computational complexity, speed, and applicability differ within them. Some examples of MCDA approaches include distance-based methods, ratio-based additive methods, and algorithms that operate under compromising situations. Weighted Sum Method (WSM) [6], later modified to Weighted Product Method (WPM); Analytical Hierarchy Process (AHP) proposed by [7]; Technique for Order Preference by Similarity to Ideal Solutions (TOPSIS) [8]; Vlšekriterijumsko KOmpromisno Rangiranje—or multi-criteria optimization and compromise solution—(VIKOR) [9]; Elimination and Choice Translating Reality (ELECTRE) [10] and its evolutions; and Performance Ranking Organization Method for Enrichment of Evaluations (PROMETHEE) [11] are some well-known techniques used in energy decision-making studies. For a review and comparative analysis of different MCDA methods, see also [12,13,14,15]. For example, Ref. [16] used the AHP to assess renewable energy generation sources in Saudi Arabia. Deveci, Özcan, and John presented a TOPSIS technique to select the best site for offshore wind farm development in the Black Sea Region of Turkey [17]. Xiao and Wang applied the VIKOR method to identify and propose suitable provinces in China for building solar power plants [18]. In [19], a new hybrid method is proposed that is a combination of AHP and PROMETHEE-II methods to select sites for offshore wind energy projects in Egypt. In the offshore wind energy sector, the MCDA methods have been applied at a national (e.g., [20,21,22]), regional (e.g., [23]), and local level (e.g., [24,25]).
Few studies have been conducted to identify favorable locations for offshore wind energy projects in the Greek Seas, most of which have employed the AHP from the MCDA family of methods. Specifically, Ref. [26] applied AHP to evaluate and compare sites for offshore wind farm projects in Greece, while [4] proposed a methodological framework for the identification of appropriate areas that can host offshore wind and wave energy systems simultaneously. This framework was based on AHP for evaluation and ranking purposes and Geographic Information System (GIS) for processing and representing the data and was implemented in Greece. Vagiona and Kamilakis developed and applied an integrated methodology to address the offshore wind farm site selection problem in the South Aegean Sea by combining AHP and TOPSIS [27]. Ref. [28] used the AHP method and GIS tools to identify suitable areas for OWFs around Crete Island by considering 14 exclusion and 16 evaluation criteria.
In this work, the authors use a non-linear optimization method that is capable of navigating through the possibly multimodal surface of a cost function that considers the various factors related to the choice of placement of offshore energy production facilities while avoiding simplifying approximations. Choices of non-linear optimization methods include genetic algorithms that are inspired by natural evolution. In Genetic Algorithm-based methods, potential solutions to the optimization problem evolve over time through evolutionary operations such as selection, crossover, and mutation with the goal to preserve and combine the best aspects of those solutions in the concept of the “survival of the fittest” [29,30,31]. Genetic algorithms are commonly used to optimize the layout or arrangement of objects in space. Such applications include facility layout, warehouse optimization, and the optimization of the spatial layout of the process industry. Genetic algorithms have been applied to solve problems related to the optimal placement and sizing of distributed energy generation systems, as demonstrated in [32,33]. Additionally, Ref. [34] presents an example of using genetic algorithms for multi-objective forest planning.
Another well-known probabilistic optimization algorithm used for solving spatial optimization problems is Simulated Annealing. Simulated Annealing is based on the idea of annealing in metallurgy, in which a material is heated and then gradually cooled to reduce defects and increase its structural purity [35]. The algorithm generates a random initial solution and then, similarly to genetic algorithms, it iteratively alters it, but, in this case, it accepts or rejects the change based on the improvement it causes to the solution. The decision of whether to accept or reject a solution is made using a probabilistic function that, early in the optimization process, can enable the acceptance of other than the best solution to avoid local optima [36]. Simulated Annealing has been applied in multiple spatial optimization problems, including the spatial layout of a process industry [37] and the distribution of generation facilities [38].
Particle Swarm Optimization is another optimization technique for finding the best solution to a problem by imitating the behavior of birds or fish in a group [39]. This is achieved by representing potential solutions as particles and continually adjusting them based on their ability to solve the problem and the progress of nearby particles [39]. This method can be applied to many problems with multiple dimensions. Particle Swarm Optimization has been used in various fields, such as forestry for optimal forest spatial planning [40], land use management for spatial structure optimization [41], and urban water management [42].
The Ant Colony Optimization algorithm simulates the behavior of insects (ants) when they follow the shortest path toward their food source. In this process, ants release a chemical called pheromone as they move between the colony and food sources. This creates a pheromone trail that other ants can detect and use to find their way. The trails with the strongest pheromone concentrations are more likely to be chosen, further strengthening the trail through a positive feedback loop. Over time, this leads to the formation of the shortest path between the colony and food sources [43]. Ant Colony Optimization is used in many cases, including solving the ship pipe route design optimization problem in 3D space using a dynamic local search. The problem can be translated to a graph representation, and Ant Colony Optimization is used to find the shortest path that satisfies the greatest number of constraints [44].
In this paper, the authors (a) propose a new optimization method for identifying areas suitable for offshore energy production, and (b) the method for the allocation of wind farms in the Aegean Sea is applied. The authors define an objective function that includes the conditions for the operation of renewable energy sources, i.e., water depth and wind speed; constraints related to other activities, such as shipping routes; and other technical restrictions, including distance from shore, distance from ports, and suitability of electrical grid infrastructure. The objective function, made of heterogeneous criteria, forms a multimodal surface with multiple locations of possible renewable energy installations. To solve the optimization problem, a method is developed based on sequential Monte Carlo methods [45,46,47,48]. The authors assess the effectiveness of the method in consistently identifying areas of deployment of renewable energy installation and the method to an exhaustive search in terms of efficiency and computational expense.
The structure of the full paper is as follows. In Section 2, the authors state the optimization problem in terms of the objective function that depends on criteria and constraints of offshore energy production, and the methodology for solving the optimization problem and the algorithm is provided. In Section 3, the data utilized for the purposes of this work are briefly described, and the simulation results are provided, demonstrating the effectiveness of the method in identifying the areas suitable for hosting offshore energy installations while minimizing conflicts with other human or environmental processes. Section 4 presents the results of the new tool and the comparative analysis with the exhaustive search method. In the final section, the main findings of this study are summarized, additional applications where this approach could be useful are recommended, and subsequent research directions are proposed.

2. Materials and Methods

2.1. Problem Statement

The problem of identifying suitable areas for offshore energy production is posed as an optimization problem. The problem consists of maximizing an objective function reflecting the conditions and constraints related to offshore energy production installations. The objective function is then a two-dimensional function of the position of possible offshore energy production units in the Cartesian coordinates. The objective function is, moreover, composed of functions that represent the conditions necessary for significant renewable energy production and constraints imposed by other activities or natural environment protective measures.
The objective function is given by:
W x = m = 1 M I w m x m = 1 M c m w m x
where
x = χ ψ
which is a two-dimensional vector with elements χ and ψ that denote spatial coordinates in the Cartesian plane. w i x are functions that describe the suitability of a location with coordinates χ , ψ based on a factor indexed by m = 1 , , M . Functions w m x may, for example, have high values at locations with coordinates χ , ψ associated with factors such as depth, average wind speeds, or distance from suitable harbor facilities and low values when criteria for feasible or efficient offshore energy production are partially met. Similarly, functions w m x may be assigned low values at coordinates χ , ψ reserved for shipping routes or marine protected areas. The factors used in this study are provided in more detail in the “Simulation Results” section. Furthermore, c m ,   m = 1 , , M are the contributions of the M factors to the total weight specified in the “Simulation Results” section. For example, some natural environment or human activity factors, such as shipping routes at coordinates χ , ψ Will have a low-valued contribution to the overall weight as they are prohibitive to the placement of offshore energy installations. Additionally, an indicator function is defined that will be used to set the total weight to zero in case any of the factors produce a zero weight. The indicator function is defined as
I w m = 1 ,     w m > 0 0 ,     otherwise

2.2. Optimization Method

The optimization problem utilizes the two-dimensional objective function in (1) that takes into account all factors affecting the choice of locations for offshore energy production. Additionally, the sought solution does not include a single point but instead larger areas that are represented by peaks in the objective function. This is because the objective function has many locally optimal solutions representing multiple areas where offshore energy production would be suitable based on the set criteria.
A sequential Monte Carlo method is proposed and described briefly in this section to identify the peaks in the objective function. The method evolves a large number of hypotheses indexed by l = 1 , , L on the possible locations of offshore wind energy installations. The optimization method initially proposes multiple hypothetical locations uniformly across the geographical area examined. The locations are then given weights based on the value of the objective function. The weights are normalized to sum to one, and then an equal number of locations is sampled with replacement from the pool of available locations. The sampled locations also evolve by adding Gaussian noise to increase the diversity and to navigate towards higher objective value functions. The repeated evolution of the locations and the resampling operation results in the concentration of hypothetical locations in favorable areas for offshore wind energy. Next, the hypothetical locations are clustered, and areas are defined based on the clusters. The process is then provided in detail.
Each hypothetical location evolves as:
x l , j = x l , j 1 + V η l , j
where j is the iteration step, η l , j is a process noise vector of zero-mean, unit variance Gaussian random variables, and V is a diagonal matrix with the square root of the variance of the process noise vector in its main diagonal. In addition to providing diversity in the proposed locations, the noise component accommodates errors in data provided for constructing the objective function. After the evolution step, hypotheses are assessed by evaluating the objective function at each location, resulting in location weights given by (1) as:
W l x l , j = m = 1 M I w m x l , j m = 1 M c m w m x l , j ,   l = 1 , ,   L ,
where the indicator function in (3), the weights based on each factor, and the factor’s importance have been used. The weights are normalized to form a probability distribution, and locations are sampled with replacement. After a number of evolutions, weighting, and sampling steps, locations start to form clusters, identified using K-means clustering. Specifically, clustering is performed based on the geographical distance between proposed locations. The clustering process involves initially randomly clustering the locations and then performing iterations to re-cluster locations based on the minimum sum of the squared distance between the data points and centroids of clusters [49,50]. Further evolution occurs within clusters until areas identified by clusters remain unaltered. The result is areas with a high potential of hosting offshore wind energy generation installations. The method is summarized in Algorithm 1. In Figure 1, the set research area can be inspected. This is the area of interest where all investigations are conducted, and therefore, no results are produced outside this area. Moreover, Figure 2, Figure 3, Figure 4 and Figure 5 illustrate the process of identifying favorable areas through the initial research, refinement, and clustering of proposed locations into recommended areas.
Algorithm 1: The developed algorithm
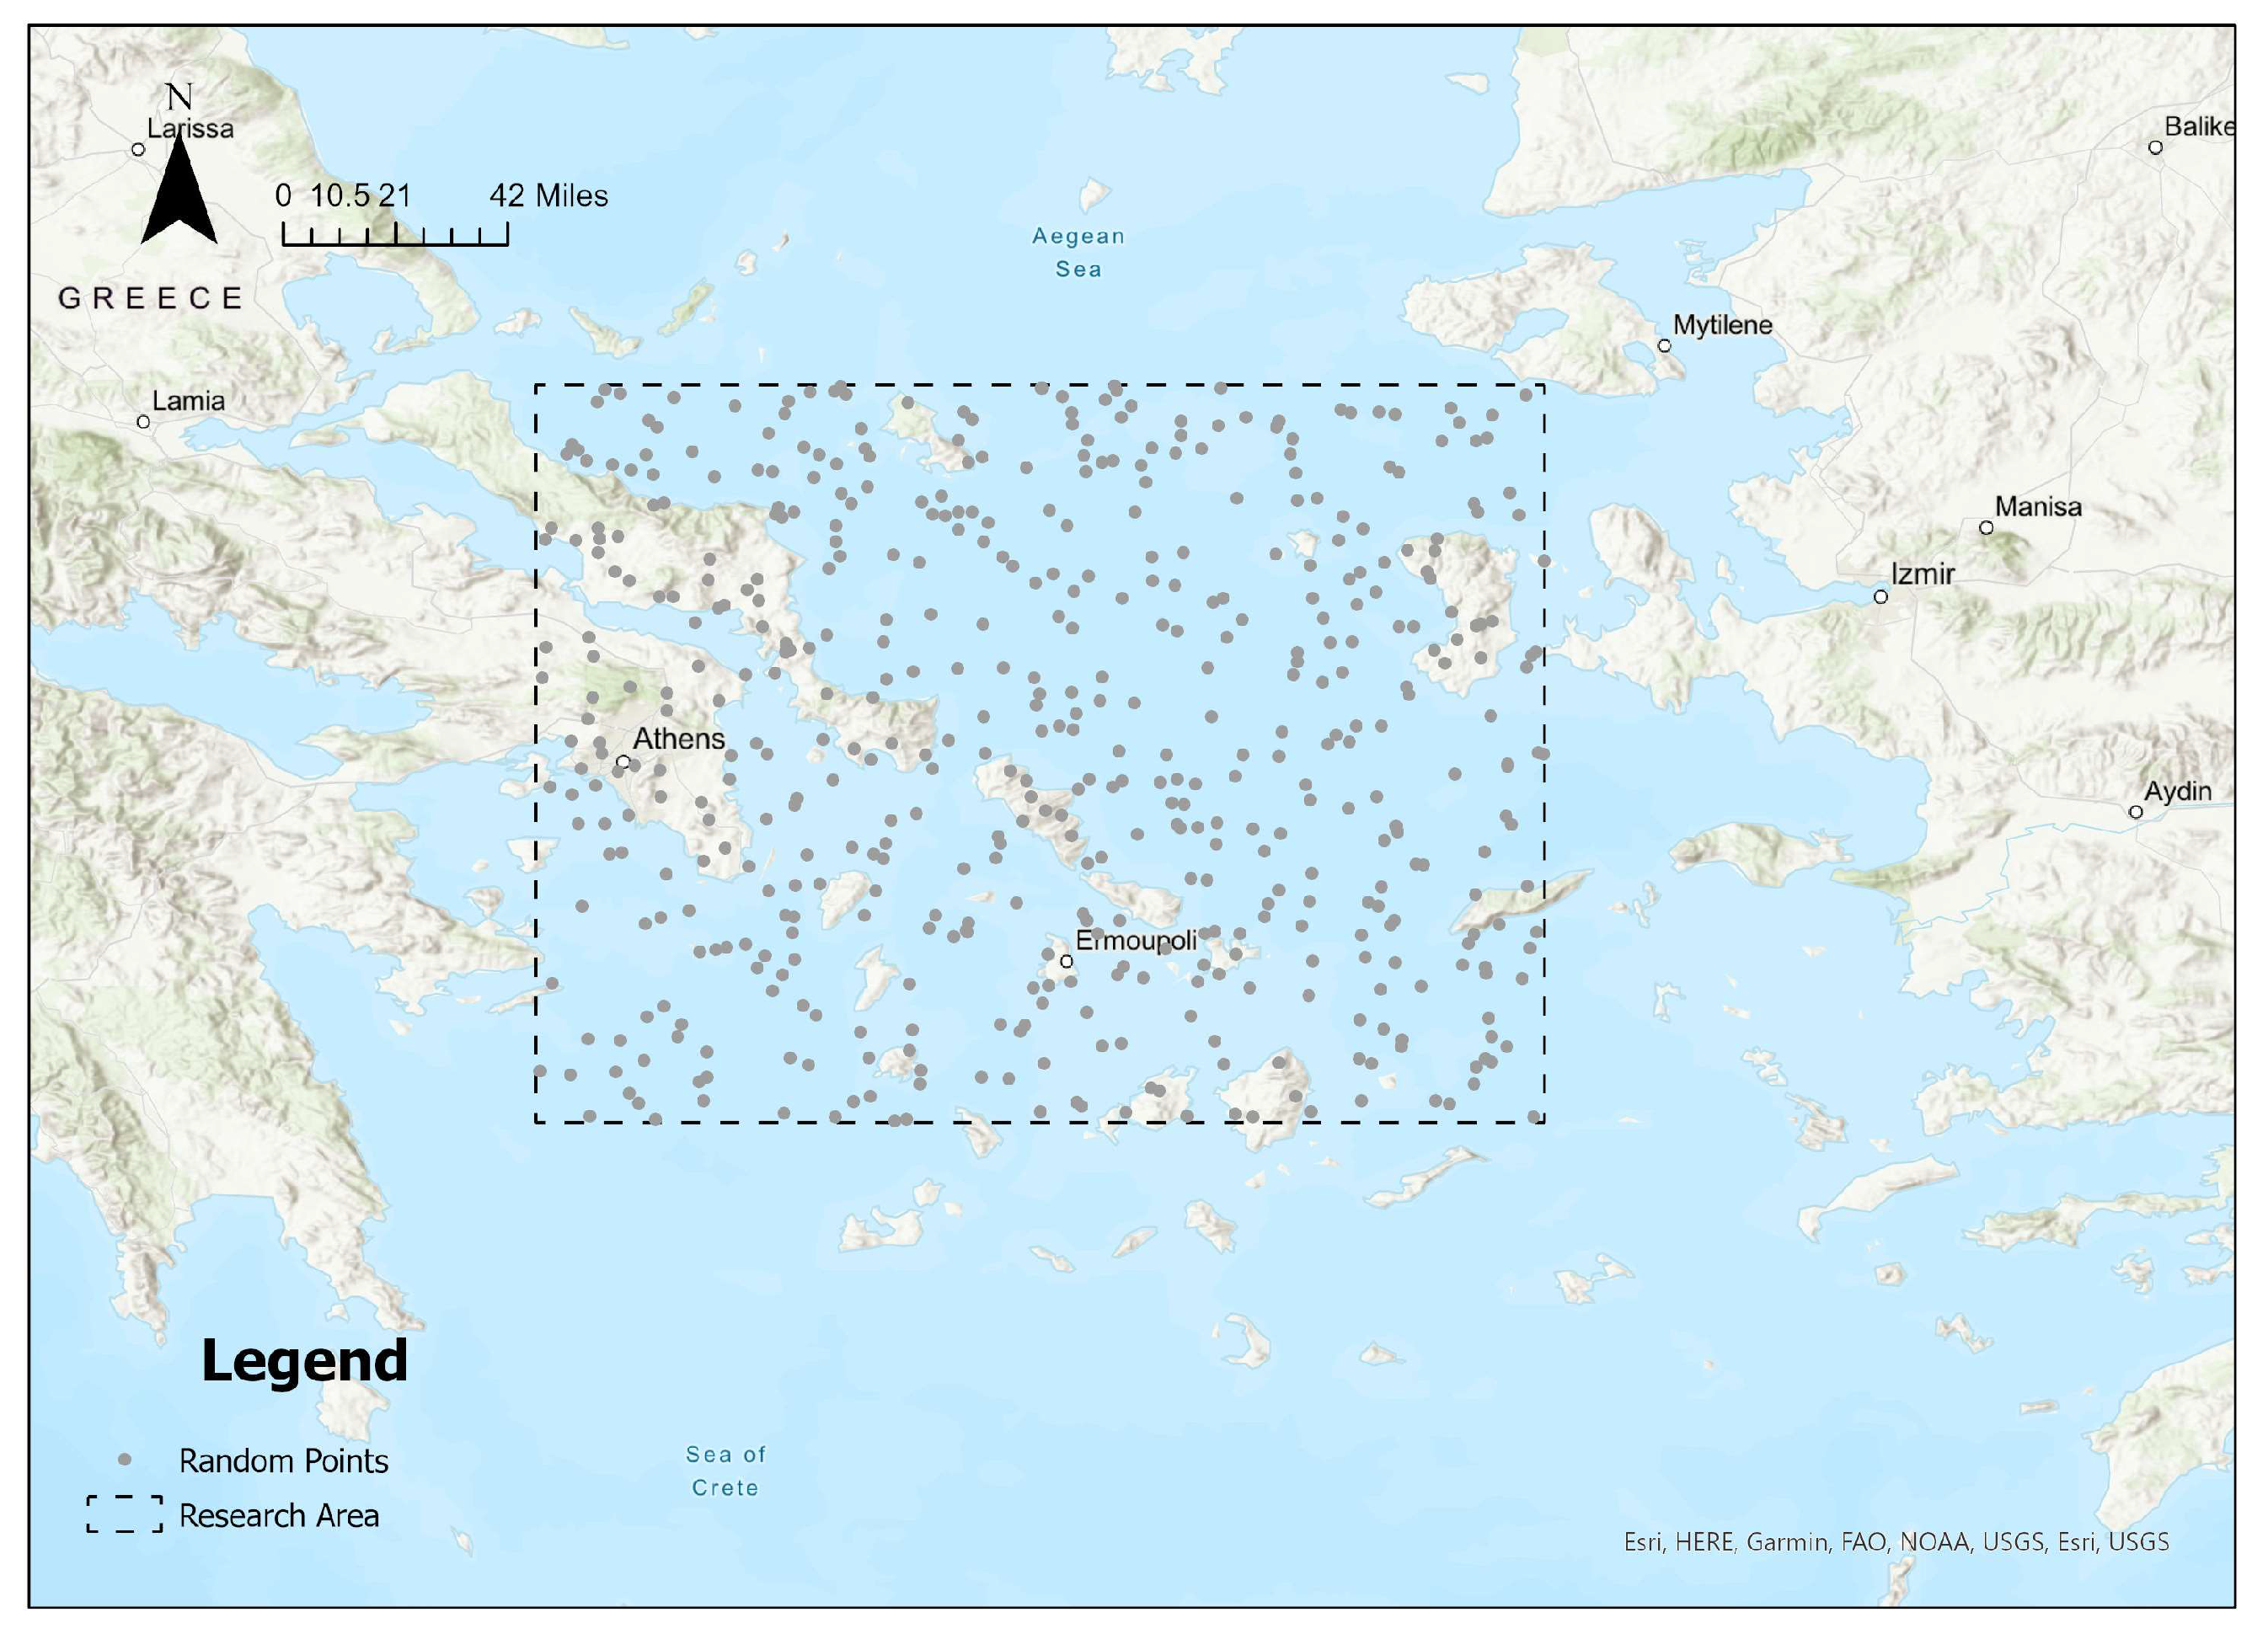
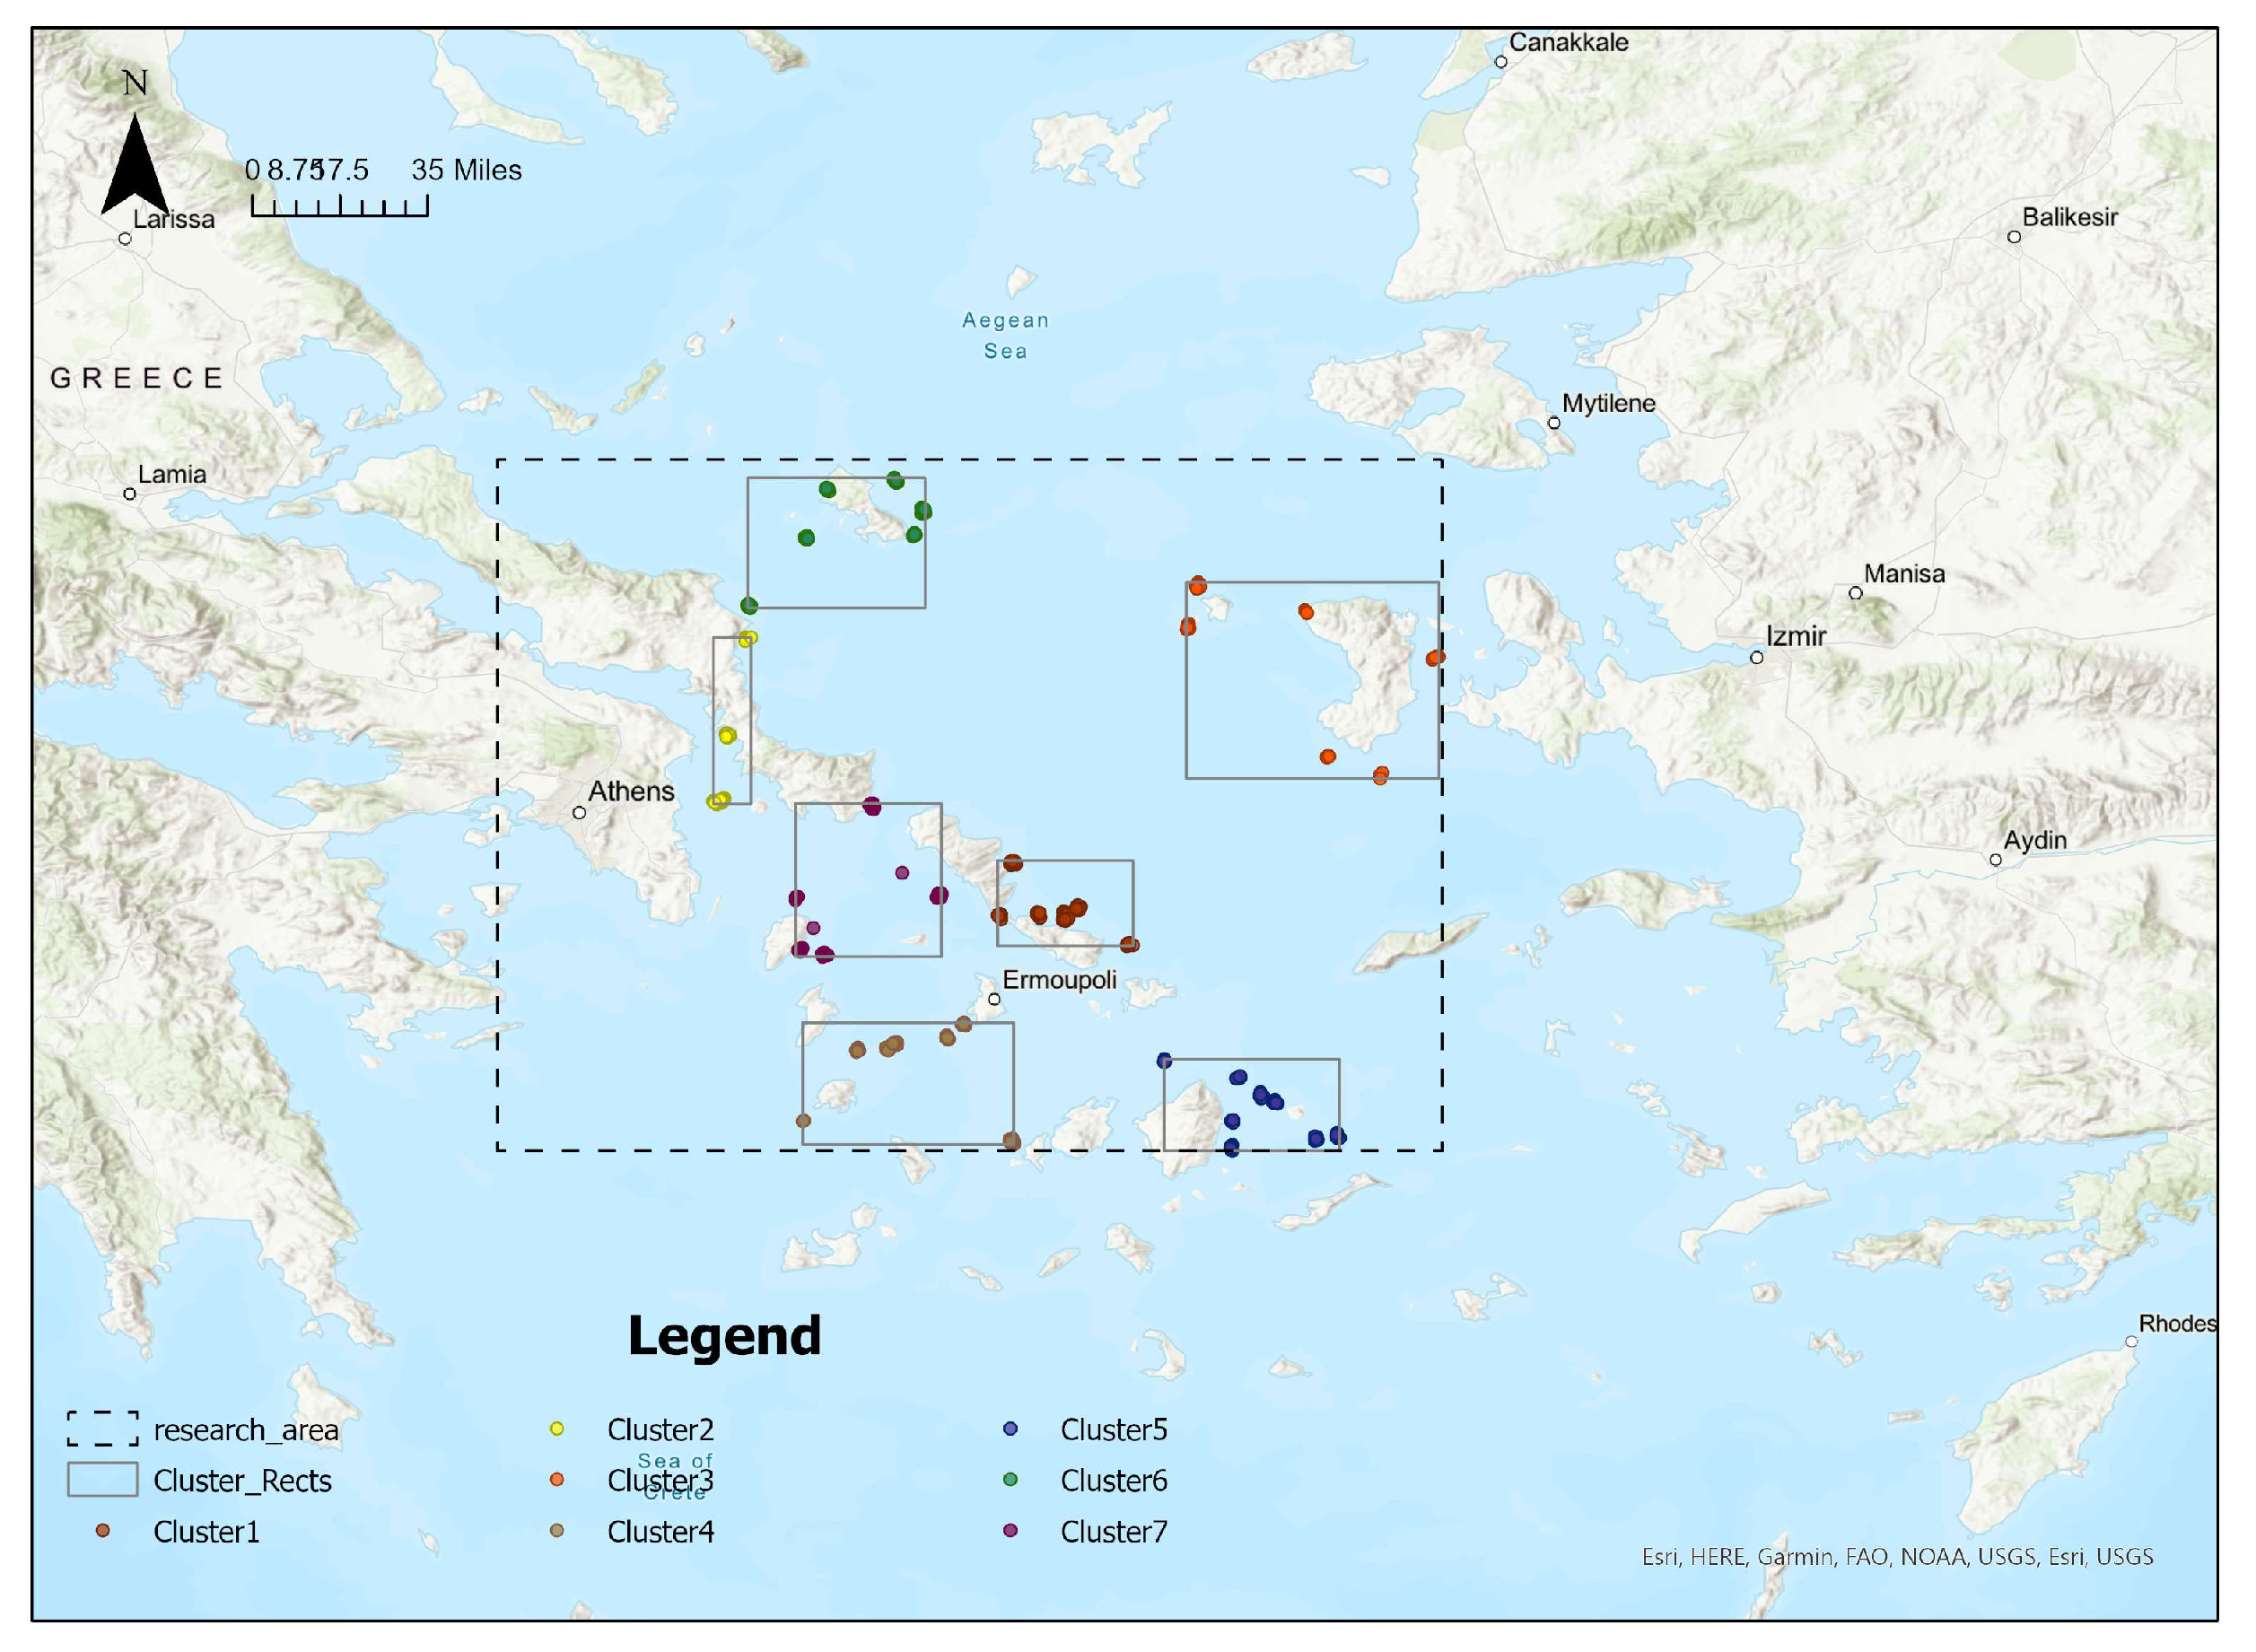
At iteration step j = 0 , proposed locations x l , j , l = 1 , ,   L , are sampled with uniform distribution over the selected area.
Monte Carlo resampling:
For each iteration step j = 1 , ,   J
  • Calculate proposed locations weights W l x l , j , l = 1 , ,   L (5);
  • Normalize proposed locations weights;
  • Sample proposed locations with replacement using normalised weights;
  • Propagation of proposed locations x l , j   (4).
K-Means clustering:
  • Assign proposed locations to K clusters.
Identify final areas:
For each cluster k = 1 , , K
  • Place suggested locations at equidistant points within the cluster;
  • Calculate weight for each suggested location;
  • Reject locations with zero weight.

3. Simulation Results

3.1. Data and factors

The most important technical parameter in the identification of potential areas for offshore wind energy development is wind speed. Offshore wind speed data can be obtained in a variety of ways, such as in situ measurements (using, e.g., oceanographic buoys, floating lidars, or offshore wind masts), remote sensing techniques, numerical atmospheric model results, etc. Offshore in situ wind measurements and satellite wind data are considered reference data for local wind energy assessment [51]. In situ wind measurements are absolutely necessary for site-specific analysis but, due to the poor spatial coverage, are not sufficient for analyses of extended areas of complex morphology, such as the Aegean Sea. On the other hand, satellite data are characterized by poor spatial and temporal resolution, while atmospheric conditions may also affect the quality of the measurements. Therefore, in this work, the mean annual wind speed for the Greek Seas is obtained from the Eta-SKIRON model, with a spatial and temporal resolution of 0.1 deg and 3 h, respectively [52].
Bottom depth was obtained from EMODnet Bathymetry [53], a freely available Digital Terrain Model for the examined sea areas with a resolution 1/16 of an arc minute (~130 m). Regarding the shipping routes, they were derived via the Open Street Map API using the web-based overpass-turbo tool [54]. Information on the existing electrical grid infrastructure and offshore cabling along an inland coastal zone of 150 km was obtained from the 2014 ENTSO-E Interconnected Network Grid Maps. This information was used to calculate the nearest source connection for each proposed location. The scale of the map is 1:4,000,000 and shows both existing and under-construction elements (e.g., substations, power plants, etc.). This information was also enriched by digitized data from the map of the Independent Power Transmission Operator published in 2018. The information regarding ports, which is analyzed to distance from suitable port/harbor and corresponding (maximum) water depth, was derived from the World Port Index Database of the national geospatial intelligence agency [55]. The coastline was derived from the Ministry of the Interior and Administrative Reconstruction of Greece [56].
Table 1 shows the factors and contributions to total weight and ranks. The ranks vary from 0, denoting the least favorable location, to 4, denoting the most promising one in terms of OWF development. The lowest mean annual wind speed (at 10 m above sea level) for marginal OWF suitability is defined between 4 m/s and 5 m/s. The reason for considering such a low limit is that the wind speed results from the Eta-SKIRON model tend to be underestimated compared to buoy measurements and satellite data [57]. Therefore, in order to avoid accidentally excluding areas that may be proved promising for OWF projects, the above threshold was chosen. It is noteworthy that the reference height of wind speed is irrelevant for the purposes of this work since the analysis is based on the same wind speed reference height for the entire area of interest. In addition, water depths between 40 m and 200 m have the first two best ranks since there is a trend to move to the floating structures for the Mediterranean Sea and, consequently, move to deeper water sites, more distant to the shore. On the other hand, depths greater than 200 m are characterized by the lowest ranks since such values are not suitable from a financial point of view. By keeping a balance between financial and optical disturbance reasons, the ideal distance from shore was selected to be 5–11 km, while 0–5 km has the second highest factor rank due to visual disturbance issues. For the proximity to ports, apart from the distance from suitable harbors, two aspects were also considered: (i) the size of the harbor and (ii) its maximum water depth alongside the wharf/pier, which should be over 10 m. If the latter factor was unknown, the corresponding harbor was not included in the analysis. Moreover, the spatial limitation of the 6 nm from the coastline of the Greek territory (instead of 12 nm, the standard zone of territorial waters according to the UN Convention on the Law of the Sea) from its non-EU adjacent countries was taken into consideration.
Based on the above technical factors, the corresponding contributions are assigned to each one of them to quantify their total influence in economic terms (i.e., according to the financial impact of the factor on the project cost). In this respect, the following contributions are adopted based on their significance: 35% for wind speed, 25% for water depth, 20% for distance to shore, 15% for distance to the power grid, and 5% for proximity to ports; see also the third column of Table 1 (see also [11]).

3.2. Software Tools

The simulation was implemented using Python 3.9 and Jupyter Notebook. For the geographical data, the libraries “folium”, “shapely”, and “geopandas” were used. The folium library was used for creating map visualizations and uses Open Street Maps. Additional libraries used include “pandas”, “matplotlib”, “seaborn”, “sklearn”, and “scipy”. A detailed list of the libraries and their documentation is shown in Appendix A (Table A1). The code generates an interactive map (.html format) that includes all suggested locations. The user can zoom in and out from the map and click on each suggested location to read its characteristics. For the purposes of this paper, more detailed and compact visualizations were produced by importing the results in shapefile format to the ArcGIS Pro tool and creating presented figures.

4. Results

In this section, the authors provide evidence of favorable areas for offshore energy production, considering information on other human activities and technical constraints. The data-driven tool takes as input the research area to be investigated. An example of a set research area used in this work is shown in Figure 1. The blue lines represent the transmission lines, and the blue pins represent the ports considered in this analysis. Then, the tool uses the algorithm to produce a map with suggested renewable energy points, such as the one displayed in Figure 6a. The suggested areas are illustrated as rectangles with a total area of 1 square km each. This makes it easier for the user to merge rectangles and build a final area based on their needs. The areas are colored based on their suitability. A colored scale is used where the dark, green-colored areas are highly recommended areas for OWF development. Areas colored with lighter green colors scored average weights whilst the areas almost in white have the lowest weight values, indicating areas that are least favorable for such projects. The exact range values are shown on the legend. Figure 6b provides a closer look at the resulting areas.
The performance of the data-driven tool was assessed by comparing the result to the outcome of an exhaustive search method. The exhaustive search results are considered accurate and used as a benchmark. The exhaustive method divides the entire research area into rectangular areas representing the proposed renewable energy station’s locations. The method then calculates the total weight for each suggested renewable energy station and displays the final suggestions. However, the accurate exhaustive search results are expected to arrive at a prohibitive computational expense for large areas. Figure 7 shows the result of the exhaustive search method.
The number of final proposed locations with high-weight values was used as a measure of accuracy. The result of the data-driven method relies on the number of proposed locations. Increasing the number of proposed locations also increases the computational cost. On the other hand, the exhaustive search method produces a fixed number of high-weight locations; however, the execution time slightly varies due to the processing power (4 vCPUs, 8 GB RAM). The data-driven algorithm has a trade-off between the speed and accuracy of the result. This trade-off is demonstrated in Figure 8. The result shows that the algorithm matches the accuracy of the exhaustive search method at a lower computational expense.

5. Discussion

The realization of OWF projects in both established and upcoming markets, such as Greece, can be viewed as a multi-dimensional and multi-parameter marine spatial problem. Apart from the technical (engineering) criteria, the specific environmental and socio-economic characteristics of the area of interest should also be considered during the site selection process for OWF development. For instance, the Mediterranean countries are highly linked with tourism activities, fisheries, and aquaculture that act as major economic drivers in the basin. When designating areas for offshore wind energy exploitation, potential conflicts with existing marine uses that are concentrated in a limited space should not be neglected, while any environmental and spatial planning constraints derived from the legislation at the national and European levels must be applied. The effects of OWF development on marine life in selected regions of the Mediterranean Sea have been investigated by Bray et al. [57]. In that study, potential effects on birds, marine mammals, fish, benthos, and plankton were analyzed based on review studies and findings from the Northern European seas, the grey literature, and expert opinions. Species, habitats, and taxa found in the Mediterranean waters that are likely to be affected by OWF during construction and operation phases were identified, and potential mitigation measures were proposed. The lack of comprehensive planning for OWFs and the particularities of the Mediterranean Sea with valuable seascapes and high biodiversity areas in a busy space on a narrow continental shelf has also been highlighted recently by Lloret et al. [58].
In terms of levelized cost of energy, a parameter measuring the viability of offshore wind energy projects, the cost of energy for floating wind farms, as presented in the work of Martinez and Iglesias [59], is relatively low in the central Aegean Sea (below 150 EUR/MWh) when compared to other sites of the Mediterranean Sea. This is attributed mainly to the high wind resource and proximity to the shore resulting in lower OPEX and electrical infrastructure costs. Note that LCOE values for bottom-fixed technologies are lower, but significant reductions are foreseen for the floating ones as deployment expands and supply chains and technology mature [60]. In terms of life cycle assessment and based on the analysis performed by Pulselli et al. [61], the results for the carbon intensity of electricity indicated the good environmental performance of floating wind turbines in the test site in Greece with values comparable to those estimated in ocean contexts.
Another factor that affects the commercial viability of offshore wind projects is energy storage. The power production of OWFs is of stochastic nature and thus cannot always follow the varying power demands, while transmission systems cannot always respond to the maximum potential of OWFs’ power output. This inadequacy can be efficiently tackled with the introduction of energy storage systems. Among the widely used technologies are mechanical (e.g., pumped storage systems) and electrochemical (e.g., large-scale lithium-ion battery) energy storage systems [62,63]. An alternative way to store offshore wind energy is hydrogen, which has a higher energy density than batteries and can act as an energy carrier [64]. As a fuel, hydrogen can be utilized for transport purposes (power to mobility), in gas grids (power-to-gas), and in industrial applications (power-to-industry). Other advantages of hydrogen, when combined with offshore wind farms, include the minimization of transmission losses and the reduction in installation costs of electrical transmission systems. The efficient integration of these energy storage technologies is expected to boost the development of offshore wind energy projects at the global level.

6. Conclusions

In the present work, a data-driven tool was presented for the identification of candidate locations for OWF development, with the main advantage of efficiency, scalability, and wide applicability in any industry and marine area. The tool utilizes technical requirements, which are critical factors in the design of an OWF project. Five quantifiable factors with appropriate weighting schemes were taken into account in this study. The spatial extent of this case study was in the order of several hundred kilometers.
After combining all technical criteria, the final results from the proposed methodology reveal that there are large areas located in the northern part of Andros and Tinos islands; eastern Mykonos Island; and sporadic locations around Naxos, Ikaria, Chios, and southern Evia islands. The above-identified areas are favorable for an in-depth assessment as regards OWF development on a local (spatial) scale utilizing more detailed technical, environmental, and socio-economic data to guarantee more credible results.
Future work will include the combination of different types of activities within blue economy industries that pose the significant challenge of potential conflict between activities. Moreover, the work will expand to include more user interaction and specific input from users that will be utilized by the software as learned user preferences.

Author Contributions

Conceptualization, I.K. and M.P.; methodology, I.K., M.P., and F.K.; software, M.P.; formal analysis, M.P.; data curation, V.L. and M.P.; writing—original draft preparation, I.K., M.P., F.K., and T.S.; writing—review and editing, I.K., M.P., F.K., and T.S.; visualization, M.P.; supervision, I.K.; funding acquisition, I.K. All authors have read and agreed to the published version of the manuscript.

Funding

This work was co-financed by the European Regional Development Fund and the Republic of Cyprus through the Research and Innovation Foundation projects with grant numbers INTEGRATED/0918/0032 (MARI-Sense) and INTEGRATED/0918/0046 (OS Aqua) and the EU H2020 Research and Innovation Programme under GA No. 857586 (CMMI-MaRITeC-X).

Data Availability Statement

Publicly available data used in this study may be accessed at the following URLs: All bathymetry DTM Tiles and any relevant additional information from the EMODnet Bathymetry Lot may be accessed at https://emodnet.ec.europa.eu/geoviewer/ (accessed on 11 December 2022). Spatial data on relevant ports can be accessed through the freely available WPI Ports Index Database 2019 at https://msi.nga.mil/Publications/WPI (accessed on 16 December 2022). Data from the ENTSO-e network can be freely accessible through https://eepublicdownloads.entsoe.eu/clean-documents/Publications/maps/2019/Map_ENTSO-E-4.000.000.pdf (accessed on 13 December 2022). Data from the Greek IPSO (existing and planned Greek electrical space) are freely accessible at https://www.admie.gr/sites/default/files/users/dssas/dpa-2019-2028-hartis-approved.pdf (accessed on 19 December 2022). Data regarding the coastline of Greece are available online at https://geodata.gov.gr/en/dataset/periphereies-elladas (accessed on 19 December 2022).

Conflicts of Interest

The authors declare no conflict of interest. The funders had no role in the design of the study; in the collection, analyses, or interpretation of data; in the writing of the manuscript; or in the decision to publish the results.

Disclaimer

The opinions expressed in this publication are those of the authors. They do not purport to reflect the opinions or views of the entities they represent.

Notation and Acronyms

NotationExplanation
c Factor’s contribution to total weight
mFactor index
j Iteration step index
k Cluster index
l Proposed location
w Factor weight
W Total weight
x Two-dimensional location vector
η Noise vector
χ , ψ Cartesian coordinates
AHPAnalytical Hierarchy Process
ELECTREElimination and Choice Translating Reality
GISGeographical Information System
MCDAMulti-Criteria Decision Analysis
OWFOffshore Wind Farm
PROMETHEEPerformance Ranking Organization Method for Enrichment of Evaluations
TOPSISTechnique for Order Preference by Similarity to Ideal Solutions
VIKORVlšekriteri-jumsko KOmpromisno Rangiranje
WPMWeighted Product Method
WSMWeighted Sum Method

Appendix A

Table A1. Python Libraries used for simulating the results.
Library UsedDocumentation
FoliumFolium—Folium 0.14.0 documentation (python-visualization.github.io)
Randomrandom—Generate pseudo-random numbers—Python 3.11.2 documentation
Pandaspandas documentation—pandas 1.5.3 documentation (pydata.org, accessed on 12 December 2022)
GeoPandasDocumentation—GeoPandas 0.12.2+0.gefcb367.dirty documentation
NumPyNumPy Documentation
MatplotlibMatplotlib documentation—Matplotlib 3.7.0 documentation
Seabornseaborn: statistical data visualization—seaborn 0.12.2 documentation (pydata.org, accessed on 12 December 2022)
Scikit-learnscikit-learn: machine learning in Python—scikit-learn 1.2.1 documentation
SciPySciPy documentation—SciPy v1.10.0 Manual

References

  1. Soukissian, T.H.; Denaxa, D.; Karathanasi, F.; Prospathopoulos, A.; Sarantakos, K.; Iona, A.; Georgantas, K.; Mavrakos, S. Marine Renewable Energy in the Mediterranean Sea: Status and Perspectives. Energies 2017, 10, 1512. [Google Scholar] [CrossRef] [Green Version]
  2. Wind Europe, Wind Energy in Europe: 2021 Statistics and the Outlook for 2022–2026, Report. 2022, p. 40. Available online: https://windeurope.org/intelligence-platform/product/wind-energy-in-europe-2021-statistics-and-the-outlook-for-2022-2026/ (accessed on 12 December 2022).
  3. Taranto Offshore Wind Farm. Available online: https://www.4coffshore.com/windfarms/italy/taranto-italy-it31.html (accessed on 11 January 2023).
  4. Boero, F.; Foglini, F.; Fraschetti, S.; Goriup, P.; Macpherson, E.; Planes, S.; Soukissian, T.; CoCoNet Consortium 2016. CoCoNet: Towards coast to coast networks of marine protected areas (from the shore to the high and deep sea), coupled with sea-based wind energy potential. Sci. Res. Inf. Technol. (Ric. Sci. E Tecnol. Dell’Inf.) 2016, 6, 1–95. [Google Scholar]
  5. Tsakalerou, M.; Efthymiadis, D.; Abilez, A. An intelligent methodology for the use of multi-criteria decision analysis in impact assessment: The case of real-world offshore construction. Sci. Rep. 2022, 12, 15137. [Google Scholar] [CrossRef]
  6. Fishburn, F.C. Letter to the Editor—Additive Utilities with Incomplete Product Sets: Application to Priorities and Assignments. Oper. Res. 1967, 15, 537–542. [Google Scholar] [CrossRef] [Green Version]
  7. Saaty, T.L. Axiomatic Foundation of the Analytic Hierarchy Process. Manag. Sci. 1986, 32, 841–855. [Google Scholar] [CrossRef]
  8. Hwang, C.; Yoon, K. Methods for multiple attribute decision making. In Multiple Attribute Decision Making; Springer: Berlin/Heidelberg, Germany, 1981; pp. 58–191. [Google Scholar]
  9. Opricovic, S.; Tzeng, G.H. Compromise solution by MCDM methods: A comparative analysis of VIKOR and TOPSIS. Eur. J. Oper. Res. 2004, 156, 445–455. [Google Scholar] [CrossRef]
  10. Roy, B. Classement et choix en présence de points de vue multiples. Rev. Fr. D’inf. Rech. Opér. 1968, 2, 57–75. [Google Scholar] [CrossRef]
  11. Brans, J.; Vincke, P.; Mareschal, B. How to select and how to rank projects: The Promethee method. Eur. J. Oper. Res. 1986, 24, 228–238. [Google Scholar] [CrossRef]
  12. Antunes, C.H.; Henriques, C.O. Multi-Objective Optimization and Multi-Criteria Analysis Models and Methods for Problems in the Energy Sector. In Multiple Criteria Decision Analysis. International Series in Operations Research & Management Science; Greco, S., Ehrgott, M., Figueira, J., Eds.; Springer: New York, NY, USA, 2016; Volume 233, pp. 1067–1165. [Google Scholar]
  13. Polatidis, H.; Haralambopoulos, D.A.; Munda, G.; Vreeker, R. Selecting an Appropriate Multi-Criteria Decision Analysis Technique for Renewable Energy Planning. Energy Sources 2006, 1, 181–193. [Google Scholar] [CrossRef]
  14. Wang, J.J.; Jing, Y.Y.; Zhang, C.F.; Zhao, J.H. Review on multi-criteria decision analysis aid in sustainable energy decision-making. Renew. Sustain. Energy Rev. 2009, 13, 2263–2278. [Google Scholar] [CrossRef]
  15. Sahabuddin, M.; Khan, I. Multi-criteria decision analysis methods for energy sector’s sustainability assessment: Robustness analysis through criteria weight change. Sustain. Energy Technol. Assess. 2021, 47, 101380. [Google Scholar] [CrossRef]
  16. Garni, H.A.; Kassem, A.; Awasthi, A.; Komljenovic, D.; Al-Haddad, K. A multicriteria decision making approach for evaluating renewable power generation sources in Saudi Arabia. Sustain. Energy Technol. Assess. 2016, 16, 137–150. [Google Scholar] [CrossRef]
  17. Deveci, M.; Özcan, E.; John, R. Offshore Wind Farms: A Fuzzy Approach to Site Selection in a Black Sea Region. IEEE Tex. Power Energy Conf. (TPEC) 2020, 1–6. [Google Scholar] [CrossRef]
  18. Xiao, F.; Wang, J.Q. Multistage decision support framework for sites selection of solar power plants with probabilistic linguistic information. J. Clean. Prod. 2019, 230, 1396–1409. [Google Scholar] [CrossRef]
  19. Abdel-Basset, M.; Gamal, A.; Chakrabortty, K.; Ryan, M. A new hybrid multi-criteria decision-making approach for location selection of sustainable offshore wind energy stations: A case study. J. Clean. Prod. 2021, 280, 124462. [Google Scholar] [CrossRef]
  20. Vasileiou, M.; Loukogeorgaki, E.; Vagiona, D.G. GIS-based multi-criteria decision analysis for site selection of hybrid offshore wind and wave energy systems in Greece. Renew. Sustain. Energy Rev. 2017, 73, 745–757. [Google Scholar] [CrossRef]
  21. Mandy, M.; Bahaj, A. Multi criteria decision analysis for offshore wind energy potential in Egypt. Renew. Energy 2018, 118, 278–289. [Google Scholar]
  22. Castro-Santos, L.; Garcia, G.P.; Simões, T.; Estanqueiro, A. Planning of the installation of offshore renewable energies: A GIS approach of the Portuguese roadmap. Renew. Energy 2019, 132, 1251–1262. [Google Scholar] [CrossRef]
  23. Schillings, C.; Wanderer, T.; Cameron, L.; Van der Wal, J.T.; Jacquemin, J.; Veum, K. A decision support system for assessing offshore wind energy potential in the North Sea. Energy Policy 2012, 49, 541–551. [Google Scholar] [CrossRef] [Green Version]
  24. Kim, T.; Park, J.; Maeng, J. Offshore wind farm site selection study around Jeju Island, South Korea. Abbreviated J. Name 2016, 94, 619–628. [Google Scholar] [CrossRef]
  25. Soukissian, T.; Reizopoulou, S.; Drakopoulou, P.; Axaopoulos, F.; Karathanasi, F.; Fraschetti, S.; Bray, L.; Foglini, F.; Papadopoulos, A.; De Leo, F.; et al. Greening offshore wind with the smart wind chart evaluation tool. Web Ecol. 2016, 16, 73–80. [Google Scholar] [CrossRef]
  26. Vagiona, D.; Karanikolas, N. A multicriteria approach to evaluate offshore wind farms siting in Greece. Glob. NEST J. 2012, 14, 235–243. [Google Scholar]
  27. Vagiona, D.; Kamilakis, M. Sustainable Site Selection for Offshore Wind Farms in the South Aegean—Greece. Sustainability 2018, 10, 749. [Google Scholar] [CrossRef] [Green Version]
  28. Gkeka-Serpetsidaki, P.; Tsoutsos, T. A methodological framework for optimal siting of offshore wind farms: A case study on the island of Crete. Energy 2022, 239, 122296. [Google Scholar] [CrossRef]
  29. Sivanandam, S.; Deepa, S.N. Introduction to Genetic Algorithms; Springer Science & Business Media: Cham, Switzerland, 2008. [Google Scholar]
  30. Goldberg, D.E. Genetic Algorithms in Search, Optimization, and Machine Learning; Addison-Wesley Professional: Boston, MA, USA, 1989. [Google Scholar]
  31. Abdmouleh, Z.; Gastli, A.; Ben-Brahim, L.; Haouari, M.; Al-Emadi, N.A. Review of optimization techniques applied for the integration of distributed generation from renewable energy sources. In Renewable Energy; Elsevier Ltd.: Amsterdam, Netherlands, 2017; pp. 266–280. [Google Scholar]
  32. Borges, C.L.; Falcão, D.M. Optimal distributed generation allocation for reliability, losses, and voltage improvement. Int. J. Electr. Power Energy Syst. 2006, 28, 413–420. [Google Scholar] [CrossRef]
  33. Singh, R.K.; Goswami, S.K. Optimum siting and sizing of distributed generations in radial and networked systems. Electr. Power Compon. Syst. 2009, 37, 127–145. [Google Scholar] [CrossRef]
  34. Fotakis, D.G.; Sidiropoulos, E.; Myronidis, D.; Ioannou, K. Spatial genetic algorithm for multi-objective forest planning. For. Policy Econ. 2012, 21, 12–19. [Google Scholar] [CrossRef]
  35. Kirkpatrick, S.; Gelatt, C.J.; Vecchi, M. Optimization by Simulated Annealing. Science 1983, 220, 671–680. [Google Scholar] [CrossRef] [PubMed]
  36. Cerny, V. A thermodynamical approach to the traveling salesman problem: An efficient simulation algorithm. J. Optim. Theory Appl. 1985, 45, 41–51. [Google Scholar] [CrossRef]
  37. Cheng, Y. A simulated annealing algorithm for spatial layout optimization in process industries. Chem. Eng. Sci. 1999, 54, 5585–5594. [Google Scholar]
  38. Aly, A.I.; Hegazy, Y.G.; Alsharkawy, M.A. A Simulated Annealing Algorithm for Multi-Objective Distributed Generation Planning. In Proceedings of the Power and Energy Society General Meeting, Minneapolis, MN, USA, 25–29 July 2010. [Google Scholar]
  39. Kennedy, J.; Eberhart, R. Particle swarm optimization. In Proceedings of the IEEE International Conference on Neural Networks, Perth, Australia, 27 November–1 December 1995. [Google Scholar]
  40. Shan, Y.; Bettinger, P.; Cieszewski, C.; Wang, W. Pitfalls and potential of particle swarm optimization for contemporary spatial forest planning. For. Syst. 2012, 21, 468–480. [Google Scholar] [CrossRef] [Green Version]
  41. Shifa, M.; Jianhua, H.; Feng, L.; Yan, Y. Land-use spatial optimization based on PSO algorithm. Geo-Spat. Inf. Sci. 2011, 14, 54–61. [Google Scholar]
  42. Zarghami, M.; Hajykazemian, H. Urban water resources planning by using a modified particle swarm optimization algorithm. Resour. Conserv. Recycl. 2013, 70, 1–8. [Google Scholar] [CrossRef]
  43. Dorigo, M.; Birattari, M.; Stützle, T. Ant Colony Optimization; The MIT Press: Cambridge, MA, USA, 2004. [Google Scholar]
  44. Xiaoning, F.; Yan, L.; Zhuoshang, J. The Ant Colony Optimization for Ship Pipe Route Design in 3D Space. In Proceedings of the 2006 6th World Congress on Intelligent Control and Automation IEEE, Dalian, China, 21–23 June 2006. [Google Scholar]
  45. Arulampalam, M.; Maskell, S.; Gordon, G.; Clapp, T. A tutorial on particle filters for online nonlinear/non-Gaussian Bayesian tracking. IEEE Trans. Signal Process. 2002, 50, 174–188. [Google Scholar] [CrossRef] [Green Version]
  46. Orton, M.; Fitzgerald, W. A Bayesian approach to tracking multiple targets using sensor arrays and particle filters. IEEE Trans. Signal Process. 2002, 50, 216–223. [Google Scholar] [CrossRef]
  47. Kyriakides, I. Target Tracking using Cognitive Radar and Foveal Nodes. In Proceedings of the 15th International Conference on Distributed Computing in Sensor Systems (DCOSS), Santorini, Greece, 29–31 May 2019; pp. 694–700. [Google Scholar]
  48. Kyriakides, I. Cognitive fusion for target tracking. Synth. Lect. Algorithms Softw. Eng. 2019, 10, 1–65. [Google Scholar]
  49. Jin, X.; Han, J. K-Means Clustering. In Encyclopedia of Machine Learning; Sammut, C., Webb, G.I., Eds.; Springer: Boston, MA, USA, 2011. [Google Scholar]
  50. Bishop, C.M.; Nasrabadi, N.M. Pattern Recognition and Machine Learning; Springer: New York, NY, USA, 2006. [Google Scholar]
  51. Soukissian, T.; Papadopoulos, A.; Skrimizeas, P.; Karathanasi, F. Satellite-Based Offshore Wind Resource Assessment in the Mediterranean Sea. IEEE J. Ocean. Eng. 2017, 42, 73–86. [Google Scholar] [CrossRef]
  52. Soukissian, T.; Karathanasi, F.; Axaopoulos, P.; Avgoustoglou, E.; Kyriakidou, H.; Tsalis, C.; Voudouri, A.; Gofa, F.; Katsafados, P. Assessment of offshore wind power potential in the Aegean and Ionian Seas based on high-resolution hindcast model results. AIMS Energy 2017, 5, 268–289. [Google Scholar] [CrossRef]
  53. EMODnet Digital Bathymetry (DTM 2020). Available online: https://doi.org/10.12770/bb6a87dd-e579-4036-abe1-e649cea9881a (accessed on 11 January 2023).
  54. Overpass Turbo. Available online: https://overpass-turbo.eu/ (accessed on 11 January 2023).
  55. Maritime Safety Office. Available online: https://msi.nga.mil (accessed on 11 January 2023).
  56. Regions of Greece. Available online: https://geodata.gov.gr/en/dataset/periphereies-elladas (accessed on 11 January 2023).
  57. Bray, L.; Reizopoulou, S.; Voukouvalas, E.; Soukissian, T.; Alomar, C.; Vázquez-Luis, M.; Deudero, S.; Attrill, M.J.; Hall-Spencer, J.M. Expected Effects of Offshore Wind Farms on Mediterranean Marine Life. J. Mar. Sci. Eng. 2016, 4, 18. [Google Scholar] [CrossRef] [Green Version]
  58. Lloret, J.; Turiel, A.; Solé, J.; Berdalet, E.; Sabatés, A.; Olivares, A.; Gili, J.-M.; Vila-Subirós, J.; Sardá, R. Unravelling the ecological impacts of large-scale offshore wind farms in the Mediterranean Sea. Sci. Total Environ. 2022, 824, 153803. [Google Scholar] [CrossRef] [PubMed]
  59. Martinez, A.; Iglesias, G. Multi-parameter analysis and mapping of the levelised cost of energy from floating offshore wind in the Mediterranean Sea. Energy Convers. Manag. 2021, 243, 114416. [Google Scholar] [CrossRef]
  60. Shields, M.; Beiter, P.; Nunemaker, J. A Systematic Framework for Projecting the Future Cost of Offshore Wind Energy. Golden, CO: National Renewable Energy Laboratory 2022. NREL/TP-5000-81819. Available online: https://www.nrel.gov/docs/fy23osti/81819.pdf (accessed on 11 January 2023).
  61. Pulselli, R.M.; Maccanti, M.; Bruno, M.; Sabbetta, A.; Neri, E.; Patrizi, N.; Bastianoni, S. Benchmarking Marine Energy Technologies Through LCA: Offshore Floating Wind Farms in the Mediterranean. Front. Energy Res. 2022, 10, 18. [Google Scholar] [CrossRef]
  62. Yu, H.; Yang, X.; Chen, H.; Lou, S.; Lin, Y. Energy Storage Capacity Planning Method for Improving Offshore Wind Power Consumption. Sustainability 2022, 14, 14589. [Google Scholar] [CrossRef]
  63. Katsaprakakis, D.A. Energy storage for offshore wind farms. Offshore Wind Farms 2016, 459–493. [Google Scholar] [CrossRef]
  64. Calado, G.; Castro, R. Hydrogen Production from Offshore Wind Parks: Current Situation and Future Perspectives. Appl. Sci. 2021, 11, 5561. [Google Scholar] [CrossRef]
Figure 1. The research area is indicated by a rectangle, blue lines represent transmission lines, and blue markers represent the ports.
Energies 16 02235 g001
Figure 2. Random initialization of proposed locations.
Energies 16 02235 g002
Figure 3. Proposed locations after Monte Carlo resampling.
Energies 16 02235 g003
Figure 4. Proposed locations after clustering.
Energies 16 02235 g004
Figure 5. Final recommended areas.
Energies 16 02235 g005
Figure 6. (a) The outcome of the data-driven algorithm, which identified 2822 areas in total. The color scale is defined by their final weight. (b) A zoomed-in area of the final results.
Energies 16 02235 g006
Figure 7. The outcome of the exhaustive algorithm identified 4399 areas in total.
Energies 16 02235 g007
Figure 8. The improvement in identifying high weight resulting locations, with a 95% confidence intervals (denoted by light blue shading), as computational expense increases.
Energies 16 02235 g008
Table 1. Factors and contribution to overall weight and rank.
Index mFactorContribution to Total Weight c i Factor Weight w m Classification
1Land0%1Proposed location on sea
0Proposed location on land
2Distance from ship routes0%1≥1 km
0<1 km
3Distance from the shore20%45–11 km
30–5 km
0Otherwise
4Distance from transmission lines15%40–20 km
320–50 km
250–70 km
1Otherwise
5Distance from ports5%40–20 km
320–50 km
250–70 km
170–100 km
0Otherwise
6Water depth25%440–70 m
370–200 m
20–40 m
1200–300 m
0Otherwise
7Mean annual wind speed35%4≥7 m/s
36–7 m/s
25–6 m/s
14–5 m/s
0Otherwise
Disclaimer/Publisher’s Note: The statements, opinions and data contained in all publications are solely those of the individual author(s) and contributor(s) and not of MDPI and/or the editor(s). MDPI and/or the editor(s) disclaim responsibility for any injury to people or property resulting from any ideas, methods, instructions or products referred to in the content.

