Article

Inverter-Less Integration of Roof-Top Solar PV with Grid Connected Industrial Drives

1
Department of Electrical and Electronic Engineering, East West University, A/2 Jahurul Islam Avenue, Jahurul Islam City, Aftabnagar, Dhaka 1212, Bangladesh
2
Department of Electrical and Electronic Engineering, United International University, United City, Badda, Dhaka 1212, Bangladesh
*
Author to whom correspondence should be addressed.
These authors contributed equally to this work.
Energies 2023, 16(4), 2060; https://doi.org/10.3390/en16042060
Submission received: 15 December 2022 / Revised: 4 February 2023 / Accepted: 8 February 2023 / Published: 20 February 2023
(This article belongs to the Topic Advanced Energy Harvesting Technology)

Abstract

:
Green energy from Solar PV is getting increased attention in the industries due to the falling price of solar panels in the world market. A grid-tied inverter is one of the major components in such a system, where the DC energy from PV is converted to AC and synchronized with the grid to obtain power sharing between the PV and the grid for the industrial drives. In this paper, a DC link has been proposed instead of an AC link for interconnection between the solar PV system and the grid to run those industrial drives. In most modern industrial applications, induction motors are driven by VVVF (Variable Voltage and Variable Frequency) inverters to achieve efficient speed control. The inverters commonly have a rectifier section at the front end that rectifies the input AC to DC and the DC is then used in PWM mode to generate the required voltage and frequency for the induction motor operating under variable speed and load conditions. Such an inverter can use both AC or DC as the input so long the supply voltage has the right value for the inverter to operate. In our proposition, we eliminate the grid-tied inverter and use a DC link, created from the rectified AC and the regular Solar PV, to obtain the power-sharing between the PV output and the grid. Using the DC link output directly to energize the VVVF inverter has an impact on the performance of the inverter. In the proposed system, the solar PV array is designed in such a way that the grid remains as the supplementary power source only to supplement any shortfall in the PV output due to variable sunshine conditions. The control circuit used in this novel technique is inexpensive, efficient, and simple in design when compared to the grid-tied inverters. The proposed system has been implemented at Niagara Textiles in Gazipur, Bangladesh. The experimental/practical results are presented to validate the basic concept. Around a 20% reduction in the cost of energy has been reported in this paper, with a more than 90% efficient system. This will definitely make solar PV energy more competitive with regular energy and attractive to industries for its simplicity.

1. Introduction

The ominous threat of global warming has triggered enhanced awareness amongst policymakers, utilities, and consumers alike. Countries in general, irrespective of their geographical location or economic affluence, are considering renewable energy resources as a major thrust area [1,2,3]. Earlier, the green energy concept was stigmatized as an expensive form of energy meant only for the rich [4,5]. However, the price of the PV modules in the world market has come down to a level such that solar PV-based energy generation has become commercially viable, even for countries with moderate sunshine, so that they can compete with the national grids [6,7]. The most common form of solar PV and grid connection involves grid-tied inverters, where the DC output of solar PV is converted to an AC that is compatible with the grid voltage. These grid-tied inverters should have the following characteristics:
  • The output voltage needs to be sinusoidal;
  • Voltage and frequency of the output must match with those of the grid;
  • The output must have the right phase to connect to the grid.
Additionally, the inverter must draw power from the PV such that maximum power point operation is ensured. Satisfying all the requirements in the grid-tied inverter require complex control circuits, which is reflected in their cost. The design of the grid-tied inverters has improved significantly over the years and present-day inverters can have an efficiency of more than 95% under full load operation. However, under varying load conditions due to varying sunshine, the average efficiency remains more than 90% [8,9].
Despite their high efficiency, grid-tied inverters are still expensive and account for around 15–20% of the PV energy cost [9]. Usually, the cost of the PV energy is within a very narrow margin of profitability and any uncertainty in the PV output such as periodic cleaning of the dirt [10,11] on the PV modules to keep the output to the designed level can eat up the narrow margin of profit. Such factors have a discouraging effect on the industrial uptake of PV systems and any reduction in the energy cost can have a significant positive impact. With the development of power electronics, many of the appliances and drives have electronic controls inside them and are effectively insensitive to the type of input voltage (AC or DC) supply [12]. At the same time, many of the appliances have their own control circuit that enables the appliances to work over a wide range of input voltages. This is particularly true for the industrial motor drives [13,14,15] and it opens up the opportunity of integrating solar PV to grid-connected systems without using grid-tied inverters. Such a mechanism is expected to be of lower cost compared to the cost of the grid-tied inverters, as already discussed, and can have efficiency as high as or higher than the usual grid-tied inverters. Higher efficiency and lower cost can contribute towards a less expensive PV-based power that can have a positive impact in popularizing PV systems in grid-connected applications. Although such a concept has been proposed in small-scale household cooking systems with cooking appliances using DC loads [16], to the best of our knowledge, a similar system has not been studied with three-phase industrial drives. Here, we have presented the performance of such a system under varying sunshine and load conditions indicating that it can be a very effective low-cost solution for industrial applications.
In this paper, we present the concept and the design considerations for a rooftop inverter-less PV system to be connected with grid-connected industrial drives. An inverter-less system along with rooftop solar PV was implemented in Niagara Textiles, a compliant textile industry in Gazipur, Bangladesh, to verify the performance of the system. Experimental/practical data were collected to observe the power-sharing between the solar panel array and the grid under different loads and sunshine conditions. Results show that load-sharing control was smooth and efficient under varying load and sunshine conditions. After this introduction section, Section 2 describes the issues and proposal of our research. The proposed system model has been explained in Section 3. Section 4 clarifies the system modeling. The findings and results are discussed in Section 5. Lastly, the conclusion has been drawn in Section 6.

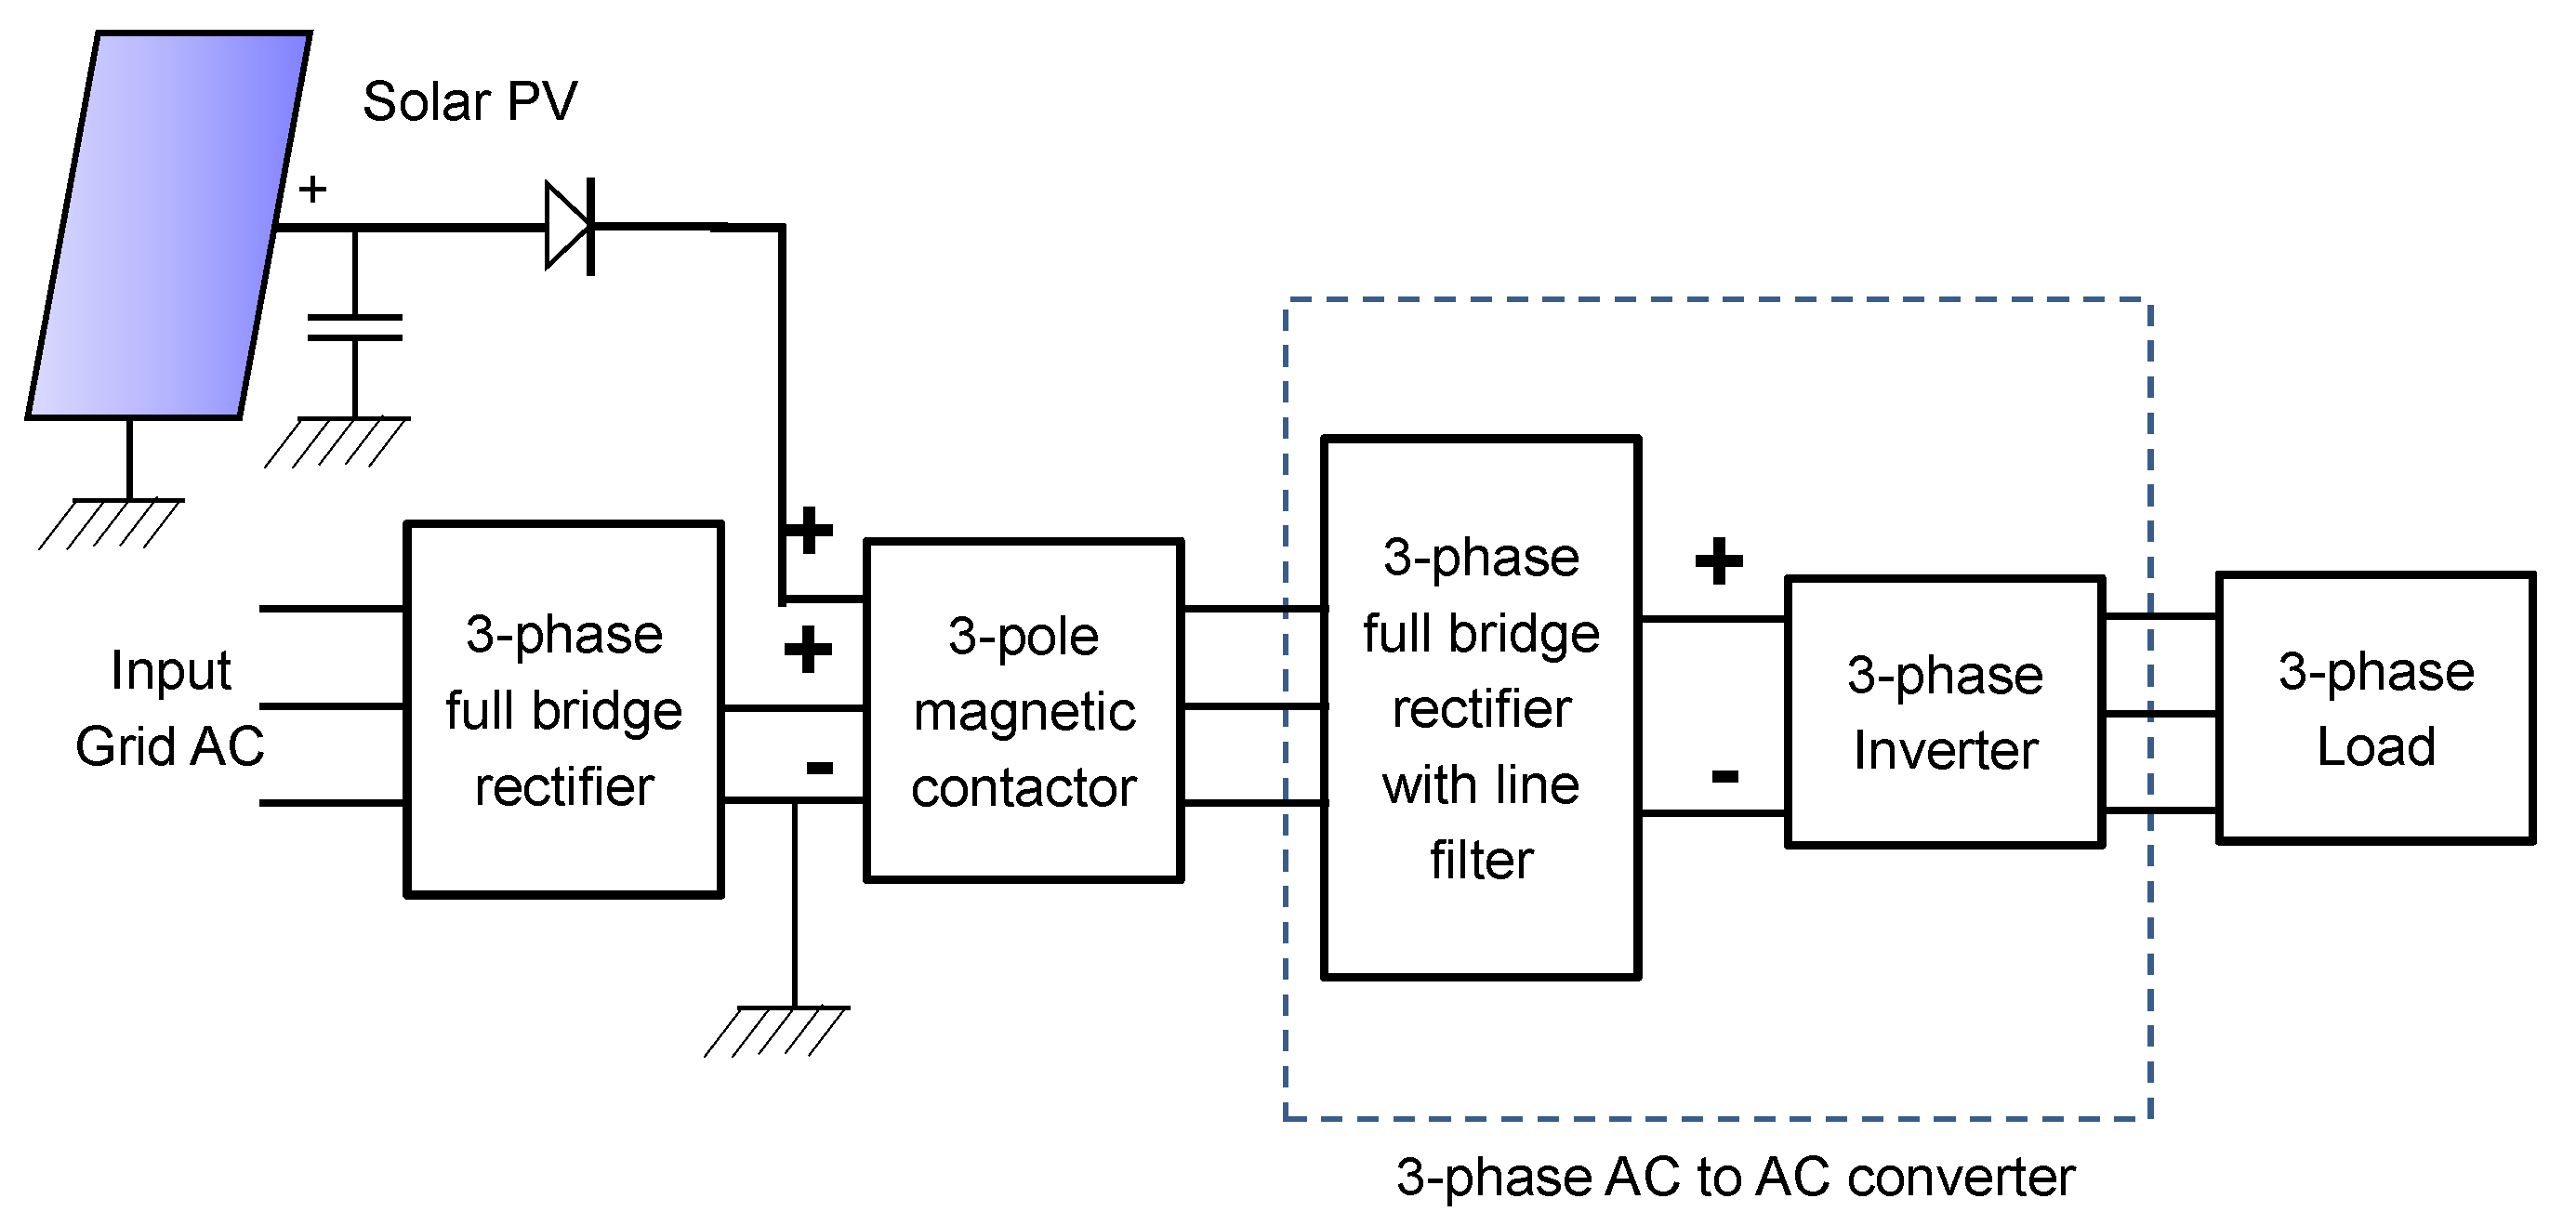
2. Inverter-Less Integration of Solar PV with Industrial Drives

The rooftop application of solar PV is gaining momentum, particularly in industries in Bangladesh, as there are a number of economic reasons associated with it. Infrastructure Development Company Limited (IDCOL), Bangladesh [17] has so far financed 11 rooftop solar systems and the average energy cost is approximately USD 0.075/kWh (with 80% loan at a subsidized interest rate of 6%). The cost of captive power generation in Bangladesh is USD 0.055/kWh where a subsidized gas supply is available and the cost of grid power is USD 0.11/kWh. Although IDCOL estimated the cost of inverter based solar PV energy to be lower than the grid energy, it was realized later that most of the industries did not consider the realistic loss of energy due to temperature rise in the solar cells [18,19,20,21,22] and accumulation of dust and dirt on the solar panels [23,24,25,26,27,28]. When all these losses are taken into account, the actual cost of energy is expected to be higher. So, further reduction in the cost of solar PV-based energy is essential to make solar PV power competitive to the grid power in Bangladesh, when IDCOL funding with subsidized interest rate is exhausted.
The main reasons for solar PV applications in the industrial sector in Bangladesh are:
  • A large number of industries receive natural gas (Methane) from the national gas grid at a price much lower (less than half) than the international price [29]. They use this gas for captive electricity generation and as fuel for boilers for steam generation. As the production of gas from the local gas fields is dwindling, the government has taken up a plan to import gas and supply it to the gas network to sustain the industries. However, the cost of gas is expected to increase by at least 50% within a few months or so [29]. This has instigated considerable concerns for the industries to look for alternative energy resources and due importance is given to solar PV.
  • The falling price of solar PV has made the cost of solar energy competitive with the captive generation. Any increase in gas price will make solar PV even more attractive.
  • For industries not having enough captive generation, solar PV has become a very attractive alternative as grid electricity costs are much higher (almost 40% higher) than captive electricity generation.
However, the main challenges of using PV in industries are as follows:
  • Solar PV output is intermittent in nature with varying output varying with cloud, fog or other weather related uncertainties.
  • Most industries run for long hours every day and the industry must arrange for alternative sources for night hours.
  • One possible option is to have a battery or some other form of energy storage, which is still very expensive and is not economically viable for most industries.
  • Having grid-tied inverters to connect the solar PV to the internal power line is one of the best solutions. However, as already mentioned, in moderate-sized PV systems, less than 500 kWp, the cost of inverters constitutes approximately 15–20% of the energy cost with a complex operation system [30].
Using the proposed system, there is scope to make the PV power less expensive and it is our estimation that the cost of the energy can be reduced by close to 20%. Such a reduction in the energy cost can make them more popular and we expect that more industries will take interest in generating a higher percentage of green energy reducing the overall carbon emission [29,31].
The basic block diagram of the proposed system is shown below in Figure 1. The 3-phase AC supply is rectified to convert it to DC. The PV array is chosen such that it has the maximum power point voltage close to the rectified grid voltage (which automatically means that the open circuit voltage will be approximately 25% higher than the rectified grid voltage) [9]. The −ve terminal of the PV out and the rectified grid voltage is connected to form a common −ve terminal. This common −ve terminal, the +ve terminal of the rectified grid voltage, and the +ve terminal of the PV output are now connected to the three input terminals of the variable voltage variable frequency (VVVF) inverter (DC to AC converter) of the industrial drive via a 3-pole (3-phase) magnetic contactor as shown in Figure 1. The value of the capacitor at the PV terminals is essential for the efficient operation of the system as the VVVF inverter operates in pulse width modulation (PWM) mode.

3. The Proposed System Model

In the proposed system, we suggest that the number of PV modules connected in series should be such that the DC voltage obtained by the rectification of the grid voltage is close to the maximum power point voltage of the PV array. So, there is no voltage level converter used so far as the PV output is concerned and this will save the cost of the hardware and at the same time reduce the energy loss occurring due to voltage conversion. The VVVF inverter, driving the motor, has a maximum rated input voltage to avoid damage due to over-voltage. While designing the PV array, it is to be taken into consideration that the open circuit voltage of the PV array does not exceed this limit.
Mathematically, these conditions can be expressed as
N = i n t V G D C V M P + 1
where N is the number of panels to be connected in series. V G D C is the rectified 3-phase grid voltage. V D C is the DC operating voltage of the VVVF inverter and V M P is the maximum power point voltage of a single array, V O C is the open circuit voltage of a single PV module and V O C A r r a y is the open circuit voltage of the PV array, V D C m is the maximum DC voltage that is allowed to apply at the VVVF inverter input terminals. Here, int(x) indicates a mathematical operation that selects an integral value from x by discarding the fractional part. Along with the condition mentioned in Equation (2), it is to be ensured that the open circuit voltage of the PV array does not exceed the allowed voltage limit that can be applied to a PV module, i.e.,
N × V O C < P V module - maximum - allowed - voltage
Typically, the rectified grid voltage V G D C ranges within 540–560 V for the VVVF inverters and the maximum allowed voltage for a PV module is less than 1000 V. So, the voltage condition required in Equation (2) is usually within the safe voltage range for an individual PV module.

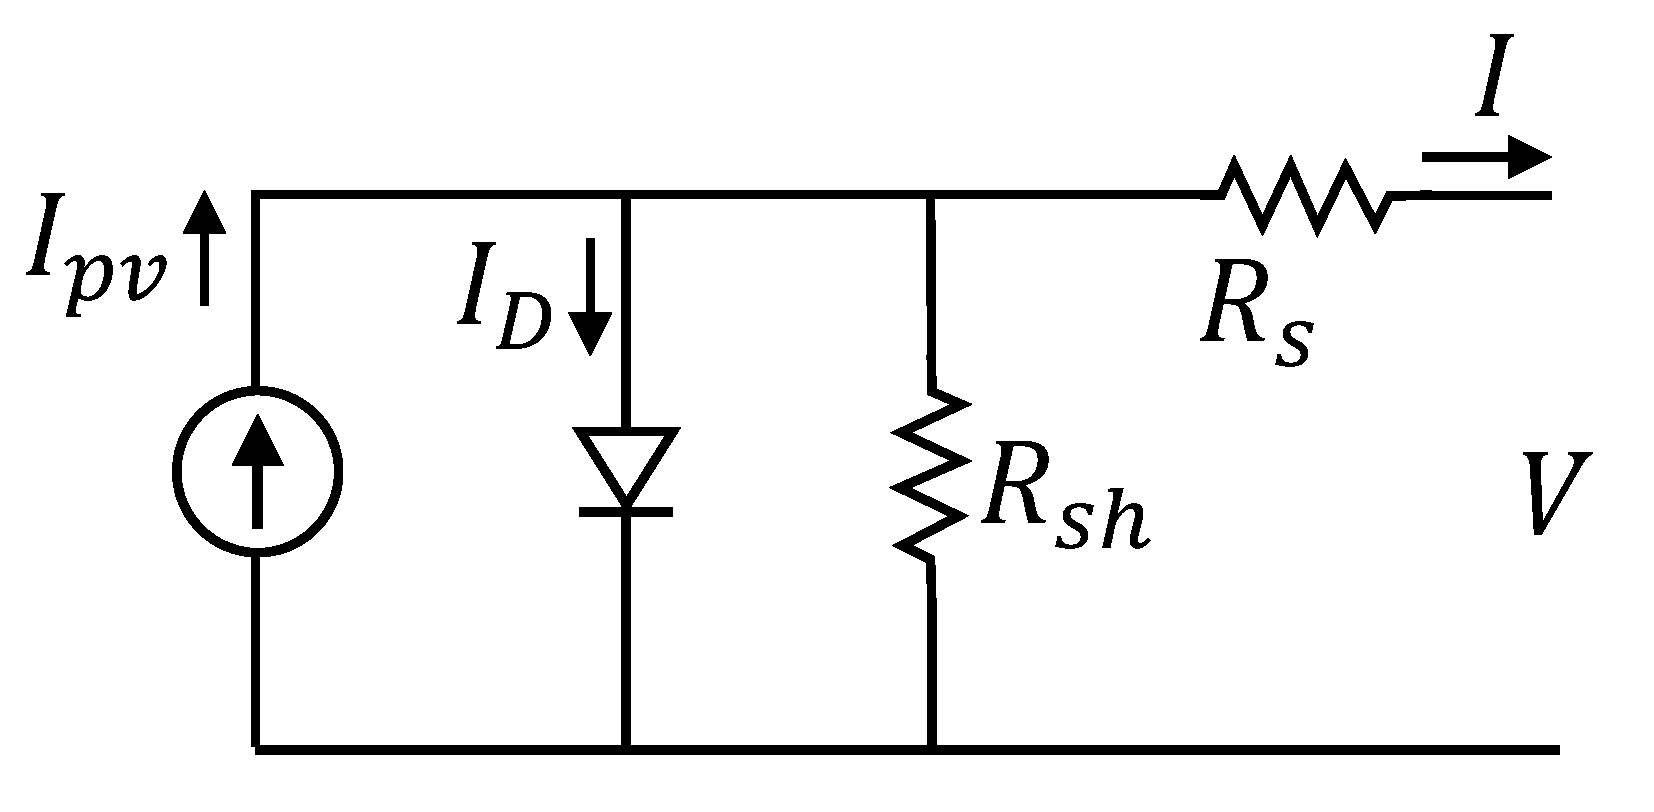
3.1. Design of the Panel Array

Once the value of N is obtained from Equations (1) and (2), we design an array of PV panels by connecting N number of solar panels in series. To determine the number of parallel branches in the PV array, we need to estimate the required installed capacity of the solar panel array, P a r r a y . Given individual panel power rating P P (Watt peak), we can calculate the number of parallel strings A i in the PV array as follows:
A i = i n t P a r r a y N × P P
It is very likely that P a r r a y / ( N × P P ) will be a non-integer, and we need to make a round off of the value of A i by choosing the lower round off after adding 0.5.
While choosing the value of P a r r a y , we need to consider the roof space, the recommended tilt angle at that geographical location, and the amount of green energy the industry intends to consume. It is recommended that we choose P a r r a y such that its production does not exceed the power requirement of the connected load under the expected highest sunshine condition at that geographical location, as any excess power from the panel cannot be delivered to the grid in the proposed system.

3.2. The Control Circuit

As discussed earlier, many industrial machines are driven by VVVF inverters. Due to the rectifiers at the first stage of the VVVF circuits, these inherently can run from a DC source with a voltage close to its rated AC peak voltage. For our analysis, a number of AC to AC converters (VVVF inverters) that drive variable speed knitting machines were considered as the load. The AC to AC converter has a 3-phase full bridge rectifier at its input end and a variable frequency inverter at the output end as shown in the schematic diagram in Figure 1. The 3-phase grid supply is first rectified through an externally connected bridge rectifier and the DC output is given as input to the two of the three terminals of the AC to AC converter via a 3-pole magnetic contactor. The negative end of the PV array is connected to the negative end of the external bridge rectifier that converts the grid AC to DC. The positive terminal of the PV array, the positive terminal of the grid DC and the common negative terminal are connected to the three input terminals of the magnetic contactor and the output of the magnetic contactor is then connected to the three inputs of the AC to AC converter. The choice of the terminals has no impact on the operation of the circuit. The circuit arrangement ensures that there is no backflow of power from the panel to the grid or from the grid to the panel. The magnetic coil of the contactor is energized from the grid ensuring that the magnetic contactor disconnects the AC to AC converter from the grid and the solar PV to avoid any accident due to high PV voltage when the grid power is off. In a developing country such as Bangladesh, load shedding is not an uncommon phenomenon and it is important to isolate the load from the PV during load shedding. This is enforced by the magnetic contactor whose magnetic coil is energized by the grid voltage. When there is load shedding the magnetic coil is de-energized and contact with the PV is disconnected. This ensures personnel safety during grid power failure or repair and maintenance of the machine. There is a 1000 μ F capacitor connected at the output of the PV array which makes sure that the PV voltage remains steady during the switched mode operation of the inverter. This is important to keep the PV voltage always close to the maximum power point voltage for efficient operation.

3.3. Operating Conditions and Expected Losses

While PV output and the grid are connected via the rectifying circuits (shown in Figure 1), the following two conditions may occur during power sharing between the grid and the panel.

3.3.1. Condition 1: When the Load Power Is Less Than the Maximum Power of the Solar PV

Under this condition, PV output at its maximum power point is higher than the power consumption of the load. This may occur due to strong sunshine or very low power requirement from the load. Under such a condition, the PV terminal voltage increases to a value higher than the grid voltage to adjust to the load power. As per the design of the control circuit, any increase in the PV voltage will reverse bias the rectifier circuit on the grid side (as the grid side voltage is almost constant) and power flow from the grid will stop. This is an unwanted situation as the power flow from the PV panels are less than their capability to deliver and should be avoided.

3.3.2. Condition 2: When the PV Power Is Less Than the Load Power

Under this condition, the rectified grid voltage determines the DC voltage at the input side of the inverter and the current flow from the PV panel will correspond to the DC operating voltage. As per the design, the DC voltage obtained from the rectified grid supply is slightly below the maximum power point (MPP) voltage of the PV.
Therefore, PV supplies the majority of the load power requirement while operating close to MPP. The remaining fraction of the total load power is drawn from the grid. The percentage of power share between the PV and the grid will depend on the sunshine condition. Solar PV maximum power point voltage decreases from the standard testing condition (STC) value under lower sunshine conditions. Therefore, under varying sunshine, solar PV operates at the grid voltage but suffers some degree of power loss due to the deviation of the maximum power point voltage. Our numerically simulated results presented in Section 5.1 show that the loss remains well within 5% for an optimally designed system.
While designing the PV array, we should ensure that the situation described in condition 1 rarely takes place. Unlike the MPPT (maximum power point tracking) inverters, the control circuit is very simple and can handle the rapid fluctuations in the sunshine conditions without having any adverse effect on the efficiency. The I-V characteristics of the solar panel ensure that, under condition 2, PV delivers its power to the load and only the remaining fraction of the load-power requirement is drawn from the grid. During the night hours, there is no PV output and the full power is drawn from the grid.
The array is designed in such a way that the operating voltage of the system is set slightly lower (3–5% lower) than the STC maximum power point voltage of the PV array. This is to make sure that the operating DC voltage of the system (i.e., inverter inside the machine) never goes higher than the MPP voltage of the PV array due to the fluctuation of the grid voltage. The power output of a PV array reduces rapidly if the operating voltage goes beyond the maximum power point. Hence, the array is designed such that the operating DC voltage never exceeds the maximum power point voltage of the PV.
As far as the efficiency of the control circuit is concerned, losses in the rectifiers are the main losses, considering that there is no significant loss in the connecting wires or the magnetic contactor. In the case of the bridge rectifier, two diodes remain in conduction while under operation and the expected voltage drop V d i o d e will be of the order of 2 V (∼1 V for each diode). Considering the operating DC voltage of the inverter to be V D C , any current (I) will deliver load power of P ( = I × V D C ) and the corresponding power loss in the two diodes will be P L o s s ( = I × V d i o d e ). So, the loss fraction of the load power will be ( I × V d i o d e ) / ( I × V D C ) = V d i o d e / V D C ( 2 V ) / V D C . Similarly, in the PV circuit, there is only one diode in the conduction path and the expected loss fraction in the PV portion of the circuit is (1 V)/ V D C (∼1 V drop in a single diode). The usual voltage of V D C will be close to 535 V D C for a 3-phase 400 V AC system. This corresponds to 0.37% and 0.18% loss in the grid and PV portion of the control circuit, respectively. This is no doubt a very low loss figure for a circuit connecting PV to the grid. Loss in the magnetic contactor [32] will depend on the type chosen and should not exceed 10 W.

4. System and Model Setup

In the following subsections, we will discuss the experimental system setup and the numerical model considerations.

4.1. System Configuration

We implemented our scheme in a small knitting section of Niagara Textiles, where four knitting machines were energized by the system. Each of the machines was rated at 3.5 kW, and the inverters driving the machines were rated at 4 kW. The actual load of the knitting machines varied with the thickness and type of yarn used and speed of operation. As the total maximum power of the knitting machines was 14 kW, we decided to perform the experiment with a much lower PV size (∼5 kWp) so that the power generated from the solar PV is never higher than the load. This was to ensure the maximum utilization of solar energy. The grid line was a 3-phase 400 V supply, but there was some variation of the line voltage, which varied from 390 V to 410 V depending on the internal load condition of the textile industry. The DC value of the rectified voltage correspondingly varied from 525 to 550 V.
The solar panels that were available in the market had MPP voltages of 18.65 V, 31.34 V, 36.4 V, and higher. While using Equation (1), we found that V M P P of 31.34 V produces the value of N to be 18 when the V G D C is considered 537.5 V (halfway between 525 and 550 V). Therefore, we chose to use 18 panels in series. The rated power of the PV panels available in the market varied from 250–330 W p and we chose 275 W p panels for our purpose so that the total watt peak for the PV array of 18 panels is 4.95 kW that is close to the targeted 5 kW. Each panel has 60 cells in series making the MPP voltage of 31.34 V as presented in Table 1. The MPP voltage of the array for N = 18 corresponds to 564.12 V. The average operating voltage of 535 V is about 5% lower than the rated MPP voltage. This is, as discussed earlier, to ensure efficient operation of the PV panels when the grid voltage fluctuates or the sunshine varies. Table 1 summarizes the design factors chosen for the PV array. The PV array was put on the roof of one of the buildings such that there is no shading/partial shading from any other structures nearby. The panels were tilted at an angle of 20 to the south, considering the latitude of the location to be 23 N.

4.2. Numerical Model

Typically, the equivalent circuit of a solar cell is represented by a current source connected in parallel with a diode and a resistance R s h . A series resistance R s takes into account the resistance inside the solar cell while the load current flows through the semiconductor and contact of the p-n junction. Figure 2 shows the widely used equivalent circuit.
The load current I L [33] is given by
I L = I s c I 0 exp ( V + I L R s ) k T / e 1 ( V + I L R s h ) R s h
where e is the electronic charge, k is the Boltzmann constant and T is the temperature in K. I s c is the short circuit current for a given input radiation, V is the output voltage of a PV cell. The solar module used has 60 cells in series and we have used 18 panels in series. Therefore, the voltage V = V L / ( 60 × 18 ) , where V L is the PV array terminal voltage. During the open circuit condition, I L is zero and the diode current is much larger than the current through the shunt resistance R s h . Therefore, we have I 0 = 1.44 × 10 10 A, under the standard testing condition listed in Table 1. We numerically modeled the solar module I–V given the I 0 value—to match the voltage and the current at the MPP to the ratings, we found R s and R s h values of 4.47 m Ω and 10 Ω , respectively.

5. Results and Discussions

5.1. Numerical Analysis

The grid AC voltage in Bangladesh can fluctuate from 390 to 410 V depending upon the load condition of the textile mill. As there is no maximum power point tracking in the proposed control circuit, the PV array usually operates at a voltage that corresponds to the DC voltage obtained by the rectification of the grid AC. Hence, there is a likelihood that the array will operate at a voltage off the MPP and will not extract the maximum possible power.
If the operating voltage is too much off the MPP voltage, we may lose a significant amount of PV power. So, to get an idea about the loss of PV power due to deviation from MPP voltage, we simulated the maximum power point voltage for the PV array under different sunshine conditions with the parameters given in Table 1. The simulation result is presented in Figure 3.
The figure shows that the maximum power point voltage at cell temperature of 25 C varies from near 565 V at sunshine of 1000 W/m 2 to a lower voltage of 555 V for sunshine of 250 W/m 2 . The average sunshine in Bangladesh is close to 600 W/m 2 [34] for the effective sunshine hours of 8 h and the corresponding MPP voltage is 565 V. However, the MPP voltage drops significantly if we take into consideration the actual cell temperature under different sunshine conditions. We used the Skoplaki model [35] to calculate the cell temperatures based on the experimentally obtained ambient temperature and plane-of-array irradiance. Considering the ambient temperature at 25 C, the MPP voltage drops with higher incident radiation and is shown by the dotted line in Figure 3. Under the 1-sun condition, our calculations show that the cell temperature becomes close to 55 C and MPP voltage reaches as low as 500 V. This forms the basis for our choice of the PV array voltage. On observation in the Niagara Textile Mill, we found that the DC voltage at the load mostly remains close to 535 V with the occasional dip to 530 V. We simulated the performance of the solar panel under different DC voltages for varying sunshine conditions and the results are presented in Figure 4. Within an operating DC voltage of 520–540 V, we may lose some power from the PV panel array due to the deviation from the MPP of the panels. If the cell temperature is kept constant at 25 C, then the loss never exceeds ∼4% for a wide range of sunshine varying from 250–1000 W/m 2 , as shown in Figure 4a. On the other hand, if we simulate the losses considering the actual cell temperature under different sunshine conditions, then the losses remain below 5% except for the high radiation intensity of 1 sun when the loss becomes ∼7.5% for an operating voltage of 540 V DC, see Figure 4b. However, the sunshine intensity in Bangladesh has an average value close to 650 W/m 2 and seldom reaches 1000 W/m 2 and the operating voltage mostly remains around 535 V. So, it is quite reasonable to assume that the losses due to deviation from the MPP voltage remain within 5%.
As explained in Section 3.3, the low power consumption by the load connected to the inverter may result in losses due to higher PV generation. Considering the factors mentioned above, it is important to estimate the power extraction efficiency of our system under different load and sunshine conditions. If P M P is the power of the array at MPP under a given sunshine condition and P P V is the PV power received at the load then we can define a power extraction efficiency η e x , where
η e x = P P V P M P
The net load power is
P L = P P V + P G ,
where P G is the load power consumed from the grid.
The simulated results in Figure 5 show the simulated extraction efficiency of the PV array for two different conditions. The solid line is for a fixed cell temperature of 25 C (i.e., STC). The dashed line is for an ambient temperature of 25 C incorporating the variation in cell temperature (using the Skoplaki model, as mentioned earlier) and the variation of MPP power of the panels due to varying sunshine for a given load power of P L .
The PV-array was designed for P M P 5 kW (rated under 1000 W/m 2 irradiance)—we can expect the output to proportionately (approximately) reduce with decreasing intensity. As long as the panel MPP is lower than the load requirement P M P < P L , the load draws the maximum possible power from the panel and the rest from the grid. Of course, we will always have P M P < P L at lower sunshine, resulting in high extraction efficiencies η e x , as seen in Figure 5.
For example, for a load power of 3 kW, the PV power P M P remains lower than the load power P L when the sunshine remains lower than 650 W/m 2 . As the sunshine increases further, the PV power becomes higher than the load power and the extraction efficiency starts falling rapidly, as can be seen in Figure 5. This is an expected outcome as the PV system’s excess power cannot be supplied to the grid.
It may be intuitively expected that η e x remains close to 100% when we have a matching load of 5 kW. However, for sunshine higher than 700 W/m 2 , the cell temperature becomes quite high and the extraction efficiency becomes lower, even for P L > P M P , due to lowering of the MPP voltage from the grid voltage (the simulation results consider an operating DC voltage of 535 V). As already discussed earlier, the extraction efficiency for P L > P M P remains above 95% (meaning a loss of 5%) for a wide range of sunshine (<950 W/m 2 ), which should be an acceptable figure for the sunshine conditions in Bangladesh.
The above simulations provide us with the following insights:
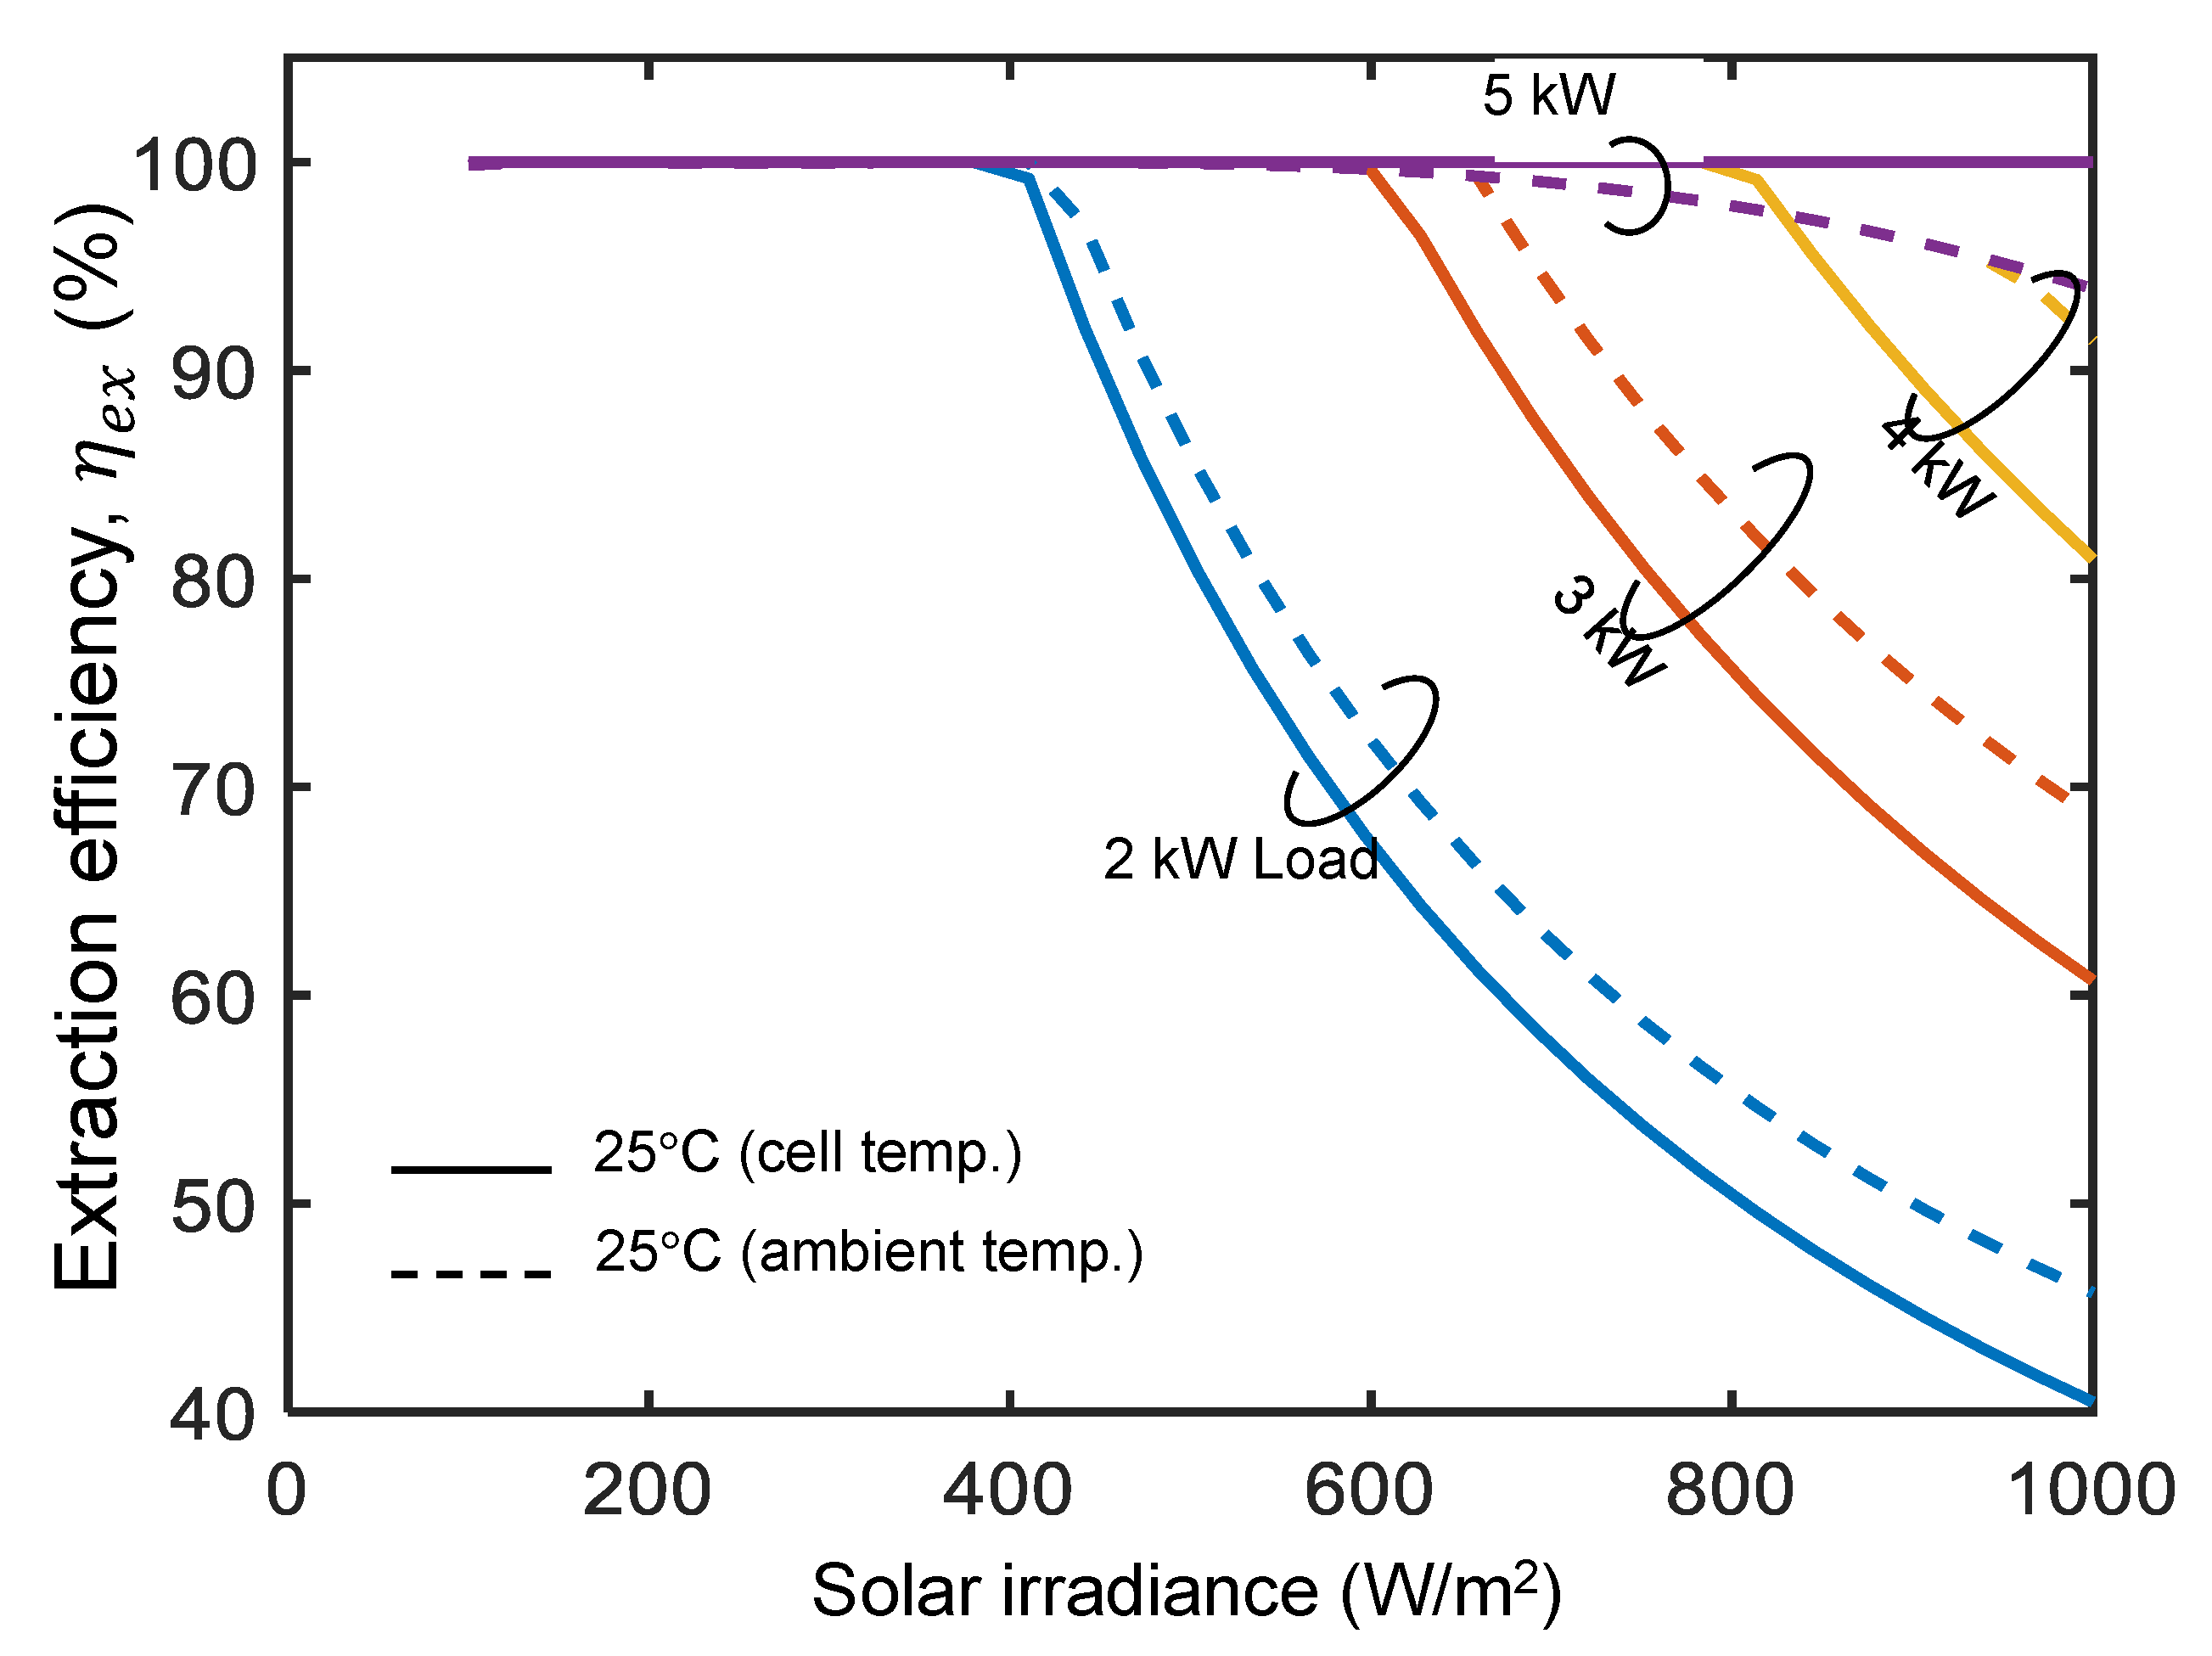
  • Unlike the grid-tied inverters, the DC link presented here is unable to transmit power to the grid. So, the design should ensure that the connected load must not be less than the PV generation, as higher PV generation will result in low energy extraction efficiency from the PV array.
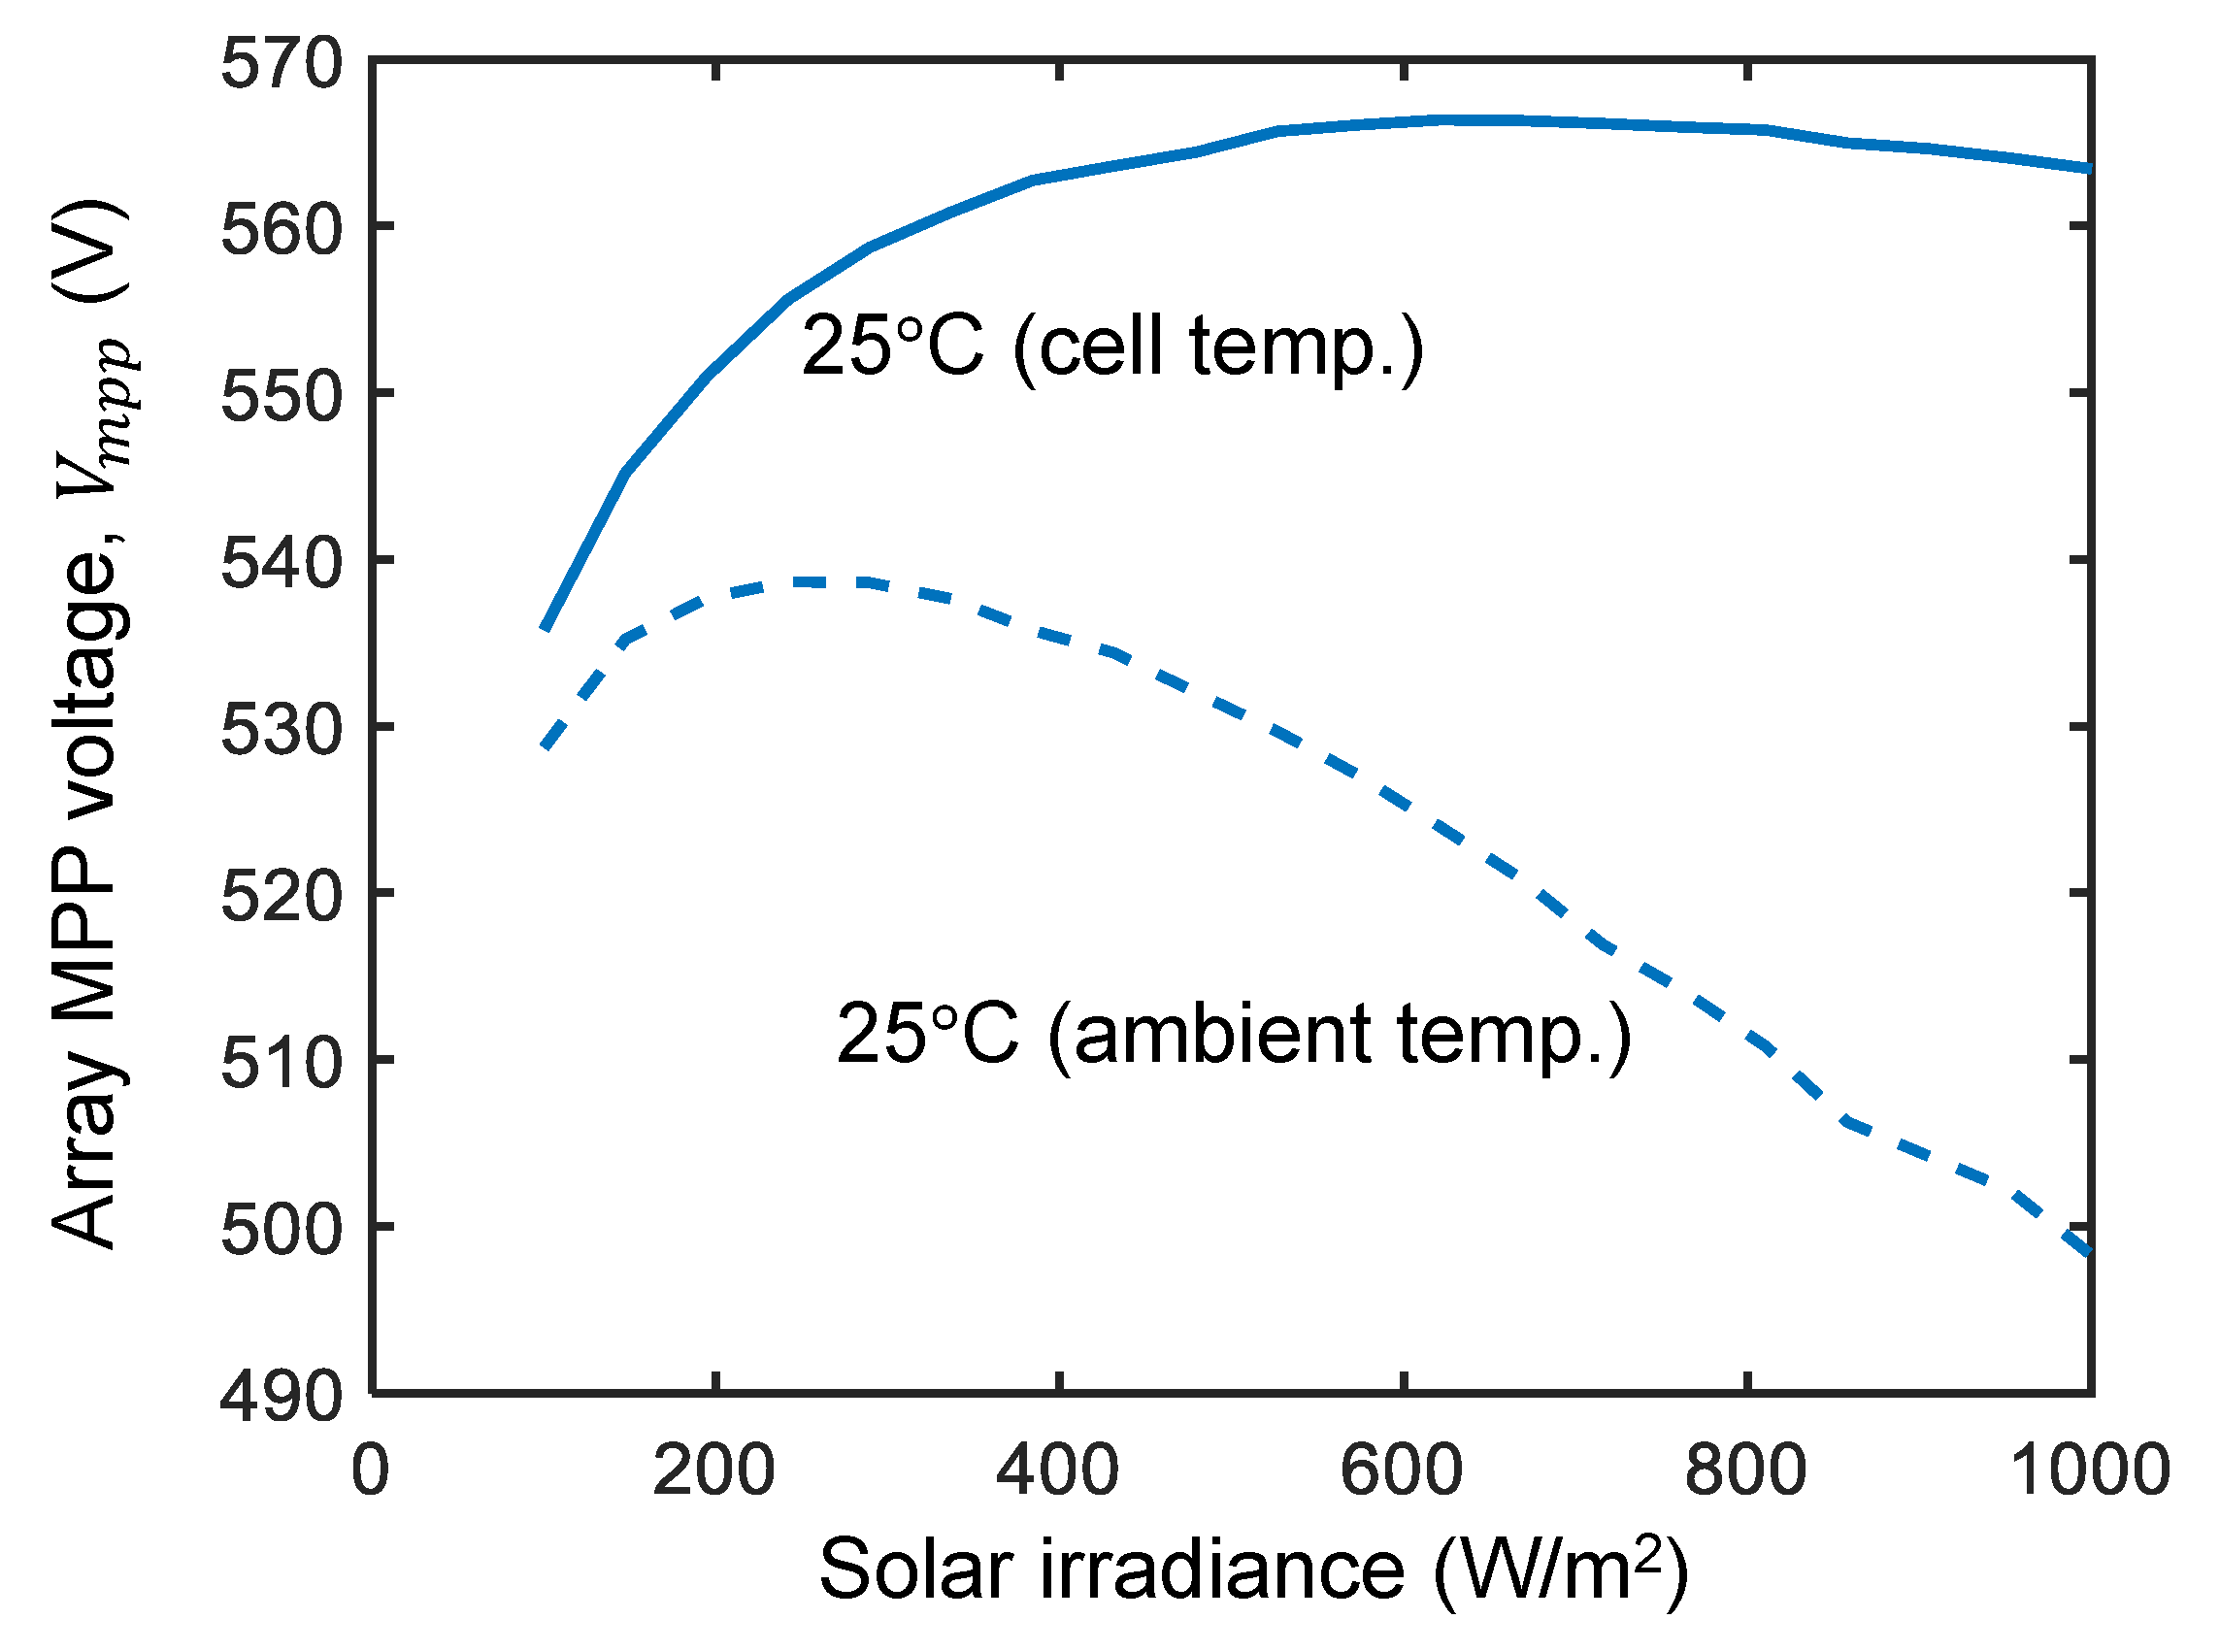
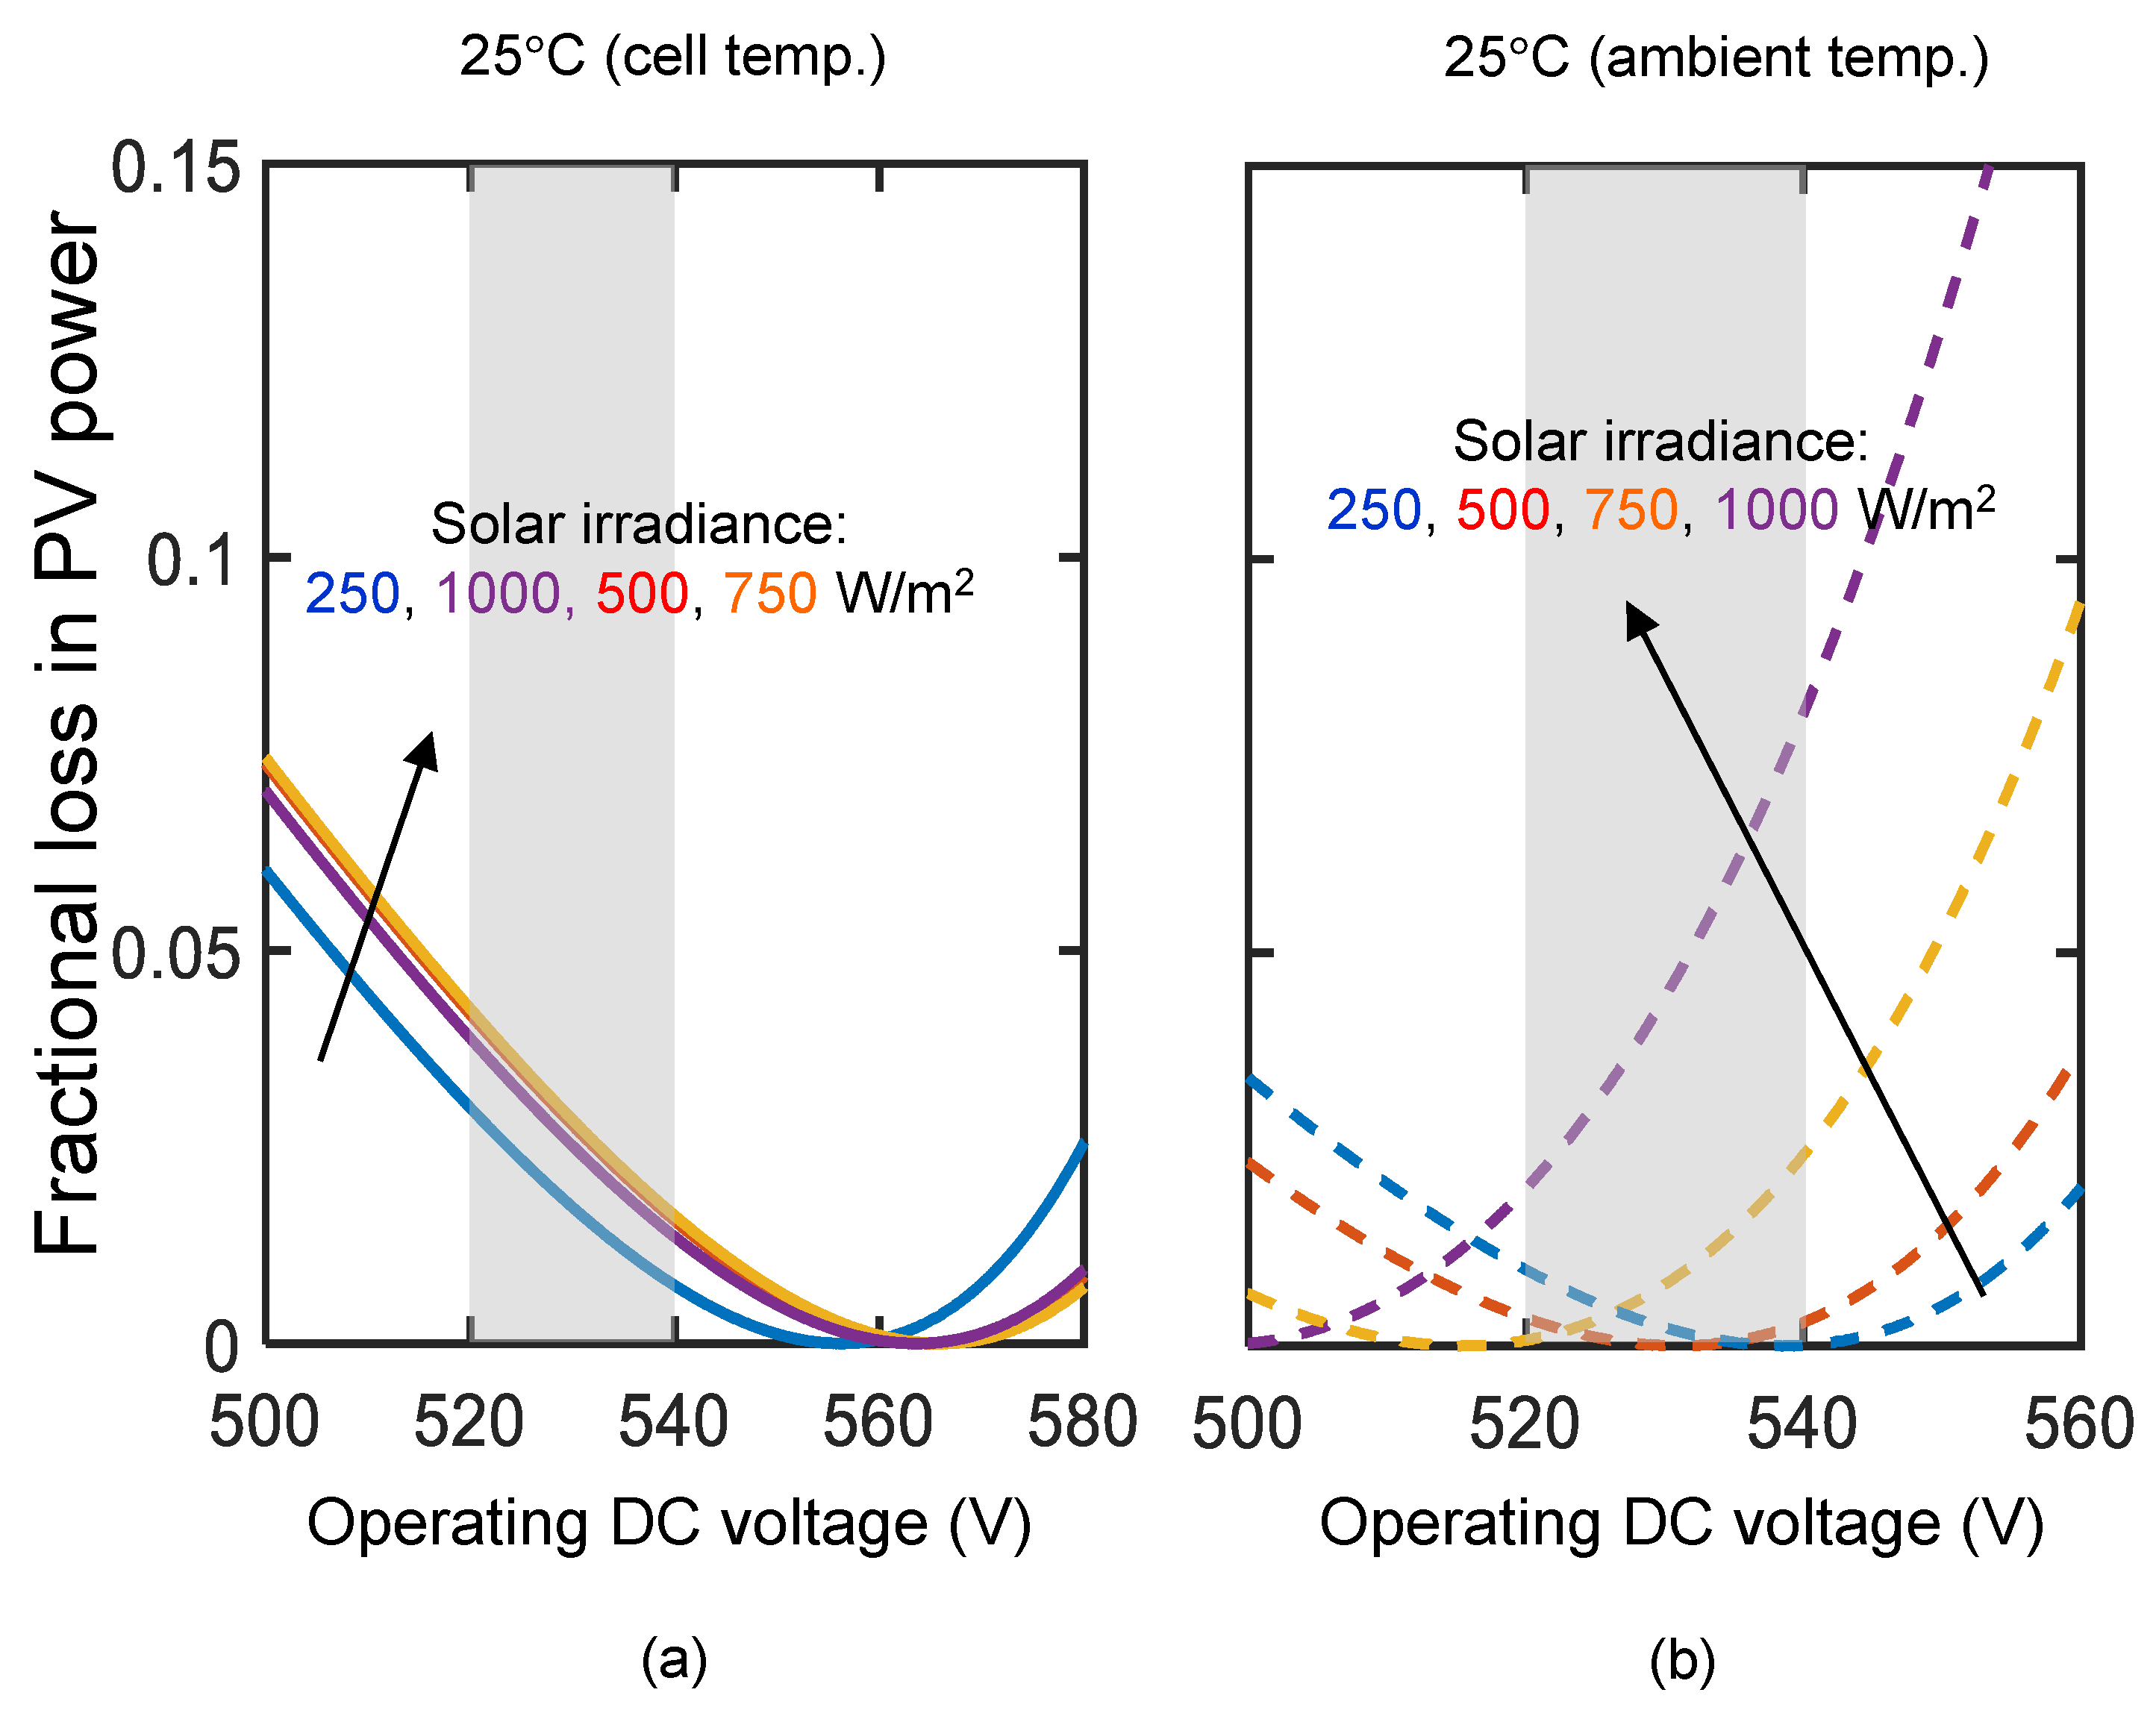
  • The presented control circuit does not track the maximum power point of the PV array but instead supplies power at a voltage generated by rectification of the grid supply. The PV array is designed such that the maximum power point is close to the operating DC voltage to limit the power extraction loss ( 1 η e x ) . So, it is important to estimate the possible loss of energy when the grid voltage fluctuates.
  • The operating point of the load voltage should remain within a range such that the actual extraction of power from the grid remains high under varying load conditions, grid voltage fluctuations, and variations in the sunshine.

5.2. Experimental Results

Figure 6 shows the picture of the PV array installed on the roof of the Niagara textiles. Four knitting machines, each having a maximum power of 3.5 kW, were connected to the DC grid as described earlier and the total estimated load was expected to vary from 6 kW to 10 kW, depending on the size of the cotton yarn used and the speed of the machines determined by the production process. The knitting machines driven by the VVVF inverters are rated at a maximum input voltage of 570 V A C (corresponding peak value of 800 V). The PV system of 18 panels connected in series has an open circuit voltage of 690 V, which is well within the maximum voltage rating of the inverter. The 3-phase full wave rectifier module had a maximum reverse voltage of 1000 V and a maximum current of 60 A which is much higher than the required current capacity. The choice of the rectifier module was based on its ready availability in the local market and the price was USD 4.50. The magnetic contactor used was a 3-pole 700 V A C with a current rating of 40 A. The power-sharing between the solar PV and the grid under different running conditions, as measured, is given in Table 2.
The measurements were taken at different times of the day to have different levels of sunshine and also under different load conditions. The column P M P was numerically calculated (as discussed in Section 5.1) for the measured sunshine data given in the table at 25 C ambient temperature. As can be seen from Table 2, the lowest grid power delivered was 0.6 kW, which indicates that the PV power was always less than the load power. If we compare the η e x presented in Table 2, we find that the value remains below 95%, less than predicted by the simulation results. This is due to the fact that the measured power includes other losses such as line loss, loss in the rectifier network, etc. The extraction efficiency ( η e x ) value seems to reduce for lower sunshine conditions. It may be mentioned here that the lower sunshine values correspond to the morning or the afternoon hours when the incidence angle of the sunshine was higher causing more reflection from the panel surface. We also cannot eliminate the possibility of 1–2% measurement errors. However, it is important that the overall extraction efficiency (including all the losses) remains higher than 90% which is reasonably high.

6. Conclusions

Modern-day industrial drives are inverter driven and the input AC from the grid is rectified right away to feed the internal DC bus of the inverter. In this research, we fed DC directly to the inverter terminals to get rid of the grid-tied inverters for lower cost and higher efficiency. The proposed system shows a seamless power-sharing mechanism that gives priority to solar power drawing only the shortfall from the grid. Although no power point tracking is used for the solar panels, the array of the solar panels is designed in such a way that the operating DC voltage is close to the maximum power point voltage of the PV array. Simulations show that the loss of power due to deviation in the maximum power point is less than 5% even under higher cell temperatures. The loss in the control circuit is estimated to be less than 1% and we achieved more than 90% power extraction from the panels over a wide range of sunshine and load conditions except for very low sunshine. The elimination of grid-tied inverters is expected to reduce the cost of energy from such rooftop solar by around 20%, which may prove to be very attractive for industries. The limitation of the proposed system is its inability to export PV power to the grid when the industry is not in operation. So, it is important to do further research to find an effective way to utilize solar PV output during the holidays when the industry is closed.

Author Contributions

Conceptualization, I.A. and M.R.K. (M. Rezwan Khan); Methodology, I.A. and M.R.K. (M. Rezwan Khan); Software, M.R.K. (M. Ryyan Khan); Validation, M.R.K. (M. Ryyan Khan); Formal analysis, M.R.K. (M. Ryyan Khan) and M.R.K. (M. Rezwan Khan); Investigation, M.R.K. (M. Ryyan Khan), I.A. and M.R.K. (M. Rezwan Khan); Data curation, M.R.K. (M. Ryyan Khan); Writing—original draft, I.A.; Writing—review & editing, M.R.K. (M. Ryyan Khan); Supervision, M.R.K. (M. Rezwan Khan); Project administration, M.R.K. (M. Rezwan Khan); Funding acquisition, M.R.K. (M. Rezwan Khan). All authors have read and agreed to the published version of the manuscript.

Funding

Funded by Institute for Advanced Research, Publication Grant of United International University, Ref. No.: IAR-2022-Pub-041 (https://iar.uiu.ac.bd/, accessed on 20 January 2023).

Data Availability Statement

The data can be made available upon reasonable request to the authors via email.

Acknowledgments

The authors would like to express their sincere gratitude to the Niagara Textiles for their support in implementing the project.

Conflicts of Interest

The authors declare no conflict of interest.

Abbreviations

The following abbreviations are used in this manuscript:
V L Load Voltage
V O C Open circuit voltage
V G D C Rectified grid voltage
V M P Maximum power point voltage of a single array
P P Individual Panel Power in Watt Peak W p
V P V m Maximum voltage of the PV array
I s c Short circuit current
I m Panel maximum current

References

  1. Roy, D.; Rout, U.K.; Jonalagadda, S.; Behera, P. A Brief Analysis on Solar Status of India. In Proceedings of the International Conference on Innovative Mechanisms for Industry Applications, Bengaluru, India, 21–23 February 2017; Volume 1, pp. 451–456. [Google Scholar] [CrossRef]
  2. De Sousa Stilpen, D.V.; Cheng, V. Solar Photovoltaics in Brazil: A Promising Renewable Energy Market. In Proceedings of the International Renewable and Sustainable Energy Conference (IRSEC), Marrakech, Morocco, 10–13 December 2015; Volume 3. [Google Scholar] [CrossRef]
  3. Sultan, H.M.; Kuznetsov, O.N.; Diab, A.A.Z. Site selection of large-scale grid-connected solar PV system in Egypt. In Proceedings of the IEEE NW Russia Young Researchers in Electrical and Electronic Engineering Conference, Moscow and St. Petersburg, Russia, 29 January–1 February 2018; pp. 813–818. [Google Scholar] [CrossRef]
  4. Solar Pulse. Are Solar Panels Just for Rich People? Priceconomics Data Studio. 21 June 2016. Available online: https://priceonomics.com/are-solar-panels-just-for-rich-people/ (accessed on 20 January 2023).
  5. Hinckley, S. Coastal California Has a Reputation as a Leader in Green Energy—But Only the Rich are Benefiting. Available online: www.businessinsider.com/only-the-rich-are-benefiting-from-green-energy-in-california-2018-2 (accessed on 12 February 2018).
  6. Calma, J. Solar Energy Reaches Historically Low Costs: Solar Is ‘the New King’. The Verge. 13 October 2020. Available online: https://www.theverge.com/2020/10/13/21514902/solar-energy-cost-historic-low-energy-agency-outlook-2020 (accessed on 20 January 2023).
  7. Niranjan, A. Falling Solar Panel Prices Spell Sunny Future for Clean Energy. DW.com. 25 May 2020. Available online: https://www.dw.com/en/cheap-solar-energy-prices-explained/a-53590607 (accessed on 20 January 2023).
  8. Nipon Ketjoy, W.C.A.; Mensin, P. Analysis of factors affecting efficiency of inverters: Case study grid-connected PV systems in lower northern region of Thailand. Energy Rep. 2021, 7, 3857. [Google Scholar] [CrossRef]
  9. Rashid, M.H. Alternative Energy in Power Electronics; Elsevier: Amsterdam, The Netherlands, 2015. [Google Scholar]
  10. Gostein, M.; Caron, J.R.; Littmann, B. Measuring soiling losses at utility-scale PV power plants. In Proceedings of the 2014 IEEE 40th Photovoltaic Specialist Conference (PVSC), Denver, CO, USA, 8–13 June 2014; pp. 0885–0890. [Google Scholar] [CrossRef]
  11. Zhao, W.; Lv, Y.; Wei, Z.; Yan, W.; Zhou, Q. Review on dust deposition and cleaning methods for solar PV modules. J. Renew. Sustain. Energy 2021, 13, 032701. [Google Scholar] [CrossRef]
  12. Rezwan Khan, M.; Lutful Kabir, S.M.; Choudhury, M.A. Resurrection of DC: An Exposition for Future Power System. In Proceedings of the 2018 10th International Conference on Electrical and Computer Engineering (ICECE), Dhaka, Bangladesh, 20–22 December 2018. [Google Scholar] [CrossRef]
  13. Bose, B.K. Power Electronics and Motor Drives: Advances and Trends; Academic Press: Cambridge, MA, USA, 2006; ISBN 978-0-12-088405-6. [Google Scholar]
  14. Eisenbrown, R.E. AC Drives, Historical and Future Perspective of Innovation and Growth. In Proceedings of the 25th Anniversary of The Wisconsin Electric Machines and Power Electronics Consortium (WEMPEC), University of Wisconsin, Madison, WI, USA, 18 May 2008; pp. 6–10. [Google Scholar]
  15. Narendra, A.; Venkataramana Naik, N.; Kumar Panda, A.; Tiwary, N. A Comprehensive Review of PV Driven Electrical Motors. Sol. Energy 2020, 195, 278–303. [Google Scholar] [CrossRef]
  16. Khan, M.R.; Alam, I. A Solar PV-Based Inverter-Less Grid-Integrated Cooking Solution for Low-Cost Clean Cooking. Energies 2020, 13, 5507. [Google Scholar] [CrossRef]
  17. Infrastructure Development Co., Ltd. Available online: http://idcol.org/home/rooftopsolar (accessed on 15 October 2020).
  18. Amelia, A.R.; Irwan, Y.M.; Leow, W.Z.; Irwanto, M.; Safwati, I.; Zhafarina, M. Investigation of the Effect Temperature on Photovoltaic (PV) Panel Output Performance. Int. J. Adv. Sci. Eng. Inf. Technol. 2017, 6, 682–688. [Google Scholar]
  19. Thong, L.W.; Murugan, S.; Ng, P.K.; Sun, C.C. Analysis of Photovoltaic Panel Temperature Effects on its Efficiency. In Proceedings of the 2nd International Conference on Electrical Engineering and Electronics Communication System 2016, Ho Chi Minh, Vietnam, 18–19 November 2016. [Google Scholar]
  20. Fesharaki, V.J.; Dehghani, M.; Fesharaki, J.J.; Tavasoli, H. The Effect of Temperature on Photovoltaic Cell Efficiency. In Proceedings of the 1st International Conference Emerging Trends in Energy Conservation, Bordeaux, France, 6–10 November 2011; pp. 20–21. [Google Scholar]
  21. Mohamed, A.; Khatibi, T. Correlation for estimating solar cell temperature based on a tropical field operation of a photovoltaic system. In Proceedings of the 2014 IEEE/PES Transmission & Distribution Conference & Exposition (T&D), Chicago, IL, USA, 14–17 April 2014; pp. 1–5. [Google Scholar]
  22. Manasrah, A.; Masoud, M.; Jaradat, Y.; Bevilacqua, P. Investigation of a Real-Time Dynamic Model for a PV Cooling System. Energies 2022, 15, 1836. [Google Scholar] [CrossRef]
  23. Mithhu, M.M.H.; Rima, T.A.; Khan, M.R. Global analysis of optimal cleaning cycle and profit of soiling affected solar panels. Appl. Energy 2021, 285, 116436. [Google Scholar] [CrossRef]
  24. Jahangir, J.B.; Al-Mahmud, M.; Shakir, M.S.S.; Mithhu, M.M.H.; Rima, T.A.; Sajjad, R.N.; Khan, M.R. Prediction of Yield, Soiling Loss, and Cleaning Cycle: A Case Study in South Asian Highly Construction-Active Urban Zone. In Proceedings of the 2020 47th IEEE Photovoltaic Specialists Conference (PVSC), Calgary, AB, Canada, 15 June–21 August 2020; pp. 1371–1374. [Google Scholar] [CrossRef]
  25. Ilse, K.K.; Figgis, B.W.; Naumann, V.; Hagendorf, C.; Bagdahn, J. Fundamentals of soiling processes on photovoltaic modules. Renew. Sustain. Energy Rev. 2018, 98, 239–254. [Google Scholar] [CrossRef]
  26. Maghami, M.R.; Hizam, H.; Gomes, C.; Radzi, M.A.; Rezadad, M.I.; Hajighorbani, S. Power loss due to soiling on solar panel: A review. Renew. Sustain. Energy Rev. 2016, 59, 1307–1316. [Google Scholar] [CrossRef] [Green Version]
  27. Jones, R.K.; Baras, A.; Al Saeeri, A.; Al Qahtani, A.; Al Amoudi, A.O.; Al Shaya, Y.; Alodan, M.; Al-Hsaien, S.A. Optimized Cleaning Cost and Schedule Based on Observed Soiling Conditions for Photovoltaic Plants in Central Saudi Arabia. IEEE J. Photovoltaics 2016, 6, 730–738. [Google Scholar] [CrossRef]
  28. Jones, R.K. Solving the Soiling Problem for Solar Power Systems. Joule 2019, 3, 2298–2300. [Google Scholar] [CrossRef]
  29. Bangladesh Energy Regulatory Commission. Available online: http://www.berc.org.bd/site/view/notices (accessed on 12 February 2023).
  30. Schultis, D.-L. Effective Volt/var Control for Low Voltage Grids with Bulk Loads. Energies 2022, 15, 1950. [Google Scholar] [CrossRef]
  31. Chowdhury, S.A.; Khan, M.Z.R. The Net Metering Guideline of Bangladesh-Potential and Way Forward. In Proceedings of the 2020 11th International Conference on Electrical and Computer Engineering (ICECE), Dhaka, Bangladesh, 17–19 December 2020; pp. 435–438. [Google Scholar] [CrossRef]
  32. Lin, S.; Huang, X. Power Loss Analysis of AC Contactor at Steady Closed State with Electromagnetic-Thermal Coupling Method. J. Inf. Hiding Multimed. Signal Process. 2017, 8, 290–299. [Google Scholar]
  33. Dongaonkar, S.; Karthik, Y.; Wang, D.; Frei, M.; Mahapatra, S.; Alam, M.A. On the nature of shunt leakage in amorphous silicon p-i-n solar cells. IEEE Electron Device Lett. 2010, 31, 1266–1268. [Google Scholar] [CrossRef]
  34. Obaidullah, M.; Sarkar, M.A.R.; Martinac, I. Performance and Life Cycle Cost Analysis of a Stand Alone PV Lighting System. J. Energy Environ. 2004, 3, 25–32. [Google Scholar]
  35. Skoplaki, E.; Palyvos, J.A. Operating temperature of photovoltaic modules: A survey of pertinent correlations. Renew. Energy 2009, 34, 23–29. [Google Scholar] [CrossRef]
Figure 1. Block diagram of the control circuit to drive the existing motor controller.
Energies 16 02060 g001
Figure 2. Circuit model of a solar cell.
Energies 16 02060 g002
Figure 3. Variation of MPP voltage for variation of sunshine.
Energies 16 02060 g003
Figure 4. Loss of solar PV power due to deviation in the MPP voltage under varying sunshine conditions for different operating DC voltage are shown assuming (a) STC conditions, i.e., cell temperature at 25 C, and (b) practical conditions, i.e., ambient temperature of 25 C. Load power is greater than 5 kW.
Energies 16 02060 g004
Figure 5. Solar energy extraction efficiency of the system for different load power under varying sunshine conditions. Load voltage is assumed to be 535 V D C .
Energies 16 02060 g005
Figure 6. Picture of the solar PV array installed at the roof of Niagara Textiles.
Energies 16 02060 g006
Table 1. Module and array configuration ratings.
W p of the PV module, W275
V O C , V 38.28
I s c , A 9.29
V m , V 31.34
I m , A 8.77
Number of PV modules18
Rating of the array W p , k W 4.95
Temperature coefficients of the short circuit current, open circuit voltage, and maximum power are 0.058%/°C, −0.33%/°C, and −0.4%/°C, respectively.
Table 2. Estimation of extraction efficiency in our experiments.
Irradiance, W m 2 Load Voltage, V dc Measured PV Power,  P PV , kWPower from Grid, kW P MP , kW (Calculated)% η ex
266.75381.075.51.2585.6
444.45361.94.82.0891.3
705.95403.010.63.2293.5
740.75403.190.93.3694.9
Disclaimer/Publisher’s Note: The statements, opinions and data contained in all publications are solely those of the individual author(s) and contributor(s) and not of MDPI and/or the editor(s). MDPI and/or the editor(s) disclaim responsibility for any injury to people or property resulting from any ideas, methods, instructions or products referred to in the content.

