Article

Operation and Thermodynamic Modeling of a Novel Advanced Hydrothermal Reactor: Introduction of the Novel 3-Step Evolution Model

by
Stergios Vakalis
1,*,
Snehesh Shivananda Ail
2,
Konstantinos Moustakas
3 and
Marco J. Castaldi
2
1
Energy Management Laboratory, Department of Environment, University of the Aegean, University Hill, 81100 Mytilene, Greece
2
Chemical Engineering Department, City College, City University of New York, New York, NY 10031, USA
3
Unit of Environmental Science & Technology, School of Chemical Engineering, National Technical University of Athens, Zographou Campus, 15780 Athens, Greece
*
Author to whom correspondence should be addressed.
Energies 2023, 16(4), 2032; https://doi.org/10.3390/en16042032
Submission received: 7 January 2023 / Revised: 11 February 2023 / Accepted: 15 February 2023 / Published: 18 February 2023
(This article belongs to the Special Issue Advanced Technologies for Sustainable Bio-Fuels Production)

Abstract

:
Liquid biowaste represents more than 98% of the total municipal waste streams on wet basis and 4–5% on dry basis. Recent attention has been focused on how to manage it optimally, and several novel technologies are being developed to valorize it. Among the developing alternatives is a technology that operates continuously by integrating a hydrothermal reactor, a gasifier and condenser to recover hydrochar using any produced gases to power the system. This study introduces the “3-step evolution model” in order to simulate the hydrothermal reactor. The model has been developed in a MATLAB/Cantera environment and calculates the outputs as the products of a series of sub-stoichiometric char-gas reactions. Experiments with chicken manure slurry as feedstock were implemented for the validation of the model. Treatment of 32.16 kg/h of chicken manure produces 4.57 kg/h of hydrochar and 3.45 kg/h of syngas. The 3-step evolution model simulated the correct ratio of solid-to-gas, 57–43% (excluding the liquids). The experimentally measured carbon dioxide is used as a correction factor to calculate all the other parameters that cannot be assessed during the continuous operation of the hydrothermal reactor. The simulated compositions for carbon dioxide and methane were 94–96% and 0.5–0.8%, respectively. The values were close to the experimental results that ranged from 94.7% to 95.6% for the carbon dioxide and from 0.5% to 0.7% for the methane. The model predicts that higher temperatures of operation would increase carbon monoxide composition from 4–5% up to 7–8%.

1. Introduction

Energy recovery strategies from lignocellulosic biomass and non-hazardous municipal solid waste (MSW) are well established and commercially available technologies [1] that are able to thermally valorize waste fractions and potentially even work in combination with anaerobic processes [2]. Unlike MSW, an underutilized fraction of organic waste includes low-solids and liquid streams from municipal and industrial wastewater. Wei et al. (2020) reported that on average 28.1 kg of sludge are being produced per capita annually in China, which amounts to 39 billion kg [3]. The authors connected the rapid urbanization of the country with increasing values of produced sludge and denoted the emission of greenhouse gas and the future challengers in the field of sludge management. On average, 0.63 m3 of wastewater are being produced per capita in the United States, which is equivalent to 0.075 kg of sludge per person per day or 26.65 kg of sludge per person per year [4]. Several differences can be identified among different States, including the population discrepancies and the wealth gap. California produces in total more than 600 million kg of sludge annually, and, for comparison, a less populated state such as Alaska produces less than 12,000,000 kg of sludge annually. The same report by the ‘National Research Council’ also discusses the effect of the ‘Clean Water Act and the Ocean Dumping Ban’ and the utilization and disposal of sludge [4]. New York state had beneficially used sludge as much as 50% from 1998 to 2009 but began to landfill more in 2010 and has continued that trend [5]. In Europe, a similar situation is observed, with Germany producing close to 2000 million kg of dry sludge annually, followed by the UK, France, Spain and Italy, all of whom exceed the production level of 1000 million kg of dry sludge annually as reported by Bianchini et al. [6]. The authors also presented the sludge treatment methods in each country, and more than 80% of the sludge is being landfilled in several countries such as Greece, Bulgaria and Romania. Nonetheless, most EU countries are turning towards more efficient methods of treatment, such as WTE and biological treatment methods.
The solid content in sludge is small, usually between 1% and 7% for the case of raw sludge, and can go up to 35% after dewatering. Thus, the application of thermochemical technologies for energy production has not been the standard practice. A common—and relatively successful—practice is the utilization of the wastewater from municipal [7] and industrial [8] practices as feedstock for anaerobic digestion and the production of biogas. The advantage of non-thermal technologies is the low technological and energy cost, but this comes with the drawback of low carbon conversion percentages [9] and long process times typically on the order of several days. Therefore, the potential of utilizing thermal processes for the valorization of sludge have recently been further investigated, since they have also additional advantages. The main advantages being that thermal processes render solids inactive and that the extracted volatiles from the inlet waste stream can be used to offset some of the power for the process. The main conventional thermal technologies for converting biomass into carbonaceous products or fuels are pyrolysis and gasification that operate at temperatures of 200 °C and higher requiring significant energy input. The main parameters that influence the carbon conversion, the char yield and the production of other gaseous or liquid products are temperature, pressure, the heating medium (atmosphere), the heating rate and the residence time [10]. The most applied pyrolysis method is torrefaction, which primarily takes place under medium/low temperatures, i.e., 200–350 °C, and residence times up to 3 h. This mild “roasting” of biomass targets the release of volatiles and advances energy densification of the final mass yield of the carbonaceous products, which usually exceeds 70%, while retaining the largest fraction of the initial energy [11]. A disadvantage of this method is the long residence times and the external energy requirements [12].
Bach and Skreiberg [13] published a thorough and comprehensive review that assessed the torrefaction of dry and wet feedstock. The authors identified the additional limitation of dry torrefaction for the cases of high ash content in the feedstock and highlighted the technical and economic challenges. Subsequently this study proceeded to the presentation of “wet torrefaction”/“wet oxidation” which is a term that refers to the utilization of a hydrothermal liquid medium under high pressures and moderate temperatures, i.e., 180–260 °C, for the treatment/pretreatment of biomass. The elevated pressure of the operating reactor prevents the hydrothermal liquid from boiling and transitioning to the gaseous phase thus operating at or near the saturation point. By means of this approach, substantial energy losses from the vaporization of water (i.e., the latent heat of vaporization) are avoided, and this thermochemical pathway can be preferable for the case of any feedstock with low solids and high water content [14]. The process converts the initial feedstock into products from all three different phases, i.e., gaseous products (e.g., CO2, H2 etc.), liquid products that are diluted in the aqueous phase and solid products that include the solid residue from the treatment and (in some cases) the carbonized solid product that is commonly referred to as hydrochar. Currently, several authors refer to this process as “hydrothermal carbonization” [15] and “hydrothermal treatment/pretreatment” [16] almost interchangeably with “wet oxidation” and “wet torrefaction”. A point of differentiation can be the quality of the final products, with “hydrothermal carbonization” being more focused on the actual conversion of the wet feedstock into hydrochar. A common denominator for all the hydrothermal carbonization technologies is that the input feedstock is biomass with high moisture content and that the final solid product contains a substantial fraction of the total input carbon [17]. The process of hydrothermal carbonization produces acidic functional groups, thus making hydrochar more acidic [18], with reported pH values ranging from 5.8 down to 3.5 [19]. Treatment of biomass residues with hydrothermal carbonization can be an environmentally friendly strategy [20], and a comprehensive critical literature review by Djandja et al. [21] identified hydrothermal as a very promising technology for the recovery of energy and materials from sludge.
Existing hydrothermal carbonization models are mainly dimensionless models that are based on the kinetics of the process and thus restricted to a specific reactor, while the results are derived from statistical correlations [22]. At the same time, black-box thermodynamic models of pressurized reactors do not have the ability to produce accurate results due to by-product formation being kinetically controlled, and the production of carbon dioxide, that has been experimentally measured in hydrothermal carbonization reactors, has not been properly addressed [23]. In respect of the actual mechanisms, Kruse et al. [24] presented a very thorough analysis, where dehydration, aromatization and decarboxylation are very analytically described. The authors highlight the research gap in the actual formation pathways of hydrochar. The polymerization of aromatic clusters into hydrochar has been stated, but modeling the formation of hydrochar has remained a challenge. Guo et al. [25] followed an extremely interesting approach by investigating the formation of hydrochar precursors from the decomposition of glucose. Although this is a very useful and thorough work, it faces the obstacle that waste streams are complex and include numerous individual molecules. Therefore, this approach may counter difficulties during the incorporation of all the included molecules in one model. On the other side of the spectrum, Sangare et al. [26] developed a CFD, i.e., Computational Fluid Dynamics, simulation by means of the software COMSOL and modeled the HTC of avocado stones. The authors highlight the ability of CFD models to predict qualitative data, and it is also the case that CFD modeling can be a very useful tool for modeling heat transfer. CFD modeling can be slightly inaccurate in the quantitative assessment, especially when the model includes complex feedstocks, such as waste.
This present study complements the promising applications of hydrothermal treatment for the valorization of sludge and aims to develop a hydrothermal carbonization model that can simultaneously describe and predict the outcomes of the process. In this framework, a novel advanced hydrothermal reactor (AHR) that has the ability to operate continuously is presented, analyzed and modeled. This hydrothermal reactor is part of an integrated system that is coupled with a gasifier and will be presented in the section of “Materials and Methods”. At the same time, the modeling limitations of hydrothermal processing are addressed by the introduction of a novel multi-stage thermodynamic model that may have a more generalized use and not be restricted for the case a single reactor. In addition, modeling the reactor in multiple stages aims to improve significantly the accuracy of single stage black-box models. This model is defined as the “3-step evolution model” since it models hydrothermal carbonization as a series of thermochemical reactions/steps, i.e., methanation, partial oxidation and char-gas equilibrium reactions. The “3-step evolution model” is presented in detail in the chapter of “Materials and Methods”. Overall, this study aims to present the first experimental results of the operation of the AHR and to present/apply the 3-step evolution model as a new modeling method for hydrothermal reactors.

2. Materials and Methods

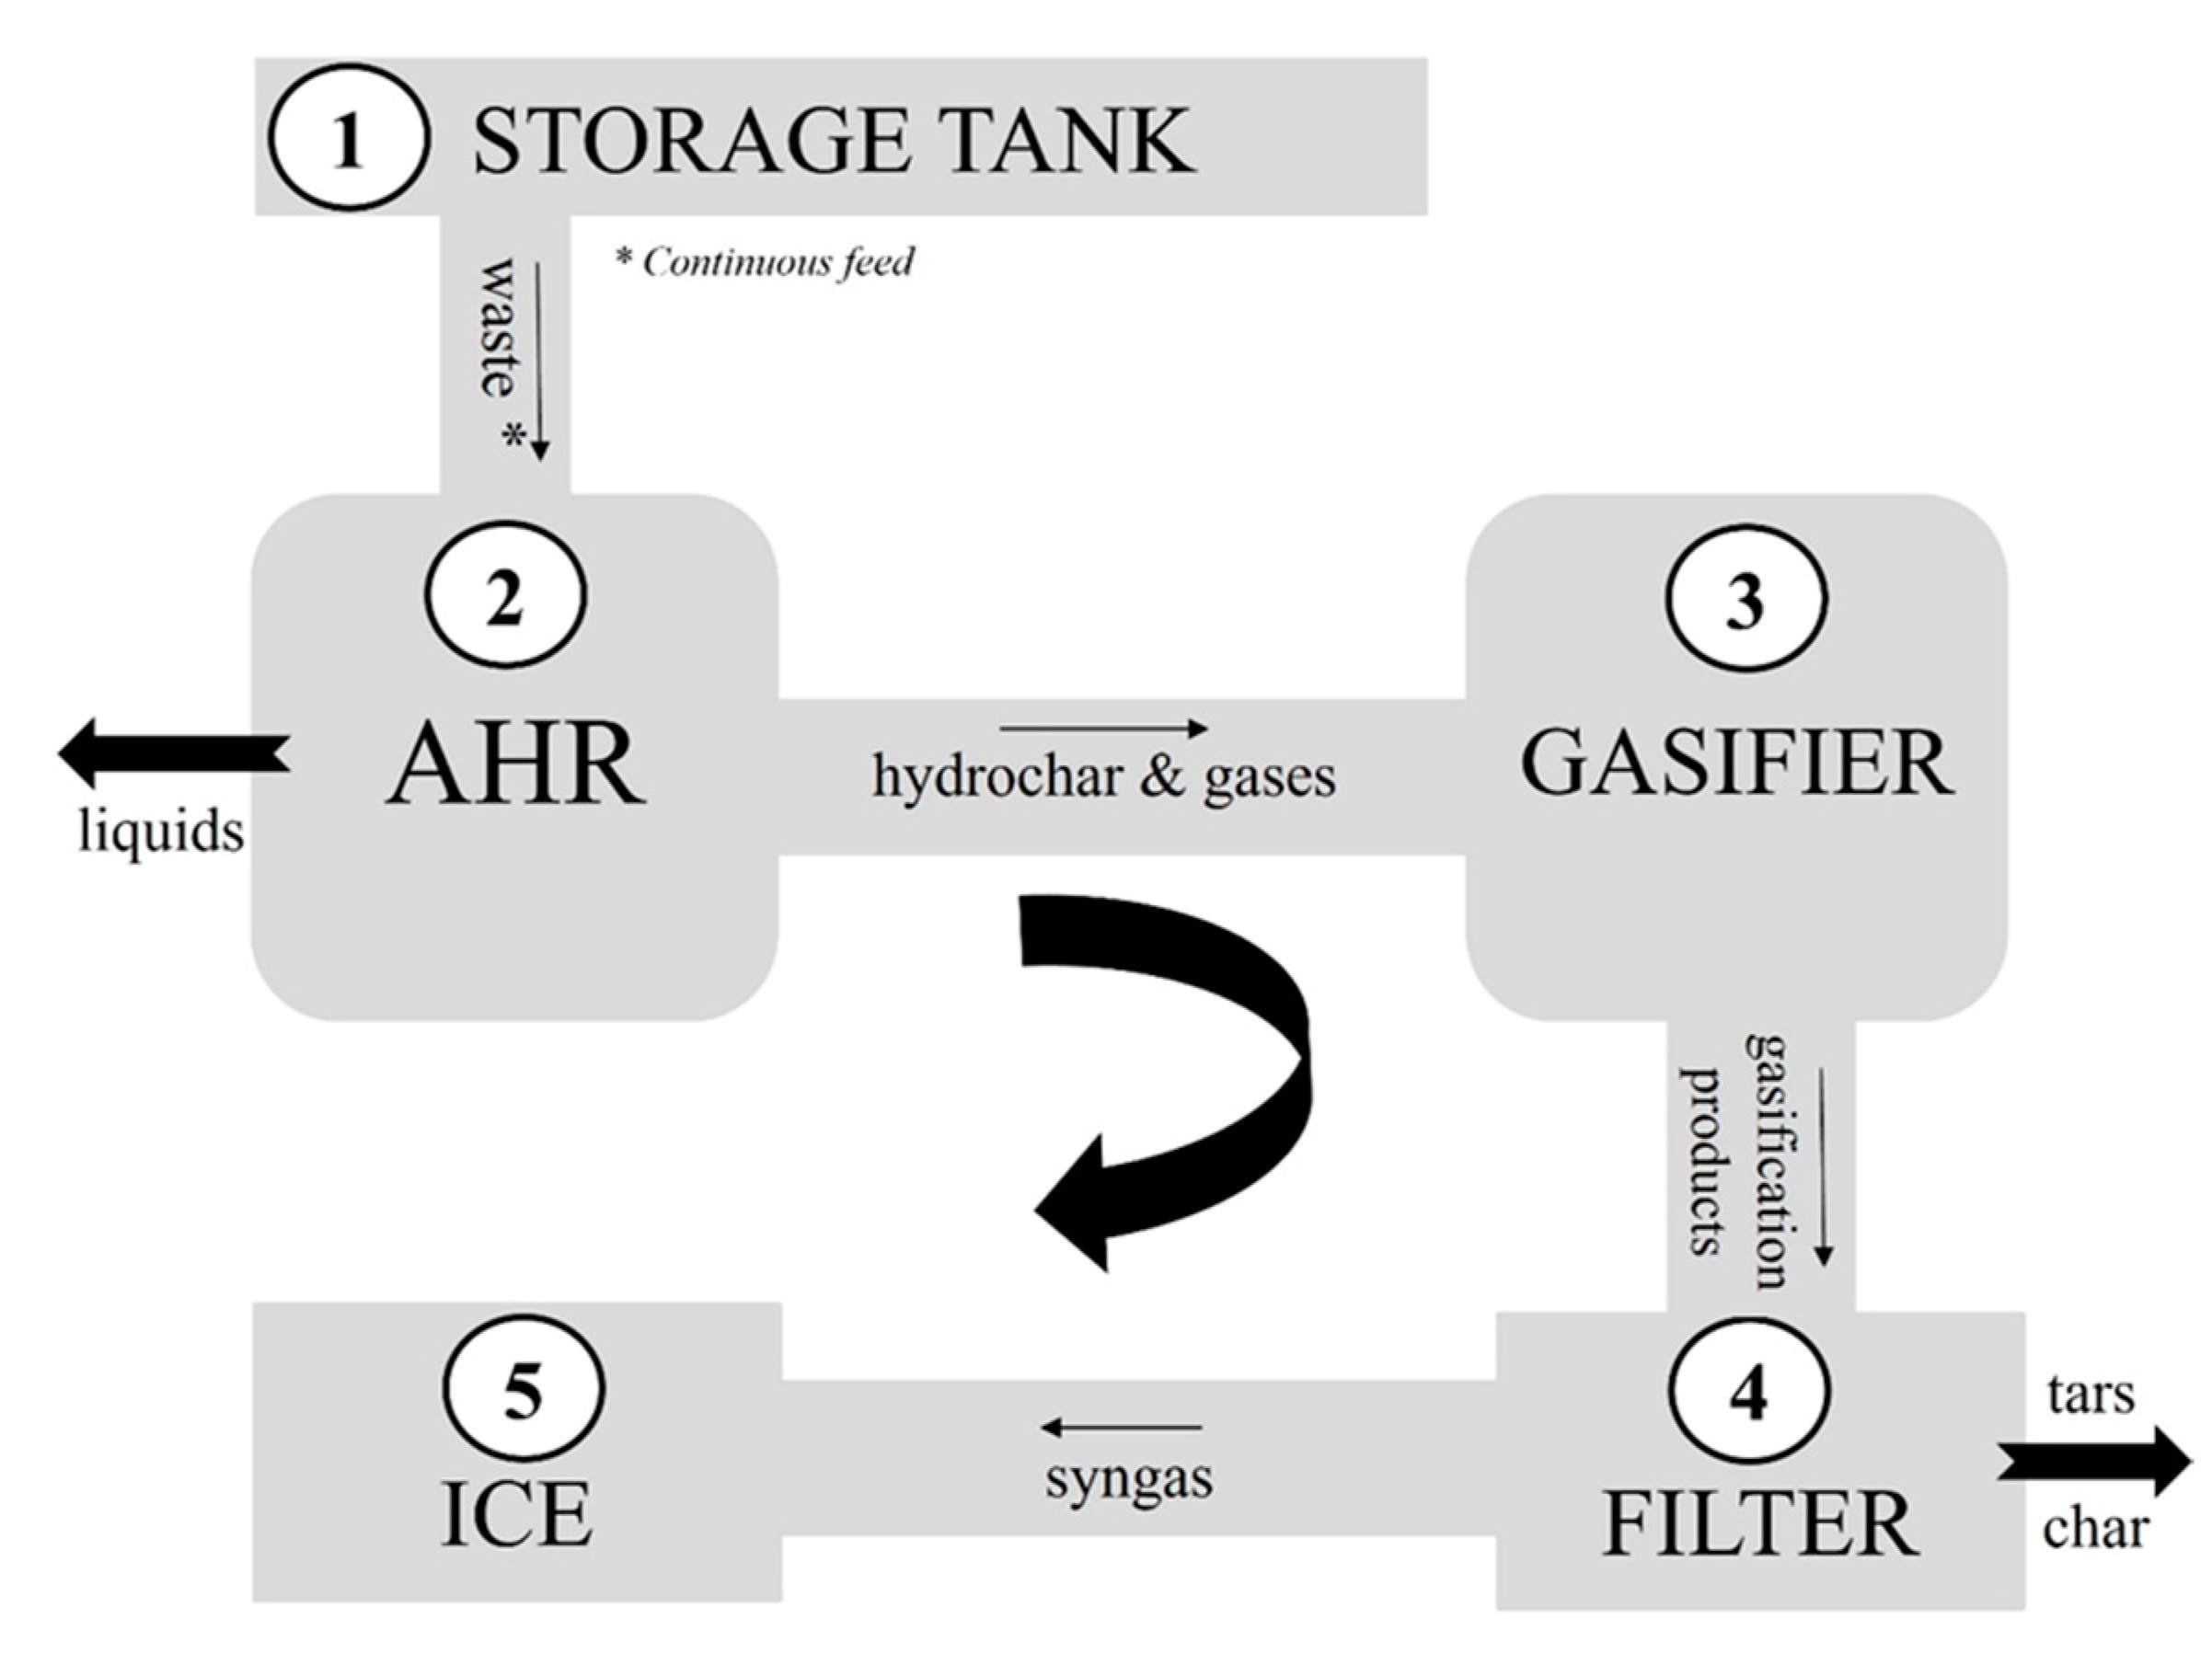
2.1. Operation and Technology Description

The technology used for this study is an integrated system that consists of a hydrothermal reactor that is coupled with a gasifier and has the advantage that it operates in a continuous mode. The main function is to valorize the biodegradable low-grade organic fraction and depending on the feedstock properties potentially covert the input into fuels and energy via advanced thermochemical reactions. It can be referred to as an ‘Advanced Hydrothermal Reactor’ or AHR. The system is a 3.000 dry kg per day unit that is used for screening different feedstock material and allowing rapid adjustments to determine a suitable operational envelope for a commercial scale system that would operate at a scale of 100,000–300,000 dry kg per day.
The Input stage of the system consists of a holding and homogenizing tank, where the organic wastes are contained for intermediate storage before the material undergoes hydrothermal treatment. The AHR operates with temperatures up to 590 K and pressures of up to 80 bar. The reactor produces primarily a solid carbon-rich product along with gases and liquids. The operating conditions maintain a saturated liquid, and the only required energy is thermal energy to heat the liquid, a percentage of which is recovered at the condenser. The operation of the AHR improves the characteristics of the solids for optimal gasification in the gasification reactor that is connected downstream of the AHR. The gasifier produces syngas that may have several applications, including use to power the system [27]. The scheme of the AHR system is presented in a generic way in Figure 1 since parts of the system have been patented and other parts are in the process of being patented. It should be noted that the liquids are separated as outputs of the AHR and are not directed to the gasifier. This is primarily implemented with the utilization of a pressurized separation column that is connected to the main rector, and it consists of scavenging valve for the outflow of the gaseous products under high pressures and continuous operation. Thus, the model focuses on the outputs from the AHR that are gasified downstream, i.e., the hydrochar and the gases and their respective hydrochar-to-gases ratios.
The focus of this study is the analysis and modeling of the AHR. This part is the most innovative process of the system, but at the same time it is the most challenging to model/ simulate because there are several reactions occurring simultaneously in all phases, and measurements cannot be taken that enable one to discriminate where the captured measurements originate. Experiments of the continuous operation of the system were performed in the Combustion and Catalysis Laboratory of the City College of New York (CCNY). The molar fraction of the produced gases was measured every 4 min by means of an Inficon Micro GC (Model 3000) which was connected to the exit line of the separation stage of the gaseous products. The solid and liquid streams, i.e., the hydrochar and the slurry, were collected and measured in a drum at the output line before entering the gasifier. The mass flows were measured during steady-state operation. The tests were performed at various temperatures ranging from 530 K to 600 K and residence times from 10 to 30 min. The utilized feedstock was chicken manure with 25% of total solids. Carbon dioxide was measured to be the dominant gas produced (90–95%) followed by carbon monoxide (5–10%) and trace amounts of methane and hydrogen [27].

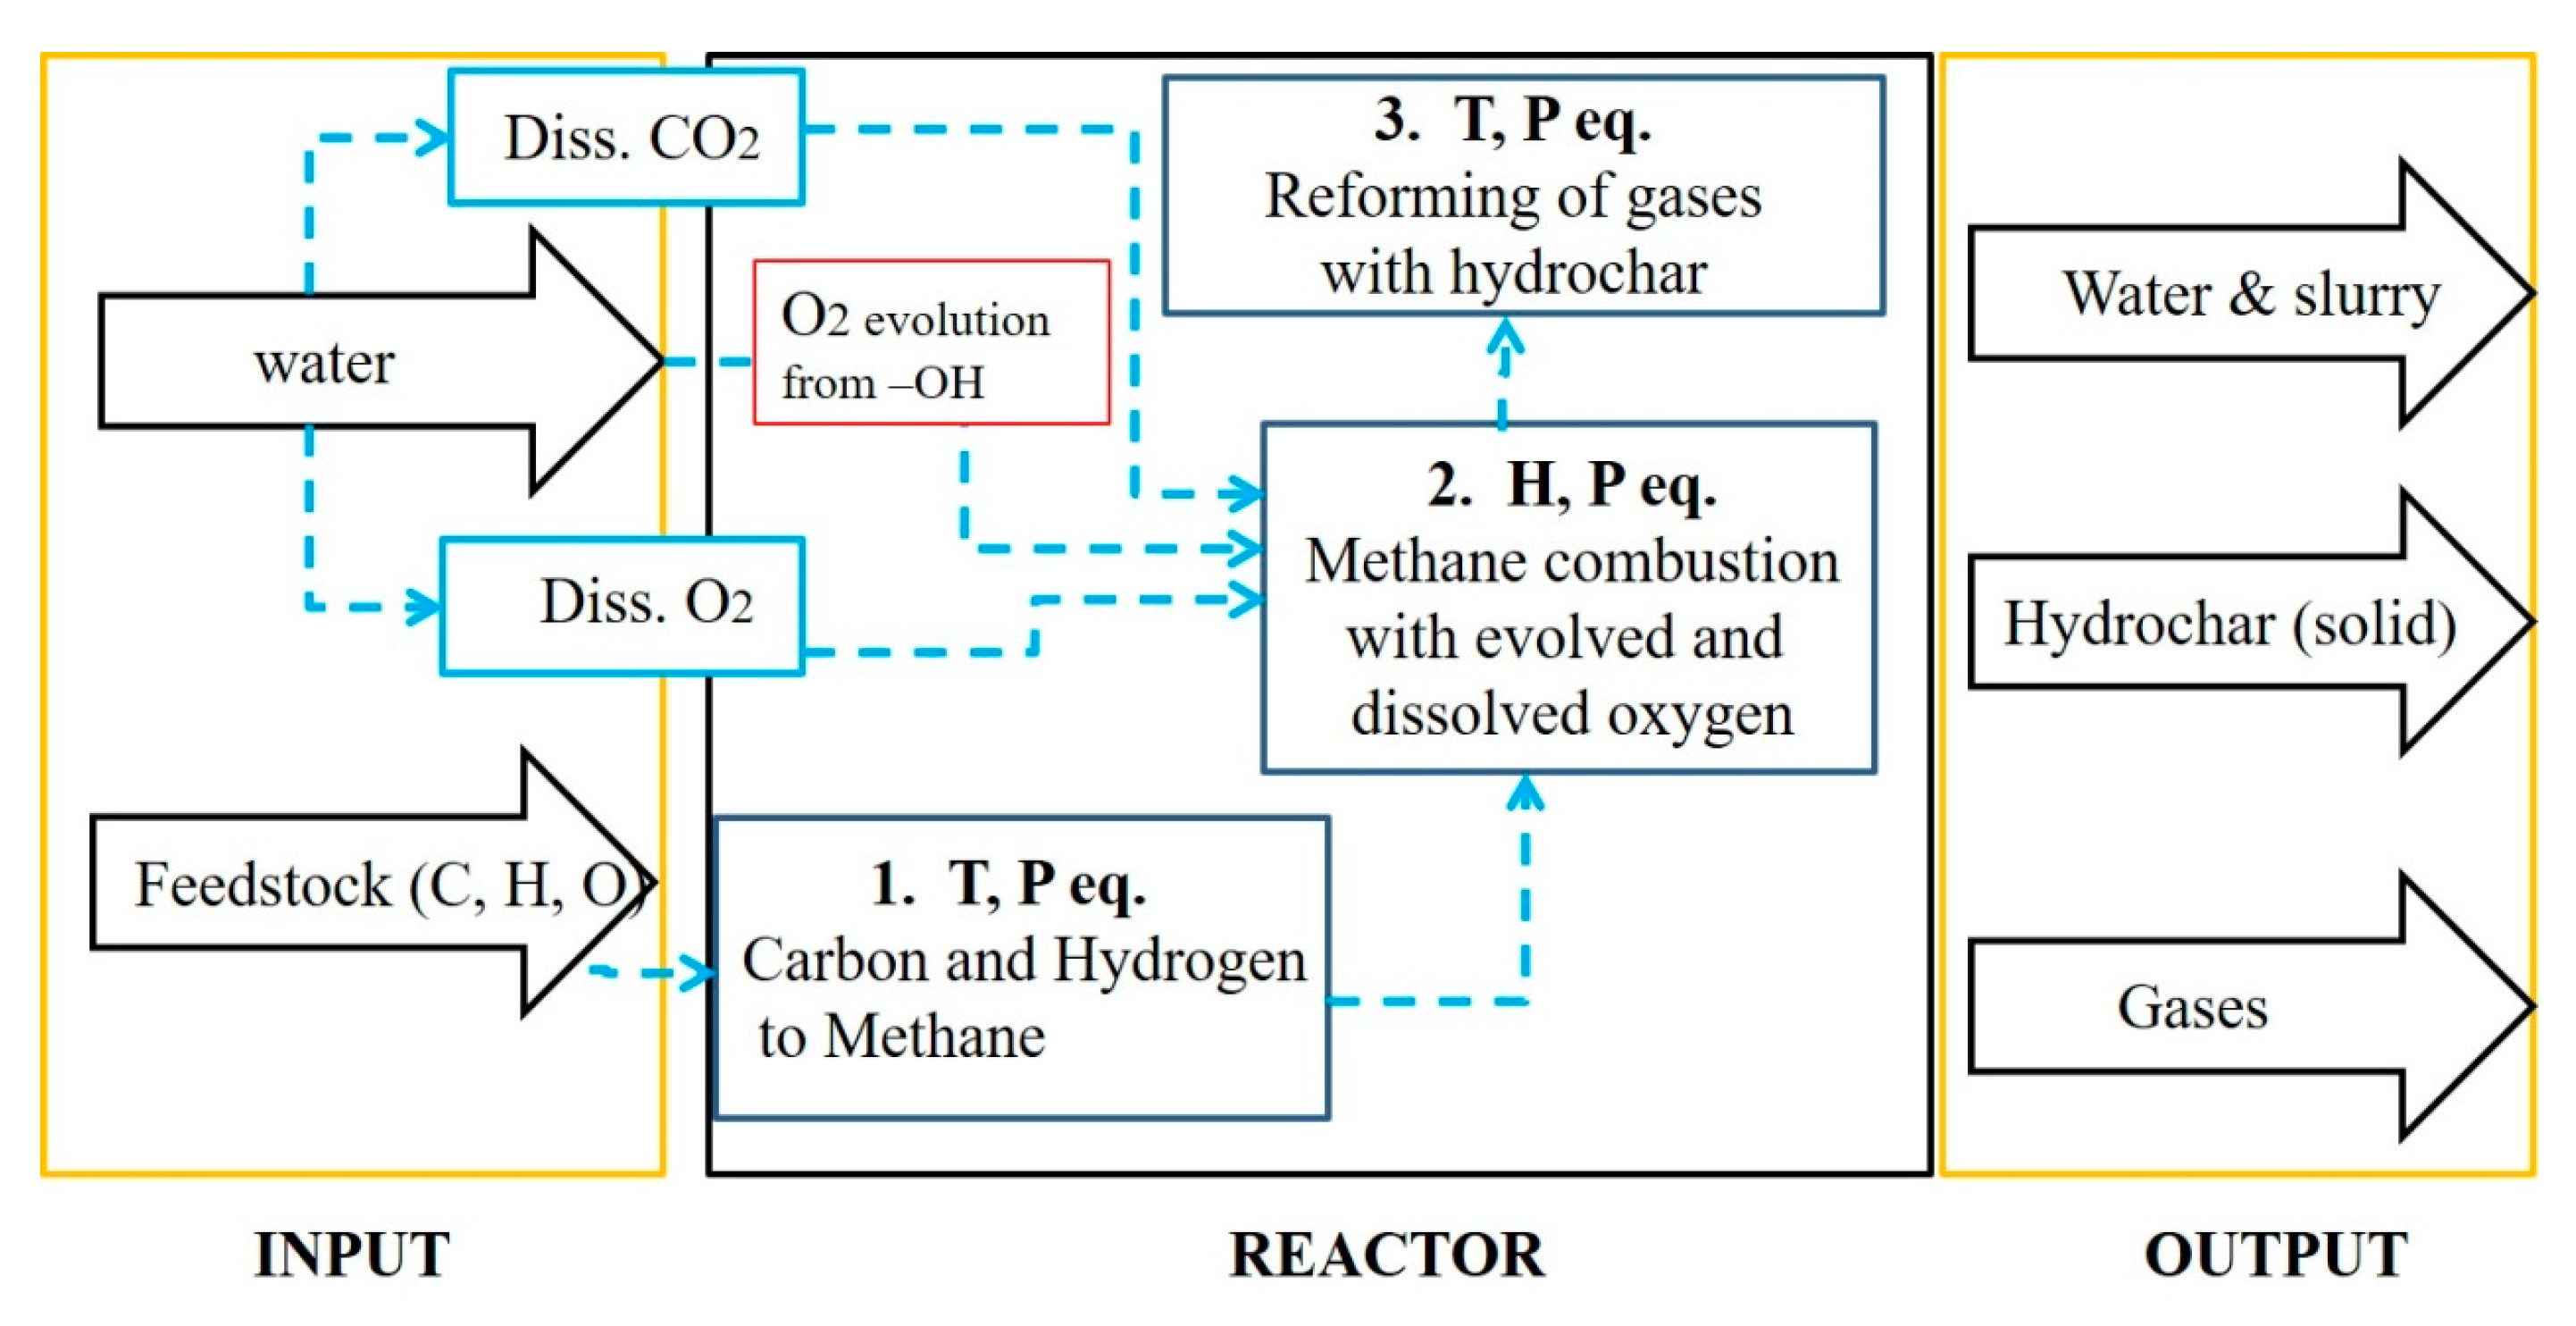
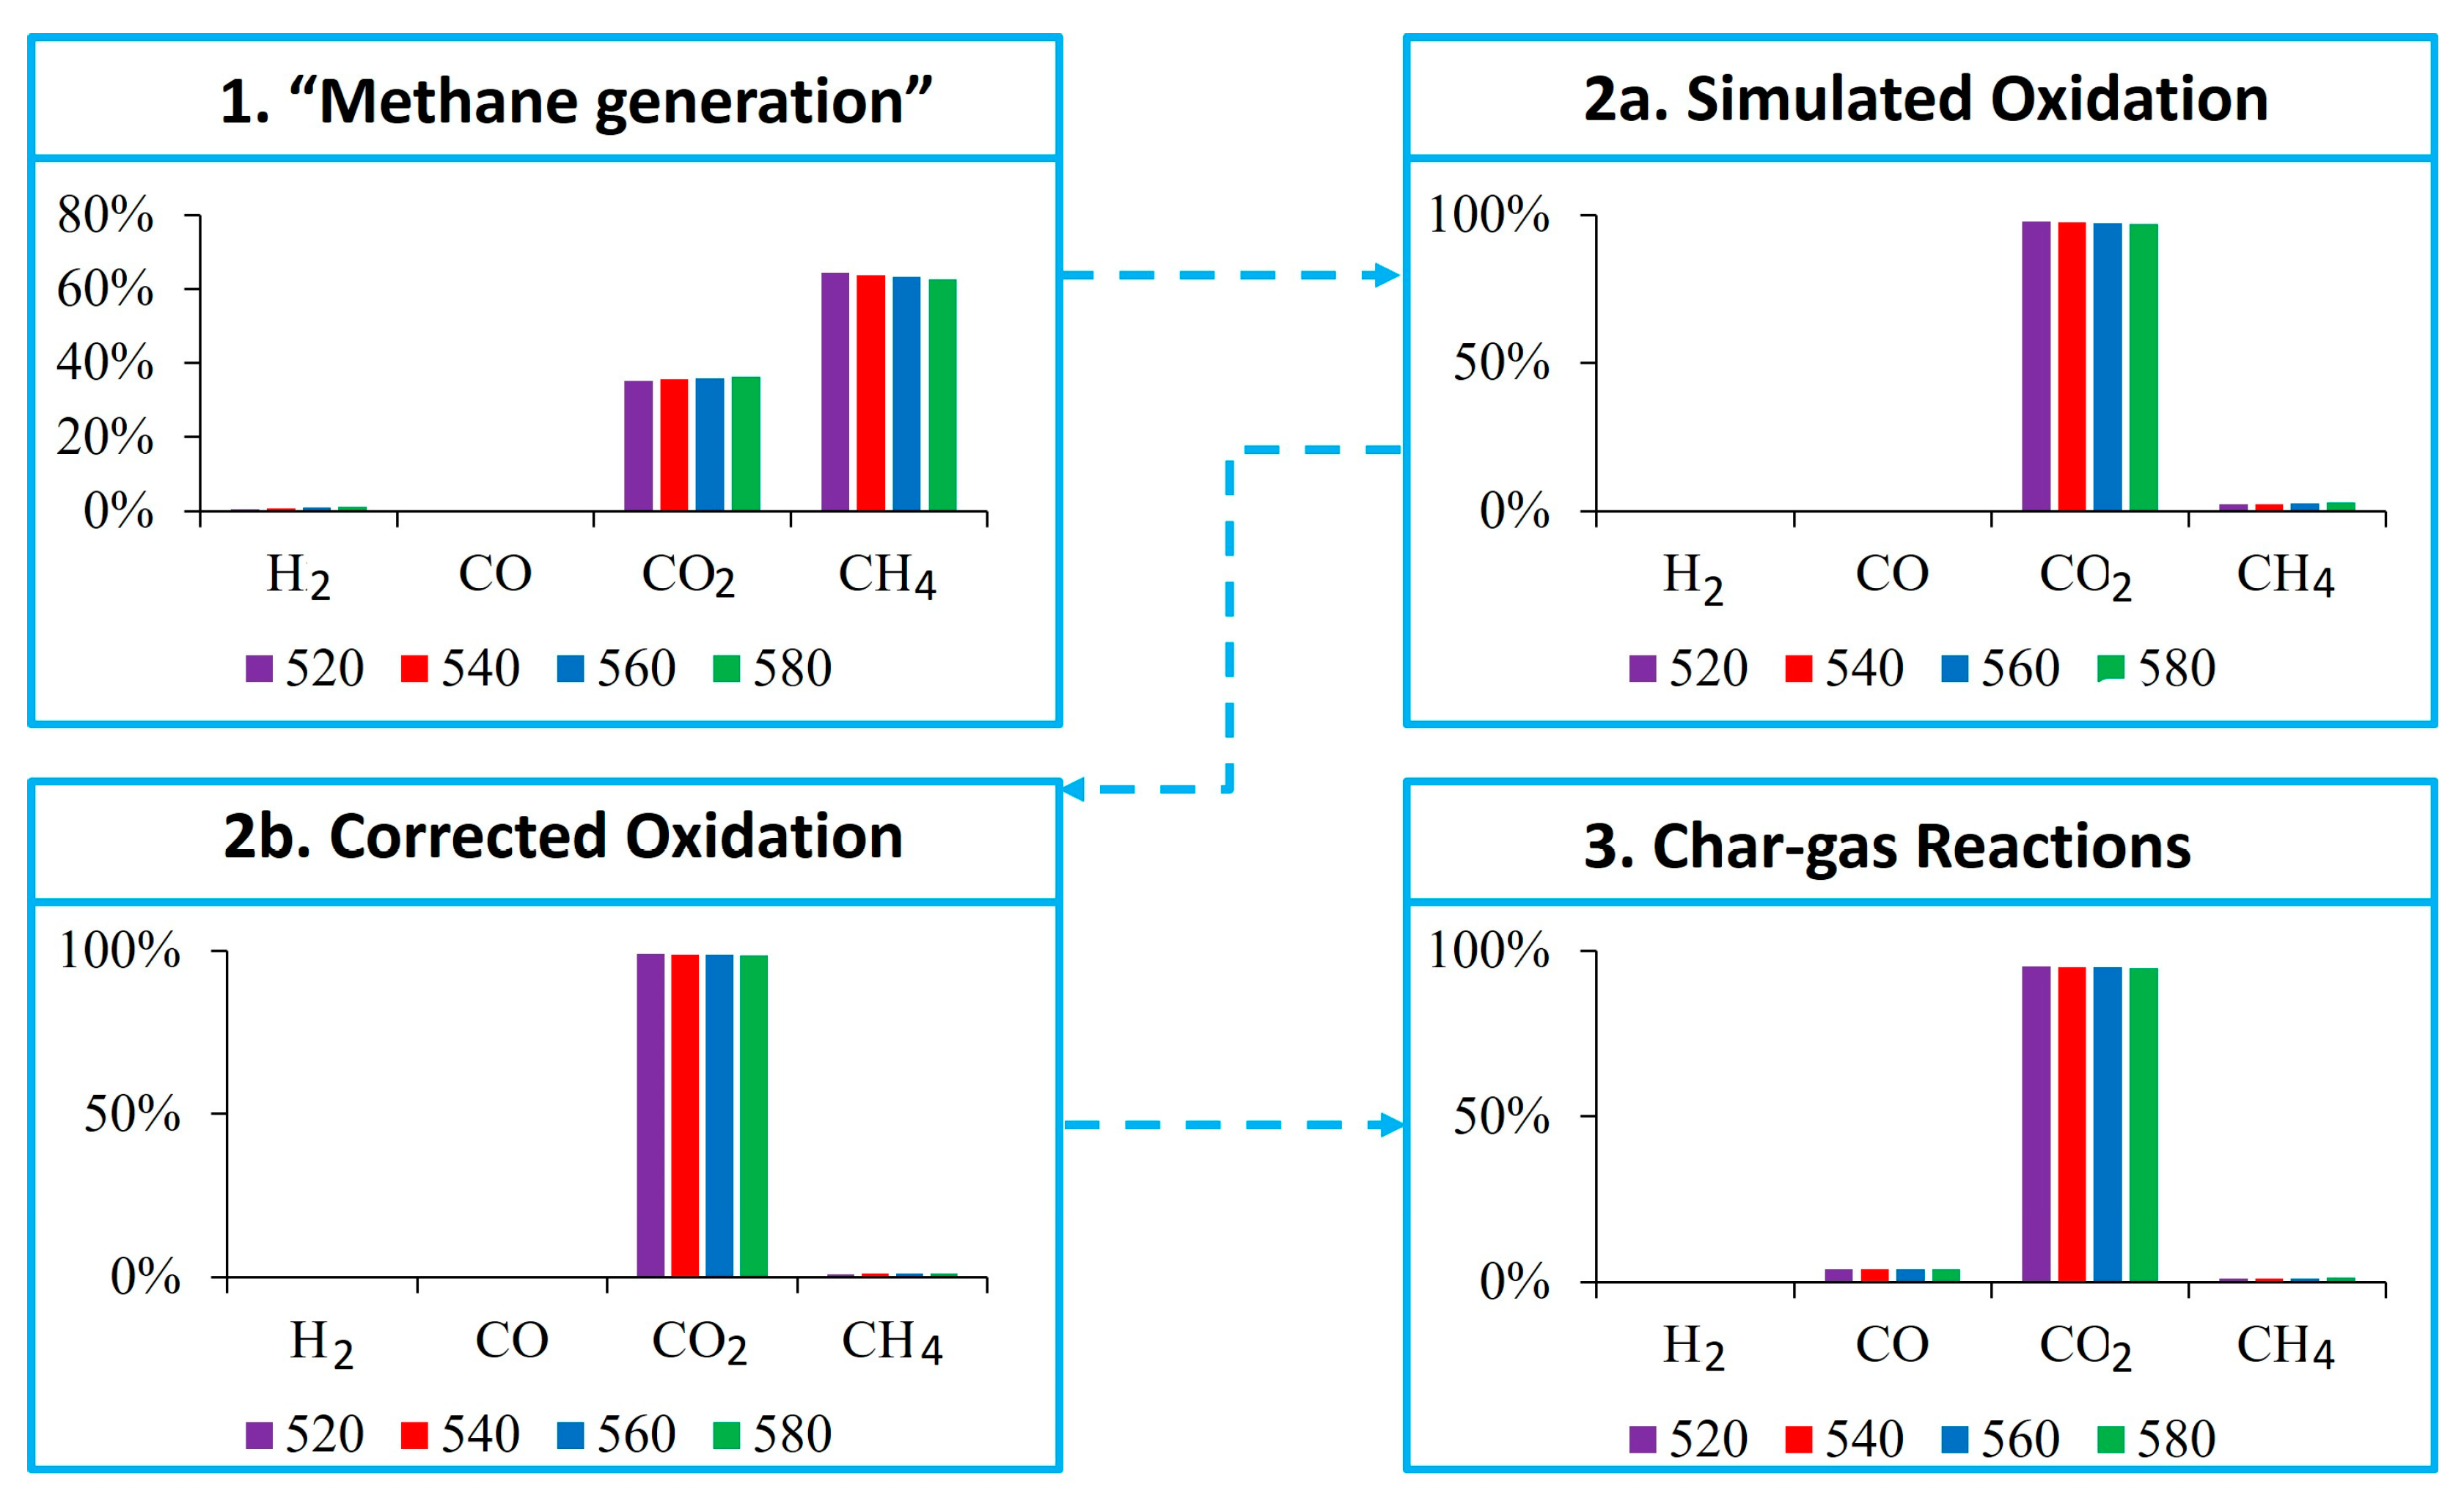
2.2. Previous Models and the Introduction of the 3-Step Evolution Model

A previous study [28] showed that the single-stage modeling of the AHR with thermodynamic equilibrium calculations or Aspen Plus simulations return similar results for the gaseous phase, and, in both methods, hydrogen and methane are always dominant over carbon oxides. The results of the single-stage modeling are shown in Figure 2, and an outcome of the presented data is that single-stage thermodynamic models have the drawback that they cannot account for the elevated pressures. This study recognizes the merit of the previously mentioned models and their usability for non-pressurized reactors but aims to focus on addressing specifically the application on high-pressure reactors.
The measured primary gas that is produced from the operation of the AHR is carbon dioxide as shown in Table 1 and is in good agreement with other similar studies of hydrothermal reactors. Gases can be measured directly, and the measured CO2 molar fraction from the experiments is used as an indicator for assessing the operation of the process from the thermodynamic equilibrium. Thus, several equilibrations are tried at elevated temperatures to match the yield of CO2 and correlate it with the production of hydrochar. That result is not predicted when using Aspen Plus modeling and single stage equilibrium thermodynamic parameters. Thus, the development of a more specific and multi-stage model is necessary to account for the thermochemical pathways that are favored in higher pressures but cannot be depicted with the single stage approach.
The current model is developed in MATLAB/ Cantera to simulate all three phases by integrating the corresponding mechanisms, i.e., GRI30 (gas phase) [29], liquid-vapor and Curran (water and liquid phase) [30] and graphite (solid phase) [31]. The analytical scheme of the 3-step evolution model is shown in Figure 3.
Through minimizing the chemical potential, the model executes a multi-stage calculation solution for integrating the secondary reactions between the produced gases, the evolved oxygen and the hydrochar, i.e., the 3-step evolution approach that limits the approach to equilibrium at each step. The main idea behind the 3-step evolution model is that the generation of hydrochar in the AHR is modeled as a series of “char-gas” 2-phase thermochemical sub stoichiometric reactions based on the hypothesis that the production of hydrochar can be described with these reactions which are being primarily used for the modeling of gasification systems. The major char-gas reactions that are considered in the framework of this model are the Boudouard reaction, the Water–Gas reaction and the (Hydro)Methanation reaction as shown in Equations (1)–(3).
C + CO2 ↔ 2CO, ΔH = +172 kJ/mol
C + H2O ↔ CO + H2, ΔH = +131 kJ/mol
C + 2H2 ↔ CH4, ΔH = −74.8 kJ/mol
An additional key parameter is the presence of available oxygen in the AHR based on the assumption that the oxygen becomes available, i.e., “evolves” from other molecules. As an example, there are several mechanisms that predict the evolution of oxygen from hydroxide ions due to the appropriate system parameters as mentioned in the study by Jaworski et al. [32] for the case of lower pH levels (below 7) and the production of ions. This is an interesting observation since hydrothermal treatment reduces the pH of the feedstock. In the framework of this model, it is assumed that the reactive oxygen equals the available oxygen of the input. As available oxygen, it is considered the sum of the elemental oxygen in the feedstock plus the dissolved oxygen in the input water which can be calculated according to the correlation based on the Henry’s Constant for dissolved oxygen as seen in Equation (4). Similarly, Henry’s equation as shown in Equation (5), and the corresponding Henry constant, i.e., KH equal to 29.41, is being used for assessing the dissolved carbon dioxide in the water.
H(T) = 761.1 − 108.9 ln(T) − 40785.5/T
pCO2 = K H × xCO2
Initially the dissolved oxygen and the dissolved carbon dioxide in the input water are calculated for the input temperature, and then the difference in dissolved concentrations is calculated between the initial environmental conditions and the operating AHR conditions. The available oxygen and carbon dioxide are considered in the second stage of the equilibrium calculations. The first equilibrium calculation is emulating the hydro-methanation char-gas reaction for the conversion of carbon and hydrogen into methane (as shown in Equation (3)). The produced methane in the second equilibration is subsequently oxidized by reacting with the available oxygen that is (as mentioned before) the sum of the elemental oxygen in the feedstock plus the dissolved oxygen in the input water, along with the available carbon dioxide from the input water. The third and final equilibration is mainly driven by the Boudouard reaction where the gases are reformed primarily due to the interaction with the hydrochar. The AHR is connected airtightly with the gasifier downstream, and no direct measurements of the hydrochar production are possible.
The model calculates each complex equilibrium by running the Villars–Cruise–Smith (VCS) algorithm which diagonalizes the Hessian matrix rapidly in a very similar way the RAND algorithm operates. The VCS algorithm avoids several intermediate steps by assuming that the Hessian matrix is invertible. The 3-step evolution model aims to simulate the experiments made at the Combustion and Catalysis Laboratory of the City College of New York but also tries to predict the behavior of the AHR for different input feedstock. The experiments were performed with chicken manure (CM), but for modeling purposes, additional feedstocks were considered, which in this case are wine brewery sludge (WBS) and olive mill wastewater (OMWW). The elemental analysis of these feedstock is shown in Table 2.

2.3. Limitations of the Proposed Modeling Approach
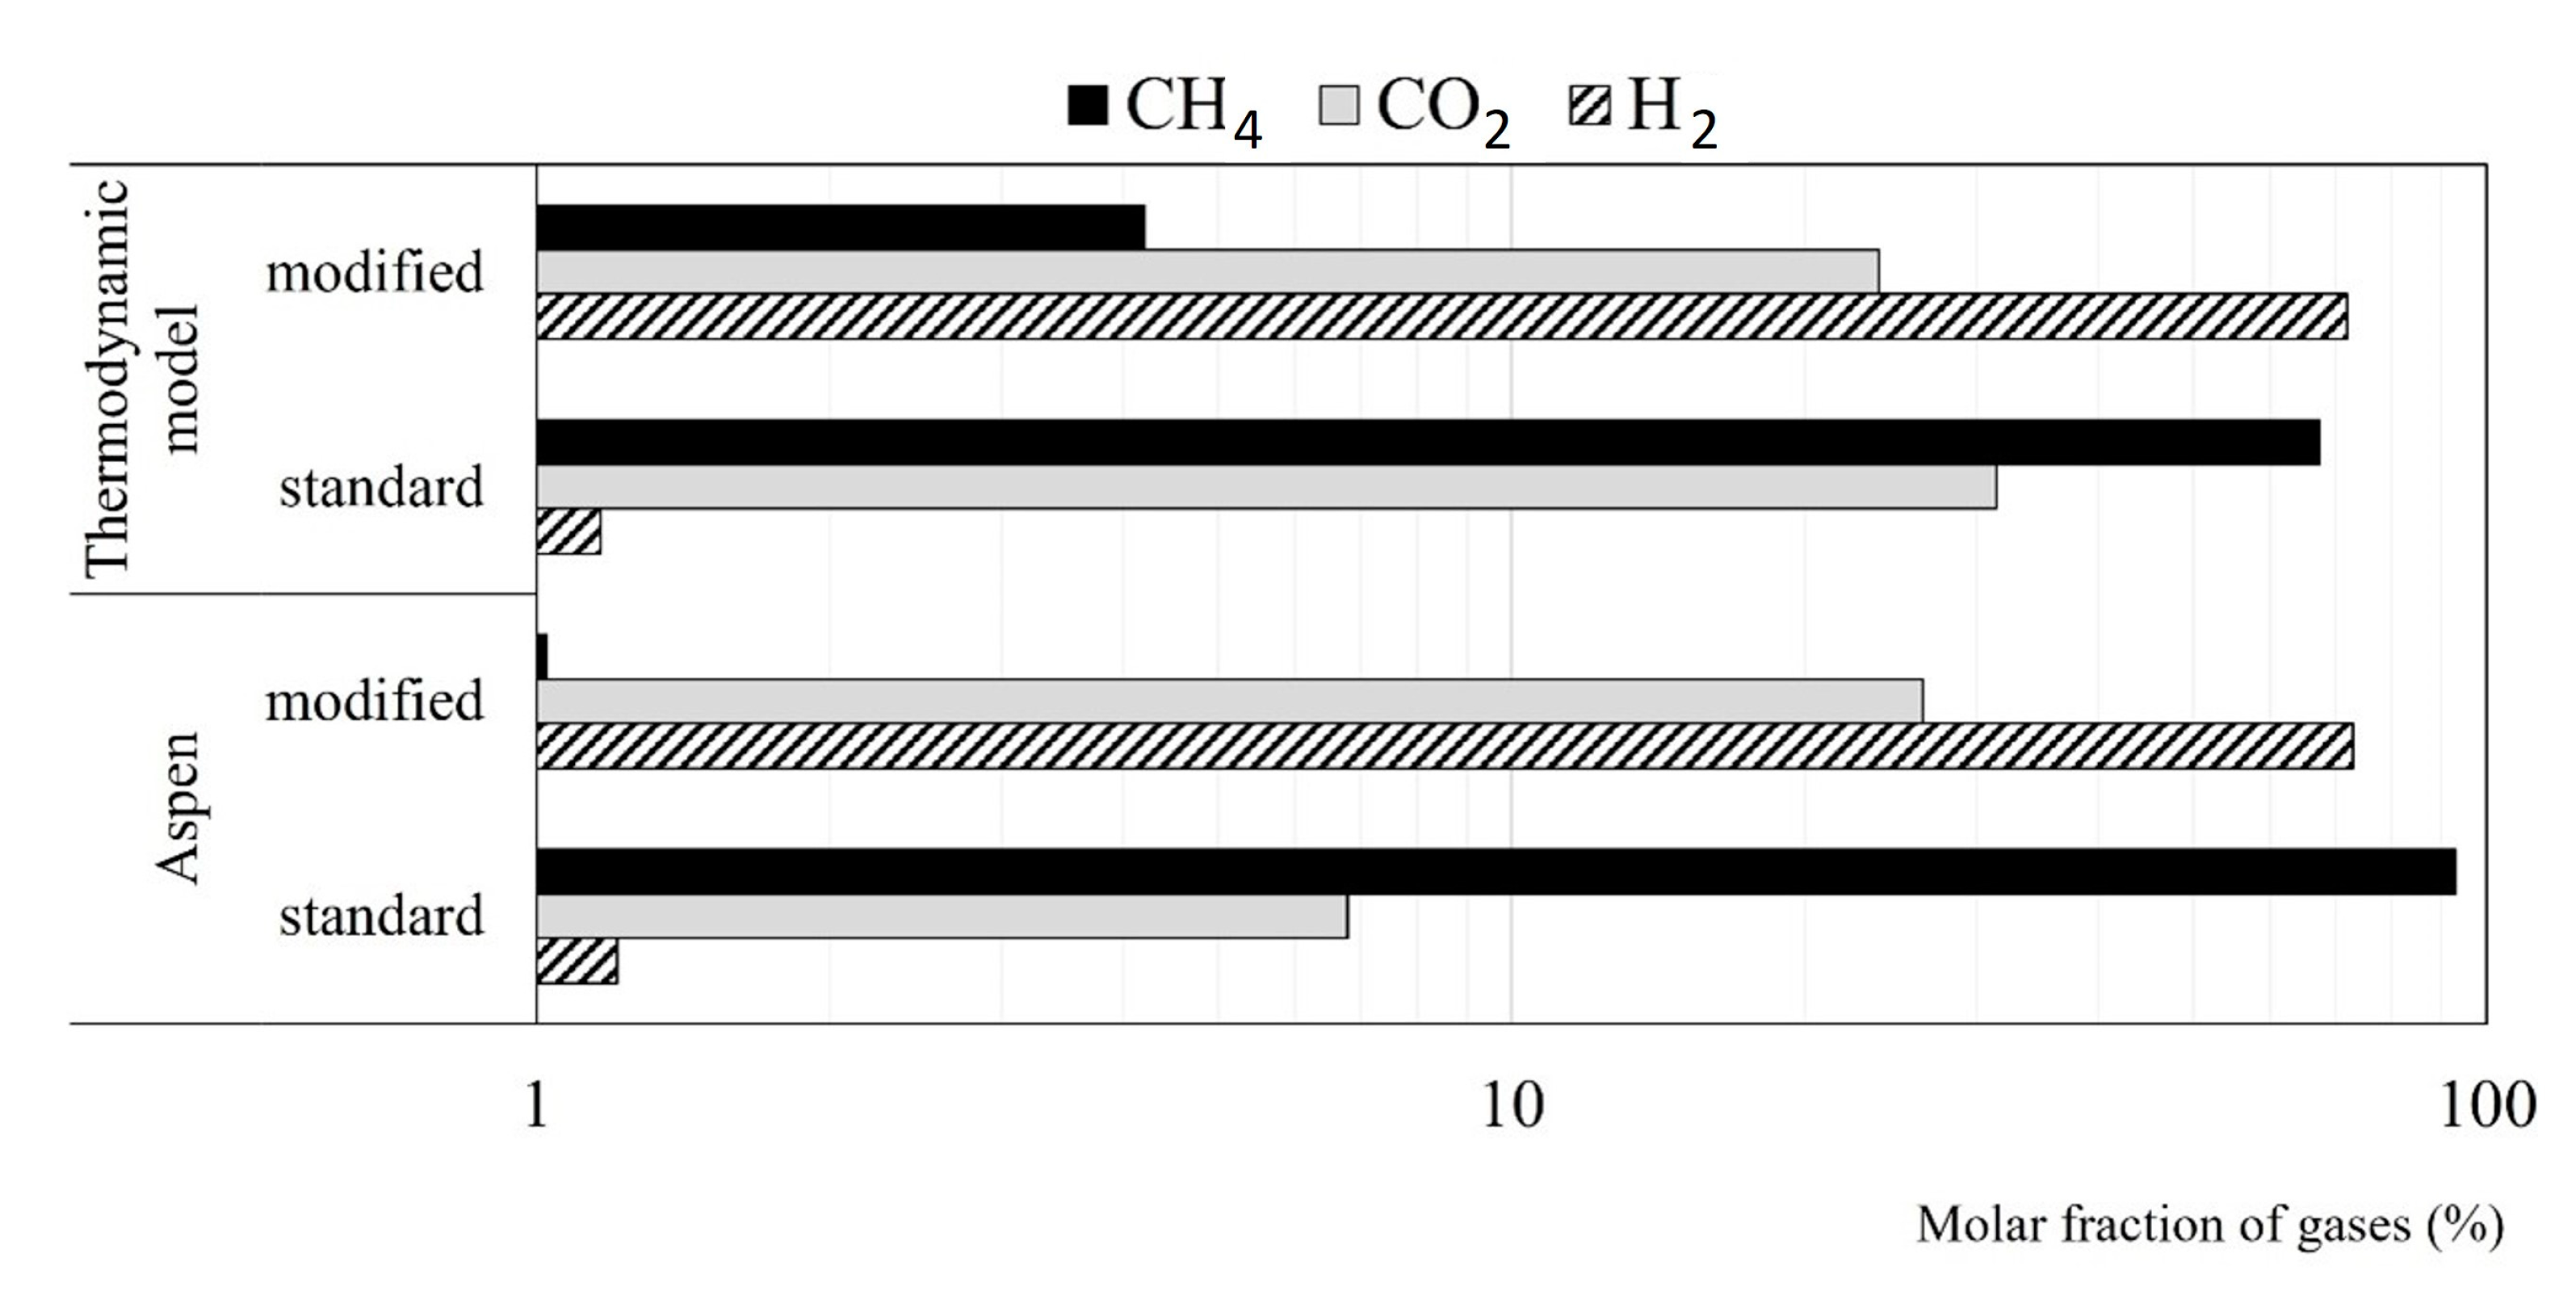
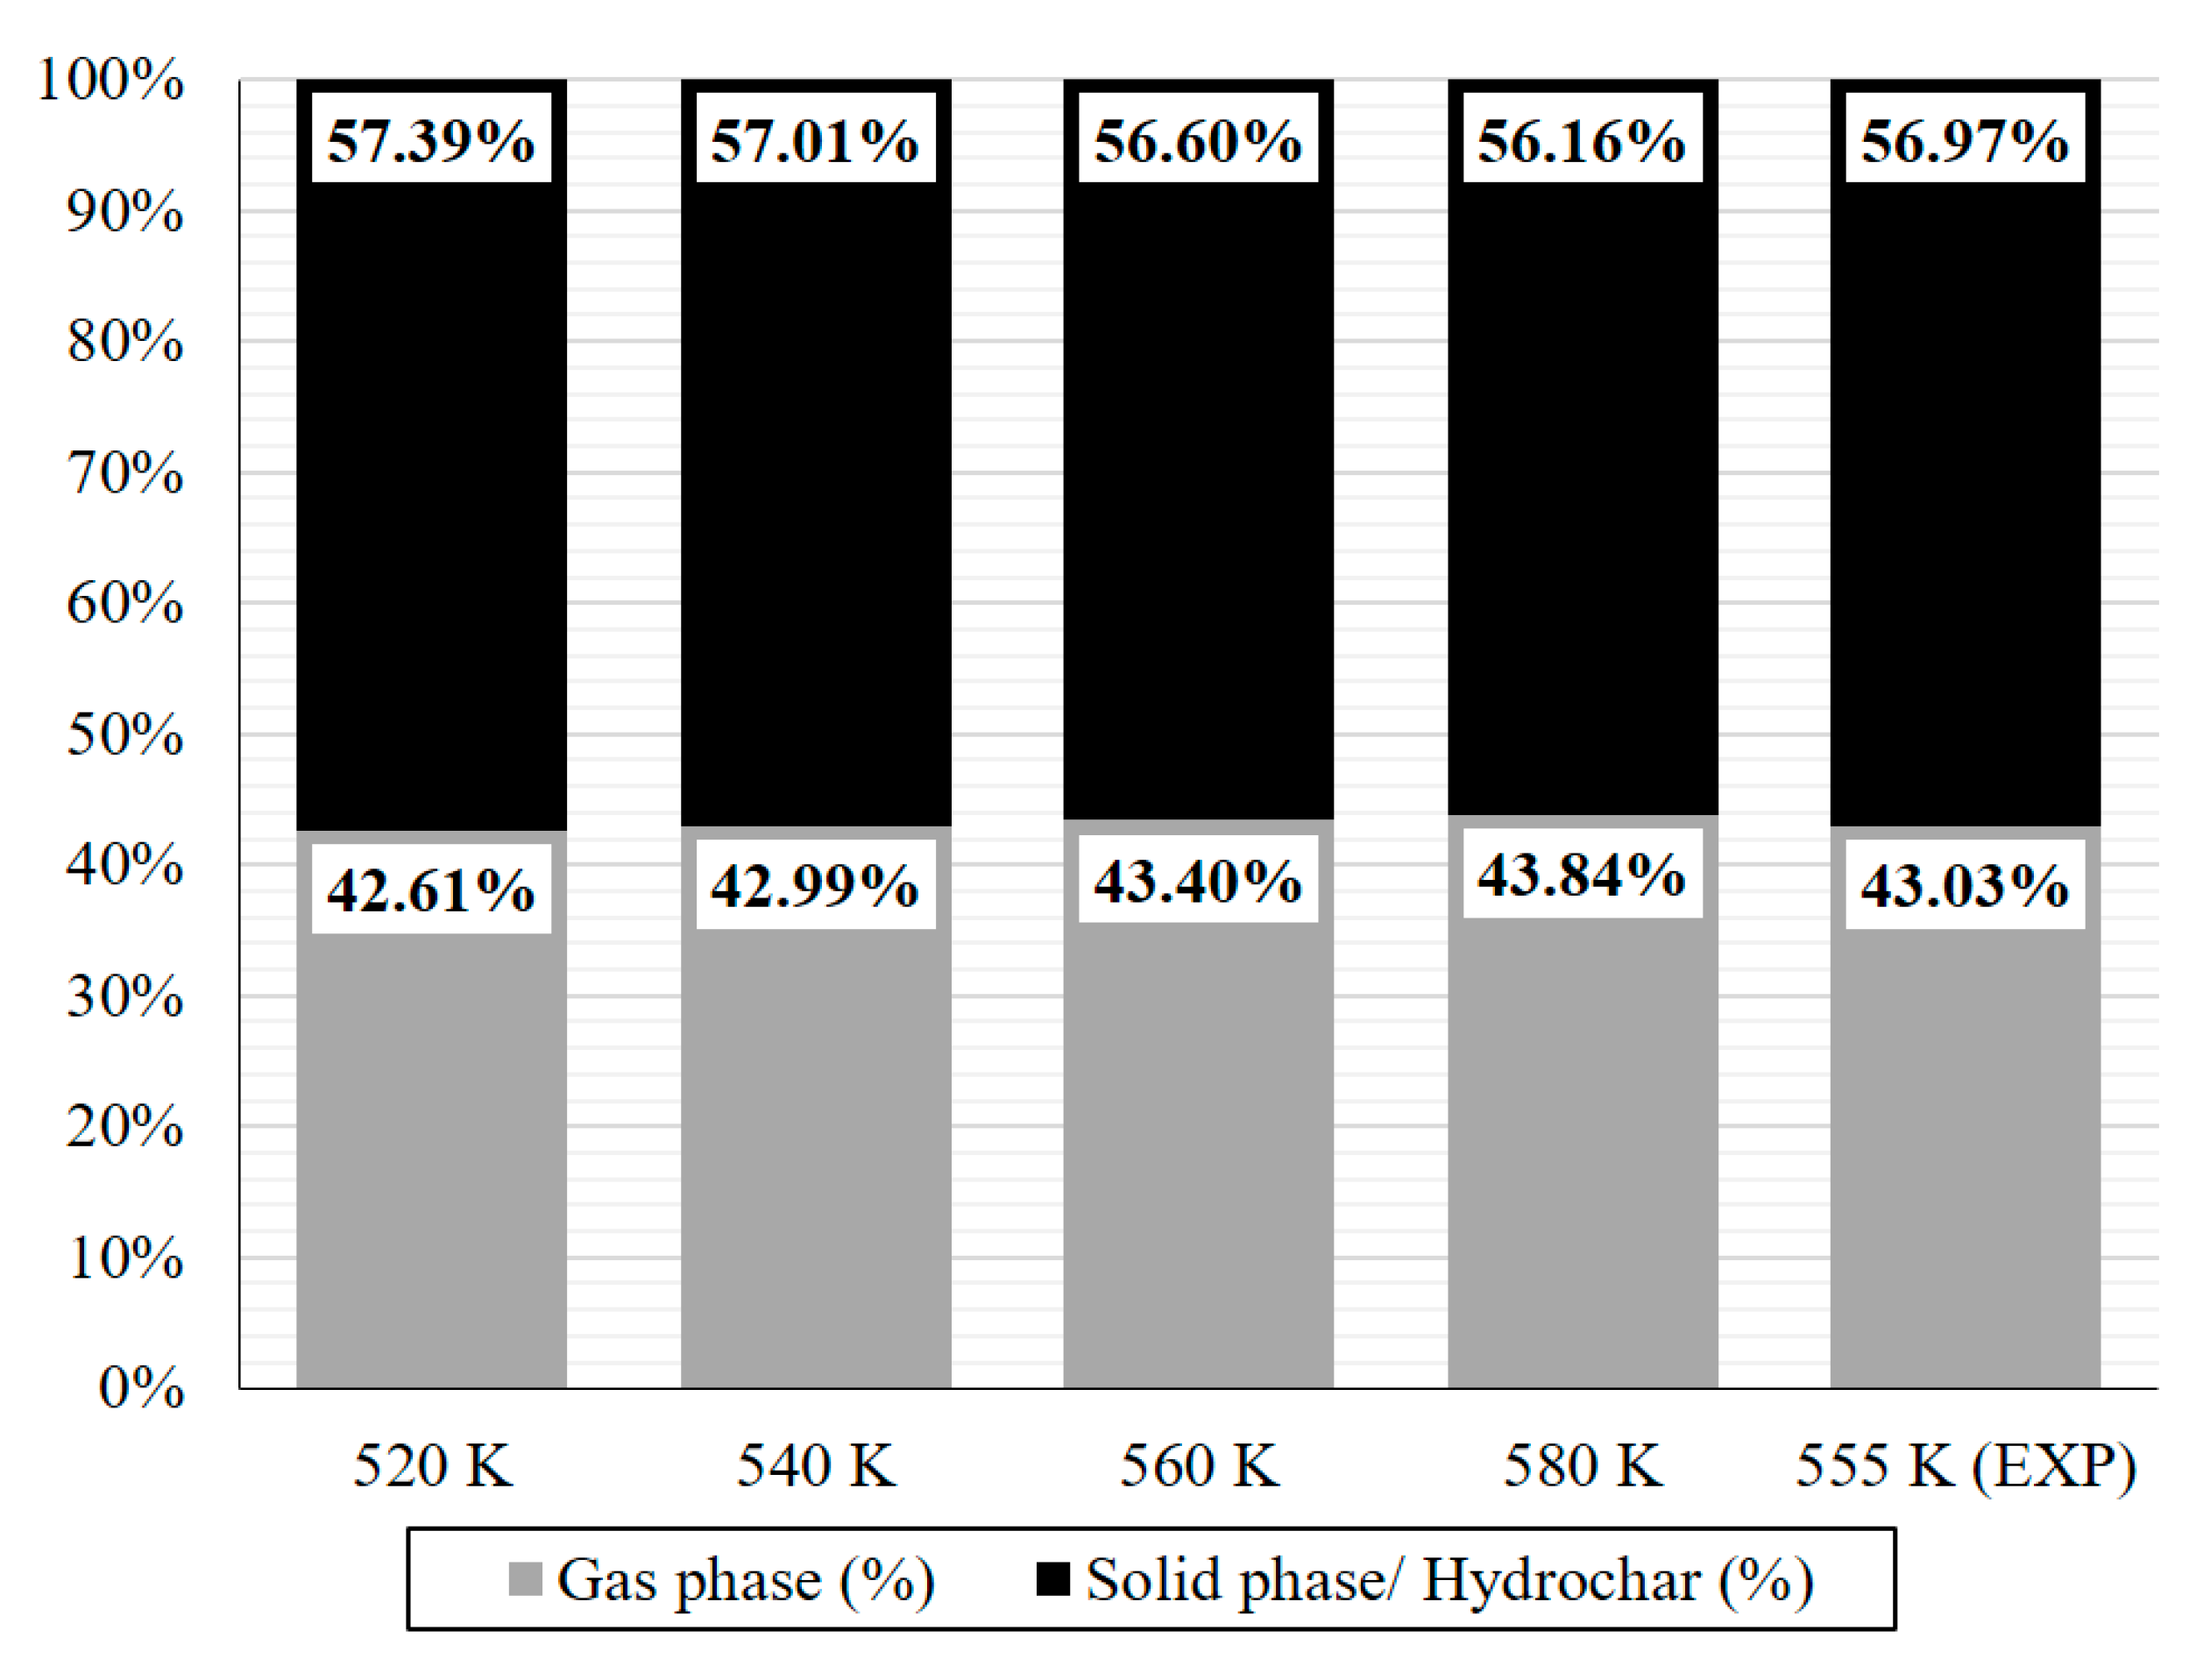
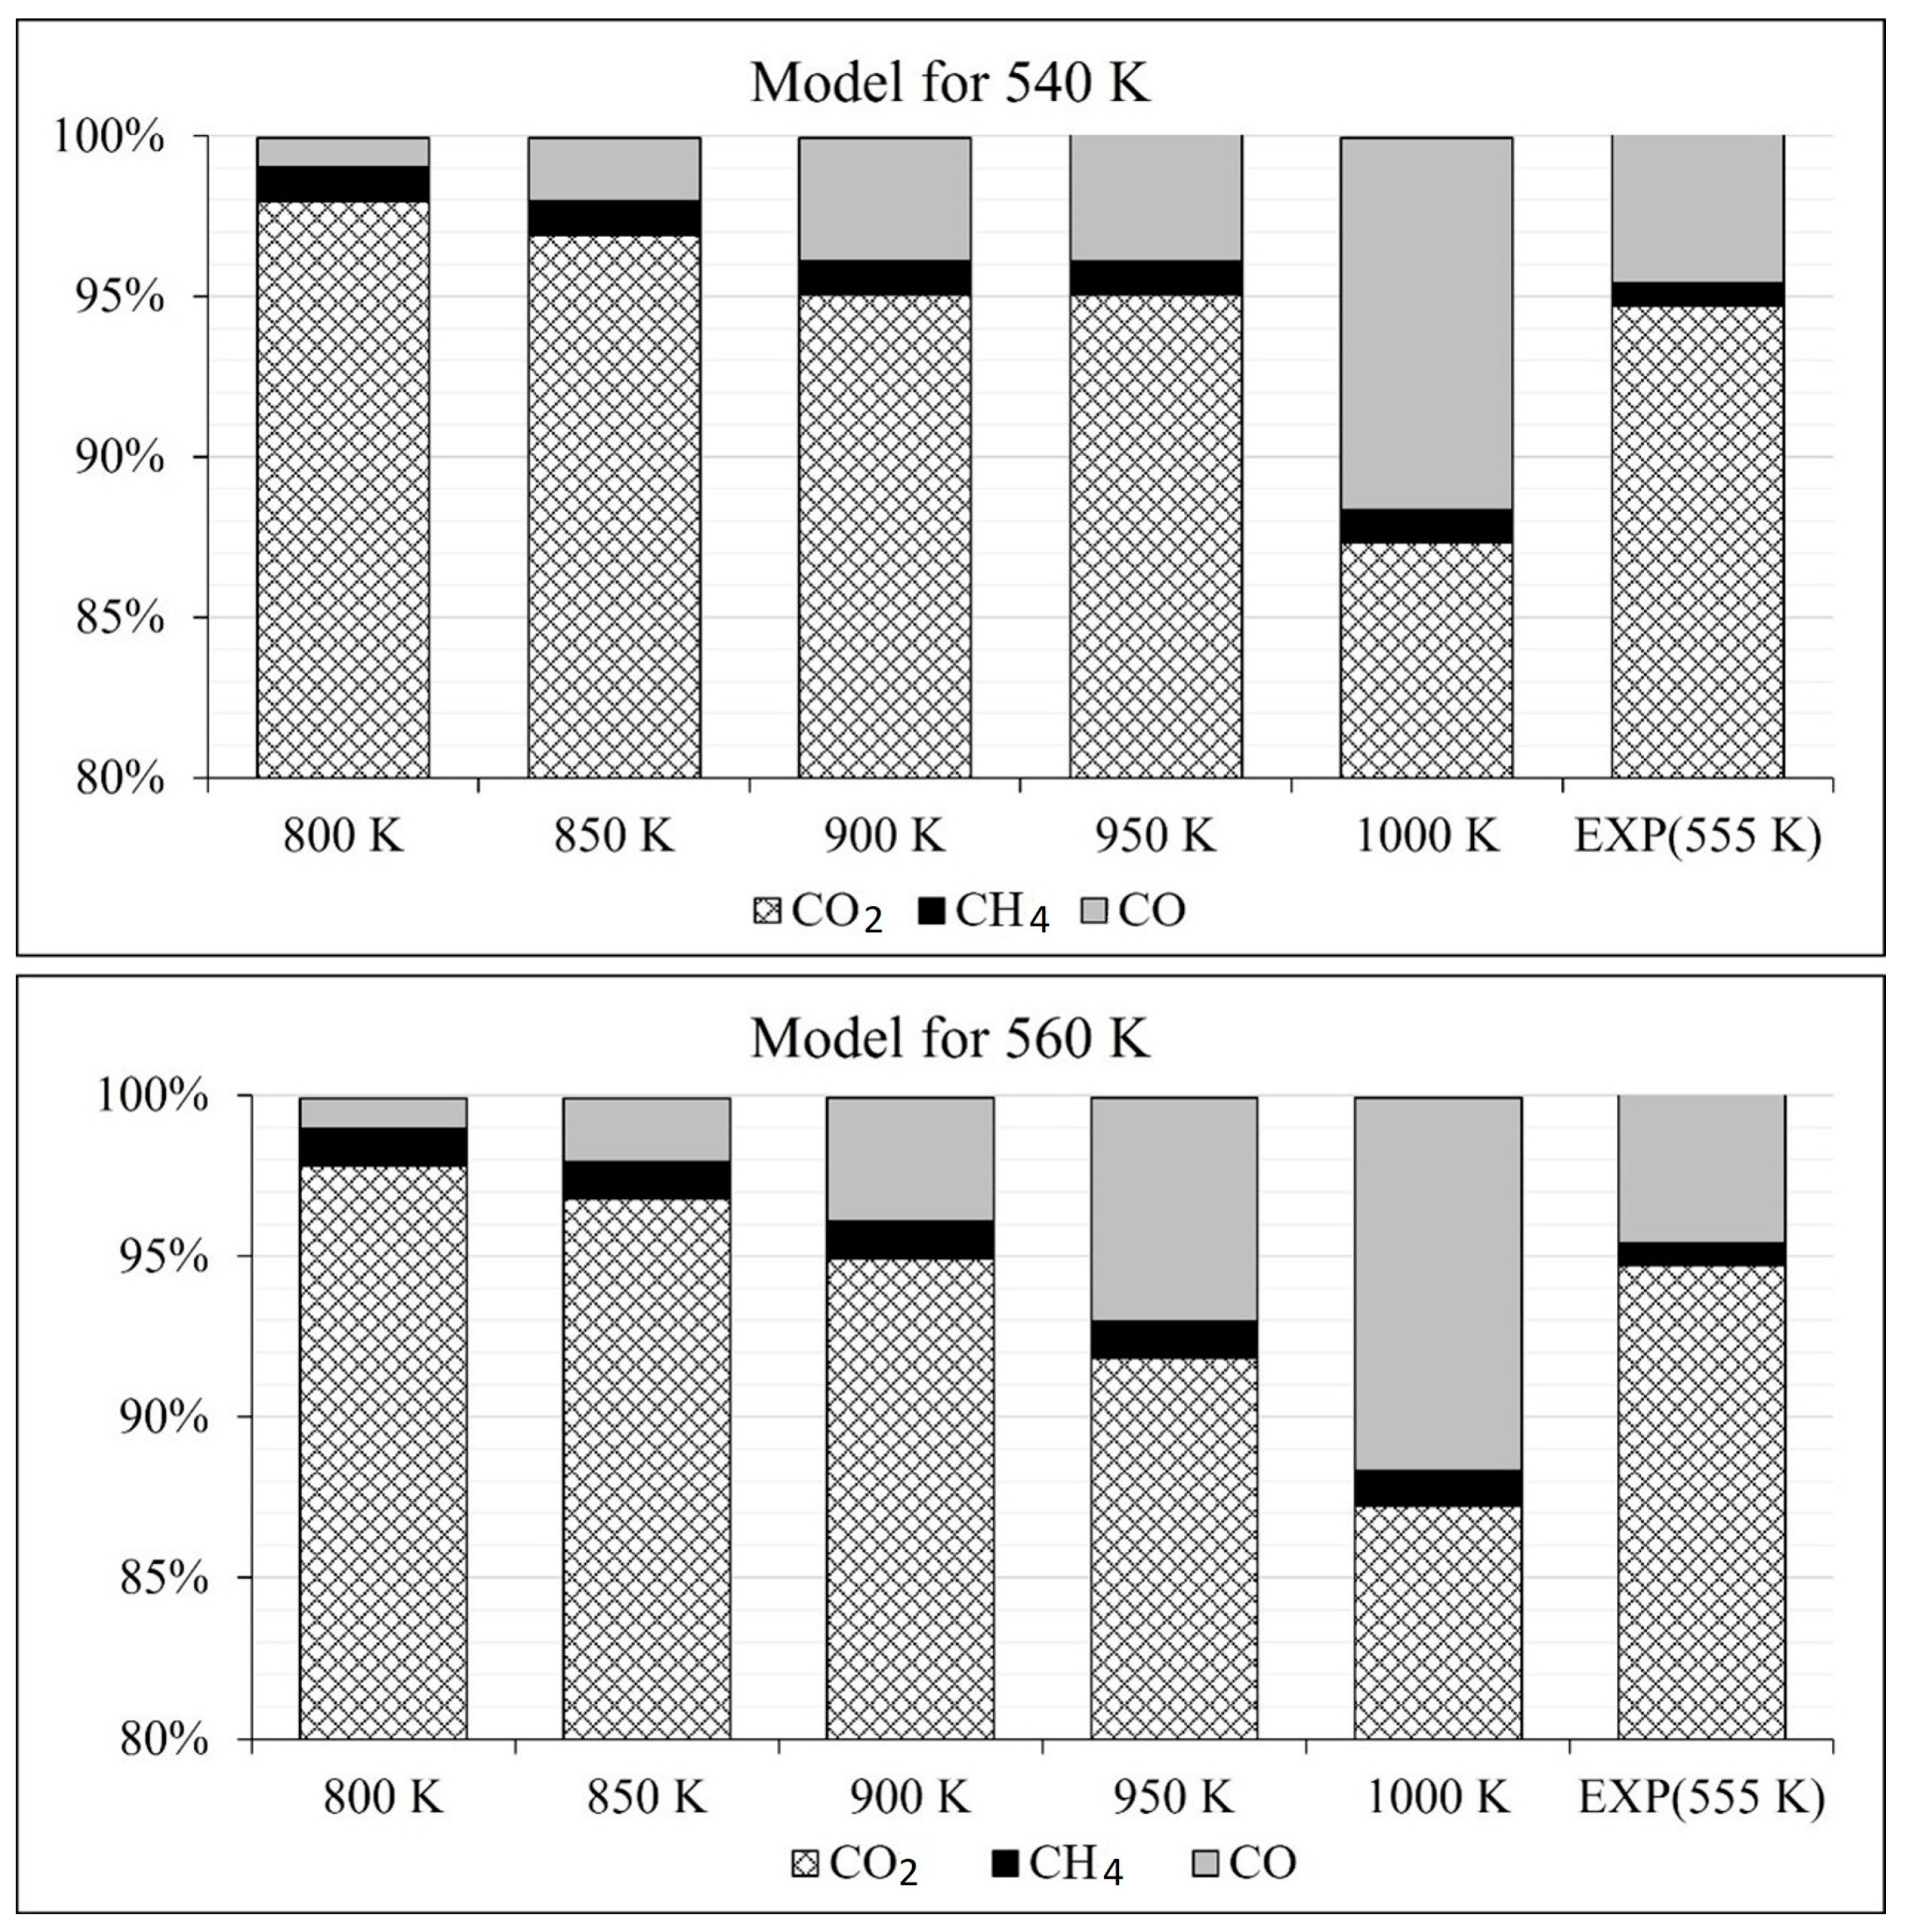
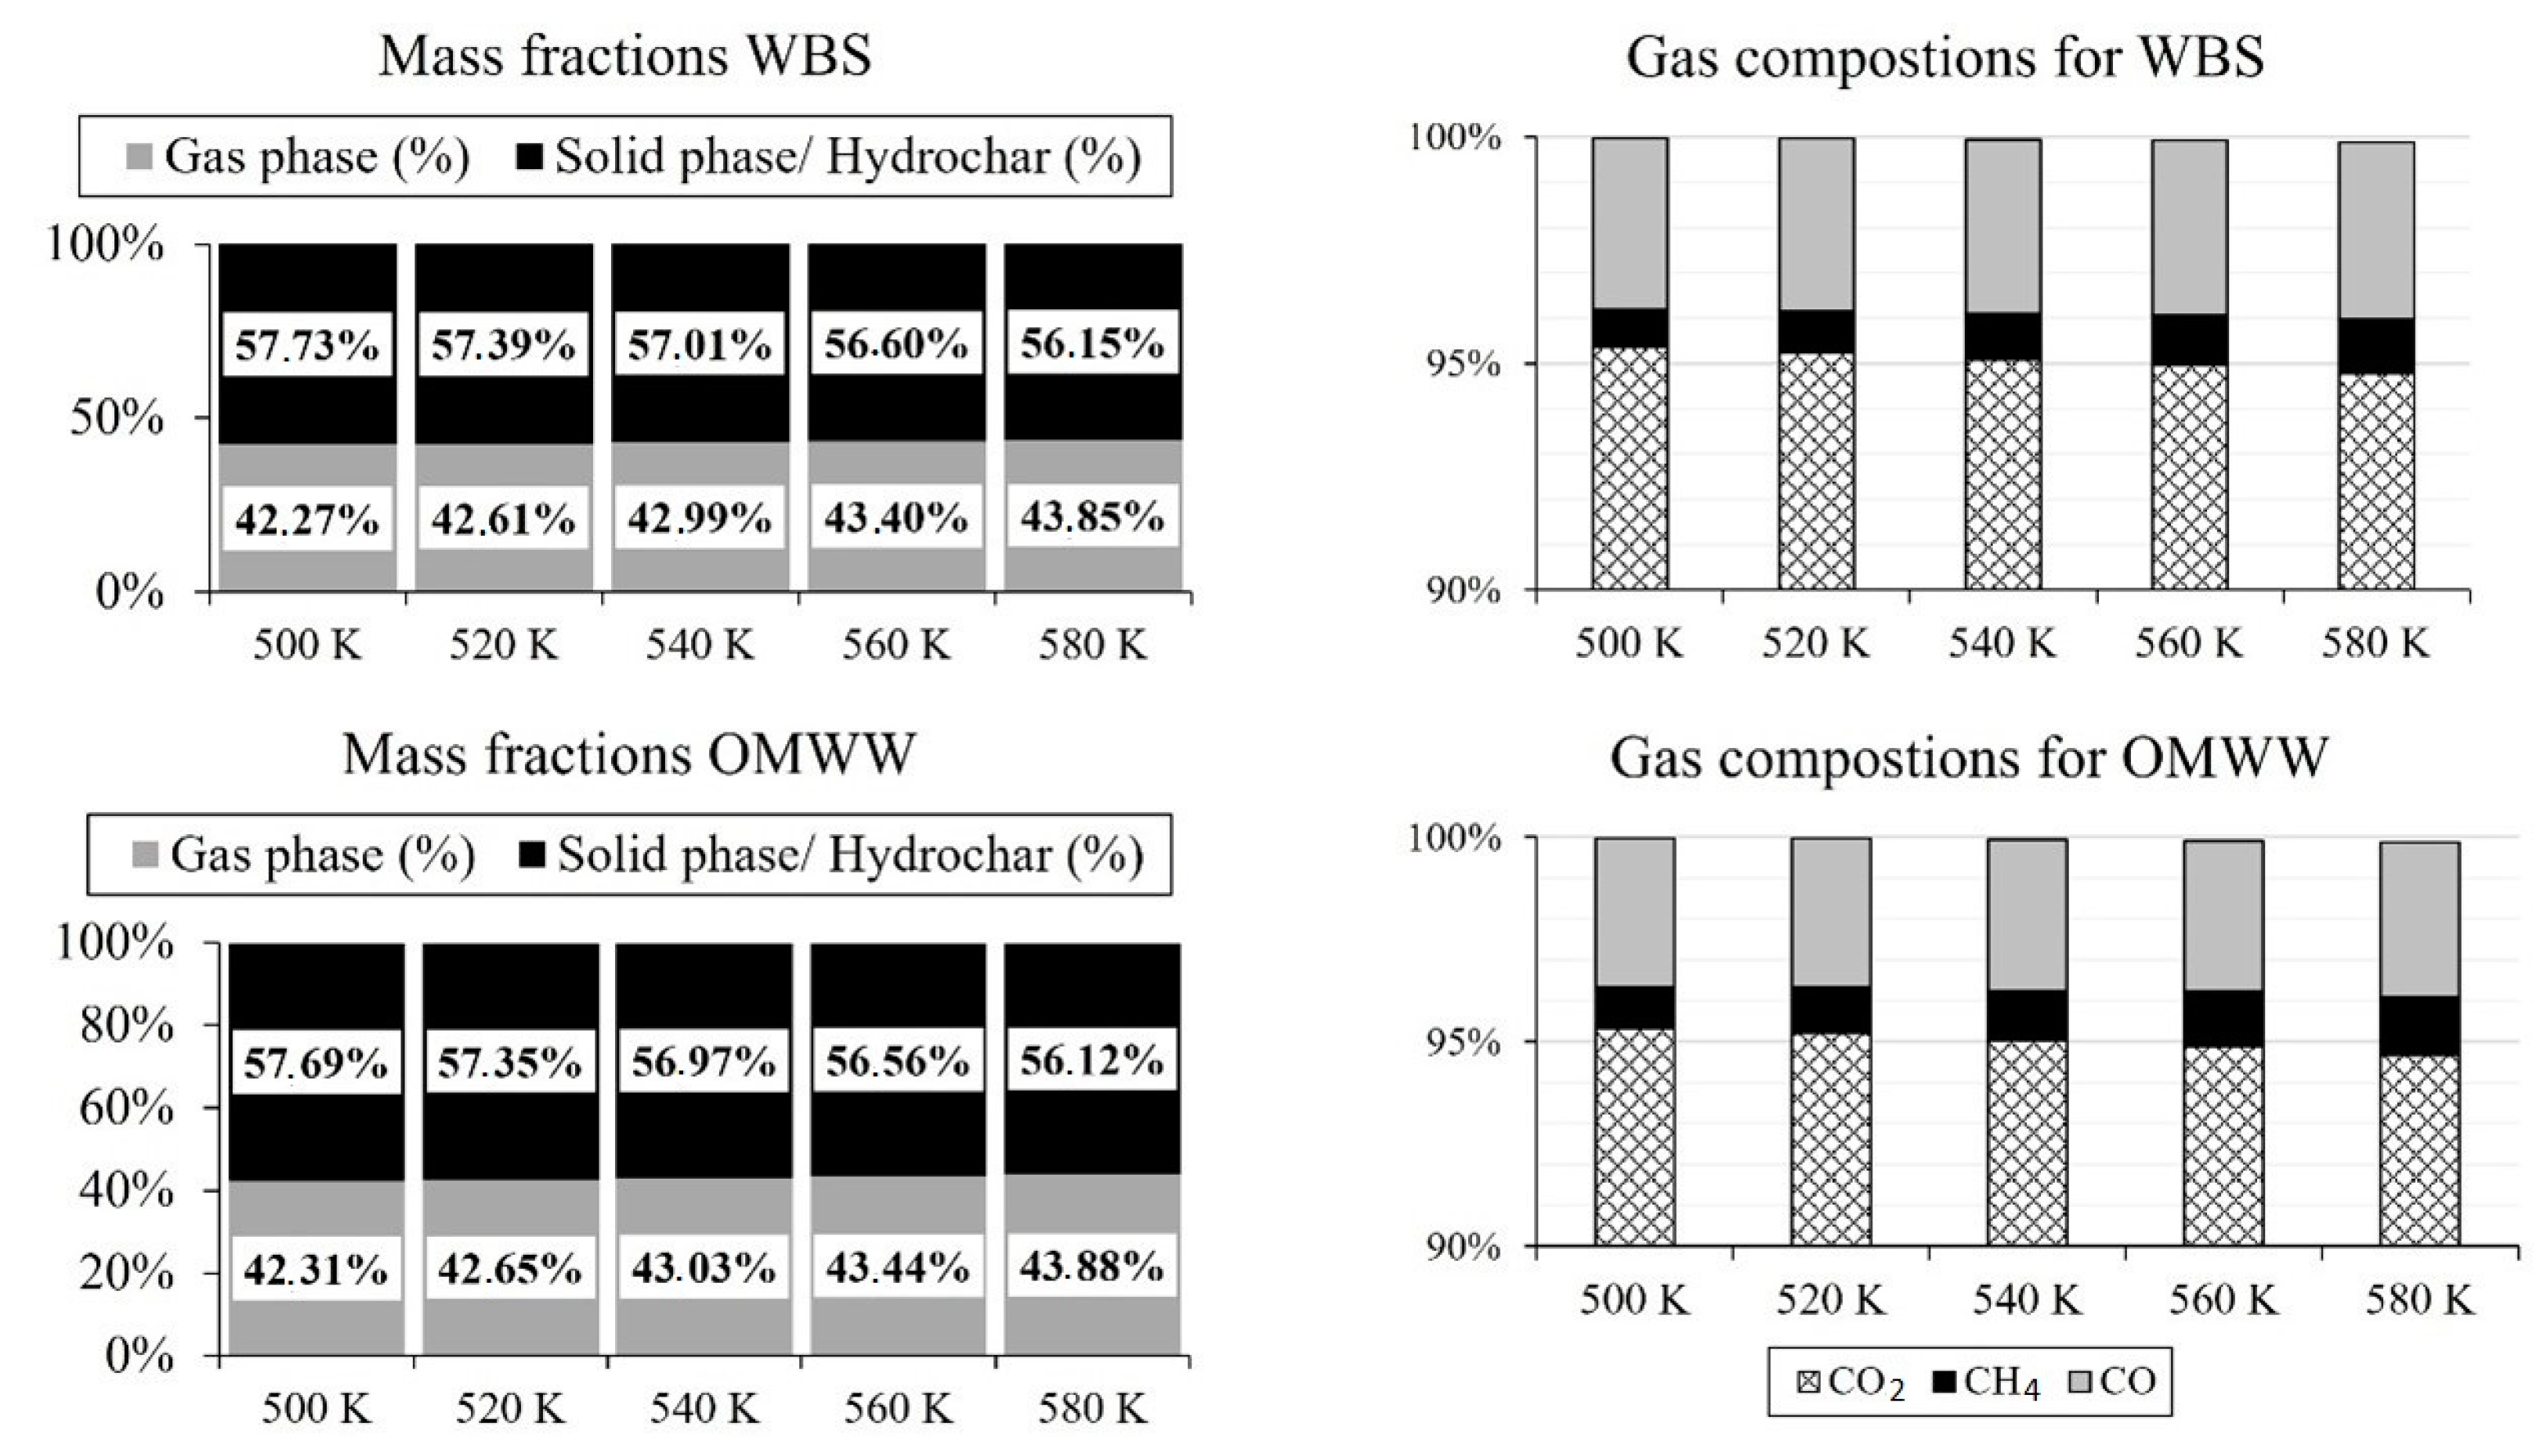
This study recognizes that the 3-step evolution model has the limitations that all models have; i.e., it simulates the operation of the AHR system as realistically as possible, but it is not a detailed description of thermochemical mechanisms. At the same time, the process depends on the accuracy of the thermodynamic databases that are used, with GRI30 being a characteristic example. Although the level of detail in the reaction mechanisms is sufficient, it is the case that they are primarily developed for other purposes; e.g., the GRI30 is optimized for the combustion of methane. At the same time, thermodynamic modeling cannot account for the proximity of the actual process to a thermodynamic equilibrium, although the model assumes so in order to minimize the chemical potential. The correction that is proposed by the 3-step evolution model is a way to overcome this issue. Finally, although the liquid phase can be described by means of the Curran mechanism [30], the model cannot account for the solubility of some liquid products in the water.

3. Results

The mass flow analysis in and out of the AHR is presented in Figure 4. The overall input mass was measured to be 32.16 kg/h, from which 25% was chicken manure slurry, and the balance fraction was water. The elemental analysis of the chicken manure slurry is shown in Figure 4 as well, and notable parameters are the carbon content (34.11%) and the nitrogen content (3.38%) which may be not typical for conventional lignocellulosic biomass but are relatively similar with the results from other studies that have analyzed chicken manure [27]. From the initial 32.16 kg/h, 10.72% end in the gaseous phase in the form of syngas where carbon oxides, i.e., CO2 and CO, account for the majority of the total gaseous mixture with molar fractions of 94.70% and 4.79%, respectively. The carbonaceous solid residue, which resembles hydrochar, accounts for 14.21% of the initial feedstock, and the two main elements are carbon with 64.79% and ash with 35.21%. Finally, the remaining 75.07% ends up in the liquid phase.
The main effort of the 3-step evolution model is that the final output gases from the AHR are a product of the (hydro)char-gas reactions and the oxidative reactions from the evolved oxygen that are further enhanced by the presence of the free oxygen that has was previously dissolved in the input water. This 3-step reforming is presented in Figure 5 for different assumed operating temperatures. The 3-step reforming simulation accounts for the additional oxygen that was previously dissolved in the input water, and this enhanced oxidation converts a higher fraction of methane into (primarily) carbon dioxide and water. The third evolution step represents the reforming of gases together with char for the conversion of a fraction of carbon dioxide into carbon monoxide. The products of this final equilibrium show that the main reaction that drives it is the Boudouard reaction (Equation (1)).
The final simulated gaseous mix contains approximately 93–95% carbon dioxide, 3–5% carbon monoxide and 0.5–0.8% methane, a composition which is close to the values that were measured during the experiments on this reactor. As mentioned previously, the 3-step evolution model simulates not only the production of syngas but also the production of the solid carbonaceous product that resembles hydrochar. Figure 6 shows the final simulated equilibrium for different temperatures of potential operation of the AHR and presents the solid fractions and the gaseous fraction (water is excluded from the calculation). As shown in Figure 6, for all the assumed temperatures, the solid phase is simulated to account for more mass than the gaseous phase. For increasing temperatures, the mass fraction of the gaseous phase has a positive correlation. The mass fraction of the solid carbonaceous product is in the lower end of the standard values that are reported for hydrothermal carbonization, i.e., 50–80%, but still clearly within the reported range [35]. In addition, the AHR operates at significantly smaller time frames than conventional hydrothermal carbonization, and the maximization of the solid fraction yield is not the main scope, since the products of the AHR are subsequently gasified downstream.
A final part of the 3-step evolution model, as described in the section “Materials and Methods”, was the re-equilibration at different (elevated) temperatures of the third evolution step gaseous and solid products as an indicator for assessing “how far” the process is from the thermodynamic equilibrium. At the same time, this is an indirect way to account for the aspect that the process is not in total equilibrium. For example, although the thermodynamic state of the water is in equilibrium at the saturated condition, the conversion of the feedstock is still in a kinetic regime. Thus, experimental measurement of the CO2 molar fraction in the output syngas was used in order to assess which elevated equilibrium temperature matched best the actual operation of the AHR. The results of this final simulation/equilibration are presented in Figure 7 and are compared with the experimental measurement of the syngas that exited the AHR. Thus, modeling results at equilibration temperatures at 540 K and 560 K were compared with the experimental results at 555 K, which was the measured operational temperature, and the final simulated syngas was re-equilibrated for temperatures between 800 K and 1000 K. In both cases of equilibrations at 540 K and 560 K, the final correction with “char-gas reactions” at 900 K produces optimal results. As mentioned in the section of Materials and Methods, the measured CO2 molar fraction from the experiments is used as an indicator for assessing “how far” the process is from the thermodynamic equilibrium, and elevated temperatures are utilized as a correction factor. For modeling at 540 K and re-equilibration at 900 K, the final syngas was simulated to have concentrations of CO2: 95.05%, CO: 3.84% and CH4: 0.61%. For modeling at 560 K and re-equilibration at 900 K, the final syngas was simulated to have concentrations of CO2: 94.93%, CO: 3.84% and CH4: 0.67%. The experimental measurements showed that the final syngas had concentrations of: experimental results at 555 K CO2: 94.71%, CO: 4.79% and CH4: 0.70%. The simulation of carbon monoxide deviates from the actual measured value, and although the simulation returns values that are less than 1%, we have to point to the relative difference. An explanation for this can be the chemical reaction mechanisms, i.e., GRI30, which on the one hand is optimized for the combustion of methane, and on the other hand it also simulates the development of some minor gaseous hydrocarbons such as ethane, which has compositions around 0.4–0.6%. The utilization aspect of this final re-equilibration step can be described as a way to incorporate the severity factor, which is a parameter that is utilized (primarily) in torrefaction in order to account for the residence time and the temperature profile of the reactor into the final production of solid carbonaceous products, mainly torrefied biomass [35]. An interesting utilization of the severity factor has been presented by Heidari et al. [36], where the authors performed a series of experiments and utilized the data along with severity factors in order to predict (among other parameters) the mass yield of hydrochar from hydrothermal carbonization.
In respect to immediate future work and possible applications of the model, the authors have focused on two points. The first point is related to the possible applicability of the model for more input feedstock other than chicken manure slurry. Typical elemental analysis parameters for wine brewery sludge and olive mill wastewater are presented in Table 1 and have been used as input parameters in the 3-step evolution model. The modeling results are presented in Figure 8. The mass fraction of the solid phase is between 56% and 57% for both inputs, but the quality of syngas is significantly different. An explanation can be that the high content of hydrogen in olive mill wastewater is the main reason behind the higher methane yields. At the same time, the lower oxygen content (in comparison to wine brewery sludge) can be an explanation behind the lower content of carbon dioxide—and subsequently the higher content of carbon monoxide—in the syngas produced from olive mill wastewater. Azzaz et al. [37] studied the hydrothermal carbonization of olive mill wastewater and concluded that the solid fraction from hydrothermal carbonization drops rapidly with increasing temperature, i.e., “from 57% at 180 °C to 25% at 220 °C”. Vasileiadou et al. [38] report similar data of yields on the area of 20–25%, but it should be stated that the pressures have been very low. Artikopoulos et al. [39] utilized a high-pressure reactor and performed hydrothermal carbonization in pressures that reached 55 bars. The authors reported hydrochar yield in the area of 50%, thus providing a strong indication that higher pressure may assist the formation of hydrochar and increase the produced yields at levels similar to the 3-step evolution model. It remains to be examined with future experiments if a similar tendency holds also for the AHR that operates under higher pressures than the standard HTC.
In addition, for liquid feedstock that primarily consists of phenols—such as olive mill wastewater—a potential pathway for the optimization of the 3-step evolution model is the expansion of the utilization of the Curran mechanism [30] to add specific organic compounds as inputs and not simple elements. This would significantly affect the thermodynamic behavior of the input mixture, but it requires extensive feedstock analysis before the implementation of this modeling endeavor.
This present study provides a modeling solution only for the AHR process and not for the whole system. Modeling the whole AHR process is planned for future work, yet it is recognized that the gasifier will approach closely to an equilibrium condition due to the elevated temperature. A first set of ideas is the following: potential pre-drying of the feedstock—which results in dewatering—can be modeled with the Page or the Midilli model, as presented by Sotiropoulos et al. [40]. The AHR will be modeled with the 3-step evolution that is presented in this study, and the gasification system will be modeled by means of the MAGSY gasification model that is specialized in complex two-phase gasification reactors [41]. The validation of the gasification model will be conducted by comparing the results with relevant modeling and experimental work similar to the study by Saha et al., (2019) [42]. Finally, potential integration of the re-equilibration stage with severity factor parameters could be a pathway for making the model applicable to all hydrothermal carbonization reactors.

4. Discussion and Conclusions

This study proposed the 3-step evolution thermodynamic model as a solution to successfully simulate the operation of the AHR subprocess. The AHR is modeled as a series of “char-gas” 2-phase reactions and accounts that the oxygen that is bound in the molecules of the feedstock becomes available for sub stoichiometric reactions. The model has been validated with experiments that were performed in the Combustion and Catalysis Laboratory (CCNY). For chicken manure slurry as feedstock, the mass fraction of the solid carbonaceous product was 56–57%, and the liquid input and output were modeled and measured experimentally to be similar. In the gaseous phase, the simulated carbon dioxide composition ranged between 92% and 97%, the carbon monoxide between 1% and 7% and methane between 0.5% and 0.8%. Carbon dioxide and methane compositions were very close to the actual measured composition, and carbon monoxide was also close but with a small deviation of less than 1%. Wine brewery sludge and olive mill wastewater were also simulated, and the model returned solid yields between 56% and 57% for both but with significantly different syngas qualities due to the influence of the elemental composition of the inputs on the final thermodynamic equilibrium. Further experiments are necessary to validate these modeling results. Future work will include the simulation of the whole AHR process, including the drying of the feedstock and the gasification process downstream of the AHR. The ultimate scope is to expand the use of the 3-step evolution model to all high pressure and high temperature reactors, especially HTC reactors.

Author Contributions

Conceptualization, S.V. and M.J.C.; methodology, S.V. and K.M.; software, S.V., S.S.A. and K.M.; validation, S.S.A. and K.M.; formal analysis, S.V., S.S.A. and K.M.; investigation, K.M.; resources, S.V. and M.J.C.; data curation, S.S.A.; writing—original draft preparation, S.V.; writing—review and editing, S.V. and M.J.C.; visualization, S.V.; supervision, S.V. and M.J.C.; project administration, S.V. and M.J.C.; funding acquisition, M.J.C. All authors have read and agreed to the published version of the manuscript.

Funding

This research received no external funding.

Data Availability Statement

Data are unavailable due to privacy restrictions.

Acknowledgments

The authors would like to thank the scientific teams of the Energy Management Laboratory (University of the Aegean) and the Combustion and Catalysis Laboratory (City College/City University of New York) for their collaboration and support.

Conflicts of Interest

The authors declare no conflict of interest.

Nomenclature

μichemical potential
νjstoichiometric coefficients
νinumber of moles
ΔHdelta enthalpy
Mmass (kg)
mass flux (kg h−1)
ṁ biommass flux of biomass (kg h−1)
ṁ gasmass flux of producer gas (kg h−1)
AHRAdvanced Hydrothermal Reactor
CMChicken Manure
EEnergy (J)
GGibbs Free Energy
H (h)enthalpy (J)
HTCHydrothermal Carbonization
ICEInternal Combustion Engine
KKelvin
n0initial composition
OMWWOlive mill wastewater
RTresidence time
Ttemperature (K)
pCO2partial pressure of CO2 in the atmosphere (Pa)
KHHenry constant (Pa−1)
(mol/ (kg × Pa))(dimensionless)
xCO2equilibrium mole fraction of CO2 in the water (%)
WBSWine Brewery Sludge
WTEWaste-to-Energy

References

  1. Vakalis, S.; Patuzzi, F.; Baratieri, M. Introduction of an energy efficiency tool for small-scale biomass gasifiers—A thermodynamic approach. Energy Convers. Manag. 2017, 131, 1–9. [Google Scholar] [CrossRef]
  2. Chen, H.; Li, J.; Liu, J.; Li, T.; Xu, G.; Liu, W. Thermodynamic and economic evaluation of a novel waste-to-energy design incorporating anaerobic digestion and incineration. Energy Convers. Manag. 2022, 252, 115083. [Google Scholar] [CrossRef]
  3. Wei, L.; Zhu, F.; Li, Q.; Xue, C.; Xia, X.; Yu, H.; Zhao, Q.; Jiang, J.; Bai, S. Development, current state and future trends of sludge management in China: Based on exploratory data and CO2-equivalent emissions analysis. Environ. Int. 2020, 144, 106093. [Google Scholar] [CrossRef] [PubMed]
  4. National Research Council. Use of Reclaimed Water and Sludge in Food Crop Production; The National Academies Press: Washington, DC, USA, 1996. [Google Scholar] [CrossRef]
  5. New York State Department of Environmental Conservation. Biosolids Management in New York State. Division of Materials Management. 2018. Available online: https://www.dec.ny.gov/chemical/97463.html (accessed on 7 February 2022).
  6. Bianchini, A.; Bonfiglioli, L.; Pellegrini, M.; Saccani, C. Sewage sludge management in Europe: A critical analysis of data quality. Int. J. Environ. Waste Manag. 2016, 18, 226–238. [Google Scholar] [CrossRef]
  7. Kor-Bicakci, G.; Eskicioglu, C. Recent developments on thermal municipal sludge pretreatment technologies for enhanced anaerobic digestion. Renew. Sustain. Energy Rev. 2019, 110, 423–443. [Google Scholar] [CrossRef]
  8. Latifi, P.; Karrabi, M.; Danesh, S. Anaerobic co-digestion of poultry slaughterhouse wastes with sewage sludge in batch-mode bioreactors (effect of inoculum-substrate ratio and total solids). Renew. Sustain. Energy Rev. 2019, 107, 288–296. [Google Scholar] [CrossRef]
  9. Sharma, V.K.; Canditelli, M.; Fortuna, F.; Cornacchia, G. Processing of urban and agro-industrial residues by aerobic composting: Review. Energy Convers. Manag. 1997, 38, 453–478. [Google Scholar] [CrossRef]
  10. Wainaina, S.; Awasthi, M.K.; Sarsaiya, S.; Chen, H.; Singh, E.; Kumar, A.; Ravindran, B.; Awasthi, S.K.; Liu, T.; Duan, Y.; et al. Resource recovery and circular economy from organic solid waste using aerobic and anaerobic digestion technologies. Bioresour. Technol. 2020, 301, 122778. [Google Scholar] [CrossRef]
  11. Chen, D.; Gao, A.; Ma, Z.; Fei, D.; Chang, Y.; Shen, C. In-depth study of rice husk torrefaction: Characterization of solid, liquid and gaseous products, oxygen migration and energy yield. Bioresour. Technol. 2018, 253, 148–153. [Google Scholar] [CrossRef]
  12. Vakalis, S.; Ahmad, J.; Heimann, R.; Patuzzi, F.; Baratieri, M. The Case of Frictional Torrefaction and the Effect of Reflux Condensation on the Operation of the Rotary Compression Unit. Bioresour. Technol. 2018, 268, 91–96. [Google Scholar] [CrossRef]
  13. Bach, Q.-V.; Skreiberg, Ø. Upgrading biomass fuels via wet torrefaction: A review and comparison with dry torrefaction. Renew. Sustain. Energy Rev. 2016, 54, 665–677. [Google Scholar] [CrossRef]
  14. Bach, Q.-V.; Tran, K.-Q.; Khalil, R.A.; Skreiberg, Ø.; Seisenbaeva, G. Comparative assessment of wet torrefaction. Energy Fuels 2013, 27, 6743–6753. [Google Scholar] [CrossRef]
  15. Goto, M.; Obuchi, R.; Hirose, T.; Sakaki, T.; Shibata, M. Hydrothermal conversion of municipal organic waste into resources. Bioresour. Technol. 2004, 93, 279–284. [Google Scholar] [CrossRef] [PubMed]
  16. Alba, L.G.; Torri, C.; Samorì, C.; van der Spek, J.; Fabbri, D.; Kersten, S.R.A.; Brilman, D.W. Hydrothermal treatment (HTT) of microalgae: Evaluation of the process as conversion method in an algae biorefinery concept. Energy Fuels 2011, 26, 642–657. [Google Scholar] [CrossRef]
  17. Wang, Y.; Qiu, L.; Zhu, M.; Sun, G.; Zhang, T.; Kang, K. Comparative Evaluation of Hydrothermal Carbonization and Low Temperature Pyrolysis of Eucommia ulmoides Oliver for the Production of Solid Biofuel. Sci. Rep. 2019, 9, 5535. [Google Scholar] [CrossRef] [Green Version]
  18. Sevilla, M.; Maciá-Agulló, J.A.; Fuertes, A.B. Hydrothermal carbonization of biomass as a route for the sequestration of CO2: Chemical and structural properties of the carbonized products. Biomass Bioenergy 2011, 35, 3152–3159. [Google Scholar] [CrossRef] [Green Version]
  19. Saha, N.; Saba, A.A.; Reza, M.T. Effect of hydrothermal carbonization temperature on pH, dissociation constants, and acidic functional groups on hydrochar from cellulose and wood. J. Anal. Appl. Pyrolysis 2019, 137, 138–145. [Google Scholar] [CrossRef]
  20. Libra, J.A.; Ro, K.S.; Kammann, C.; Funke, A.; Berge, N.D.; Neubauer, Y.; Titirici, M.-M.; Fühner, C.; Bens, O.; Kern, J.; et al. Hydrothermal carbonization of biomass residuals: A comparative review of the chemistry, processes and applications of wet and dry pyrolysis. Biofuels 2011, 2, 89–124. [Google Scholar] [CrossRef] [Green Version]
  21. Djandja, O.S.; Yin, L.-X.; Wang, Z.-C.; Duan, P.-G. From wastewater treatment to resources recovery through hydrothermal treatments of municipal sewage sludge: A critical review. Process Saf. Environ. Prot. 2021, 151, 101–127. [Google Scholar] [CrossRef]
  22. Román, S.; Libra, J.; Berge, N.; Sabio, E.; Ro, K.; Li, L.; Ledesma, B.; Álvarez, A.; Bae, S. Hydrothermal Carbonization: Modeling, Final Properties Design and Applications: A Review. Energies 2018, 11, 216. [Google Scholar] [CrossRef] [Green Version]
  23. Basso, D.; Patuzzi, F.; Castello, D.; Baratieri, M.; Rada, E.C.; Weiss-Hortala, E.; Fiori, L. Agro-industrial waste to solid biofuel through hydrothermal carbonization. Waste Manag. 2016, 47, 114–121. [Google Scholar] [CrossRef] [PubMed] [Green Version]
  24. Kruse, A.; Funke, A.; Titirici, M.-M. Hydrothermal conversion of biomass to fuels and energetic materials. Curr. Opin. Chem. Biol. 2013, 17, 515–521. [Google Scholar] [CrossRef] [PubMed]
  25. Guo, S.; Xu, D.; Guo, X.; Zhao, D.; Li, X.; Liu, T. Theoretical modeling of hydrochar precursor formation during the hydrothermal carbonization of sewage sludge. Fuel Process. Technol. 2022, 231, 107212. [Google Scholar] [CrossRef]
  26. Sangare, D.; Chartier, A.; Moscosa-Santillan, M.; Gökalp, I.; Bostyn, S.S. Kinetic studies of hydrothermal carbonization of avocado stone and analysis of the polycyclic aromatic hydrocarbon contents in the hydrochars produced. Fuel 2022, 316, 123163. [Google Scholar] [CrossRef]
  27. Ciuta, S.; Tsiamis, D.; Castaldi, M.J. Gasification of Waste Materials: Technologies for Generating Energy, Gas, and Chemicals from Municipal Solid Waste, Biomass, Nonrecycled Plastics, Sludges, and Wet Solid Wastes, 1st ed.; Elsevier/Academic Press: London, UK, 2017; pp. 65–91. ISBN 9780128127179. [Google Scholar]
  28. Ghavami, N.; Özdenkçi, K.; Chianese, S.; Musmarra, D.; De Blasio, C. Process simulation of hydrothermal carbonization of digestate from energetic perspectives in Aspen Plus. Energy Conv. Manag. 2022, 270, 116215. [Google Scholar] [CrossRef]
  29. Smith, G.P.; Golden, D.M.; Frenklach, M.; Moriarty, N.W.; Eiteneer, B.; Goldenberg, M.; Bowman, C.T.; Hanson, R.K.; Song, S.; Gardiner, W.C., Jr.; et al. GRI-Mech 3.0. Available online: http://www.me.berkeley.edu>/gri_mech (accessed on 4 February 2022).
  30. Curran, H.J.; Gaffuri, P.; Pitz, W.J.; Westbrook, C.K. A comprehensive modeling study of iso-octane oxidation. Combust. Flame 2002, 129, 253–280. [Google Scholar] [CrossRef]
  31. Goodwin, D.G.; Moffat, H.K.; Speth, R. Cantera: An Object-Oriented Software Toolkit for Chemical Kinetics, Thermodynamics, and Transport Processes (Version 2.2.0). Available online: http://www.cantera.org (accessed on 4 February 2022).
  32. Jaworski, R.K.; Cox, J.A.; Strohmeier, B.R. Characterization of oxide films electrochemically deposited from solutions of palladium chloride and sodium hexachloroiridate. J. Electroanal. Chem. 1992, 325, 111–123. [Google Scholar] [CrossRef]
  33. Tsai, W.-T. An Analysis of the Use of Biosludge as an Energy Source and Its Environmental Benefits in Taiwan. Energies 2012, 5, 3064–3073. [Google Scholar] [CrossRef] [Green Version]
  34. Altiparmaki, G.; Kourletakis, P.; Moustakas, K.; Vakalis, S. Assessing the effect of hydrothermal treatment (HT) severity on the fate of nitrates and phosphates in dairy wastewater. Fuel 2022, 312, 122866. [Google Scholar] [CrossRef]
  35. Maniscalco, M.P.; Volpe, M.; Messineo, A. Hydrothermal Carbonization as a Valuable Tool for Energy and Environmental Applications: A Review. Energies 2020, 13, 4098. [Google Scholar] [CrossRef]
  36. Heidari, M.; Norouzi, O.; Salaudeen, S.; Acharya, B.; Dutta, A. Prediction of Hydrothermal Carbonization with Respect to the Biomass Components and Severity Factor. Energy Fuels 2019, 33, 9916–9924. [Google Scholar] [CrossRef]
  37. Azzaz, A.A.; Jeguirim, M.; Kinigopoulou, V.; Doulgeris, C.; Goddard, M.-L.; Jellali, S.; Ghimbeu, C.M. Olive mill wastewater: From a pollutant to green fuels, agricultural and water source and bio-fertilizer—Hydrothermal carbonization. Sci. Total Environ. 2020, 733, 139314. [Google Scholar] [CrossRef] [PubMed]
  38. Vasileiadou, M.A.; Altiparmaki, G.; Moustakas, K.; Vakalis, S. Quality of Hydrochar from Wine Sludge under Variable Conditions of Hydrothermal Carbonization: The Case of Lesvos Island. Energies 2022, 15, 3574. [Google Scholar] [CrossRef]
  39. Artikopoulos, A.; Altiparmaki, G.; Liakos, D.; Vakalis, S. Hydrothermal Carbonization as a Pathway for Co-Gasification of Municipal Sludge and Agricultural Residues. In Proceedings of the 1st International Conference on Sustainable Chemical and Environmental Engineering, Rethymno, Greece, 31 August–4 September 2022. [Google Scholar]
  40. Sotiropoulos, A.; Malamis, D.; Michailidis, P.; Krokida, M.; Loizidou, M. Research on the drying kinetics of household food waste for the development and optimization of domestic waste drying technique. Environ. Technol. 2016, 37, 929–939. [Google Scholar] [CrossRef] [PubMed]
  41. Vakalis, S.; Moustakas, K. Modeling of Advanced Gasification Systems (MAGSY): Simulation and Validation for the Case of the Rising Co-current Reactor. Appl. Energy 2019, 242, 526–533. [Google Scholar] [CrossRef]
  42. Saha, P.; Muddin, H.; Reza, M.T. A steady-state equilibrium-based carbon dioxide gasification simulation model for hydrothermally carbonized cow manure. Energy Convers. Manag. 2019, 191, 12–22. [Google Scholar] [CrossRef]
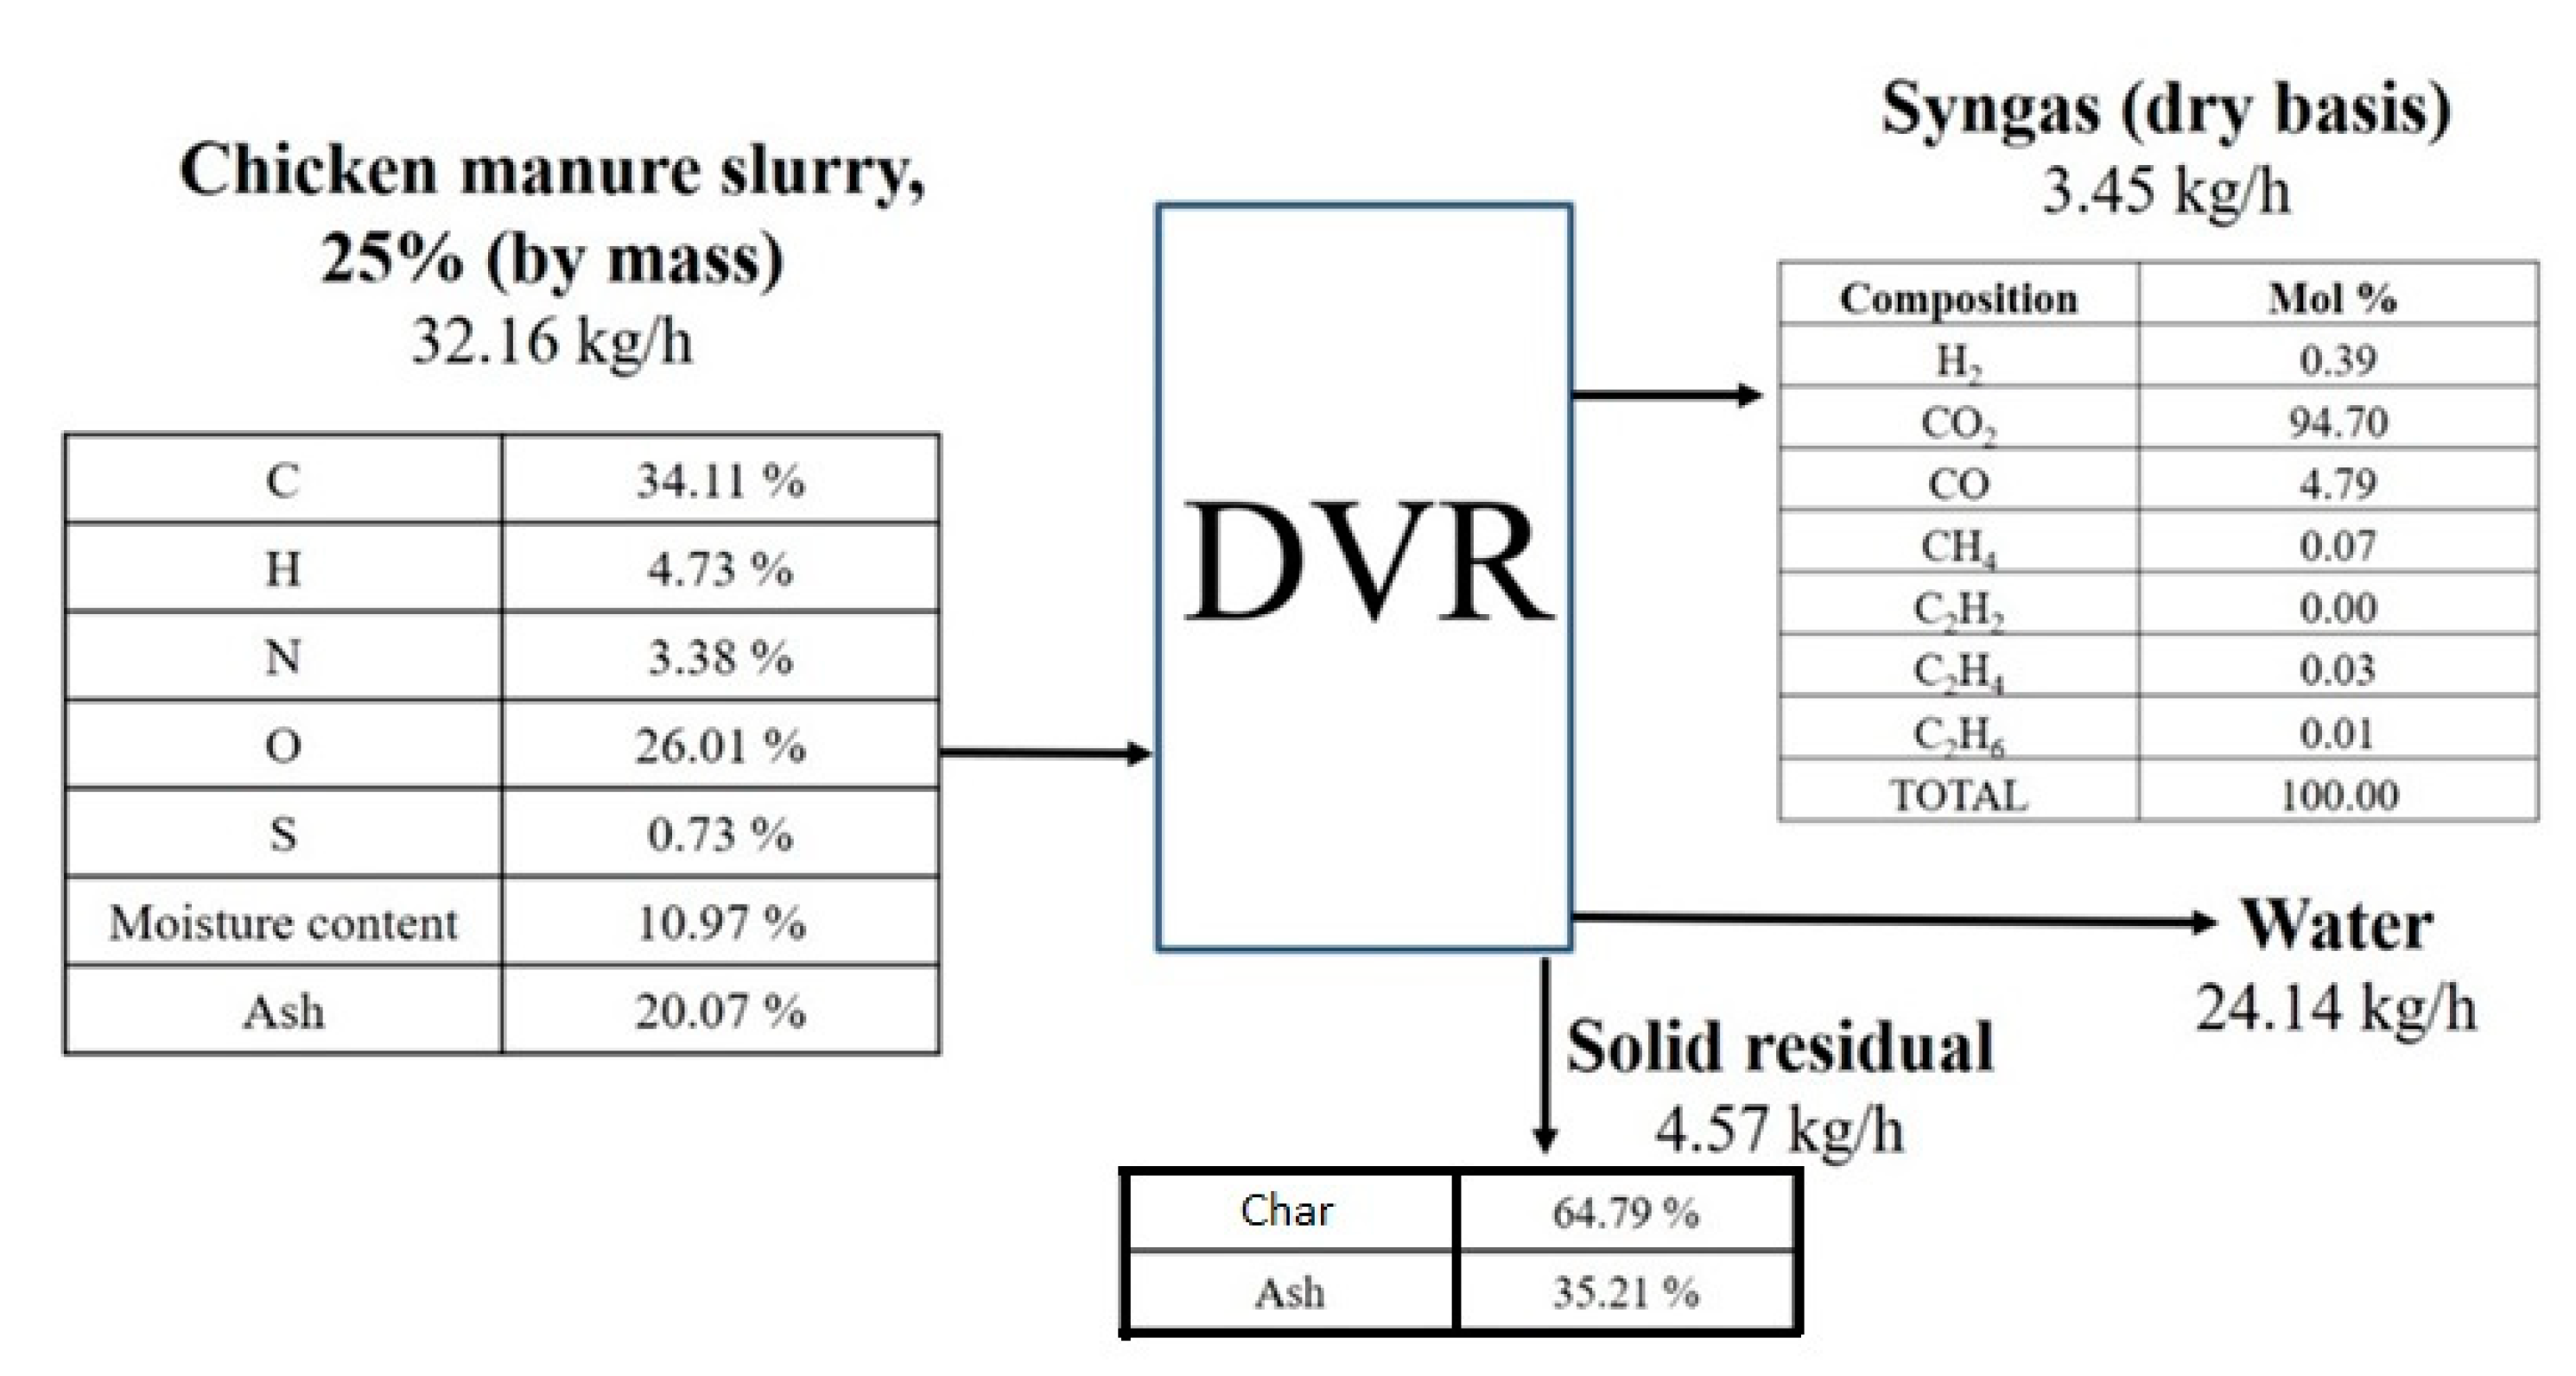
Figure 1. Scheme of the AHR system.
Energies 16 02032 g001
Figure 2. Modeling of the AHR—main gases.
Energies 16 02032 g002
Figure 3. Detailed scheme of the novel 3-step evolution model.
Energies 16 02032 g003
Figure 4. Input and output mass flows analysis at the AHR.
Energies 16 02032 g004
Figure 5. Detailed fractions of gases after the 3-step evolution simulation in the AHR for different operational temperatures (in Kelvin).
Energies 16 02032 g005
Figure 6. Mass fractions distribution between gaseous products and hydrochar for different operation temperatures of the AHR comparing model results to experiments.
Energies 16 02032 g006
Figure 7. Fractions of major gases for different modified equilibrium temperatures.
Energies 16 02032 g007
Figure 8. Fractions of major gases and mass fractions distribution between gaseous products and hydrochar for different for different operation temperatures of the AHR.
Energies 16 02032 g008
Table 1. Measured concentration of gases in the AHR [27].
Syngas Species (mol %)10 min RT,
565 K
10 min RT,
575 K
30 min RT,
550 K
H20.390.180.48
CO294.7195.6595.05
CO4.794.094.29
CH40.070.050.11
C2H40.030.020.04
C2H60.010.010.02
Table 2. Elemental Analysis of the input feedstock (on dry basis) for the 3-step evolution model.
WBS [33]CM [27]OMWW [34]
Carbon (%) 31.638.0157.3
Hydrogen (%) 4.94.988
Oxygen (%) 31.928.9823.9
Nitrogen (%) 5.53.762.3
Ash (%) 26.122.3615.73
HHV (MJ/ Kg)13.415.230
Disclaimer/Publisher’s Note: The statements, opinions and data contained in all publications are solely those of the individual author(s) and contributor(s) and not of MDPI and/or the editor(s). MDPI and/or the editor(s) disclaim responsibility for any injury to people or property resulting from any ideas, methods, instructions or products referred to in the content.

