Article

Class Thresholds Pre-Definition by Clustering Techniques for Applications of ELECTRE TRI Method

by
Flavio Trojan
1,
Pablo Isaias Rojas Fernandez
1,
Marcio Guerreiro
1,
Lucas Biuk
2,
Mohamed A. Mohamed
3,*,
Pierluigi Siano
4,5,*,
Roberto F. Dias Filho
6,
Manoel H. N. Marinho
6 and
Hugo Valadares Siqueira
1,2
1
Graduate Program in Industrial Engineering (PPGEP), Federal University of Technology-Paraná-UTFPR, R. Doutor Washington Subtil Chueire, 330-Jardim Carvalho, Ponta Grossa 84017-220, PR, Brazil
2
Graduate Program in Electrical Engineering (PPGEE), Federal University of Technology-Paraná-UTFPR, R. Doutor Washington Subtil Chueire, 330-Jardim Carvalho, Ponta Grossa 84017-220, PR, Brazil
3
Department of Electrical Engineering, Faculty of Engineering, Minia University, Minia 61519, Egypt
4
Department of Management & Innovation Systems, University of Salerno, 84084 Fisciano, Italy
5
Department of Electrical and Electronic Engineering Science, University of Johannesburg, Johannesburg 2006, South Africa
6
Polytechnic School of Pernambuco, University of Pernambuco, R. Benfica 455, Recife 50720-001, PE, Brazil
*
Authors to whom correspondence should be addressed.
Energies 2023, 16(4), 1936; https://doi.org/10.3390/en16041936
Submission received: 3 January 2023 / Revised: 7 February 2023 / Accepted: 9 February 2023 / Published: 15 February 2023

Abstract

:
The sorting problem in the Multi-criteria Decision Analysis (MCDA) has been used to address issues whose solutions involve the allocation of alternatives in classes. Traditional multi-criteria methods are commonly used for this task, such as ELECTRE TRI, AHP-Sort, UTADIS, PROMETHEE, GAYA, etc. While using these approaches to perform the sorting procedure, the decision-makers define profiles (thresholds) for classes to compare the alternatives within these profiles. However, most such applications are based on subjective tasks, i.e., decision-makers’ expertise, which sometimes might be imprecise. To fill that gap, in this paper, a comparative analysis using the multi-criteria method ELECTRE TRI and clustering algorithms is performed to obtain an auxiliary procedure to define initial thresholds for the ELECTRE TRI method. In this proposed methodology, K-Means, K-Medoids, Fuzzy C-Means algorithms, and Bio-Inspired metaheuristics such as PSO, Differential Evolution, and Genetic algorithm for clustering are tested considering a dataset from a fundamental problem of sorting in Water Distribution Networks. The computational performances indicate that Fuzzy C-Means was more suitable for achieving the desired response. The practical contributions show a relevant procedure to provide an initial view of boundaries in multi-criteria sorting methods based on the datasets from specific applications. Theoretically, it is a new development to pre-define the initial limits of classes for the sorting problem in multi-criteria approach.

1. Introduction

The motivation of this work is based on the fact that in multi-criteria approaches, decision-makers are often faced with subjective analysis. Several methods have been developed to support these subjective tasks on Multi-criteria Decision Analysis (MCDA) problems. These problems present alternatives that can be evaluated under a multiple-criteria view, and the selection of experts for the definition of limits for preferences is crucial in each application [1,2]. In addition, each context demands assertiveness in decision-making, which depends on input information quality, decision-maker experience, and the efficiency of the applied methods. However, input information quality and decision-makers’ know-how are not easy to measure numerically.
The MCDM (Multi-criteria Decision Making) methods have been widely applied to real problems and can guide decision-making to achieve the intended objectives, considering preferences. Nevertheless, sometimes the decision-maker must provide inputs to the method, like weights for criteria and bounds for classes, which depend on the user’s knowledge and assertiveness [3].
Unfortunately, in some cases, the lack of knowledge or experience may harm the efficiency of the method and the entire process. So, the selection of methods sometimes needs to be correctly conducted. A potential alternative to overcome this problem is using methods that do not require a priori subjective information, like clustering approaches. Thus, a quantitative dataset might be an alternative to guarantee the quality of the inputs and after the adjusting of the personal information to attend to the preferences [4,5]. The advance of technology leads to an increase in the information available. Some examples can explain this statement, such as the development of social networks and search websites, the creation of the internet of things, and Industry 4.0. In these scenarios, using Data Mining techniques, it is necessary to create mechanisms to group these datasets [6,7].
In this sense, clustering algorithms are the core of Data Mining. They can divide some databases into groups according to their similarities, usually through an unsupervised approach [8]. This task can be modeled as an NP-hard problem and solved using optimization tools [9].
The clustering methods can be classified into four groups: 1. partitioned, 2. overlapping; 3. hierarchical; and 4. graph-based [10,11]. The first approach divides the data into groups according to their similarities using the Euclidean Distance in most cases. The overlapping methods consider that some samples may belong to different groups according to a membership grid. The hierarchical approaches create a dendrogram (a structured tree representing the clustering levels). The last one, graph-based, creates a weighted graph where the connections are the edges [7,12]. This paper addresses the partitional and overlapping approaches integrated into a comparative analysis with a multi-criteria outranking method to allocate alternatives in classes.
Undoubtedly, the most known partitional clustering algorithm is the K-Means, proposed by [13]. Its fame comes from its simplicity and computational efficiency [6]. The application of the K-Means involves the creation of centroids, artificial samples representing each center of the group. However, this presents drawbacks, such as convergence to a local minimum. once it strongly depends on the initialization of the centroids. In this direction, the K-Medoids were created to overcome the initialization dependency. The main difference between them is using samples’ positions as initial centers in the last case [7].
Many authors proposed the use of bio-inspired meta-heuristics for partitional clustering [14]. In these cases, clusters are again determined by the position of the centroids, as well as modeled as an optimization task, which must be minimized. In this paper, we apply Particle Swarm Optimization (PSO) for clustering [7,15], Genetic Algorithm [16,17], and Differential Evolution [12]. These methods are well known, can be easily implemented, and can escape local optima [18].
The last method investigated is the Fuzzy C-Means, which is an overlapping procedure. It can overcome the problems with the K-Means since the complexity of the relations considering the samples can be challenging to identify. Therefore, this method does not define a sharp partition but a membership matrix once a selection may belong to different groups [4,6,19].
In this context, the objective of this work is to present a methodology to use clustering approaches to support a pre-definition of boundaries for classes in sorting problems for multi-criteria methods and to solve real problems related to this definition.
We compared the clustering results with the ELECTRE TRI outranking method with a dataset extracted from a real application performed in the work published by [20].
This paper is organized as follows: Section 2 presents a Multi-Criteria problem; Section 3 shows the Theoretical basis of the ELECTRE-TRI; Section 4 discusses the methodology used and highlights the application of clustering approaches; Section 5 brings the empirical results and develops a critical analysis. The conclusions and future directions are in Section 6.

2. Problem Statement

Several methodologies have been developed in multi-criteria decision analysis to support decision-makers in expressing their preferences in ordinal, intervallic, or cardinal scales related to real problems. Despite the experience and acquired expertise, sometimes decision-makers feel uncomfortable defining the parameters in a subjective way [21].
The important multi-criteria question in this work is, “how does it assist decision-makers in classifying alternatives in classes?” [22]. In the multi-criteria sorting problem, they need to define weights for criteria, number of classes, boundaries for categories, and thresholds for indifference and preference, which might be, in some cases, a challenging task. For the criteria weight definitions, there are several appropriate methods in which the decision-maker is conducted to reflect on these parameters. Most of them present reliable results in their reports. Among such techniques, some might be quoted: Trade-off analysis [23]; the FITradeoff method [24]; the Swing weights [25]; the Macbeth method [26], and the procedure available in the AHP method [27] that also allows defining weights for criteria.
Regarding the definition of the boundaries, especially for the ELECTRE TRI method [28], it depends totally on the expertise of the decision-makers or specialists. In the AHPsort [29], another sorting procedure is adopted. The decision-maker is invited to compare alternatives in a pairwise combination in order to define the most appropriate class boundaries. It represents a significant effort related to understanding, application, and necessary time to do this; i.e., the decision-makers must be confident in order to define coherent profile limits and indifference and preference thresholds because the alternatives commonly present variations among classes when the multiple criteria are considered. Figure 1 illustrates how the ELECTRE TRI method compares the alternatives with profiles of classes and the indifference and preference thresholds.
The literature researched did not show this problem of class limits exactly like a gap. This gap is commonly ignored in studies that involve limit definitions because it is just performed based on the experts’ experience. Thus, the problems are just perceived in real cases, in which the procedures must be re-performed until more coherent results are found, causing delays and occasionally unreliable results.
Additionally, the literature presents several methods, such as clustering techniques and neural networks, applied to drive the same problems using mathematical modeling [10]. On the other side, only the numerical solutions cannot cover the multi-criteria aspect related to decision-makers’ preferences. Consequently, it does not present a solution compromised with the choices and objectives. To fill this gap, it is necessary to promote the integration of these aspects since the numeric methods can aid this procedure with an initial pre-definition of boundaries, and the fine adjustments could be made in the sequence by the traditional subjective ways.

3. Theoretical Foundations and Related Works

The ELECTRE TRI is a multi-criteria classification method that places the existing alternatives into predefined categories (classes) according to their upper and lower limits [30]. The technique presents several uses for decision support in real problems, such as the selection of suppliers explored in the works of [31,32]. Additionally, there are new energy sources and criteria to improve its use in [33] and the research of [34], with applications for assessing the energy performance of school buildings.
In maintenance management, Certa et al. [35] proposed a classification of equipment failure models and [36] developed a procedure to prioritize alternatives for maintenance on water distribution networks. In health, decisions with multiple criteria approaches are assisted by triage models applied to assisted reproduction. In the financial area, the decision-making is helped to select clients who will receive a joint research loan, described in the work of [37]. In addition, using the ELECTRE TRI method in real problems is related to solving issues jointly with other ways to generate more precise decisions.
The fuzzy methodology is used in conjunction with ELECTRE TRI in the work of [32]. However, other vocations also join the fuzzy logic and DEA (data envelopment analysis) with the ELECTRE III method in a ranking problem in [38,39,40,41]. Another method in conjunction with ELECTRE TRI is the Delphi method in [10] to classify intelligent grid policies.
The AHP was another method found to collaborate with ELECTRE III/IV methods in the work of [42,43], with the objective being to rank urban transport projects. The study in [44] proposed a new decision support system for product classification problems that integrate multi-criteria decision-making and feeling analysis to classify products.
The research group from Rivero Gutiérrez, De Vicente Oliva, and Romero-Ania developed studies on Urban Public Transport Systems, with the necessity of a limits definition for classes and weights. Some pieces of the investigation have been developed considering multi-criteria methods, such as AHP, Delphi, ELECTRE TRI, and ELECTRE III, to manage sustainable decisions and the economic efficiency of the operation [2,5,40,41]. Similarly, the VIKOR method was applied to evaluate the degree of satisfaction in Turkish cities [3]. Pala [3] developed a new hybrid decision-making model combining different MCDM methods, considering a mixed-integer linear programming model to prioritize them. It is perceived that all of these studies used some correlated subjective procedure to define limits, weights, or thresholds for preference or indifference.
Thus, in order to solve quantitative aspects in this context, clustering research is geared toward numerous applications. Among these, we highlight classic problems such as maintenance costs in [45]. As presented in the paper from [46], research uses clustering with a genetic algorithm to perform the sequencing of an aircraft manufacturing industry with a flow shop environment with multiple operations. Other applications that use the clustering techniques are water and energy distributions according to consumer demand. Some works like [47] present this subject through the K-Means method, and [48] uses Fuzzy C-means clustering.
The study of [49] proposed a decision support system using the t-SNE algorithm and K-Means clustering to improve security using multiple matching analyses. Applications in health are also presented, as the research of [50] used clustering and the genetic algorithm to group characteristics of individuals with cancer. As noted, clustering can solve several problems to find common elements and form an auxiliary grouping in decision-making.

3.1. Clustering Approach on MCDA Methods

Over many years, the literature has published several clustering approaches to different MCDA methods attempting to improve results. Zhou et al. [43] and Berbel et al. [51] developed a technique based on clustering and goal programming to analyze the decision-making process in irrigated farms.
Goodwin et al. [52] combined Clustering analysis and Multi-Attribute Utility Theory (MAUT) to verify the impact of water pricing on farms. In the study from Azadnia et al. [53], the Fuzzy C-means and ELECTRE II were applied to supplier selection problems in the automotive industry. The K-Means were combined with MULTIMOORA to improve the MCDA analyses [54,55].

3.2. MCDA Methods and Subjectivity
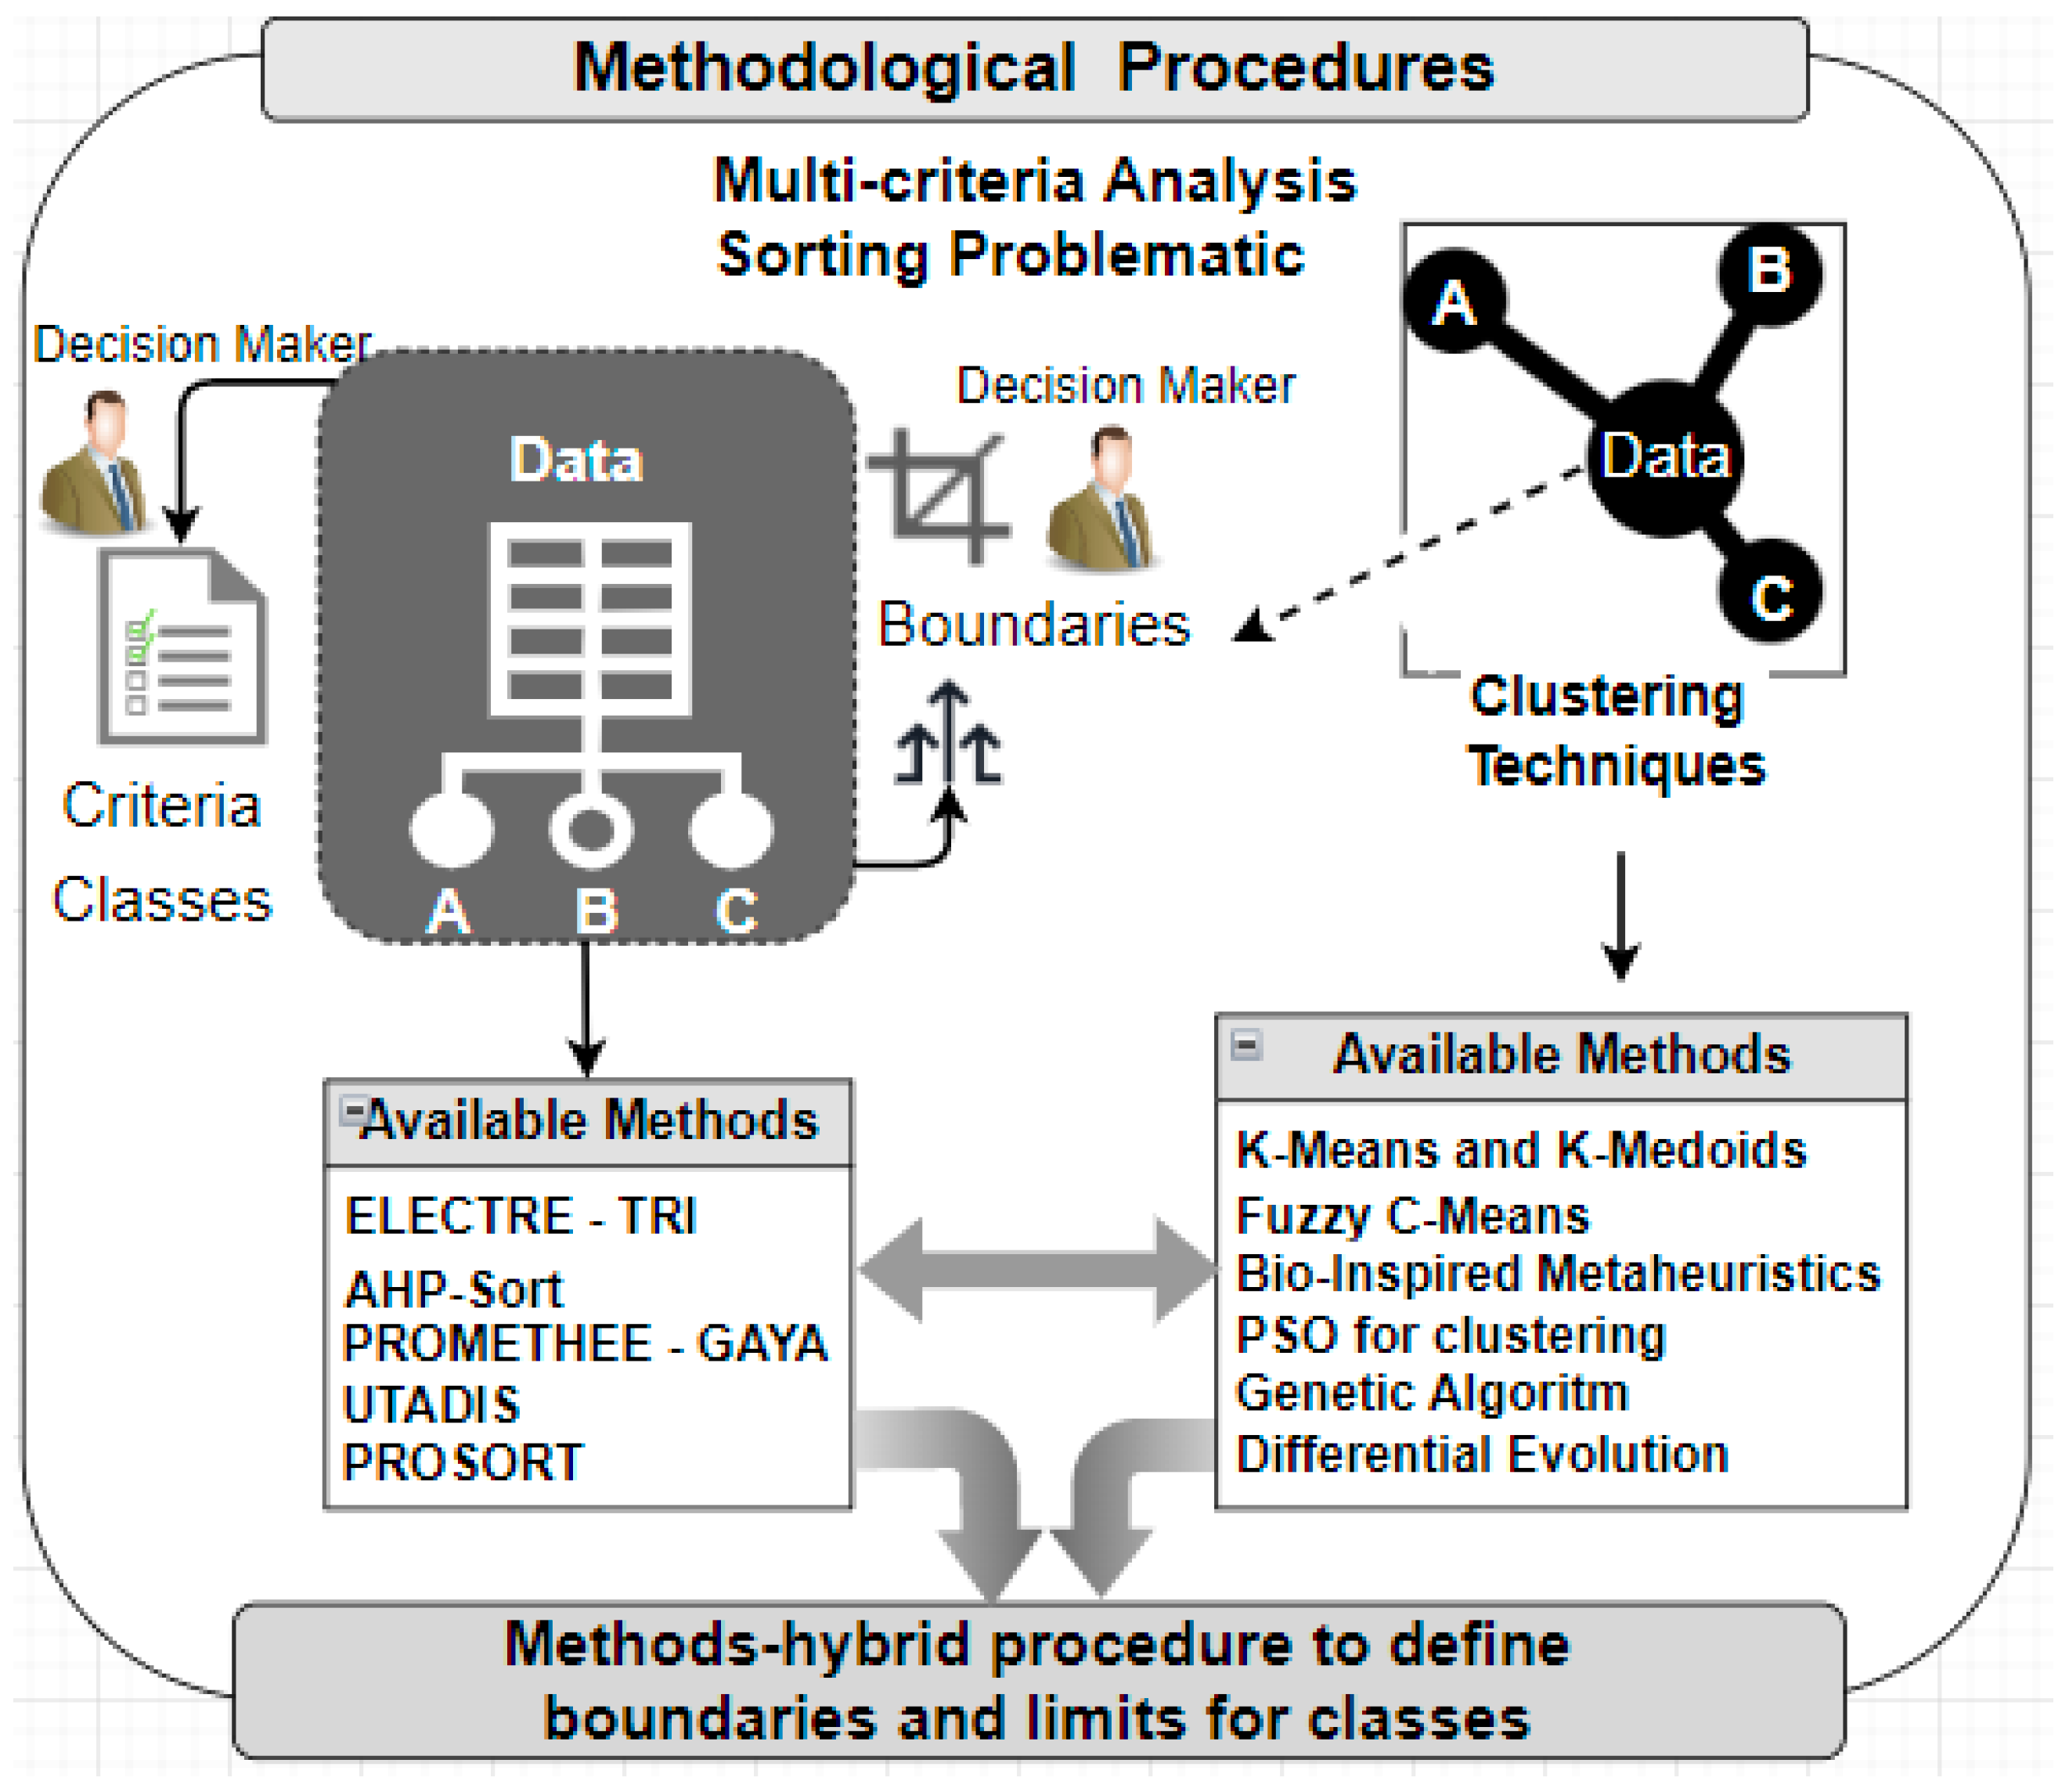
Most MCDA problems rely on decision-maker expertise to identify the best choice. Unfortunately, defining weights and parameters for a multi-criteria problem is difficult, especially in complex situations. The decision-makers’ judgments may directly affect the common choice [20,56]. Thus, it is essential to have a more systematic way to decide, avoiding the negative impacts and personal influences.
As the assignment of criteria consequences is critical to MCDA methods, several ways to define weights were proposed, from subjective to completely objective, besides combining both [57]. Many works show this concern. Ma et al. [58] proposed a two-objective programming model to consider both decision-makers’ emotional and analytical objective weights [46,59].
Entropy Modified Digital Logic (MDL), Criteria Importance through Inter-criteria Correlation (CRITIC), and two new methods were used to define the TOPSIS input weights. A hybrid fuzzy goal programming and Monte Carlo simulation were used to find Pareto-optimal solutions without depending on decision-maker subjective weights [60]. The simulation allows the fuzzy goal programming to find different solutions. Multi-attribute group decision-making that integrates objective and subjective weighting employs statistical variance, TOPSIS, Simple Additive Weighting (SAW), and Delphi-AHP [23,43,61]. The method incorporated weights of the attributes and decision-makers aiming for more accurate results.
Table 1 summarizes the main theoretical foundations related to this work. These works were selected by their relevance to this theme, the number of citations, and their connection to the developed approach.
However, we did not find efforts using clustering approaches in conjunction with ELECTRE TRI to define class boundaries. Therefore, in this paper, we propose using the clustering methods to help the ELECTRE TRI boundaries definition procedure support the decision process and reduce the doubtful subjectivity inherent to the decision-making process.

4. Methodology

This section describes the methods applied in this work to compare clustering techniques and the ELECTRE TRI method. Firstly, the results of an application involving water distribution networks are evaluated. A sorting experiment is conducted, prioritizing areas in categorized classes. The numerical application is detailed in Section 5. The primary information about the utilized methods is presented in Section 4.1 and Section 4.2. Figure 2 illustrates the methodological context giving an overview of the involved parameters for the sorting approach.

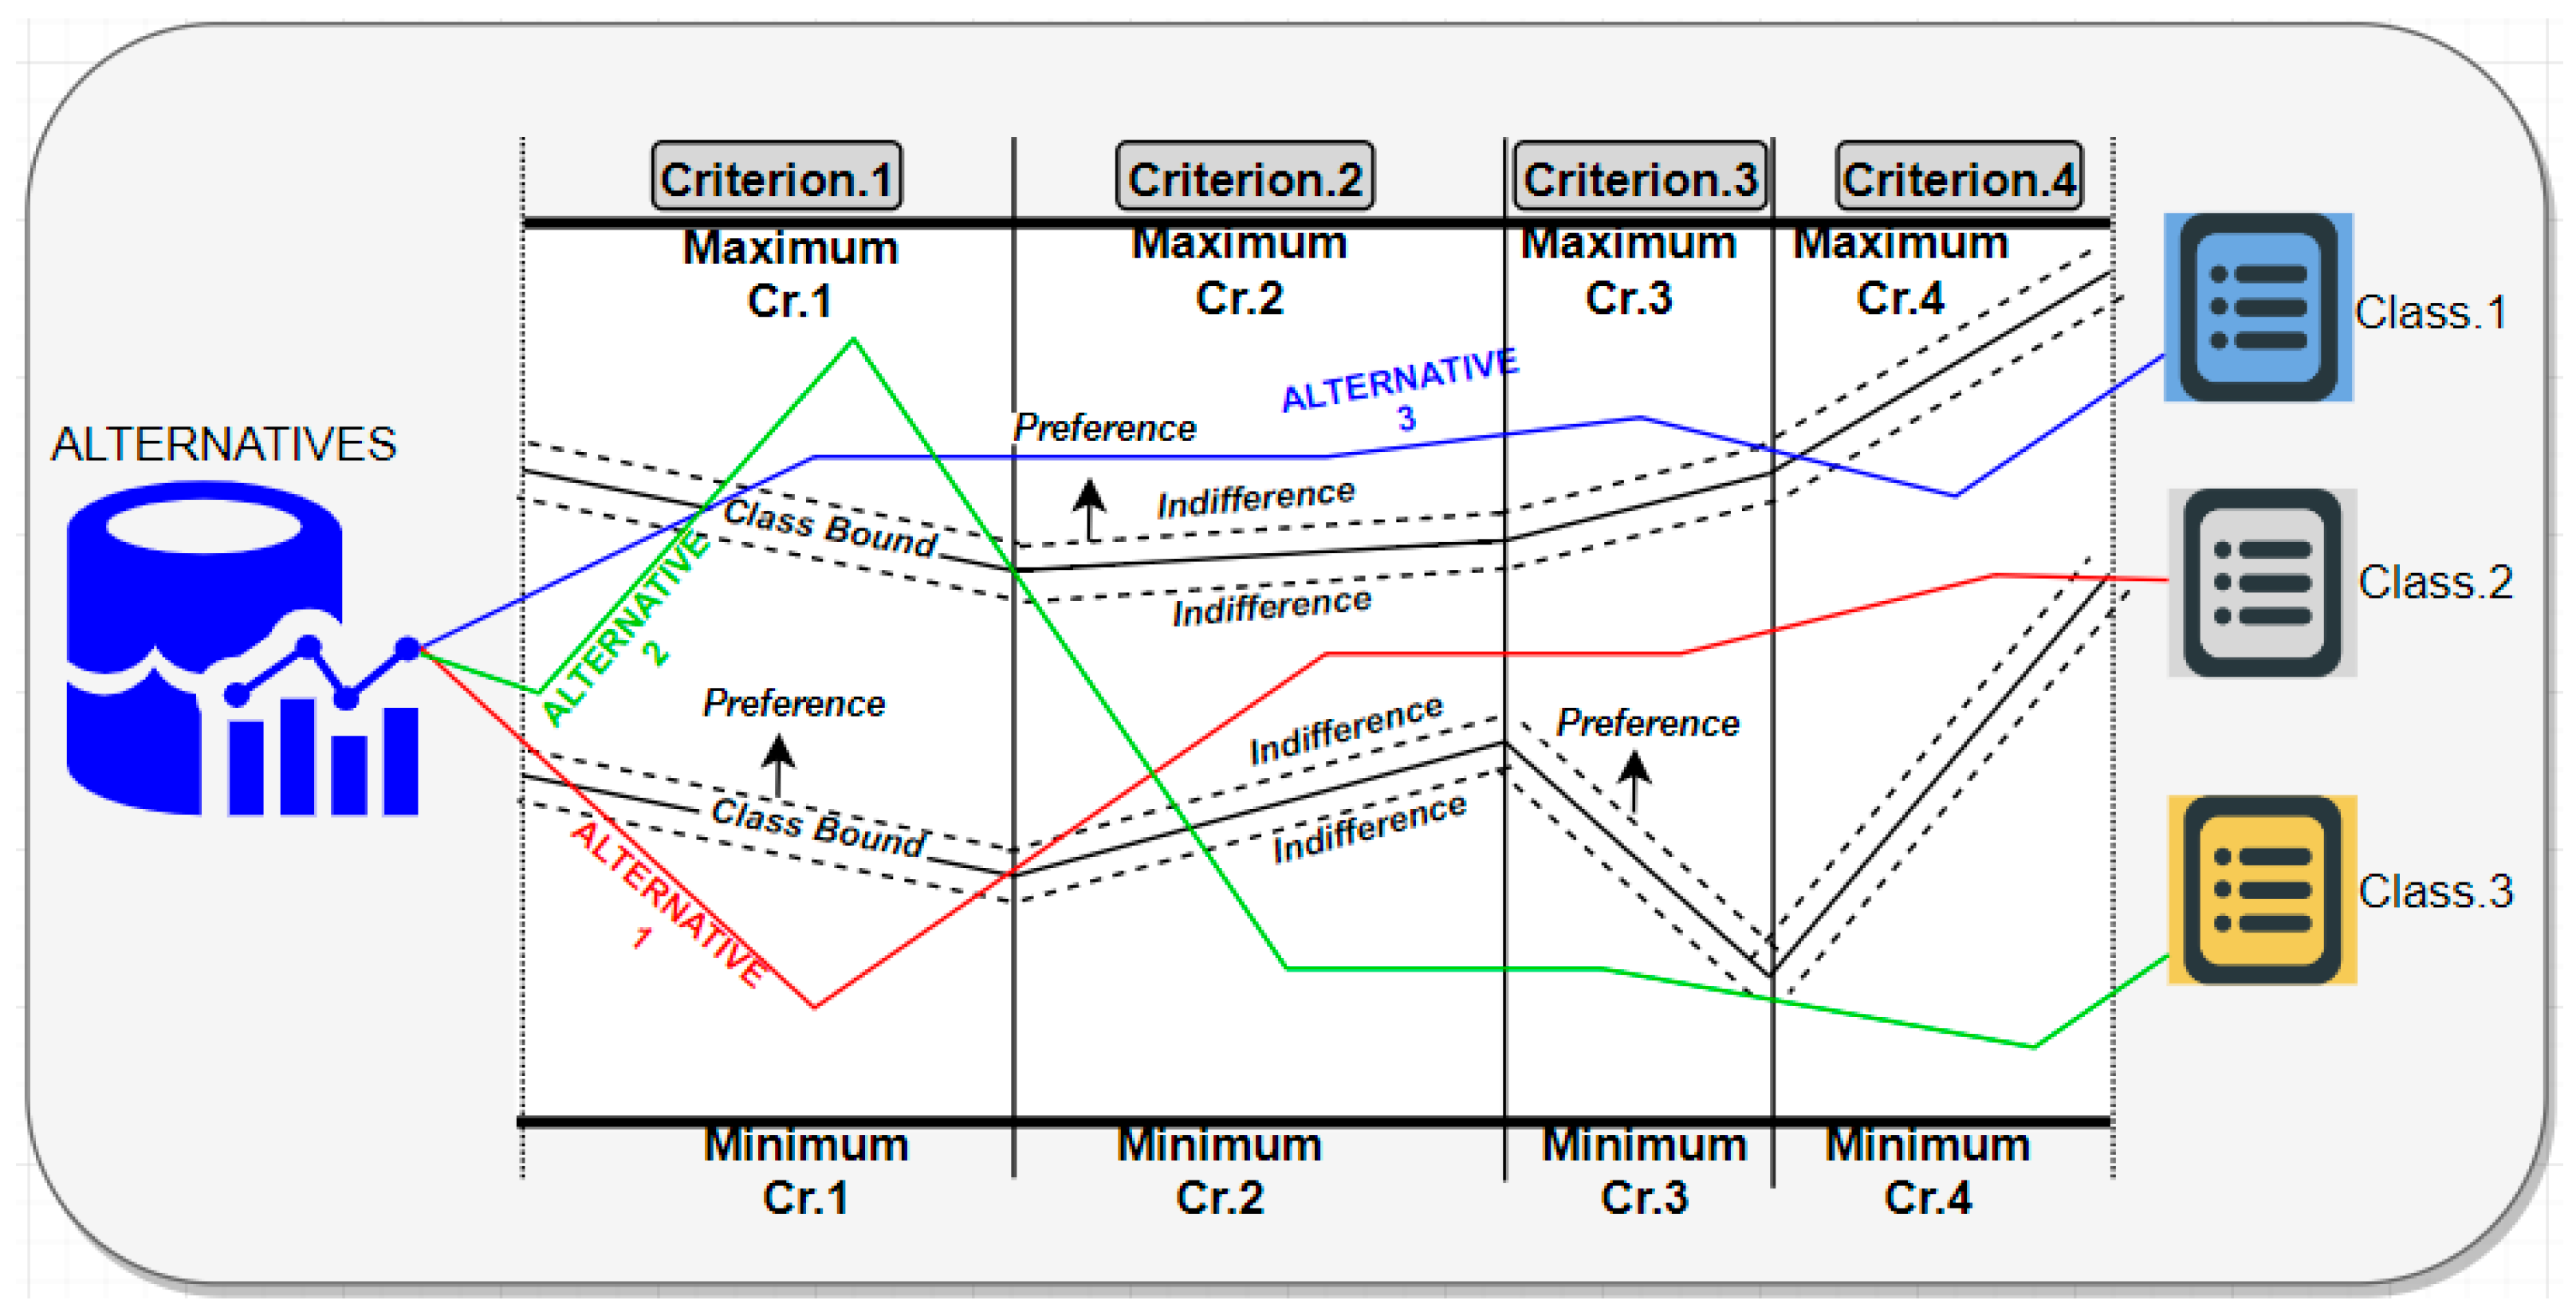
4.1. Multi-Criteria Outranking Sorting Method ELECTRE TRI

The ELECTRE TRI method is a multi-criteria outranking technique developed that allocates alternatives in predefined categories, called the sorting procedure. The allocation occurs when an option “x” is compared with defined profiles of the limits from the categories or boundaries bh. In this work, the multi-criteria outranking method ELECTRE TRI is applied as a base of comparison among clustering algorithms to search for an initial definition of boundaries for category profiles [28,63]. It uses the concordance and discordance indexes to evaluate the statement xSbh (“x outranks bh”). The partial concordance cj (x, b), concordance c (x, b), and partial discordance dj (x, b) are calculated by the expressions (1), (2), and (3) below:
c j ( x , b h ) = { 0   i f g j ( b h ) g j ( x ) p j ( b h ) 1   i f g j ( b h ) g j ( x ) q j ( b h ) p j ( b h ) + g j ( x ) g j ( b h ) p j ( b h ) q j ( b h ) , otherwise
where
c ( x , b ) = j F k j c j ( x , b h ) j F k j
where
d j ( x , b h ) = { 0 1 i f i f [ 0 , 1 ] g j ( x ) g j ( b h ) + p j ( b h ) g j ( x ) > g j ( b h ) + v j ( b h ) , otherwise
Still, an index σ is calculated, being σ(x, bh) ∈ [0, 1] σ(bh, x), respectively, which represents a credibility degree of the assertion in which xSbh, xA, hB, as shown in Equation (4).
σ ( x , b h ) = c ( x , b h ) . j F 1 d j ( x , b h ) 1 c ( x , b h )
where: F _ _ = { j F : d j ( x , b h ) > c j ( x , b h ) }
Mousseau et al. [64] presented two assignment procedures: one pessimistic, which compares x with bi, to i = p, p − 1, …, 0, bh, starting with the first profile in which xSbh is the category CLh+1(x → CLh+1); and the optimist one, which compares x with bi, to i = 1, 2, …, p, bh, starting with the first profile, such that “bh is preferable to x” states that CLh for category (x → CLh).

4.2. Clustering Techniques

Section 1 mentions that the literature divides the central clustering approaches into partitional, overlapping, hierarchical, and graph-based [7,9,10,11]. The partitional process is the most used, and it is also the focus of the investigation conducted in this paper, together with the Fuzzy C-Means, as an overlapping method [9,58].
The partitional approach creates groups according to their similarities. It performs the clustering by inserting artificial points named centroids or centers, presenting the exact dimensions of the samples (features). Each centroid is the representative point of a respective group so that the samples belonging to the same group are represented by the nearest centroid [13,15]. Then, the task to be solved by a partitional algorithm is determined by using an iterative process to find the best location of the centroids, as shown in Figure 3.
Mathematically, let xi = [xi,1, xi,2, …, xi,D] the i-th object (samples), i = 1, …, N, each presenting D features. The clustering algorithms aim to allocate these N samples into K < N clusters, represented by the ck = [ck,1, ck,2, …, ck,D] centroids, k = 1, …, K. The most used metric to determine the distance (dist) of an object i to a centroid k is the Euclidean Distance, defined in Equation (5) [9]:
d i s t x i c k = x i c k 2 = d = 1 D x i , d c k , d 2
The following subsections present in detail the algorithms addressed in this investigation.

4.3. K-Means and K-Medoids

The K-Means is the most usual method for partitional clustering due to its simplicity and fast convergence [6,11,13,15]. The samples are separated into a predefined number of groups according to the final positions of the centroids.
The initialization randomly generates the centroids. Then, distances between them and objects are calculated by Equation (5). Each point is allocated to the cluster with the smallest space. After, the positions of the centroids are recalculated using Equation (6) [6]:
c k = 1 n k i = 1 n k x i k
where the number of patterns within a cluster k is nk.
This process is repeated until the stop criterion is reached as the number of epochs or a slight change in centroid position. The K-Means minimizes the Sum of Squared Error (SSW) given by Equation (7) [65]:
S S W = k = 1 K i = 1 n k d i s t 2 x i c k
Remarkably, the method is highly dependent on the initialization. As this process is random, it can lead to poor performance. Additionally, the K-Means need to work better with overlapping databases [9].
A way to minimize this disadvantage is to address the K-Medoids algorithm, similar to the K-Means. The difference between them is just the initialization: K-Means randomly chooses K patterns (samples) of the data set as the initial positions of the centers. It can contribute to a better initialization of the algorithm.

4.4. Bio-Inspired Metaheuristics

Bio-Inspired Metaheuristics have gained prominence in optimization in the last two decades due to their search capability [66]. As the name indicates, these methods were inspired by some aspects of the natural world, like Darwin’s Evolution Theory or the collective behavior of groups of animals [16,67].
Clustering optimization is the process in which the algorithms reduce the distance between the centroids and the data inside the cluster. These algorithms are populational since solutions are simultaneously maintained during the iterative search. In this case, each key is called an agent. Therefore, the approaches above are effective candidates to deal with this task [68,69].
In the most used codification scheme, an agent yp is a centroids vector. Therefore, it is a vector with K × D elements, which concatenates the spatial positions of the K centroids, as seen in Expression (8) [10,14]:
y p = C p = c 1,1 , c 1,2 , , c 1 , D , , c K , 1 , c K , 2 , , c K , D
This work addresses two leading evolutionary algorithms, Genetic Algorithm and Differential Evolution, and the essential swarm-based proposal, Particle Swarm Optimization (PSO).

4.5. PSO for Clustering

Kennedy and Eberhart developed Particle Swarm Optimization (PSO) in 1995 [70]. It is the first proposal and the most prominent swarm-inspired algorithm, with many applications in various fields, such as optimization and clustering [7,10].
The biological inspiration came from the social interactions of animals, like flocks of birds and schools of fish. Each candidate solution is named a particle, which moves in the search space according to its self-experience, pbesttp, and the collective experience gbestt.
Indeed, the first is the best position achieved by particle p during the iterative process, and the second is the best position of the entire swarm until iteration t. The candidate solutions present a performance index named fitness. These collective interactions create a complex behavior that allows the algorithm to optimize a cost function [15].
Assume a swarm a population of p = 1, 2, …, P particles. The agents move in the D dimensional space (cost function) according to Equation (9):
y p t + 1 = x p t + v p t + 1
in which t denotes the current iteration, yp = [yp,1, yi,2,, yp,D] is the position of an agent in the search space and vp = [vp,1, vp,2,, vp,D] is the velocity, updated using Equation (10) [65]:
v p t + 1 = ω v p t + c 1 r 1 p b e s t p t x p t + c 2 r 2 g b e s t t x p t
being ω the inertia weight, r1 and r2 are random vector values generated according to a uniform probability in the interval [0,1], and c1 and c2 are the cognitive and social coefficients, respectively.
Initialization of the swarm is performed by spreading the agents over the space according to a uniform random generation. The velocity is initiated with zero. Note that ω is below 1, and the speed is limited in the interval [−Vmax;+Vmin]. Finally, in clustering tasks, the fitness assignment is given by Equation (6): the closer the data are to the respective centroid, the better the fitness, or the smaller the SSW.

4.6. Genetic Algorithm for Clustering

The Genetic Algorithm (GA) is the primary evolutionary algorithm for optimization tasks. Darwin’s Theory of Evolution by natural selection is the inspiration for the method, which influences the agents (individuals or chromosomes) and the entire population [16].
The GA is a probabilistic and populational algorithm like the PSO. The initial individuals, candidate solutions, are randomly generated subjects to the search space constraints. In this case, each agent is represented according to Equation (8), and the vector elements are called genes. The genes compose the genotype of the individual [9,67].
As usual, a fitness value is assigned to them. However, unlike the PSO, the search is performed by creating new generations, which substitute the old ones. In this sense, the agents with higher fitness tend to survive and belong to the next generation or maintain their genetic load in the population via the offspring. The next step is selecting the individuals to pass through the genetic operators. This paper uses the roulette wheel scheme [16,65,67], and better fitness tends to be chosen.
Once individuals are chosen, the final steps apply the genetic operators: crossover, which performs a local search (exploitation), and mutation for global tracking (exploration). In this work, we perform the classic one-point crossover [65]. The first two individuals randomly selected by the roulette wheel (parents) change their genes, creating two new ones according to a probability PC. These will be in the next generation. This process is repeated until the number of individuals in the next generation equals the original. Note that some agents may be selected more than once. Finally, the mutation is applied to Pm genes of the population. We add a small value drawn using a normal distribution to the selected genes.
Again, in clustering problems, the agents are represented according to Equation (8), and the fitness is calculated by Equation (7) [65].

4.7. Differential Evolution for Clustering

Differential Evolution (DE) is an optimization method that follows similar principles of the Genetic Algorithm, inspiration, and genetic operators. The agents proposed by Storn and Prince in 1995 have named vectors generated similarly to the last two presented approaches [12]. Again, it is used in a population method that maintains a set of possible solutions at each iteration. However, the crossover and mutation are different from the GA: here, the vector difference is used to perform the search [12,65].
At the initialization process, some population agent is randomly selected and named target vector vi. Next, the first operation is the mutation generating a new vector yinew. This process follows Equation (11) [28]:
y i n e w = y i r 1 + F y i r 2 y i r 3
where r1, r2, r3 ∈ 1, 2, …, NP are the index of the other three agents randomly chosen, and F is a real number drawn in the interval [0, 2]. Note that Equation (11) performs a vector subtraction [65].
The next step is the crossover between the target vector and yinew. A new agent called trial vector ui is created according to Equation (12) [8]:
u i d = y i d n e w i f r d C R i = I i v i d i f r d > C R i I i
where d = 1, …, D is the current dimension (gene); rd is sorted using a uniform distribution in the interval [0, 1]; CR is defined by the user; and Ii ∈ 1, …, D is a randomly chosen index, which guarantees that the new vector will receive at least one gene from vid. Finally, the vector that remains in the population is selected by a greedy criterion (best fitness) between vi and ui.

4.8. Fuzzy C-Means

Fuzzy C-Means (FCM) is an overlapping clustering method, fast to converge and simple to implement [4,6,71]. The FCM is an excellent alternative to clustering tasks since it overcomes the disadvantages of K-Means and some partitioned methods.
Some good aspects of the method are that it works better with overlapping data and is less sensitive to initialization and noise. Therefore, it has been successfully applied in many tasks.
The main difference between the methods previously described is that the FCM does not generate a hard boundary for the clusters. Instead, the algorithm creates a membership matrix = μ i j i , j N , K . In this case, the inputs of this matrix are μij of each object i for the cluster j. Note that μ i j 0,1 , j = 1 K μ i j = 1 , and 0 < j = 1 K μ i j < N are given by Equation (13):
μ i j m = 1 k = 1 C x i c j 2 m 1 x i c k
where ∥.∥ is the norm, often the Euclidean distance from Equation (4), and m is the fuzziness parameter. Then, the cluster centers are updated according to Equation (14):
c j = i = 1 N μ i j m i = 1 N μ i j m
The FCM firstly updates the grade of membership μij for each object and center and then calculates the centers employing Equation (9) in each iteration. At the end of the process, the goal is to optimize the cost function given by Equation (15) [6]:
J m = i = 1 N j = 1 K μ i j m x i c j 2

4.9. Numerical Application

An application was performed to present an empirical analysis using data collected from a Brazilian city (Ponta Grossa—Parana state) located in the south of Brazil with 120 thousand water connections and approximately 320 thousand inhabitants. The data were based on the study published by [20], in which the ELECTRE TRI method was used in a real case to classify maintenance priorities in water distribution networks. This case study was chosen because it was conducted using threshold definitions from experts’ perceptions and datasets from an automated system with quantitative characteristics necessary to provide the integration and comparisons with clustering techniques. The study [20] was applied in the sanitation company of the cited city and provided real results, mainly because of the support from the automated system, without only subjective evaluations.
Urban growth and the emergence of new housing are conditions in urban water distribution systems and lead to mobilizing investment in infrastructure, necessary to accommodate it. Therefore, the level of investment allocated to each sectorial area will depend on the characteristics and priorities for these areas [72,73,74]. This infrastructure includes water pipes; fittings; reservoirs (placed strategically to ensure supply at critical moments); and measuring devices, such as control valves, flow meters, and pressure gauges. It needs an organized structure to be configured. One technique that can be used to manage development areas is ‘sectorization’. This is a categorization of flow measurements from macro systems into smaller domains and presents an alternative to the modeling problem. As some sanitation companies use automation systems in their water distribution systems, this contributes directly to water loss reduction and area measurement information that can be digitally collected to make new models for solving problems in this sector [20,75,76]. Trojan et al. [36] show strategies or means that could be adopted to achieve goals individually, and some alternatives should be considered that can achieve the expected results for the goals.

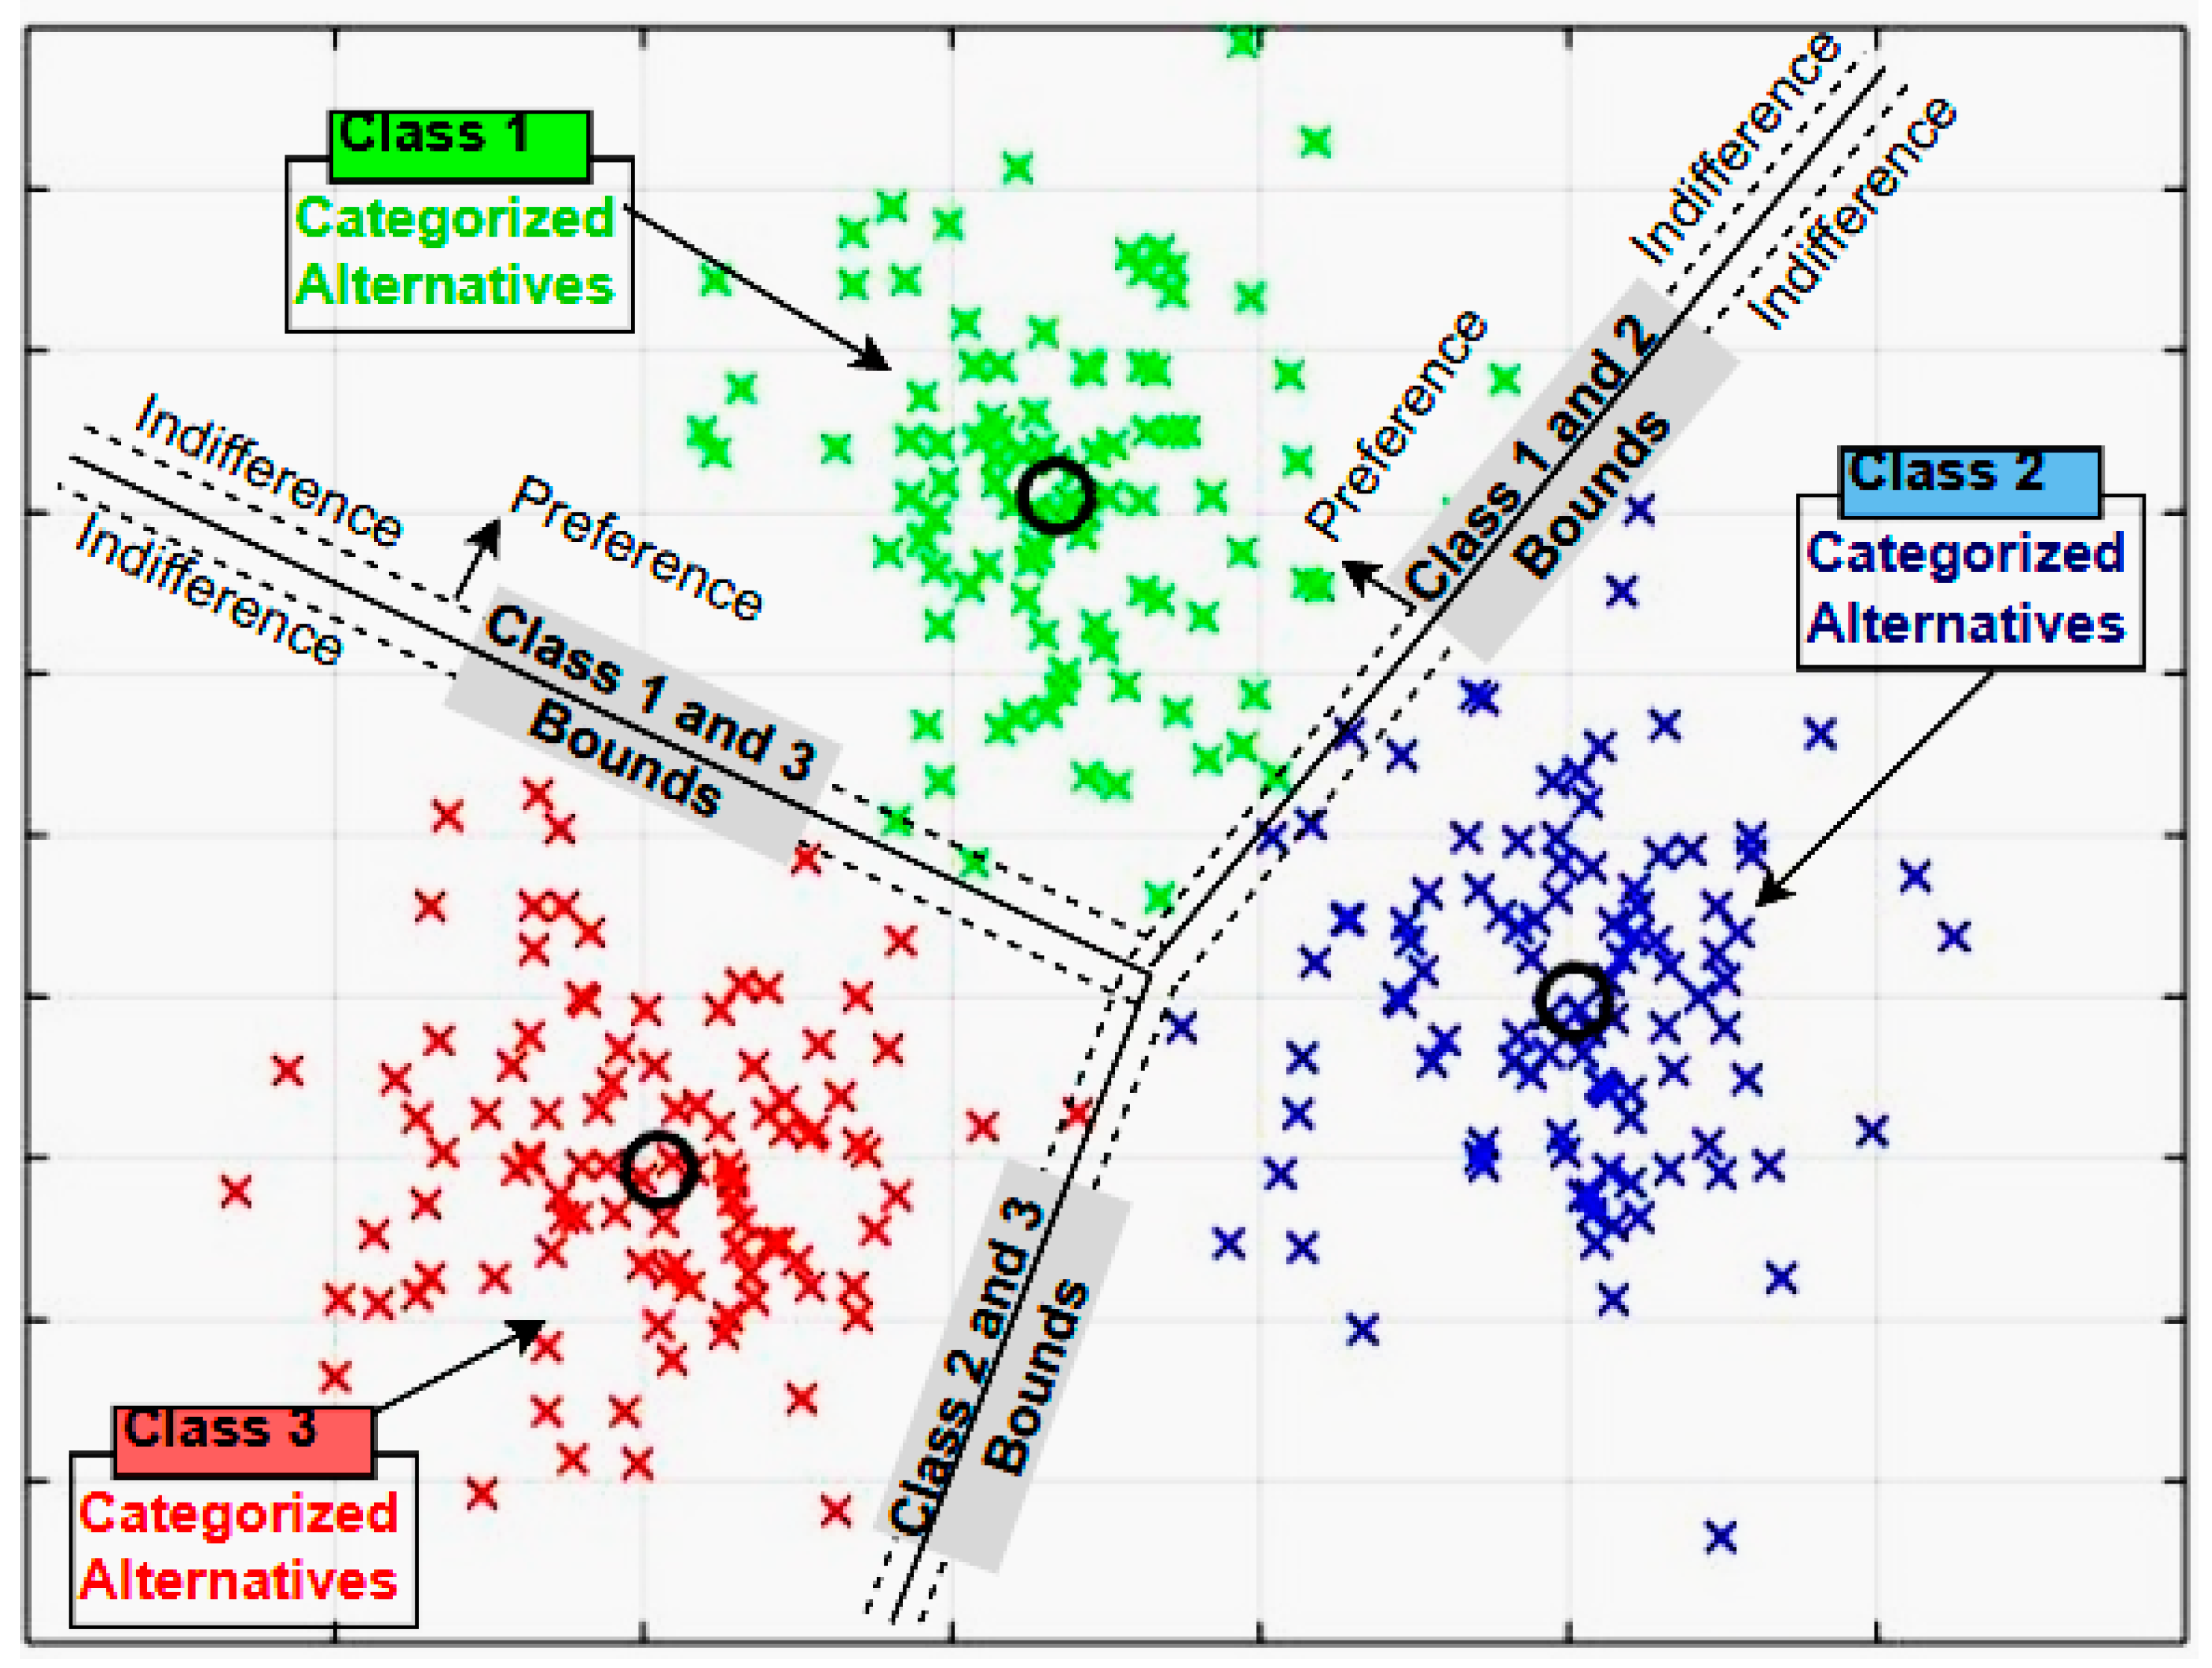
4.10. Sorting Areas into Three Categories

The first step to be considered is defining criteria close to the problem. Table 2 presents the adopted standards from the original application [20].
In multi-criteria applications, the definitions from decision-makers (experts) are typically performed for criteria, weightings, indifference and preference thresholds, and the definition of regional class boundaries. In this work, these parameters were adopted from [20] to compare the results with the clustering techniques used in experiments to define started values of boundaries for class profiles.
This was based on the dataset consolidated by the application, as shown in Table 3. Initially, Indifference and Preference thresholds equal to ‘zero’ were considered to compare the clustering results. After these proposed start values, the decision-makers could be invited to promote adjustments on these thresholds [77], as preconized in multi-criteria analysis.
Table 4 presents the original dataset extracted from [20] with the six criteria, four of which are defined as ‘benefit target’ and two as ‘cost target’. The two criteria of cost target were normalized and transformed to benefit the cluster application and to provide equal scales for comparisons with ELECTRE TRI results.
Then, three procedures were proposed to perform the cluster experiments, and all had the benefit target defined for every criterion [78,79].
The first one, shown in Table 5, considered a Normalized Weighted Dataset (Procedure 1). The original data were normalized on a scale of (0 to 100) and multiplied by their respective weights. Thus, the better value for the alternative is the exact value of the criterion weight, and the worst is equal to zero [80]. The procedure for normalizing criteria 1, 2, 4, 5, and 6 was the Linear Max–Min normalization method presented in Equations (16) and (17) [72].
n i j = r i j r j m i n r j m a x r j m i n f o r   b e n e f i t
n i j = r j m a x r i j r j m a x r j m i n f o r   c o s t
where nij is the normalized value; rij the alternatives i criteria j values; and rjmax and rjmin are the maximum and minimum criteria values, respectively. For criterion 3 [Water Losses (index %)], the normalization for the percentage was adopted as (100—rij).
The second procedure shown in Table 6 has adopted a Non-Normalized Weighted dataset (Procedure 2), in which the original data was multiplied by the weight in percentage. The cost targets were also normalized considering the formula n i j = 1 r i j for numerical data and (100—rij) for loss index percentages.
Table 7 presented the Original dataset Cost Normalized (Procedure 3), in which just the cost target for criteria 3 and 4 were normalized. The other data were considered equal to the original dataset.

5. Results and Discussion

In the ELECTRE TRI method, it is possible to utilize original data for just normalizing cost targets. So, Procedure 3 was used to make an experiment with a similar application of the ELECTRE TRI and compare it with clustering results. The other procedures were utilized for investigating the behavior between clustering techniques and original ELECTRE TRI border definitions. These procedures were adopted because they can change the experiments if considering the data direction, mainly in the clustering application.
First, the analyses and comparisons were performed based on the results presented in Figure 4, illustrating each technique with its respective procedure (1, 2, and 3). To do so, the following set of parameters was used:
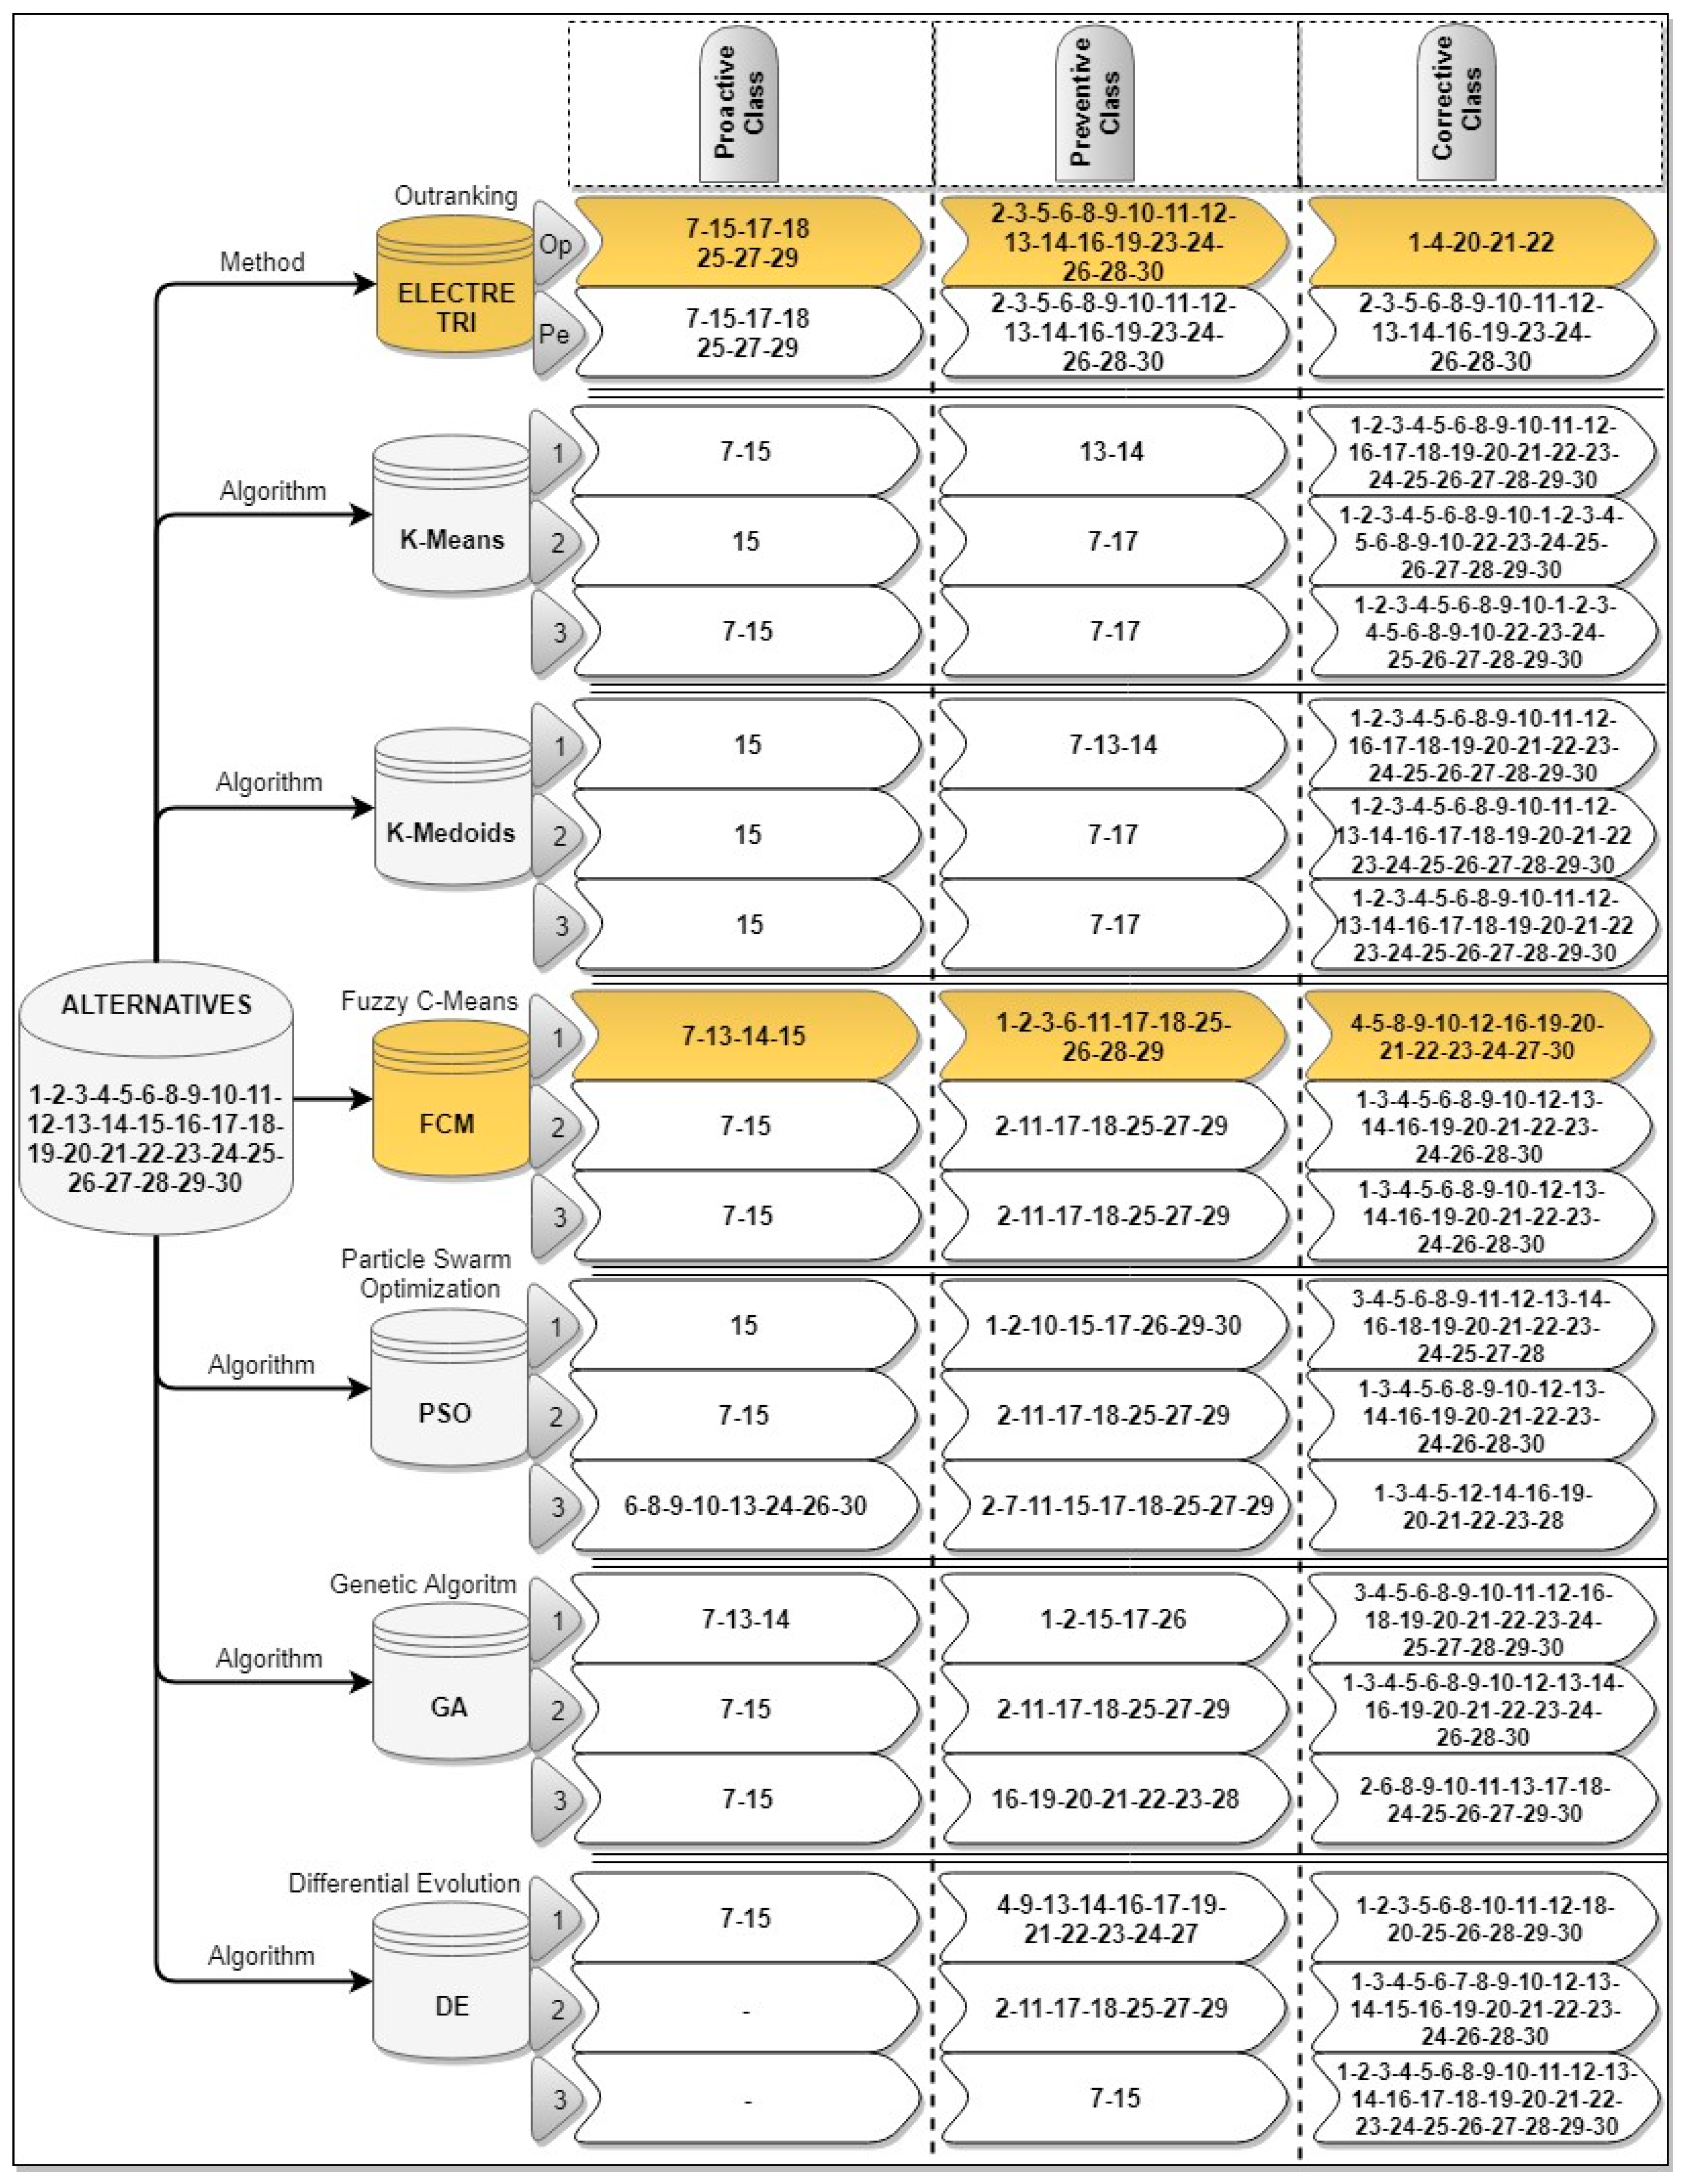
  • K-Means and K-Medoids: 100 independent runs;
  • PSO: population of 20 agents, 50 iterations, c1 = c2 = 2.05, ω with linear decay, 30 independent runs;
  • GA: population of 20 agents, 50 iterations, 80% of crossover probability, 30% of mutation probability, 30 independent runs;
  • DE: population of 20 agents, 50 iterations, 80% of crossover probability, F = 0.8, 30 independent runs;
  • FCM: 100 independent runs.
The algorithms were run several times until the smallest SSW was achieved since the final responses depend on the initialization.
Figure 5 illustrated the final results with original sorting from ELECTRE TRI, the FCM experiment, and the new results of the ELECTRE TRI application using the limits suggested by the results of FCM. It demonstrates that the FCM (Procedure 1) was able to capture the agreements of the data for the proposed categorizations.
In Table 8, the limit definition was calculated based on a middle value between classes in some criteria or based on a maximum value for other criteria, according to the target of the criteria. The calculations are detailed in the blue cells of Table 8.
According to the sorting experiments, the FCM—Procedure was considered to find each classes’ high and low limits. It was the most similar result found compared to the original application of the ELECTRE TRI method. An adjustment was necessary to delimitate a mean point between classes’ high and low limits. Thus, a medium point between these limits was considered to define the “a priori” boundaries. This adjustment was made based on the targets of each criterion. For example, criteria 3 and 4 were initially normalized as benefits, so the maximum reduction for losses and meters per connection is required. Table 8 presents the categorization (sorting) realized through the Fuzzy C-Means technique and the formulation for the adjustments to calculate each value for the limits of classes.
Table 9 presents the values of comparison between the original application from ELECTRE TRI, and the boundaries found with Fuzzy C-Means highlighted as (bn*) in Table 9.
In this application, the Fuzzy C-Means (FCM) results provided pre-defined boundaries to a new application of ELECTRE TRI with the limits defined with this technique based on the dataset. It is possible to state that the results after clustering applications were very similar to the original application with ELECTRE TRI. It is essential to highlight that the delimitation limits in the original application were performed by an elicitation (inference) process, which demands time and effort to understand the data behavior. It was performed by an intuitive process [20]. So, it is coherent to state that the results found in this application with cluster algorithms were satisfactory regarding promoting a start view for decision-makers about the class limits and thresholds.
An extra analysis with performance indicators for the utilized cluster algorithms was also realized. In Table 10, it is possible to learn a verification of these indicators. Even though FCM does not figure out the best performance, it has a Fuzzy procedure embedded in its concepts, which is closed with these basic application features.
Still, it is crucial to determine whether decision-makers can rearrange these definitions according to their preferences. The main objective of these experiments is to provide a good understanding and an initial starting point to follow with a more robust and time-reducing multiple-criteria sorting analysis.

6. Conclusions

The methodology and experiments developed in this work aimed to create a new methodology that helps in the pre-definition of boundaries (limits between classes) in multiple-criteria sorting problems using clustering techniques. It was initially performed with the elicitation of decision-makers in a sanitation company to solve the problem of sorting flow areas for investments and priorities for maintenance actions.
The proposed evaluation exploited six clustering techniques: K-Means, K-Medoids, Fuzzy C-Means, PSO for clustering, a Genetic Algorithm for clustering, and Differential Evolution. These algorithms were compared with the original application of ELECTRE TRI and provided a start view for limits of classes in this problem. In ELECTRE TRI or another sorting method, the decision-makers intuitively define these limits. However, commonly, they do not have an initial start or “north” to do this.
This work provided this overview contributing practically to support the decision process. The practical contributions may be highlighted as the opportunity offered to the decision-makers to analyze the limits between classes only by the data behavior when they do not feel comfortable defining it alone. In this sector, the experts had notarial knowledge to define these class limits; most sanitation companies’ cases did not have enough information to correctly define these class limits and thresholds. By applying this methodology, the decision-makers could not have much experience defining the initial limits for analysis.
Thus, this work also can contribute to the theory with a development that aggregates methodologies in the multi-criteria sorting analysis, widening the existing results and methods in the literature.
Some limitations, such as the existence of reliable datasets to support the clustering application and the definition of weights for criteria, still need expert understanding to do it coherently. A correct definition of these parameters can lead to biased results. Future works can be developed to generalize this methodology, like developments of this proposal considering several cases studies related to sanitation or electrical systems and sensitivity analysis to make improvements. In addition, further investigations on other clustering methods, such as self-organized maps and other bio-inspired metaheuristics, should be performed.

Author Contributions

Conceptualization, F.T. and H.V.S.; methodology, F.T. and H.V.S., M.A.M.; software, P.I.R.F., M.G. and F.T.; validation, L.B., M.A.M., P.S., R.F.D.F. and M.H.N.M.; formal analysis, M.A.M., R.F.D.F. and M.H.N.M.; investigation, F.T.; resources, M.A.M.; data curation, F.T.; writing—original draft preparation, F.T., P.I.R.F. and H.V.S.; writing—review and editing, M.G., L.B., M.A.M., P.S., R.F.D.F. and M.H.N.M.; visualization, M.H.N.M.; supervision, F.T. and M.A.M.; project administration, R.F.D.F. and M.H.N.M.; funding acquisition, M.H.N.M. All authors have read and agreed to the published version of the manuscript.

Funding

The authors thank the support of Brazilian agencies Coordination for the Improvement of Higher Education Personnel (CAPES)-Financing Code 001, Brazilian National Council for Scientific and Technological Development (CNPq), process number 315298/2020-0, and Araucaria Foundation, process number 51497.

Data Availability Statement

Not applicable.

Conflicts of Interest

The authors declare no conflict of interest.

References

  1. Safarzadeh, S.; Khansefid, S.; Rasti-Barzoki, M. A group multi-criteria decision-making based on best-worst method. Comput. Ind. Eng. 2018, 126, 111–121. [Google Scholar] [CrossRef]
  2. Rivero Gutiérrez, L.; De Vicente Oliva, M.A.; Romero-Ania, A. Managing sustainable urban public transport systems: An AHP multicriteria decision model. Sustainability 2021, 13, 4614. [Google Scholar] [CrossRef]
  3. Pala, O. A mixed-integer linear programming model for aggregating multi–criteria decision making methods. Decis. Mak. Appl. Manag. Eng. 2022, 5, 260–286. [Google Scholar] [CrossRef]
  4. Karaaslan, F.; Özlü, Ş. Correlation coefficients of dual type-2 hesitant fuzzy sets and their applications in clustering analysis. Int. J. Intell. Syst. 2020, 35, 1200–1229. [Google Scholar] [CrossRef]
  5. Romero-Ania, A.; Rivero Gutiérrez, L.; De Vicente Oliva, M.A. Multiple criteria decision analysis of sustainable urban public transport systems. Mathematics 2021, 9, 1844. [Google Scholar] [CrossRef]
  6. Macedo, M.; Figueiredo, E.; Soares, F.; Siqueira, H.; Maciel, A.; Gokhale, A.; Bastos-Filho, C. Clustering Students Based on Grammatical Errors for On-line Education. Learn. Nonlinear Model. 2018, 16, 26–40. [Google Scholar] [CrossRef]
  7. Nanda, S.J.; Panda, G. A survey on nature inspired metaheuristic algorithms for partitional clustering. Swarm Evol. Comput. 2014, 16, 1–18. [Google Scholar] [CrossRef]
  8. Hruschka, E.R.; Campello, R.J.; Freitas, A.A. A survey of evolutionary algorithms for clustering. IEEE Trans. Syst. Man Cybern. Part C Appl. Rev. 2009, 39, 133–155. [Google Scholar] [CrossRef] [Green Version]
  9. Alam, S.; Dobbie, G.; Koh, Y.S.; Riddle, P.; Rehman, S.U. Research on particle swarm optimization based clustering: A systematic review of literature and techniques. Swarm Evol. Comput. 2014, 17, 1–13. [Google Scholar] [CrossRef]
  10. Figueiredo, E.; Macedo, M.; Siqueira, H.V.; Santana, C.J., Jr.; Gokhale, A.; Bastos-Filho, C.J. Swarm intelligence for clustering—A systematic review with new perspectives on data mining. Eng. Appl. Artif. Intell. 2019, 82, 313–329. [Google Scholar] [CrossRef]
  11. Guerreiro, M.T.; Guerreiro, E.M.A.; Barchi, T.M.; Biluca, J.; Alves, T.A.; de Souza Tadano, Y.; Trojan, F.; Siqueira, H.V. Anomaly Detection in Automotive Industry Using Clustering Methods—A Case Study. Appl. Sci. 2021, 11, 9868. [Google Scholar] [CrossRef]
  12. Mukhopadhyay, A.; Maulik, U.; Bandyopadhyay, S. A survey of multiobjective evolutionary clustering. ACM Comput. Surv. CSUR 2015, 47, 1–46. [Google Scholar] [CrossRef]
  13. MacQueen, J. Some methods for classification and analysis of multivariate observations. In Proceedings of the Fifth Berkeley Symposium on Mathematical Statistics and Probability, Oakland, CA, USA; Statistical Laboratory of the University of California: Berkeley, CA, USA, 1967; Volume 1, pp. 281–297. [Google Scholar]
  14. Hancer, E.; Karaboga, D. A comprehensive survey of traditional, merge-split and evolutionary approaches proposed for determination of cluster number. Swarm Evol. Comput. 2017, 32, 49–67. [Google Scholar] [CrossRef]
  15. Van der Merwe, D.; Engelbrecht, A.P. Data clustering using particle swarm optimization. In Proceedings of the 2003 Congress on Evolutionary Computation, Canberra, Australia, 8–12 December 2003; Volume 1, pp. 215–220. [Google Scholar]
  16. Holland, J.H. Adaptation in Natural and Artificial Systems: An Introductory Analysis with Applications to Biology, Control, and Artificial Intelligence; MIT Press: Cambridge, MA, USA, 1992. [Google Scholar]
  17. Bäck, T.; Fogel, D.B.; Michalewicz, Z. Evolutionary Computation 1: Basic Algorithms and Operators; CRC Press: Boca Raton, FL, USA, 2018. [Google Scholar]
  18. De Souza Tadano, Y.; Siqueira, H.V.; Alves, T.A. Unorganized machines to predict hospital admissions for respiratory diseases. In Proceedings of the 2016 IEEE Latin American Conference on Computational Intelligence (LA-CCI), Cartagena, Colombia, 2–4 November 2016; pp. 1–6. [Google Scholar]
  19. Kachba, Y.; Chiroli, D.M.d.G.; Belotti, J.T.; Antonini Alves, T.; de Souza Tadano, Y.; Siqueira, H. Artificial neural networks to estimate the influence of vehicular emission variables on morbidity and mortality in the largest metropolis in South America. Sustainability 2020, 12, 2621. [Google Scholar] [CrossRef] [Green Version]
  20. Trojan, F.; Morais, D.C. Maintenance management decision model for reduction of losses in water distribution networks. Water Resour. Manag. 2015, 29, 3459–3479. [Google Scholar] [CrossRef]
  21. Thesari, S.S.; Trojan, F.; Batistus, D.R. A decision model for municipal resources management. Manag. Decis. 2019, 57, 3015–3034. [Google Scholar] [CrossRef]
  22. Ma, L.C. A two-phase case-based distance approach for multiple-group classification problems. Comput. Ind. Eng. 2012, 63, 89–97. [Google Scholar] [CrossRef]
  23. Keeney, R.; Raiffa, H. Decisions with Multiple Objectives: Preferences and Value Tradeoffs; John Wiley & Sons: New York, NY, USA, 1976. [Google Scholar]
  24. De Almeida, A.T.; de Almeida, J.A.; Costa, A.P.C.S.; de Almeida-Filho, A.T. A new method for elicitation of criteria weights in additive models: Flexible and interactive tradeoff. Eur. J. Oper. Res. 2016, 250, 179–191. [Google Scholar] [CrossRef]
  25. Goodwin, P.; Wright, G. Book Selection-Decision Analysis for Management Judgement (2nd Ed.). J. Oper. Res. Soc. 1998, 49, 1107. [Google Scholar]
  26. Bana e Costa, C.A.; Vansnick, J.C. Applications of the MACBETH approach in the framework of an additive aggregation model. J. Multi-Criteria Decis. Anal. 1997, 6, 107–114. [Google Scholar] [CrossRef]
  27. Saaty, T.L. Decision making with the analytic hierarchy process. Int. J. Serv. Sci. 2008, 1, 83–98. [Google Scholar] [CrossRef]
  28. Mousseau, V.; Slowinski, R. Inferring an ELECTRE TRI model from assignment examples. J. Glob. Optim. 1998, 12, 157–174. [Google Scholar] [CrossRef]
  29. Ishizaka, A.; Pearman, C.; Nemery, P. AHPSort: An AHP-based method for sorting problems. Int. J. Prod. Res. 2012, 50, 4767–4784. [Google Scholar] [CrossRef] [Green Version]
  30. Ramezanian, R. Estimation of the profiles in posteriori ELECTRE TRI: A mathematical programming model. Comput. Ind. Eng. 2019, 128, 47–59. [Google Scholar] [CrossRef]
  31. Costa, A.S.; Govindan, K.; Figueira, J.R. Supplier classification in emerging economies using the ELECTRE TRI-nC method: A case study considering sustainability aspects. J. Clean. Prod. 2018, 201, 925–947. [Google Scholar] [CrossRef]
  32. Galo, N.R.; Calache, L.D.D.R.; Carpinetti, L.C.R. A group decision approach for supplier categorization based on hesitant fuzzy and ELECTRE TRI. Int. J. Prod. Econ. 2018, 202, 182–196. [Google Scholar] [CrossRef]
  33. Sánchez-Lozano, J.; García-Cascales, M.S.; Lamata, M.T. Comparative TOPSIS-ELECTRE TRI methods for optimal sites for photovoltaic solar farms. Case study in Spain. J. Clean. Prod. 2016, 127, 387–398. [Google Scholar] [CrossRef]
  34. Bernardo, H.; Gaspar, A.; Antunes, C.H. An application of a multi-criteria decision support system to assess energy performance of school buildings. Energy Procedia 2017, 122, 667–672. [Google Scholar] [CrossRef]
  35. Certa, A.; Enea, M.; Galante, G.M.; La Fata, C.M. ELECTRE TRI-based approach to the failure modes classification on the basis of risk parameters: An alternative to the risk priority number. Comput. Ind. Eng. 2017, 108, 100–110. [Google Scholar] [CrossRef]
  36. Trojan, F.; Morais, D.C. Prioritising alternatives for maintenance of water distribution networks: A group decision approach. Water SA 2012, 38, 555–564. [Google Scholar] [CrossRef] [Green Version]
  37. Koca, E.; Yaman, H.; Aktürk, M.S. Stochastic lot sizing problem with controllable processing times. Omega 2015, 53, 1–10. [Google Scholar] [CrossRef]
  38. Hashemi, S.S.; Hajiagha, S.H.R.; Zavadskas, E.K.; Mahdiraji, H.A. Multicriteria group decision making with ELECTRE III method based on interval-valued intuitionistic fuzzy information. Appl. Math. Model. 2016, 40, 1554–1564. [Google Scholar] [CrossRef]
  39. Wu, Y.; Zhang, J.; Yuan, J.; Geng, S.; Zhang, H. Study of decision framework of offshore wind power station site selection based on ELECTRE-III under intuitionistic fuzzy environment: A case of China. Energy Convers. Manag. 2016, 113, 66–81. [Google Scholar] [CrossRef]
  40. Rivero Gutiérrez, L.; De Vicente Oliva, M.A.; Romero-Ania, A. Economic, Ecological and Social Analysis Based on DEA and MCDA for the Management of the Madrid Urban Public Transportation System. Mathematics 2022, 10, 172. [Google Scholar] [CrossRef]
  41. Romero-Ania, A.; De Vicente Oliva, M.A.; Rivero Gutiérrez, L. Economic Evaluation of the Urban Road Public Transport System Efficiency Based on Data Envelopment Analysis. Appl. Sci. 2021, 12, 57. [Google Scholar] [CrossRef]
  42. Zak, J.; Kruszyn’ ski, M. Application of AHP and ELECTRE III/IV methods to multiple level, multiple criteria evaluation of urban transportation projects. Transp. Res. Procedia 2015, 10, 820–830. [Google Scholar] [CrossRef] [Green Version]
  43. Zhou, M.; Liu, X.B.; Yang, J.B. Evidential reasoning-based nonlinear programming model for MCDA under fuzzy weights and utilities. Int. J. Intell. Syst. 2010, 25, 31–58. [Google Scholar] [CrossRef]
  44. Çali, S.; Balaman, Ş.Y. Improved decisions for marketing, supply and purchasing: Mining big data through an integration of sentiment analysis and intuitionistic fuzzy multi criteria assessment. Comput. Ind. Eng. 2019, 129, 315–332. [Google Scholar] [CrossRef]
  45. Aldouri, Y.K.; Al-Chalabi, H.; Zhang, L. Data clustering and imputing using a two-level multi-objective genetic algorithm (GA): A case study of maintenance cost data for tunnel fans. Cogent Eng. 2018, 5, 1513304. [Google Scholar] [CrossRef]
  46. Zhang, Y.; Liu, S.; Sun, S. Clustering and genetic algorithm based hybrid flowshop scheduling with multiple operations. Math. Probl. Eng. 2014, 2014, 167073. [Google Scholar] [CrossRef] [Green Version]
  47. Meirelles, G.; Brentan, B.; Izquierdo, J.; Ramos, H.; Luvizotto, E. Trunk network rehabilitation for resilience improvement and energy recovery in water distribution networks. Water 2018, 10, 693. [Google Scholar] [CrossRef]
  48. Zhou, K.; Yang, S.; Shao, Z. Household monthly electricity consumption pattern mining: A fuzzy clustering-based model and a case study. J. Clean. Prod. 2017, 141, 900–908. [Google Scholar] [CrossRef]
  49. Peng, P.; Addam, O.; Elzohbi, M.; Özyer, S.T.; Elhajj, A.; Gao, S.; Liu, Y.; Özyer, T.; Kaya, M.; Ridley, M.; et al. Reporting and analyzing alternative clustering solutions by employing multi-objective genetic algorithm and conducting experiments on cancer data. Knowl.-Based Syst. 2014, 56, 108–122. [Google Scholar] [CrossRef]
  50. Dhalmahapatra, K.; Shingade, R.; Mahajan, H.; Verma, A.; Maiti, J. Decision support system for safety improvement: An approach using multiple correspondence analysis, t-SNE algorithm and K-means clustering. Comput. Ind. Eng. 2019, 128, 277–289. [Google Scholar] [CrossRef]
  51. Berbel, J.; Rodriguez-Ocana, A. An MCDM approach to production analysis: An application to irrigated farms in Southern Spain. Eur. J. Oper. Res. 1998, 107, 108–118. [Google Scholar] [CrossRef]
  52. Gómez-Limón, J.A.; Riesgo, L. Irrigation water pricing: Differential impacts on irrigated farms. Agric. Econ. 2004, 31, 47–66. [Google Scholar] [CrossRef]
  53. Azadnia, A.H.; Ghadimi, P.; Saman, M.Z.M.; Wong, K.Y.; Sharif, S. Supplier selection: A hybrid approach using ELECTRE and fuzzy clustering. In Proceedings of the International Conference on Informatics Engineering and Information Science, Kuala Lumpur, Malaysia, 12–14 November 2011; pp. 663–676. [Google Scholar]
  54. Chen, T.Y. Multiple criteria decision analysis under complex uncertainty: A Pearson-like correlation-based Pythagorean fuzzy compromise approach. Int. J. Intell. Syst. 2019, 34, 114–151. [Google Scholar] [CrossRef] [Green Version]
  55. Maghsoodi, A.I.; Kavian, A.; Khalilzadeh, M.; Brauers, W.K. CLUS-MCDA: A novel framework based on cluster analysis and multiple criteria decision theory in a supplier selection problem. Comput. Ind. Eng. 2018, 118, 409–422. [Google Scholar] [CrossRef]
  56. Ortiz-Barrios, M.; Miranda-De la Hoz, C.; López-Meza, P.; Petrillo, A.; De Felice, F. A case of food supply chain management with AHP, DEMATEL, and TOPSIS. J. Multi-Criteria Decis. Anal. 2020, 27, 104–128. [Google Scholar] [CrossRef]
  57. Alemi-Ardakani, M.; Milani, A.S.; Yannacopoulos, S.; Shokouhi, G. On the effect of subjective, objective and combinative weighting in multiple criteria decision making: A case study on impact optimization of composites. Expert Syst. Appl. 2016, 46, 426–438. [Google Scholar] [CrossRef]
  58. Ma, J.; Fan, Z.P.; Huang, L.H. A subjective and objective integrated approach to determine attribute weights. Eur. J. Oper. Res. 1999, 112, 397–404. [Google Scholar] [CrossRef]
  59. Wang, T.C.; Lee, H.D. Developing a fuzzy TOPSIS approach based on subjective weights and objective weights. Expert Syst. Appl. 2009, 36, 8980–8985. [Google Scholar] [CrossRef]
  60. Moghaddam, K.S. Fuzzy multi-objective model for supplier selection and order allocation in reverse logistics systems under supply and demand uncertainty. Expert Syst. Appl. 2015, 42, 6237–6254. [Google Scholar] [CrossRef]
  61. Zhang, X.; Xu, Z. Extension of TOPSIS to multiple criteria decision making with Pythagorean fuzzy sets. Int. J. Intell. Syst. 2014, 29, 1061–1078. [Google Scholar] [CrossRef]
  62. Yildirim, B.F.; Yıldırım, S.K. Evaluating the satisfaction level of citizens in municipality services by using picture fuzzy VIKOR method: 2014–2019 period analysis. Decis. Mak. Appl. Manag. Eng. 2022, 5, 50–66. [Google Scholar] [CrossRef]
  63. Yu, W. ELECTRE TRI(Aspects Méthodologiques et Manuel D’utilisation); Document; Université de Paris-Dauphine, LAMSADE: Paris, France, 1992. [Google Scholar]
  64. Mousseau, V.; Figueira, J.; Naux, J.P. Using assignment examples to infer weights for ELECTRE TRI method: Some experimental results. Eur. J. Oper. Res. 2001, 130, 263–275. [Google Scholar] [CrossRef] [Green Version]
  65. José-García, A.; Gómez-Flores, W. Automatic clustering using nature-inspired metaheuristics: A survey. Appl. Soft Comput. 2016, 41, 192–213. [Google Scholar] [CrossRef]
  66. De Mattos Neto, P.S.; Firmino, P.R.A.; Siqueira, H.; Tadano, Y.S.; Antonini Alves, T.; de Oliveira, J.F.L.; Marinho, M.H.; Madeiro, F.A. Neural-based ensembles for particulate matter forecasting. IEEE Access 2021, 9, 14470–14490. [Google Scholar] [CrossRef]
  67. Tan, H.; Li, Z.; Wang, Q.; Mohamed, M.A. A novel forecast scenario-based robust energy management method for integrated rural energy systems with greenhouses. Appl. Energy 2023, 330, 120343. [Google Scholar] [CrossRef]
  68. Siqueira, H.; Boccato, L.; Attux, R.; Filho, C.L. Echo state networks for seasonal streamflow series forecasting. In Proceedings of the Intelligent Data Engineering and Automated Learning-IDEAL 2012: 13th International Conference, Natal, Brazil, 29–31 August 2012; Volume 13, pp. 226–236. [Google Scholar]
  69. Santos, P.; Macedo, M.; Figueiredo, E.; Santana, C.J.; Soares, F.; Siqueira, H.; Maciel, A.; Gokhale, A.; Bastos-Filho, C.J. Application of PSO-based clustering algorithms on educational databases. In Proceedings of the 2017 IEEE Latin American Conference on Computational Intelligence (LA-CCI), Arequipa, Peru, 8–10 November 2017; pp. 1–6. [Google Scholar]
  70. Dayalan, S.; Gul, S.S.; Rathinam, R.; Fernandez Savari, G.; Aleem, S.H.A.; Mohamed, M.A.; Ali, Z.M. Multi-Stage Incentive-Based Demand Response Using a Novel Stackelberg–Particle Swarm Optimization. Sustainability 2022, 14, 10985. [Google Scholar] [CrossRef]
  71. Ma, R.; Zeng, W.; Song, G.; Yin, Q.; Xu, Z. Pythagorean fuzzy C-means algorithm for image segmentation. Int. J. Intell. Syst. 2021, 36, 1223–1243. [Google Scholar] [CrossRef]
  72. Jahan, A.; Edwards, K.L. A state-of-the-art survey on the influence of normalization techniques in ranking: Improving the materials selection process in engineering design. Mater. Des. 2015, 65, 335–342. [Google Scholar] [CrossRef]
  73. Lizot, M.; Trojan, F.; Afonso, P. Combining Total Cost of Ownership and Multi-Criteria Decision Analysis to Improve Cost Management in Family Farming. Agriculture 2021, 11, 139. [Google Scholar] [CrossRef]
  74. Lizot, M.; Goffi, A.S.; Thesari, S.S.; Trojan, F.; Afonso, P.S.L.P.; Ferreira, P.F.V. Multi-criteria methodology for selection of wastewater treatment systems with economic, social, technical and environmental aspects. Environ. Dev. Sustain. 2021, 23, 9827–9851. [Google Scholar] [CrossRef]
  75. Oliveira Leme, M.; Trojan, F.; Francisco, A.C.; Paula Xavier, A.A. Digital Energy Management for Houses and Small Industries Based on a Low-cost Hardware. IEEE Lat. Am. Trans. 2016, 14, 4275–4278. [Google Scholar] [CrossRef]
  76. Wang, H.; Wang, B.; Luo, P.; Ma, F.; Zhou, Y.; Mohamed, M.A. State evaluation based-feature identification of measurement data for resilient power system. CSEE J. Power Energy Syst. 2021, 8, 983–992. [Google Scholar]
  77. Chen, J.; Li, X.; Mohamed, M.A.; Jin, T. An adaptive matrix pencil algorithm based-wavelet soft-threshold denoising for analysis of low frequency oscillation in power systems. IEEE Access 2020, 8, 7244–7255. [Google Scholar] [CrossRef]
  78. Alnowibet, K.; Annuk, A.; Dampage, U.; Mohamed, M.A. Effective energy management via false data detection scheme for the interconnected smart energy hub–microgrid system under stochastic framework. Sustainability 2021, 13, 11836. [Google Scholar] [CrossRef]
  79. Basílio, M.P.; Pereira, V.; Costa, H.G.; Santos, M.; Ghosh, A. A Systematic Review of the Applications of Multi-Criteria Decision Aid Methods (1977–2022). Electronics 2022, 11, 1720. [Google Scholar] [CrossRef]
  80. Mohamed, M.A. A relaxed consensus plus innovation based effective negotiation approach for energy cooperation between smart grid and microgrid. Energy 2022, 252, 123996. [Google Scholar] [CrossRef]
Figure 1. Sorting illustration of the ELECTRE TRI.
Energies 16 01936 g001
Figure 2. Methodological Context.
Energies 16 01936 g002
Figure 3. Partitional Clustering Procedure Illustration.
Energies 16 01936 g003
Figure 4. First Results and comparisons.
Energies 16 01936 g004
Figure 5. Results after clustering boundaries definition.
Energies 16 01936 g005
Table 1. Summarized theoretical foundations.
Reference YearApproach
Multi-criteria concepts and methods
[35]2017Classification of equipment failure models
[36]2012Procedure to prioritize alternatives for maintenance on water distribution networks
[37]2015Selection of clients who will receive a joint research loan
[32]2018Fuzzy methodology is used in conjunction with ELECTRE TRI
[38]2016Decisions based on interval-valued intuitionistic fuzzy information
[39]2016Power station site selection under intuitionistic fuzzy environment
[42]2015Evaluation of urban transportation projects.
[43]2010Evidential reasoning-based nonlinear programming model for MCDA
[44]2019A new decision support system for product classification problems that integrate multi-criteria decision-making
[56]2020Supply chain management with AHP, DEMATEL, and TOPSIS
[57]2016Subjective, objective, and combinative weighting in multiple criteria decision making
[58]1999Determination of attribute weights
[59]2009Fuzzy TOPSIS based on subjective and objective weights
[60]2015Supplier selection and order allocation in reverse logistics systems
[61]2014TOPSIS to multiple criteria decision making with Pythagorean fuzzy sets
[2]2021Managing Sustainable Urban Public Transport Systems: an AHP Multicriteria Decision Model
[5]2021Multiple Criteria Decision Analysis of Sustainable Urban Public Transport Systems
[40]2022Economic, Ecological, and Social Analysis Based on DEA and MCDA for the Management of the Madrid Urban Public Transportation System
[41]2022Economic Evaluation of the Urban Road Public Transport System Efficiency Based on Data Envelopment Analysis
[3]2022A mixed-integer linear programming model for aggregating multi–criteria decision-making methods
[62]2021Evaluating the satisfaction level of citizens in municipality services by using picture fuzzy VIKOR method: 2014 2019 period analysis
Clustering
[10]2019Swarm intelligence for clustering
[45]2018An investigation that used genetic algorithms and Fuzzy C-means for evaluations of maintenance costs
[46]2014Clustering with a genetic algorithm to perform the sequencing of an aircraft manufacturing industry with a flow shop environment with multiple operations
[47]2018K-Means method for energy recovery in water distribution networks
[48]2017Fuzzy C-Means clustering for evaluation of household monthly electricity consumption
[49]2014Decision support system using the t-SNE algorithm and K-Means clustering to improve security using multiple matching analyses
[50]2019Clustering and genetic algorithm to group characteristics of individuals with cancer
Clustering and MCDA combined
[51]1998Developed a technique based on clustering and goal programming to analyze the decision-making process in irrigated farms
[52]2004Combined Clustering analysis and Multi-Attribute Utility Theory (MAUT) to verify the impact of water pricing on farms
[53]2011Fuzzy C-Means and ELECTRE II were combined to supplier selection problems in the automotive industry
[54,55]2019K-Means was combined with MULTIMOORA to improve the MCDA analyses
Table 2. Criteria.
Table 2. Criteria.
Criteria
g1Number of connections (CN)
g2Measured Volume (MV)
g3Water Losses (WL)
g4Meters per connection (MC)
g5Population (POP)
g6Public Economies (PE)
Table 3. Parameters for the boundaries between classes (original application with criteria 3 and 4 changed to benefit).
Categories
/Classes
MaintenanceBordersCriteria
(CN)
g1
(MV)
g2
(WL)
g3
(MC)
g4
(POP)
g5
(PE)
g6
CL1Proactiveb1350037,00093.0027.0012,00015
CL2Preventive
b2190018,50086.0025.0080005
CL3Corrective
Weights23%10%20%15%12%20%
Direction of Preferences↑ up↑up↑up↑up↑up↑up
Ln → Classes; gn → Criteria; bn → Class Border.
Table 4. Original dataset.
BenefitBenefitCostCostBenefitBenefit
Weights23%10%20%15%12%20%
Areas (flow sectors)
an
Number of Connections
(index)
Measured
Volume
(index)
Water
Losses
(index)
Meters of Network
Per Connections
(index)
Population
(index)
Public
Economies
(index)
a188312,40441.5014.49303310
a2325557,72939.1815.8114,9605
a3185019,13029.6910.1964705
a4131016,81053.5513.3142672
a5119211,42537.248.9140592
a6278330,22036.9411.9810,2205
a714,375180,58555.2512.6248,44420
a8339732,93851.1110.0111,5746
a9262233,18265.2613.0588375
a10277935,79751.7711.3410,1605
a11328645,78439.6311.7011,7507
a12220820,38244.109.9376473
a13333335,47441.5010.5211,52120
a14268526,49938.9010.17925920
a1523,474302,94734.1312.3483,56310
a16183022,47266.4912.2462263
a17866792,68646.9410.7629,88710
a18512453,41632.7210.7617,2686
a19170519,25061.6811.2958815
a2086510,86446.3211.5330775
a21974915864.809.9932895
a22727748366.7610.3525203
a23184420,14154.0811.0963625
a24296134,72465.7011.8110,6043
a25458651,19739.3910.4415,7294
a26215636,34327.5216.7490744
a27452750,23474.8111.4515,5455
a28187623,15337.0712.0466234
a29465156,29652.4311.9816,2909
a30277433,14359.6011.9496688
Table 5. Normalized weighted dataset—Procedure 1.
BenefitBenefitBenefitBenefitBenefitBenefit
Weights23%10%20%15%12%20%
Areas (flow sectors)
an
Number of Connections
(index)
Measured
Volume
(index)
Water
Losses
(index)
Meters of Network
Per Connections
(index)
Population
(index)
Public
Economies
(index)
a10.160.1711.704.310.088.89
a22.561.7012.161.781.843.33
a31.140.3914.0612.550.583.33
a40.590.329.296.570.260.00
a50.470.1312.5515.000.230.00
a62.080.7712.619.121.143.33
a713.805.868.957.896.8020.00
a82.700.869.7812.891.344.44
a91.920.876.957.070.943.33
a102.070.969.6510.341.133.33
a112.591.3012.079.661.375.56
a121.500.4411.1813.050.761.11
a132.630.9511.7011.921.3320.00
a141.980.6412.2212.591.0020.00
a1523.0010.0013.178.4312.008.89
a161.120.516.708.620.551.11
a178.032.8810.6111.464.058.89
a184.451.5513.4611.462.184.44
a190.990.407.6610.440.503.33
a200.140.1110.749.980.083.33
a210.250.067.0412.930.113.33
a220.000.006.6512.240.001.11
a231.130.439.1810.820.573.33
a242.260.926.869.441.201.11
a253.901.4812.1212.071.962.22
a261.440.9814.500.000.972.22
a273.841.455.0410.131.933.33
a281.160.5312.599.000.612.22
a293.971.659.519.122.047.78
a302.070.878.089.201.066.67
Table 6. Non-Normalized weighted dataset—Procedure 2.
BenefitBenefitBenefitBenefitBenefitBenefit
Weights23%10%20%15%12%20%
Areas (flow sectors)
an
Number of ConnectionsMeasured
Volume
(m3/month)
Water
Losses
(%)
Meters of Network
Per Connections
(Index)
Population
(Inhabitants)
Public
Economies
(Number)
a12031240.458.50.069363.92.0
a27485772.960.80.0631795.21.0
a34251913.070.30.098776.41.0
a43011681.046.40.075512.00.4
a52741142.562.70.112487.00.4
a66403022.063.00.0831226.41.0
a7330618,058.544.70.0795813.24.0
a87813293.848.80.1001388.81.2
a96033318.234.70.0771060.41.0
a106393579.748.20.0881219.21.0
a117554578.460.30.0851410.01.4
a125072038.255.90.101917.60.6
a137663547.458.50.0951382.54.0
a146172649.961.10.0981111.04.0
a15539930,294.765.80.08110,027.52.0
a164202247.233.50.082747.10.6
a1719939268.653.00.0933586.42.0
a1811785341.667.20.0932072.11.2
a193921925.038.30.089705.71.0
a201981086.453.60.087369.21.0
a21224915.835.20.100394.61.0
a22167748.333.20.097302.40.6
a234242014.145.90.090763.41.0
a246813472.434.30.0851272.40.6
a2510545119.760.60.0961887.40.8
a264953634.372.40.0601088.80.8
a2710415023.425.10.0871865.41.0
a284312315.362.90.083794.70.8
a2910695629.647.50.0831954.81.8
a306383314.340.40.0841160.11.6
Table 7. Original dataset Cost Normalized—Procedure 3.
BenefitBenefitBenefitBenefitBenefitBenefit
Weights23%10%20%15%12%20%
Areas (flow sectors)
an
Number of ConnectionsMeasured
Volume
(m3/month)
Water
Losses
(%)
Meters of Network
Per Connections
(Index)
Population

(Inhabitants)
Public
Economies
(Number)
a188312,40458.5018.99303310
a2325557,72960.8217.6714,9605
a3185019,13070.3123.2964705
a4131016,81046.4520.1742672
a5119211,42562.7624.5740592
a6278330,22063.0621.5010,2205
a714,375180,58544.7520.8648,44420
a8339732,93848.8923.4711,5746
a9262233,18234.7420.4388375
a10277935,79748.2322.1410,1605
a11328645,78460.3721.7811,7507
a12220820,38255.9023.5576473
a13333335,47458.5022.9611,52120
a14268526,49961.1023.31925920
a1523,474302,94765.8721.1483,56310
a16183022,47233.5121.2462263
a17866792,68653.0622.7229,88710
a18512453,41667.2822.7217,2686
a19170519,25038.3222.1958815
a2086510,86453.6821.9530775
a21974915835.2023.4932895
a22727748333.2423.1325203
a23184420,14145.9222.3963625
a24296134,72434.3021.6710,6043
a25458651,19760.6123.0415,7294
a26215636,34372.4816.7490744
a27452750,23425.1922.0315,5455
a28187623,15362.9321.4466234
a29465156,29647.5721.5016,2909
a30277433,14340.4021.5496688
Table 8. Definition of limits after sorting by Clustering method—FCM—Procedure 1.
BenefitBenefitBenefitBenefitBenefitBenefit
Classes/LimitsanNumber of ConnectionsMeasured
Volume
(m3/month)
Water
Losses
(%)
Meters of Network
Per Connections
(m/connections)
Population

(Inhabitants)
Public
Economies
(Number)
High(Hi1)a1523,474302,94765.8712.3483,56310
Proactive
Class
a714,375180,58544.7512.6248,444Max20
a13333335,47458.5010.5211,521Energies 16 01936 i00320
Low(Lo1)a14Lo1 = 2685Lo1 = 26,49938.90Lo1 = 10.17925920
Limits for Preventive/
Proactive
L i m = H i 2 L o 1 2 + L o 1 L i m = H i 2 L o 1 2 + L o 1 = M a x L i m = H i 2 L o 1 2 + H i 2 L i m = H i 2 L o 1 2 + L o 1 = M a x
LIMIT VALUES(8667 − 2685/2) + 2685
= 5676
(92,686 − 26,499/2) + 26,499
= 59,592

= 72.48
(23.29 − 10.17/2) + 23.29
= 29.85
(29,887 − 9259/2) + 9259
= 19,573

= 20
High(Hi2)a17Hi2 = 8667Hi2 = 92,686Energies 16 01936 i00153.0610.76Hi2 =29,88710
Preventive
Class
a2325557,72960.8215.8114,9605
a29465156,29647.5711.9816,2909
a18512453,41667.2822.7217,2686
a25458651,19760.6123.0415,7294
a11328645,78460.3721.7811,7507
a26215636,343Max72.4816.7490744
a6278330,22063.0621.5010,2205
a28187623,15362.9321.446623Lo2 = 4
a3185019,13070.31Hi2 = 23.2964705
Low(Lo2)a1Lo2 = 883Lo2 = 12,40458.5018.99Lo2 = 303310
Limits for Corrective/
Preventive
L i m = H i 3 L o 2 2 + L o 2 L i m = H i 3 L o 2 2 + L o 2 L i m = M a x L i m = H i 3 L i m = H i 3 L o 2 2 + L o 2 H i 3 L o 2 2 + L o 2
LIMIT VALUES(4527 − 883/2) + 883
= 2705
(50,234 − 12,404/2) + 12,404
= 31,319

= 62.76

= 24.57
(15,545 − 3033/2) + 3033
= 9289
(8 − 4/2) + 4
= 6
High(Hi3)a27Hi3 = 4527Hi3 = 50,234Energies 16 01936 i00225.19Energies 16 01936 i00222.03Hi3 = 15,5455
Corrective
Class
a10277935,79748.2322.1410,1605
a24296134,72434.3021.6710,6043
a9262233,18234.7420.4388375
a30277433,14340.4021.549668Hi3 = 8
a8339732,93848.8923.4711,5746
a16183022,47233.5121.2462263
a12220820,38255.9023.5576473
a23184420,14145.9222.3963625
a19170519,25038.3222.1958815
a4131016,81046.4520.1742672
a5119211,425Max62.76Hi3 = 24.5740592
a2086510,86453.6821.9530775
a21974915835.2023.4932895
Low(Lo3)a22727748333.2423.132.5203
Table 9. Final Boundaries adopted defined by FCM Procedure 1.
Categories
/Classes
MaintenanceBordersCriteria
(CN)
g1
(MV)
g2
(WL)
g3
(MC)
g4
(POP)
g5
(PE)
g6
CL1Proactiveb1
b1*
3500
5676
37,000
59,592
93.00
72.48
27.00
29.85
12,000
19,573
15
20
CL2Preventive
b2
b2*
1900
2705
18,500
31,319
86.00
62.76
25.00
24.57
8000
9289
5
6
CL3Corrective
Table 10. Final Boundaries defined by FCM Procedure 1.
MethodAverage SSWAverage SSBAverage Silhouette
K-Means940.42106.430.65
K-Medoids945.20140.810.80
FCM630.5380.010.53
PSO145.7689.180.41
GA142.60102.160.58
DE145.07108.620.64
Disclaimer/Publisher’s Note: The statements, opinions and data contained in all publications are solely those of the individual author(s) and contributor(s) and not of MDPI and/or the editor(s). MDPI and/or the editor(s) disclaim responsibility for any injury to people or property resulting from any ideas, methods, instructions or products referred to in the content.

