
Anomaly Detection Algorithm for Photovoltaic Cells Based on Lightweight Multi-Channel Spatial Attention Mechanism
Abstract
:1. Introduction
- Integrating the convolutional block attention module (CBAM) into Faster R-CNN to modify the feature extraction part to assign greater weights to the features of photovoltaic cell defects, so that the network can better distinguish the target and background of crack defects in the image;
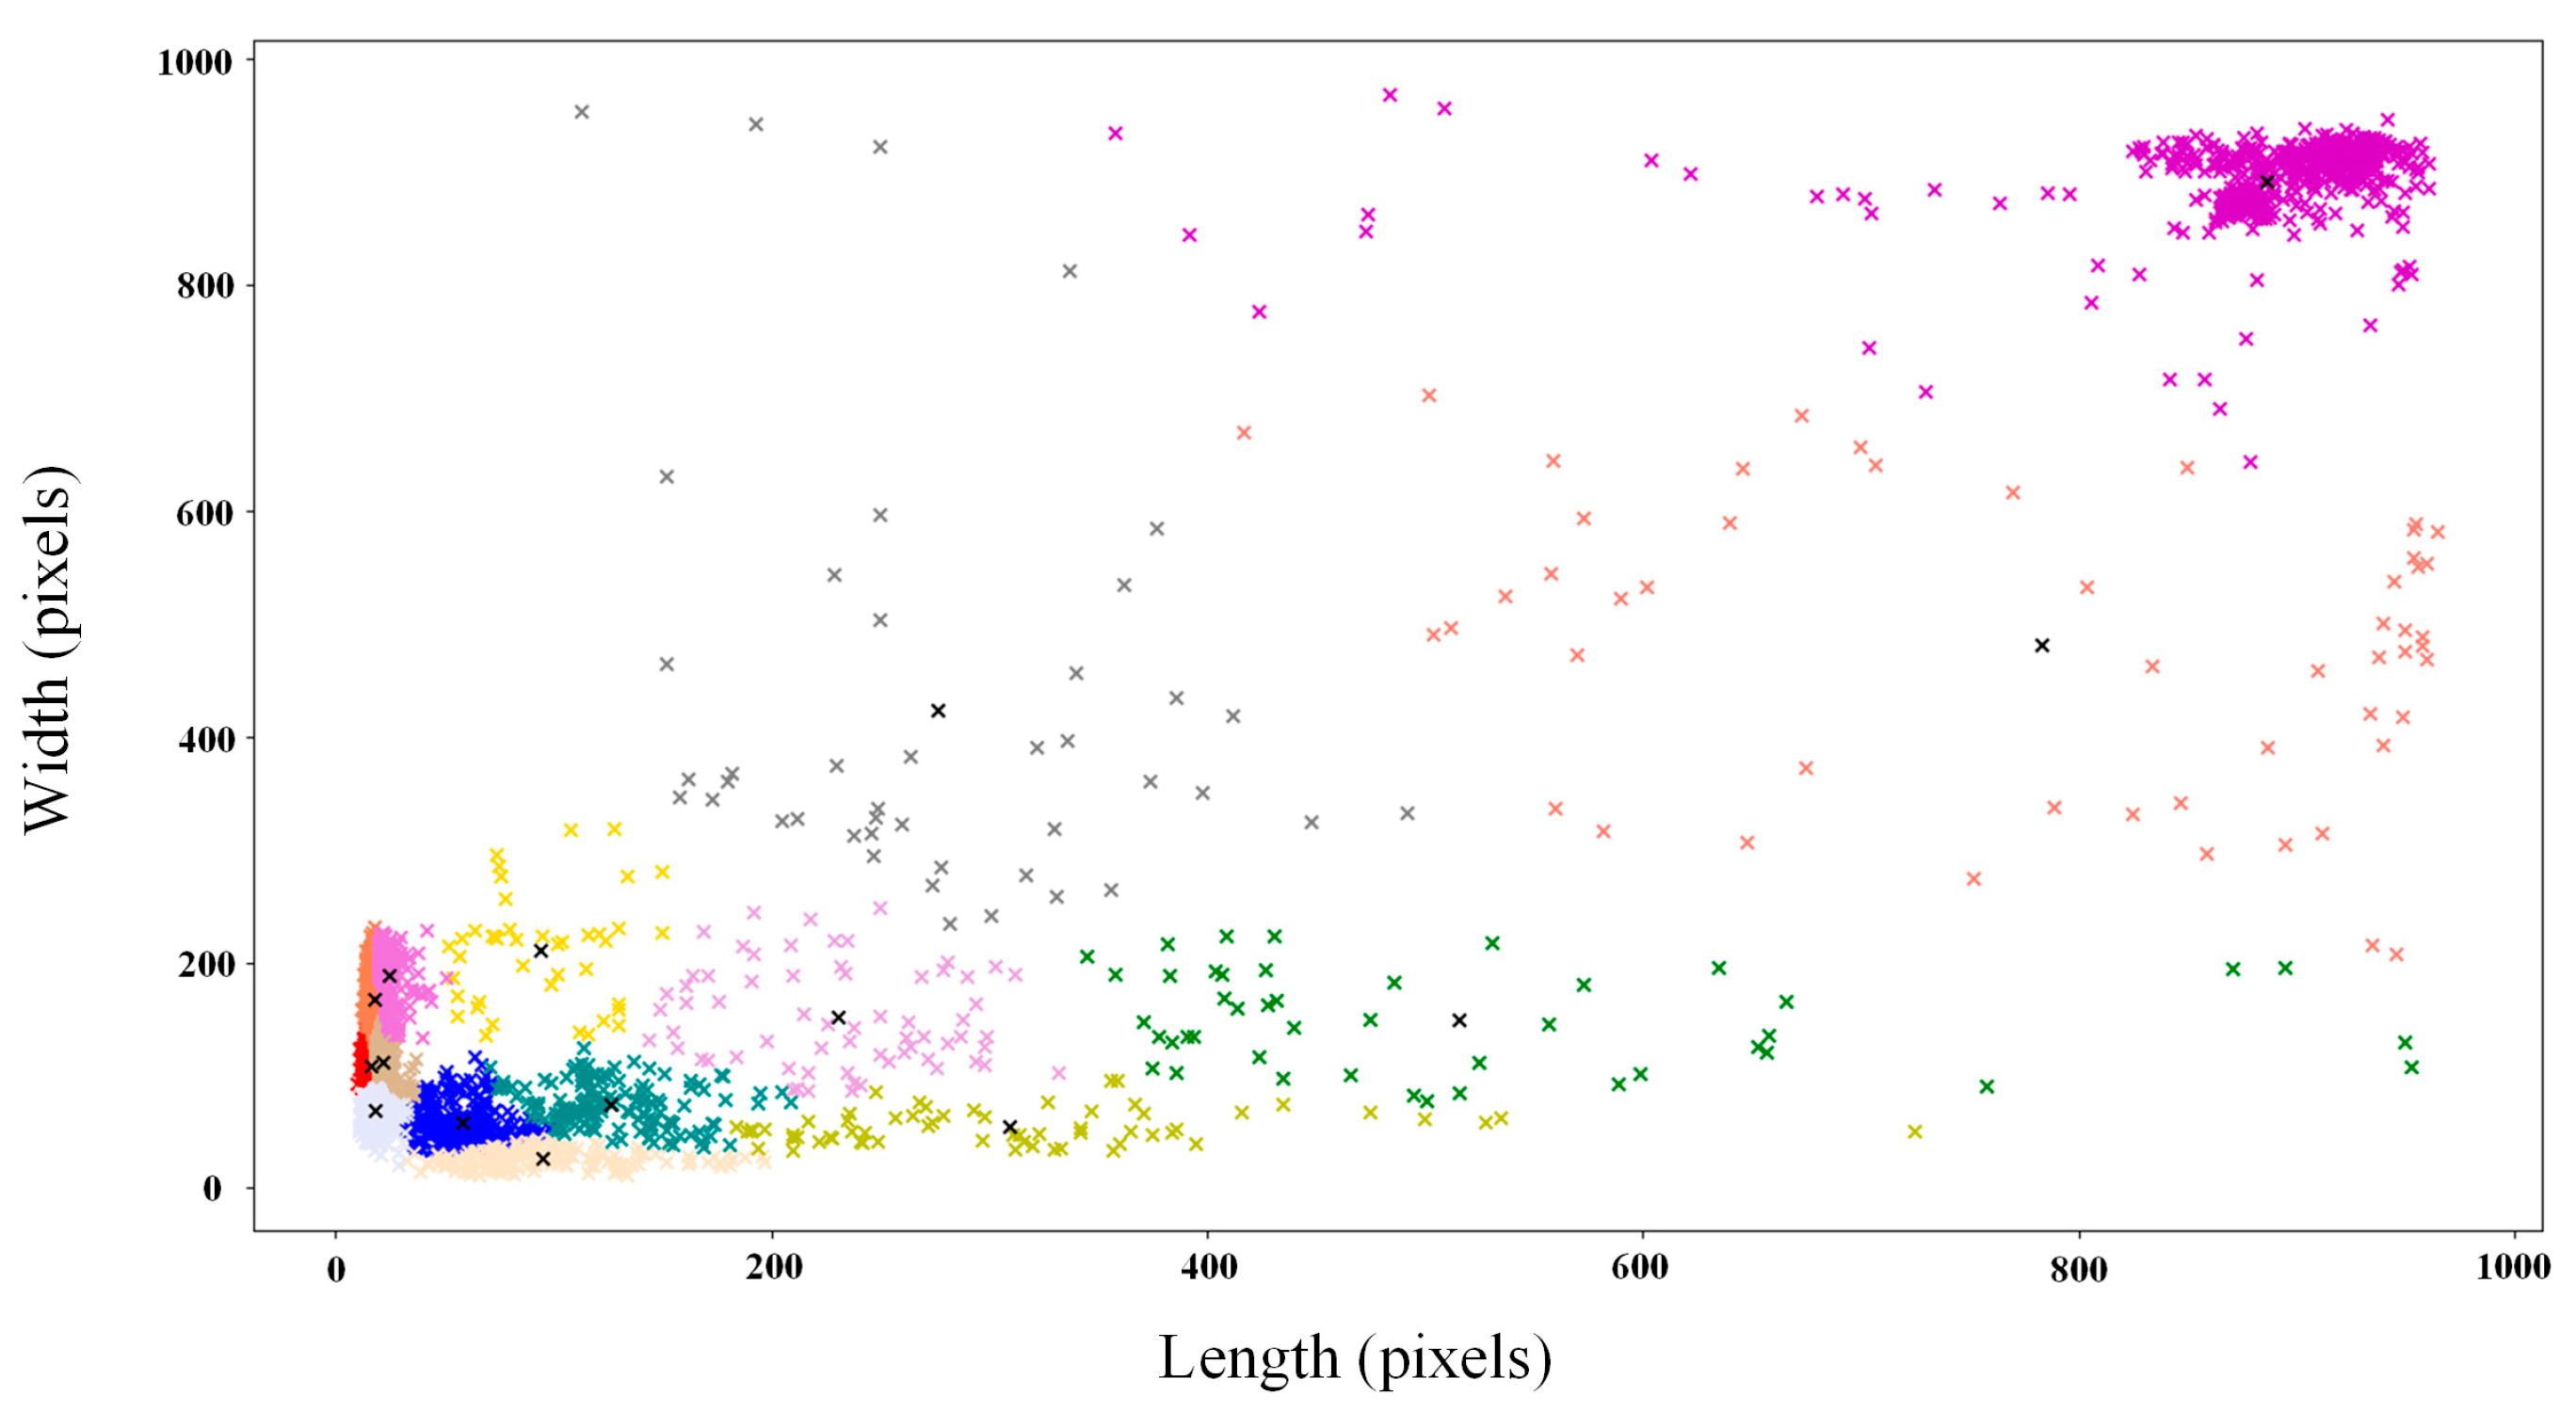
- The K-means clustering algorithm was used to train targeted anchors to cluster the width and height dimensions of the anchors for the three labeled defect boxes to be detected in the photovoltaic cell surface defect dataset, which made it easier for the detection network to learn accurate defect detection anchors, to improve detection accuracy;
- The traditional loss function was replaced by the calculation method of the DIoU loss function, and the normalized distance between the candidate frame and the target frame was directly minimized to achieve a faster convergence speed, so that the regression could overlap with the target frame for even more accuracy and speed when included.
2. Related Work
2.1. Introduction to Faster R-CNN
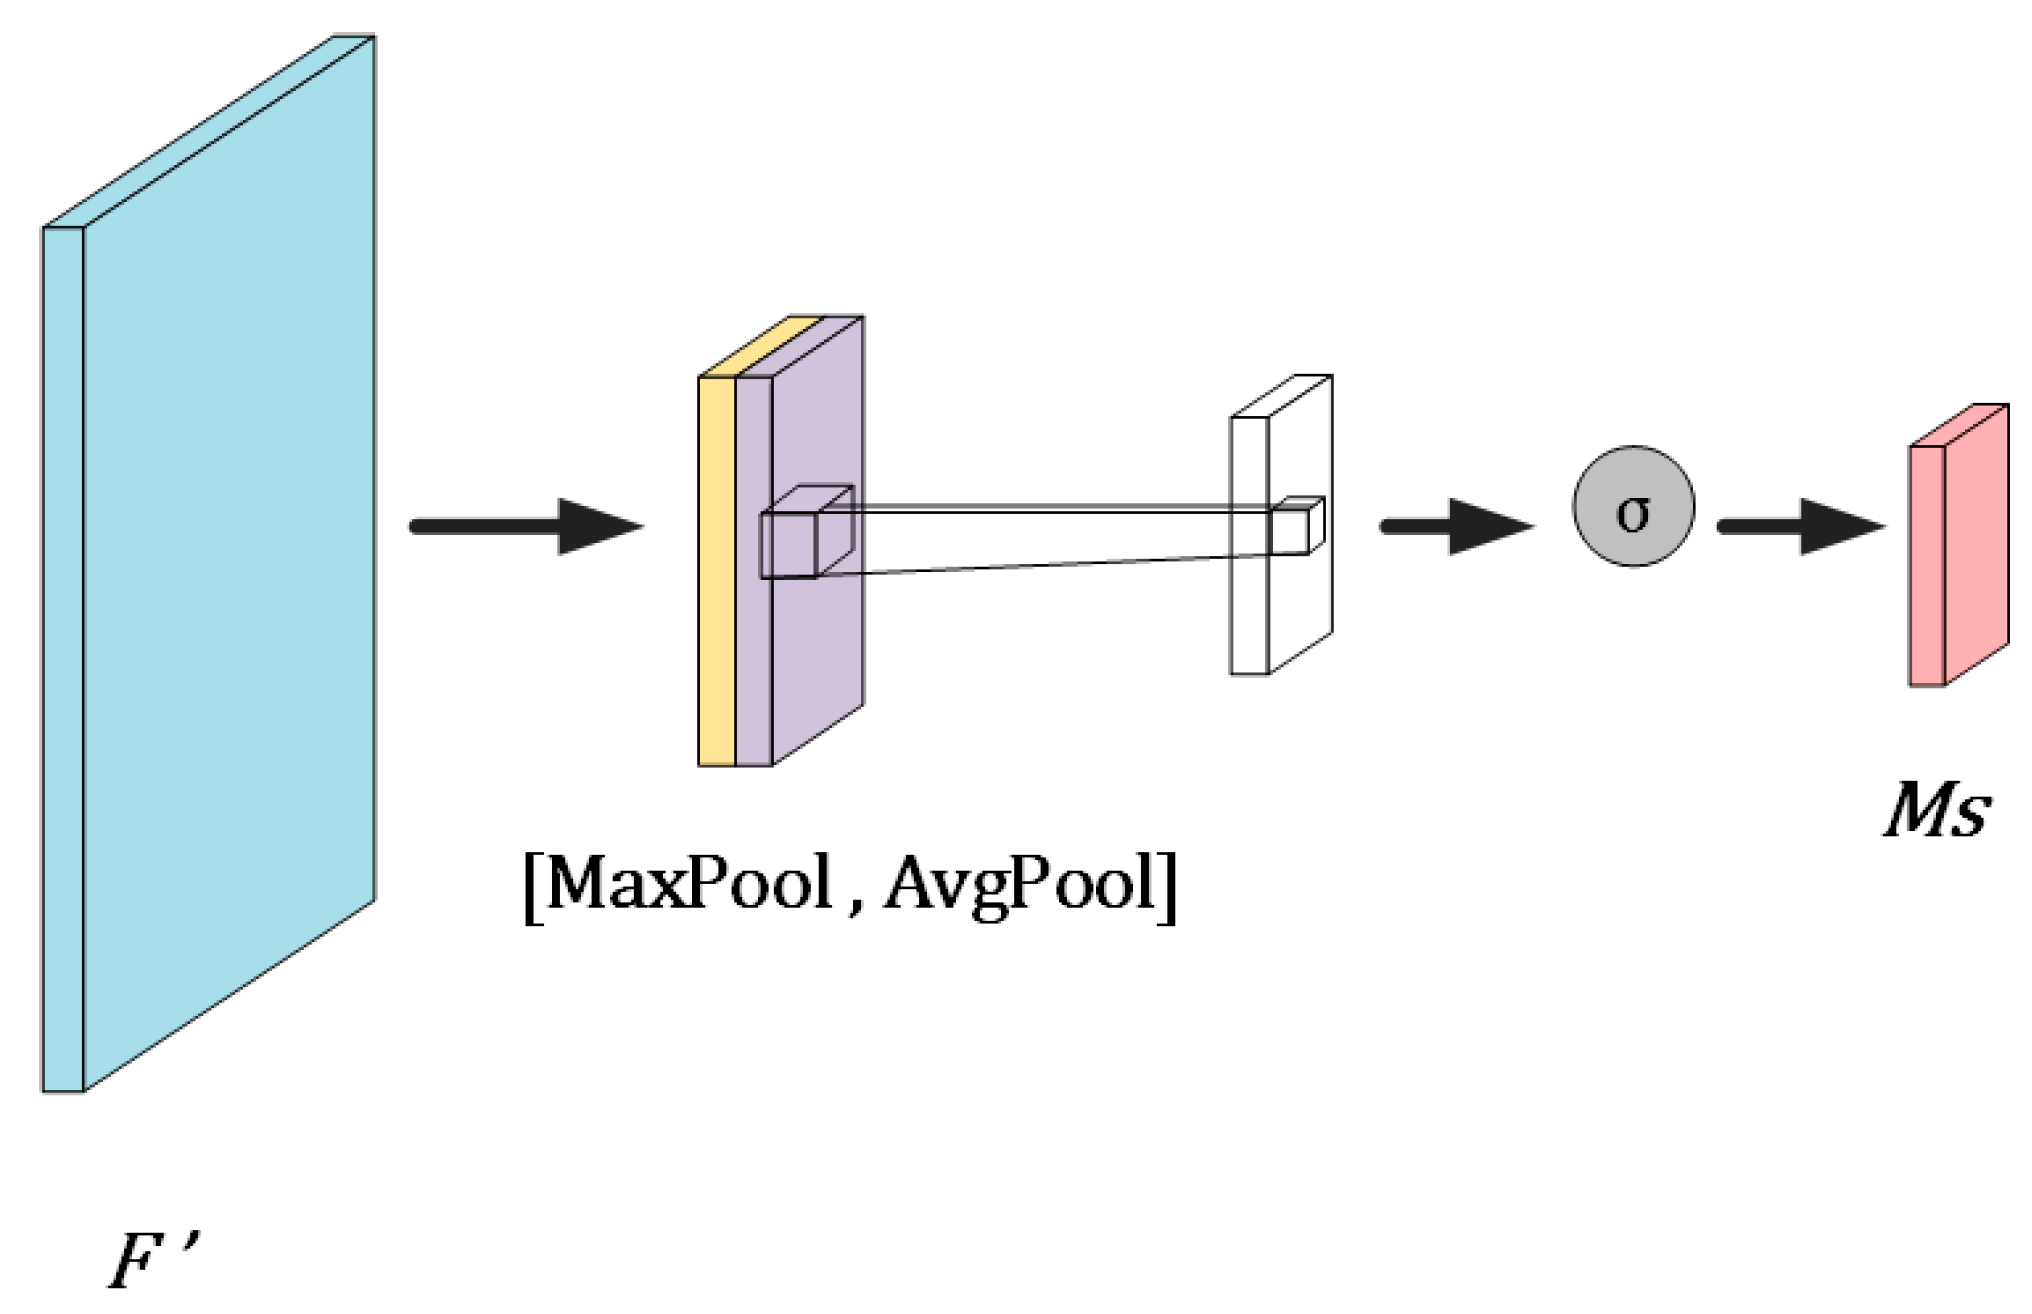
2.2. Convolutional Block Attention Mechanism
2.3. Clustering Algorithm K-Means
2.4. Loss Function
3. Research Method
3.1. Introduction of Feature Extraction Network with CBAM Structure
3.2. Anchor Box Scheme Generation Based on K-Means Clustering Algorithm
| Algorithm 1: Anchor frame clustering algorithm |
|
3.3. Loss Function Optimization
- Obtain the maximum value of at the upper left point and the minimum value of at the lower right point of the prediction frame and the target frame, find the difference and obtain the two sides of the intersection area, respectively, multiply them together and obtain the intersection value of the prediction frame and the target frame, as shown in Figure 8a;
- The area of the prediction frame and the target frame are summed and subtracted from the intersection value to the merged value of the prediction frame and the target frame;
- The can be obtained from the intersection and merge values;
- The square of the Euclidean distance between the two centroids is obtained by finding the centroid coordinates of the prediction frame and the target frame from their respective coordinates;
- The minimum value of at the upper left point and the maximum value of at the lower right point of the prediction frame and the target frame are obtained, the difference is found to obtain the two sides of the closed region, and the square of the diagonal distance of the closed region is obtained, as shown in Figure 8b;
- The loss value is obtained by Equations (7) and (8).
| Algorithm 2: DIoU loss function forward |
|
4. Experiments
4.1. Experimental Data and Experimental Setup
4.2. Ablation Experiments
4.3. Comparison of Different Target Detection Algorithms
5. Conclusions
Author Contributions
Funding
Data Availability Statement
Conflicts of Interest
References
- Ren, H.W.; Tian, K.G.; Hong, S.X.; Dong, B.Q.; Xing, F.; Qin, L. Visualized Investigation of Defect in Cementitious Materials with Electrical Resistance Tomography. Constr. Build. Mater. 2019, 196, 428–436. [Google Scholar] [CrossRef]
- Li, Y.B.; Liu, M.J. Aerial Image Classification Using Color Coherence Vectors and Rotation & Uniform Invariant LBP Descriptors. In Proceedings of the 2018 IEEE 3rd Advanced Information Technology, Electronic and Automation Control Conference (IAEAC), Chongqing, China, 12–14 October 2018; pp. 653–656. [Google Scholar]
- Wen, T.K.; Yin, C.C. Crack Detection in Photovoltaic Cells by Interferometric Analysis of Electronic Speckle Patterns. Sol. Energy Mater. Sol. Cells 2011, 98, 216–223. [Google Scholar] [CrossRef]
- Dhimish, M.; Holmes, V. Solar Cells Micro Crack Detection Technique Using State-of-the-Art Electroluminescence Imaging. J. Sci. Adv. Mater. Devices 2019, 4, 499–508. [Google Scholar] [CrossRef]
- Hu, C.F.; Wang, Y.X. An Efficient Convolutional Neural Network Model Based on Object-Level Attention Mechanism for Casting Defect Detection on Radiography Images. IEEE Trans. Ind. Electron. 2020, 67, 10922–10930. [Google Scholar] [CrossRef]
- Sassi, P.; Tripicchio, P.; Avizzano, C.A. A smart monitoring system for automatic welding defect detection. IEEE Trans. Ind. Electron. 2019, 66, 9641–9650. [Google Scholar] [CrossRef]
- Chen, H.Y.; Pang, Y.; Hu, Q.D.; Liu, K. Solar Cell Surface Defect Inspection Based on Multispectral Convolutional Neural Network. J. Intell. Manuf. 2020, 31, 453–468. [Google Scholar] [CrossRef]
- Han, H.; Gao, C.Q.; Zhao, Y.; Liao, S.S.; Tang, L.; Li, X.D. Polycrystalline Silicon Wafer Defect Segmentation Based on Deep Convolutional Neural Networks. Pattern Recognit. Lett. 2020, 130, 234–241. [Google Scholar] [CrossRef]
- Akram, M.W.; Li, G.Q.; Jin, Y.; Chen, X.; Zhu, C.A.; Zhao, X.D.; Khaliq, A.; Faheem, M.; Ahmad, A. CNN Based Automatic Detection of Photovoltaic Cell Defects in Electroluminescence Images. Energy 2019, 189, 116319. [Google Scholar] [CrossRef]
- Hussain, M.; Chen, T.H.; Titrenko, S.; Su, P.; Mahmud, M. A Gradient Guided Architecture Coupled with Filter Fused Representations for Micro-Crack Detection in Photovoltaic Cell Surfaces. IEEE Access 2022, 10, 58950–58964. [Google Scholar] [CrossRef]
- Girshick, R.; Donahue, J.; Darrell, T.; Malik, J. Rich Feature Hierarchies for Accurate Object Detection and Semantic Segmentation. In Proceedings of the IEEE Conference on Computer Vision and Pattern Recognition, Columbus, OH, USA, 23–28 June 2014; pp. 580–587. [Google Scholar]
- Girshick, R. Fast r-cnn. In Proceedings of the IEEE Conference on Computer Vision and Pattern Recognition, Santiago, Chile, 7–13 December 2015; pp. 580–587. [Google Scholar]
- Ren, S.Q.; He, K.M.; Girshick, R.; Sun, J. Faster r-cnn: Towards Real-Time Object Detection with Region Proposal Networks. In Proceedings of the IEEE Transactions on Pattern Analysis and Machine Intelligence, Las Vegas, NV, USA, 26 June–1 July 2016; pp. 1137–1149. [Google Scholar]
- He, K.M.; Gkioxari, G.; Dollár, P.; Girshick, R. Mask R-CNN. In Proceedings of the IEEE International Conference on Computer Vision, Honolulu, HI, USA, 21–26 July 2017; pp. 2961–2969. [Google Scholar]
- Liu, W.; Anguelov, D.; Erhan, D.; Szegedy, C.; Reed, S.; Fu, C.Y.; Berg, A.C. SSD: Single Shot MultiBox Detector. In Proceedings of the European Conference on Computer Vision, Amsterdam, The Netherlands, 10–16 October 2016; pp. 21–37. [Google Scholar]
- Redmon, J.; Divvala, S.; Girshick, R.; Farhadi, A. You Only Look Once: Unified, Real-Time Object Detection. In Proceedings of the IEEE Conference on Computer Vision and Pattern Recognition, Las Vegas, NV, USA, 26 June–1 July 2016; pp. 779–788. [Google Scholar]
- Redmon, J.; Farhadi, A. YOLO9000: Better, Faster, Stronger. In Proceedings of the IEEE Conference on Computer Vision and Pattern Recognition, Honolulu, HI, USA, 21–26 July 2017; pp. 7263–7271. [Google Scholar]
- Redmon, J.; Farhadi, A. YOLOv3: An Incremental Improvement. arXiv 2018, arXiv:1804.02767. [Google Scholar]
- Bochkovskiy, A.; Wang, C.-Y.; Liao, H.-Y.M. YOLOv4: Optimal Speed and Accuracy of Object Detection. arXiv 2020, arXiv:2004.10934. [Google Scholar]
- He, K.M.; Zhang, X.Y.; Ren, S.Q.; Sun, J. Deep Residual Learning for Image Recognition. In Proceedings of the IEEE Conference on Computer Vision and Pattern Recognition, Las Vegas, NV, USA, 26 June–1 July 2016; pp. 770–778. [Google Scholar]
- Woo, S.H.; Park, J.C.; Lee, J.Y.; Kweon, I.S. CBAM: Convolutional Block Attention Module. In Proceedings of the European Conference on Computer Vision, Munich, Germany, 8–14 September 2018; pp. 3–19. [Google Scholar]
- Li, X.; Te, R.G.; Yi, F.; Xu, G.C. TCS-YOLO model for global oil storage tank inspection. Opt. Precis. Eng. 2023, 31, 246–262. [Google Scholar] [CrossRef]
- Li, K.; Jiang, X.L.; Chen, E.K.; Chen, P.; Xu, Z.Y.; Lin, Q. Auto-Counting the Eel Anguilla in Recirculating Aquaculture System Via Deep Learning. Oceanologia Limnologia Sinica 2022, 53, 664–674. [Google Scholar]
- Yu, J.H.; Jiang, Y.N.; Wang, Z.Y.; Cao, Z.M.; Huang, T. UnitBox: An Advanced Object Detection Network. In Proceedings of the 24th ACM international conference on Multimedia, Amsterdam, The Netherlands, 15–19 October 2016; pp. 516–520. [Google Scholar]
- Rezatofighi, H.; Tsoi, N.; Gwak, J.Y.; Sadeghian, A.; Reid, I.; Savarese, S. Generalized Intersection Over Union: A Metric and a Loss for Bounding Box Regression. In Proceedings of the IEEE/CVF Conference on Computer Vision and Pattern Recognition, Long Beach, CA, USA, 16–20 June 2019; pp. 658–666. [Google Scholar]
- Zheng, Z.H.; Wang, P.; Liu, W.; Li, J.Z.; Ye, R.G.; Ren, D.W. Distance-IoU Loss: Faster and Better Learning for Bounding Box Regression. In Proceedings of the AAAI Conference on Artificial Intelligenc, New York, NY, USA, 7–12 February 2020; pp. 12993–13000. [Google Scholar]
- Zhang, H.T.; Tian, M.; Shao, G.P.; Cheng, J.; Liu, J.J. Research on Military Gesture Detection Algorithm Based on Improved EfficientDet. Fire Control Command. Control 2022, 47, 97–106. [Google Scholar]
- Li, D.P.; Ren, X.M.; Yan, N.N. Real-Time Dection of Insulator Drop String Based on UAV Aerial Photography. J. Shanghai Jiaotong Univ. 2022, 56, 994. [Google Scholar]
- Su, B.Y.; Zhou, Z.; Chen, H.Y. PVEL-AD: A Large-Scale Open-World Dataset for Photovoltaic Cell Anomaly Detection. IEEE Trans. Ind. Inform. 2022, 19, 404–413. [Google Scholar] [CrossRef]
- Yi, X.T.; Shan, Y.F. Internal Defect Detection of Photovoltaic Cells Based on Improved Faster R-CNN. J. Electron. Meas. Instrum. 2021, 35, 40–47. [Google Scholar]
- Lin, H.; Li, B.; Wang, X.G.; Shu, Y.Y.; Niu, S.L. Automated Defect Inspection of LED Chip Using Deep Convolutional Neural Network. J. Intell. Manuf. 2019, 30, 2525–2534. [Google Scholar] [CrossRef]


| Category | Training Set | Test Set |
|---|---|---|
| Crack | 884 | 376 |
| Finger | 2105 | 853 |
| Black Core | 688 | 340 |
| Parameter | Choice |
|---|---|
| Image size | 1024 × 1024 |
| Learning rate | 0.01 |
| Network batch size | 4 |
| Momentum | 0.9 |
| RPN batch size | 256 |
| Max iteration | 30 |
| ROI foreground threshold | (0.5, 1) |
| ROI background threshold | (0, 0.5) |
| Image size | 1024 × 1024 |
| Group | Faster R-CNN | Pre-Training Weights | CBAM | Anchor Clustering | Loss Function | mAP (%) | Crack | Finger | Black Core |
|---|---|---|---|---|---|---|---|---|---|
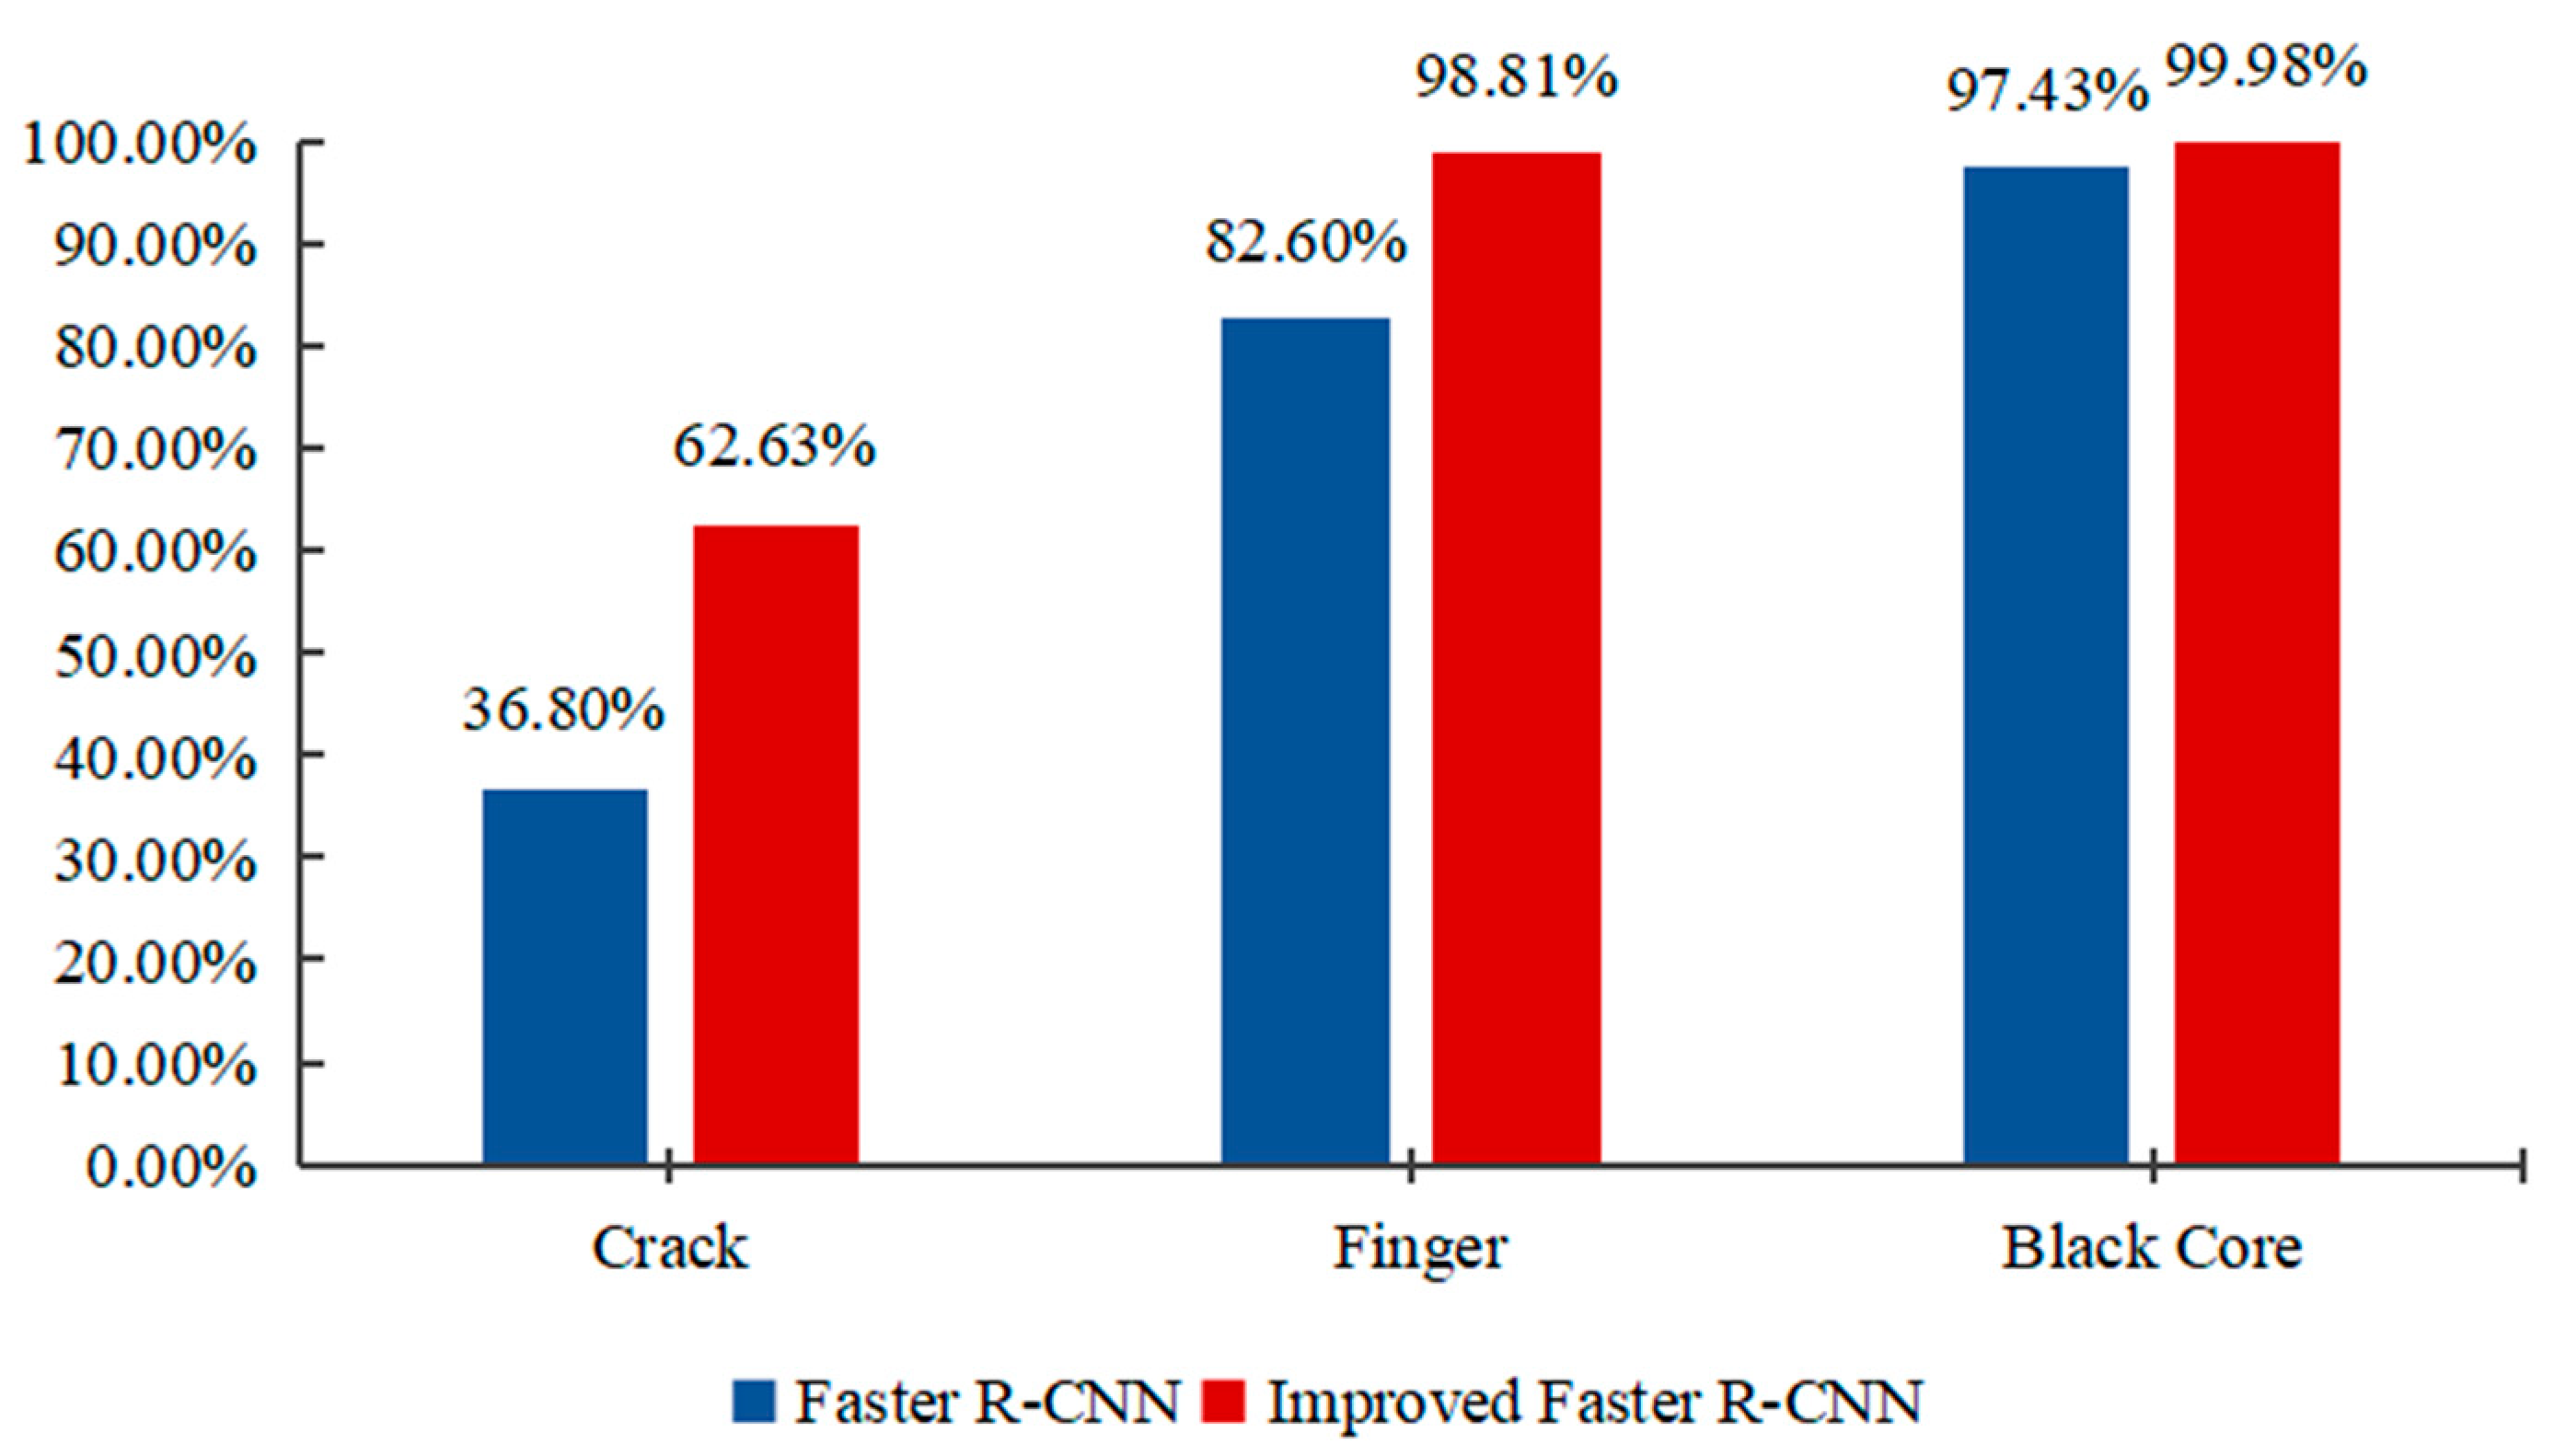
| 1 | √ | 72.27% | 36.80% | 82.60% | 97.43% | ||||
| 2 | √ | √ | 78.14% | 45.67% | 89.95% | 98.80% | |||
| 3 | √ | √ | √ | 83.10% | 55.66% | 94.54% | 99.10% | ||
| 4 | √ | √ | √ | √ | 86.53% | 61.93% | 98.11% | 99.54% | |
| 5 | √ | √ | √ | √ | √ | 87.14% | 62.63% | 98.81% | 99.98% |
Disclaimer/Publisher’s Note: The statements, opinions and data contained in all publications are solely those of the individual author(s) and contributor(s) and not of MDPI and/or the editor(s). MDPI and/or the editor(s) disclaim responsibility for any injury to people or property resulting from any ideas, methods, instructions or products referred to in the content. |
© 2023 by the authors. Licensee MDPI, Basel, Switzerland. This article is an open access article distributed under the terms and conditions of the Creative Commons Attribution (CC BY) license (https://creativecommons.org/licenses/by/4.0/).
Share and Cite
Chen, A.; Li, X.; Jing, H.; Hong, C.; Li, M. Anomaly Detection Algorithm for Photovoltaic Cells Based on Lightweight Multi-Channel Spatial Attention Mechanism. Energies 2023, 16, 1619. https://doi.org/10.3390/en16041619
Chen A, Li X, Jing H, Hong C, Li M. Anomaly Detection Algorithm for Photovoltaic Cells Based on Lightweight Multi-Channel Spatial Attention Mechanism. Energies. 2023; 16(4):1619. https://doi.org/10.3390/en16041619
Chicago/Turabian StyleChen, Aidong, Xiang Li, Hongyuan Jing, Chen Hong, and Minghai Li. 2023. "Anomaly Detection Algorithm for Photovoltaic Cells Based on Lightweight Multi-Channel Spatial Attention Mechanism" Energies 16, no. 4: 1619. https://doi.org/10.3390/en16041619