Article

Analysis of the Situation of Renewable and Non-Renewable Energy Consumption in the European Union

by
Constantin Anghelache
1,2,*,
Mădălina Gabriela Anghel
2,
Ștefan Virgil Iacob
2,3,*,
Ion Pârțachi
4,
Irina Gabriela Rădulescu
3 and
Alina Gabriela Brezoi
3
1
Faculty of Cybernetics, Statistics and Economic Informatics, Department of Statistics and Econometrics, Bucharest University of Economic Studies, 6 Piata Romana, 1st District, 010374 Bucharest, Romania
2
Faculty of Finance and Accounting, Artifex University of Bucharest, 47 Economu Cezărescu Street, 6st District, 060754 Bucharest, Romania
3
Faculty of Economic Sciences, Department of Cybernetics, Economic Informatics, Finance and Accounting, Petroleum—Gas University of Ploiesti, 39 Bucharest Boulevard, 100680 Ploieşti, Romania
4
Department of Econometrics and Economic Statistics, Academy of Economic Sciences of Moldova, Str. Banulescu-Bodoni 61, MD-2005 Chișinău, Moldova
*
Authors to whom correspondence should be addressed.
Energies 2023, 16(3), 1338; https://doi.org/10.3390/en16031338
Submission received: 30 December 2022 / Revised: 20 January 2023 / Accepted: 25 January 2023 / Published: 27 January 2023

Abstract

:
In this article, the authors present the results of research undertaken in relation to the situation regarding renewable and non-renewable energy reserves in the European Union, as well as the way in which this energy is consumed. The general view presented regarding energy resources around the world is that oil, natural gas and coal are being exhausted at an alarming rate and if we continue to exploit these oil resources at our current pace, we will see a massive depletion in energy resources over the next 41 years. The authors also focus on representing the intensity of greenhouse gas emissions from energy consumption, demonstrating that it has shown a slight decrease in the European Union. The resources and consumption of renewable and non-renewable energy were analyzed in close interdependence with these indicators under study, such as final energy consumption, renewable energy and total energy production, in order to give a correct interpretation of how these resources are used. At the same time, starting from the fact that the world economy is currently facing a cluster of crises (pandemic, financial-economic, energy, general resources), it was deemed important to highlight the fact that the total production of energy demonstrated an oscillating trend during this period.

1. Introduction

Our article, entitled “Analysis of the Situation of Renewable and Non-renewable Energy Consumption in the European Union”, begins with the complex crisis situation the world economy faces at the moment (June 2022). In the following sections, an analysis of the general situation regarding energy resources around the world is presented, stating that at this time, the consumption of renewable and non-renewable energy is one of the major problems facing humanity. Energy consumption is a defining element of the evolution of each country’s economy. The energy crisis that is currently manifesting itself is a result of both the above-mentioned crises as well as the pressure the military conflict between Ukraine and the Russian Federation imposes on the economy [1,2,3,4,5,6,7,8,9,10,11]. However, with the exception of these crises, scientific studies have shown a gradual reduction in oil, gas and coal resources on a global scale. The world’s existing resources in terms of oil resources show that at today’s level of oil exploitation, resources will still only last for a maximum of 41 years. From the data presented above, a series of conclusions regarding renewable and non-renewable energy, oil and other resources can be drawn. Energy transition is a complex process. The bold goals set by authorities in EU countries have been called into question by the need to ensure energy security [12,13,14,15,16,17,18]. Therefore, geopolitical considerations have forced a reconfiguration of the energy policies put forward by EU countries, the provision of energy needs, and the management of fuel prices, which are the current concerns of public authorities on the continent.
The energy problem is particularly important given the fact that the need to ensure national production in all countries falls under the spectrum of the energy crisis, leading to a decline in living standards and the quality of life for most people in the world. With the continuous rise in energy prices during the last period, energy poverty has begun to affect more and more consumers [19].
The greenhouse gas emissions generated by energy production and consumption have reached over 16.2 billion tons and are continuing to increase [20,21,22]. The intensity of greenhouse gas emissions from energy consumption is calculated in relation to GHG emissions related to energy and gross domestic energy consumption.
Focusing on the period 2000–2019, we conducted a study on the intensity of greenhouse gas emissions due to energy consumption in each country of the European Union. The study found that the countries most affected were Bulgaria, Croatia, Cyprus and Lithuania. The authors then turned their attention to the situation regarding renewable and non-renewable energy resources and consumption in the European Union, starting by analyzing indicators such as final energy consumption, which measures final consumption for a country excluding all non-energy uses, combustion, and for the production of substances. With regard to renewable energy, which measures the share of renewable energy consumption in gross final energy consumption, it appears that it increases from one period to another, and in the following period will replace non-renewable energy consumption. In this way, the production will achieve its intended purpose. In this regard, the total EU-wide data on renewable energy for the period 2004–2020 were presented, taking into account each time the total energy production in millions of tones and the renewable energy production in millions of tones. It was found that the total energy consumption remained somewhat constant, but the amount of non-renewable energy used during this period decreased. Energy consumption is influenced by many factors such as the level of development, urbanization and technical innovation, which result in the emergence of more energy-efficient products, etc. Despite concerns about reducing energy consumption, researchers have drawn attention to the Jevons effect, which favors lowering the price of energy at certain times, encouraging less responsible consumption [23]. Digitization may be a solution to reduce energy consumption, but studies in this area are still in their infancy [24]. In addition, researchers draw attention to the threats that digitalization can pose to energy supply [25].
Renewable energy is increasingly present in the lives of consumers. Technological innovation offers solutions for using the natural potential that each region has. Wind, solar and biofuels have gradually entered the energy mix of each country, being essential not only for the territorial distribution of these resources and the involvement of economic agents in the process of innovation, research and development, but also the attitude of consumers and local communities towards new types of energy [26,27,28,29]. Renewable energy production is accompanied by technical and economic challenges, which is why a solution would involve public-private partnerships that ensure the long-term viability of investment projects [30,31,32].
In order to deepen the analysis of some correlations that have been established between indicators such as energy production, energy consumption and renewable and non-renewable energy production, we used some statistical-econometric methods, especially the regression function, in which we considered dependent and independent variables to identify parameters and calculate the trend for the next period. Testing the results obtained by the Fisher–Snedecor test or other statistical tests showed that the parameters obtained are significant for the considered significance threshold. The tests used F-statistic and t-statistical, the values of which are higher than the tabular ones, highlighting the fact that the model we considered is valid. This means that the results obtained and the resulting parameters are appropriate and represent a very important source of analysis.
Analyzing the evolution of final energy consumption and renewable energy consumption, we found that this final consumption has a decreasing trend. Thus, from the period 2008–2011, which was the period of the economic-financial crisis, consumption gradually decreased, reaching 906.8 million tons of oil equivalent in 2020. The amount of renewable energy has a tendency to increase from one period of time to another, which must draw attention to the replacement of non-renewable energy with renewable energy. This trend is manifesting worldwide, with most states trying to increase renewable energy production, which must put consumers’ minds at ease, especially in regard to the national economy. The evolution of renewable energy and actual final consumption in the future period follows an average annual rate of change. Thus, using data on the evolution of renewable energy and final consumption in the period 2004–2020, as well as the average annual rates calculated on the basis of data taken from Eurostat and by applying econometric models (linear and nonlinear regressions), we highlighted that in a period of 29.15 years, the indicators on renewable energy production will be able to completely replace non-renewable energy. There are other variables that could be taken into account. However, in the present article, the authors analyze renewable and non-renewable energy consumption in the European Union based on the fact that non-renewable energy is set to decline as a resource in the next period and renewable energy must be the one that replaces it by ensuring the consumption needs of each state.

2. Literature Review

A significant number of authors have been concerned with the factors that generate economic growth and problems related to energy consumption, energy produced from renewable sources and carbon emissions due to the use of fossil sources. In this regard, some authors have considered the relationship between economic growth, carbon emissions and energy consumption by applying a panel vector autoregressive model (PVAR) combined with a generalized system method of moment (GMM) [33]. The disastrous situation facing humanity in the use of fossil fuels for energy production is another topic addressed by researchers [34]. Some researchers have turned their attention to the impact of the severity of environmental policy on the level of CO2 emissions, highlighting on the one hand the short-term unidirectional link between GDP per capita growth and greenhouse gas emissions and on the other hand the bidirectional causality between primary energy consumption and greenhouse gas emissions [35,36,37]. It was also highlighted that energy poverty has a strong impact on the population’s standard of living [38]. Some researchers have highlighted the importance of energy resources in terms of the economic development of a nation, emphasizing in this sense the fact that sustainable development requires maintaining the balance between domestic consumption and resources. At the same time, achieving green growth will have a positive impact on economic growth. This chapter also addresses the issue of environmental degradation in developing countries [39,40,41,42]. Some authors have analyzed the effect of digitization on energy consumption, considering the direct effects on production, the use of information and communication technologies and economic growth through increased labor and energy productivity [43]. The negative effects of the use of fossil fuels were analyzed and it was emphasized that sustainable development takes into account the conservation of fossil fuels and the development of renewable energies [44]. Some research approaches involve statistical-econometric analysis methods to highlight the correlations that exist between investments in renewable energy and CO2 emissions in developing countries [45,46]. One of the directives of the European Union states that at least 20% of the total energy produced should come from renewable energy sources and attention must be paid to the link between the share of renewable energy sources in electricity and real GDP per capita [47]. Emphasis is placed on the relationships between the performance of sustainability indicators and economic growth in the European Union, using in this sense a series of indices such as human development, financial development, urban population, energy consumption from renewable sources, non-renewable energy consumption, ecological footprint, carbon emissions and gross domestic product [48]. Other studies highlight the correlation between GDP, the global competitiveness index and renewable energy consumption, emphasizing after applying some statistical tests that there is a positive effect of the evolution of renewable energy consumption on GDP growth and global competitiveness [49]. Some researchers are concerned with issues related to carbon emissions, energy consumption and economic growth, considering both developing and developed countries, while others highlight the correlation that exists between the development of renewable energies, economic growth and financial aspects, such as studies based on causality tests [50,51]. Some studies use the hierarchical clustering methodology to project certain economic models of the behavior and grouping of the member states of the European Union [52].

3. Materials, Methods, Results and Discussion

3.1. Materials and Methods Used

In the research carried out, which is the basis of this article, we selected and used a series of relevant documents regarding the evolution of renewable and non-renewable energy resources. In this context, we accessed the database made available by Real-time world statistics and the communications of Eurostat and the National Institute of Statistics on this topic. At the same time, we used some data extracted from the databases of the European Union regarding the intensity of greenhouse gas emissions of energy consumption in the European Union.
These data, extracted from the mentioned materials, part of which can be found in this article, were analyzed using a series of statistical-econometric methods (index method, comparison method, dynamic study of variables, simple linear regression model and Vector Autoregression Regression). We also used graphical representations and synthetic tables, which ensure an easier and more concrete interpretation of the authors’ opinions.

3.2. Analysis, Results and Discussion on the Situation of Energy Resources in the World

Renewable and non-renewable energy consumption is one of the major concerns of researchers, but also of national administrators or management teams of international economic bodies, as is the case of the European Union [53,54,55]. Energy consumption is a defining element in the evolution of the economy of each nation in the sense that the organization and realization of production at a national and global level depends on the quantity and quality of these energy resources. Traditional non-renewable energy resources are oil, natural gas and coal. They are concentrated in certain geographical areas, which means that under these conditions, only international trade is able to provide the necessary resources according to the development strategy of each country. We must not forget that in addition to the primary uses of these energy resources, there are also branches of the national economy that can produce only if they have such raw materials. Thus, natural gas resources consisting of raw material are derived primarily from branches of the petrochemical industry (fertilizers, other products needed by the national economy as a whole).
The studies carried out so far highlight the fact that the total energy resources are 283,197,500 kWh. The total value of non-renewable energy sources (oil, gas, natural resources, coal) represents 241,332,792 kWh. Thus, the renewable energy sources are represented by the difference between the two being approximately 41,864,708 kWh.
We know that in addition to this non-recoverable energy there are renewable energy sources such as solar energy, wind energy and water energy, etc. In order to avoid having to face short periods where oil, natural gas, and coal resources are depleted, these renewable energy resources must be used with priority. Currently, oil is exploited daily at a rate of 58,312,700 barrels. If we take 1,436,099,720,310 barrels, which is equivalent to 14,627 days, as the total amount of oil left to be exploited globally, in approximately 41 years, all oil resources will have disappeared. Additionally, natural gas at the time of this analysis represents a total global stock of 1,081,518,350,200 bep. This means that we can only continue to exploit natural gas for another 56,922 days, i.e., about 156 years. Coal resources currently represent a total of 4,294,609,821,700 bep, the average operation of which is 148,090 days. The data are presented in the Table 1.
Solving the energy problem is crucial, particularly as it takes into account resources as well as the need to ensure national production, consumption in the socio-economic system, and, consequently, the standard of living of the population. We must not neglect the fact that the world’s population currently stands at 7,953,391,905, with a daily increase of 234,790 people, thus ensuring that the first five and a half months of 2022 alone will see an increase of 36,199,461 people. Additionally, greenhouse gas emission levels are quite high, standing in the past few months of 2022 at 16,213,795,300 tons.
Energy consumption causes environmental pollution. Scientific studies have focused on issues such as the impact of globalization, foreign direct investment, foreign trade, carbon emissions generated or synthetic indicators used on the intensity of greenhouse gas emissions due to energy consumption [5,57,58,59].
The intensity of greenhouse gas emissions from energy consumption is an indicator calculated as the ratio between energy-related GHG emissions and gross domestic energy consumption. It expresses how many tones of CO2 equivalent of energy-related GHGs are emitted in a given economy per unit of energy that is consumed. Energy emissions data are obtained from GHG emissions reported to the UNFCCC. We proposed a situation regarding the intensity of gas emissions and energy consumption and considered this indicator the intensity in the 28 states of the European Union to establish how each country has evolved from 2000 to 2019 over five-year intervals (minus the last interval).
Interpreting the data presented in Table 2, we found that every year the intensity of greenhouse gas emissions has decreased in all Member States of the European Union. Thus, the most important decreases in the period 2000–2019 were registered by Iceland, 55.2%, Malta, 41.2%, and Denmark, 36.8%, respectively. At the same time, Bulgaria has only managed to reduce the destructive effect of greenhouse gas emissions by 2.9%. In the same area are Cyprus with a 5% reduction, Luxembourg with a 7.7% decrease, and The Netherlands with a 7.6% cut. The worst is Lithuania, which has failed to reduce its greenhouse gas emissions, but is still 2.6% above the 2000 level. At the level of the European Union, the intensity of greenhouse gas emissions was reduced compared to the level of 2000 by 17.4%, showing a downward trend. Completing the above data and figures that have been analyzed, we must keep in mind that the consumption of energy must also take into account the way in which the states of the world can secure these reserves. Thus, the armed crisis between Ukraine and the Russian Federation has led to disruptions in the trading of primary energy resources. This energy crisis has led to economic and financial crises, together with other problems, such as the crisis of rising energy prices first, but then the chain of rising product prices, which belongs to other categories. This particular situation that has become difficult for people around the world, but especially for Europe. In this context, analyzing the situation representing the evolution of energy resources, we will find that special measures must be taken by developing renewable energy resources. This, of course, depends on a high level of usable technology as well as the organization capacity of the national energy production system in each country.

3.3. Results and Discussions Regarding the Situation of Renewable and Non-Renewable Energy Resources and Consumption in the European Union

In order to establish models and statistical-econometric methods for analyzing the interdependencies between the indicators under study, we will define in the first stage their content. Thus, Final Energy Consumption measures the final energy consumption in a country, excluding all non-energy uses of energy carriers (natural gas used not for combustion, but for the production of chemicals). Final energy consumption also covers energy only consumed by end-users, such as industry, transport, households, services and agriculture, and excludes the energy consumption of the energy sector itself and losses that occur during the transformation and distribution of energy.
Regarding renewable energy, it measures the share of renewable energy consumption in gross final consumption of energy under the Renewable Energy Directive. Gross final consumption of energy is the energy used by final consumers (final energy consumption) plus network losses and self-consumption of power plants.
Total energy production results from the division of gross domestic product (GDP) by the available gross energy for a given calendar year. This indicator thus measures the productivity of energy consumption and provides a picture of the degree of decoupling of energy consumption from GDP growth. The euro unit in chain-linked volumes allows trends in energy productivity to be observed over time in a single geographical area, while the PPS unit allows a comparison to be made between countries for the same year. The available gross energy is calculated as follows: primary production + recovered and recycled products + imports—exports + stock changes.
Of course, in order to be able to put into the equation the evolution of the studied indicators and to establish what is the correlation between them, they can be recalculated and expressed in absolute figures (million tons of oil equivalent) or relative (%). The evolution of final energy consumption and renewable energy in the period 2000-2020 is illustrated in Figure 1.
Analyzing the evolution of final energy consumption, we find that this final consumption has a tendency to decrease slightly. Thus, from 1036.4 million tons of oil equivalent, during the crisis of 2008–2011, it reached a consumption of 980.6 million tons of oil equivalent in 2009, respectively, and 984.5 million tons of oil equivalent in 2011. This downward trend in total consumption continued so that in 2020 it was 906.8 million tons of oil equivalent.
Regarding the total quantity of renewable energy, this final consumption has a growing trend, being in 2004 of 99.55 million tons of oil equivalent, then increasing by 2008 to 130.11 million tons of oil equivalent, and then after the economic crisis of 2008–2010 continued to increase from one year to the next, reaching 200.30 million tons of oil equivalent in 2020, practically doubling the amount of renewable energy over the last 17 years.
In this way, it can be pointed out that the production of renewable energy has increased in most of the European Union states, accounting for almost a quarter of the total final consumption. Therefore, this Directive of the European Union to focus on the development of this energy source has come to life.
In order to more clearly highlight the interdependence or correlation that exists between production, total final consumption and renewable energy, we used the statistical-econometric regression model, on the basis of which we calculated useful parameters to highlight the evolutionary trend and the perspective of the evolution of these indicators. The model has the following form:
P R ^ = α 0 + α 1 · R G ^
C S ^ = β 0 + β 1 · R G ^
The results of the analysis using the linear regression method are presented in Table 3.
We find that the values of the linear correlation coefficient (r) are 0.8226, respectively, −0.8584. Thus, being closer to the upper limit of the interval [−1,1] than to the null value, this indicates that in both cases there is a strong linear correlation between the two variables. Additionally, the Fisher–Snedecor test indicates that the results obtained are significant for the materiality threshold considered and the values of the determination validity (R-squared = 0.6768 and 0.7369, respectively) indicate the strong influence of the causal variable on the resulting characteristic.
Consequently, the stimulation of the theoretical values of the dependent variable is achieved by replacing the values of the parameters calculated in Equations (1) and (2).
Using the first relationship to obtain the forecast until 2080, we find a change in the average rate of change in total energy production from 0.44% for the period 2000–2020 to 0.34% for the period 2021–2080. However, we must not overlook the fact that non-renewable energy reserves are in an alarming decline and that the Earth cannot sustain this average rate of evolution on the basis of non-renewable sources. Consequently, it is an overwhelming emergency to implement new projects and technological developments to provide renewable energy sources (wind, solar, hydro, gravitational, etc.).
We will deepen the analysis of the evolution of renewable energy and actual final consumption over the next period using the average annual change rate. Thus, data on the evolution of renewable energy and actual final consumption, as well as the average annual rates calculated on the basis of data taken from Eurostat, are presented in the following table. Data on the average volumes and rates of change of energy consumption and renewable energy are presented in Table 4.
In order to determine the time period x when the absolute volumes of the two indicators will be equal, we will respect the content:
V c f · I M A M c f   x = V e r · I M A M e r   x
Since it is a nonlinear equation, we will use the logarithm method to identify the variable x. Thus, the calculations showed that years x = 29.15. Of course, the 29.15-year period is valid only if the two indicators maintain the same average annual rate of change (increase or decrease). In other words, in about 30 years, under the conditions mentioned, renewable energy sources will be sufficient to fully cover the energy consumption needed by the European Union.
I shall then resort to a VAR (Vector Autoregression Estimates) analysis, considering that the results of such an analysis are more certain than those obtained on the basis of the multiple regression model. Thus, based on the VAR model, the following equations were used:
C S = α 0 + α 1 C S t 1 + α 2 C S t 2 + α 3 P R t 1 + α 4 P R t 2 + α 5 R G t 1 + α 6 R G t 2
P R = β 0 + β 1 C S t 1 + β 2 C S t 2 + β 3 P R t 1 + β 4 P R t 2 + β 5 R G t 1 + β 6 R G t 2
R G = γ 0 + γ 1 C S t 1 + γ 2 C S t 2 + γ 3 P R t 1 + γ 4 P R t 2 + γ 5 R G t 1 + γ 6 R G t 2
The results of the analysis of the correlation between the three variables, namely final energy consumption (CS), total energy production (PR) and renewable energy (RG) are presented in Table 5.
The results of the analysis confirm the links between the three variables by values closer to the unit value than to the null value of the coefficients of determination (R-squared). At the same time, we find that the built model is a valid one and based on the calculated regression parameters, we can make the forecast for the next period.
Using the above relationships, the result of the forecast by the year 2050; that is, for a period of 30 years, is presented in Table 6:
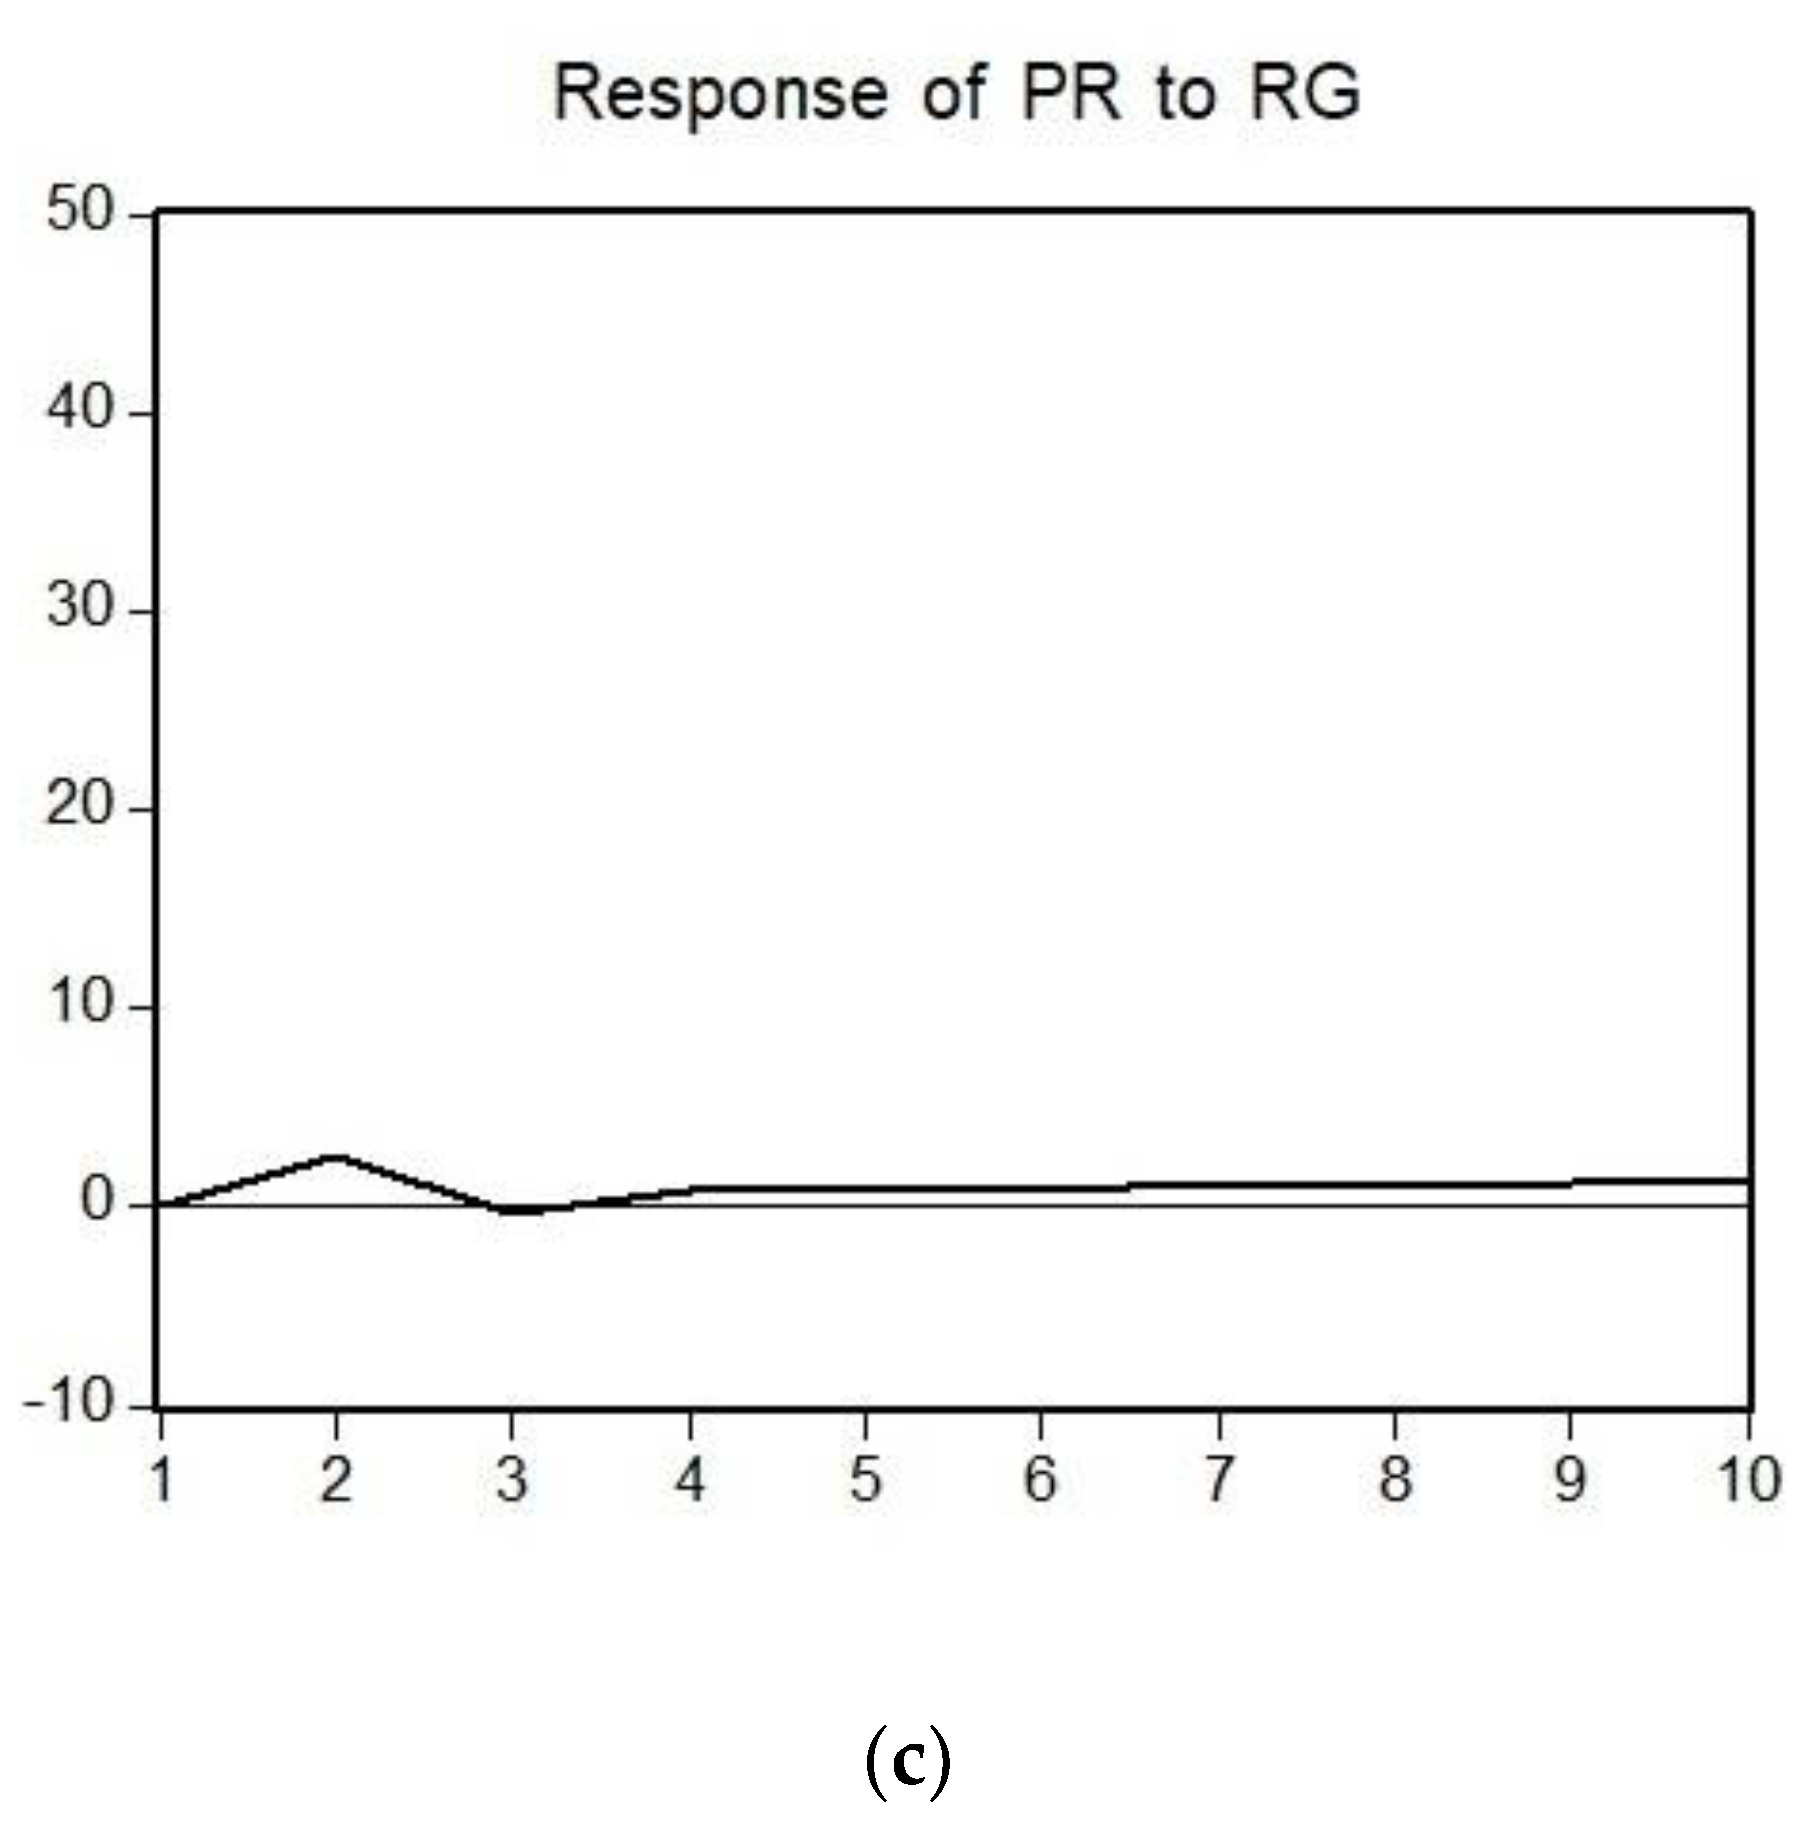
We find that based on the VAR model used in 30 years’ time, the production of renewable energy (RG) will cover approximately 39.36% of final energy consumption (CS) at the European Union level. Of course, these results are more pertinent than the previous estimate, and that is because the average rate of change in the considered variables is difficult to maintain. As the European Union’s economy is known and is not only being hit by crises and a series of events affecting all branches of the national (Member States) economies, including the energy industry, the existence of these shocks is signaled in the data series analyzed and they are caught in the equations for estimating future developments. It is in this context that we shall consider the response to momentum in the case of the variables considered, taking into account a period of 10 years.
We note that the application of a shock with a standard deviation on the total energy production will have an immediate effect on the evolution of the final energy consumption, registering a sharp increase in the first year, after which the trend had changed, being a strongly downward one until year 4, after which it will no longer have an influence (Figure 2a). In the case of the application of a shock with a standard deviation on renewable energy, we find that the response of the final energy consumption is similar to the previous case, but with a lower intensity (Figure 2b). Additionally, the application of a shock on renewable energy will have the effect of an oscillation in the evolution of total energy production in the first 3–4 years, after which the effect fades (Figure 2c).
There are some differences, more or less significant, between the results obtained from the analyses carried out in this research using statistical-econometric models and methods, but what is certain is that they all converge towards a unique and extremely worrying result at the same time. In this sense, the results of the analysis highlight the fact that we are facing a particular crisis in terms of the global energy system and in the following period the prospects for recovery are limited. Therefore, recovery measures must be taken urgently through a substantial injection of funds in terms of innovation–research–development, because an approach in this sense can offer humanity a perspective in which new energy production technologies can be discovered; it can benefit from the maximum performance of the existing ones, and, consequently, the current crisis, which, based on the study carried out and presented in this article, has effects over a long period of time, will be overcome.

4. Conclusions

From the article Analysis of the Situation of Renewable and Non-renewable Energy Consumption in the European Union, a series of theoretical and especially practical conclusions emerge. First of all, it should be pointed out that the non-renewable energy resources in the world (oil, natural gas, coal) are diminishing from one day to the next. In this context, it appears necessary to expand the production of renewable energy, which can replace this low level of non-renewable resources and not affect the world economy.
In the European Union, renewable and non-renewable energy resources have been studied and it has been pointed out that there is an upward trend in the widest possible use of renewable energy resources, with the European Union directive consisting precisely of requiring states to move towards this change in the structure of energy production.
We note that current renewable and non-renewable energy resources could ensure the normal evolution of the economies of the European Union’s states. In the current conditions, this situation is affected by the crises facing the world economy.
The immediate conclusion emerges that all the Member States of the European Union must guide their research as well as the imposition of conditions to ensure that the production of renewable energy is increased. There are natural conditions for this type of renewable energy to develop. It is also important that the Member States of the European Union want to efficiently size their resources and go beyond this framework of the negative effects generated by the current crises.
The world economy, that of the European Union as well as that of each Member State, is currently facing, after 2008–2010, the largest and most complex crisis that has ever been felt by the states of the world and, in particular, by the European states, amplified to a level unimaginable by the current crises, acting in concert, with the deepest economic effects, which will be even harder to overcome. It is more urgently necessary to deepen intra-community cooperation and to establish strategies aimed at bringing national economies to an appropriate level of macro-stability. The national recovery and resilience plans adopted as an essential point in the European Union’s strategy must be carried out with rapidity in order to redress some areas of activity specific to each member country.
The study on which this article is based is limited, but there may be the possibility of expanding the use of other sources of data and variables, which extend the forecasts in the field of renewable and non-renewable energy. Within the perspective of the evolution of the industry of the future, other possibilities for expanding the analyses will appear. The authors propose to deepen the study, which for the moment represents a beginning.
Working more actively within the European Union and between Member States, particularly in the field of energy, is a priority that can result in positive results in terms of the production of renewable energy.

Author Contributions

Conceptualization, C.A., M.G.A. and Ș.V.I.; methodology, C.A., M.G.A. and Ș.V.I.; software, C.A., M.G.A. and Ș.V.I.; validation, C.A., M.G.A., Ș.V.I., I.P., I.G.R. and A.G.B.; formal analysis, C.A., M.G.A., Ș.V.I., I.P., I.G.R. and A.G.B.; investigation, C.A., M.G.A., Ș.V.I., I.P., I.G.R. and A.G.B.; resources, C.A., M.G.A., Ș.V.I., I.P., I.G.R. and A.G.B.; data curation, C.A., M.G.A., Ș.V.I., I.P., I.G.R. and A.G.B.; writing—original draft preparation, C.A., M.G.A., Ș.V.I., I.P., I.G.R. and A.G.B.; writing—review and editing, C.A., M.G.A., Ș.V.I., I.P., I.G.R. and A.G.B.; visualization, C.A., M.G.A., Ș.V.I., I.P., I.G.R. and A.G.B.; supervision, C.A., M.G.A., Ș.V.I., I.P., I.G.R. and A.G.B.; project administration, C.A., M.G.A., Ș.V.I., I.P., I.G.R. and A.G.B.; All authors have read and agreed to the published version of the manuscript.

Funding

This research received no external funding.

Data Availability Statement

Not applicable.

Conflicts of Interest

The authors declare no conflict of interest.

References

  1. Balsalobre-Lorente, D.; Ibáñez-Luzón, L.; Usman, M.; Shahbaz, M. The environmental Kuznets curve, based on the economic complexity, and the pollution haven hypothesis in PIIGS countries. Renew. Energy 2022, 185, 1441–1455. [Google Scholar] [CrossRef]
  2. Morina, F.; Lyroudi, K.; Balomenou, C. The Economic Impact of the Coronavirus Pandemic (COVID-2019): Implications for the Energy Sector. In Energy Transition; Springer: Singapore, 2022; pp. 193–213. [Google Scholar]
  3. Erokhin, V.; Tianming, G. Renewable Energy as a Promising Venue for China-Russia Collaboration. In Energy Transition; Springer: Singapore, 2022; pp. 73–101. [Google Scholar]
  4. Ahmad, T.; Zhang, D. A critical review of comparative global historical energy consumption and future demand: The story told so far. Energy Rep. 2020, 6, 1973–1991. [Google Scholar] [CrossRef]
  5. Armeanu, D.Ş.; Gherghina, Ş.C.; Pasmangiu, G. Exploring the causal nexus between energy consumption, environmental pollution and economic growth: Empirical evidence from central and Eastern Europe. Energies 2019, 12, 3704. [Google Scholar] [CrossRef] [Green Version]
  6. Armeanu, D.S.; Joldes, C.C.; Gherghina, S.C.; Andrei, J.V. Understanding the multidimensional linkages among renewable energy, pollution, economic growth and urbanization in contemporary economies: Quantitative assessments across different income countries’ groups. Renew. Sustain. Energy Rev. 2021, 142, 110818. [Google Scholar] [CrossRef]
  7. Popescu, G.H.; Mieila, M.; Nica, E.; Andrei, J.V. The emergence of the effects and determinants of the energy paradigm changes on European Union economy. Renew. Sustain. Energy Rev. 2018, 81, 768–774. [Google Scholar] [CrossRef]
  8. Dobrowolski, Z. Energy and local safety: How the administration limits energy security. Energies 2021, 14, 4841. [Google Scholar] [CrossRef]
  9. Sułkowski, Ł.; Dobrowolski, Z. The role of supreme audit institutions in energy accountability in EU countries. Energy Policy 2021, 156, 112413. [Google Scholar] [CrossRef]
  10. Kufel, T.; Kufel, P.; Błażejowski, M. Do COVID-19 lock-downs affect business cycle? Analysis using energy consumption cycle clock for selected European countries. Energies 2022, 15, 340. [Google Scholar] [CrossRef]
  11. Mbah, R.E.; Wasum, D.F. Russian-Ukraine 2022 War: A review of the economic impact of Russian-Ukraine crisis on the USA, UK, Canada, and Europe. Adv. Soc. Sci. Res. J. 2022, 9, 144–153. [Google Scholar] [CrossRef]
  12. Neacșa, A.; Panait, M.; Mureșan, J.D.; Voica, M.C.; Manta, O. The Energy Transition between Desideratum and Challenge: Are Cogeneration and Trigeneration the Best Solution? Int. J. Environ. Res. Public Health 2022, 19, 3039. [Google Scholar] [CrossRef]
  13. Joița, D.; Dobrotă, C.E. Aspects of European funding for the energy transition-Just transition. Ovidius Univ. Ann. Ser. Econ. Sci. 2022, 22, 289–297. [Google Scholar]
  14. Fernández-González, R.; Puime-Guillén, F.; Pérez-Vas, R. The New Wind Energy Boom in Spain: Are Large Companies Once Again Dominating the Market? In Energy Transition; Springer: Singapore, 2022; pp. 135–163. [Google Scholar]
  15. Neacsa, A.; Rehman Khan, S.A.; Panait, M.; Apostu, S.A. The Transition to Renewable Energy—A Sustainability Issue? In Energy Transition; Springer: Singapore, 2022; pp. 29–72. [Google Scholar]
  16. Popescu, C.; Panait, M.; Palazzo, M.; Siano, A. Energy Transition in European Union—Challenges and Opportunities. In Energy Transition; Springer: Singapore, 2022; pp. 289–312. [Google Scholar]
  17. Apostu, S.A.; Panait, M.; Vasile, V. The energy transition in Europe—A solution for net zero carbon? Environ. Sci. Pollut. Res. 2022, 29, 71358–71379. [Google Scholar] [CrossRef] [PubMed]
  18. Khan, S.A.R.; Panait, M.; Guillen, F.P.; Raimi, L. Energy Transition. Economic, Social and Environmental Dimensions; Springer: Singapore, 2022. [Google Scholar]
  19. Bouzarovski, S.; Thomson, H.; Cornelis, M. Confronting energy poverty in Europe: A research and policy agenda. Energies 2021, 14, 858. [Google Scholar] [CrossRef]
  20. Gurtu, A.; Searcy, C.; Jaber, M.Y. A framework for reducing global manufacturing emissions. J. Environ. Dev. 2016, 25, 159–190. [Google Scholar] [CrossRef]
  21. Balsalobre-Lorente, D.; Shahbaz, M.; Roubaud, D.; Farhani, S. How economic growth, renewable electricity and natural resources contribute to CO2 emissions? Energy Policy 2018, 113, 356–367. [Google Scholar] [CrossRef] [Green Version]
  22. Martins, F.; Felgueiras, C.; Smitková, M. Fossil fuel energy consumption in European countries. Energy Procedia 2018, 153, 107–111. [Google Scholar] [CrossRef]
  23. Flores, J.; Cavique, M.; Seixas, J. Energy Sustainability—Rebounds Revisited Using Axiomatic Design. Sustainability 2022, 14, 6737. [Google Scholar] [CrossRef]
  24. Ren, S.; Hao, Y.; Xu, L.; Wu, H.; Ba, N. Digitalization and energy: How does internet development affect China’s energy consumption? Energy Econ. 2021, 98, 105220. [Google Scholar] [CrossRef]
  25. Dobrowolski, Z. Internet of things and other e-solutions in supply chain management may generate threats in the energy sector—The quest for preventive measures. Energies 2021, 14, 5381. [Google Scholar] [CrossRef]
  26. Shahzad, U.; Radulescu, M.; Rahim, S.; Isik, C.; Yousaf, Z.; Ionescu, S.A. Do Environment-Related Policy Instruments and Technologies Facilitate Renewable Energy Generation? Exploring the Contextual Evidence from Developed Economies. Energies 2021, 14, 690. [Google Scholar] [CrossRef]
  27. Jahanger, A.; Usman, M.; Murshed, M.; Mahmood, H.; Balsalobre-Lorente, D. The linkages between natural resources, human capital, globalization, economic growth, financial development, and ecological footprint: The moderating role of technological innovations. Resour. Policy 2022, 76, 102569. [Google Scholar] [CrossRef]
  28. Andrei, J.; Andreea, I.R. A trade-off between economics and environment requirements on energy crops vs. food crops in Romanian agriculture. Custos E Agronegocio Line 2018, 14, 61–82. [Google Scholar]
  29. Platon, V.; Frone, S.; Constantinescu, A.; Jurist, S. Current Perspectives and Challenges of Biofuel Production and Consumption. Rom. J. Econ. 2010, 31, 107–128. [Google Scholar]
  30. Kirikkaleli, D.; Adebayo, T.S. Do public-private partnerships in energy and renewable energy consumption matter for consumption-based carbon dioxide emissions in India? Environ. Sci. Pollut. Res. 2021, 28, 30139–30152. [Google Scholar] [CrossRef] [PubMed]
  31. Shahbaz, M.; Raghutla, C.; Song, M.; Zameer, H.; Jiao, Z. Public-private partnerships investment in energy as new determinant of CO2 emissions: The role of technological innovations in China. Energy Econ. 2020, 86, 104664. [Google Scholar] [CrossRef] [Green Version]
  32. Dobrowolski, Z.; Drozdowski, G. Does the Net Present Value as a Financial Metric Fit Investment in Green Energy Security? Energies 2022, 15, 353. [Google Scholar] [CrossRef]
  33. Acheampong, A.O.; Boateng, E.; Amponsah, M.; Dzator, J. Revisiting the economic growth–energy consumption nexus: Does globalization matter? Energy Econ. 2021, 102, 105472. [Google Scholar] [CrossRef]
  34. Adebayo, T.S.; Rjoub, H.; Akinsola, G.D.; Oladipupo, S.D. The asymmetric effects of renewable energy consumption and trade openness on carbon emissions in Sweden: New evidence from quantile-on-quantile regression approach. Environ. Sci. Pollut. Res. 2021, 29, 1875–1886. [Google Scholar] [CrossRef]
  35. Albulescu, C.T.; Boatca-Barabas, M.E.; Diaconescu, A. The asymmetric effect of environmental policy stringency on CO2 emissions in OECD countries. Environ. Sci. Pollut. Res. 2022, 29, 27311–27327. [Google Scholar] [CrossRef]
  36. Armeanu, D.S.; Gherghina, S.C.; Andrei, J.V.; Joldes, C.C. Evidence from the nonlinear autoregressive distributed lag model on the asymmetric influence of the first wave of the COVID-19 pandemic on energy markets. Energy Environ. 2022, 0, 0958305X221087502. [Google Scholar] [CrossRef]
  37. Butnaru, G.I.; Haller, A.P.; Clipa, R.I.; Ștefănică, M.; Ifrim, M. The nexus between convergence of conventional and renewable energy consumption in the present European Union states. Explorative study on parametric and semi-parametric methods. Energies 2020, 13, 5272. [Google Scholar] [CrossRef]
  38. Druică, E.; Goschin, Z.; Ianole-Călin, R. Energy poverty and life satisfaction: Structural mechanisms and their implications. Energies 2019, 12, 3988. [Google Scholar] [CrossRef] [Green Version]
  39. Dusmanescu, D. Solar Energy Potential as Support for Sustainable Development of Romanian Economy. In Agricultural Management Strategies in a Changing Economy; IGI Global: Pennsylvania, SUA, 2015; pp. 225–252. [Google Scholar]
  40. Jiang, T.; Yu, Y.; Jahanger, A.; Balsalobre-Lorente, D. Structural emissions reduction of China’s power and heating industry under the goal of “double carbon”: A perspective from input-output analysis. Sustain. Prod. Consum. 2022, 31, 346–356. [Google Scholar] [CrossRef]
  41. Khan, M.K.; Khan, M.I.; Rehan, M. The relationship between energy consumption, economic growth and carbon dioxide emissions in Pakistan. Financ. Innov. 2020, 6, 1–13. [Google Scholar] [CrossRef] [Green Version]
  42. Khan, S.A.R.; Ponce, P.; Yu, Z. Technological innovation and environmental taxes toward a carbon-free economy: An empirical study in the context of COP-21. J. Environ. Manag. 2021, 298, 113418. [Google Scholar] [CrossRef] [PubMed]
  43. Lange, S.; Pohl, J.; Santarius, T. Digitalization and energy consumption. Does ICT Reduce Energy Demand? Ecol. Econ. 2020, 176, 106760. [Google Scholar] [CrossRef]
  44. Marinaș, M.C.; Dinu, M.; Socol, A.G.; Socol, C. Renewable energy consumption and economic growth. Causality relationship in Central and Eastern European countries. PloS ONE 2018, 13, e0202951. [Google Scholar] [CrossRef] [Green Version]
  45. Shahbaz, M.; Nasreen, S.; Ahmed, K.; Hammoudeh, S. Trade openness–carbon emissions nexus: The importance of turning points of trade openness for country panels. Energy Econ. 2017, 61, 221–232. [Google Scholar] [CrossRef] [Green Version]
  46. Raza, S.A.; Shah, S.H.; Yousufi, S.Q. The impact of public-private partnerships Investment in Energy on carbon emissions: Evidence from nonparametric causality-in-quantiles. Environ. Sci. Pollut. Res. 2021, 28, 23182–23192. [Google Scholar] [CrossRef]
  47. Shahzad, M.; Bilan, Y.; Krajňáková, E.; Streimikiene, D.; Gędek, S. Renewable energy in the electricity sector and GDP per capita in the European Union. Energies 2019, 12, 2520. [Google Scholar]
  48. Sharma, G.D.; Tiwari, A.K.; Erkut, B.; Mundi, H.S. Exploring the nexus between non-renewable and renewable energy consumptions and economic development: Evidence from panel estimations. Renew. Sustain. Energy Rev. 2021, 146, 111152. [Google Scholar] [CrossRef]
  49. Simionescu, M.; Păuna, C.B.; Diaconescu, T. Renewable Energy and Economic Performance in the Context of the European Green Deal. Energies 2020, 13, 6440. [Google Scholar] [CrossRef]
  50. Waheed, R.; Sarwar, S.; Wei, C. The survey of economic growth, energy consumption and carbon emission. Energy Rep. 2019, 5, 1103–1115. [Google Scholar] [CrossRef]
  51. Wang, J.; Zhang, S.; Zhang, Q. The relationship of renewable energy consumption to financial development and economic growth in China. Renew. Energy 2021, 170, 897–904. [Google Scholar] [CrossRef]
  52. Zaharia, M.; Pătrașcu, A.; Gogonea, M.R.; Tănăsescu, A.; Popescu, C. A cluster design on the influence of energy taxation in shaping the new EU-28 economic paradigm. Energies 2017, 10, 257. [Google Scholar] [CrossRef] [Green Version]
  53. Cristea, M.; Dobrota, C.E. Green Energy for Sustainable Development in Romania’s Economy. Rev. Chim. 2017, 68, 1375–1380. [Google Scholar] [CrossRef]
  54. Shahbaz, M.; Raghutla, C.; Chittedi, K.R.; Jiao, Z.; Vo, X.V. The effect of renewable energy consumption on economic growth: Evidence from the renewable energy country attractive index. Energy 2020, 207, 118162. [Google Scholar] [CrossRef]
  55. Chen, C.; Pinar, M.; Stengos, T. Determinants of renewable energy consumption: Importance of democratic institutions. Renew. Energy 2021, 179, 75–83. [Google Scholar] [CrossRef]
  56. Real-Time World Statistics. Available online: https://www.worldometers.info/ (accessed on 12 June 2022).
  57. Khaskheli, A.; Jiang, Y.; Raza, S.A.; Khan, K.A.; Qureshi, M.A. Financial development, international trade, and environmental degradation: A nonlinear threshold model based on panel smooth transition regression. Environ. Sci. Pollut. Res. 2021, 28, 26449–26460. [Google Scholar] [CrossRef]
  58. Rehman, A.; Radulescu, M.; Ma, H.; Dagar, V.; Hussain, I.; Khan, M.K. The impact of globalization, energy use, and trade on ecological footprint in Pakistan: Does environmental sustainability exist? Energies 2021, 14, 5234. [Google Scholar] [CrossRef]
  59. Xia, W.; Apergis, N.; Bashir, M.F.; Ghosh, S.; Doğan, B.; Shahzad, U. Investigating the role of globalization, and energy consumption for environmental externalities: Empirical evidence from developed and developing economies. Renew. Energy 2022, 183, 219–228. [Google Scholar] [CrossRef]
  60. Eurostat. Available online: https://ec.europa.eu/eurostat (accessed on 12 June 2022).
Figure 1. It’s the evolution of final energy consumption (CS) and renewable energy (RG)—million tons of oil equivalent.
Energies 16 01338 g001aEnergies 16 01338 g001b
Figure 2. Response to impulse of the variables analyzed over a 10-year period.
Energies 16 01338 g002aEnergies 16 01338 g002b
Table 1. Global resources.
Crt. No.SourceU.M.IndicatorPeriodsVolume
1ElectricitykWhconsumptiondaily283,197,500
2non-renewablekWhconsumptiondaily241,332,792
3regeneratorkWhconsumptiondaily41,864,708
5Oilbarrelconsumptiondaily58,312,700
6Oilbarrelremaining reservesuntil exhaustion1,436,099,720,310
7Oildaydays until exhaustionuntil exhaustion14,627
8Natural gasesbeptotal reservesuntil exhaustion1,081,518,350,200
9Natural gasesdaydays until exhaustionuntil exhaustion56,922
10Coalbepreservationsuntil exhaustion4,294,609,821,700
11Coal daydays until exhaustion until exhaustion148,090
Source: Real-time world statistics. Accessed 12 June 2022—data processed by the authors [56].
Table 2. Intensity of greenhouse gas emissions of energy consumption in the European Union (Year 2000 = 100).
2005201020152019
European Union—28 countries96.691.988.982.6
Belgium99.991.890.785.6
Bulgaria104117.4111.697.1
Czech Republic89.683.679.473.7
Denmark93.387.872.963.2
Germany94.593.294.986.5
Estonia95.599.6101.879.8
Ireland10090.987.479.5
Greece99.694.785.274.9
Spain10287.488.579.8
French94.589.180.679.5
Croatia101.896.590.486.6
Italy97.792.187.582.2
Cyprus106.4103.9101.195
Latvia92.69685.683.8
Lithuania98.5124.5105.3102.6
Luxembourg108.7104.596.592.3
Hungary89.983.978.577.3
Malta90.187.372.758.8
The Netherlands96.897.39992.4
Austria102.990.283.383.7
Poland99.493.392.384.2
Portugal98.884.986.978.7
Romania97.286.393.385.4
Slovenia96.699.991.289.8
Slovakia95.589.182.677.7
Finland9499.875.869.7
Sweden90.891.179.168.2
Iceland98.15648.644.8
Norway9185.892.487.9
UK98.798.189.581.8
Source: Eurostat. Data processed by the authors [60].
Table 3. Analysis results.
Dependent VariableIndependent VariablerR-SquaredF-StatisticProb (F-Statistic)
Total production (PR)Renewable Energy (RG)0.82260.676839.79150.000005
Consumption (CS)Renewable Energy (RG)−0.85840.736953.23530.000001
Source: Data processed by the authors.
Table 4. Analysis of the evolution of renewable energy and actual final consumption using the average annual change rate.
IndicatorValue
V c f = Volume of final consumption in 2020906.80
V e r = Volume of renewable energy in 2020200.30
I M A M c f = Annual average index of change in final consumption0.9921
I M A M e r = Annual average renewable energy change index1.0451
Source: Data processed by the authors.
Table 5. Vector Autoregression Estimates.
CSPRRG
R-squared0.7213440.6512950.995655
Adj. R-squared0.5820160.4769420.993482
Sum sq. resids8038.18126995.4697.14411
S.E. equation25.8814347.430172.845232
F-statistic5.1773003.735506458.2555
Log likelihood−84.41126−95.92019−42.46152
Akaike AIC9.62223810.833705.206476
Black SC9.97018911.181665.554427
Mean dependent999.36841569.135146.3679
S.D. dependent40.0320965.5812935.24167
Source: Data processed by the authors.
Table 6. Forecast.
Table 6. Forecast.
YearCSPRRG
2020906.81564.1200.3
2050835.41773.5328.8
Source: Data processed by the authors.
Disclaimer/Publisher’s Note: The statements, opinions and data contained in all publications are solely those of the individual author(s) and contributor(s) and not of MDPI and/or the editor(s). MDPI and/or the editor(s) disclaim responsibility for any injury to people or property resulting from any ideas, methods, instructions or products referred to in the content.

