1. Introduction
Research within the field of energy storage has focused on the development of innovative battery technologies that are able to reach higher energy densities than Lithium-ion batteries (Li-ion) while maintaining stability and complying with safety regulations. All-Solid-State Batteries (ASSBs) are a promising technology to meet these conditions due to their high theoretical energy density and use of an ionic conductive solid electrolyte (SE) [
1,
2,
3,
4]. The use of a SE, as opposed to a liquid and flammable electrolyte, is associated with improved cell safety. While these characteristics make this technology attractive, ASSBs also need to be competitive with other battery technologies in order to penetrate the market. To achieve this, ASSBs need to demonstrate a longer cycle life, lower production cost, and reduced environmental impact compared to other technologies. Furthermore, they require production processes that are highly automated and scalable [
3,
4,
5].
One major challenge with the development of ASSBs is the reduction in cell performance and cycle life caused by the degradation of the SE [
6,
7]. Various classes of SEs have been investigated for their ability to improve ASSB cell performance, including sulfides [
8,
9], polymers [
10,
11], and oxides [
12]. Nonetheless, the degradation of the SE remains critical. SE decomposition is caused by the direct contact between a high-voltage cathode material, such as Lithium Nickel Cobalt Manganese Oxide (NCM), and the SE while at high potentials during charging. This direct contact leads to interfacial reactions between the SE and CAM, resulting in the degradation of the SE and a decrease in cell performance [
4].
To overcome this challenge, the addition of a protective coating to the CAM has been investigated and found to improve cell performance [
2,
4]. The coating increases the mechanical integrity of ASSB cells and acts as a diffusion barrier. Further, it enhances ionic conductivity, which in turn often leads to a higher initial discharge capacity compared to uncoated CAMs [
1]. While the protective coating has been found to improve cell performance, the degree to which this improvement occurs is dependent on various properties such as the thickness and uniformity of the coating applied. For this reason, a variety of coating materials and techniques are currently being investigated.
In terms of coating materials, both binary and ternary oxides have been explored, including ZrO
2, Al
2O
3, SiO
2, LiTaO
3, Li
2SiO
3, Li
3PO
4, and LiNbO
3. However, the use of ternary oxides as CAM coatings has proven to be the most successful due to their ability to prevent SE degradation in ASSB cells [
1]. To be effective, CAM coatings for ASSBs should [
13]:
- ▪
provide a wide electrochemical window, which encompasses the operating voltage of the cathode as well as matching the electrochemical window of the electrolyte;
- ▪
have minimal reactivity with the SE and the CAM;
- ▪
maintain sufficient (or increase) ionic conductivity; and
- ▪
demonstrate minimal contact resistance between both the SE and the coating and the coating and the active material.
Current research has shown that the ternary oxide, lithium niobate (LiNbO
3), leads to higher ionic conductivities than other coating materials [
1,
2]. However, as stated previously, the effectiveness of the coating is dependent on its morphological properties, such as thickness and uniformity, once applied, and its functionalization is not yet fully understood. Ideally, coating methods should be able to generate a shell with a specific thickness that allows for contact between CAM particles, yet inhibits SE degradation [
2].
There are a variety of suitable coating methods for CAMs that are under investigation, including both physical and chemical deposition processes. These methods can differ in their ability to generate coatings with specific morphological properties. With a focus on the coating requirements for ASSBs, processes for depositing protective films on powdery CAMs include: Atomic Layer Deposition (ALD) [
14]; Chemical Vapor Deposition (CVD) [
15]; Physical Vapor Deposition (PVD), or more specifically Magnetron Sputtering (MS) [
16]; and Pulsed Laser Deposition (PLD) [
17,
18,
19]. Wet coating techniques have also been explored, including Sol–Gel derived synthesis (SG) [
20] and Spray Coating (SC) [
21,
22]. To the best of the authors’ knowledge, none of the above coating technologies have been commercially established for ASSB CAM coating on an industrial scale.
To help scale up the coating methods for ASSBs, more research is needed to determine how each technology will perform from a technical, economic, and environmental perspective, including coating quality, operating costs, and CO
2 emissions. While the environmental impacts of conventional Li-ion batteries are relatively well understood, this is not the case for ASSBs, with only a few environmental assessment studies available [
23]. For Li-ion batteries, the CAM has been found to contribute 30–40% to the overall potential impact on climate change (measured in kg CO
2-equivalents) [
24,
25,
26]. Since the CAM is similar for both conventional Li-ion batteries and ASSBs, the additional environmental impacts due to coating the CAM need to be assessed to fully understand the environmental impacts of ASSBs. Furthermore, the technical feasibility of the coating also needs further consideration, as the purpose of the coating is to improve cell performance and allow for ASSBs to become competitive alternatives to conventional battery technologies.
The overall goal of the work presented in this paper is to evaluate the environmental impact and technical feasibility of two coating techniques for CAMs at an early stage of process development. In particular, two vacuum-based, thin-film techniques for coating NCM811 particles with LiNbO
3 were selected for evaluation: ALD and PVD/MS. ALD was selected since it is a well-established technology that provides superior coating uniformity compared to virtually all competitive coating processes and is highly controllable with respect to film thickness and reproducibility [
1]. Meanwhile, PVD/MS is a standard, high-rate-capable coating technology for conventional objects (such as tooling equipment, windowpanes, etc.). While PVD/MS offers versatile coating material options and has demonstrated excellent coating adhesion, it does not necessarily provide a complete and uniform coating on delicate materials, such as powders. Since the necessity for a complete covering of the particles with a uniform coating is still to be proven, PVD/MS was also selected for further investigation within this paper (further details regarding ALD and PVD/MS are presented in
Section 2).
ASSBs are still an emerging technology, with research being conducted on a laboratory scale. Therefore, the uncertainty of how these innovative laboratory processes will scale to production is high during this development stage. Nonetheless, this early stage of research and development opens a unique opportunity to simultaneously evaluate the environmental impacts associated with these processes before they are implemented at larger production scales. Thus, assessments at this stage can be used to provide recommendations to process engineers and decision-makers at a time when changes can be implemented more readily compared to mature technologies [
27,
28,
29] However, challenges exist for conducting environmental assessments of emerging technologies at an early stage of development, including data availability, uncertainty, process scalability, and comparability.
This paper addresses the challenges of early-stage evaluation of the environmental impacts of two coating methods by providing a methodology for supporting the environmental assessment results with a qualitative technical feasibility assessment. It further provides recommendations to process engineers and decision-makers and discusses challenges that still need to be addressed with further research. Further details regarding environmental assessment at an early stage of development are presented in
Section 3.
2. ALD and PVD/MS for Coating Powdery CAMs
ALD and PVD/MS are vacuum-based, thin-film coating techniques that can be used for coating powdery CAMs. ALD is a special type of CVD and is considered one of the most attractive thin-film deposition techniques, where film conformality, uniformity, and thickness controllability are crucial aspects [
30]. The technique relies on successive, separated, and self-terminating gas–solid reactions, typically involving two gaseous reactants. These self-limiting surface reactions enable precise control over film thickness and guarantee excellent coverage and uniformity on complex-shaped geometries and particle-based systems. ALD enables the fine-tuning of film composition and growth at the atomic scale and can be performed at low deposition temperatures (typically below 300 °C).
In terms of ASSB cell production, ALD is a valuable technique to utilize since it allows the direct deposition of material onto powdery substrates and eases modification and interface tailoring, with the aim of improving ionic conductivity and stability. ALD is thus an exceptional tool for screening the influence of varying material composition and film thickness on ionic conductivity. There have been significant efforts dedicated to the development of ALD processes to produce lithium-containing compounds and materials for use within ASSBs. For example, lithium carbonate was first successfully synthesized by Putkonen et al. in 2009 [
31]. Subsequently, several other ALD-based ASSB materials have been produced, such as lithium lanthanum titanate [
32], lithium alumina [
33], lithium tantalate [
34], lithium phosphate [
35], lithium lanthanum zirconia (LLZO) [
36], and lithium phosphorus oxynitride (LiPON) [
37].
MS is one of the most established PVD processes. This technique is based on the atom bombardment of a solid target with high-energy ions (eV), usually ionized argon. Throughout the process, the target is being atomized, which enables the coating species to drift in a directional manner from the target to the substrate. As the sputtered coating species move directionally, a layer is formed on the surface of the substrate. The surface to be coated must, in principle, be uncovered, otherwise, the formation of a homogeneous layer will be impaired.
The benefit of the MS technique results from the extraordinary variety of usable coating materials such as carbon, pure metals, metal alloys, metal oxides, nitrides, carbides, as well as complex composites. Furthermore, deposition rates as high as 10 nm/min and even greater than 100 nm/min (dependent on the coating material) are a paramount property of MS. However, the use of fine (D
50 approximately 5 µm) or ultra-fine (D
50 < 5 µm) particles can result in undesired particle agglomeration or powder accumulation. These particulates exhibit strong adhesive surface and field forces (van der Waals forces, electrostatic and magnetic forces), therefore, material bridges (solid-state bridges, and form-fitting bonds) may occur through hooking. This is crucial under the working conditions for MS, where techniques to avoid these effects, such as dispersing liquid phases or sufficiently impulse-transmitting gas molecules, cannot be applied. Since it is imperative to deagglomerate, fluidize, and revolve particle collectives with a controllable dwell time in the course of the coating procedure, various approaches have previously been published [
38,
39,
40,
41,
42,
43,
44,
45,
46,
47,
48].
While PVD machinery for coating powders does currently exist, to the best of the authors’ knowledge, a corresponding sputter system has not yet been commercialized [
49]. Furthermore, there are only a few publications so far regarding the synthesis of protective coatings on CAMs via MS [
50]. With the objective of efficiently overcoming cohesive and adhesive holding and frictional forces, a proprietary technological solution was developed [
51] and has been used in this paper (refer to
Section 4.2). The embodiment consists of vibrating fine screen meshes inserted into a rotating powder reservoir with an opening towards the coating zone (refer to diagram in
Section 4.1.
3. Environmental Assessment at an Early Stage of Development
To quantify the environmental impact of a product system, such as the production of ASSB cells, Life Cycle Assessment (LCA) can be used. This methodology follows the international guidelines ISO14040:2006 [
52] and ISO14044:2006 [
53] and can be applied throughout a product’s life cycle from raw material extraction (cradle) through to final disposal (grave). LCA is usually applied retrospectively, assessing technologies that are already on the market. However, it has been recognized that the application of LCA to emerging technologies and technologies that are still under development, such as ASSBs, is also beneficial [
54,
55,
56,
57]. LCA applied at an early stage of development is often referred to as prospective LCA, although ex ante, future-oriented, early-stage, anticipatory, explorative, and scenario-based assessments are also terms that have been applied [
27,
58,
59].
There are challenges when conducting a prospective LCA, such as unrepresentative or missing data, scalability to larger production scales, and comparability to conventional technologies [
58,
60,
61]. While these challenges also exist for retrospective LCA, the uncertainty introduced due to these challenges is considered to be greater in prospective assessments [
61]. Various methods can be applied to overcome these challenges; however, both the uncertainty of the assessment and the Technology Readiness Level (TRL) of the product system should be taken into consideration when interpreting the results. Low TRLs indicate immature technologies with low market penetration, whereas high TRLs indicate mature technologies that have entered the market. At low TRLs, there is greater uncertainty regarding how the technology will be scaled and if the technology will alter the technology mix that already exists on the market. Because of this, at low TRLs, theoretical yields and efficiencies can be used to fill data gaps and to define future, more optimized scenarios for the technology being assessed. Linear scaling should be avoided since it is highly likely that industrial processes will differ from optimized laboratory processes due to economies of scale, changes in energy and materials efficiencies, and changes in waste management and emissions [
56,
62,
63]. Alternative methods, such as learning and experience curves, can be applied once more information is known regarding the technology, particularly once higher TRLs have been reached.
LCA studies of ASSBs have previously applied defined scenarios for upscaling from laboratory scale to larger production scales [
29], considering improvements in material efficiency, energy consumption, and waste management. Expert knowledge regarding the processes and technical feasibility assessments can also be used to support the definition of scenarios for prospective environmental assessments. A technical feasibility assessment of defined production processes for ASSBs has previously been conducted, where specific criteria were defined and evaluated to determine the extent to which ASSB production can utilize the industrial-scale production processes of Li-ion batteries [
5]. The ability to use processes that are already available at a large scale would ease the entrance of the technology into the market. A technical feasibility assessment is therefore useful at a process level to evaluate the scalability and optimization potential of specific processes within ASSB production, including the coating of the CAM.
4. Methodology
ALD and PVD/MS techniques were used to deposit a LiNbO
3 coating on the surface of NCM811 particles (particle size D
90 = 6.9 µm; D
10 = 1.5 µm). The methodologies for the ALD and PVD/MS techniques are described in
Section 4.1 and
Section 4.2. The methodologies for the environmental and technical assessments are described in more detail in
Section 4.3 and
Section 4.4. Process-specific data were collected for each technique, including electricity and material consumption.
4.1. Atomic Layer Deposition of Lithium Niobate on NCM811
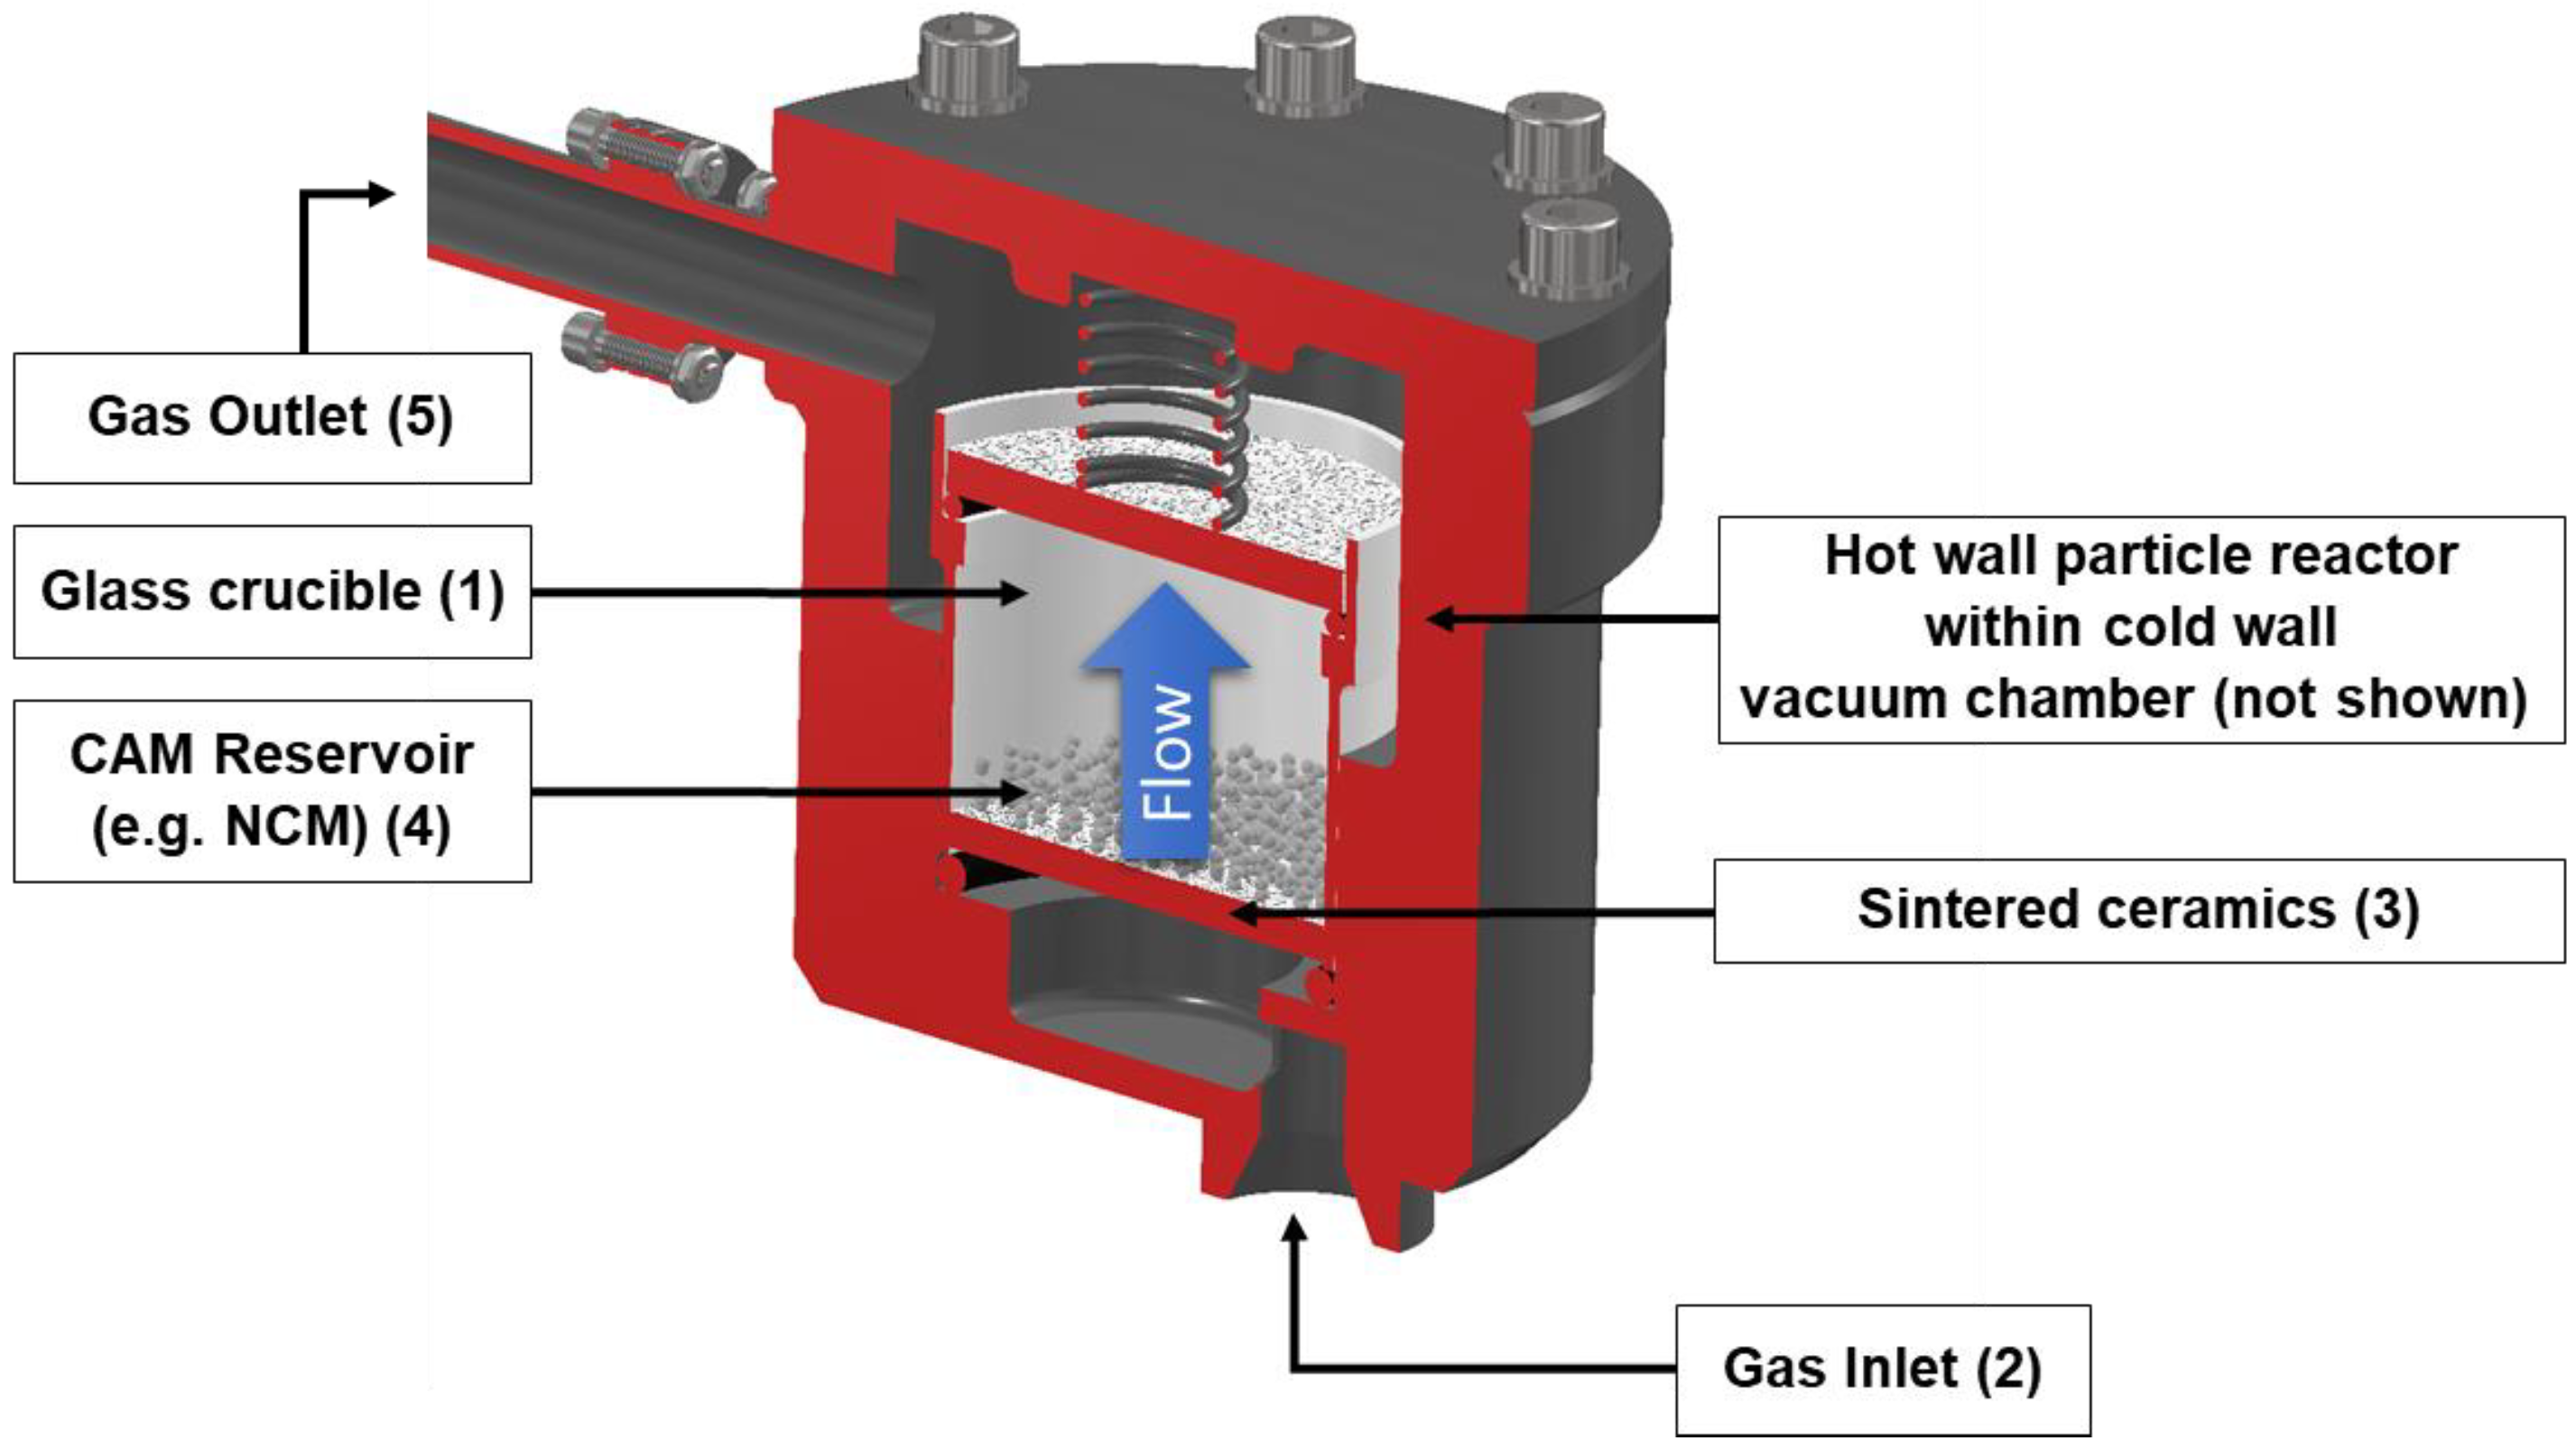
A modified Beneq TFS 500 was used for the thermal ALD procedure. Specifically, a modified forced fluidized-bed reactor was selected since it is advantageous for deposition onto particle-based systems such as NCM811 particles. The particle reactor (depicted in
Figure 1) is placed within a cold wall vacuum chamber and consists of a glass crucible (1) that contains the substrate material to be coated. During the coating procedure, purge gas and precursor gas are introduced through the gas inlet (2), which then flows through the sintered ceramics (3), which act as a particle barrier, to the CAM reservoir (4) and out of the gas outlet (5).
For the deposition of LiNbO3, multiple cycles of lithium (Li) and niobium (Nb) precursors were needed. Each supercycle consisted of one subcycle of Li precursor and deionized water followed by four subcycles of Nb precursor and deionized water. The following precursors were used in the process:
- ▪
Li precursor: lithium tert-butoxide [LiOtBu, (CH3)3COLi, Strem Chemicals Inc.]
- ▪
Nb precursor: niobium ethoxide [Nb(OEt)5, Et = −CH2CH3, Strem Chemicals Inc.]
Deionized water was used as the oxidant within both subcycles and argon was used as the carrier and purge gases. The pulse step for every precursor was performed using the following structure: support flow increase, precursor pulse, purge phase, and outgassing. The purging and outgassing step is required within each subcycle to remove any unreacted material and byproducts prior to the next pulse of precursor. This is also referred to as the pulse and purge phase of the ALD procedure. LiOtBu and Nb(OEt)5 were sublimed at 170 and 155 °C, respectively. All depositions were performed at a temperature of 235 °C.
In order to determine the amount of argon that was consumed during the pulse and purge phases, the flow of argon was recorded during the coating procedure in standard cubic centimeters per minute (sccm). The ALD system was further filled with argon before the process. This is not measured, so an estimation was made based on the size of the chamber being filled and the density of argon. The amount of argon required for this is therefore dependent on the size of the chamber. For the purge gas, the quantity of argon consumed depends on the number of cycles required for the process.
A total of 7 g of NCM811 was introduced into the CAM reservoir to be coated. It should be noted that this quantity of input material is lower than the capacity of the ALD reactor used. To measure the precursor consumption, the precursor containers were weighed before the coating process, and again after multiple processes were conducted. Due to the very small mass of precursor consumed per process, the precursor containers were not weighed after each process. Therefore, the number of coating cycles along with the mass of total consumed precursor was used to determine the approximate amount of precursor consumed per cycle. The quantity of the deionized water consumed was calculated assuming a 1:1 molar ratio to the precursors.
The ALD process further requires cooling water. The cooling water is used to cool the cold wall vacuum chamber and the vacuum pump. The laboratory cooling system recovers the water and is used for multiple processes within the laboratory. Since the water is recycled with minimal losses, the consumption of water for cooling is considered negligible at this scale. The input quantities are summarized in
Table 1.
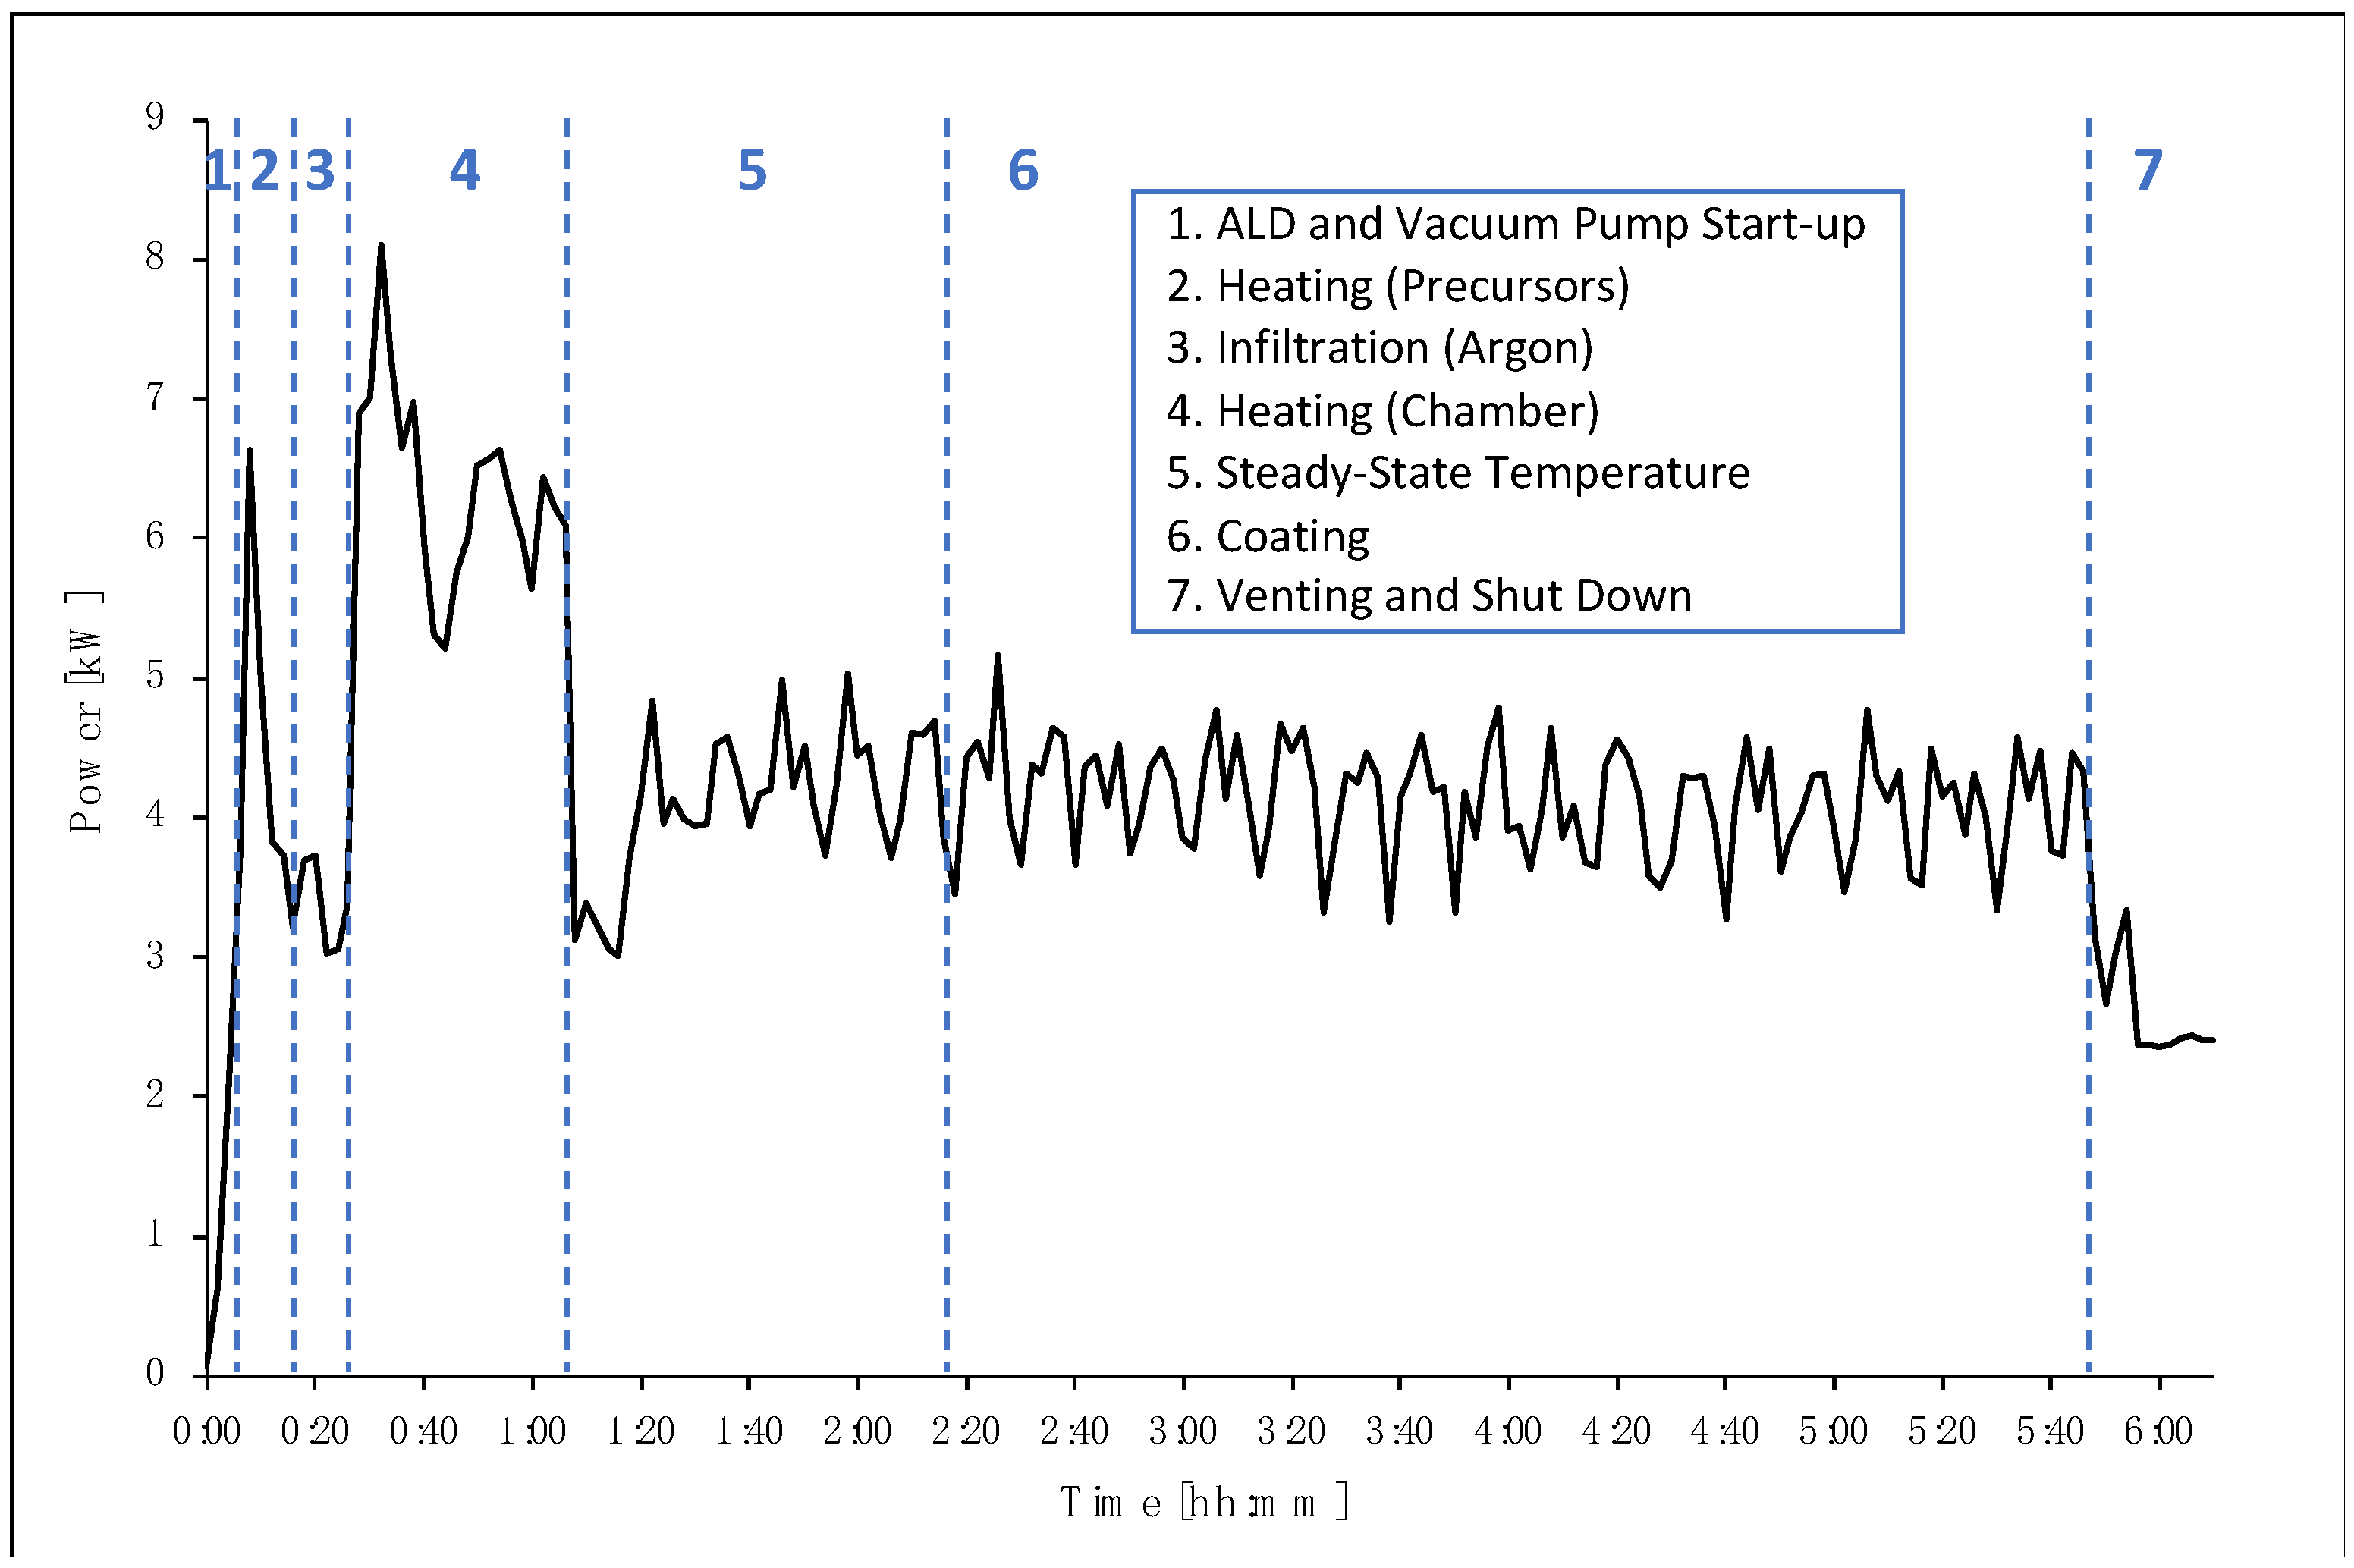
Electricity consumption was also measured during the ALD coating process using an active power meter and a data logger (CS Instruments GmbH, Harrislee, Germany). The process was recorded and the data was analyzed for the consumption of electricity during the main steps of the procedure of thermal ALD, including ALD and vacuum pump start-up, heating of the precursors, infiltration of argon, heating of the reactor chamber, coating, and venting (as shown in
Figure 2).
Numbers 1–3 in
Figure 2 illustrate the start-up of the vacuum pump, the heating of the Li and Nb precursors, and the infiltration of argon, respectively. The second broader peak (number 4 in
Figure 2) represents the heating of the chamber (where the particle reactor is located) to a temperature of 235 °C. Once the chamber has reached the set temperature, the system is given time to reach a steady state (number 5 in
Figure 2), stabilizing at the required temperature and pressure before the coating process begins. In this case, 70 min was set before the coating process started. This time could be reduced and optimized for this process, and in particular, for larger-scale production. The coating process itself (number 6 in
Figure 2), including the pulse and purge phases, lasted for 210 min and consumed an average power of 4.14 kW. The final step (number 7 in
Figure 2) is the venting of argon from the chamber prior to switching off the device.
Table 2 summarizes the steps, along with the average power consumption and time of each step. This breakdown is useful for deriving recommendations for the reduction of electricity consumption by optimizing the time at each step.
4.2. Physical Vapor Deposition of Lithium Niobate on NCM811
The PVD/MS setup with a Direct Current (DC) sputter source is depicted in
Figure 3 and is sized for a laboratory-scale particle coating batch process. During the process, powder deagglomeration is achieved by sieving and rotation. As illustrated in the figure, electrical energy is converted (1) into Ultrasonic (US) oscillations for powder sieving. The US oscillations are transmitted via a rotary axis (2) to the powder reservoirs (3a, 3b). Each powder reservoir contains one vibrating sieve (4a, 4b). Opposite the rotary axis, there is an opening where particulates that have penetrated the sieve are being exposed to incoming sputtered species (4). The sputtered species are released from the lithium niobate (LiNbO
3) target (5). The powder vessel must be intermittently rotated during coating. This was conducted by hand during experimentation; however, this will be optimized for larger-scale production.
For carrying out the coating process, 15 g of NCM811 was inserted into the powder reservoir. The PVD/MS coating process further involves the implementation of a custom-made, carbon-enriched LiNbO3 target. The target consists of a 3 mm thick LiNbO3 disk containing 5 wt.% carbon and was purchased from a supplier. This disk is bonded on a copper back plate, using indium as the bonding agent. The entire target weighs 615 g, of which approximately 146 g is LiNbO3. As very little LiNbO3 is consumed throughout one coating process, the target can be reused in multiple batches.
To estimate the mass of carbon-enriched LiNbO3 being consumed within one batch, the sputtered LiNbO3 material was captured on copper foil during the coating process. The foil was placed in front of the opening of the rotating powder reservoir to ensure the collected sample was representative of that consumed from the target during the coating process. Weighing the copper foil before and after the process revealed that the consumption of the target during the coating process was approximately 0.05 g.
During the process, pumping took place to reach a pressure of approximately 4 × 10
−2 Pa. The working pressure for sputtering was approximately 2.2 × 10
−1 Pa. The MS gas rate was set at 20 sccm of argon and the US generator was swept at a frequency range of 34.35–34.70 kHz. The intermittent rotation of the powder vessel was executed every 2 min, which corresponds with the time required for all introduced powder to transfer from the surface of the upper sieve down to the lower reservoir. The PVD/MS system also required cooling water that circulates in a closed loop with minimal losses. Therefore, water consumption was considered negligible at this scale. The total process time was approximately 80 min.
Table 3 summarizes all input quantities for this process.
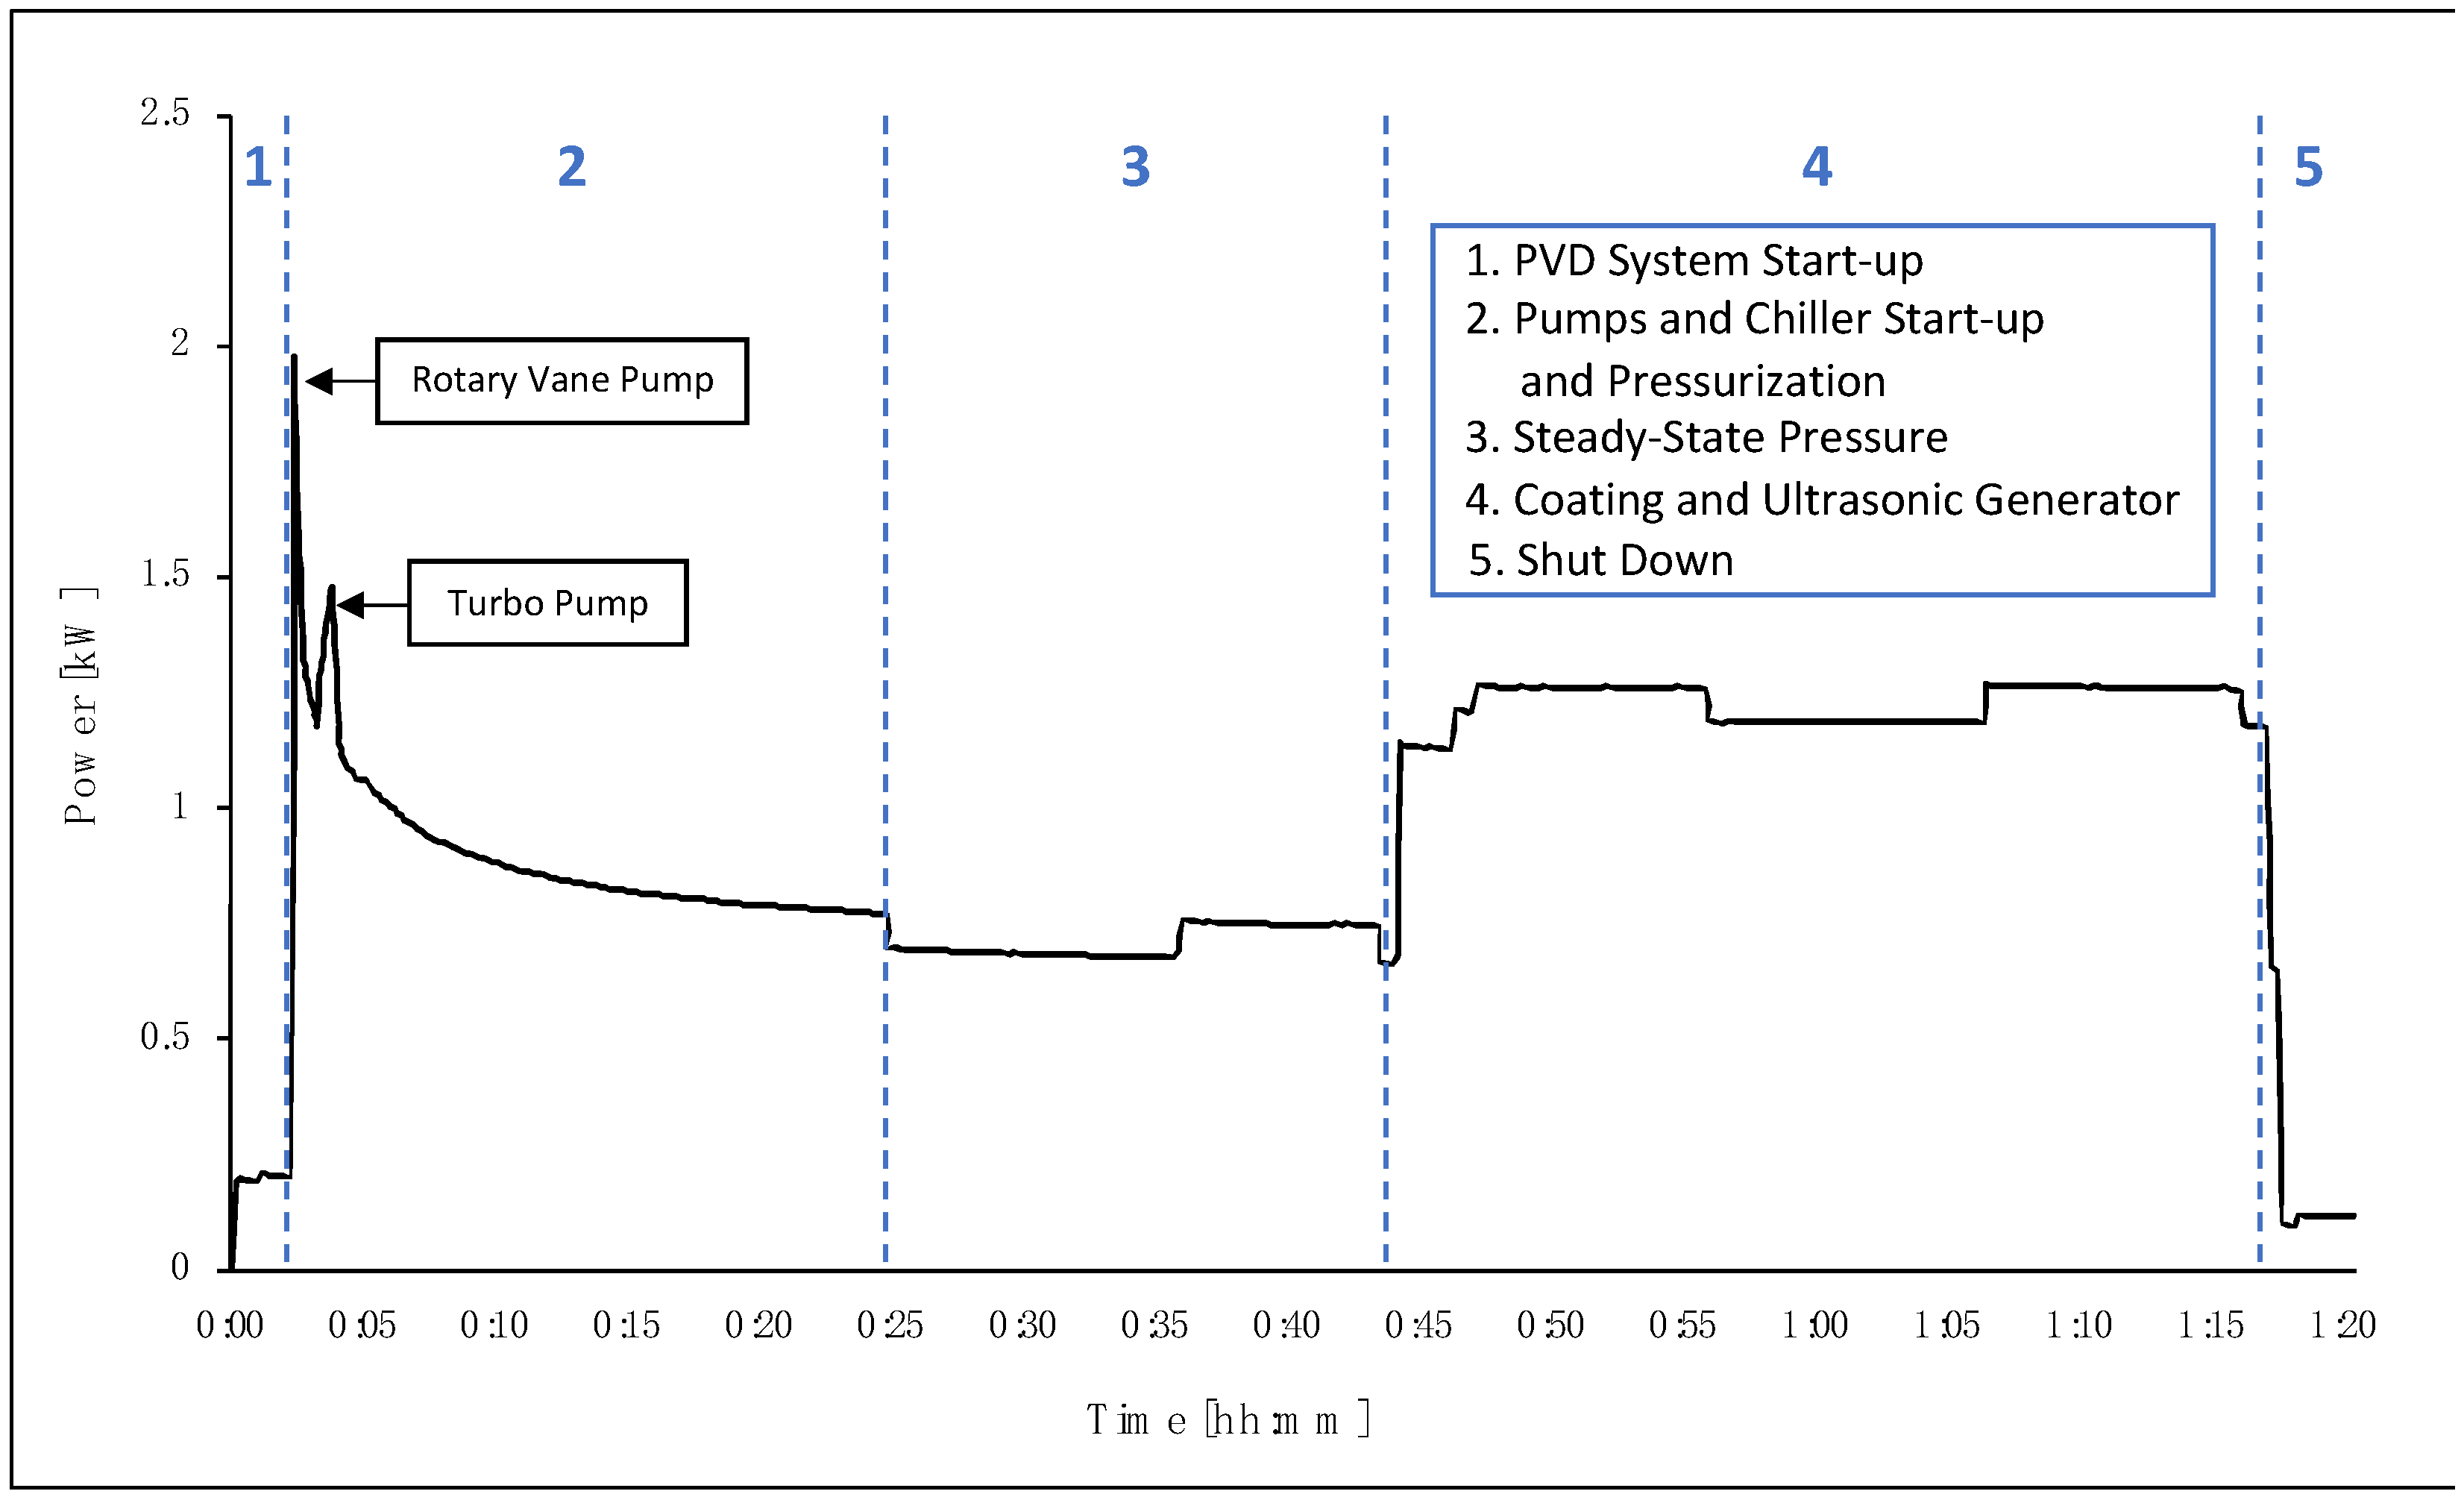
In terms of electricity consumption, the PVD/MS system contains multiple consumers, including the chiller, rotary vane pump, turbo pump, plasma generator, and US generator. The chiller and US generator have constant power consumption measured at 0.14 kW and 0.05 kW, respectively. The power consumption was recorded throughout the process and combined with the measurements from the constant power consumers, as shown in
Figure 4. The US generator is switched on only during the coating process (number 4 in
Figure 4), whereas the chiller is on throughout the entire process (numbers 1–5 in
Figure 4). The first major peak in the figure is due to the start-up of the PVD/MS system, including the start-up of the rotary vane pump, followed by the turbo pump. The decrease in power consumption represents system stabilization at the process-specific pressure. Once the set pressure has been reached, the system is in a steady state and is ready for the coating process to start. Similar to the ALD process, the time that the system remains in a steady state can be optimized and reduced, particularly at larger scales. It should also be noted that the chiller was far oversized for the process and can be optimized in further setups.
The total coating time for the PVD/MS process was 33 min, including approximately 3 min pre-ignition of the target.
Table 4 summarizes the average power and time for each step. The consumption of the coating step itself was approximately 1.23 kW, including the consumption of the US generator.
4.3. Environmental Assessment
An environmental assessment was conducted following the international guidelines for conducting a Life Cycle Assessment [
52,
53], as far as possible for the prospective assessment. Any deviations from the guidelines are reported in this section. The potential environmental impacts of the coating techniques (described in
Section 4.1 and
Section 4.2) were evaluated at an early stage of development to provide recommendations to process engineers. Furthermore, the goal of the environmental assessment was to identify the hotspots (parts of the processes that are contributing most to the overall environmental impacts) of the coating techniques in comparison to the production of uncoated NCM811.
The open-source software, Brightway2 [
64] was used for the assessment, along with additional Python code for data analysis. The data sources included measured data for the processes, including material and energy consumption, ecoinvent (version 3.9) datasets [
65], and literature data. Patents and stoichiometric equations were also used where data was unavailable, particularly for the production of the target and precursors.
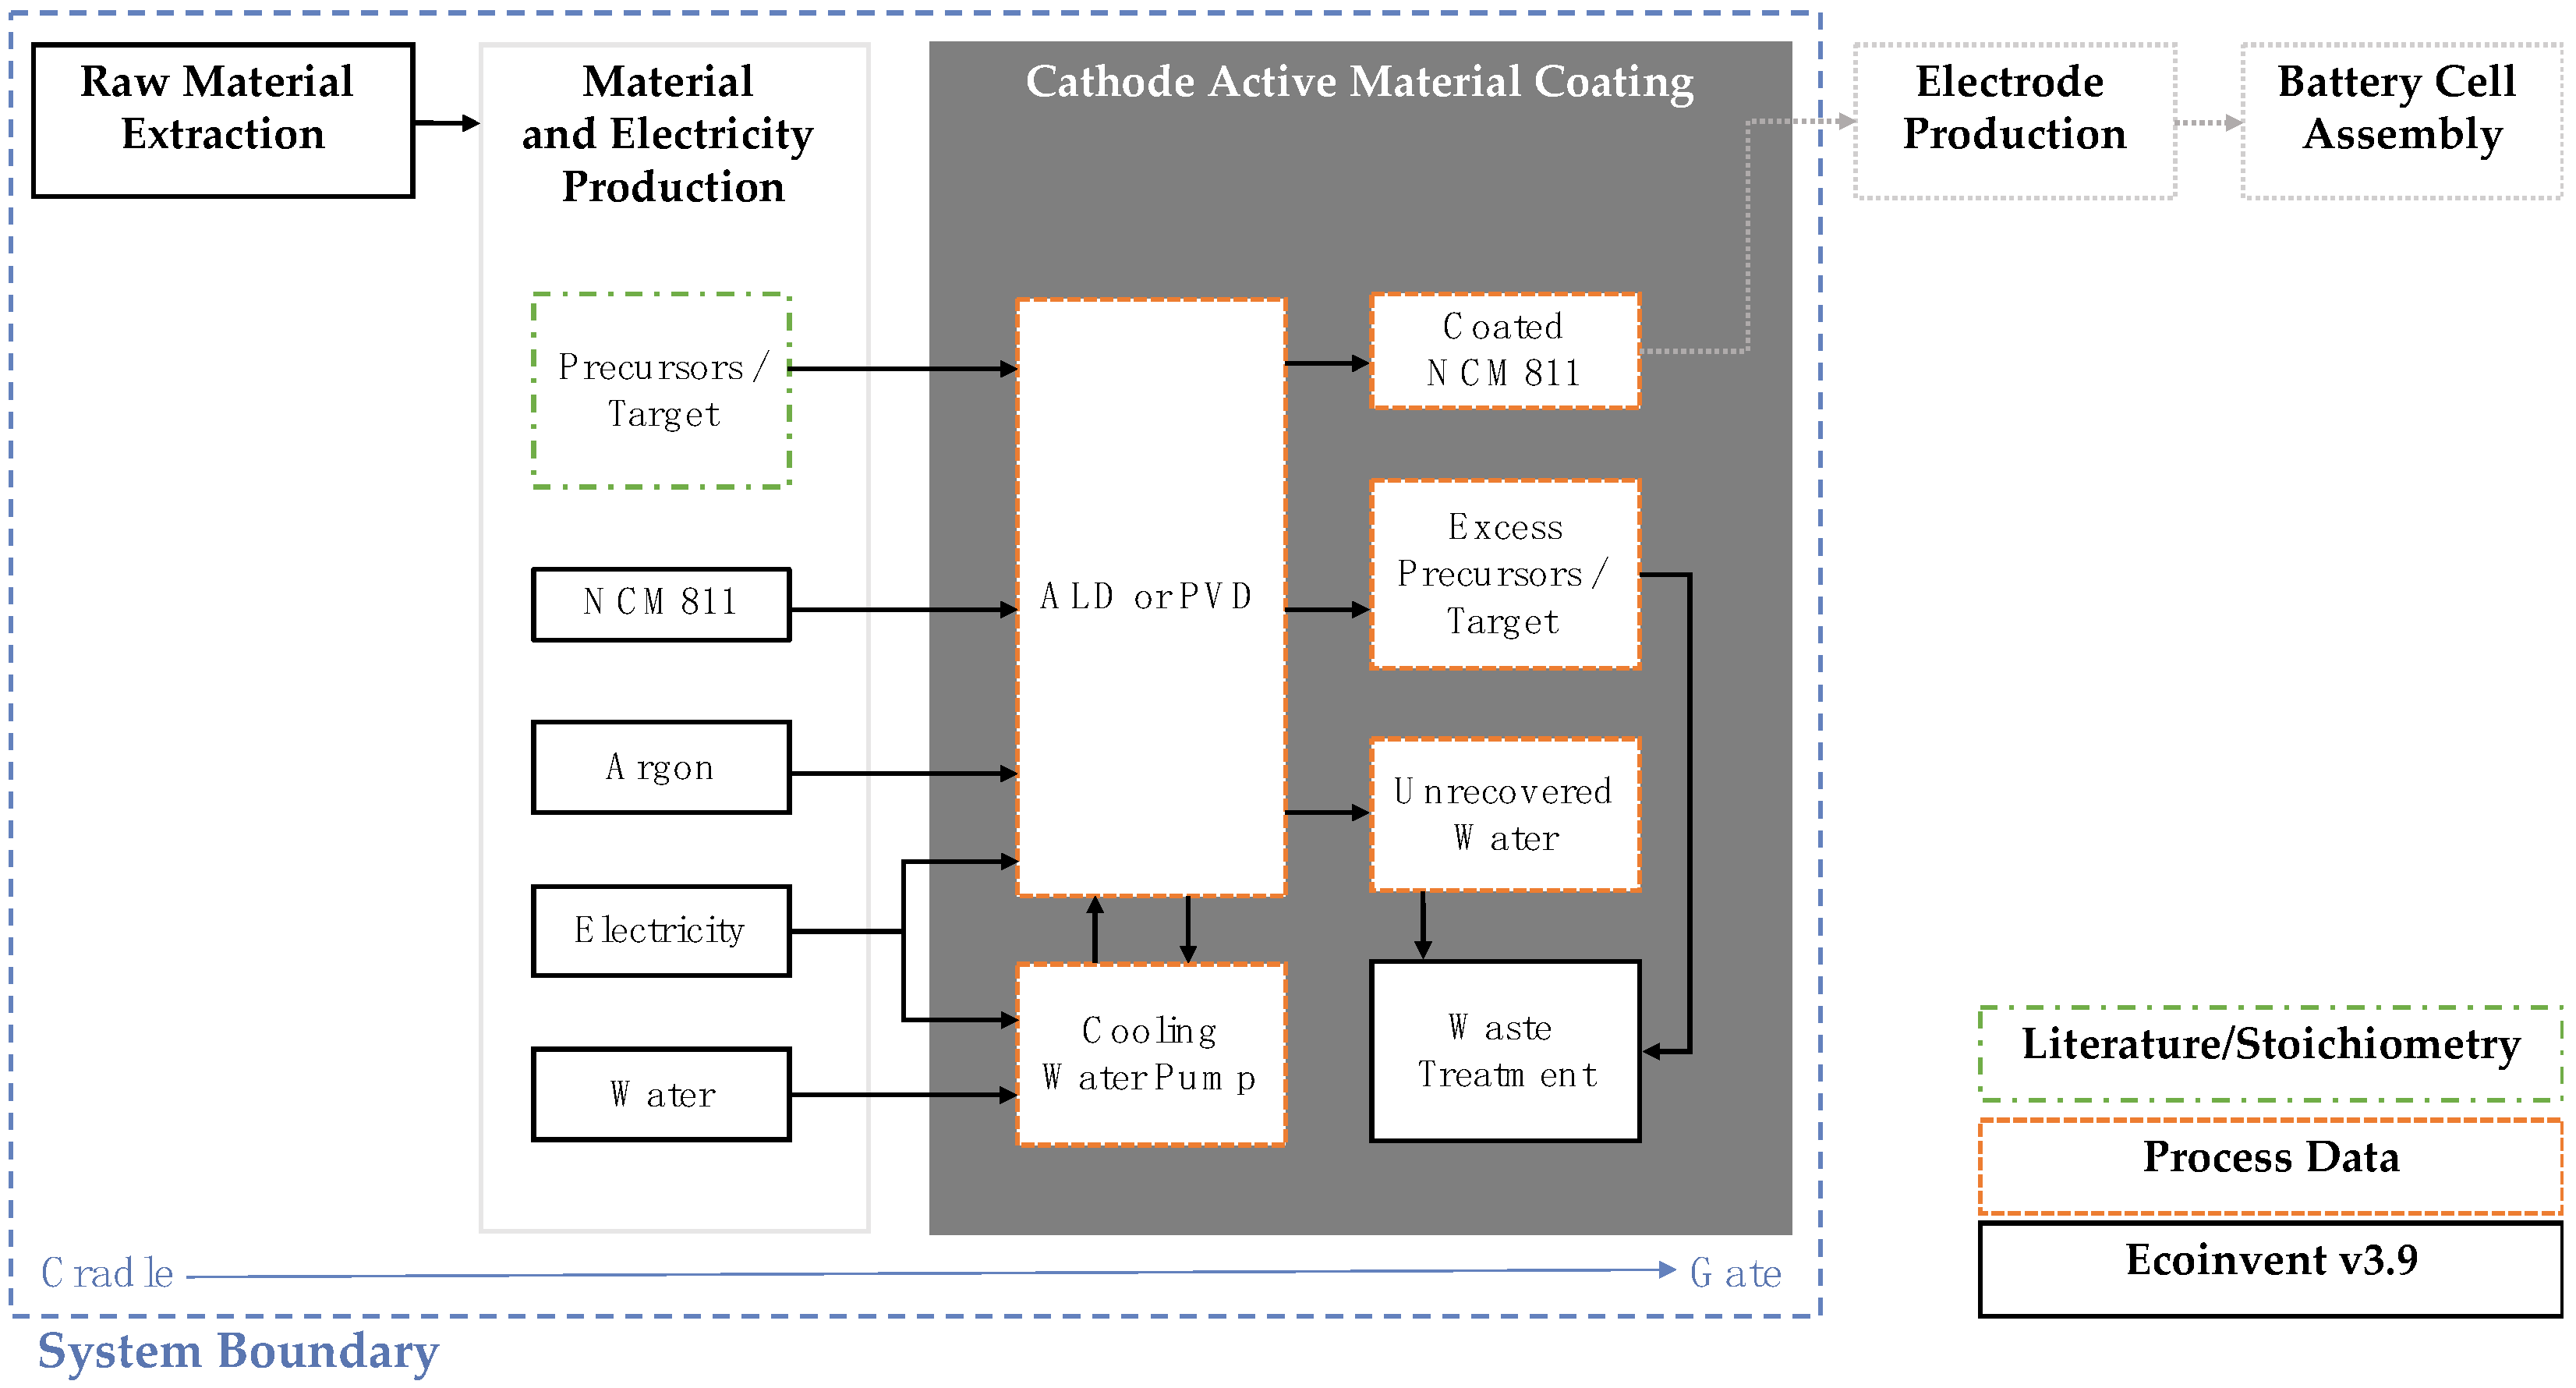
Figure 5 depicts the system boundary that was assessed for the coating techniques. The system boundary was cradle-to-gate, including raw material extraction (cradle), material and electricity production, and CAM coating (gate). The electrode manufacturing and further battery production processes were not included in the assessment.
In an LCA, a functional unit is defined that provides a reference to which the inputs and outputs of a model are collected and that describes the function of the product. A reference flow is also defined that describes the flow of materials within a process. Since the coating techniques are assessed on a laboratory scale, the reference flow is taken as the amount of input NCM811 for each process, 7 g for ALD and 15 g for PVD/MS. The functional unit is defined as 1 g of input NCM811, which deviates slightly from the recommendations in the ISO guidelines. This functional unit was selected because of the difficulty in measuring both the performance of the coating and the thickness of the coating on the surface of the NCM811 particles. These aspects are key to defining the functional performance of the coating. Since this data was unavailable at this early stage in development, a mass-based functional unit is applied.
The environmental impact categories assessed include the CML (v.4.8) [
66] impact categories: Climate Change, Energy Resources (non-renewables), and Material Resources (metals and minerals). The Climate Change impact category quantifies the potential impact due to the release of greenhouse gases throughout the life cycle. Energy Resources and Materials Resources quantify the potential depletion of resources, particularly non-renewable energy sources and raw material resources (such as metals and minerals), respectively.
As with all LCA studies, there are limitations of this study that should be considered. The processes are currently conducted at a laboratory scale and have not yet been optimized at this scale, since the techniques are still under development. Therefore, optimal input quantities of the target/precursors are still under research and the ALD and PVD/MS reactors are not operating at full capacity. Scenarios were therefore defined to take further optimization of the processes in the near future into consideration. The scenarios are summarized in
Table 5.
The base scenario (
Table 5) represents the measured data and methods described in
Section 4.1 and
Section 4.2, scaled to the functional unit of 1 g input NCM811. Since the environmental impact of NCM811 has been studied previously [
24] and found to have a large contribution to the overall impact of a battery, it is used as a reference point for the additional impact from the coating process itself. For the base scenario, the electricity mix for Germany in ecoinvent 3.9 has been used. Scenario A represents an increase in the share of renewables in the electricity grid mix. For this, a grid mix composed of approximately 90% electricity production from renewables was used as a best-case scenario. Scenario B represents an increase in the capacity of the reactors to 100 g of input NCM811 to reach the maximal capacity of the reactors. Within this scenario, the optimization of the efficiencies of the input materials is also considered by reducing the quantity of material losses.
Ideally, the coating processes should aim to have a minimal environmental impact and maximal performance benefit, including energy density and cycle life. While the performance of the cell is not explored within the environmental assessment, these aspects are qualitatively assessed with the technical assessment, as presented in the following section. Therefore, the technical assessment is used to support the environmental assessment results at an early stage of the coating process development, where quantitative performance data of the coating is not yet available.
4.4. Technical Assessment
In addition to the environmental assessment, a technical feasibility assessment of the coating processes was conducted considering the challenges and requirements for large-scale production [
5,
29,
67,
68]. Several criteria based on the method of Schnell et al. [
5] were selected and extended by additional criteria developed by the process experts. The criteria are divided into three categories—material, product, and process—based on related requirements that need to be considered with regard to potential upscaled production [
5].
Table 6 provides an overview of the chosen criteria and their definitions.
As
Table 6 shows, the material-related criteria focus on the mechanical and chemical properties of the precursors for ALD and the target for PVD/MS. The product-related criteria consider the feasibility to produce the desired coating morphology of the CAM. Finally, the process-related criteria include the throughput, the environmental conditions, the flexibility of the process towards change, the stability and reproducibility of the process, and the feasibility of different modes of operation of the coating process itself. The mode of operation includes, for example, the feasibility of implementing the process at larger scales and continuous production lines.
The technical feasibility criteria described above can be used alone to decide which technology to select for the coating process, however, by also including the potential environmental impacts and costs, a more holistic decision-making process can be promoted. While quantitative aspects, such as cell performance, can also be included in the technical assessment, at this early stage of development, this information is usually not available. Therefore, qualitative information from process experts is also valuable to make recommendations regarding the technology, as well as to further support the results and recommendations from the environmental assessment. The qualitative technical feasibility assessment criteria are therefore focused on overcoming the challenge of a lack of quantitative data, allowing for more robust conclusions to be drawn from early-stage environmental assessments. Cost has not been included at this time; however, it can be easily introduced into this method at a later stage.
5. Results and Discussion
In this section, the environmental and technical results are presented and discussed. The Life Cycle Inventory data is summarized in
Section 5.1, and the Life Cycle Impact Assessment and Interpretation are presented in
Section 5.2. The results of the technical feasibility assessment are presented in
Section 5.3.
Section 5.4 concludes by making recommendations based on the results and identifying the limitations of the study.
5.1. Life Cycle Inventory
The life cycle inventory tables for the ALD and PVD/MS process are presented in
Table 7 and
Table 8 below.
5.2. Life Cycle Impact Assessment and Interpretation
Three impact categories were assessed: Climate Change (CC), Energy Resources—fossil (ER), and Material Resources—metals/minerals (MR). These impact categories were described previously in
Section 4.3. The following results for the impact assessment are first shown for the ALD and PVD/MS systems for the reference flows of 7 g and 15 g of input NCM811, respectively. The scenario analysis follows where the results are scaled to the functional unit of 1 g of input NCM811. Since the production of the CAM has been found to contribute significantly to the overall impact of a battery cell (as stated in
Section 1), the aim of both coating techniques is to have a minimal increase in the environmental impact relative to that of NCM811 production, keeping in mind that the performance of the coated CAM also needs to be considered in the final recommendations (refer to
Section 5.4).
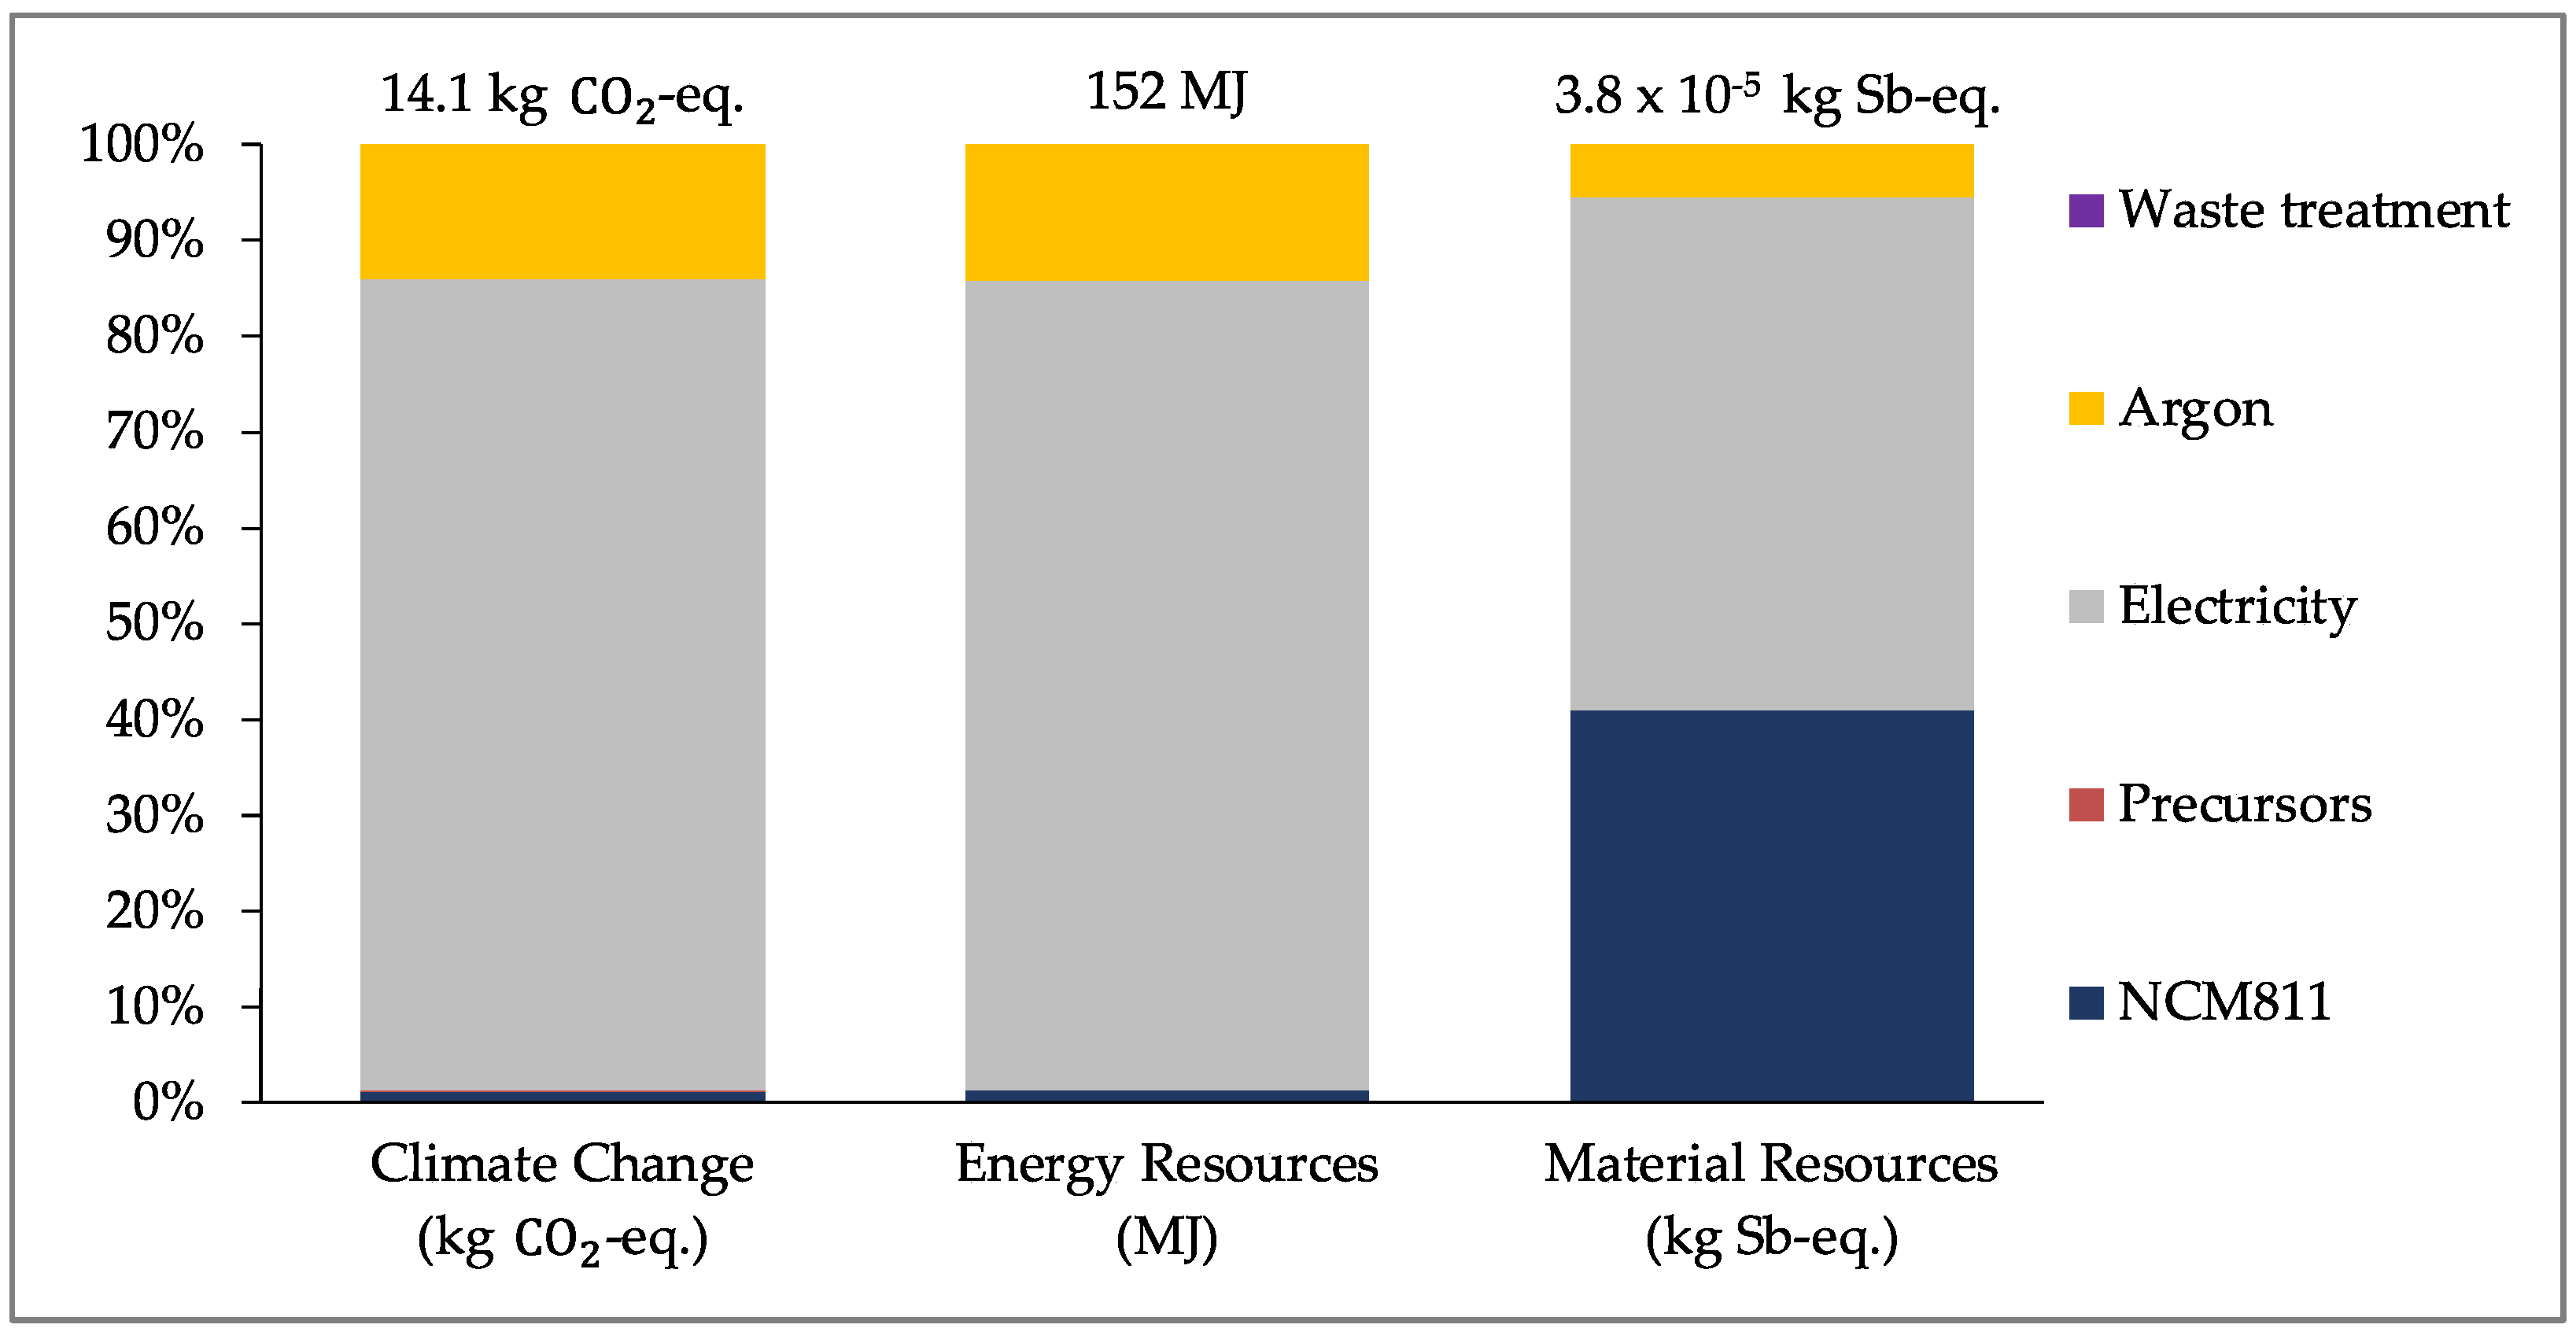
For the ALD process,
Figure 6 (below) shows the results for coating 7 g of NCM811. It should be noted that for these results, the reactor is not operating at its full capacity (approximately 100 g NCM811). As can be seen, the electricity and argon consumption contribute the most to the overall impact for both CC and ER due to the oversized reactor. The production of NCM811 is only a fraction of the total impact for these impact categories, contributing to just over 1% of the impact. For MR, the production of NCM811 contributes to almost 40% of the total impact, with the contribution of electricity consumption being approximately 53%.
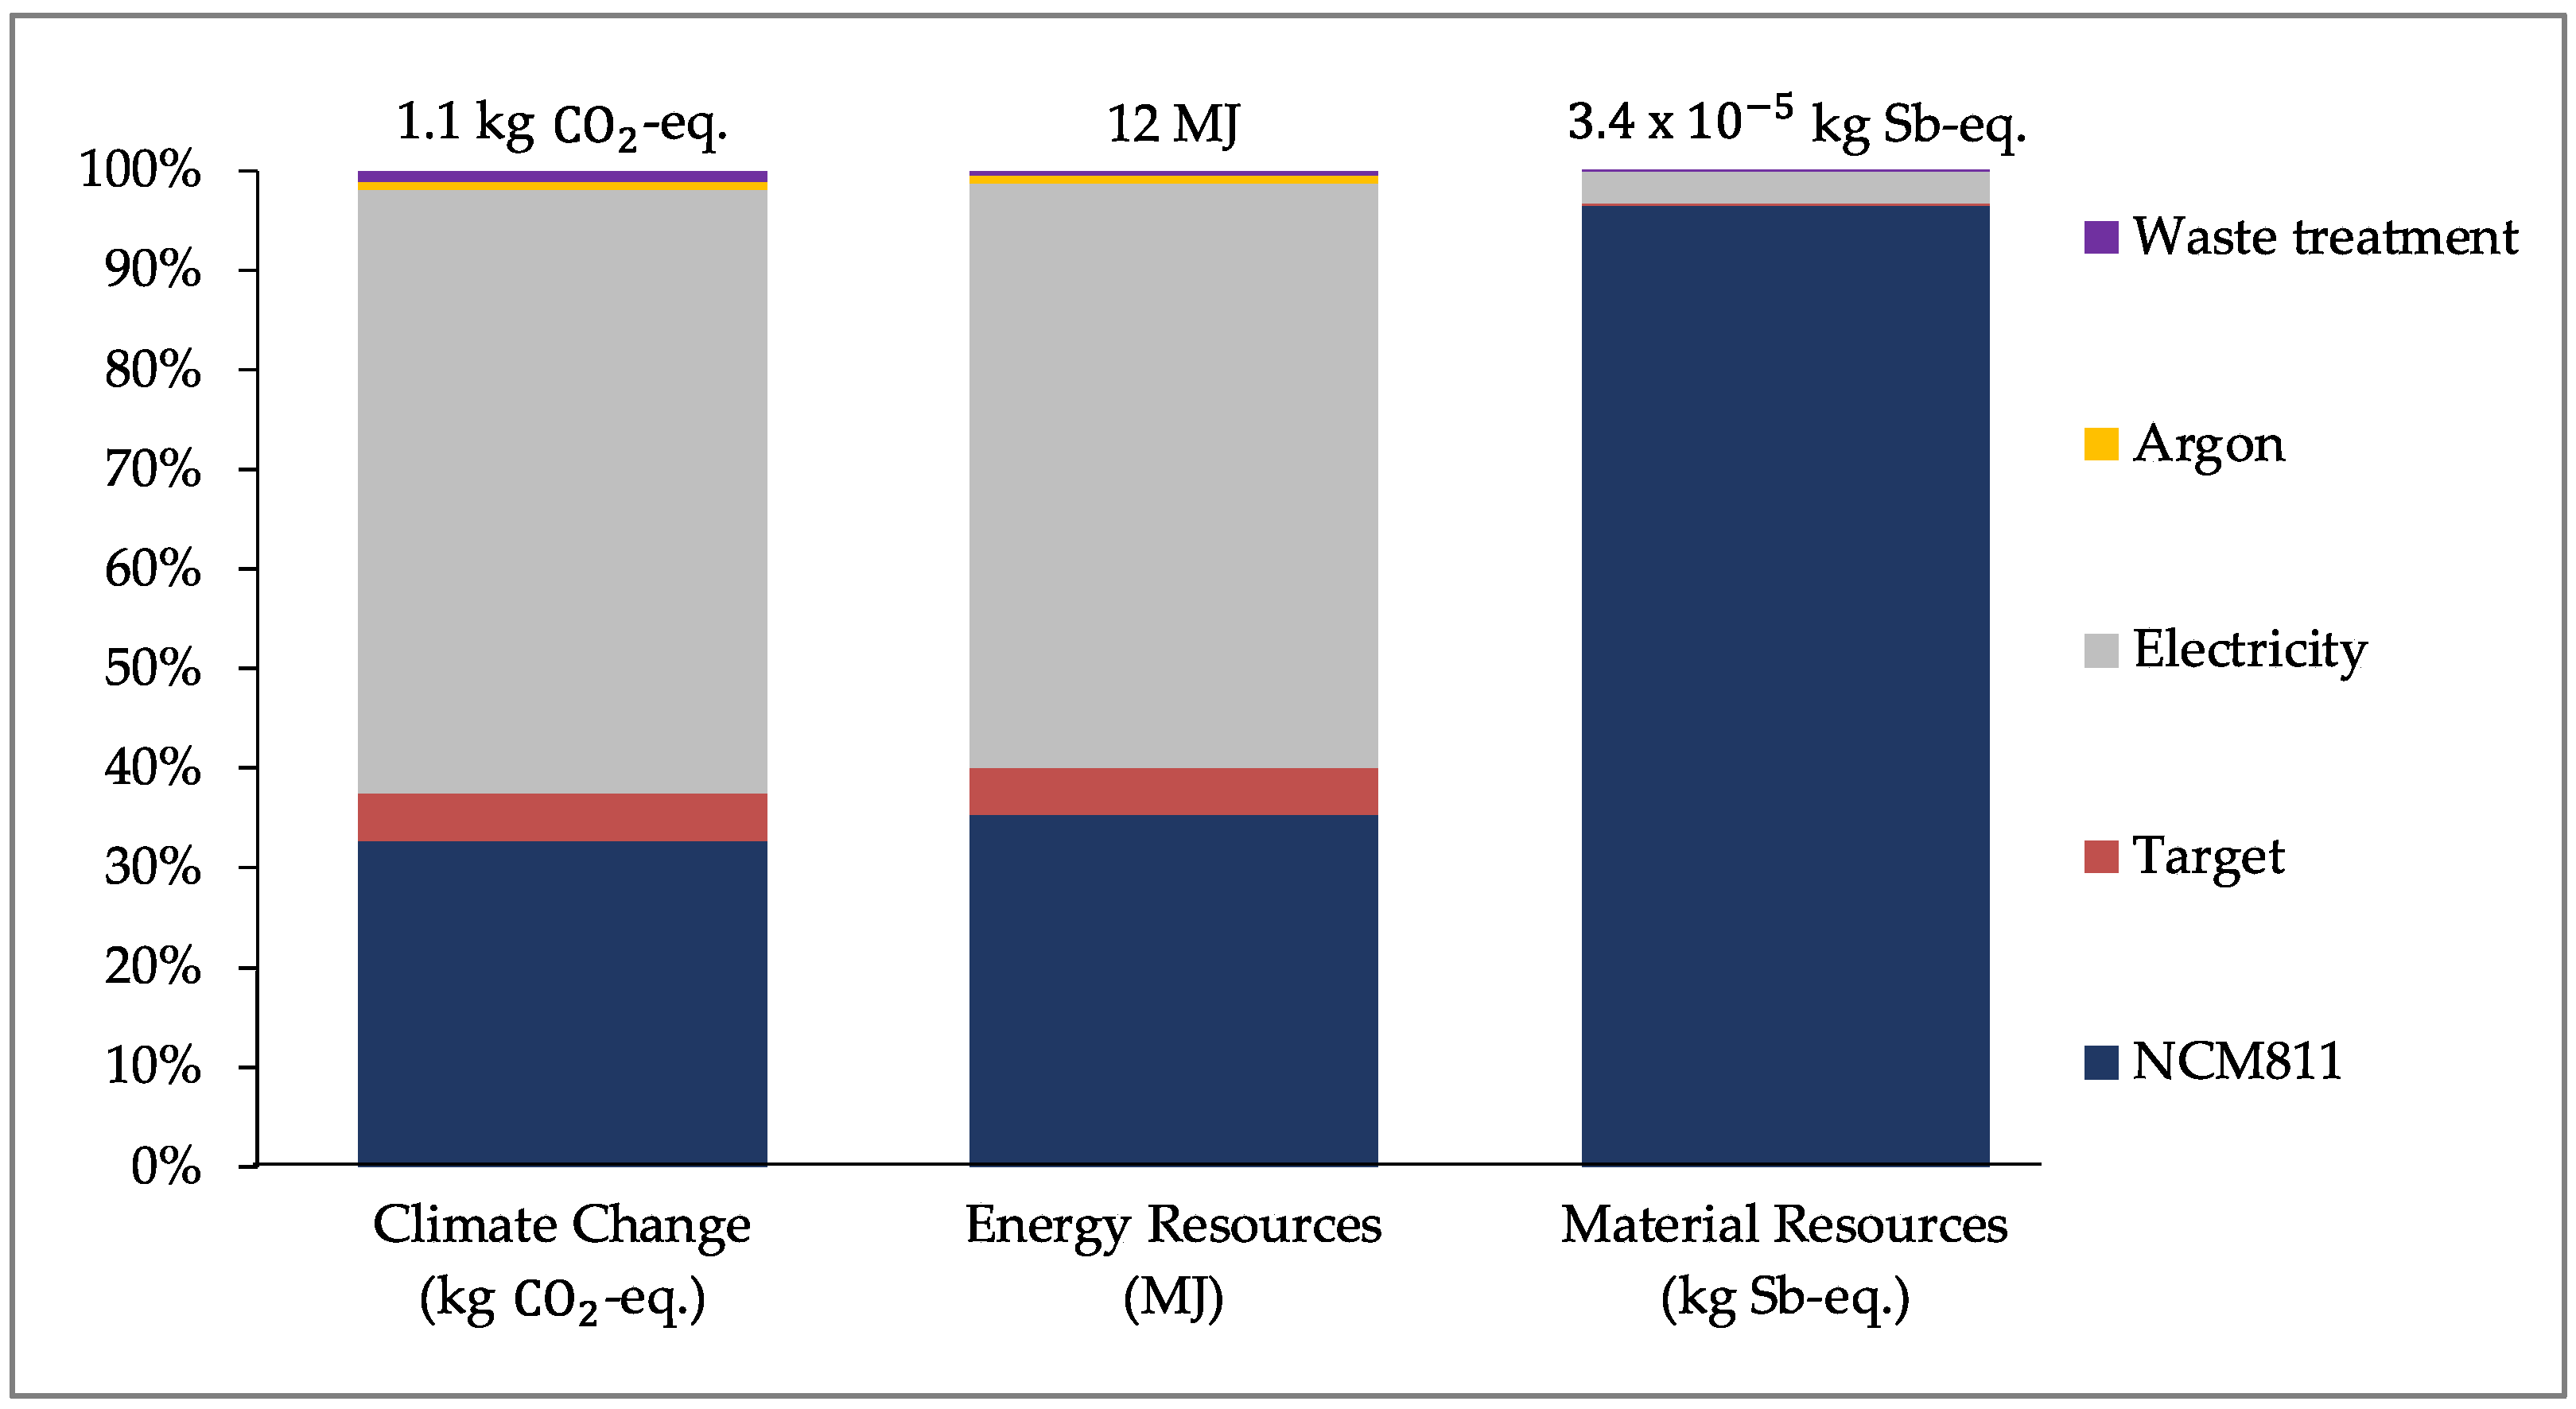
For the PVD/MS process,
Figure 7 (below) shows the results for coating 15 g of NCM811. Similar to the ALD process, these results are for a laboratory-scale system that is not operating at its full capacity of 100 g. Electricity consumption and the production of NCM811 contribute most significantly to the overall result for all impact categories assessed. The production of NCM811 contributes to 33%, 35%, and 96% of the overall result for CC, ER, and MR, respectively.
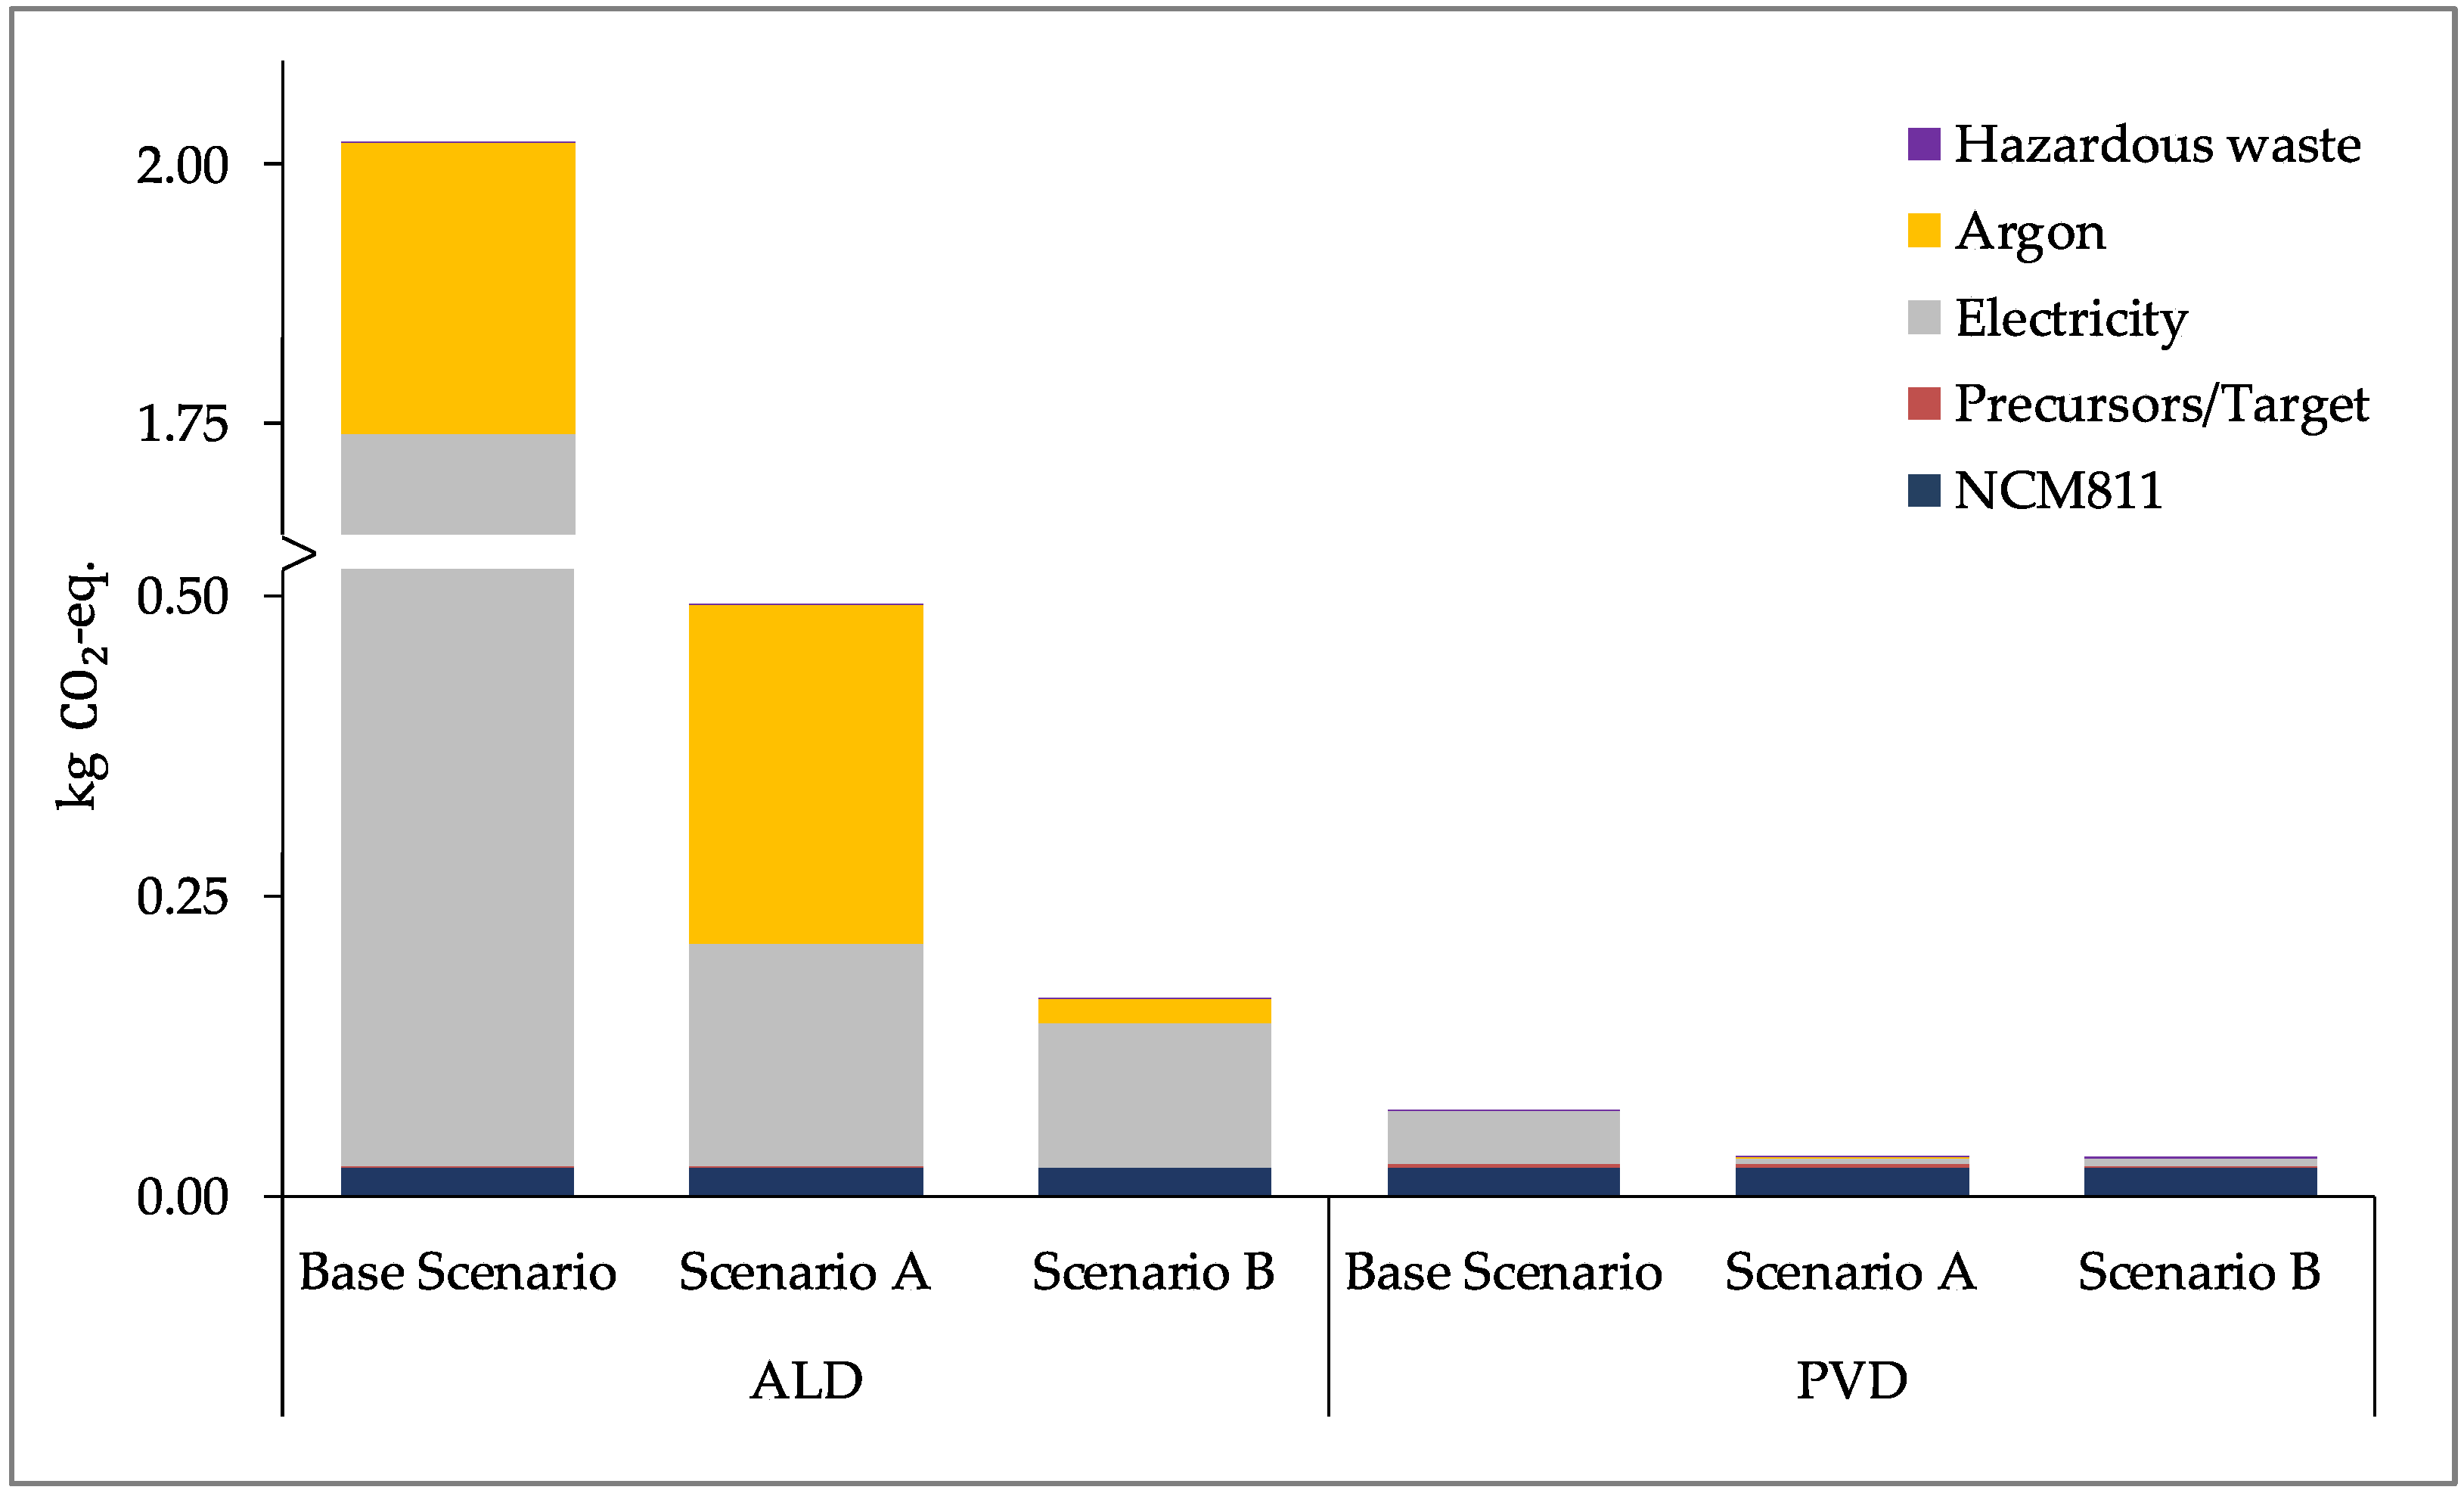
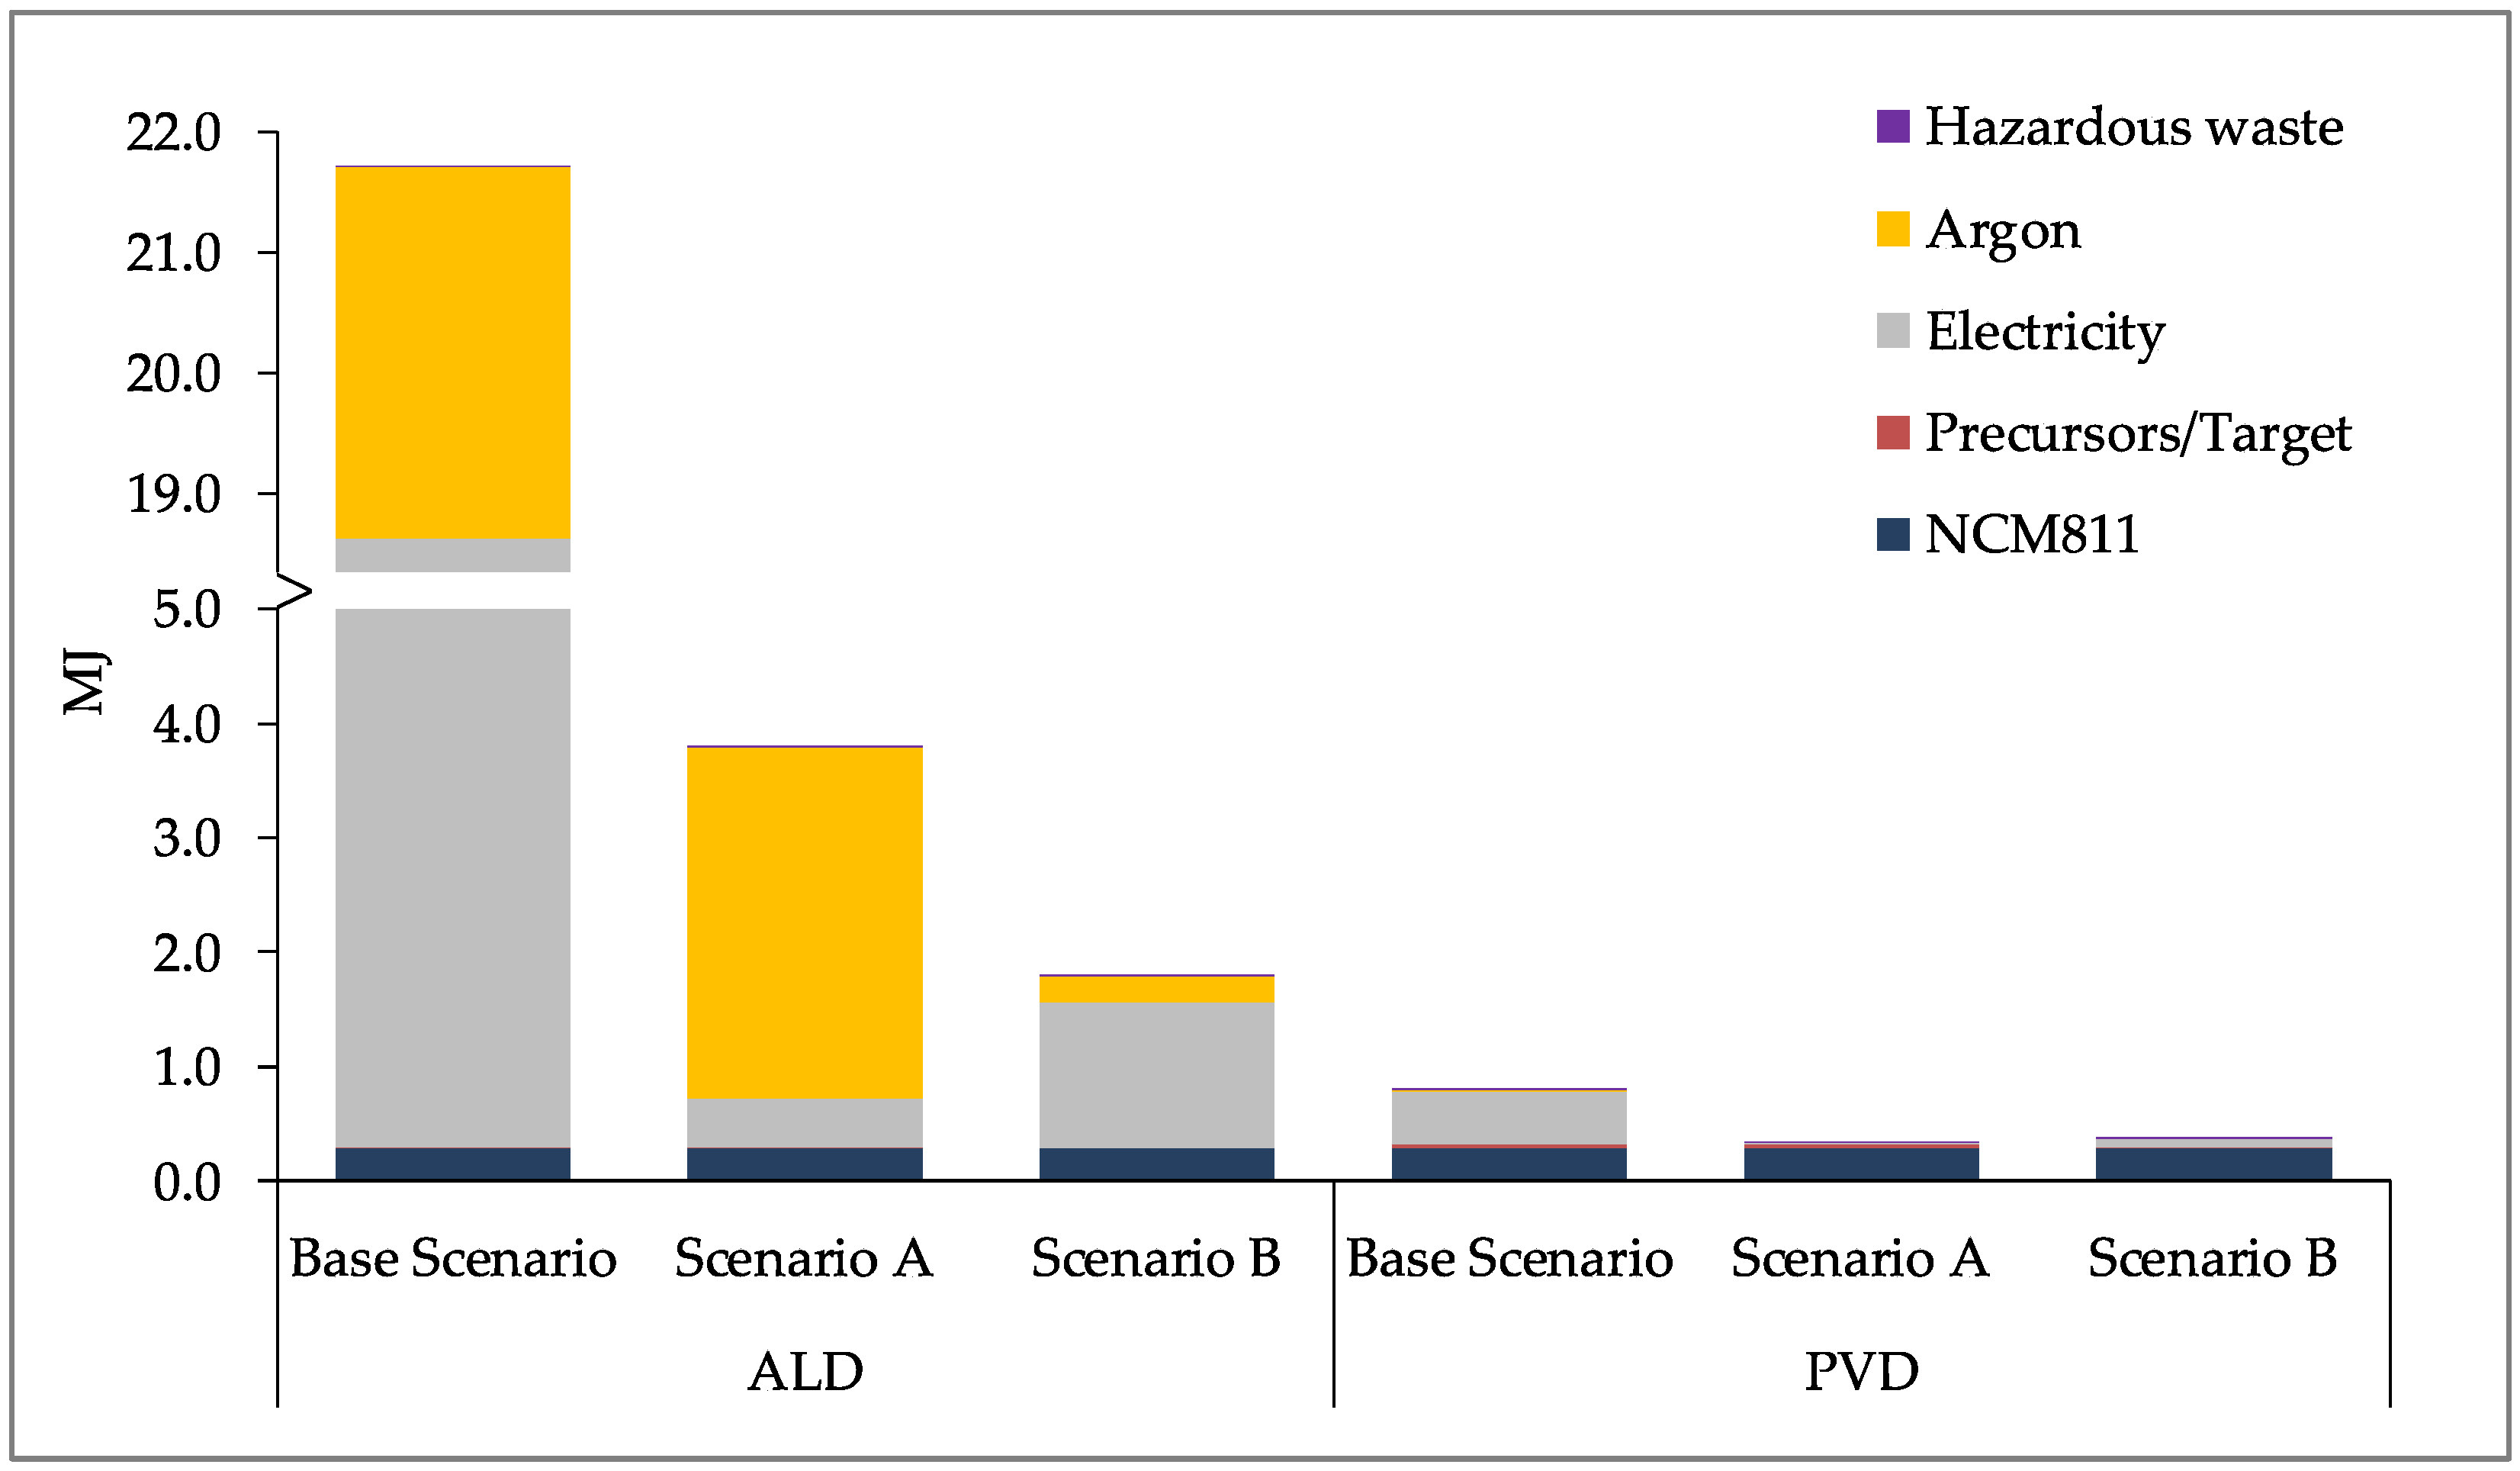
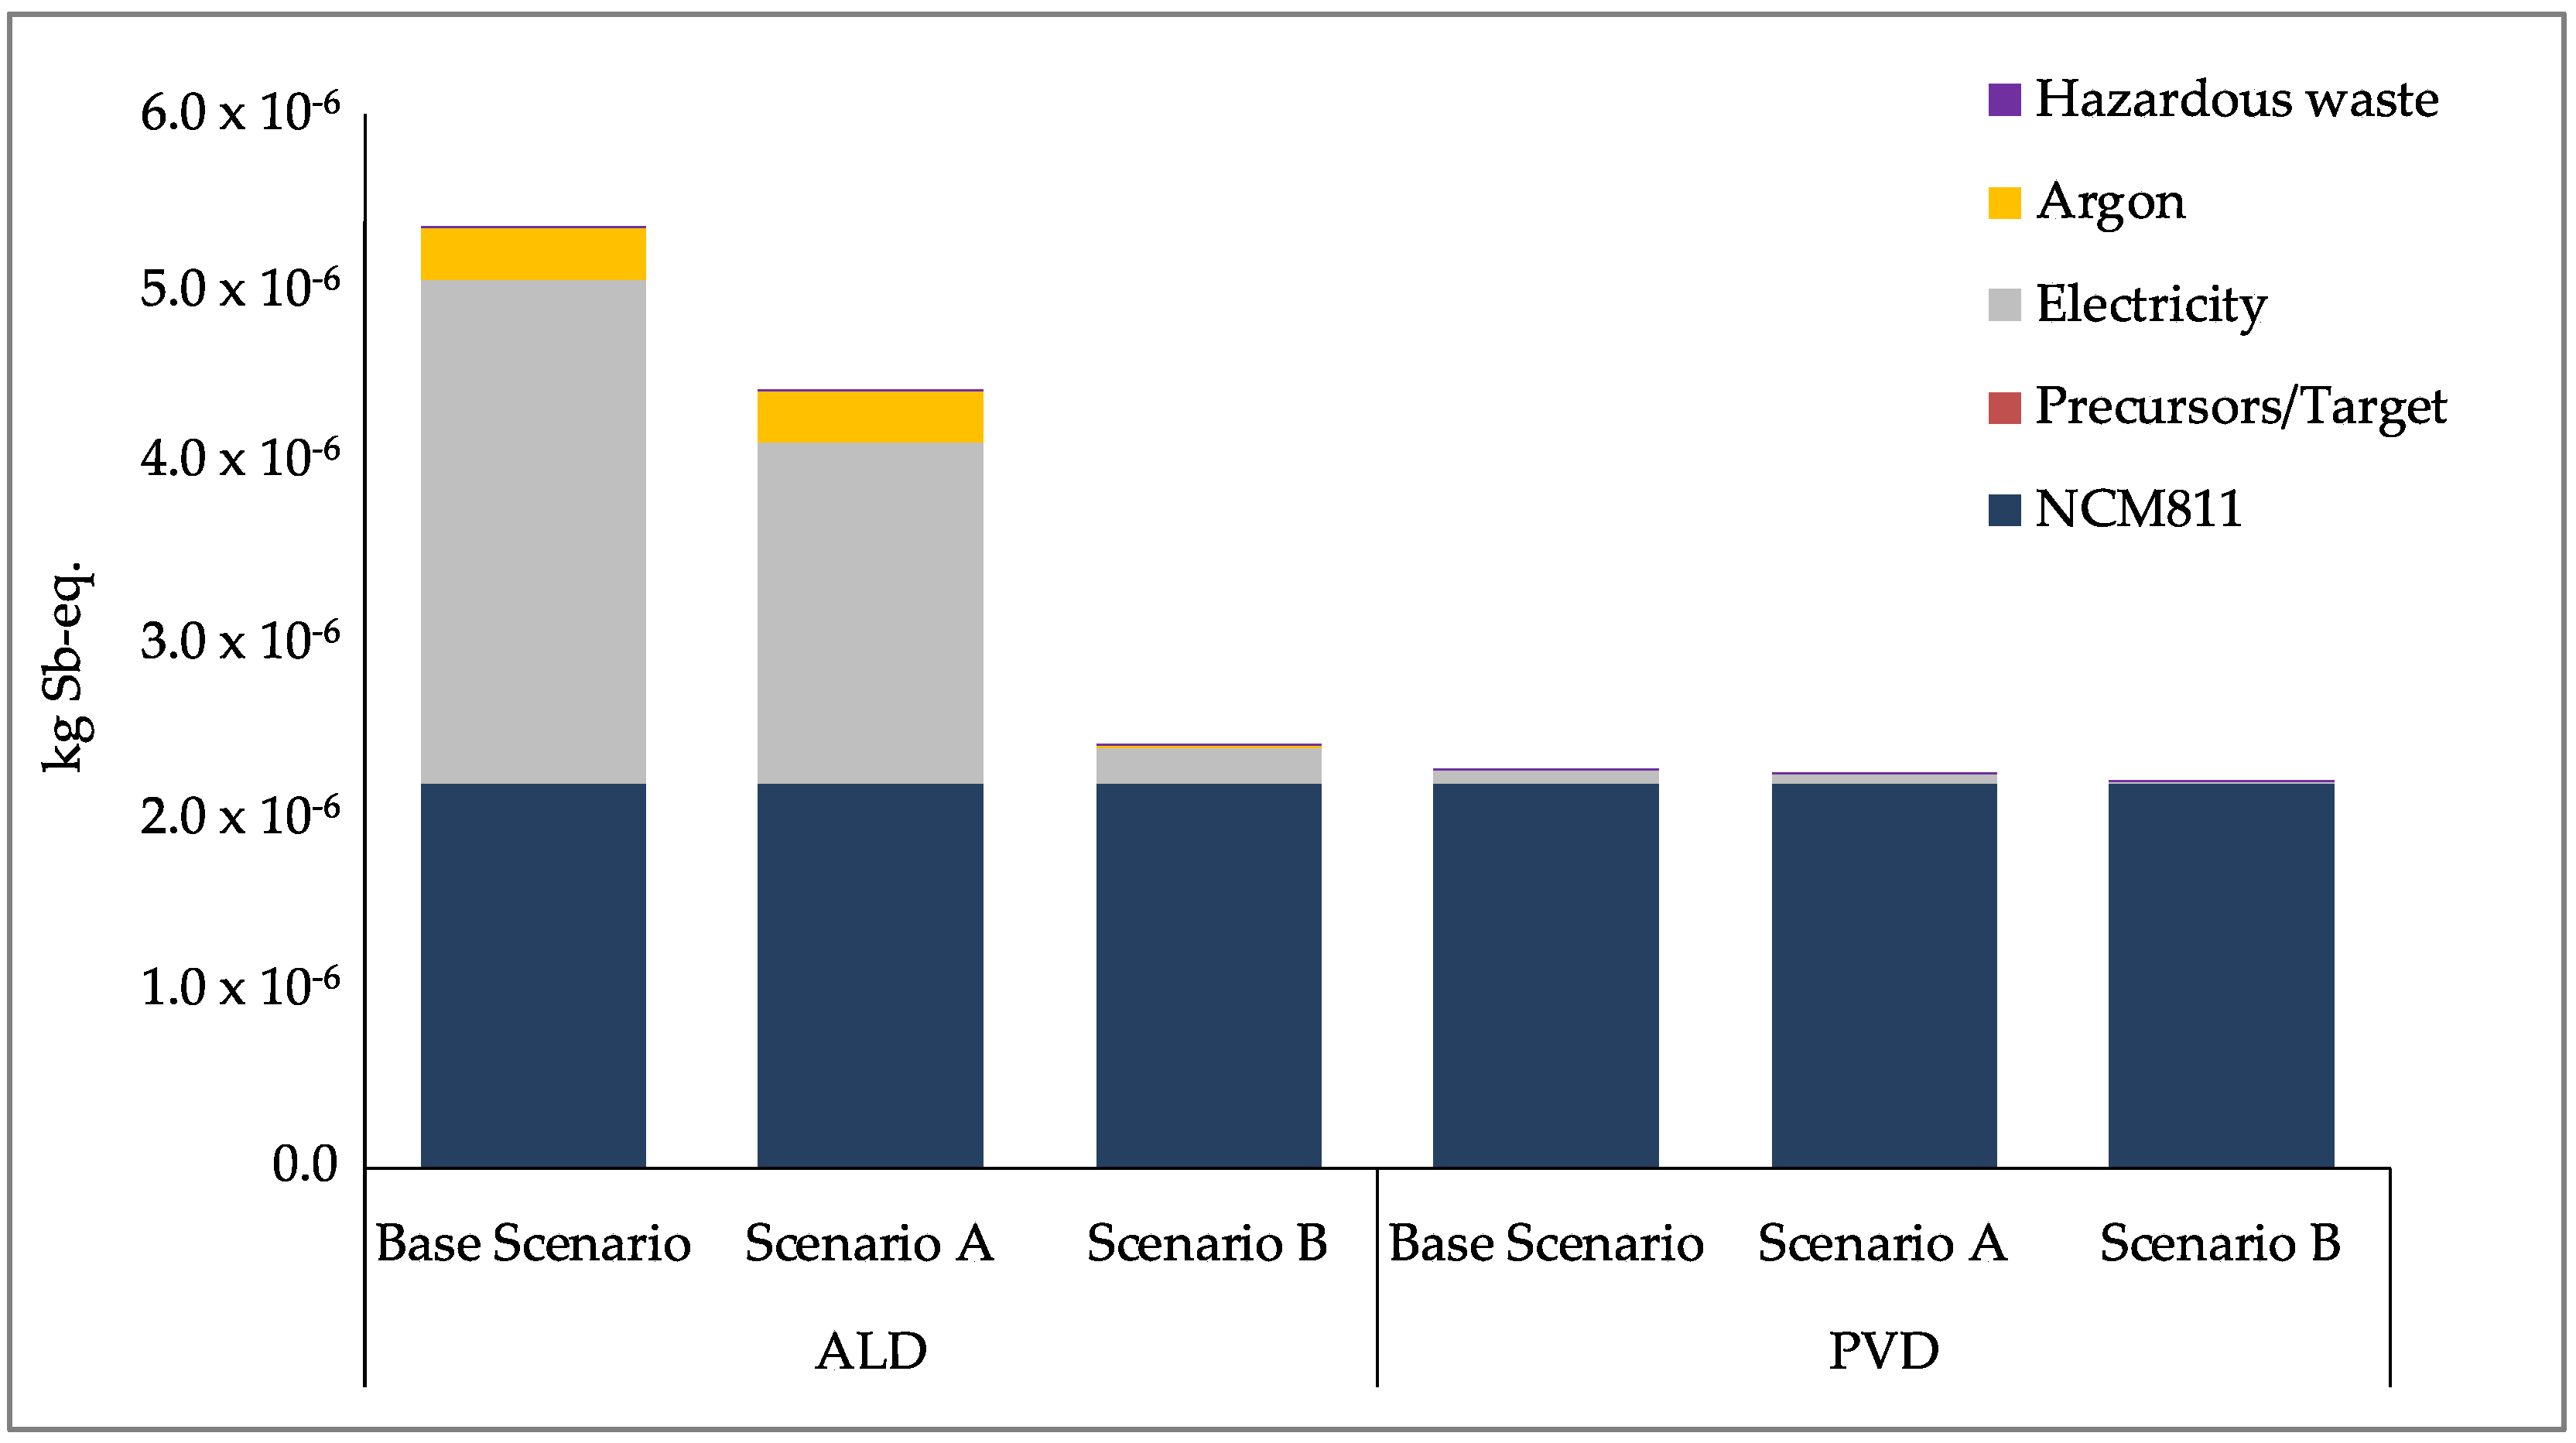
Figure 8,
Figure 9 and
Figure 10 (below) show the results for the scenario analysis scaled to the functional unit (refer to
Table 5 for details on the scenarios). The results for the base scenario are presented alongside the results for two scenarios (refer to
Section 4.3). Scenario A shows the results for increasing the share of renewables in the electricity mix and scenario B shows the results for more optimal laboratory scale processes in terms of operating at full capacity and improving the input material efficiencies, thus reducing the material losses.
As can be seen in
Figure 8,
Figure 9 and
Figure 10, the use of renewable energy for electricity production for the processes (Scenario A) reduces the impact significantly for the CC and ER impact categories. A larger reduction is seen for the optimization (Scenario B) of the processes to a more optimal laboratory-scale production for all three impact categories. Due to the larger contribution of argon and electricity for the ALD process, more significant reductions are seen across the scenarios, and each impact approaches that of the production of NCM811. The greater quantity of electricity required for ALD is due to its longer process time, taking approximately 210 min, compared to the 30 min process time for PVD/MS (refer to
Figure 2 and
Figure 4). Furthermore, the ALD coating step itself consumes approximately four times the power than the PVD/MS coating step (refer to
Table 2 and
Table 4).
With lower process time and lower power consumption, using the PVD/MS process to coat NCM811 as per Scenario B leads to an insignificant increase in the impact of the coated CAM compared to uncoated CAM (NCM811). Moreover, this increase is less than that of the ALD process for Scenario B, particularly for CC and ER. However, as stated previously, this result does not consider the performance differences or quality of the coated CAMs produced using ALD versus PVD/MS. Furthermore, as further experience is gained with these processes and more is known regarding their upscaling to production, the contribution of energy and argon consumption to the overall impact is expected to decrease. Yet, this decrease will not linearly scale with the scale of production [
56,
62,
63], and therefore should not be evaluated linearly.
5.3. Technical Assessment Results
The technical assessment qualitatively evaluates each coating technique in terms of three categories: material, product, and process (defined previously in
Table 6). The following table (
Table 9) provides an overview of the results of the technical assessment.
In terms of the material-related criteria, both the precursors (ALD) and the target (PVD/MS) show stable behavior regarding thermal and chemical changes. However, for the reactivity and toxicity, the target used for the PVD/MS is environmentally benign, whereas the organometallic precursors used for the ALD are highly reactive towards water and oxygen. Therefore, for the ALD process, standard procedures regarding the handling of hazardous materials must be followed.
To assess the product-related criteria, a LiNbO3-coated CAM is evaluated for each process. For both processes, the initial coating is structured as island-like growths. In the case of ALD, however, this structure only applies to the first monolayer, reaching a compact film thereafter. Therefore, a higher uniformity can be achieved by this technique compared to PVD/MS. However, there are uncertainties that should be considered for both techniques, as the coating properties are dependent on the process conditions and the achieved thickness of the coating. For ALD, the coating properties further depend on the batch load and process window. The uncertainty in the coating properties obtained can be minimized by dosing the precursors in excess, however, this leads to lower material efficiencies and higher wastes.
The process-related criteria of the technical assessment evaluate the coating technique and procedure itself. The criteria include the throughput, required process environment, flexibility towards other coating materials, process stability, and potential mode of operation (refer to
Table 6). In terms of throughput, PVD/MS coated 15 g of NCM811 in approximately 80 min based on the performed laboratory-scale experiments. The release rate of sputtered species during PVD/MS was found to be approximately 1–2 mg/min. For ALD, a total process time of approximately 350 min was required and 7 g of NCM811 was coated. Longer process times are needed for ALD, however, the coating thickness is highly controllable, increasing linearly with process time.
In terms of the process environment, both coating techniques have several requirements. The inert gas, argon, is used as a carrier gas to provide the process-specific atmosphere and working pressure, 10−1 Pa for PVD/MS and 10−2–10−3 Pa for ALD. The thermal conditions are elementary. Both processes also require a cooling system. Additionally, ALD requires the electric heating of the two precursors. These requirements need to be considered for upscaling scenarios.
In terms of flexibility, PVD/MS is very tolerant towards new coating materials, as there are nearly no limitations. However, ALD requires further investigation into new precursor materials and is therefore considered to have limited flexibility. For stability, however, both process setups have promising batch-to-batch reproducibility.
Lastly, the mode of operation for both processes is currently batch production. However, for ALD, there are already systems available that work in continuous mode. For example, current commercial-scale production systems exist that allow for the deposition of oxide-based materials on particles at atmospheric pressure, therefore lowering the energy required throughout the process. In combination with a fully continuous deposition process, high-throughput systems are available for addressing capacities of 0.1–20 tons/day [
69]. For PVD/MS, larger batch sizes are also feasible, with the possibility to coat batch sizes of approximately 2 kg of CAM in 2–3 h. Optimization towards process temperature, thin-film performance, coating homogeneity and uniformity, efficiency, and resulting throughput are the main drivers to improve the battery performance metrics discussed in this paper for both processes.
Overall, for the process-related criteria, ALD is promising in terms of its ability to be implemented into a continuous production process, whereas PVD/MS is promising in terms of its flexibility to adapt to all types of materials and to reach larger batch sizes. However, it needs to be considered that the processes were performed on a laboratory scale, and the qualitative results of the criteria assessed are based on the laboratory setups. The results, therefore, give an insight into the overall potential of the techniques at this stage of process development, where quantitative characterization data, such as cell performance, are not available. However, as the technologies reach higher TRLs, their performance and impacts should be reassessed in more detail, and the possibility to improve estimations with the use of learning and experience curves considered. This is an iterative process, where recommendations can be made throughout the process of technology development.
5.4. Discussion and Limitations
The overall goal of the environmental and technical assessments was to evaluate the two innovative techniques for coating CAMs at an early stage of development, where mitigation methods can be implemented more readily to reduce potential environmental impacts. In terms of the environmental assessment, hotspots were identified for both processes, being largely electricity and argon consumption. However, to bring the environmental results into perspective at this early stage in development, a technical feasibility assessment was also conducted qualitatively with the contribution of process experts.
With the cathode itself contributing approximately 30–40% to the overall kg CO
2-equivalents for Li-ion batteries [
24,
25,
26], the additional steps for the production of the coating should aim for minimal additional impact with maximal additional performance benefits, including longer cycle life and higher energy densities for ASSBs. It was found that with more optimal laboratory-scale production procedures, both processes are able to reduce the additional impact of the coating. For ALD, the benefits include a uniform, homogenous coating, and deposition of very thin films; however, the technology suffers from potentially larger energy and argon consumption due to the longer coating times. The ALD process further requires the use of toxic precursor materials and is relatively less flexible when it comes to the variation of materials that can be used for coating. In comparison, the PVD/MS process performs better in terms of energy and argon consumption due to the relatively short process time and the smaller device setup. The process further uses a non-toxic target as its source of LiNbO
3, however, it suffers from a non-uniform coating that varies in thickness.
A direct comparison of the two technologies cannot be made without knowledge of how the coating from each technology is performing in a cell. Results from cell characterization tests can be added at a later stage to compare the performance of the ALD and PVD/MS coatings [
2,
70]. Meanwhile, both processes can focus on the reduction in electricity and argon consumption at larger-scale production (larger batch sizes or continuous process), improvements in material efficiencies, and reduction in process time. Nevertheless, the advantage of both techniques over other coating techniques, such as spray coating, includes the lower amount of material (CAM, precursors/target) lost as waste. It should also be considered that for any coating process, the quantity of waste material (including active material, precursors/target, solvents, etc.) and the requirement of post-processing should be carefully evaluated as they contribute not only to the overall environmental impact, but also the final cost of the coating.
There are limitations to this study that also need to be considered. The data for the production of the precursors and the target were taken from expert knowledge, proxy datasets, and stoichiometric equations. This will introduce uncertainty into the results and the quality of this data should be improved with further iterations of the assessment of the coating techniques. Furthermore, the scenarios (refer to
Table 5) are currently based on expert estimations for the improvements in the processes. These scenarios can be updated once more experience is gained with the methods at a laboratory scale. Lastly, the consumption of the input precursors and target are expected to change as more experience is gained with the technology. Similarly, at larger-scale production, the consumption of argon and electricity is expected to significantly reduce, as is suggested in other studies of emerging technologies [
71]. It is recommended that the assessments are updated along with the further development of the technology, as more optimal process parameters are determined.
6. Conclusions and Outlook
In this paper, ALD and PVD/MS techniques for coating NCM811 particles with LiNbO3 were presented and evaluated. The coating processes are currently at an early stage of technology development, being conducted on a laboratory scale. A methodology for assessing the environmental impact and technical feasibility of each coating technique at an early stage of process development was further presented in this paper. The environmental assessment comprised process-specific data, including material and energy consumption, and was complemented by a qualitative technical feasibility assessment based on expert knowledge of the processes. The goal of the assessments was to provide recommendations to process engineers and decision-makers at a time when changes to the processes can be implemented more readily.
Scenarios were defined and evaluated for more optimal laboratory-scale processes. It was found that the ALD process is able to provide a uniform, homogenous coating, but has potentially larger energy and argon consumption due to the longer coating times and requires the use of toxic precursor materials. In comparison, the PVD/MS process performs better in terms of energy and argon consumption due to the relatively short process time and uses non-toxic input materials, however, it suffers from a non-uniform coating that varies in thickness. While a direct comparison of the processes is not possible at this stage, the results have demonstrated that there are levers for optimization and that there is a high potential for reducing the environmental hotspots for both coating techniques. Process engineers and decision-makers can focus to reduce these hotspots, and when more data are available, the assessments can be updated. Since both coating techniques are still at an early stage of development, the environmental and technical assessments can be updated iteratively as higher TRLs are achieved.
While more research is needed, the ALD and PVD/MS methods presented in this paper are promising for coating NCM811 with LiNbO3. Cell testing is currently in progress to determine how the coated CAM from each coating technique performs in an ASSB cell, including tests across the three classes of ASSBs (oxides, polymers, and sulfides). With these cell test results, the system boundary will be extended to include electrode production steps and cell assembly, and the performance data will be included within the functional unit of the environmental assessment and added to support the qualitative technical assessment. These results are expected in a future publication.
Life Cycle Costing (LCC) was out of the scope of this paper, however, should be conducted for the ALD and PVD/MS techniques at a later stage. While it is expected that savings in material and energy consumption will lower costs as the processes are optimized and upscaled, other costs still need further consideration, such as investment, maintenance, and personnel costs. Furthermore, for possible comparison to other coating techniques, material losses and post-processing requirements should also be considered in the assessments. Lastly, it should be noted that there are multiple possible applications for thin-film technologies that have not been considered in this paper, including, but not limited to, the application of protective layers on anodes and current collectors. Thus, further investigation into these coating techniques should be continued and their economic, environmental, and technical impacts assessed and compared with other technologies.

 ,
, 


