Article

Facilitating Investment in Photovoltaic Systems in Iran Considering Time-of-Use Feed-in-Tariff and Carbon Market

by
Asrin Seyedzahedi
1 and
Salah Bahramara
2,*
1
Department of Science, Campus of Bijar, University of Kurdistan, Bijar 6651874871, Iran
2
Department of Electrical Engineering, Sanandaj Branch, Islamic Azad University, Sanandaj 6616935391, Iran
*
Author to whom correspondence should be addressed.
Energies 2023, 16(3), 1067; https://doi.org/10.3390/en16031067
Submission received: 20 December 2022 / Revised: 5 January 2023 / Accepted: 15 January 2023 / Published: 18 January 2023
(This article belongs to the Topic Clean and Low Carbon Energy)

Abstract

:
Photovoltaic (PV) systems are the leading solutions for reducing carbon dioxide (CO2) emissions in Iran’s energy system. However, there are some challenges to investing in PV systems in Iran, such as the low energy market price and the high investment cost of PV systems. Although the flat feed-in tariff (FiT) is defined to help purchase energy from the PV systems, it is not attractive to investors. In this paper, a mathematical formulation is developed for the planning problem of the PV systems with battery energy storages (BESs) considering two incentive policies: (1) Designing time-of-use FiT to encourage the PV systems to sell energy to the grid at peak hours (2) Participating in the carbon trading energy market. The insolation in Iran is calculated regarding mathematical formulations which divide Iran into eight zones. The results of the base case show high payback periods for all zones. In the presence of the incentive policies, the payback period decreases considerably from 5.46 yrs. to 3.75 yrs. for the best zone. Also, the net present value increases more than 170 percent in some zones compared to the base case.

1. Introduction

The main factor of climate change in the world is the huge emission of greenhouse gases (GHGs), especially carbon dioxide (CO2). Iran has a share of 2.2 percent of the global annual CO2 emission [1]. Since fossil fuel-based power plants are mainly responsible for producing electrical energy in Iran (80 percent of the power installed capacities), they are the producers of a large portion of this pollution emission [2]. One of the main solutions to decrease pollution emissions in Iran is developing renewable energy sources (RESs), especially photovoltaic (PV) systems. Iran has great potential to use these systems considering their appropriate insolation; however, there are several challenges to developing the PV systems in Iran, which are described in the following subsection.

1.1. Challenges and Solutions of Using PV Systems in Iran

Iran has large fossil fuel resources, such as crude oil and natural gas. Therefore, installing fossil fuel-based power plants has always been the main choice for Iran’s governments to meet their electrical demand. The government has therefore considered a significant discount on selling fossil fuels to power plants, leading to the production of electrical energy at a low price. On the other hand, producing electrical energy through the RESs, such as the PV systems, needs high investment costs, and therefore these systems cannot compete with the fossil fuel-based power plants to sell energy to the grid since the energy market price is far lower in Iran. For this purpose, Iran’s government defines the flat feed-in-tariff (FiT) scheme as a supporting policy to purchase energy from RES-based power plants. However, these schemes are not attractive to either the system operator or the investors. From the viewpoint of the system operator, the main problem of the system is the peak hours, especially in summer, when it leads to a 10,000 MW gap between generation and consumption. To decrease the demand in peak hours, the system operator has employed some demand response programs and has also shed the industrial, commercial, and residential loads to maintain the reliability of the system. Implementing the demand response programs, especially shedding the loads, has led to huge economic and social damages both for the people and the government. On the other hand, the flat FiT does not encourage the PV’s investors to install the BES. Thus, as a result of not installing these BESs, the investors will not participate in the peak periods, and they will consequently not meet the demand of the system. PV-based power plants can act as Iran’s main sources of CO2 reduction. Although there are carbon markets in which carbon credits are traded between sellers and buyers, the PV-based power plant operators in Iran do not access these markets to earn profit from selling their carbon credits.
To address the abovementioned challenges and to encourage investors to invest in PV systems in Iran, two main solutions can be presented:
  • Designing the Time of Use (TOU) FiT scheme: As mentioned above, the main challenge of Iran’s power system operation is the peak hours. Designing the TOU FiT scheme can encourage investors to use the BESs in their PV systems, which could then provide more energy for the system during peak hours. This policy can be easily implemented in Iran since load shedding causes significant damage to the system in peak hours.
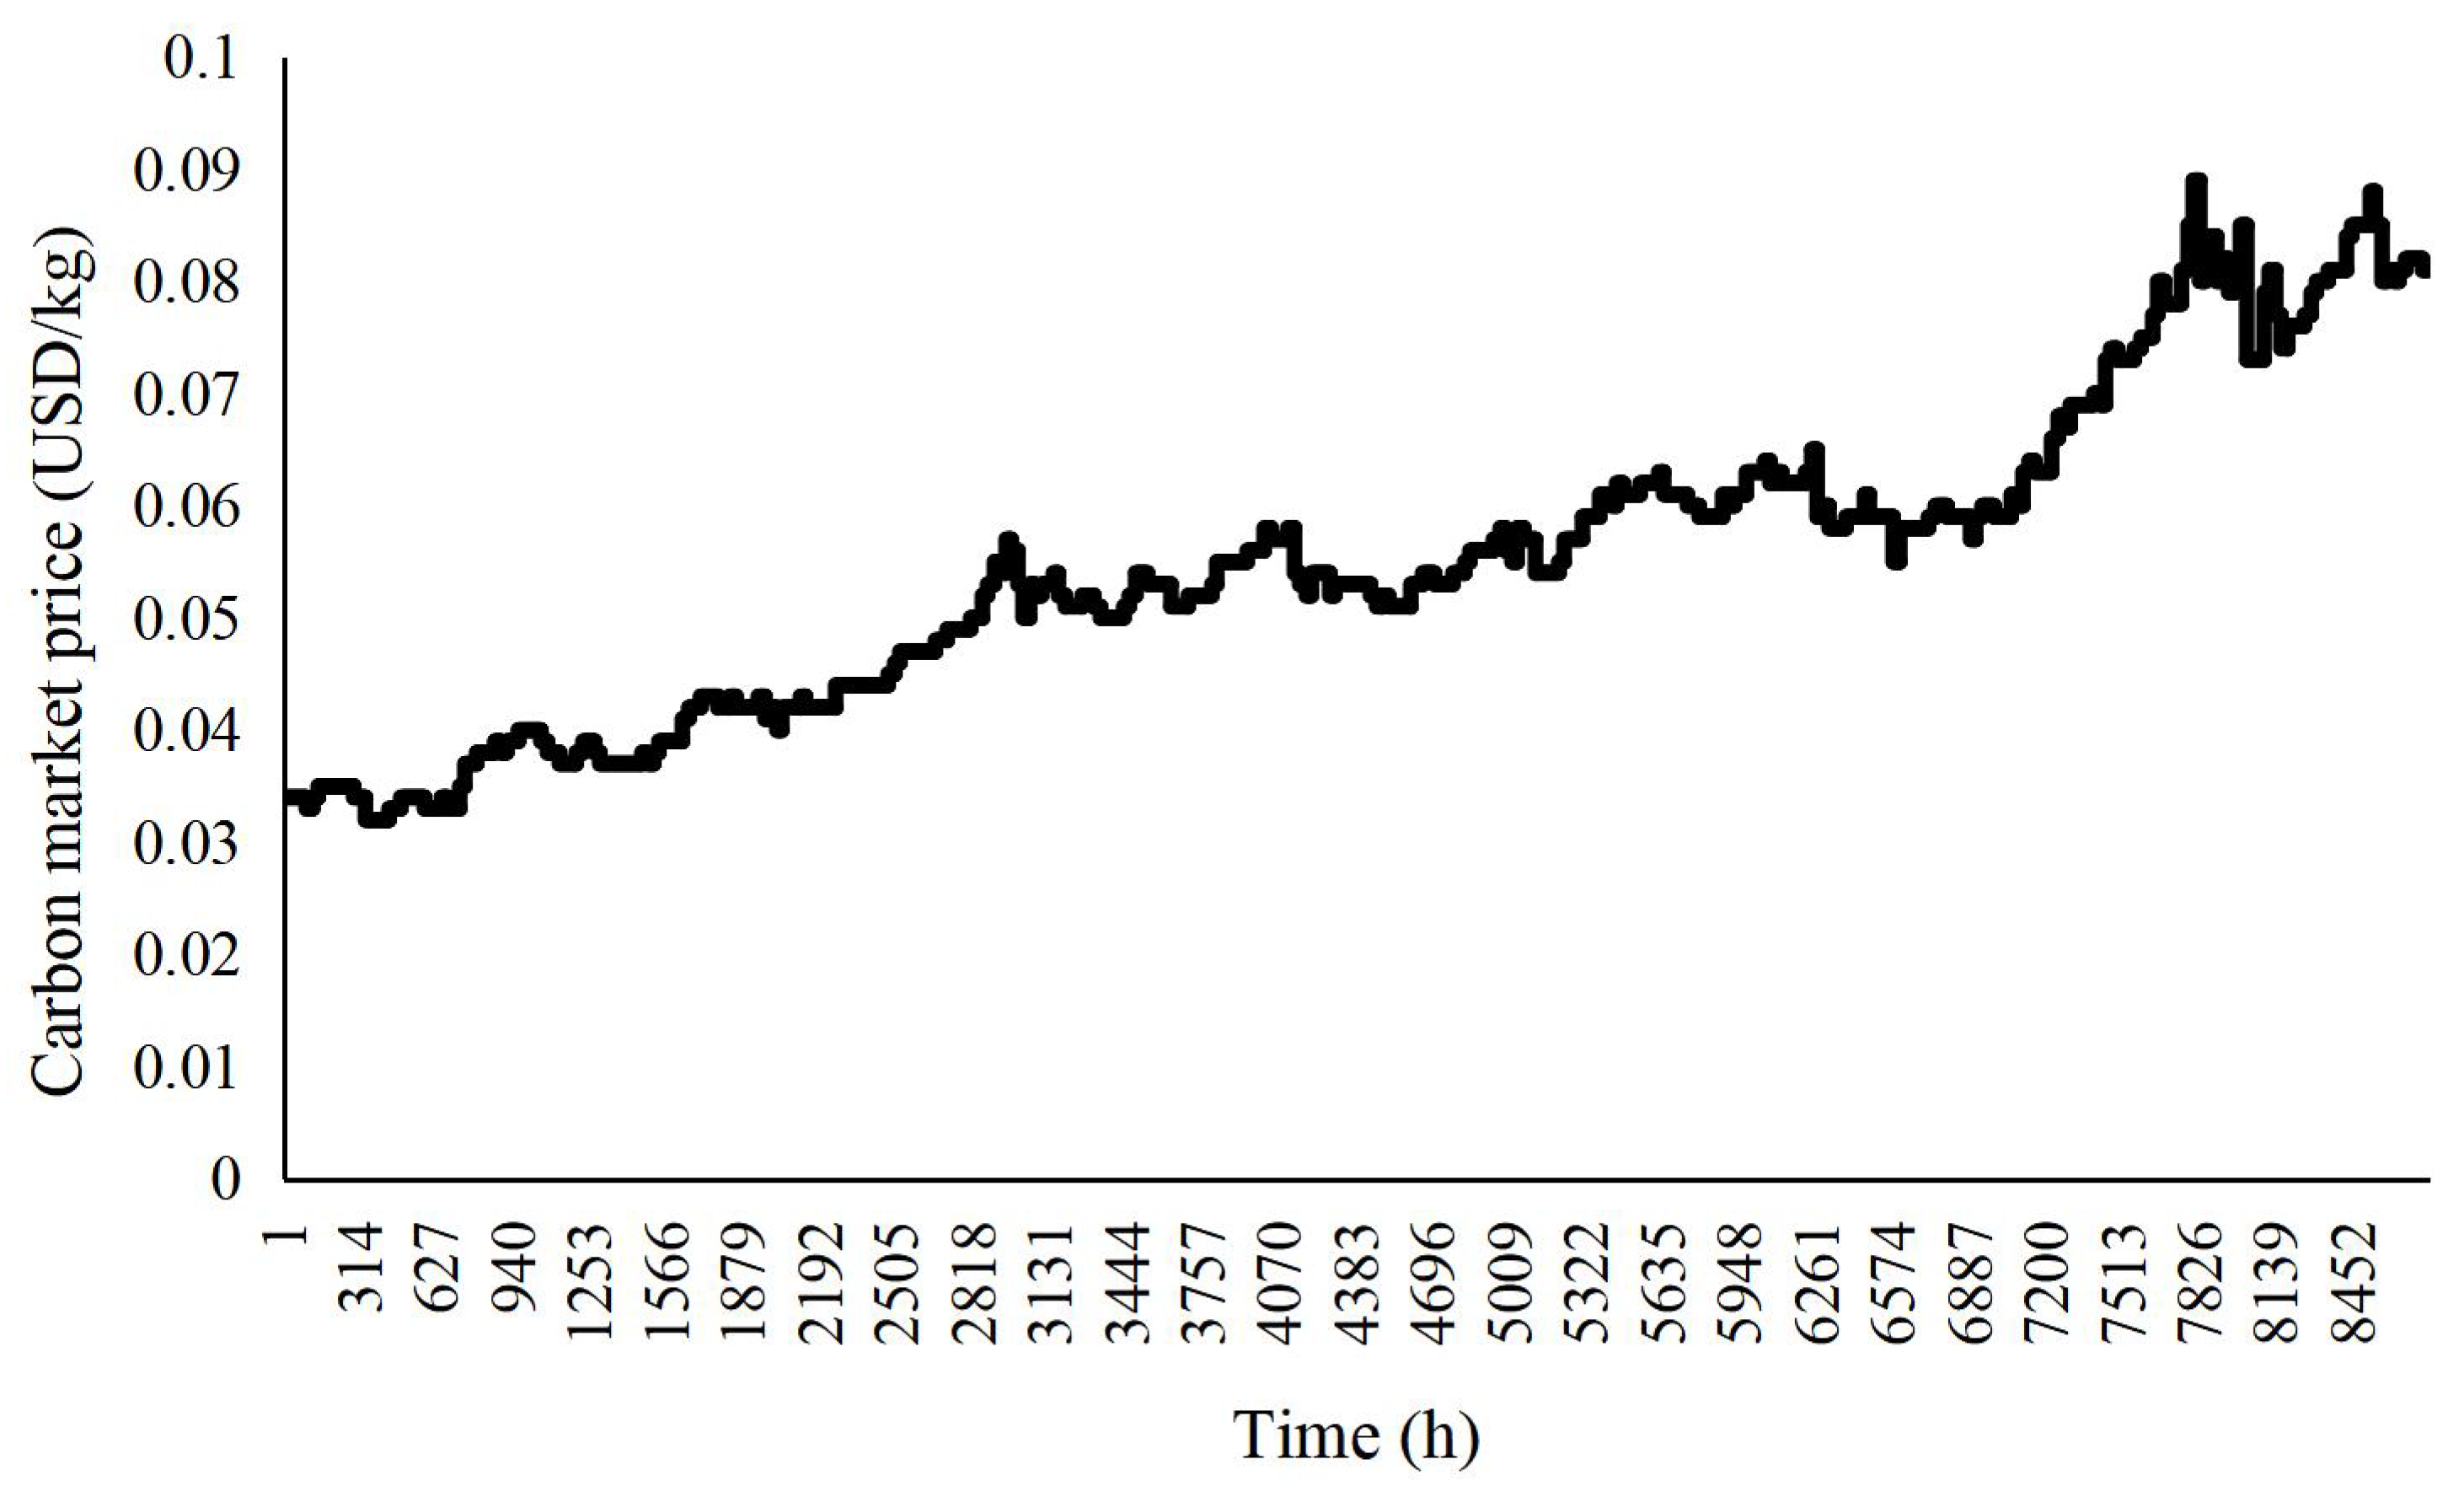
  • Participating in the carbon trading market: This market can earn more revenue for PV systems, so investors are encouraged to invest in these systems. Besides this, the price of the carbon market is increasing due to the major concerns of climate change.
One of the main aims of this paper is to consider these solutions for the investment problem of PV systems.

1.2. Reviewing the Planning Problems of the PV Systems Proposed in the Literature

The PV systems are used in hybrid energy systems alongside other energy resources and energy storage to meet the electrical, thermal, and cooling energy demands and to sell the extra energy to the grid. Artificial intelligence models are employed in [3,4] to predict the performance of the PV systems, including the PV panels, the thermoelectric air conditioning systems, the thermal collectors, and the electrolytic hydrogen production systems. A new approach is used in [5] to model a system in which heat, electricity, and hydrogen are produced through different energy resources, such as PV thermal collectors. The feasibility of using the PV-thermal system and the ground source of heat pumps to meet the electrical, heating, and cooling energy demands of the buildings is investigated in [6]. Various aspects of using solar dish/Stirling systems in the solar systems are investigated in [7]. Although PV systems can be used for different applications, the focus of this paper is to use these systems in electrical energy systems.
The optimal planning problem of PV systems is addressed in many studies. Hybrid energy systems, including PV/diesel/wind turbine (WT)/BES, are designed for some remote areas in Saudi Arabia using HOMER software in [8]. A mixed integer linear programming (MILP) model is developed to formulate the problem of the optimal sizing of the PV system and the BESs to reduce the annualized total cost of a fast charging station in [9]. The optimal sizing problem of the PV/BES system for different residential consumers in Zurich, Switzerland, is investigated in [10], considering different electrical power system conditions. The results showed that using the BESs along with the PV system leads to obtaining a better net present value (NPV) compared to without a BES system. To obtain the optimal configuration of the hybrid energy system in a rural area in Bangladesh, a technical and economic evaluation is considered using HOMER software [11]. Then, the optimum configurations are evaluated through their economic and environmental indices using the TOPSIS and AHP methods. The optimal sizing problem of the PV/BES system for a residential location in China is formulated as a mixed-integer nonlinear programming (MINLP) model in [12]. HOMER software is employed in [13] to optimize the PV/diesel/BES hybrid energy system for a rural area in Iraq. The main contribution of the study in [13] is using a new dispatch strategy for the energy management system in the proposed system. For this purpose, the proposed dispatch strategy is implemented in MATLAB software, and then it is linked to HOMER. The results showed that the net present cost (NPC) of the system decreases by 3.95 percent using the proposed dispatch strategy in comparison with the case that uses the cycle charging strategy suggested in the HOMER. A two-stage stochastic optimization problem is developed for the optimal sizing problem of a PV system equipped with the electrical and thermal energy storages for the residential areas in Qatar [14]. The behavior of a hybrid energy system, including a PV/BES/diesel generator, to meet the demand of a university in Medellin, Colombia is investigated in [15]. The results showed that in the presence of the diesel generator, the total cost of the system decreases in comparison with the case that uses only the PV and BES to meet the demand. HOMER software is employed in [16] to obtain the best configuration of the PV/diesel/BES system to meet the demand of the electric vehicle-charging station in three cities in Ethiopia. The results show the optimum systems have a cost of energy (COE) of 0.196 USD/kWh, 0.18 USD/kWh, and 0.188 USD/kWh for Addis Ababa, Jijiga, and Bahir Dar, respectively. A PV/thermal energy storage system is designed for a health center in Tigray, Ethiopia using the TRNSYS model in [17]. The aim of this paper is to solve the problem of how to store the excess energy of the PV system in thermal energy storage. The results show that the daily average excess energy in the mentioned system changes from 2070 Wh to 2959 Wh. The best configuration of the hybrid energy systems to meet the electrical load of two residential consumers in Windhoek, Namibia is obtained through minimizing the NPC using HOMER software in [18].
The authors of [19] designed the optimal combined cooling, heating, and power generation (CCHP) system for a residential building in three climate zones in Iran. The results show a huge amount of CO2 emission reduction in supplying the demand of the buildings using these systems. This is despite the fact that, under the present conditions of Iran’s energy market, these systems are not economical to meet the electric, heating, and cooling demand of the buildings in Iran. Therefore, new financial support is required to encourage investors to use the CCHP systems in Iran. The site selection for installing the PV energy system in Markazi Province in Iran is investigated using the multi-criteria decision-making method detailed in [20]. For this purpose, some economic, environmental, and technical indices are defined to obtain the best locations through the fuzzy method. By the end, the results are reported in the geographical information system (GIS) environment. The correlation coefficient and standard deviation (CCSD) method is used as a multi-criteria decision-making approach to evaluate the PV system’s power generation potential in the southeast regions of Iran [21]. The optimal planning of the hybrid energy systems, including PVs, diesel generators, and BESs, using HOMER software is investigated by considering some incentive policies in [22]. The simulation results show the significant NPC and CO2 reduction in the optimized systems, considering the incentive policies in comparison with the base case. The incentive policies include increasing the fixed price of purchasing energy from these systems, reducing the purchased energy from the grid to meet the demand of the system, and decreasing the investment cost in the system. The previous models and approaches proposed in the literature are also reviewed in Table 1 and Table 2.

1.3. Proposed Approach and the Contributions

In this paper, a mathematical formulation is developed for the optimal planning of the PV system in the presence of a BES, considering the FiT schemes and the carbon trading market. The proposed model in this paper is compared with previous studies in both Table 1 and Table 2. As shown in Table 2, most of the previous studies use different software for the optimal planning problem of the PV systems and the mathematical model is used in a few studies. Although it seems as if this paper uses a similar mathematical model to that considered in the other studies, the differences between the proposed model in this paper and the previous studies are described in detail in Table 1. First, the mathematical formulations are used to calculate the insolation in each location of Iran for each day and each hour in this paper. In contrast, in the previous studies reviewed in Table 1, only the forecast insolation is used to calculate the power generation of the PV systems. Iran is divided into eight zones regarding the calculated insolation. In the next step, the planning problem of the PV/BES systems is modeled, considering the TOU FiT scheme and the carbon trading market as the two main solutions to encourage the investors of the PV/BESs systems. The results are presented in three cases to show the effect of the incentive policies on the NPV and the payback time of the planning problem for different zones in Iran. Therefore, the main contributions of this paper are as follows:
  • Calculating the insolation regarding the latitude and longitude of each location for each day and each hour of the year regarding the mathematical models. In contrast, previous studies have used the forecast insolation, which mainly shows the average daily insolation.
  • Modeling the planning problem of the PV/BES systems considering the FiT scheme and the carbon trading market.
  • Investigating the NPV and the payback time of the PV/BES systems for different zones in Iran. On the other hand, previous studies have only concentrated on specific locations in a country.

1.4. Paper Organization

The problem is described in Section 2. In the third section of the paper, mathematical formulations to calculate the insolation are presented. In the next section, the planning problem of the PV/BES systems is formulated. The results are presented in Section 5. In the last section, conclusions are given.

2. Problem Description

The proposed approach in this paper to model the investment problem of PV systems is shown in Figure 1. In the first step, the insolation is modeled as (1)–(5). Then, this model is coded in Python software to obtain the insolation of each location on every day and hour of the year. The input parameters of this model are the latitude and longitude of the locations. In the second step, the investment problem of the PV systems is mathematically formulated as (6)–(20). It is a linear programming (LP) model which is coded in the GAMS software. The input parameters of this model are described in Figure 1, including the demand of the system, the investment and the maintenance cost of the PV panels, inverter, and BES and the technical specifications of this equipment. Also, the obtained insolation in the previous step is considered as the input parameter in the proposed model in (6)–(20). The decision variables of this step are the capacities of the PV panels, inverter, and BES, as well as the NPV of the system and the payback time. These steps are described in detail in the next sections.

3. Modeling Insolation

In this section, the insolation is calculated for various locations (considering their latitudes and longitudes) on every day and hour of the year. For this purpose, the proposed models in [23] are used (The same notations proposed in [23] are used in this section.). The insolation ( K ϕ , λ , d , h ) is calculated as (1)
K ϕ , λ , d , h =   S d   T ϕ , λ , d , h r     sin ( ψ )
where S d is the insolation measured on a day (d) of the year (For example, S5 indicates the insolation measured on the fifth day of the year.), and it is calculated as (2). T ϕ , λ , d , h r is the net sky transmissivity, which is modeled as (3)
S d = S 0   R ¯ R d 2
where S 0 is the average total insolation measured for the average distance between the Sun and the Earth, R ¯ is the average distance between the Sun and the Earth, which is 149.6 Giga meters, and R d is the actual distance of that point with the Sun on a given day (d).
T ϕ , λ , d , h r = ( 0.6 + 0.2 sin ( ψ ) )
The local elevation angle (ψ) used in Equations (1) and (3) is calculated as (4)
sin ( ψ ) = sin ( ϕ ) sin ( δ s ) cos ( ϕ ) cos ( δ s ) cos C   h UTC h d λ
where ϕ is the latitude, λ is the longitude, h UTC is the time of the day regarding the UTC, h d is 24, which represents the hours in a day, C equals 2 π radians, and δ s is the solar declination angle which is calculated as (5).
δ   s = ϕ r cos C ( d d r )   d y
Here ϕ r is the ecliptic plane, and it is 23.44 ° , d r is the number of the Julian day (It shows the longest day of a year.), which is the 172nd day of the year, d y is the number of days in a year, i.e., 365.
To use the proposed formulations in (1)–(5) in the investment problem of the PV systems in the next section, a location with known latitude (ϕ) and longitude (λ) is determined and its insolation ( K ϕ , λ , d , h ) is calculated for all the days of a year and all the hours of the day (i.e., 365 days and 24 h). This calculated insolation is then reported as K d , h .

4. Modeling the Investment Problem in the PV Systems

The NPV of the hybrid PV/BES system modeled in (6) consists of six terms. The system’s revenue from selling energy to the grid and participating in the carbon market are modeled as the first and the second terms of (6). These terms are both modeled in (7) (In this section, the index D shows all the days of the year and is the same as d y presented in the previous section. Also, index T shows all the hours of the day and is the same as h d described in the previous section.). The third term of (6) models the salvage of the system. The coefficient (χ) is used in (8) to show the equipment’s efficiency reduction after ending the project lifetime. The fourth term of (6) models the investment cost of the system’s equipment as modeled in (9). This cost includes the investment cost of the PV panels, the BESs, and the inverter, as described in (10), (11), and (12), respectively. Since the capacity of the inverter should be more than the capacity of the PV panels, the coefficient (α) is used in (12) to model this issue. Also, the coefficient (β) is multiplied by IC in the objective function to model the other investment costs, including the PV panels’ structures, wiring, protection devices and so on. The fifth term of (6) is used to model the land price as described in (13). The last term of (6) shows the maintenance cost of the system as modeled in (14).
N P V = y = 1 Y R y sell ( 1 + i ) y + y = 1 Y R y carbon ( 1 + i ) y + R Salvage β   I C C Land y = 1 Y M C y ( 1 + i ) y
R y sell = d = 1 D h = 1 H p y , d , h sell ρ y , d , h sell               ,                 R y carbon = d = 1 D h = 1 H p y , d , h sell   ρ y , d , h carbon
R Salvage = IC PV ( LT PV LT Project LT PV ) χ PV + IC PV ( LT BES LT Project LT BES ) χ BES                                                                                   + IC Inverter ( LT Inverter LT Project LT Inverter ) χ Inverter
I C = I C PV + I C BES + I C Inverter
I C PV = N   P ¯ PV ρ IC _ PV
I C BES =   E ¯ BES ρ IC _ BES
I C Inverter = α N   P ¯ PV ρ IC _ Inverter
C Land = N   A Land ρ Land
M C y = M C y PV + M C y BES + M C y Inverter                                     =     N   P ¯ PV ρ y MC _ PV +   E ¯ BES ρ y MC _ BES + α N   P ¯ PV ρ y MC _ Inverter
The proposed objective function is optimized considering the following constraints:
p y , d , h PV η Inverter + p y , d , h discharge = p y , d , h charge + p y , d , h sell + P y , d , h demand                               : y , d , h
Equation (15) models the power balance of the system where the power generation of the PV system can be used to charge the BES and to sell energy to the grid. Also, the BESs can be discharged to sell energy to the grid. Also, the demand of the system can be met through the PV system and discharging power of the BES.
0 p y , d , h charge δ   E ¯ BES                     ,                       0 p y , d , h discharge δ   E ¯ BES                   : y , d , h
The maximum power charging/discharging limitations of the BESs are modeled as (16). In this equation, the coefficient (δ) is used to model the fact that the maximum charging/discharging power of the BESs are coefficients of the BESs’ energy maximum capacity.
E y , d , h BES = E y , d , h 1 BES + p y , d , h charge η charge p y , d , h discharge η discharge                                   : y , d , h > 1 E y , d , h BES = E y BES _ ini + p y , d , h charge η charge p y , d , h discharge η discharge                                     : y , d , h = 1
The stored energy in the BESs depends on both the power charging/discharging of the BESs in that time step and the stored energy in the previous time step, as modeled in (17).
θ   E ¯ BES E y , d , h BES   E ¯ BES                       : y , d , h
The minimum and maximum limitations of the stored energy in the BESs are modeled in (18).
p y , d , h PV = N   P ¯ PV K y , d , h K Std
The power generation of the PV panels in each time step is modeled as (19). For this purpose, the insolation ( K y , d , h ) (It should be noted that K y , d , h is the same as K d , h since the insolation is constant for all years.) is multiplied by the maximum capacity of the PV panel obtained in the standard condition and the number of the panels. The resulting term is then divided by the insolation amount at the standard condition, which is 1000 W/m2.
y = 1 Y d = 1 D h = 1 H ( p y , t charge + p y , t discharge ) ϕ   E ¯ BES
Equation (20) models the relationship between the charging/discharging power of the BESs with the BESs’ lifetime.

5. Numerical Results

In this simulation, some 0.4kW PV panels are considered. The price of this panel is USD 200. The price of the inverter and the BES for 1 kW and 1 kWh capacities are USD 87.5 and USD 122, respectively. The maintenance cost of the PV panels and the inverter are considered to be 2 percent of their investment cost [24]. This term for the BESs is considered to be 5 percent [25]. The required space for installing the PV system for 1 kW is 12 m2. The price of purchasing land for installing the PV system is assumed to be 12 USD/m2. The efficiency of the inverter is 0.98, and the charging/discharging efficiency of the BES is 0.95. The lifetime of the inverter and the PV panel are 10 and 20 years, respectively. For calculating the salvage, it is assumed that the electrical energy production efficiency of the PV panels would reduce by 10 percent after the project lifetime (10 years). It is assumed that the lifetime of each 1 kWh capacity of the battery is 10,000 kWh. The interest rate is 21 percent, and the inflation rate is 18 percent, regarding the average of these values reported by the central bank of Iran. Therefore, the real interest rate would be 2.54 percent. The average hourly value of the demand is 0.14 kW; the peak demand is 0.36 kW, and therefore the load factor is approximately 0.39.

5.1. Insolation in Iran and Defining Different Zones

The amount of insolation in Iran is shown in Figure 2 (This Figure shows the insolation without considering the effect of the temperature and the clearness index.) regarding the mathematical models proposed in Section 3. This data is calculated for 12:00 p.m. in June. Iran is divided into eight zones, as given in Table 3, with regard to the results obtained in Figure 2. These zones are determined by the amount of insolation. For example, the areas with an insolation equal to or greater than 1060 W/m2 at 12:00 p.m. local time in Iran are labeled as Zone 1. The longitude and the latitude spectrums of each zone are presented, among which one latitude is chosen for each zone for the calculations in the next subsection. The greatest and the least amount of insolation are observed in zones 1 and 8, with more than 1060 W/m2 and less than 1000 W/m2 at noon in June, respectively. As shown in this figure, the insolation only depends on the latitude since it is constant in a specified latitude with different longitudes. The average daily insolation in Iran is presented for the different zones in Table 3.

5.2. Description of Different Cases

In order to investigate the optimal behavior of the PV/BES system in different zones, three cases are defined as described in Table 4. In the base case, the present conditions of Iran’s electrical energy system are considered in which the power generation of the PV systems are purchased at the Flat FiT. In this case, the government purchases energy at a fixed price in the year. This price for PV systems with capacities equal to or greater than 20 kW and equal to or smaller than 200 kW is 0.055 USD/kWh, and this increases by 15 percent each year. Therefore, the maximum number of PV panels which can be installed is 500.
In Case I, it is proposed that the government designs the TOU FiT to encourage the investors to use the BESs in the PV systems. For this purpose, it is assumed that the purchased power from the PV systems increases in the peak periods, as proposed in Figure 3. As shown in this figure, the price increases from 0.055 USD/kWh to 0.11 USD/kWh in hours 21–23 in all seasons and in hours 13–17 only in summer.
In Case II, it is assumed that the PV system’s operators can participate in the carbon trading market besides selling their electrical energy under the TOU FiT scheme. The price of the carbon trading market for one year is given in Figure 4 [26]. These prices show the amount of price paid for 1 kg carbon reduction. The emission intensity of electricity production in Iran is 0.492 kgCO2eq/kWh [27].

5.3. Results

The results are presented for the proposed three cases as follows.
(1)
Base case: The results of this case are given in Table 5 and Table 6. As shown in these tables, the optimized capacity of the system for all zones is equal. The capacity of the BES is 4 kWh for all zones. This capacity is obtained only to meet the demand of the system in the hours with no power generation of the PV system. It should be noted that since the selling price to the grid is flat, there is no incentive to use the BES in such systems with the aim of selling energy to the main grid. The payback time from the worst zone (Zone 8) to the best zone (Zone 1) decreases by 0.73 yrs. The NPV of the best zone also increases by 32.88 percent more than the worst one. The results presented in Table 5 and Table 6 show that investing in the PV system is not attractive for investors in Iran under the present conditions since the payback time in all zones is equal to or greater than 5.46 yrs.
(2)
Case I: The results of this case are given in Table 7 and Table 8. As shown in these tables, under the TOU FiT scheme, the investors are encouraged to use the BESs in their PV systems to sell energy to the grid. The optimized BESs capacity for the best zone is 94 kWh. In fact, by using the BES with this capacity, the best NPV and payback period are obtained for this zone. For the other zones, when decreasing the power generation of the PV systems, the size of the BES capacity increases to obtain the optimum results for that zone. The optimized BES capacity for zones 4–8 reaches 100 kWh. The payback period from the worst zone (Zone 8) to the best zone (Zone 1) decreases by 0.6 yrs. Also, the NPV of the best zone increases by 23.13 percent in comparison with the worst one.
The behavior of the PV system on a summer day and a day in other seasons in Case I in Zone 1 is shown in Figure 5, Figure 6, Figure 7 and Figure 8. The power balance of the system on a summer day is shown in Figure 5. The charging/discharging process of the BES is repeated twice on this day, as shown in Figure 5. The BES is charged in hours 9 and 10, and then it is discharged in hours 15 and 17 to sell energy to the grid at the high-selling energy price. In the second cycle, the BES is charged in hours 18 and 19 and then it is discharged in hours 21 and 22 at the high-selling energy price. The power balance of the system in a day in seasons other than summer is shown in Figure 7. Since the peak price of selling energy to the grid is noticed only in one period in the non-summer days, i.e., 21–23, the BES is only discharged in hours 21 and 22, as shown in Figure 7. For this purpose, the BES is charged in hours 17 and 18. As shown in these two figures, the charging/discharging of the BES takes place regarding the TOU FiT described in Figure 3. The results of supplying the demand of the system are shown in Figure 6 and Figure 8 for a day in summer and a non-summer day, respectively. As shown in these figures, the demand of the system is supplied through the PV system in hours 6–19, and the BES is discharged to meet the demand in the other hours. The results of this case show that this behavior of the PV system in storing the PV power generation in the BES in the off-peak hours, with the aim of discharging the BES in the peak periods, increases the system’s revenue from selling energy to the grid.
(3)
Case II: The results of this case are given in Table 9 and Table 10. As shown in these tables, considering the carbon trading market besides the TOU FiT scheme, investing in PV systems is more attractive for investors since the payback time of the project is significantly shorter compared to the other cases. The payback time for the best zones (Zones 1–4) becomes less than four years, which is very attractive for investors. In the best zone (Zone 1), this payback time is optimized and also the NPV of the project obtained with the BES capacity equals 45 kWh. The BESs’ optimized capacities increase in the other zones since the power generation of the PV systems decreases in these zones. The payback period from the worst zone (Zone 8) to the best one (Zone 1) decreases by 0.6 yrs. The NPV of the best zone also increases by 21.46 percent more than the worst one.
The amount of the increment/reduction of the NPV/payback time in Cases I and II in comparison with the base case are given in Table 11. As shown in the results, for the best zone, the NPV increases 63.85 percent in Case I and 159.8 percent in Case II in comparison with the base case. Also, the payback period in this zone in Cases I and II are 6.78 percent and 31.32 percent shorter, respectively, than the base case. The results show that proposing the TOU FiT and participating in the carbon trading market has more effect on the NPV of the zones with lower power generation of the PV systems. From the viewpoint of the payback period, in cases I and II, the payback time reduces more in the zones with low and high power generation of the PV systems, respectively.

5.4. Discussion

The whole capacity of the PV systems installed in Iran is 484 MW, which is only 0.55 percent of the whole power plant capacity. This capacity of the PV systems produces approximately 848 GWh in a year and prevents 0.417 Mt CO2 emission per year. The whole CO2 emission of the electrical energy systems in Iran is approximately 176.8 Mt. Therefore, it can be concluded that with the present trend of investing in the PV system, it is not possible in Iran to reach a low carbon energy system. Therefore, in this paper, two main solutions are proposed to facilitate the investment in PV systems: using the TOU FiT and participating in the carbon trading market. The main findings of the results are as follows:
  • The payback period of the PV systems in Iran in the base case (present condition) is not at all attractive to investors.
  • In Cases I and II, the payback periods for all zones decrease significantly, especially in Case II, which could encourage investors to invest in PV systems.
  • The difference between the payback period in the best and the worst zones in the base case is 0.73 yrs. This difference in both Cases I and II decreases to 0.6 yrs. Therefore, it can be concluded that the economic conditions in all zones in Iran can be more attractive in the presence of these incentive policies.
  • The results show that investment in the PV system in all cases is more attractive in the best zones, such as Zones 1 and 2, than the others. Therefore, it can be concluded that defining similar incentive policies for the whole country cannot lead to investing in PV systems in all zones. For this purpose, some solutions should be considered by the government besides the ones proposed in this paper. For example, the price of the purchased energy from the PV systems can increase in the worst zones compared to the best ones.
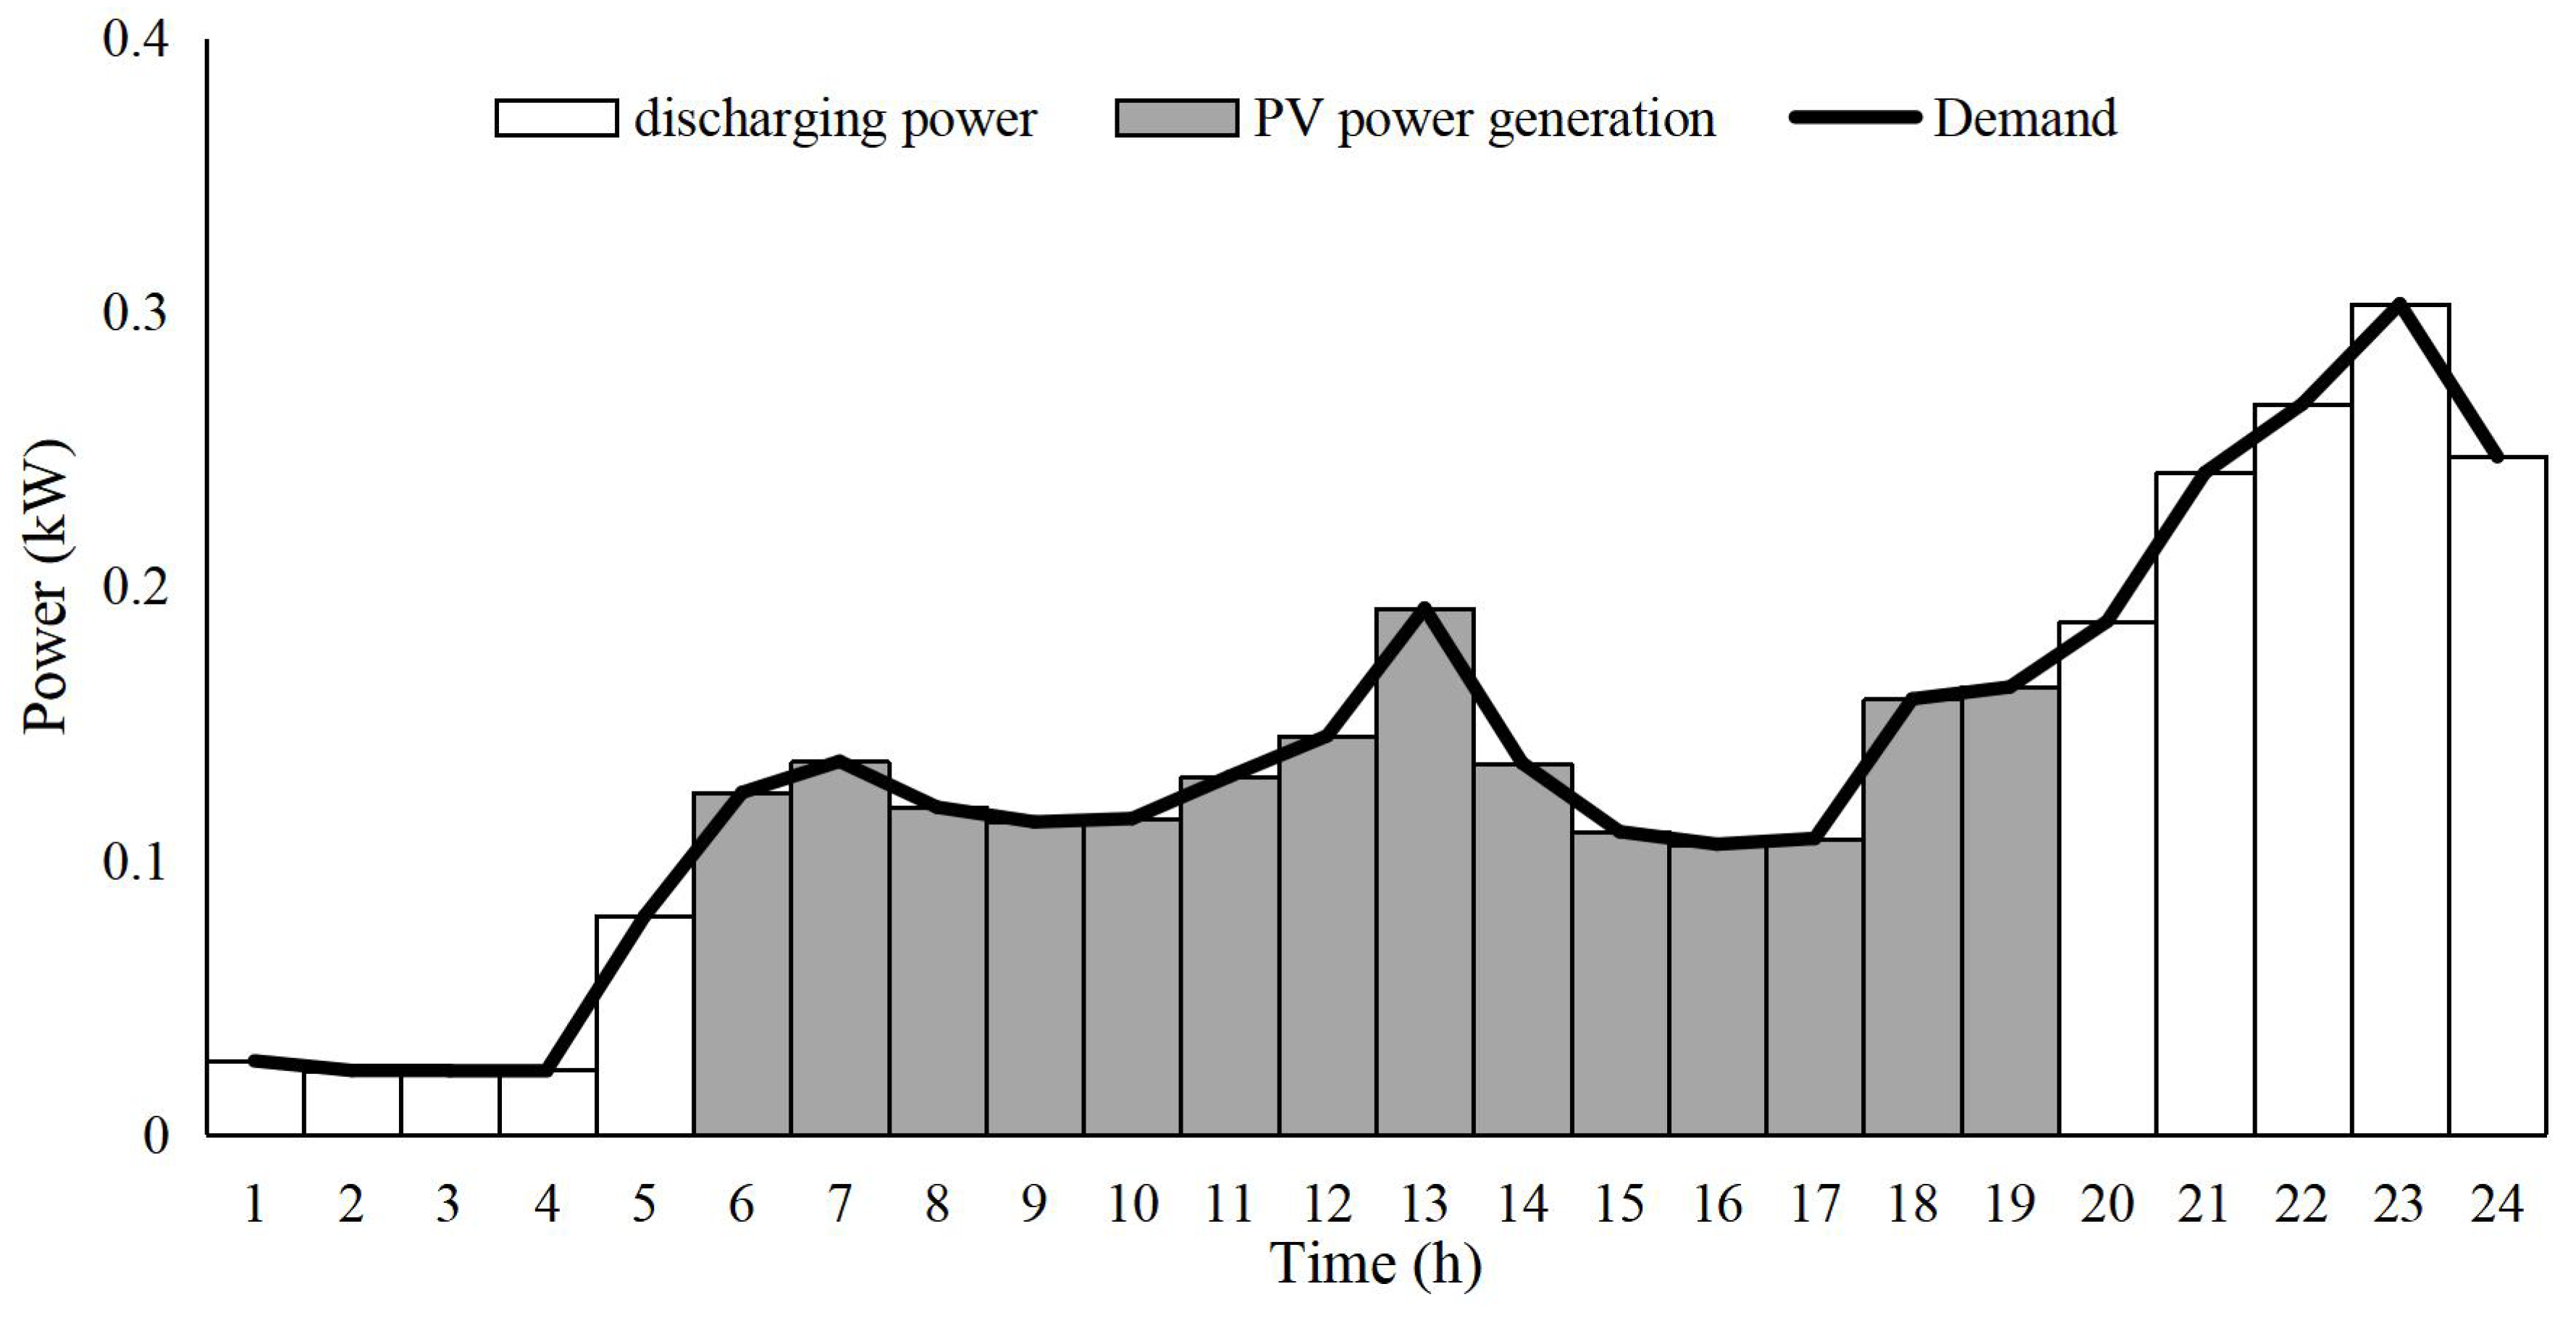
  • The results show that in the base case, the PV systems do not use the BES system to sell energy to the grid, and the BESs are only used to meet the system’s demand. Therefore, they cannot have a noticeable participation in helping the system in the peak periods. This is why, in Cases I and II, the BESs are employed in all zones, and they are charged in the off-peak hours and then discharged in the peak hours to sell energy to the grid. This means that the requirements of Iran’s power system could be met during peak hours.

5.5. Comparison of the Proposed Approach in this Paper with the Previous Studies

The aim of this subsection is to prove the main contributions of this paper in comparison with the proposed studies through the reported results.
  • Regarding the model used in this paper, the insolation is obtained for all locations in Iran and Iran is then divided into eight zones. This approach of dividing Iran into different zones is used to determine the NPV and the payback period in these zones. This is because, in previous studies, the forecast data related to the insolation used for the investment problem is solved for specific locations.
  • As the results show, considering the TOU FiT and participating in the carbon energy market leads to obtaining a better NPV and also a better payback period in comparison with the base case. The results show the different impacts of these incentive policies on the different zones. This issue shows how the proposed model in this paper can be used in Iran to increase investment in PV systems. This is because these incentive policies are not considered in the investment problem in the PV systems in the previous studies.
  • The obtained results in this paper can be used both by the investors and the government of Iran. From the viewpoint of the investors, they could then select the best locations for their investment. On the other hand, the government notices the importance of introducing different incentives for different zones to encourage investors to invest in all zones. In fact, the reported results in the previous studies could not be used by investors to select the best location for investing in a country. Also, those models cannot be used by governments to design incentive policies for their entire countries.

6. Conclusions and Future Works

In this paper, the planning problem of the PV system in the presence of the BESs is formulated considering the TOU FiT and the carbon trading market. In order to investigate the behavior of the PV systems in Iran, the insolation is calculated regarding the mathematical formulations by dividing Iran into eight different zones. The average daily insolation for the best and the worst zones are 6705 Wh/m2 and 5703 Wh/m2, respectively. The results of the planning problem are reported for three cases. For the base case with the flat FiT and without participating in the carbon market, the payback periods change from 5.46 yrs. to 6.19 yrs. from the best zone to the worst one. In Case I, considering the TOU FiT, the payback periods decrease between 6.78 percent and 8.08 percent for different zones. The results show a significant reduction of the payback period in Case II regarding the carbon trading market, where the payback period in the best zone decreases by 31.32 percent. The results show that investing in PV systems is not attractive for investors considering the present conditions in Iran (base case). The incentive policies proposed in Cases I and II decrease the payback periods of the investment in all zones. Therefore, the investment in PV systems would be attractive for investors under the conditions proposed in Cases I and II.
The results report different effects of the TOU FiT and participating in the carbon market on the NPV and the payback time of the zones. The greatest increments in the NPV in both Cases I and II occur in the zones with low PV power generation, considering the TOU FiT leads to improving the payback time in the worst zones (with low PV power generation). Also, both the TOU FiT and the participation in the carbon market lead to improving the payback time in the best zones (with high PV power generation). Therefore, the main suggestion for Iran’s government to increase the investment in the PV system is to define different flat/TOU FiTs for different zones since the NPV and the payback periods are different in each zone. In fact, defining a similar FiT for the country is not generally attractive for investors to invest in PV systems.
Some suggestions are presented as follows, which can be considered for future works:
  • Modeling the other incentive policies in the investment problem of the PV systems.
  • Developing the proposed model in this paper for the hybrid energy systems with modeling the other energy resources such as WT and biomass energy resources.
  • Developing the approach in this paper to model the investment problem of PV systems in the presence of thermal energy resources and thermal demands.

Author Contributions

Conceptualization, A.S. and S.B.; methodology, A.S. and S.B.; software, S.B.; formal analysis, A.S. and S.B.; writing—review and editing, A.S. and S.B.; supervision, S.B. All authors have read and agreed to the published version of the manuscript.

Funding

This research received no external funding.

Data Availability Statement

The data is available upon request.

Conflicts of Interest

The authors declare no conflict of interest.

Nomenclature

Acronyms
BESBattery energy storage
CCHPCombined cooling, heating, and power
CO2Carbon Dioxide
FiTFeed-in-Tariff
GHGGreenhouse gas
MILP/MINLPMixed-integer linear/nonlinear programming
PVPhotovoltaic
RESRenewable energy sources
TOUTime of Use
WTWind turbine
Indices/sets
t/TIndex/set of hours of the day
d/DIndex/set of days of the year
y/YYear of the project
Variable:
NPVNet present value (USD)
Positive variables:
E y , t BES Stored energy in the BES (kWh)
ICInvestment cost (USD)
I C BES Investment cost of the BES (USD)
I C Inverter Investment cost of the inverter (USD)
C Land Investment cost of the purchasing the land (USD)
I C PV Investment cost of the PV panels (USD)
M C y Maintenance cost of the system (USD)
M C y PV Maintenance cost of the BES (USD)
M C y BES Maintenance cost of the BES (USD)
M C y Inverter Maintenance cost of the inverter (USD)
NNumber of the PV panels
p y , t charge Power charging of the BES (kW)
p y , t discharge Power discharging of the BES (kW)
p y , t sell Selling energy to the grid (kW)
p y , t PV Power generation of the PV panels (kW)
R y sell Revenue from selling energy to the grid (USD)
R y carbon Revenue from participating in the carbon trading market (USD)
R Salvage Salvage value (USD)
Parameters:
A Land The required space for installing each PV panel (m2)
E ¯ BES Capacity of the BES (kWh)
E y BES _ ini Initial stored energy in the BES (kWh)
iReal interest rate (%)
K y , t Insolation (kW/m2)
K Std Insolation of the standard condition (kW/m2)
LT BES Lifetime of the BES (yr.)
LT Inverter Lifetime of the inverter (yr.)
LT PV Lifetime of the PV panels (yr.)
LT Project Lifetime of the project (yr.)
P y , d , h demand The demand of the system (kW)
P ¯ PV Capacity of the PV panel (kW)
η charge / η discharge Charging/discharging power efficiency of the BES
ρ y , t carbon Carbon trading market price (USD/kg)
ρ IC _ PV Cost of purchasing one PV panel (USD/kW)
ρ IC _ BES Cost of purchasing the BES (USD/kWh)
ρ IC _ Inverter Cost of purchasing the inverter (USD/kW)
ρ Land The price of purchasing land (USD/m2)
ρ y MC _ PV , ρ y MC _ BES , ρ y MC _ Inverter Maintenance price of the PV panels, BES, and inverter (USD/kW,USD/kWh, and USD/kW)
ρ y , t sell Fixed/TOU FiT (kW)
χ PV , χ BES , χ Inverter Efficiency reduction of the PV panels, BES, and inverter after ending the project
Coefficients
αThe coefficient used to show the increment size of the inverter in respect to the PV panels
δThe coefficient used to show the maximum charging/discharging power of the BES
θThe coefficient used to show the minimum stored energy in the BES
ϕThe coefficient used to show the lifetime of the BES

References

  1. Our World in Data. Iran: CO2 Country Profile. Available online: https://ourworldindata.org/co2/country/iran (accessed on 25 December 2021).
  2. Iran CO2 Emission. Available online: https://countryeconomy.com/energy-and-environment/co2-emissions/iran,countryeconomic.com (accessed on 25 December 2021).
  3. Almodfer, R.; Zayed, M.E.; Elaziz, M.A.; Aboelmaaref, M.M.; Mudhsh, M.; Elsheikh, A.H. Modeling of a solar-powered thermo-electric air-conditioning system using a random vector functional link network integrated with jellyfish search algorithm. Case Stud. Therm. Eng. 2022, 31, 101797. [Google Scholar] [CrossRef]
  4. Elaziz, M.A.; Senthilraja, S.; Zayed, M.E.; Elsheikh, A.H.; Mostafa, R.R.; Lu, S. A new random vector functional link integrated with mayfly optimization algorithm for performance prediction of solar photovoltaic thermal collector combined with elec-trolytic hydrogen production system. Appl. Therm. Eng. 2021, 193, 117055. [Google Scholar] [CrossRef]
  5. El-Hadary, M.I.; Senthilraja, S.; Zayed, M.E. A hybrid system coupling spiral type solar photovoltaic thermal collector and electrocatalytic hydrogen production cell: Experimental investigation and numerical modeling. Process. Saf. Environ. Prot. 2023, 170, 1101–1120. [Google Scholar] [CrossRef]
  6. Bae, S.; Nam, Y. Feasibility analysis for an integrated system using photovoltaic-thermal and ground source heat pump based on real-scale experiment. Renew. Energy 2022, 185, 1152–1166. [Google Scholar] [CrossRef]
  7. Zayed, M.E.; Zhao, J.; Elsheikh, A.H.; Li, W.; Sadek, S.; Aboelmaaref, M.M. A comprehensive review on Dish/Stirling concentrated solar power systems: Design, optical and geometrical analyses, thermal performance assessment, and applications. J. Clean. Prod. 2020, 283, 124664. [Google Scholar] [CrossRef]
  8. Al Garni, H.Z.; Mas’Ud, A.A.; Baseer, M.; Ramli, M.A. Techno-economic optimization and sensitivity analysis of a PV/Wind/diesel/battery system in Saudi Arabia using a combined dispatch strategy. Sustain. Energy Technol. Assess. 2022, 53, 102730. [Google Scholar] [CrossRef]
  9. Rehman, W.U.; Bo, R.; Mehdipourpicha, H.; Kimball, J.W. Sizing battery energy storage and PV system in an extreme fast charging station considering uncertainties and battery degradation. Appl. Energy 2022, 313, 118745. [Google Scholar] [CrossRef]
  10. Han, X.; Garrison, J.; Hug, G. Techno-economic analysis of PV-battery systems in Switzerland. Renew. Sustain. Energy Rev. 2022, 158, 112028. [Google Scholar] [CrossRef]
  11. Chowdhury, T.; Hasan, S.; Chowdhury, H.; Hasnat, A.; Rashedi, A.; Asyraf, M.R.M.; Hassan, M.Z.; Sait, S.M. Sizing of an Island Standalone Hybrid System Considering Economic and Environmental Parameters: A Case Study. Energies 2022, 15, 5940. [Google Scholar] [CrossRef]
  12. Wu, Y.; Liu, Z.; Liu, J.; Xiao, H.; Liu, R.; Zhang, L. Optimal battery capacity of grid-connected PV-battery systems considering battery degradation. Renew. Energy 2021, 181, 10–23. [Google Scholar] [CrossRef]
  13. Aziz, A.S.; Tajuddin, M.F.N.; Zidane, T.E.K.; Su, C.-L.; Alrubaie, A.J.K.; Alwazzan, M.J. Techno-economic and environmental evaluation of PV/diesel/battery hybrid energy system using improved dispatch strategy. Energy Rep. 2022, 8, 6794–6814. [Google Scholar] [CrossRef]
  14. Al-Aali, I.; Modi, V. Decarbonizing the electricity sector in Qatar using PV combined with ice thermal and battery storage. Energy Strat. Rev. 2022, 44, 101014. [Google Scholar] [CrossRef]
  15. Ropero-Castaño, W.; Muñoz-Galeano, N.; Caicedo-Bravo, E.F.; Maya-Duque, P.; López-Lezama, J.M. Sizing Assessment of Islanded Microgrids Considering Total Investment Cost and Tax Benefits in Colombia. Energies 2022, 15, 5161. [Google Scholar] [CrossRef]
  16. Muna, Y.B.; Kuo, C.-C. Feasibility and Techno-Economic Analysis of Electric Vehicle Charging of PV/Wind/Diesel/Battery Hybrid Energy System with Different Battery Technology. Energies 2022, 15, 4364. [Google Scholar] [CrossRef]
  17. Kahsay, M.B.; Lauwaert, J. Excess Energy from PV-Battery System Installations: A Case of Rural Health Center in Tigray, Ethiopia. Energies 2022, 15, 4355. [Google Scholar] [CrossRef]
  18. Amupolo, A.; Nambundunga, S.; Chowdhury, D.S.P.; Grün, G. Techno-Economic Feasibility of Off-Grid Renewable Energy Electrification Schemes: A Case Study of an Informal Settlement in Namibia. Energies 2022, 15, 4235. [Google Scholar] [CrossRef]
  19. Sigarchian, S.G.; Malmquist, A.; Martin, V. Design Optimization of a Small-Scale Polygeneration Energy System in Different Climate Zones in Iran. Energies 2018, 11, 1115. [Google Scholar] [CrossRef] [Green Version]
  20. Yousefi, H.; Hafeznia, H.; Yousefi-Sahzabi, A. Spatial Site Selection for Solar Power Plants Using a GIS-Based Boolean-Fuzzy Logic Model: A Case Study of Markazi Province, Iran. Energies 2018, 11, 1648. [Google Scholar] [CrossRef] [Green Version]
  21. Dahooie, J.H.; Kashan, A.H.; Naeini, Z.S.; Vanaki, A.S.; Zavadskas, E.K.; Turskis, Z. A Hybrid Multi-Criteria-Decision-Making Aggregation Method and Geographic Information System for Selecting Optimal Solar Power Plants in Iran. Energies 2022, 15, 2801. [Google Scholar] [CrossRef]
  22. Amini, S.; Bahramara, S.; Golpîra, H.; Francois, B.; Soares, J. Techno-Economic Analysis of Renewable-Energy-Based Micro-Grids Considering Incentive Policies. Energies 2022, 15, 8285. [Google Scholar] [CrossRef]
  23. Stull, R.B.; Ahrens, C.D. Meteorology for Scientists and Engineers; Brooks/Cole: Monterey, CA, USA, 2000. [Google Scholar]
  24. Khezri, R.; Mahmoudi, A.; Haque, M.H. A Demand Side Management Approach for Optimal Sizing of Standalone Renewable-Battery Systems. IEEE Trans. Sustain. Energy 2021, 12, 2184–2194. [Google Scholar] [CrossRef]
  25. Mongird, K.; Viswanathan, V.V.; Balducci, P.J.; Alam, J.E.; Fotedar, V.; Koritarov, V.S.; Hadjerioua, B. Hadjerioua, Energy Storage Technology and Cost Characterization Report; Pacific Northwest National Lab.(PNNL): Richland, WA, USA, 2019; p. 1573487. [Google Scholar] [CrossRef]
  26. EMBER. EU Carbon Price Tracker. Available online: https://ember-climate.org/data/data-tools/carbon-price-viewer/ (accessed on 25 December 2021).
  27. EMBER. Available online: https://ember-climate.org/countries-and-regions/countries/iran/ (accessed on 25 December 2021).
Figure 1. The proposed approach in this paper for modeling the investment problem in PV systems.
Energies 16 01067 g001
Figure 2. Insolation in Iran at 12:00 p.m. local time in June.
Energies 16 01067 g002
Figure 3. Proposed purchasing energy price from the PV system in Case I.
Energies 16 01067 g003
Figure 4. Carbon trading market price used in Case II [26].
Energies 16 01067 g004
Figure 5. The power balance of the PV system in Case I in Zone 1 on a summer day.
Energies 16 01067 g005
Figure 6. Results of supplying the demand for Case I in Zone 1 on a summer day.
Energies 16 01067 g006
Figure 7. The power balance of the PV system in Case I in Zone 1 on a non-summer day.
Energies 16 01067 g007
Figure 8. Results of supplying the demand for Case I in Zone 1 on a non-summer day.
Energies 16 01067 g008
Table 1. Comparing the present paper with previous studies regarding their modeling approaches.
Ref.InsolationModeling Selling Energy to the GridModeling Carbon Reduction Incentive
Mathematical ModelingUsing Forecast
Data
Flat
FiT
TOU
FiT
Fixed PriceCarbon Market
LatitudeLongitudeDay/Hour
[8]----*----
[9]----*----
[10]----**---
[11]----*----
[12]----***--
[13]----*----
[14]----*--*-
[15]----**---
[16]----*----
[17]----*----
[18]----*----
[19]----**---
[22]----**---
This paper****-**-*
* stands for ‘considered’ and - stands for ‘not considered’.
Table 2. Comparing the present paper w previous studies regarding the optimization approaches and case studies.
Ref.PV SystemOptimization
Approach
Case StudyWhole Country
PVInverterBESMathematical ModelSoftwareSpecified Locations
[8]***-HOMERAbha, Jazan, Makkah, Madinah, Hail, and Arar (Saudi Arabia)-
[9]****-Oak Ridge, Tennessee (USA)-
[10]****-Zurich (Switzerland)-
[11]***-HOMERMonpura Island (Bangladesh)-
[12]****-Changsha (China)-
[13]***-HOMERA rural area (Iraq)-
[14]****-A residential area (Qatar)-
[15]****-A university (Colombia)-
[16]***-HOMERThree cities (Ethiopia)-
[17]**--TRNSYSA health center (Ethiopia)-
[18]***-HOMERResidential consumers (Namibia)-
[19]***-TRNSYS
PSO
Hamedan, Tehran, Ahvaz (Iran)-
[22]***-HOMEREducational complex, Sanandaj (Iran)-
This paper****--Iran
* stands for ‘considered’ and - stands for ‘not considered’.
Table 3. Average daily insolation in the eight different zones.
Zone
Number
Latitude SpectrumLongitude
Spectrum
The Chosen Latitude for Calculations (ϕ)Average Daily Insolation
(Wh/m2)
Zone 125° N–26.8° N44° E–63° E26° N6705
Zone 226.8° N–29° N44° E–63° E28° N6582
Zone 329° N–31° N44° E–63° E30° N6451
Zone 431° N–33.7° N44° E–63° E32° N6314
Zone 533.7° N–35.8° N44° E–63° E34° N6169
Zone 635.8° N–37.7° N44° E–63° E36° N6019
Zone 737.7° N–39.4° N44° E–63° E38° N5864
Zone 839.4° N–40° N44° E–63° E40° N5703
Table 4. Conditions of different cases defined for the simulations.
CasesFlat FiTTOU FiTCarbon Trading Market
Base case--
Case I--
Case II-
✓ stands for ‘considered’ and - stands for ‘not considered’.
Table 5. The optimized capacity, the NPC, and the payback time of the system in the base case.
Zone’s NumberInstalled CapacitiesNPV
(USD)
Payback Time
(yr.)
PV
(kW)
Inverter
(kW)
BES
(kWh)
Zone 12002204227,940.615.46
Zone 22002204220,992.485.54
Zone 32002204213,639.025.63
Zone 42002204205,900.465.73
Zone 52002204197,798.975.83
Zone 62002204189,356.585.95
Zone 72002204180,597.526.07
Zone 82002204171,547.876.19
Table 6. The details of the costs/revenue in the base case.
Zone’s NumberInvestment
Cost (USD)
Maintenance
Cost (USD)
Land Price
(USD)
Revenue from
Selling Energy (USD)
Salvage
(USD)
Zone 1119,73820,735.4528,800376,161.6545,000
Zone 2119,73820,735.4528,800369,213.5245,000
Zone 3119,73820,735.4528,800361,860.0145,000
Zone 4119,73820,735.4528,800354,121.5145,000
Zone 5119,73820,735.4528,800346,020.0145,000
Zone 6119,73820,735.4528,800337,577.6345,000
Zone 7119,73820,735.4528,800328,818.5645,000
Zone 8119,73820,735.4528,800319,768.9245,000
Table 7. The optimized capacity, the NPC, and the payback time of the system in case I.
Zone’s NumberInstalled CapacitiesNPV
(USD)
Payback Time
(yr.)
PV
(kW)
Inverter
(kW)
BES
(kWh)
Zone 1200 kW220 kW94373,478.795.09
Zone 2200 kW220 kW96365,084.235.16
Zone 3200 kW220 kW99356,105.875.23
Zone 4200 kW220 kW100346,574.655.31
Zone 5200 kW220 kW100336,523.685.39
Zone 6200 kW220 kW100325,968.275.48
Zone 7200 kW220 kW100314,878.325.58
Zone 8200 kW220 kW100303,323.965.69
Table 8. The details of the costs/revenue in case I.
Zone’s NumberInvestment Cost
(USD)
Maintenance
Cost (USD)
Land Price
(USD)
Revenue from
Selling Energy
(USD)
Salvage
(USD)
Zone 1130,71825,529.8228,800539,670.2145,000
Zone 2130,96225,636.3628,800531,674.9945,000
Zone 3131,32825,796.1728,800523,295.6445,000
Zone 4131,45025,849.4428,800513,964.0945,000
Zone 5131,45025,849.4428,800505,711.5745,000
Zone 6131,45025,849.4428,800493,357.7245,000
Zone 7131,45025,849.4428,800482,267.7645,000
Zone 8131,45025,849.4428,800470,713.4145,000
Table 9. The optimized capacity, the NPC, and the payback time of the system in case II.
Zone’s NumberInstalled CapacitiesNPV
(USD)
Payback Time
(yr.)
PV
(kW)
Inverter
(kW)
BES
(kWh)
Zone 120022045592,299.543.75
Zone 220022052579,601.253.82
Zone 320022061566,082.773.9
Zone 420022069551,787.523.99
Zone 520022079536,763.714.07
Zone 620022084521,038.84.16
Zone 7200220885046,56.344.25
Zone 8200220924876,66.174.35
Table 10. The details of the costs/revenue in case II.
Zone’s NumberInvestment
Cost (USD)
Maintenance
Cost (USD)
Land Cost
(USD)
Revenue from
Selling Energy
(USD)
Revenue from Carbon
Reduction (USD)
Salvage
(USD)
Zone 1124,74022,919.5528,800529,651.45219,055.6545,000
Zone 2125,59423,292.4528,800522,671.12214,735.3845,000
Zone 3126,69223,771.8828,800515,525.95210,159.145,000
Zone 4127,66824,198.0528,800507,611.56205,375.645,000
Zone 5128,88824,730.7428,800499,599.22003,60.8645,000
Zone 6129,49824,997.1128,800490,017.81952,15.7245,000
Zone 7129,98625,210.1928,800479,744.511899,05.2345,000
Zone 8130,47425,423.2828,800469,025.621844,32.6245,000
Table 11. Comparison of the results of three cases.
Zone’s NumberNPV
(USD)
NPV Increment
(%)
Payback Time
(yr.)
Payback Time Reduction
(%)
Base CaseCase ICase IIBase caseCase ICase II
Zone 1227,940.6163.85159.85.466.7831.32
Zone 2220,992.4865.2162.35.546.8631.05
Zone 3213,639.0266.691655.637.1130.73
Zone 4205,900.4668.321685.737.3330.34
Zone 5197,798.9770.13171.45.837.5530.19
Zone 6189,356.5872.15175.25.957.930.09
Zone 7180,597.5274.35179.46.078.0729.99
Zone 8171,547.8776.82184.36.198.0829.73
Disclaimer/Publisher’s Note: The statements, opinions and data contained in all publications are solely those of the individual author(s) and contributor(s) and not of MDPI and/or the editor(s). MDPI and/or the editor(s) disclaim responsibility for any injury to people or property resulting from any ideas, methods, instructions or products referred to in the content.

