Article

Effect of Glucose and Methylene Blue in Microbial Fuel Cells Using E. coli

by
Carolina Montoya-Vallejo
,
Jorge Omar Gil Posada
and
Juan Carlos Quintero-Díaz
*
Grupo de Bioprocesos, Departamento de Ingeniería Química, Universidad de Antioquia, Medellín 050010, Colombia
*
Author to whom correspondence should be addressed.
Energies 2023, 16(23), 7901; https://doi.org/10.3390/en16237901
Submission received: 26 September 2023 / Revised: 23 October 2023 / Accepted: 28 October 2023 / Published: 4 December 2023
(This article belongs to the Topic Chemical and Biochemical Processes for Energy Sources)

Abstract

:
Microbial fuel cells could be used as an alternative for wastewater treatment and electricity generation. Escherichia coli is a representative bacterium that has been widely studied as a model in laboratory assays despite its limited ability to transfer electrons. Although previous studies have employed glucose and methylene blue in electricity production using E. coli, there remains a lack of understanding on how current generation would impact the production of metabolites and what the most appropriate conditions for current production might be. To shed light on those issues, this manuscript used a 32 factorial design to evaluate the effect of the concentration of organic matter (glucose) and the concentration of the mediator methylene blue (MB) using E. coli DH5α as an anodic microorganism. It was found that as the concentration of glucose was increased, the production of electricity increased and at the same time, its degradation percentage decreased. Similarly, a 17-fold increase in current production was observed with an elevation in methylene blue concentration from 0 to 0.3 mM, though inhibition became apparent at higher concentrations. The maximum power generated by the cell was 204.5 µW m−2, achieving a current density of 1.434 mA m−2 at concentrations of 5 g L−1 of glucose and 0.3 mM of MB. Reductions in the production of ethanol, lactate, and acetate were observed due to the deviation of electrons to the anode.

1. Introduction

Accelerated industrial development and demographic growth are constantly creating challenges to human society, some of those challenges include a scarcity of fresh water, increasing the demand of energy in the order of 28,500 TWh by the year 2021 [1], the generation of large amounts of waste currently estimated at 360 km3 year−1 [2,3], and environmental deterioration [4]. Therefore, it is important to develop and implement energy-efficient processes that add value to the organic matter present in different types of wastewaters, this will in turn provide a means to achieve water purification and reuse [5].
Microbial fuel cells (MFCs) are bioelectrochemical devices engineered to convert chemical energy into bioelectricity through the redox processes occurring within living microorganisms. Microbial fuel cells can provide ecofriendly solutions to energy scarcity and water pollution [6]. A typical MFC comprises an anode chamber where a microbial culture oxidizes organic matter into electrons and protons thus producing a flow of electrons that is diverted through an external circuit and a flow of protons that travels across the electrolyte, both flows converging to the cathode where oxidized species are finally reduced [7].
Recent advancements have demonstrated that the MFC power density can be substantially improved through alterations in electrode materials and construction, the customization of bacterial cultures to boost MFC performance, and the optimization of MFC geometry and design. Nonetheless, the relatively low power density of MFCs remains a significant challenge that hinders their widespread adoption for large-scale applications [8,9].
Commonly found in the lower intestines of warm-blooded animals, Escherichia coli, is a well-known facultative anaerobic bacterium that belongs to the Enterobacteriacea family. Due to its clear genetic background, convenience to be genetically modified, low nutritional requirements, and rapid growth, E. coli is one of the most frequently used bacterial models for the electrochemical oxidation of carbon sources [10,11,12].
Within the respiratory chain of E. coli, a significant number of primary dehydrogenases are present to oxidize electron donors, and terminal reductases and quinones are present to reduce electron acceptors. These components are activated depending on the availability of final electron acceptors [13,14]. The transfer of electrons to the anode by E. coli has been tested, and although very low, it is not negligible. Since E. coli lacks nanotubes for direct electron transfer [15], this transfer appears to be promoted by endogenous redox mediators such as hydroquinones, as well as other soluble molecules that could act as electron carriers [15,16,17]. E. coli DH5α is a widely used strain for maintaining and amplifying plasmid DNA [18]. Its effective utilization in microbial cells can facilitate initiatives to expand its application through improvements aimed at achieving a higher efficiency in electron transfer, as has been done recently [19,20].
Given that the redox potential (E0) of the NADH/NAD+ pair is −320 mV, the redox potential of terminal reductases under anaerobic conditions such as nitrite reductase (E0 = +360 mV), DMSO reductase (E0 = +160 mV), TMAO reductase (E0 = +130 mV), or fumarate reductase (E0 = +30 mV), allows for the flow of electrons until they reach the final acceptor. Electron transfer can also be achieved by using exogenous mediators that compete with the natural final acceptors; these species must be capable of penetrating the cellular membrane to receive electron charges from the terminal reductases of the cell, then leave the cell to transfer electrons to the anode. To enable fast electrode reaction kinetics, exogenous mediators should ideally exhibit not only a low toxicity to microorganisms but also a high solubility and stability [21]. Exogenous mediators, such as methylene blue (MB), methyl viologen (MV), neutral red (NR), anthraquinone-2,6-disulfonate (AQDS), 2-hydroxy-1,4-naphthoquinone, and resazurin, have been used to enhance electron transfer when electrically inactive microorganisms like E. coli are used with microbial fuel cells [22,23,24,25,26]. Among these redox compounds, methylene blue (E0 = +110 mV) is highly attractive due to its high redox potential [24]; however, optimization studies of its concentration in relation to the concentration of the carbon source as an electron donor have not been conducted. Figure 1 not only provides a schematic description of a microbial fuel cell but also represents the mediation mechanism of MB. Recent developments have demonstrated the utility of E. coli in MFC technology, achieving power densities on the order of 11.7 mW m−2 when using E. coli K12 and anodes based on carbon [27]; the use of E. coli DH5 α and anodes based on carbon nanotubes has rendered even larger power densities, reaching 2740 mW m−2 [28,29]. When dealing with E. coli, differences in MFC electron transfer measurements can be explained by electrode materials [15], genetic modifications [30], the use of exogen mediators [20], and cocultures [31,32].
This manuscript aims at evaluating and improving the production of electric current obtained when E. coli degrades glucose by means of an anodic fermentation within a microbial fuel cell, and by using methylene blue as exogenous mediator.

2. Materials and Methods

2.1. Reactor Design and Operation

Escherichia coli DH5α was used as the anodic microorganism and was cultured in LB (Luria-Bertani) medium that contained 5.0 g L−1 of NaCl, 10 g L−1 of tryptone, and 5.0 g L−1 of yeast extract.
A dual-chamber H-type microbial fuel cell was used to conduct experiments. The basic setup consisted of two glass chambers, each of them with a total capacity of 250 mL, separated by a Zirfon® proton exchange membrane with a diameter of 1.5 cm. Graphite brush electrodes were used for both anodic and cathodic chambers (2.5 cm in outer diameter and 2.5 cm long, an average fiber diameter of 0.72 μm, a total area of 0.22 m2, MILL ROUSE). The anodic chamber was loaded with an E. coli DH5α suspension in LB medium that was supplemented with glucose as an electron donor at different concentrations (1.0, 5.0, 10.0) g L−1 and methylene blue as a redox mediator also at three concentrations (0, 0.3, 3.0) mM. The cathodic chamber was filled with a solution of 20 mM K3[Fe(CN)6], and oxygen was supplied through air bubbling using an aquarium pump at a constant flow. An external resistance of 1 kΩ was part of the external circuit that was used to connect anode and cathode. The MFC operating temperature was held constant at 35 °C at a constant speed of 150 rpm. Anaerobic conditions within the anodic chamber were reached by minimizing the head space, and by bubbling nitrogen for at least 10 min, prior to each culture.
Data acquisition and electrochemical measurements (polarization curves and voltage profiles) were performed by using a multichannel potentiostat with FRA capabilities (MultiPalmSense4, Palmsens - Houten. Netherlands).
The performance of the MFC was assessed by measuring the net charge ( Q e ) generated during each treatment using the current vs. time (I vs. t) profile, as described in the following expression (Equation (1)):
Q e = I   d t
The construction of the power curves (P = V I) (from the polarization curve V vs. I) allowed for the determination of the maximum power generated by the cell (Pmax), and for the determination of the internal resistance which determines a relationship between the maximum power generated by the cell and the square of the intensity of the current (Equation (2)) [33].
R i n t = P m á x I 2
The anodic electrofermentation efficiency (ηEF) is defined by Equation (3) [34]:
η E F = Q e Q p i
where the number of electrons released to the anode and transferred through the external circuit ( Q e ) are calculated by using Equation (1), while the term Q p i represents the total electron charge due to the formation of products during the open-circuit fermentation (control treatment), minus the electron charge due to product formation during the anodic electrofermentation. To calculate this parameter, it is required to evaluate the number of electrons ( N P i ) per mol of product i by means of Equation (4).
N C w N x O y H z = 4 w 3 x 2 y + z
If ( n P i ) is the number of moles of product i formed and F is the Faraday constant (96,458 C mol−1), then:
Q p i = n P i N P i   F

2.2. Analytical Methods

Glucose was measured according to the glucose oxidase method [35]. Biomass was determined by measuring the optical density of a culture sample at 600 nm by using a spectrophotometer. Bacteria metabolites of E. coli DH5α (lactate, acetate, and ethanol) were determined by using an HPLC system (Agilent, Tokyo, Japan) equipped with a refractive index detector. Separations were carried out on an ICSEP COREGEL- 87H3 column (Transgenomic, Omaha, NE, USA). The mobile phase consisted of an aqueous solution of sulfuric acid 0.01 N, at a flow rate of 0.6 mL min−1 [36].

2.3. Experimental Design and Statistical Analysis
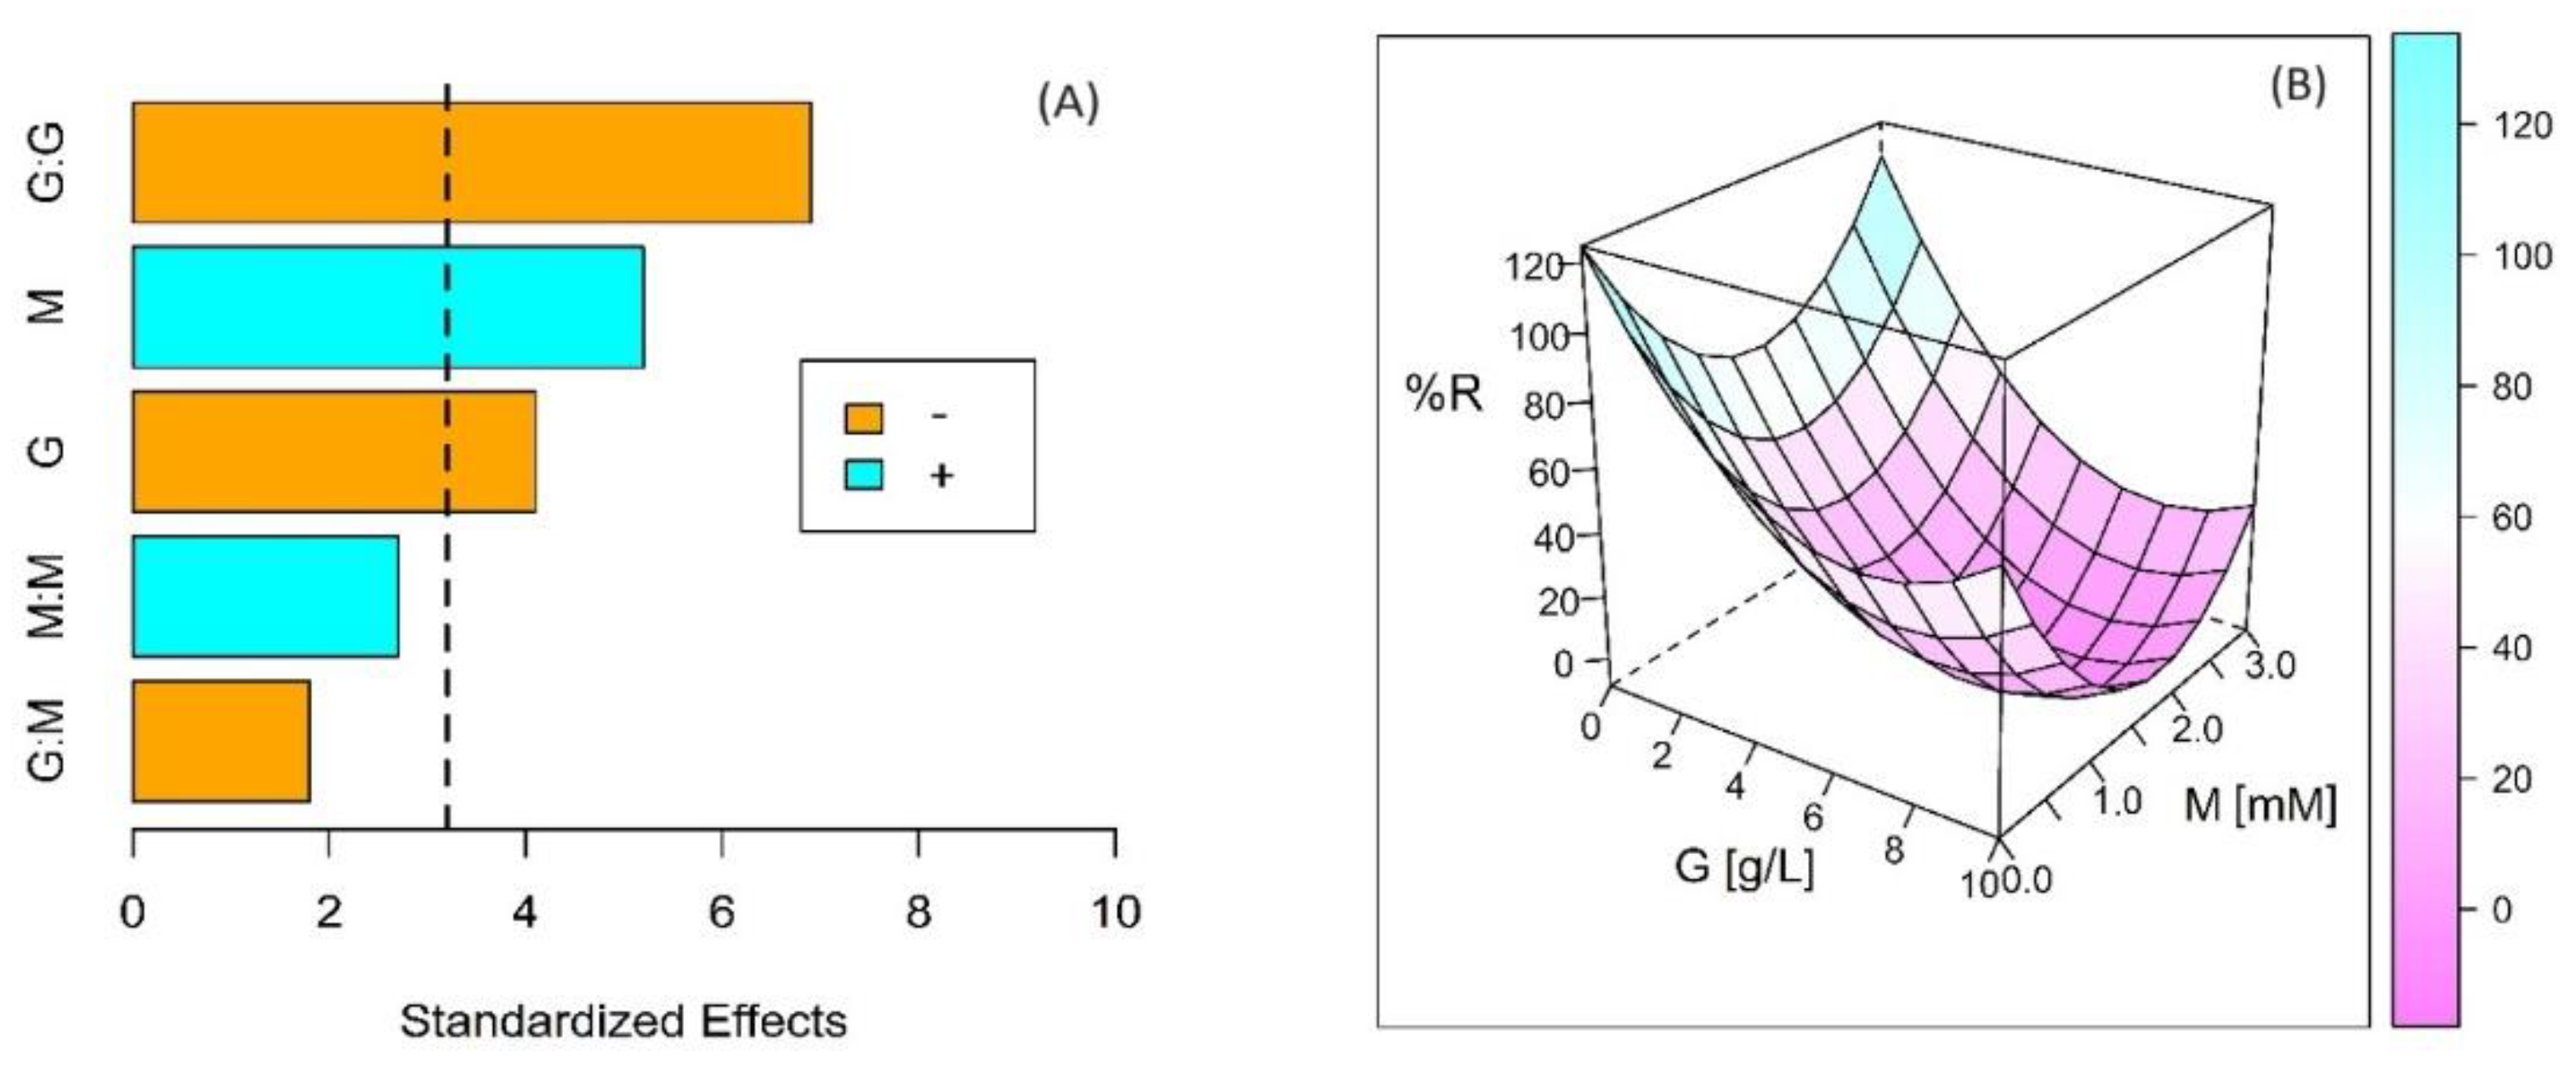
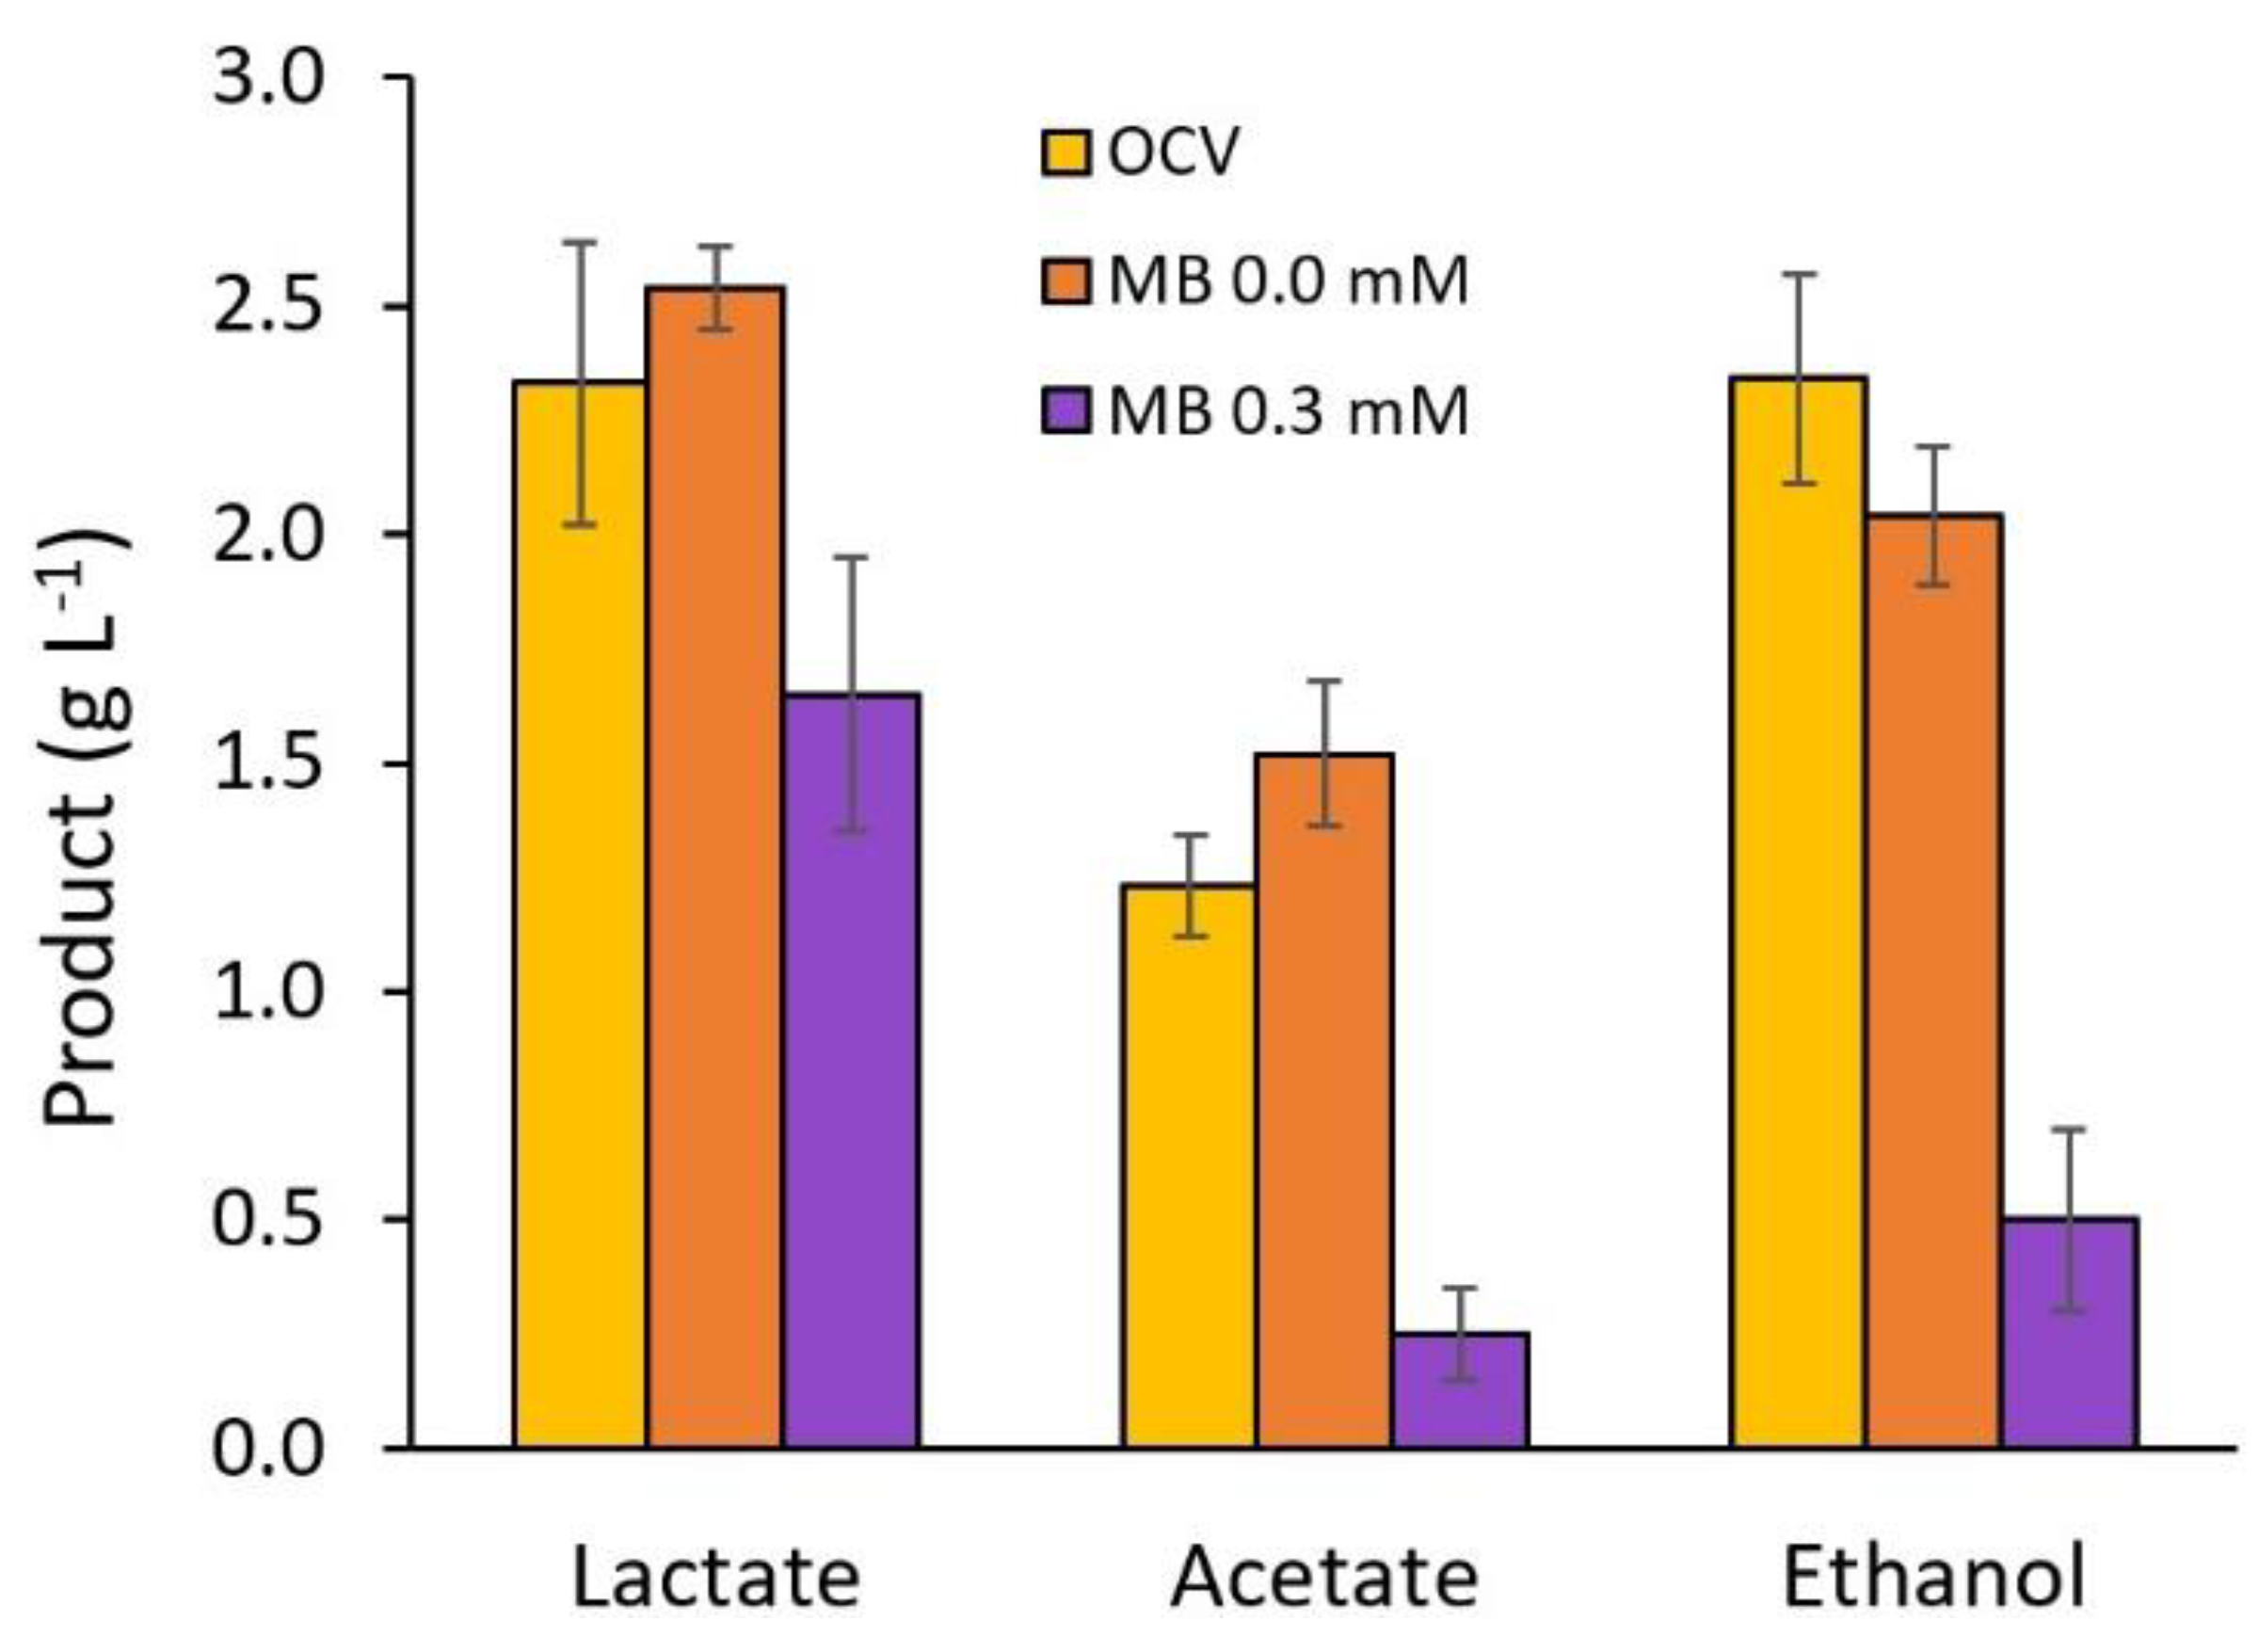
A factorial design 32 (duplicate) was performed to evaluate the effect of organic matter concentration as an electron donor (glucose 1, 5 and 10 g L−1) and methylene blue (MB) concentration as an electron carrier (0, 0.3 and 3.0 mM), on the performance of the MFC. Statistical analysis was performed by an ANOVA, a comparation of means, and by the response surface methodology using software Statgraphics Centurion V 19.1.2.

3. Results

As previously explained, a full 32 factorial design was used to evaluate the incidence of the organic load (glucose concentration) and redox mediator (methylene blue) on the MFC performance. Experiments were conducted under batch mode and using E. coli DH5 α.
As shown in Figure 2A, time-domain voltage profiles for treatments using three different concentrations of mediator and glucose at a constant concentration of 5.0 g L−1 were compared. While no significant potential difference across the cell was developed for the culture without mediator, a rapid increase in the MFC voltage profile was detected for the culture when the concentration of methylene blue was increased from 0.0 mM to 0.3 mM, as the maximum voltage drop across the MFC went up from negligible values to almost 0.31 V; once this value was reached, it remained almost constant for the rest of the treatment.
However, when the culture was conducted at a concentration of methylene blue of 3.0 mM, the maximum voltage drop generated across the MFC went down to 0.19 V. After each treatment was completed, the overall electric charge was calculated as the area under the curve on a current versus time plot using Equation (1). As can be seen from Figure 2B, in the absence of a redox mediator, E. coli DH5 α renders neither a significant current nor an appreciable voltage drop across the MFC. However, when methylene blue is added at a concentration of 0.3 mM, there is a significant increase in both current and voltage drops. For example, the treatments conducted at 5.0 g L−1 of glucose revealed that when the concentration of methylene blue was increased from 0 to 0.3 mM, the charge increased from 1.3 coulomb to 25.6 coulomb. However, when the methylene blue concentration was further increased to 3.0 mM, the cell performance decreased, and only 13.5 coulombs of charge was produced. Similar results have been reported elsewhere; for example, by using an H-type MFC, Taskan and coworkers [37] evaluated the concentration effect of selected mediators such as methylene blue (MB), 2-hydroxy-1,4-naphthoquinone (HNQ), and neutral red (NR) on cell performance using domestic wastewater as substrate. It was found that for every mediator, there was a concentration threshold above which any further concentration increase would produce a decrease in cell current; that was 50 µM for HNQ and 300 µM for both MB and NR. This reduction was associated with an increase in the internal resistance of the cell, so it was concluded that large concentrations of mediator species would foment the adsorption of mediator molecules on the surface of the electrode, which would in turn affect the overall internal resistance of the cell [37]. Similarly, Rahimnejad and coworkers found that current would decrease when increasing the concentration of methylene blue beyond 3.0 mM; this could be attributed to the formation of methylene blue aggregates that might occur at large concentration [26,38]. On the other hand, methylene blue at concentrations beyond 1.5 mM inhibits microbial growth; therefore, this molecule has been used to treat E. coli infections [39,40,41]. What all of this suggests is that cell performance is adversely affected by large concentrations of methylene blue not only for its antimicrobial properties but also for its absorption on the surface of the electrode (thus increasing internal resistance) and the formation of dimers which might hinder electron transport, and thus any redox process involving the methylene blue itself. Moreover, it has also been reported that for a culture of E. coli with methylene blue at concentrations beyond 0.3 mM, current production was at least 10 times larger than the ones corresponding to cultures without a mediator [15]. Finally, no inhibitory effect was detected beyond 10 mM of methylene blue (antimicrobial properties). These findings have been explained in terms of mediator depletion due to adsorption on the walls of the reactor [15].
The presence of glucose was found to have a positive effect on the generation of current only when methylene blue was used. In the absence of methylene blue, current production was marginal at best, as reported in Table 1, which indicates that E. coli requires the use of an external redox mediator to generate significant MFC currents. Similar conclusions were drawn with cultures of E. coli with neutral red, where currents in the order of 0.1 mA were achieved when no mediator was used; however, in the presence of neutral red, currents in the order of 1.2 mA were reached [42]. On the other hand, cocultures of E. coli with P. aeruginosa (which is well known for producing several redox mediators) rendered larger current values than its pure-culture counterparts [31,43].
In line with the ANOVA and Pareto diagram (Figure 3A), the concentrations of glucose and methylene blue on electric charge were both significant (p < 0.05). In the case of methylene blue, a significant second-order model was determined. Neither the glucose quadratic effect nor the mixed term between glucose and methylene blue were significant. The overall model, given by Equation (6), had a regression coefficient (r2) of 0.973 with an adjusted r2 of 0.928. From this equation, it followed the linear terms in glucose and methylene blue had a positive effect on the electric charge; however, the methylene blue quadratic term was negative, which indicated inhibition. The quadratic effects of glucose and the interaction were not significant for the model.
Qe = −2.93615 + 0.70788 × G + 89.64 × M + 0.02224 × G2 + 0.2496*G × M − 28.9403 × M2
The surface response model, plotted in Figure 3B, indicates an optimal value for the electric charge of 79.7 C at 1.6 mM of methylene blue and 10.0 g L−1 of glucose. It is worth noting that the methylene blue inhibitory effect that occurs at concentrations beyond 1.5 mM. as mentioned in [40], and other aspects that might adversely affect the electric charge (already considered) might limit the usefulness of the model.
As can be seen from Table 1, glucose utilization efficiency values ranged from 93% for an initial concentration of glucose of 1.0 g L−1 to nearly 40% for larger initial concentrations of glucose (5–10 g L−1) and all of this at 0.3 mM of methylene blue. As can be seen, initial concentrations of glucose of 1.0 g L−1 rendered the largest values of glucose utilization efficiency. In any case, the carbon source was never completely depleted. This behavior has been previously explained by considering that the use of high organic loads will increase the production of organic acids, thus increasing the acidity of the anolyte, which will in turn reduce microbial activity and COD removal [44]. Similarly, the accumulation of fermentation products such as acetate, lactate, and ethanol will inhibit microbial growth when using E. coli [45,46]. It has been shown that lactic acid at a concentration of 5.0 g L−1 would completely inhibit the growth of E. coli [47], Similarly, it has been reported that any additions of acetate species at concentrations beyond 0.45 g L−1 would reduce the rate of E. coli growth by almost 50% [48].
As can be seen from Table 1, the incidence of methylene blue on glucose degradation was very significant. For example, for an initial concentration of glucose of 5.0 g L−1, the percentage of degradation dropped from 40.6% to 32.1% when the methylene blue concentration was increased from 0.3 mM to 3.0 mM. These results are in line with the potential inhibitory effect the methylene blue has been reported to exert on microbial growth. According to the experimental results, the largest variation on the remotion of organic matter can be mostly explained by the presence of methylene blue.
The largest current density value of 2.0 mA m−2 was achieved when using methylene blue at a concentration of 0.3 mM and glucose at 10 g L−1; however, when the concentration of glucose was reduced to 5.0 g L−1, the current density decreased to 1.4 mA m−2; a further reduction in the concentration of glucose to 1.0 g L−1 rendered an even smaller current density, in the order of 0.97 mA m−2, but in that case, one of the largest glucose remotion efficiency values (93.3%) was achieved (corresponding to a cell voltage of 210 mV). By taking these observations into consideration, the polarization and power curves shown in Figure 4 reveal the maximum power generated by the cell was in the order of 204.5 µW m−2, and the internal resistance of the cell was in the order of 288.8 ohms. Other authors have claimed that when using dual MFC devices with carbon anodes and E. coli, current density values ranging from between 300 and 810 mA m−2 were achieved at power densities ranging from between 78 and 350 mW m−2, at cell voltages in the order of 240–250 mV and electrode areas from 1.7 to 8.0 m2 [49,50]. As can be seen, those experimental findings were observed at similar voltage values to the ones reported within this manuscript; however, there is a significant mismatch in the electroactive area of the electrodes, so it is not possible at this point to conduct a fair comparison.
Regarding the ANOVA and Pareto diagram (Figure 5A) for the concentrations of glucose and methylene blue on the remotion of glucose in the microbial fuel cell, it was observed that both factors were significant with a very significant second-order glucose term (p < 0.05). The quadratic effect on the methylene blue as well as the mixed interaction terms were nonsignificant. The overall model, given by Equation (7), has a regression coefficient (r2) of 0.972 with an adjusted r2 of 0.926. From this equation, it follows that the linear terms in glucose and methylene blue have a negative effect on glucose degradation; however, the glucose quadratic term is positive. The surface response model, plotted on Figure 5B, indicates an optimal value for the remotion of glucose close to 100% after 24 h at 0.0 mM of methylene blue and 1.0 g L−1 of glucose. These values confirm that in the absence of bacterial inhibitors such as methylene blue at low concentrations of glucose, where low numbers of organic acid species are accumulated, the consumption of organic matter is maximized. However, considering the interest in the production of electric current in the MFC, the optimal values for current generation should be reconciled with the optimal values for the degradation of organic matter.
%R = 124.567 − 20.587 × G − 67.2915 × M + 1.5174 × G2 − 0.9007*G × M + 21.2181 × M2
The production of electric current from a microbial fuel cell is due to the deviation of the electrons that are produced by the oxidation of organic matter towards the electrode to the detriment of the production of metabolites which are the natural reservoirs of the produced electrons. To evaluate this effect, a set of three experiments were conducted at a constant initial concentration of glucose (5.0 g L−1), and the production of metabolites were evaluated after a 24 h treatment: (i) an anodic fermentation under open-circuit conditions, (ii) an anodic fermentation without methylene blue under closed-circuit conditions, and (iii) an anodic fermentation with 0.3 mM of methylene blue under closed-circuit conditions. As can be seen from Figure 6, for each treatment, the metabolites lactate, acetate, and ethanol were measured. When conducting fermentations within the anodic compartment, the anode receives a fraction of the electrons generated during substrate oxidation. Because of this, a reduction in the levels of intracellular NADH takes place, which, in turn, adversely affects the production of reduced species such as intermediary metabolites [51]. In line with these ideas, Figure 6 reveals significant differences in the production of metabolites when compared against the anodic fermentation treatment that uses methylene blue. It is worth mentioning that no significant differences were found for the treatments lacking methylene blue (conventional fermentation in open-circuit conditions vs. anodic fermentation), where average concentration values of 2.5 g L−1 of lactate, 1.5 g L−1 of acetate, and 2.0 g L−1 of ethanol were found. These results indicate that E. coli would have a limited capacity for the transference of electrons to the anode. The treatment with methylene blue was characterized by a net decrement in the production of metabolites, i.e., a 35% reduction in lactate, 98.4% reduction in acetate and 75.5% reduction in ethanol. This could be explained in terms of the capacity of methylene blue to facilitate the diversion to the electrode of a portion of the electrons that resulted from the oxidation of glucose. It was reported that during the production of electricity by means of anodic fermentation with E. coli, the concentration of lactate was reduced from 3.3 mM to 2.2 mM and the concentration of acetate was reduced from 4.4 mM to 2.2 mM when using neutral red as the redox mediator [42].
Likewise, the production of ethanol by means of anodic fermentation with Saccharomyces cerevisiae was reduced from 1.7% to 0.3% when methylene blue was added [52].
Based on the production of lactate ( C 3 H 6 O 3 ), acetate ( C 2 H 4 O 2 ), and ethanol ( C 2 H 6 O ) as presented in Figure 6, the total number of electrons incorporated into these metabolic products during open-circuit fermentation (OCV) was 367.6 mmol; while in anodic electrofermentation (0.3 mM of MB), 105.0 mmol of electrons were incorporated. The difference between these two values (262.5 mmol) corresponds to the reduction in metabolite production (anodic electrofermentation vs. open-circuit fermentation). On the other hand, the transference of electrons through the external circuit during anodic electrofermentation, calculated from Figure 2A (glucose at 5.0 g L−1 and MB at 0.3 mM) by means of Equation (1), would amount to 0.26 mmol (25.57 coulombs), which means an electrofermentation efficiency of 0.1%. It can be observed that the electron flow through the external circuit alone cannot account for the reduction in lactate, acetate, and ethanol during the anodic electrofermentation. Similar results have been found for cathodic electrofermentation processes, where cells consume electrons and increase the production of metabolites, as seen for the acetone–butanol production by Clostridium. In this scenario, the flow of electrons through the external circuit, measured by chronoamperometry, is much lower than the increase in electrons incorporated into acetone and butanol, resulting in electrofermentation efficiencies ranging from between 0.2% and 1.0% [53,54,55,56]. This electron imbalance could be attributed to the diffusion of oxygen from the cathodic chamber, which has been reported as one of the primary causes of low efficiency in microbial fuel cells [57]. Furthermore, the most significant factor considered was the poor glucose degradation rate, which, under the experimental conditions considered here, was in the order of 40.6% (Table 1), whereas under open-circuit fermentation conditions, glucose degradation reached 76%. The limited glucose degradation hindered the release of electrons that could otherwise be diverted to the anode, thus increasing the electrofermentation efficiency. Additionally, since acetate is not involved in the regeneration of NADH during the E. coli metabolism, the low glucose degradation led to a reduced acetate production, which is the metabolic compound that drives ATP production through substrate-level phosphorylation. This diminished ATP production, which in turn resulted in a low biomass yield. Reductions in biomass yield up to 56% have been observed with E. coli cultures under closed-circuit conditions compared to their open-circuit counterparts [42]. This study demonstrated the ability of the E. coli DH5α strain to generate electricity in a microbial fuel cell using exogenous redox mediators, despite its limited ability to transfer electrons to the anode itself. The experimental evidence gathered here opens the doors to explore new applications of E. coli through genetic engineering. For instance, enhancing its electrogenic capacity through the production of endogenous redox mediators [58], direct electron transfer [59], or its ability to form a dense biofilm on the anode surface [20] are strategies that have recently begun to be evaluated. These strategies could further improve the performance of the MFC to achieve large-scale utilization of these devices.

4. Conclusions

Microbial fuel cells are devices capable of degrading organic matter while simultaneously generating electricity. The most relevant results of this study demonstrate that the highest substrate degradation percentage is achieved at lower concentrations (1.0 g L−1), while substrate degradation decreases at higher concentrations. On the other hand, to attain a higher current production, high substrate concentrations are required as the source of electrons (10.0 g L−1), thus necessitating a trade-off relationship for the initial substrate concentration between electricity production and organic matter degradation. It was observed that E. coli produces only a very marginal amount of current in the absence of methylene blue (MB) or any redox mediator, indicating its limited capacity for electron transfer to the anode, either directly or through the production of endogenous mediators. The use of MB significantly increases current production, reaching a maximum current of 1.434 mA m−2 at 0.3 mM of MB. Nevertheless, at a concentration of 3.0 mM of MB, there is an observed inhibition in current density, resulting in a 47.2% reduction in electricity production. Based on these findings, the experimental conditions considered here, which included 5.0 g L−1 of glucose and 0.3 mM of MB, are deemed suitable for the cultivation of microbial fuel cells. Finally, the experimental evidence gathered here would support that anodic electrofermentations carried out in MFC (microbial fuel cell) devices induce the redirection of electrons generated during substrate oxidation towards the anode, thereby reducing the synthesis of fermentation products (lactate and ethanol) traditionally used as intracellular electron acceptors, which are subsequently excreted into the culture medium.

Author Contributions

Conceptualization, C.M.-V. and J.C.Q.-D.; methodology, C.M.-V. and J.C.Q.-D.; software, J.C.Q.-D. and J.O.G.P.; validation, C.M.-V., J.C.Q.-D. and J.O.G.P.; formal analysis, C.M.-V.; investigation, C.M.-V.; resources, J.C.Q.-D.; data curation, C.M.-V., J.C.Q.-D. and J.O.G.P.; writing—original draft preparation, C.M.-V., J.C.Q.-D. and J.O.G.P.; writing—review and editing, C.M.-V., J.C.Q.-D. and J.O.G.P.; visualization, J.C.Q.-D. and J.O.G.P.; supervision, J.C.Q.-D.; project administration, J.C.Q.-D.; funding acquisition, J.C.Q.-D. All authors have read and agreed to the published version of the manuscript.

Funding

This research was funded by the Ministerio de Ciencia, Tecnología e Innovación of Colombia, grant number 80740-177.2019, and was also supported by the Comité para el Desarrollo de la Ciencia y la Tecnología, CODI de la Universidad de Antioquia (Colombia), grant number PROG 2015-7343.

Data Availability Statement

Not applicable.

Conflicts of Interest

The authors declare no conflict of interest.

References

  1. Yolcan, O.O. World Energy Outlook and State of Renewable Energy: 10-Year Evaluation. Innov. Green Dev. 2023, 2, 100070. [Google Scholar] [CrossRef]
  2. Han, J.-H.; Bae, J.; Lim, J.; Jwa, E.; Nam, J.-Y.; Hwang, K.S.; Jeong, N.; Choi, J.; Kim, H.; Jeung, Y.-C. Acidification-Based Direct Electrolysis of Treated Wastewater for Hydrogen Production and Water Reuse. Heliyon 2023, 9, e20629. [Google Scholar] [CrossRef] [PubMed]
  3. Paraschiv, S.; Paraschiv, L.S.; Serban, A. An Overview of Energy Intensity of Drinking Water Production and Wastewater Treatment. Energy Rep. 2023, 9, 118–123. [Google Scholar] [CrossRef]
  4. Rocha-Meneses, L.; Luna-delRisco, M.; González, C.A.; Moncada, S.V.; Moreno, A.; Sierra-Del Rio, J.; Castillo-Meza, L.E. An Overview of the Socio-Economic, Technological, and Environmental Opportunities and Challenges for Renewable Energy Generation from Residual Biomass: A Case Study of Biogas Production in Colombia. Energies 2023, 16, 5901. [Google Scholar] [CrossRef]
  5. Tow, E.W.; Letcher, A.; Jaworowski, A.; Zucker, I.; Kum, S.; Azadiaghdam, M.; Blatchley, E.R.; Achilli, A.; Gu, H.; Melike, G.; et al. Modeling the Energy Consumption of Potable Water Reuse Schemes. Water Res. X 2021, 13, 100126. [Google Scholar] [CrossRef]
  6. Malik, S.; Kishore, S.; Dhasmana, A.; Kumari, P.; Mitra, T.; Chaudhary, V.; Kumari, R.; Bora, J.; Ranjan, A.; Minkina, T.; et al. A Perspective Review on Microbial Fuel Cells in Treatment and Product Recovery from Wastewater. Water 2023, 15, 316. [Google Scholar] [CrossRef]
  7. Li, X.; Abu-reesh, I.M.; He, Z. Development of Bioelectrochemical Systems to Promote Sustainable Agriculture. Agriculture 2015, 5, 367–388. [Google Scholar] [CrossRef]
  8. Ghangrekar, M.M.; Chatterjee, P. A Systematic Review on Bioelectrochemical Systems Research. Curr. Pollut. Rep. 2017, 3, 281–288. [Google Scholar] [CrossRef]
  9. Santoro, C.; Arbizzani, C.; Erable, B.; Ieropoulos, I. Microbial Fuel Cells: From Fundamentals to Applications. A Review. J. Power Sources 2017, 356, 225–244. [Google Scholar] [CrossRef]
  10. Goenka, R.; Mukherji, S.; Ghosh, P.C. Bioresource Technology Reports Characterization of Electrochemical Behaviour of Escherichia coli MTCC 1610 in a Microbial Fuel Cell. Bioresour. Technol. Rep. 2018, 3, 67–74. [Google Scholar] [CrossRef]
  11. Sturm-Richter, K.; Golitsch, F.; Sturm, G.; Kipf, E.; Dittrich, A.; Beblawy, S.; Kerzenmacher, S.; Gescher, J. Unbalanced Fermentation of Glycerol in Escherichia coli via Heterologous Production of an Electron Transport Chain and Electrode Interaction in Microbial Electrochemical Cells. Bioresour. Technol. 2015, 186, 89–96. [Google Scholar] [CrossRef] [PubMed]
  12. Feng, J.; Lu, Q.; Li, K.; Xu, S.; Wang, X.; Chen, K.; Ouyang, P. Construction of an Electron Transfer Mediator Pathway for Bioelectrosynthesis by Escherichia coli. Front. Bioeng. Biotechnol. 2020, 8, 590667. [Google Scholar] [CrossRef] [PubMed]
  13. Kracke, F.; Vassilev, I.; Krömer, J.O. Microbial Electron Transport and Energy Conservation—The Foundation for Optimizing Bioelectrochemical Systems. Front. Microbiol. 2015, 6, 575. [Google Scholar] [CrossRef] [PubMed]
  14. Price, C.E.; Driessen, A.J.M. Biogenesis of Membrane Bound Respiratory Complexes in Escherichia coli. Biochim. Biophys. Acta BBA Mol. Cell Res. 2010, 1803, 748–766. [Google Scholar] [CrossRef]
  15. Sugnaux, M.; Mermoud, S.; Ferreira, A.; Happe, M.; Fischer, F. Bioresource Technology Probing Electron Transfer with Escherichia coli: A Method to Examine Exoelectronics in Microbial Fuel Cell Type Systems. Bioresour. Technol. 2013, 148, 567–573. [Google Scholar] [CrossRef]
  16. Hoang, U.; Nguyen, P.; Grekov, D.; Geiselmann, J.; Stambouli, V.; Weidenhaupt, M.; Delabouglise, D. Electrochimica Acta Anodic Deposit from Respiration Metabolic Pathway of Escherichia coli. Electrochimica Acta 2014, 130, 200–205. [Google Scholar] [CrossRef]
  17. Zhang, T.; Cui, C.; Chen, S.; Yang, H.; Shen, P. The Direct Electrocatalysis of Escherichia coli through Electroactivated Excretion in Microbial Fuel Cell. Electrochem. Commun. 2008, 10, 293–297. [Google Scholar] [CrossRef]
  18. Kostylev, M.; Otwell, A.E.; Richardson, R.E.; Suzuki, Y. Cloning Should Be Simple: Escherichia coli DH5α-Mediated Assembly of Multiple DNA Fragments with Short End Homologies. PLoS ONE 2015, 10, e0137466. [Google Scholar] [CrossRef]
  19. Jahnke, J.P.; Sarkes, D.A.; Liba, J.L.; Sumner, J.J.; Stratis-Cullum, D.N. Improved Microbial Fuel Cell Performance by Engineering E. coli for Enhanced Affinity to Gold. Energies 2021, 14, 5389. [Google Scholar] [CrossRef]
  20. Nguyen, D.-T.; Tamura, T.; Tobe, R.; Mihara, H.; Taguchi, K. Microbial Fuel Cell Performance Improvement Based on FliC-Deficient E. coli Strain. Energy Rep. 2020, 6, 763–767. [Google Scholar] [CrossRef]
  21. Li, T.; Yang, X.; Chen, Q.; Song, H.; He, Z.; Yang, Y. Enhanced Performance of Microbial Fuel Cells with Electron Mediators from Anthraquinone/Polyphenol-Abundant Herbal Plants. ACS Sustain. Chem. Eng. 2020, 8, 11263–11275. [Google Scholar] [CrossRef]
  22. Nawaz, A.; Hafeez, A.; Abbas, S.Z.; Haq, I.; Rafatullah, M. A State of the Art Review on Electron Transfer Mechanisms, Characteristics, Applications and Recent Advancements in Microbial Fuel Cells Technology. Green Chem. Lett. Rev. 2020, 13, 365–381. [Google Scholar] [CrossRef]
  23. Ng, I.S.; Hsueh, C.C.; Chen, B.Y. Electron Transport Phenomena of Electroactive Bacteria in Microbial Fuel Cells: A Review of Proteus Hauseri. Bioresour. Bioprocess. 2017, 4, 53. [Google Scholar] [CrossRef]
  24. Gemünde, A.; Lai, B.; Pause, L.; Krömer, J.; Holtmann, D. Redox Mediators in Microbial Electrochemical Systems. ChemElectroChem 2022, 9, e202200216. [Google Scholar] [CrossRef]
  25. Martinez, C.M.; Alvarez, L.H. Application of Redox Mediators in Bioelectrochemical Systems. Biotechnol. Adv. 2018, 36, 1412–1423. [Google Scholar] [CrossRef]
  26. Rahimnejad, M.; Najafpour, G.D.; Ghoreyshi, A.A.; Shakeri, M.; Zare, H. Methylene Blue as Electron Promoters in Microbial Fuel Cell. Int. J. Hydrogen Energy 2011, 36, 13335–13341. [Google Scholar] [CrossRef]
  27. Reiche, A.; Kirkwood, K.M. Bioresource Technology Comparison of Escherichia coli and Anaerobic Consortia Derived from Compost as Anodic Biocatalysts in a Glycerol-Oxidizing Microbial Fuel Cell. Bioresour. Technol. 2012, 123, 318–323. [Google Scholar] [CrossRef]
  28. Sharma, T.; Mohana, A.L.; Chandra, T.S.; Ramaprabhu, S. Development of Carbon Nanotubes and Nanofluids Based Microbial Fuel Cell. Int. J. Hydrogen Energy 2008, 33, 6749–6754. [Google Scholar] [CrossRef]
  29. Ojima, Y.; Kawaguchi, T.; Fukui, S.; Kikuchi, R.; Terao, K.; Koma, D. Promoted Performance of Microbial Fuel Cells Using Escherichia coli Cells with Multiple—Knockout of Central Metabolism Genes. Bioprocess Biosyst. Eng. 2019, 43, 323–332. [Google Scholar] [CrossRef]
  30. Popov, A.L.; Kim, J.R.; Dinsdale, R.M.; Esteves, S.R.; Guwy, A.J.; Premier, G.C. The Effect of Physico-Chemically Immobilized Methylene Blue and Neutral Red on the Anode of Microbial Fuel Cell. Biotechnol. Bioprocess Eng. 2012, 370, 361–370. [Google Scholar] [CrossRef]
  31. Aiyer, K.S. Synergistic Effects in a Microbial Fuel Cell between Co-Cultures and a Photosynthetic Alga Chlorella Vulgaris Improve Performance. Heliyon 2021, 7, e05935. [Google Scholar] [CrossRef] [PubMed]
  32. Lee, J.; Xu, H.; Xiao, Y.; Calhoun, M.C.; Crisostomo, D.; Cliffel, D.E. The Utilization of Eschericia Coli and Shewanella Oneidensis for Microbial Fuel Cell. In IOP Conference Series: Materials Science and Engineering, Proceedings of the 3rd International Conference on Chemical Engineering Sciences and Applications 2017 (3rd ICChESA 2017), Banda Aceh, Indonesia, 20–21 September 2017; IOP Publishing Ltd.: Bristol, UK, 2018; Volume 334, pp. 1–6. [Google Scholar] [CrossRef]
  33. del Campo, A.G.; Canizares, P.; Lobato, J.; Rodrigo, M.; Fernandez Morales, F.J. Effects of External Resistance on Microbial Fuel Cell’s Performance. In Environment, Energy and Climate Change II. The Handbook of Environmental Chemistry; Lefebvre, G., Jiménez, E., Cabañas, B., Eds.; Springer: Cham, Switzerland, 2014; pp. 41–53. ISBN 1433-6863r978-3-642-03970-6. [Google Scholar]
  34. Moscoviz, R.; Toledo-Alarcón, J.; Trably, E.; Bernet, N. Electro-Fermentation: How to Drive Fermentation Using Electrochemical Systems. Trends Biotechnol. 2016, 34, 856–865. [Google Scholar] [CrossRef] [PubMed]
  35. Zaitoun, M.A. A Kinetic-Spectrophotometric Method for the Determination of Glucose in Solutions. J. Anal. Chem. 2006, 61, 1010–1014. [Google Scholar] [CrossRef]
  36. Leon-Fernandez, L.F.; Rodrigo, M.A.; Villaseñor, J.; Fernandez-Morales, F.J. Electrocatalytic Dechlorination of 2,4-Dichlorophenol in Bioelectrochemical Systems. J. Electroanal. Chem. 2020, 876, 114731. [Google Scholar] [CrossRef]
  37. Taskan, E.; Ozkaya, B.; Hasar, H. Effect of Different Mediator Concentrations on Power Generation in MFC Using Ti-TiO2 Electrode. Int. J. Energy Sci. 2014, 4, 9–11. [Google Scholar] [CrossRef]
  38. Chen, Y.-A.; Yang, H.; Ouyang, D.; Liu, T.; Liu, D.; Zhao, X. Construction of Electron Transfer Chains with Methylene Blue and Ferric Ions for Direct Conversion of Lignocellulosic Biomass to Electricity in a Wide pH Range. Appl. Catal. B Environ. 2020, 265, 118578. [Google Scholar] [CrossRef]
  39. Gomes, T.F.; Pedrosa, M.M.; de Toledo, A.C.L.; Arnoni, V.W.; dos Santos Monteiro, M.; Piai, D.C.; Sylvestre, S.H.Z.; Ferreira, B. Bactericide Effect of Methylene Blue Associated with Low-Level Laser Therapy in Escherichia coli Bacteria Isolated from Pressure Ulcers. Lasers Med. Sci. 2018, 33, 1723–1731. [Google Scholar] [CrossRef]
  40. Nicu, A.I.; Pirvu, L.; Vamanu, A.; Stoian, G. The European Beech Leaves Extract Has an Antibacterial Effect by Inducing Oxidative Stress. Romanian Biotechnol. Lett. 2016, 22, 12071–12080. [Google Scholar]
  41. Ash, S.R.; Steczko, J.; Brewer, L.B.; Winger, R.K. Microbial Inactivation Properties of Methylene Blue—Citrate Solution. ASAIO J. 2006, 52, 17A. [Google Scholar] [CrossRef]
  42. Park, D.H.; Zeikus, J.G. Electricity Generation in Microbial Fuel Cells Using Neutral Red as an Electronophore. Appl. Environ. Microbiol. 2000, 66, 1292–1297. [Google Scholar] [CrossRef]
  43. Schmitz, S.; Rosenbaum, M.A. Boosting Mediated Electron Transfer in Bioelectrochemical Systems with Tailored Defined Microbial Cocultures. Biotechnol. Bioeng. 2018, 115, 2183–2193. [Google Scholar] [CrossRef] [PubMed]
  44. Rahmani, A.R.; Navidjouy, N.; Rahimnejad, M.; Alizadeh, S.; Samarghandi, M.R.; Nematollahi, D. Effect of Different Concentrations of Substrate in Microbial Fuel Cells toward Bioenergy Recovery and Simultaneous Wastewater Treatment. Environ. Technol. 2022, 43, 1–9. [Google Scholar] [CrossRef] [PubMed]
  45. Förster, A.H.; Gescher, J. Metabolic Engineering of Escherichia coli for Production of Mixed-Acid Fermentation End Products. Front. Bioeng. Biotechnol. 2014, 2, 1–12. [Google Scholar] [CrossRef]
  46. Pinhal, S.; Ropers, D.; Geiselmann, J.; de Jong, H. Acetate Metabolism and the Inhibition of Bacterial Growth by Acetate. J. Bacteriol. 2019, 201, 1–19. [Google Scholar] [CrossRef]
  47. Wang, C.; Chang, T.; Yang, H.; Cui, M. Antibacterial Mechanism of Lactic Acid on Physiological and Morphological Properties of Salmonella Enteritidis, Escherichia coli and Listeria Monocytogenes. Food Control 2015, 47, 231–236. [Google Scholar] [CrossRef]
  48. Roe, A.J.; O’Byrne, C.; McLaggan, D.; Booth, I.R. Inhibition of Escherichia coli Growth by Acetic Acid: A Problem with Methionine Biosynthesis and Homocysteine Toxicity. Microbiology 2002, 148, 2215–2222. [Google Scholar] [CrossRef]
  49. Xiang, K.; Qiao, Y.; Ching, C.B.; Li, C.M. GldA Overexpressing-Engineered E. coli as Superior Electrocatalyst for Microbial Fuel Cells. Electrochem. Commun. 2009, 11, 1593–1595. [Google Scholar] [CrossRef]
  50. Ren, J.; Li, N.; Du, M.; Zhang, Y.; Hao, C.; Hu, R. Study on the Effect of Synergy Effect between the Mixed Cultures on the Power Generation of Microbial Fuel Cells. Bioengineered 2021, 12, 844–854. [Google Scholar] [CrossRef]
  51. Vassilev, I.; Averesch, N.J.H.; Ledezma, P.K.M. Anodic Electro-Fermentation: Empowering Anaerobic Production Processes via Anodic Respiration. Biotechnol. Adv. 2021, 48, 107728. [Google Scholar]
  52. Rossi, R.; Fedrigucci, A.; Setti, L. Characterization of Electron Mediated Microbial Fuel Cell by Saccharomyces Cerevisiae. Chem. Eng. Trans. 2015, 43, 337–342. [Google Scholar] [CrossRef]
  53. Alberto García Mogollón, C.; Carlos Quintero Díaz, J.; Omar Gil Posada, J. Production of Acetone, Butanol, and Ethanol by Electro-Fermentation with Clostridium Saccharoperbutylacetonicum N1-4. Bioelectrochemistry 2023, 152, 108414. [Google Scholar] [CrossRef]
  54. Engel, M.; Holtmann, D.; Ulber, R.; Tippkötter, N. Increased Biobutanol Production by Mediator-Less Electro-Fermentation. Biotechnol. J. 2019, 14, 1800514. [Google Scholar] [CrossRef] [PubMed]
  55. Choi, O.; Kim, T.; Woo, H.M.; Um, Y. Electricity-Driven Metabolic Shift through Direct Electron Uptake by Electroactive Heterotroph Clostridiumpasteurianum. Sci. Rep. 2014, 4, 6961. [Google Scholar] [CrossRef] [PubMed]
  56. Moscoviz, R.; Trably, E.; Bernet, N. Electro-Fermentation Triggering Population Selection in Mixed-Culture Glycerol Fermentation. Microb. Biotechnol. 2018, 11, 74–83. [Google Scholar] [CrossRef] [PubMed]
  57. Wang, C.; Shen, J.; Chen, Q.; Ma, D.; Zhang, G.; Cui, C.; Xin, Y.; Zhao, Y.; Hu, C. The Inhibiting Effect of Oxygen Diffusion on the Electricity Generation of Three-Chamber Microbial Fuel Cells. J. Power Sources 2020, 453, 227889. [Google Scholar] [CrossRef]
  58. Simoska, O.; Cummings, D.A., Jr.; Gaffney, E.M.; Langue, C.; Primo, T.G.; Weber, C.J.; Witt, C.E.; Minteer, S.D. Enhancing the Performance of Microbial Fuel Cells via Metabolic Engineering of Escherichia coli for Phenazine Production. ACS Sustain. Chem. Eng. 2023, 11, 11855–11866. [Google Scholar] [CrossRef]
  59. Jensen, H.M.; TerAvest, M.A.; Kokish, M.G.; Ajo-Franklin, C.M. CymA and Exogenous Flavins Improve Extracellular Electron Transfer and Couple It to Cell Growth in Mtr-Expressing Escherichia coli. ACS Synth. Biol. 2016, 5, 679–688. [Google Scholar] [CrossRef]
Figure 1. Diagram of electron transfer mediated by methylene blue in a microbial fuel cell.
Energies 16 07901 g001
Figure 2. Electricity production in a dual-chamber microbial fuel cell by using E. coli. (A) MFC voltage profile at 5 g L−1 of glucose and three concentrations of methylene blue. (B) Electric charge produced vs. glucose and methylene blue concentration.
Energies 16 07901 g002
Figure 3. Effect of glucose and methylene blue on electric charge produced in a dual-chamber microbial fuel cell. (A) Pareto diagram of standardized effects. (B) Surface response of electrical charge as a function of the initial concentrations of glucose (G) and of methylene blue (M).
Energies 16 07901 g003
Figure 4. Polarization and power curves for MFC with E. coli using 0.3 mM of methylene blue and 5.0 g L−1 of glucose.
Energies 16 07901 g004
Figure 5. Effect of glucose and methylene blue on organic matter remotion in a dual-chamber microbial fuel cell. (A) Pareto diagram of standardized effects. (B) Surface response of organic matter remotion (%R) as a function of the initial concentrations of glucose (G) and of methylene blue (M).
Energies 16 07901 g005
Figure 6. Fermentation products by E. coli with 5.0 g L−1 of glucose. Conventional fermentation under open-circuit conditions (gold bar). Anodic fermentation without methylene blue (orange bar). Anodic fermentation with 0.3 mM of methylene blue (purple bar).
Energies 16 07901 g006
Table 1. Current density (I), electric charge produced (Qe), and remotion efficiency of glucose (%R) for different glucose (G) and methylene blue (M) concentrations.
G (g L−1)M (mM)I (mA m−2)Qe (C)%R
1.00.00.048 ± 0.030.3698.2 ± 1.4
1.00.30.974 ± 0.0419.3793.3 ± 1.0
1.03.00.432 ± 0.027.2292.8 ± 2.7
5.00.00.081 ± 0.021.2861.8 ± 7.1
5.00.31.434 ± 0.1825.5740.6 ± 2.8
5.03.00.832 ± 0.02 13.4932.1 ± 6.8
10.00.00.058 ± 0.023.6875.4 ± 6.6
10.00.32.037 ± 0.1334.4444.2 ± 2.8
10.03.01.201 ± 0.0821.9634.2 ± 3.1
Disclaimer/Publisher’s Note: The statements, opinions and data contained in all publications are solely those of the individual author(s) and contributor(s) and not of MDPI and/or the editor(s). MDPI and/or the editor(s) disclaim responsibility for any injury to people or property resulting from any ideas, methods, instructions or products referred to in the content.

