Article

Test and Analysis of the Heat Exchanger for Small Ocean Thermal Energy Power Generation Devices

1
National Ocean Technology Center, Tianjin 300112, China
2
Key Laboratory of Ocean Observation Technology, MNR, Tianjin 300112, China
*
Author to whom correspondence should be addressed.
Energies 2023, 16(22), 7559; https://doi.org/10.3390/en16227559
Submission received: 8 October 2023 / Revised: 5 November 2023 / Accepted: 9 November 2023 / Published: 13 November 2023
(This article belongs to the Topic Marine Renewable Energy, 2nd Volume)

Abstract

:
The application of ocean thermal energy conversion is an effective method to extend underwater vehicles’ running times and operating ranges, and the solid–liquid phase transition of the phase change material (PCM) in the heat exchanger is a key process for underwater vehicles to collect ocean thermal energy. This study proposes a heat exchanger structure for a small-size thermal energy power generation device and establishes the heat transfer model for the heat exchanger. Simulations were conducted considering convective heat transfer, and the obtained results demonstrated the feasibility of the designed structure. A prototype of the heat exchanger was developed, and physical experiments were conducted to validate the performance of the prototype. The results show that the melting process of the heat exchanger can be completed within 6 to 12 h, the solidification process can be completed within 3 to 7 h, and the heat transfer time decreases with the increase in temperature difference, verifying the compatibility with the underwater vehicles’ working patterns. Moreover, the heat exchanger could theoretically extend their lifetime. The results can provide a reference for the structural design and optimization of the heat exchanger for small ocean thermal energy power generation devices in the future.

1. Introduction

The ocean covers 71% of the earth’s surface and contains rich natural resources, many of which remain unexplored to date; consequently, it is significant for the sustainable development of humanity to observe, explore and develop ocean resources [1,2]. Underwater vehicles are considered and chosen as important tools for the exploration of the ocean [3]. Currently, most underwater vehicles are typically powered by batteries with a restricted capacity, which limits their operating times and results in potential pollution contamination [4,5]. Utilizing the ocean’s renewable marine energy is a practical solution for providing a long-term energy supply for underwater vehicles. There are several main ways to obtain energy from the ocean for underwater vehicles, including wind energy [6], solar energy [7], wave energy [8] and ocean thermal energy [9]. When energy is supplied by wind, the underwater vehicles need a long time at the surface of the ocean to collect wind energy because the wind only occurs at the surface. Further, solar vehicles are typically charged during the daytime, and the waiting time for long the vehicles stay at the surface is longer than it is for wind energy. Since wave energy weakens quickly with depth, its applications in the upper ocean are more appropriate. Based on the information above, we can know that these three renewable energies are mainly applied to the surface or upper layers of the ocean and are not suitable for deep-sea exploration. The surface seawater collects heat from the sunlight, yet only a small portion of that energy can be transferred to the ocean below 10 m. Therefore, the surface has a high temperature, and, as the depth increases, the temperature gradually decreases due to the weakness of solar radiation, thereby forming a vertical ocean temperature gradient. Ocean thermal energy is renewable energy stored in the form of a temperature gradient between the warm surface water and the cold deep water of the ocean [10]. Additionally, ocean thermal energy is reliably and predictably available at all hours [11] and has an enormous storage capacity, especially in tropical oceans. If underwater vehicles could harvest ocean thermal energy while traveling through the ocean, it would provide significant opportunities for the vehicles to improve their operating ranges and extend their limited lifetimes [12].
Ocean thermal energy is primarily utilized in three methods: (1) thermal energy collection, which utilizes thermoelectric generators (TEGs) [13]; (2) thermal energy collection, which utilizes shape memory alloys (SMAs) [14]; and (3) thermal energy collection, which utilizes the volume change of the phase change material (PCM) [11]. The applications of ocean thermal energy harvesting approaches based on SMAs and TEGs on underwater vehicles are currently only at the conceptual design stage, and there is no engineering implementation yet [15]. Furthermore, many researchers are applying PCM-based technology to harvest ocean thermal energy, which is based on solid–liquid phase transformation. In 2009, the Jet Propulsion Laboratory designed a profiling float named SOLO-TREC, equipped with 10 thermal engines to collect thermal energy [9]. The Webb Research Corporation developed the thermal glider: Slocum-TREC [16]. In 2016, the National Ocean Technology Center designed a PCM-based electric underwater thermal vehicle and tested it in the North Yellow Sea cold water mass [17]. In 2018, Tianjin University developed a prototype of an ocean thermal–electric conversion system, OTEC-PCM, and successfully conducted a sea trial, which implied a possibility to improve the range and navigation time of underwater vehicles [18]. A successful field trial was completed with the Sea-Bird Scientific Navis autonomous profiling float mated to the Seatrec SL1 by Seatrec Inc. The SL1 harvests energy from temperature differentials in the ocean and converts it to stored electrical energy [19].
The ocean’s thermal energy is typically collected by the volumetric expansion of the PCM in the heat exchangers during their transition from a solid to liquid phase. Currently, the PCM comprises alkanes [15], such as pentadecane and hexadecane, which have various advantages, including a large solid/liquid volume expansion coefficient and excellent chemical stability. However, its thermal conductivity is low, and high latent heat is high. These disadvantages lead to a long solidification/melting time. Therefore, reducing the solidification/melting time of the PCM is important to enhance the behavior of the heat exchangers. At present, there are two main methods used to solve the problem of long heat transfer time for heat exchangers. The first method is to add materials with high thermal conductivity, such as foam metal, graphite, etc. Huntsberger et al. used 7.5% compressed foam aluminum, which can effectively speed up the melting and solidification of phase change materials [20]; Peng et al. proved that the use of aluminum foam with a porosity of 0.98 can shorten the time required for a cycle through numerical simulation [21]; Wang reduced the melting time by 11.97% by adding 1.2% graphene to the phase change material [22]. The second method increases the heat transfer area and adds high thermal conductivity structures, such as fins, porous media, etc., into the phase change material. Li found fractal fins can reduce the solidification time of the PCM by 34.46% compared with radial fins [2]; Wang demonstrated that the heat transfer efficiency can be improved by 9.33% by using double ring heat conduction fins [23].
In this paper, we designed a heat exchanger structure and conducted numerical simulations and experimental verifications to analyze the influence of the structure on phase change velocity under different environmental temperature conditions, providing a reference for enhancing the solid–liquid phase change heat transfer performance of ocean thermal energy generation devices.
This paper is organized as follows. The principle of the thermal power generation is presented in Section 2. In Section 3, the proposed structure of the proposed heat exchanger is described in detail, and the phase change transfer model of the heat exchanger is built. In Section 4, based on the structure, we report the simulation of the heat transfer process and analyze the results. Section 5 presents the experiments. Finally, Section 6 contains a discussion and conclusions.

2. Working Principle

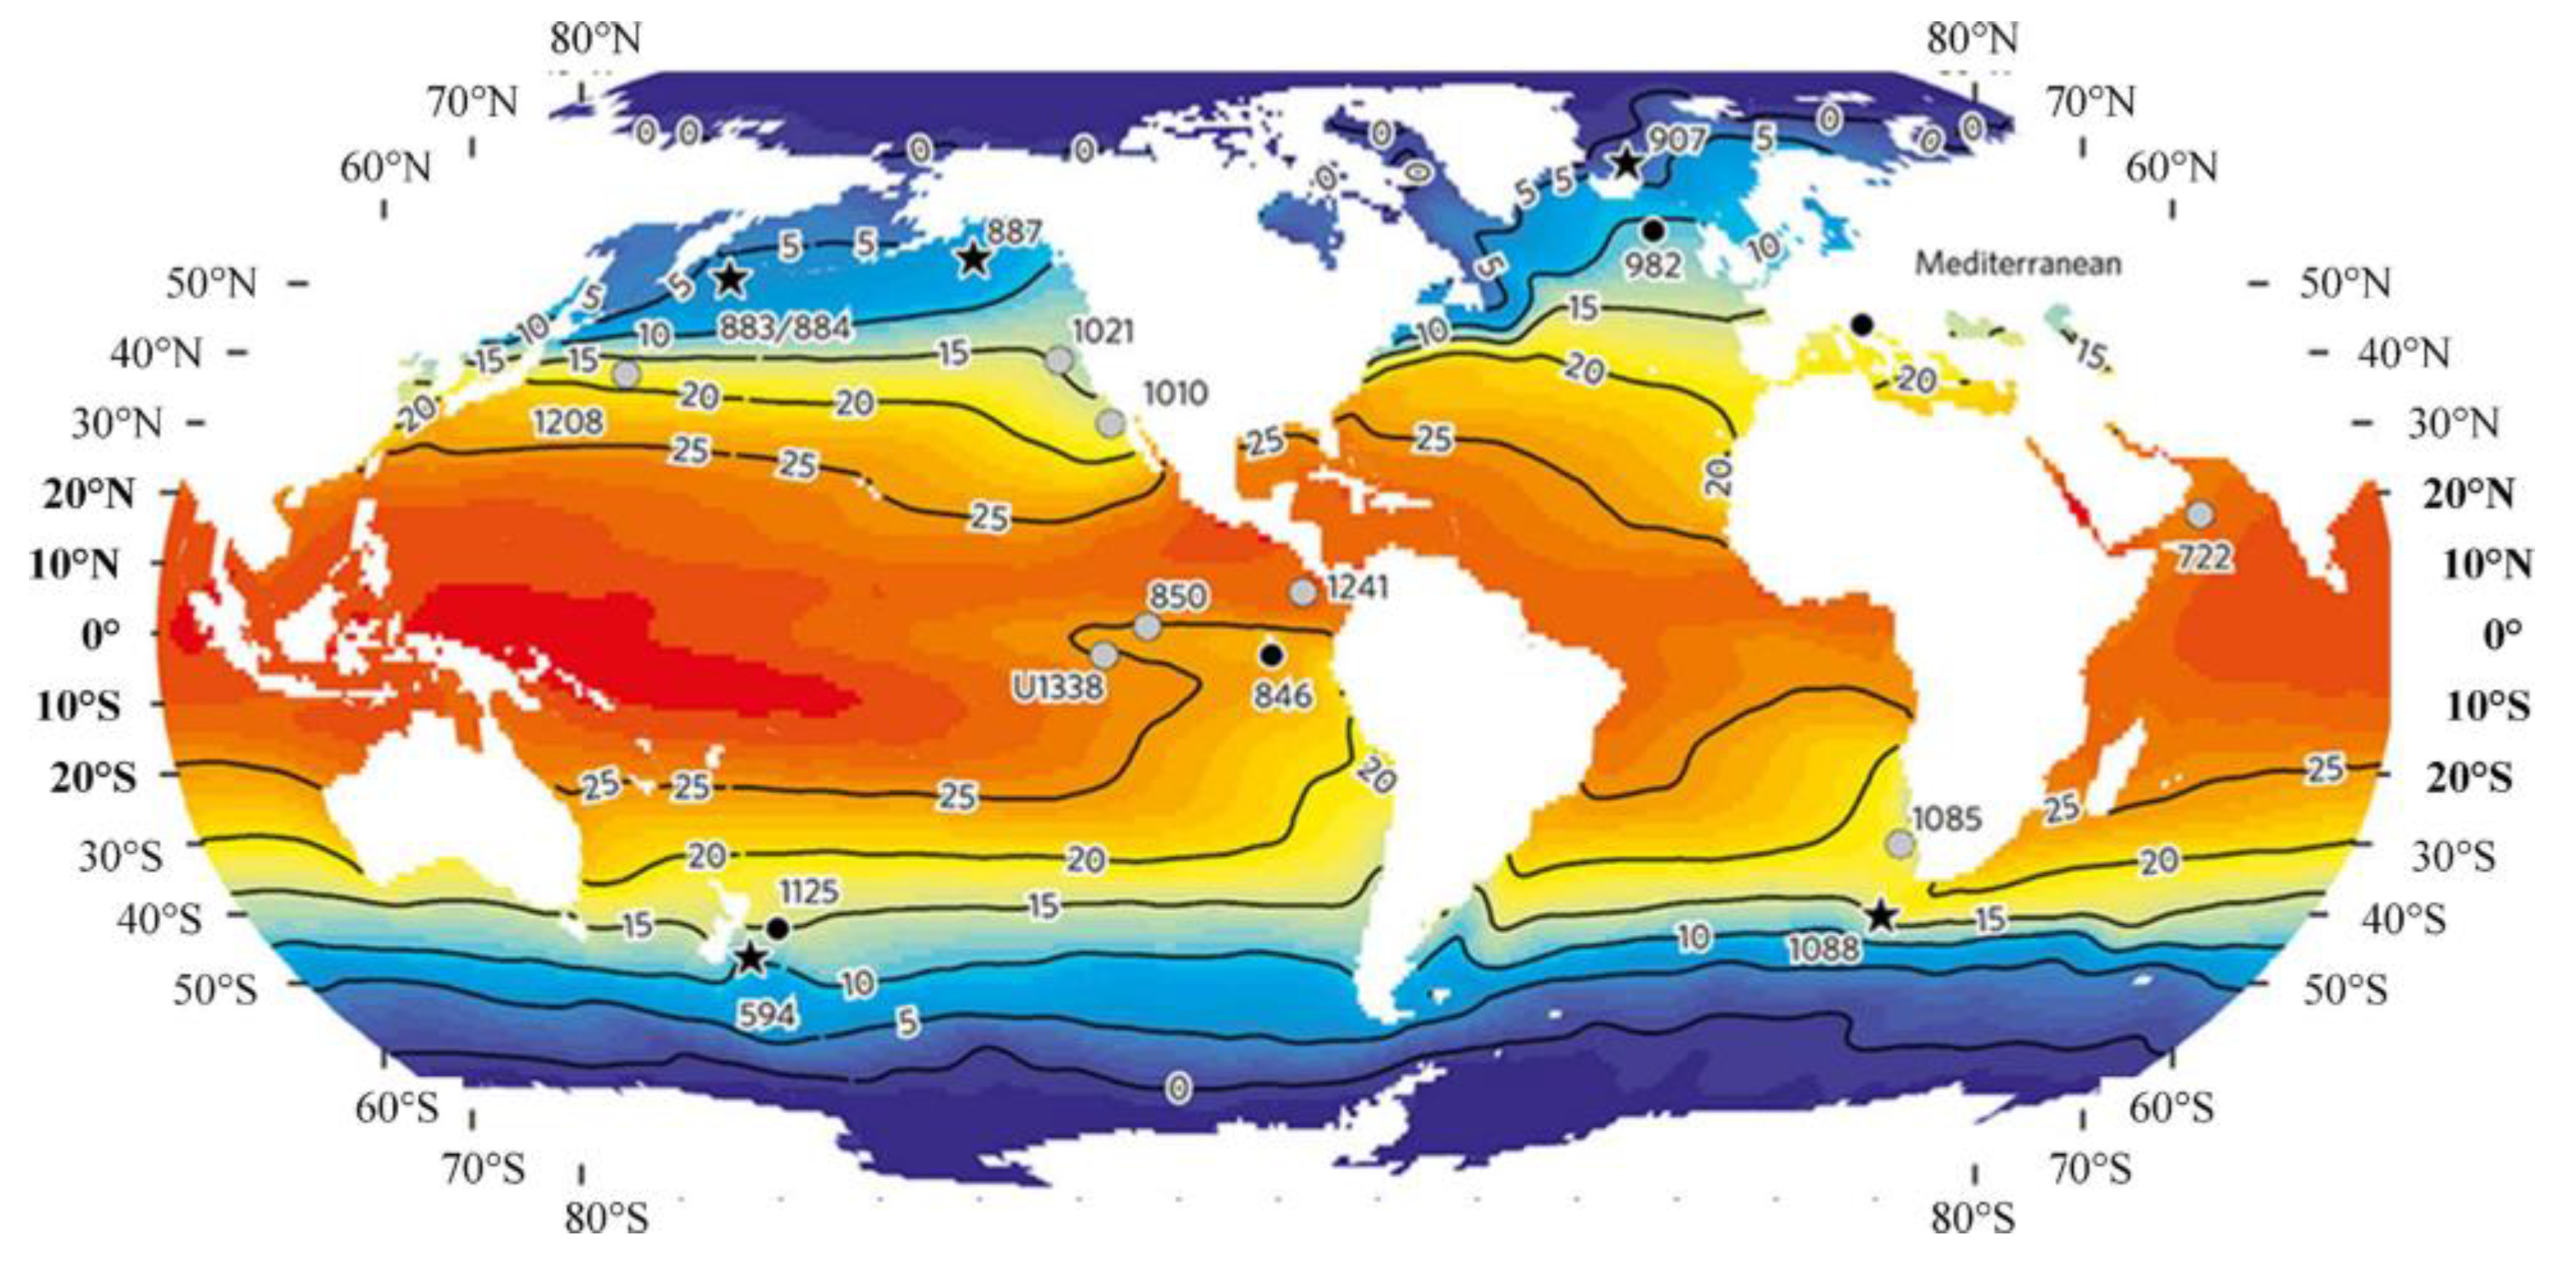
2.1. Temperature Distribution of the Ocean

The temperature distribution of the ocean surface is shown in Figure 1. It is apparent from the figure that sea surface temperatures in the tropical regions at latitudes of 20° in the north and south directions can be above 25 °C. In fact, the temperature distribution of surface seawater is strongly affected by seasons: the surface seawater temperature of typical tropical oceans can be as low as 24 °C in winter, but can exceed more than 30 °C in summer. As the depth increases, the temperature gradually decreases. The deep seawater temperature at 500–750 m is generally around 5 °C [24], which is relatively constant and more stable; below 1000 m, the temperature is basically under 4 °C.

2.2. Working Principle

Thermal power generation is utilized as an energy supplement module for underwater vehicles, which uses the PCM for collecting thermal energy from the ocean environment. The melting point of the PCM must be less than the high temperature at the sea surface and higher than the low temperature in the deep sea, otherwise it is difficult for the PCM to produce large volume changes when underwater vehicles move up and down. As the vehicles travel up and down in the ocean following a certain trajectory, the temperature in the sea water will be sensed by the heat exchanger, causing the volume change in the PCM. When the temperature is higher than melting point, the PCM will melt and produce volume expansion, and when the temperature is lower than the melting point, the PCM will solidify and shrink the volume. The working principle of the thermal power generation is shown in Figure 2.
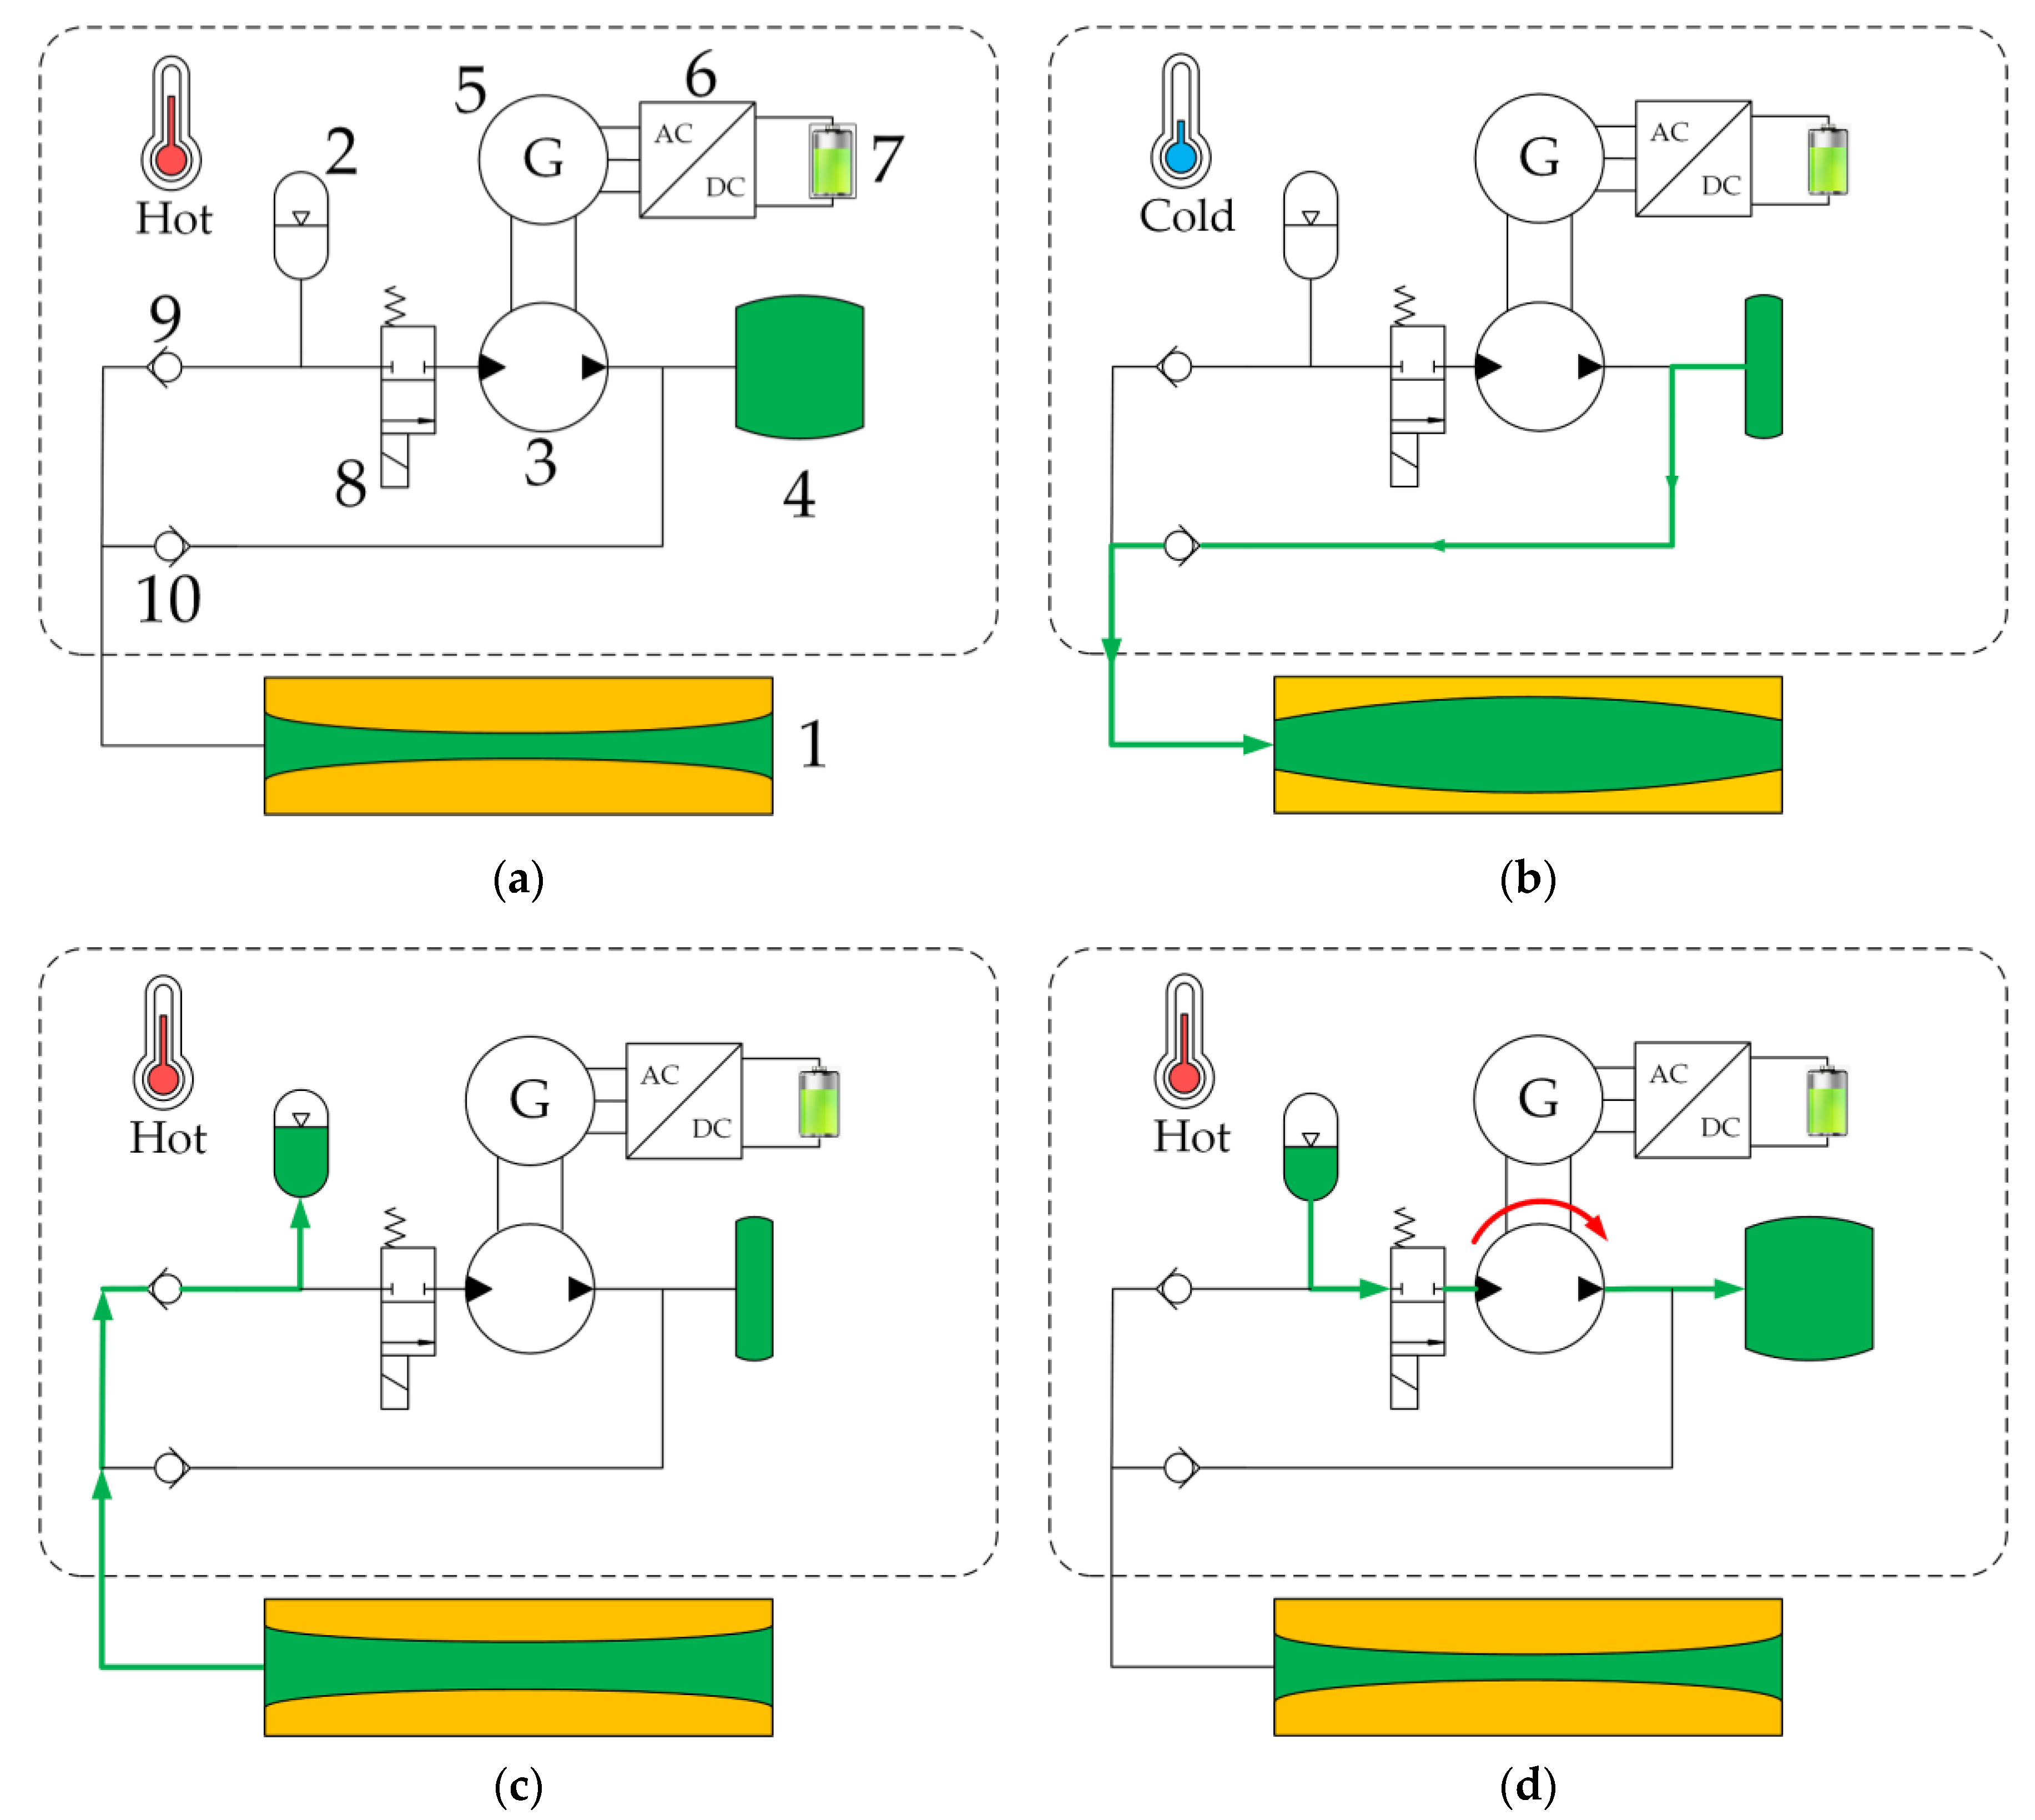
  • The initial state of thermal power generation is shown in Figure 2a. The underwater vehicles stay at the surface of the ocean, and the temperature around the vehicles is higher than the melting point of the PCM in the heat exchanger; thus, the PCM is in a liquid state. The bladder is filled with hydraulic oil and all valves are closed.
  • After staying on the surface for a while, the vehicles start to dive into the deep sea. With the diving depth increasing, the water temperature around the vehicles gradually decreases. When the temperature is lower than the freezing point of the PCM, the PCM will solidify and shrink, resulting in there being negative pressure in the heat exchanger. Due to the negative pressure, check valve 2 opens, and the hydraulic oil in the bladder flows into the heat exchanger, as shown in Figure 2b.
  • As the underwater vehicles rise from the deep sea to the surface, the seawater temperature increases. When the temperature exceeds the melting point, the PCM melts and expands in volume. Then, check valve 2 closes and check valve 1 opens, and the expanded PCM squeezes the hydraulic oil from the heat exchanger into the accumulator, as shown in Figure 2c.
  • Due to the inflow of hydraulic oil, the pressure of the accumulator gradually rises. With the hydraulic oil continuously flowing into the accumulator, the pressure inside the accumulator gradually rises. When the pressure reaches the set value, the solenoid valve will open and the hydraulic oil in the accumulator will flow through the hydraulic motor to the bladder. Driven by hydraulic oil, the hydraulic motor rotates and drives the generator to generate electricity, and the electricity is rectified and stored in the battery, as shown in Figure 2d.

3. Phase Change Transfer Model of the Heat Exchanger

3.1. The Structure of the Heat Exchanger

The structure of the heat exchanger proposed in this study, depicted in Figure 3, consists mainly of a metal shell and two rubber tubes. Both rubber tubes are filled with phase change material, and the rest of the space in the heat exchanger is filled with transmission fluid. Two ring protectors are placed between the two rubber tubes to prevent the two tubes from making contact with each other due to the expansion of the melting phase change material, which could block the flow of the transmission fluid. Unlike the scheme using fins or foam metal, we try to avoid using metal; hence, the weight of our structure is lighter.
Researchers have carried out a lot of research work on phase change material for ocean thermal energy, and have put forward various technical solutions [26,27,28,29], such as n-hexadecane, No.16 hydrogel and multi-composite materials. Due to the advantages of suitable phase change temperatures and higher phase change volume expansion rates, n-hexadecane is selected as the phase change material for the proposed heat exchanger. The physical parameters of n-hexadecane are shown in Table 1.
Rubber tube 2 is wrapped with the transmission fluid; hence, the thermal conductivity of the transmission fluid has a great impact on the efficiency of the heat exchanger. There are various types of hydraulic transmission fluid [30], including hydraulic oil, high water content fluid (HFA), water glycol fluid (HFC), phosphate ester hydraulic fluid (HFD), water, and so on. Hydraulic oil is widely used as hydraulic transmission fluid and has a low thermal conductivity. HFA consists of 95% water and 5% synthetic chemical additives, which in combination have a low viscosity and thermal conductivity close to water. HFC is a solution of water and ethylene glycol. HFC typically contains 45% water, and its viscosity is close to that of hydraulic oil. Thermal conductivity of the water-to-glycol mixture is 0.3 W/m·K. HFD comprises synthetic anhydrous fluids composed of phosphate esters and has excellent boundary lubrication properties. However, HFD has a strong ability to dissolve many sealing materials and its thermal conductivity is relatively low. The thermal conductivity of some transmission fluids is shown in Table 2. Taking the cost and thermal conductivity into account, water is chosen as the heat exchanger hydraulic transfer fluid.

3.2. Numerical Model

To reduce the complexity of numerical simulations, the three-dimensional physical model of the heat exchanger was simplified as a two-dimensional mathematical model. The two-dimensional numerical model is shown in Figure 4. After independent validations of mesh size, 0.5 mm was selected as the mesh size. Considering the computing power of the computer, the time step of 1s was used for the simulation. Under these conditions, we could obtain the simulation data at a relatively fast speed and ensure the accuracy of the results.

3.3. Phase Change Transfer Model of the Heat Exchanger

The phase change heat transfer process that occurs in in the ocean thermal energy storage unit is a complex three-dimensional, non-stationary process; therefore, in order to facilitate the study of the phase change heat transfer process in the physical model of the heat exchanger and to simplify the mathematical analysis model, the following reasonable assumptions are made:
  • PCM is homogeneous and isotropic. The density, specific capacity and thermal conductivity of the PCM are constant in a single phase, and the difference only exists in different phases, such as in solid or liquid phases;
  • PCM has great stability. There is no supercooling or overheating phenomenon, and performance degradation does not exist;
  • The heat transfer of heat exchanger in the axial direction is not considered;
  • The freezing point T s and melting point T l of the PCM are different values;
  • The influence of natural convection on the phase change process is ignored. The fluid flow generated forms the density difference between the liquid and the solid phase of the PCM in the heat transfer process; thus, natural convection is very weak.
The phase transition problem caused by the solidifying/melting of the PCM in the heat exchanger is a typical Stefan problem. The basic formulas of the solid–liquid phase change problem are shown as Equations (1)–(3) [31]:
Equation of continuity:
v = 0
Momentum conservation equation:
ρ v t + ρ v v = p + μ 2 v + f
Energy conservation equation:
ρ h t + ρ v h = k T
where v is fluid velocity; ρ is the density of the liquid phase change material; p is pressure; μ is the viscosity of the PCM; f is the source term due to the presence of solid; h is the specific enthalpy of the PCM;   k is the thermal conductivity of the material; T is the temperature.
The simulation is based on the enthalpy method, which is often used for the solidification/melting process calculation. This method takes the temperature and enthalpy of the PCM as the variables for the solution and establishes an energy equation in the whole region. It is a simple and flexible method. The essential feature of this method is that it tracks the solid–liquid interface by calculating the enthalpy distribution. This method is valid for the case when the melting point of the PCM is at a single temperature point or in a temperature range. It is suitable for the two-dimensional numerical model of the heat exchanger to solve the solidification/melting problems. The enthalpy of the PCM in the heat transfer process can be calculated as follows:
H = T r e f T c p m p c m d T + f L m p c m
where H is the enthalpy; T r e f is the arbitrary reference temperature; c p is the specific heat; m p c m is the weight of the PCM; f is liquid phase fraction; L is latent heat. f is the volume proportion of the liquid phase in the solid–liquid mixed state of the PCM, and its relationship with temperature is as follows:
f = 0 T < T s T T s T l T s T s T T l 1 T > T l
where   T s and T l represent the PCM solidification point and the PCM melting point, respectively.

4. Numerical Model Validation

4.1. Boundary Conditions and Initial Conditions

The simulation method used in this paper differs from Ref. [2] in one aspect: in Ref. [2], the heat transfer resistance of the shell is ignored; however, we take this into consideration. Affected by the ocean current and the movement of underwater vehicles, the heat exchanger is theoretically carrying out a convective heat exchange with the ocean, and the heat transfer resistance of the shell should not be neglected. Therefore, the outer wall of the shell is not a constant temperature condition, and it is more practical to consider convective heat transfer as the boundary condition of the heat transfer process. In the simulation model, the convection heat transfer between the heat exchanger and seawater is set. The formula for calculating the convective heat transfer coefficient of the outer wall of the model is as follows [32]:
h c = 0.664 R e 0.5 P r 1 / 3 λ l 0
R e = v l 0 ν
where h c is the convective heat transfer coefficient; R e is Reynolds number; P r is Prandtl number, taking 9.52; λ is the thermal conductivity of seawater, taking 0.582 W / m · K ;   l 0 is the length of the heat exchanger, taking 0.75 m ; v is the velocity, taking 0.1   m / s ; ν is the kinematic viscosity, taking 1.188 ×   10 6   m / s 2 . By substituting the above numbers into Formulas (6) and (7), h c can be calculated as 256.24   W / ( m 2 · K ) .
The pressure–velocity coupling scheme uses the SIMPLE algorithm and the second-order upwind algorithm is used in spatial discretization. Set the pressure, density and momentum to 0.2, 1 and 0.9, respectively, in the under-relaxation factors. Figure 5 represents the comparison between the present method and Ref. [2]. The results show that it will prolong the heat transfer time by nearly 15% when h c   = 156.24 W / ( m 2 · K ) , indicating that the constant temperature condition and convective heat transfer boundary condition have different effects on the solid–liquid phase change process. Additionally, considering that the convective heat transfer process is more in line with the actual condition, it can provide a more valuable reference for the introduction of the convective heat transfer coefficient.

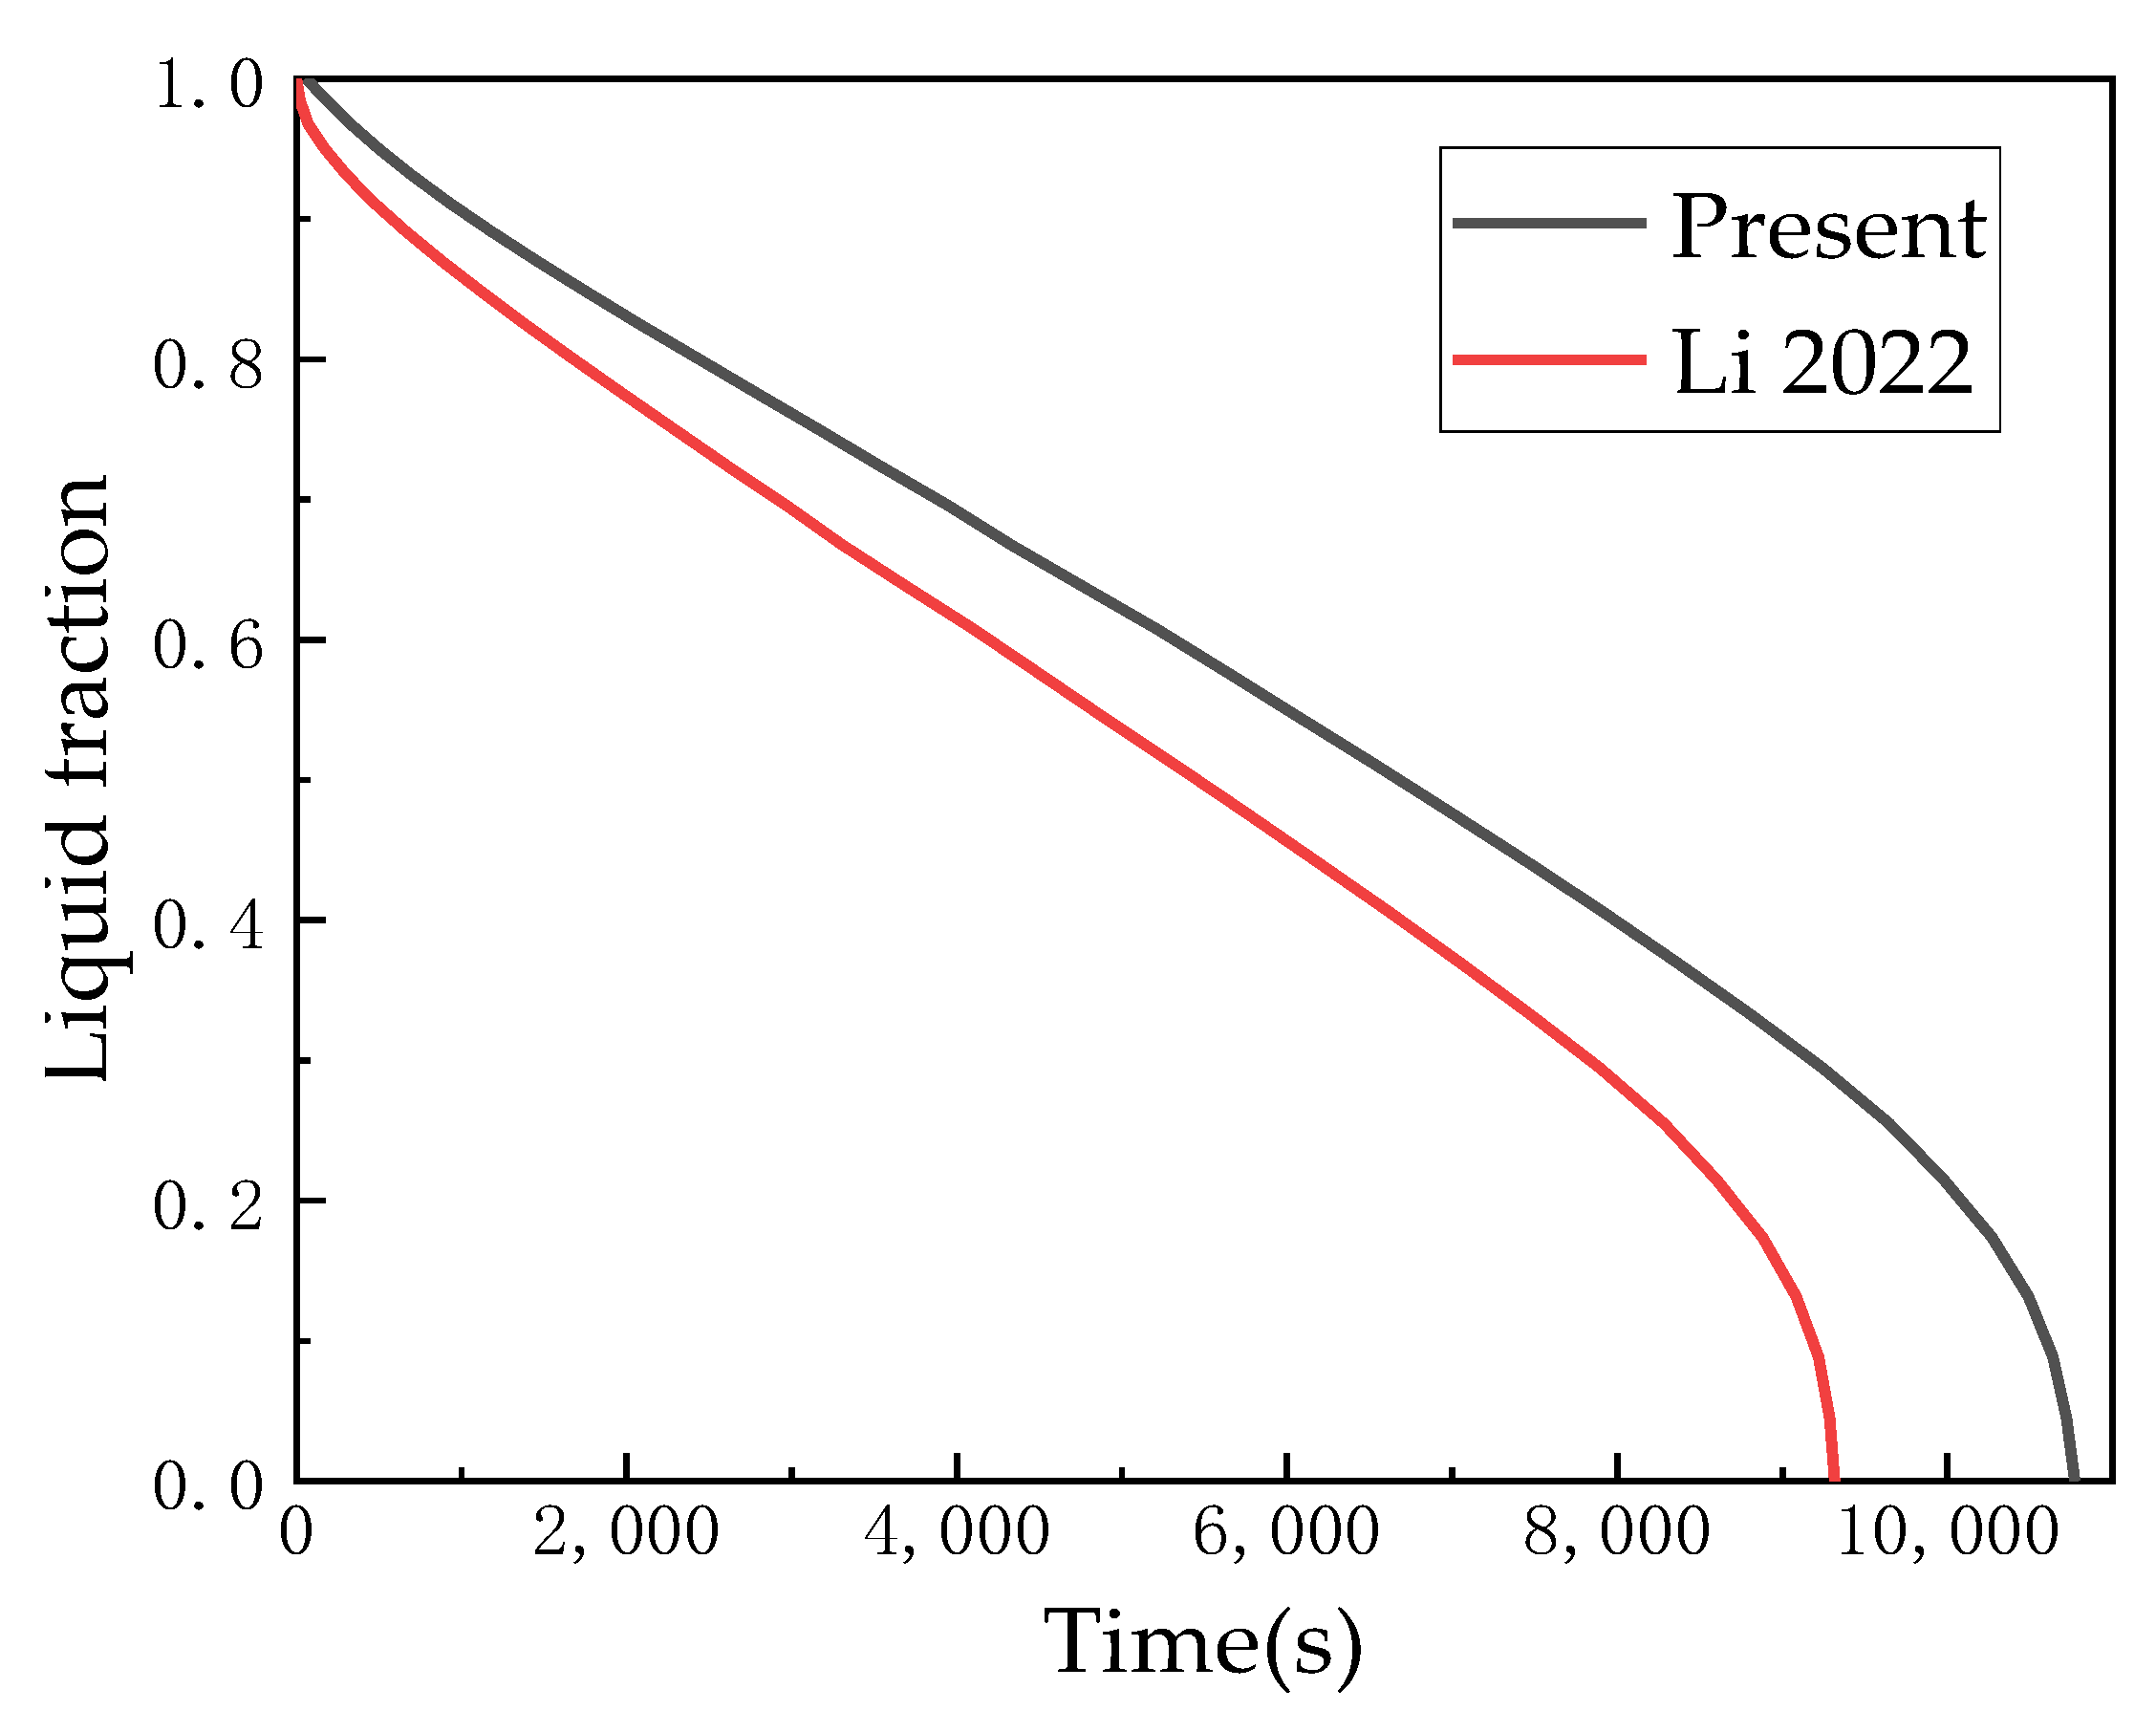
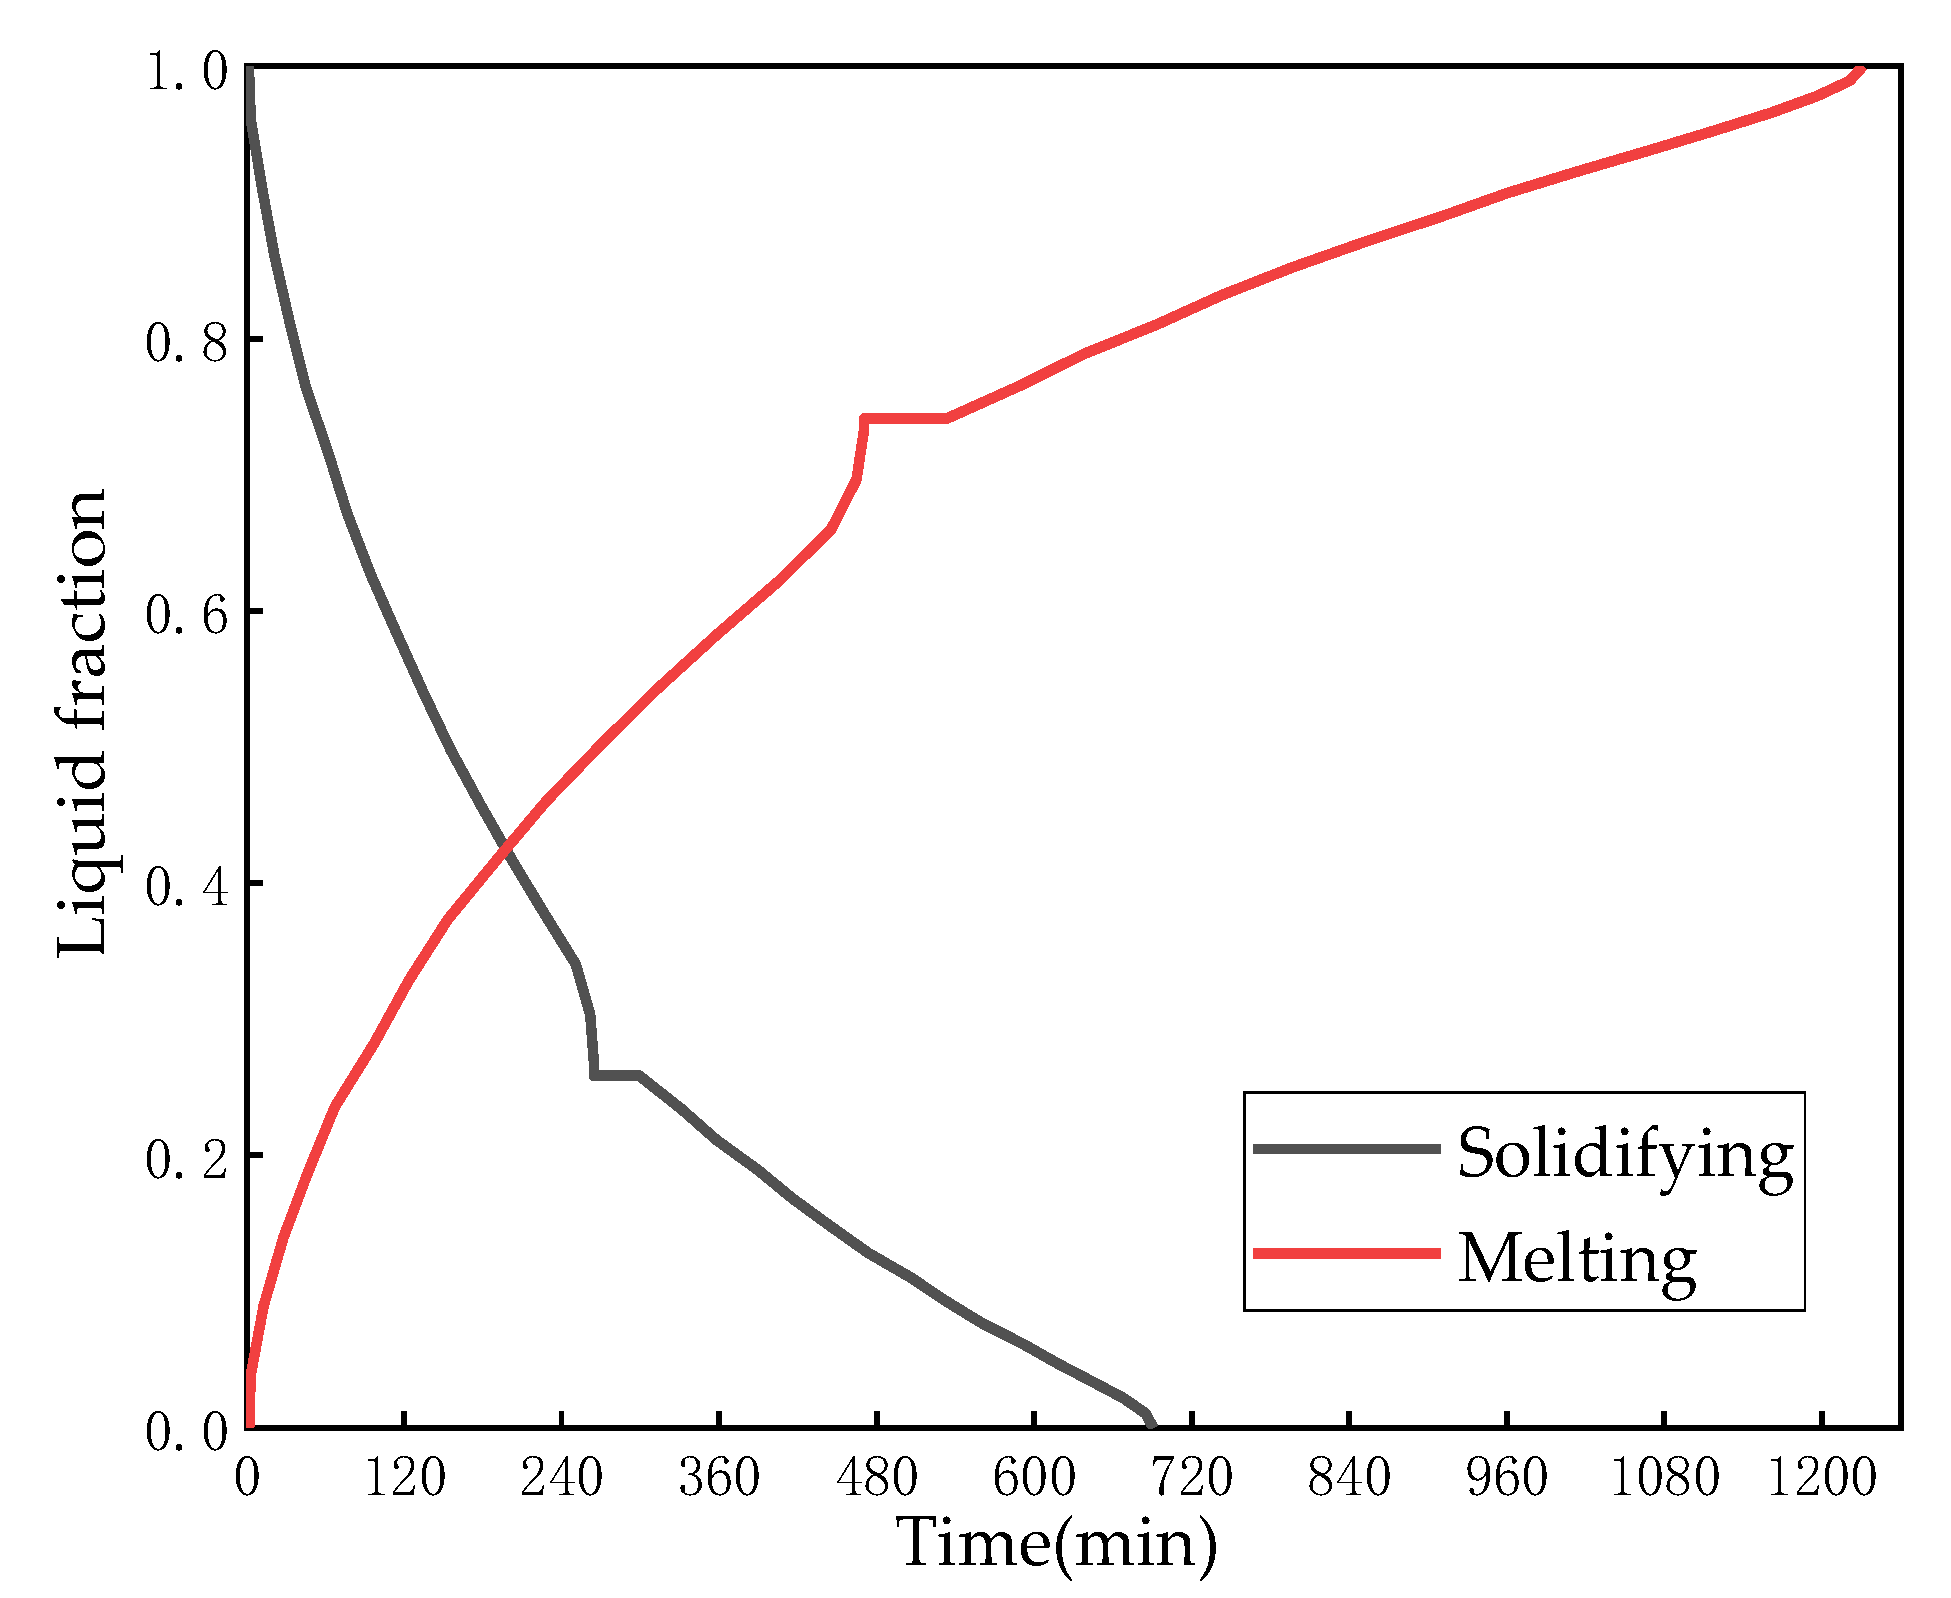
4.2. Numerical Simulation and Results
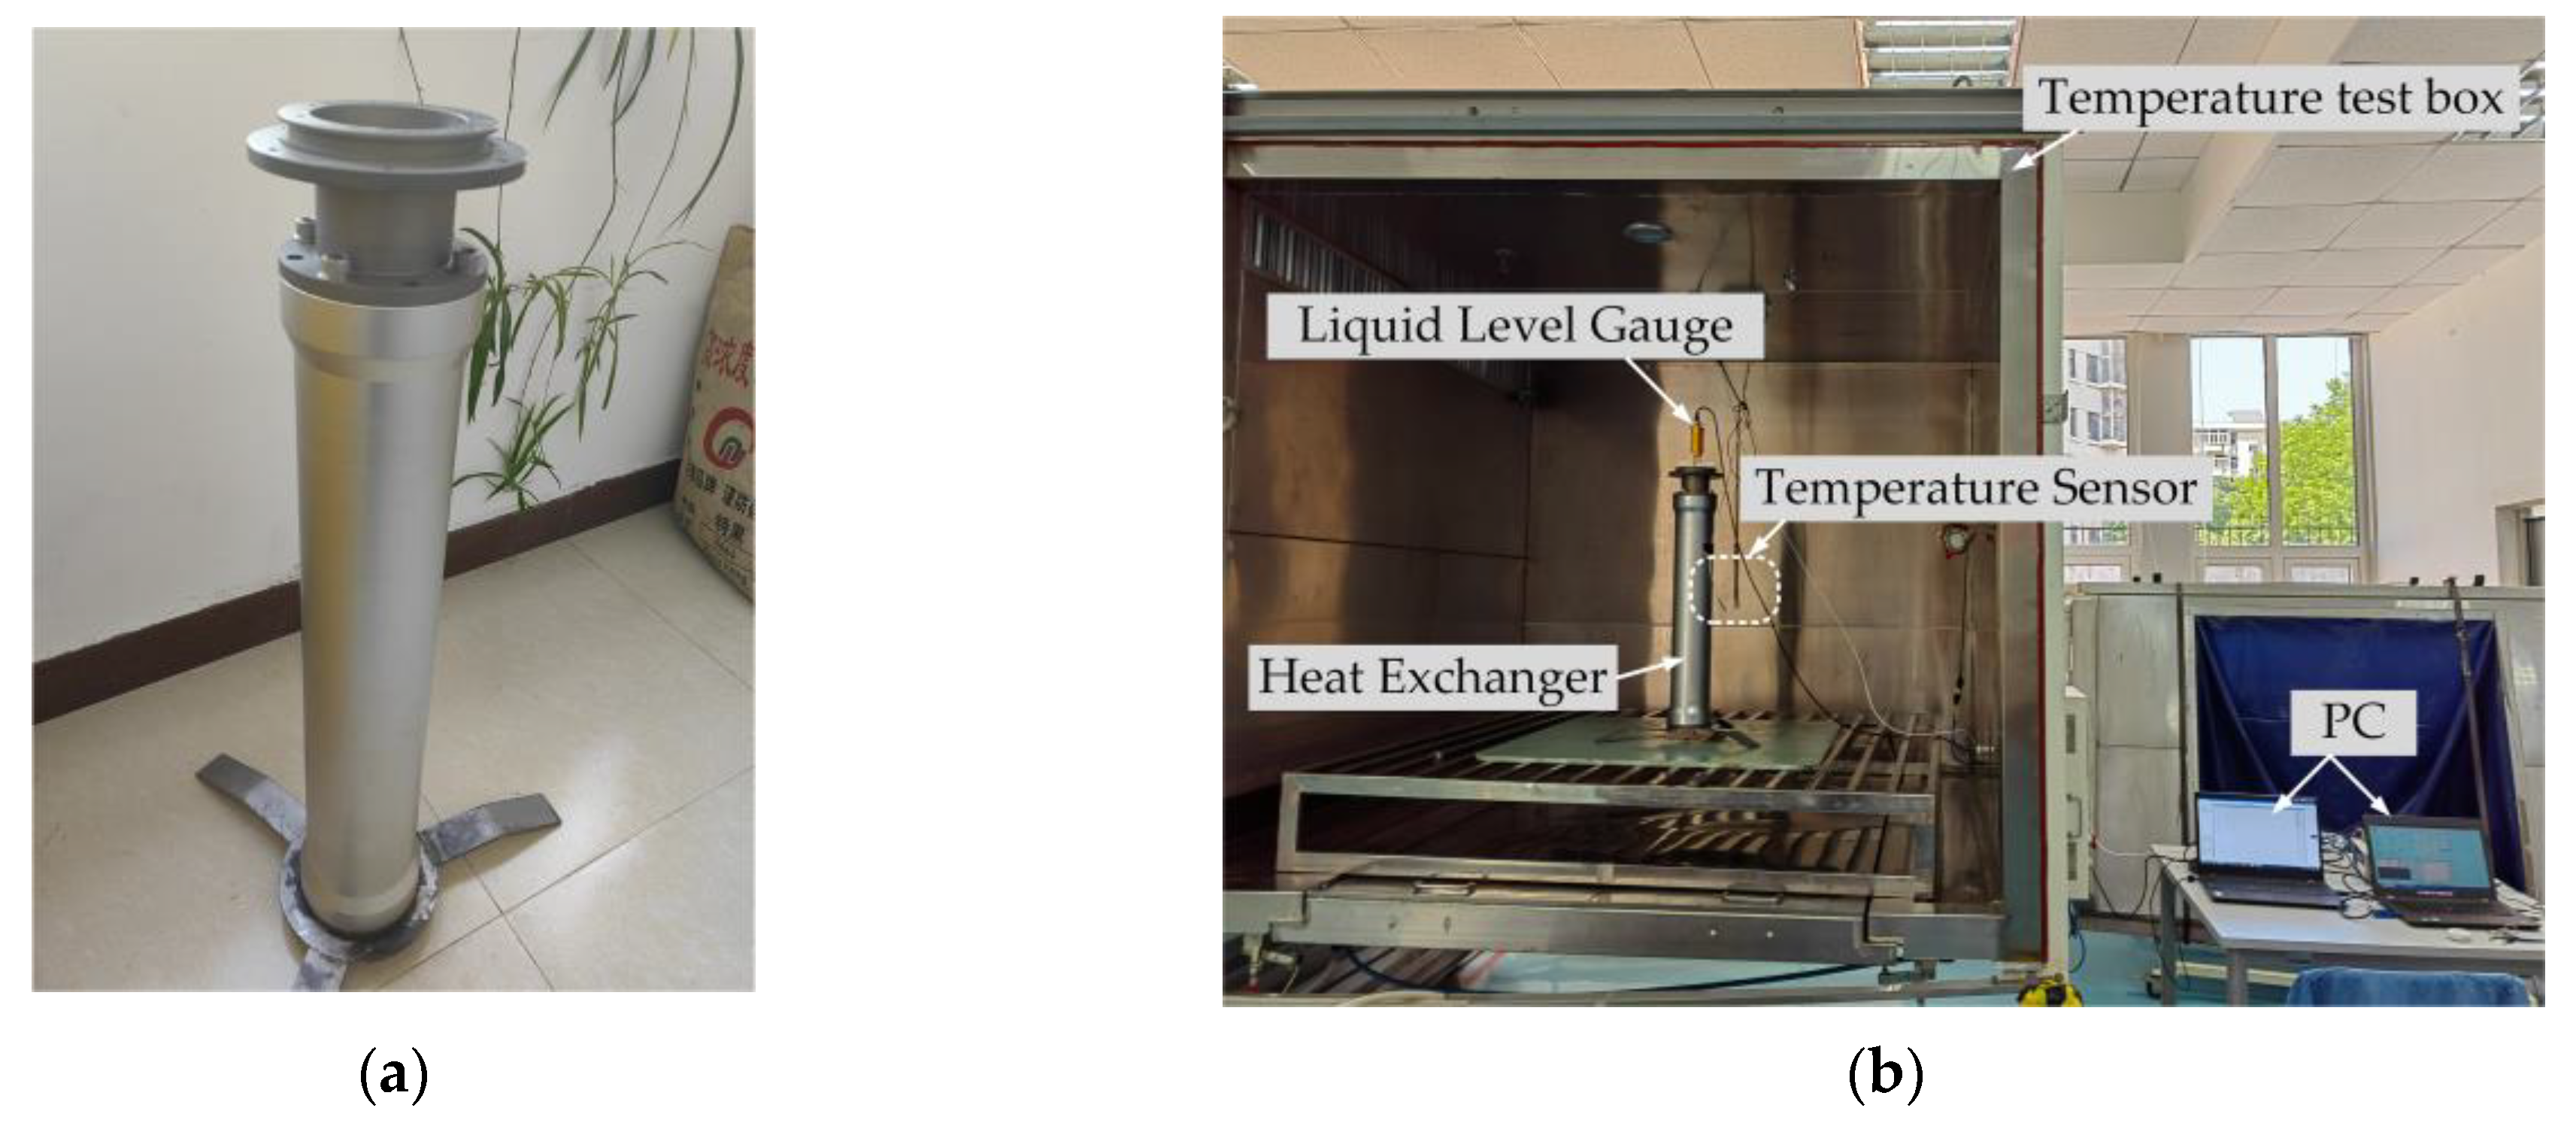
The heat transfer process can be divided into two situations: the endothermic phase transition in surface hot seawater and the exothermic phase transition in deep cold seawater. When a small-size thermal power generation device stays in the surface hot sea water, the heat exchanger absorbs the heat of seawater, and the internal working fluid temperature continuously rises, transforming from a solid to a liquid. When the power generation device is located in deep cold sea water, the heat exchanger releases heat into the cold sea water, and the internal working fluid temperature continuously decreases, transforming from a liquid to a solid. Based on the temperature of tropical seawater, it is assumed that the heat exchange tube undergoes heat exchange in a low-temperature environment at 12 °C and undergoes heat exchange in a high-temperature environment at 24 °C in the simulation.
Figure 6 shows the curve of the liquid fraction of the PCM in the heat exchanger over time under the set conditions. According to Figure 6, at the beginning, the PCM’s temperature is higher than its melting point; thus, the PCM is in a liquid phase. When the container is suddenly placed in cold water (12 °C), there is a huge temperature gradient between the inside and outside of the heat exchanger; hence, the heat transfer rate is the fastest at the beginning, and the slope of the liquefaction curve is at its the highest. As the PCM changes its phase, the temperature gradient gradually decreases, the heat transfer rate slows down and the liquefaction curve gradually becomes flat.
As shown in Figure 6, we can see that the working PCM needs to wait approximately 1230 min to fully melt after entering the 24 °C high-temperature environment from a low-temperature environment of 12 °C; the time for low-temperature solidification is relatively shorter, and the PCM needs approximately 690 min to fully solidify. The main reason why the low-temperature solidification time is shorter than the high-temperature melting is that, as shown in Table 1, the thermal conductivity of n-hexadecane in the solid state is greater than that in the liquid state. During the solidification process, the outer working fluid has already solidified, leading to an increase in the comprehensive thermal conductivity of the PCM, resulting in an acceleration in the solidification process. Therefore, the solidification process requires less time than the melting process during the heat exchange process.

5. Experiment Study

Based on the simulation analysis of the heat exchange performance, the heat exchanger prototype is designed and manufactured, as shown in Figure 7a. To simulate the experimental conditions of the ocean thermocline, an experimental scheme was designed to test the heat transfer time of the PCM during the melting and solidification processes, and the experimental equipment is presented in Figure 7b. In Figure 7b, the temperature test box can control the temperature inside the box, the temperature sensor is used for measuring the temperature around the heat exchanger and the liquid level gauge is used to measure the transmission fluid level and to calculate the volume change. As the heat exchanger was opaque, we were unable to visually judge whether the heat transfer process was completed or not. When the water level no longer changes, it means that the PCM is no longer melting or solidifying. Moreover, at this time, the heat transfer process can be considered finished. The PC is used to record and store the data collected with the sensors.
At the beginning, the prototype is fully heated to 24 °C in the temperature test box; hence, the temperature of all parts inside the prototype is uniform. To simulate the low-temperature condition of the deep sea, the temperature in the test box is reduced to 12 °C, causing the PCM in the heat exchanger to gradually solidify. After the solidification process is completed, the temperature is raised to 24 °C to simulate the high-temperature condition of the sea surface. With the increase in temperature, the PCM gradually melts. Meanwhile, the data from the sensors is recorded and saved to the PC. Figure 8 presents the liquid fraction during the solidification/melting process and the temperature around the heat exchanger. Solidification time and melting time require around 390 min and 620 min, respectively, under this temperature difference condition. The resulting volume change via melting is 263 mL. Both the test box and sensors are standard instruments of measurement with excellent reliability; thus, the prototype is in a very similar environment in each experiment and the difference in the results should be small. To ensure the repeatability of the results, the solidification process was carried out three times and the solidification times of the repeated experiments are shown in Table 3. The average solidification time was 396 min and the maximum error was 3%, proving the reliability of the results.
The results show that the phase change time of the simulation is longer than the physical experiment, which is explained by the following reason: by being affected by gravity and a temperature difference, both the liquid PCM and water produce a strong flow in the physical experiment, which accelerates the heat transfer process. Due to the software and the limitations of computing power, this factor is not well considered.
Assuming that the heat exchanger is connected to the accumulator, the designed accumulator has an initial pressure of 5.7 MPa [33] and a nominal capacity of 1000 mL. According to the volume change, the final pressure P 2 of the accumulator can calculated with Formula (8):
P 2 = P 1 V 1 V 1 Δ V = 5.7 × 1000 1000 263 7.7   MPa
where P 1 is the initial pressure of the accumulator, V 1 is the nominal capacity and Δ V is the volume change of the PCM.
The pressure energy obtained with the accumulator during the melting process can be represented with Formula (9):
E H A = P H A q H A d t
where E H A represents the pressure energy obtained by the accumulator, P H A is the instantaneous pressure of the accumulator during the melting process and q H A is the instantaneous flow of hydraulic oil entering the accumulator. q H A is equal to the volume change at the sampling period; thus, we can find that E H A is 1740 J. The efficiency of hydraulic-to-electrical energy is around 34% [34]; thus, we can generate more than 600 J of battery energy per dive cycle, in theory. An energy of 6 kJ per diving cycle is required for ocean underwater vehicles [13]; thus, we can extend the vehicles’ lifetime by 10%. As we can see from Formulas (8) and (9), if we increase the initial pressure P 1 , we will get more pressure energy E H A .
Therefore, it is necessary to study the effect of seasons on the performance of the heat exchanger. To research the influence on the phase change process, six sets of experiments under different temperature conditions were performed, and the details are shown in Table 4. The test results are shown in Figure 9. From Figure 9, under the same low-temperature condition, as the highest temperature increases, the heat transfer time shows a decreasing trend. Under the same high-temperature environment, as the minimum temperature decreases, the heat transfer time also shows a decreasing trend. From the entire experimental process, as the temperature difference increases, the heat transfer time decreases. The results of the physical experiment show that the melting process takes about 6–12 h to complete and the solidification process needs 3–7 h. The Argo profiling float is a widely used type of underwater vehicle, and it will dive into to the deep sea and typically stay there for 10 days after deployment. Then, the float will rise to the sea surface and transmit data to the satellite over 6 h. Afterwards, the float will return to the deep sea and repeat the cycle. For example, COPEX, Chinese Argo float, stays at 1000 m below sea level for 7–10 days and rises to the sea surface for 6–12 h for positioning and data transmission. The results of the physical experiment prove that the phase change process could be completed within a diving cycle of a float and that the heat exchanger could collect the thermal energy for the underwater vehicles.

6. Conclusions and Discussion

To supply energy to the underwater vehicles and prolong their working time, a heat exchanger structure for thermal power generation is proposed and a prototype is developed in this paper. Water is used as the transmission fluid, which is more beneficial to the heat transfer process due to its high thermal conductivity. Besides that, compared with the scheme using fins or foam metal, we avoid adding more metal to the heat exchanger to enable a reduction in its structural weight.
Based on the prototype, a number of physical experiments were carried out. Experimental results showed that phase change time also decreases as the temperature difference decreases. The solidification process takes 3–7 h and the melting process needs 6–12 h. The whole phase transition process could be completed in one working cycle of an underwater vehicle; thus, the heat exchanger can be applied to underwater vehicles as part of their thermal energy generation devices. Therefore, our structure can provide a reference for the heat exchanger structure of the thermal power generation device.
On the other hand, the heat exchanger is not connected to the accumulator in this paper; hence, the influence of pressure was not considered. Pressure in the accumulator is in a continuously changing state and is affected by the volume changes of the PCM in the actual working process, and the melting point of the PCM is a quantity dependent on pressure. Therefore, the effects of pressure need to be known. To further analyze the performance of the proposed heat exchanger, the focus of our future research will be on the coupling between pressure and phase change processes.

Author Contributions

X.W. (Xiao Wu): conceptualization, methodology, validation, formal analysis, investigation, data curation, writing—original draft preparation and writing—review and editing; X.W. (Xiangnan Wang): conceptualization, methodology, formal analysis, investigation, resources, writing—review and editing and funding acquisition; B.W.: conceptualization, methodology, validation, data curation, resources, writing—original draft preparation, writing—review and editing, supervision and funding acquisition. All authors have read and agreed to the published version of the manuscript.

Funding

This research was financially supported by the Directional Fund Project of Key Laboratory of Ocean Observation Technology, MNR, grant number 2021klootB04.

Data Availability Statement

Data are contained within the article.

Acknowledgments

The authors of this article acknowledge the help and support provided by the Environment and Reliability Testing Laboratory of Marine Observation and Monitoring Instruments.

Conflicts of Interest

The authors declare no conflict of interest.

Abbreviations and Nomenclature

PCMPhase change material
SMAsShape memory alloys
TEGsThermoelectric generators
c p Specific heat
E H A Pressure energy obtained with the accumulator
f Liquid phase fraction
H Enthalpy
h Specific enthalpy
h c Convective heat transfer coefficient
k Thermal conductivity of the PCM
L Latent heat
l 0 Length of the heat exchanger
m p c m Weight of the PCM
p Pressure
P H A Instantaneous pressure of the accumulator
P r Prandtl number
P 1 , P 2 Initial/final pressure of the accumulator
q H A The instantaneous flow rate of the hydraulic oil entering the accumulator
R e Reynolds number
S The source term due to the presence of a solid
T Temperature
T r e f Reference temperature
T s , T l Solidification/melting temperature of the PCM
v Fluid velocity
v Velocity of seawater
V 1 Initial volume of the accumulator
Δ V Volume change of the accumulator
λ Thermal conductivity of seawater
μ Viscosity of the PCM
ρ Density
ν Kinematic viscosity

References

  1. Sahoo, A.; Dwivedy, S.K.; Robi, P.S. Advancements in the field of autonomous underwater vehicle. Ocean Eng. 2019, 181, 145–160. [Google Scholar] [CrossRef]
  2. Li, S.; Zhang, Y.; Zhou, Z.; Shi, W.; Zhang, J.; Wang, B. Study on improving the storage efficiency of ocean thermal energy storage (OTES) unit by using fins. Case Stud. Therm. Eng. 2022, 37, 102262. [Google Scholar] [CrossRef]
  3. Hyakudome, T.; Nakatani, T.; Yoshida, H.; Tani, T.; Ito, H.; Sugihara, K. Development of fuel cell system for long cruising lange Autonomous Underwater Vehicle. In Proceedings of the 2016 IEEE/OES Autonomous Underwater Vehicles (AUV), Tokyo, Japan, 6–9 November 2016; pp. 165–170. [Google Scholar]
  4. Wang, G.; Yang, Y.; Wang, S.; Zhang, H.; Wang, Y. Modification of the phase change transfer model for underwater vehicles: A molecular dynamics approach. Int. J. Energy Res. 2020, 44, 11323–11344. [Google Scholar] [CrossRef]
  5. Aintablian, H.O.; Valdez, T.I.; Jones, J.A. A Hydraulic Motor-Alternator System for Ocean-Submersible Vehicles. In Proceedings of the 10th International Energy Conversion Engineering Conference, Atlanta, Georgia, 30 July–1 August 2012. [Google Scholar]
  6. Wang, X.; Shang, J.; Luo, Z.; Tang, L.; Zhang, X.P.; Li, J. Reviews of power systems and environmental energy conversion for unmanned underwater vehicles. Renew. Sustain. Energy Rev. 2012, 16, 1958–1970. [Google Scholar] [CrossRef]
  7. Hegarty, A.; Westbrook, G.; Glynn, D.; Murray, D.; Omerdic, E.; Toal, D.J.F. A Low-Cost Remote Solar Energy Monitoring System for a Buoyed IoT Ocean Observation Platform. In Proceedings of the 2019 IEEE 5th World Forum on Internet of Things (WF-IoT), Limerick, Ireland, 15–18 April 2019; pp. 386–391. [Google Scholar]
  8. Thomas, T.; Tarapore, D. Efficient simulation of wave glider dynamics and validation with trans-Pacific voyages. In Proceedings of the OCEANS 2023–Limerick, Limerick, Ireland, 5–8 June 2023; pp. 1–7. [Google Scholar]
  9. Chao, Y. Autonomous underwater vehicles and sensors powered by ocean thermal energy. In Proceedings of the OCEANS 2016–Shanghai, Shanghai, China, 10–13 April 2016; pp. 1–4. [Google Scholar]
  10. Yang, M.-H.; Yeh, R.H. Analysis of optimization in an OTEC plant using organic Rankine cycle. Renew. Energy 2014, 68, 25–34. [Google Scholar] [CrossRef]
  11. Webb, D.C.; Simonetti, P.J.; Jones, C.P. SLOCUM: An underwater glider propelled by environmental energy. IEEE J. Ocean. Eng. 2001, 26, 447–452. [Google Scholar] [CrossRef]
  12. Elkhatat, A.M.; Al-Muhtaseb, S.A. Combined “Renewable Energy–Thermal Energy Storage (RE–TES)” Systems: A Review. Energies 2023, 16, 4471. [Google Scholar] [CrossRef]
  13. Carneiro, J.F.; Almeida, F.G.D. Model and simulation of the energy retrieved by thermoelectric generators in an underwater glider. Energy Convers. Manag. 2018, 163, 38–49. [Google Scholar] [CrossRef]
  14. Angilella, A.J.; Gandhi, F.; Miller, T.F. Design and testing of a shape memory alloy buoyancy engine for unmanned underwater vehicles. Smart Mater. Struct. 2015, 24, 115018. [Google Scholar] [CrossRef]
  15. Wang, G.; Yanan, Y.; Wang, S. Ocean thermal energy application technologies for unmanned underwater vehicles: A comprehensive review. Appl. Energy 2020, 278, 115752. [Google Scholar] [CrossRef]
  16. Jones, C.; Allsup, B.; DeCollibus, C. Slocum glider: Expanding our understanding of the oceans. In Proceedings of the 2014 Oceans–St. John’s, St. John’s, NL, Canada, 14–19 September 2014; pp. 1–10. [Google Scholar]
  17. Wang, B.; Zhang, W.; Duan, Y. Analysis and test of power generating characteristics of small ocean thermal energy conversion device. Acta Energiae Solaris Sin. 2018, 39, 3302–3310. [Google Scholar]
  18. Wang, G.; Yanan, Y.; Wang, S.; Zhang, H.; Wang, Y. Efficiency analysis and experimental validation of the ocean thermal energy conversion with phase change material for underwater vehicle. Appl. Energy 2019, 248, 475–488. [Google Scholar] [CrossRef]
  19. Seatrec Demonstrates Energy-Harvesting Solution for Ocean Instruments. Available online: https://www.oceannews.com/news/science-technology/seatrec-demonstrates-energy-harvesting-solution-for-ocean-instruments (accessed on 19 September 2023).
  20. Huntsberger, T.L.; Jones, J.A.; Valdez, T.I.; Stirbl, R.C. Slocum-TREC Thermal Glider. In Proceedings of the Unmanned Systems Technology Review, Panama City, FL, USA, 27–31 January 2012. [Google Scholar]
  21. Peng, H.; Chen, Y.; Li, M. Analysis on solid-liquid phase change heat transfer performance of underwater thermal gliders embedding metal foam. J. Shanghai Marit. Univ. 2022, 43, 113–119. [Google Scholar] [CrossRef]
  22. Wang, G.; Yang, Y.; Wang, S. Thermophysical properties analysis of graphene-added phase change materials and evaluation of enhanced heat transfer effect in underwater thermal vehicles. J. Mol. Liq. 2021, 348, 118048. [Google Scholar] [CrossRef]
  23. Wang, R. System Design and Experiment of the Thermal Exchanger for Underwater Vehicles. Ph.D. Thesis, Tianjin University, Tianjin, China, 2018. [Google Scholar]
  24. Buckle, J.R.; Knox, A.; Siviter, J.; Montecucco, A. Autonomous Underwater Vehicle Thermoelectric Power Generation. J. Electron. Mater. 2013, 42, 2214–2220. [Google Scholar] [CrossRef]
  25. Ancient Global Cooling Gave Rise to Modern Ecosystems. Available online: https://www.brown.edu/news/2016-09-26/miocene (accessed on 19 September 2023).
  26. Kong, Q.; Ma, J. Numerical simulation of phase changing process for underwater glider propelled by ocean thermal energy. J. Wuhan Univ. Technol. (Transp. Sci. Eng.) 2011, 35, 223–227. [Google Scholar]
  27. Wang, B.; Wang, G.; Zhang, W.; Liu, H.; Li, M.; Duan, Y. Design and Testing of the Heat Exchange System for Small Ocean Thermal Energy Power Device. J. Ocean. Technol. 2017, 36, 47–52. [Google Scholar]
  28. Hou, S. Study on Working Principle of Drive-Device of AUV Driven by Temperature Difference Energy. Ph.D. Thesis, Tianjin University, Tianjin, China, 2004. [Google Scholar]
  29. Yang, R.; Chen, X.; Liu, C.; Shen, Z.; Fang, L. Adjustability of phase change temperature and decrease in melting time of n-hexadecane. J. Wuhan Inst. Technol. 2017, 39, 216–222. [Google Scholar]
  30. Zheng, D.; Hao, Y.; Li, C.; Wang, C. Technology Development of Fire-Resistant Hydraulic Fluids. Lubr. Oil 2012, 27, 5–9. [Google Scholar] [CrossRef]
  31. Kong, Q.-l.; Ma, J.; Xia, D. Numerical and experimental study of the phase change process for underwater glider propelled by ocean thermal energy. Renew. Energy 2010, 35, 771–779. [Google Scholar] [CrossRef]
  32. Yang, S.; Tao, W. Heat Transfer; Higher Education Press: Beijing, China, 2006. [Google Scholar]
  33. Wang, B.; Wang, M.; Zhang, W.; Liu, H.; Wang, G. Research on the Ocean Thermal Power Generation Technology for Small-Sized Marine Observation Vehicles. J. Ocean Technol. 2015, 34, 78–82. [Google Scholar]
  34. Xia, Q.; Chen, Y.-h.; Yang, C.; Chen, B.; Muhammad, G.; Ma, X. Maximum efficiency point tracking for an ocean thermal energy harvesting system. Int. J. Energy Res. 2020, 44, 2693–2703. [Google Scholar] [CrossRef]
Figure 1. The ocean surface temperature [25].
Energies 16 07559 g001
Figure 2. Schematic of thermal power generation based on a solid–liquid phase transition: (a) the initial state of thermal power generation; (b) the solidifying process in cold seawater; (c) the melting process in warm seawater; (d) power generation process. 1: heat exchanger; 2: accumulator; 3: hydraulic motor; 4: bladder; 5: generator; 6: rectifier; 7: battery; 8: solenoid valve; 9: check valve 1; 10: check valve 2.
Energies 16 07559 g002
Figure 3. Three-dimensional structure diagram of the heat exchanger.
Energies 16 07559 g003
Figure 4. Two-dimensional numerical model of the heat exchanger.
Energies 16 07559 g004
Figure 5. Comparison between the present method and Li 2022 [2].
Energies 16 07559 g005
Figure 6. Liquid fraction of the PCM versus time.
Energies 16 07559 g006
Figure 7. The heat exchanger prototype and the experimental equipment: (a) the heat exchanger prototype; (b) the experimental equipment.
Energies 16 07559 g007
Figure 8. Experiment results of phase change process: (a) solidification process; (b) melting process.
Energies 16 07559 g008
Figure 9. Heat transfer time for experiment sets.
Energies 16 07559 g009
Table 1. Thermo-physical properties of n-hexadecane [27].
State of the PCMSolidLiquid
Density ( kg / m 3 )835770
Specific heat ( J / ( kg · K ) )17352216
Thermal conductivity ( W / ( m · K ) )0.350.15
Melting temperature (°C)18.2
Latent heat ( J / kg )236,000
Table 2. The thermal conductivity of different transmission fluids.
MaterialThermal Conductivity (W/(m · K))
Hydraulic oil0.15
High water content fluid (HFA)0.598
Water glycol fluid (HFC)0.3
Phosphate ester hydraulic fluid (HFD)0.13
Water0.598
Table 3. Solidification time of the repeated experiments.
Experiment Number123
Solidification time (min)390402397
Table 4. The details of experiment sets.
Experiment Number123456
Low temperature4 °C4 °C4 °C4 °C8 °C12 °C
High temperature30 °C28 °C25 °C24 °C24 °C24 °C
Temperature difference26 °C24 °C21 °C20 °C16 °C12 °C
Disclaimer/Publisher’s Note: The statements, opinions and data contained in all publications are solely those of the individual author(s) and contributor(s) and not of MDPI and/or the editor(s). MDPI and/or the editor(s) disclaim responsibility for any injury to people or property resulting from any ideas, methods, instructions or products referred to in the content.

