
Simple Form of Compact Thermal Model of the Large LED Modules


Department of Marine Electronics, Gdynia Maritime University, Morska 81-87, 81-225 Gdynia, Poland
*
Author to whom correspondence should be addressed.
Energies 2023, 16(21), 7329; https://doi.org/10.3390/en16217329
Submission received: 26 September 2023
/
Revised: 25 October 2023
/
Accepted: 27 October 2023
/
Published: 29 October 2023
(This article belongs to the Special Issue Challenges and Progress in Power System Analysis and Control)
Abstract
:The paper proposes a simple compact thermal model of a large LED module. This model takes into account self-heating in each of the LEDs contained in such a module and mutual thermal couplings between each pair of these LEDs. It also allows determining the waveforms of the junction temperature of each of the LEDs. In each moment of time, the temperature distributions in the LED module in the form of values of the junction temperature of all the diodes contained in this module are calculated using the proposed model. The developed thermal model has the form of an electric network and it contains a much smaller number of components than thermal models given in the literature. The form of the developed model and the method of determining the values of its parameters as well as the results of calculations and measurements confirming the practical usefulness of this model are presented.
1. Introduction
The properties of semiconductor devices, including power LEDs, strongly change under the influence of temperature changes [1,2,3,4]. In particular, an increase in the junction temperature of such devices significantly shortens their lifetime and causes deterioration of the operating parameters [5,6,7,8,9,10,11,12]. Therefore, it is important to determine their junction temperature for specific operating conditions. This temperature is higher than the ambient temperature due to the self-heating phenomenon and mutual thermal couplings between the devices placed on a common base [13,14,15,16,17,18,19,20,21,22].
LED modules containing from a few to a dozen or so LEDs are commonly used in lighting systems [11,23,24,25,26,27]. Such modules contain power LEDs connected in series and situated on the common basis, which typically is a metal core printed circuit board (MCPCB) [11,24,26,28]. Except small LED modules dedicated to LED lamps, modules of the shape of rectangles, whose area exceeds even 100 cm2, and LEDs situated along straight parallels to the axis of the module are used. In these modules, an increase in the junction temperature of each of the LEDs contained in them not only shortens the lifetime of such a module [7], but also results in a decrease in the value of the luminous flux [25,29] of the emitted light.
Many papers have been devoted to the problem of modeling thermal phenomena in power modules [30,31,32] or in LEDs and LED modules, e.g., [8,12,13,25,33,34]. The paper [13] presents a compact thermal model of power LEDs. It has a classic form of an RC network, whose components are determined using the network identification by deconvolution method. The experimental verification of the presented model was carried out and a good agreement was obtained between the results of calculations and measurements for selected operating points with forced liquid cooling.
In [29], it was shown that mutual thermal couplings in the LED module significantly affect optical parameters and junction temperatures of LEDs contained in it. It was also shown that the cooling efficiency of individual LEDs depends on their location. In [35], a compact thermal model of a power LED was proposed, in which the catalog information about the thermal resistance between the junction and the case of these diodes was used. The experimental verification of the model was carried out with forced and free cooling.
In the paper [28], the influence of cooling conditions of the power LED on parameters of its compact thermal model was analyzed. The tests were carried out with forced cooling of the tested LEDs, in a wide range of ambient temperature changes. In the cited paper, the influence of the method of soldering a thermal pad on the parameters of this model was also considered. The test results were illustrated using the cumulative thermal resistance waveforms as a function of time constants.
The paper [36] presents the results of measurements of transient thermal impedance of selected power LEDs fixed to the substrate using various soldering methods. Based on the obtained measurement results, the values of the parameters of the compact thermal model were determined for each of the considered methods of mounting the tested LEDs. The influence of the method of mounting the LEDs on the obtained test results was indicated.
In the paper [37], a 3D thermal model of a power LED was proposed, formulated using the results of calculations obtained using the FloTHERM program. The considered model takes into account the geometric dimensions of both the tested LEDs and the dimensions of the substrate to which the LED is mounted. The correctness of the developed model was verified experimentally.
In our previous paper [25], a thermal model of a small LED module contained in a LED lamp was proposed. This module has the shape of a circle with the diameter of about 4 cm. In turn, thermal properties of a large rectangular LED module with the area of about 111 cm2 were analyzed in [23,38]. Thermal properties of the considered module were characterized using one averaged temperature of the entire module. Therefore, this model does not take into account the non-uniform temperature distribution in this module.
The paper [23] presents the results of measurements illustrating the effect of the method of soldering power LEDs contained in a large LED module on their transient thermal impedance. Both waveforms of this parameter were considered for whole LED modules and for individual LEDs contained in one of these modules. It was shown that both the methods of soldering and the location of the LED in the module significantly affect the waveforms of transient thermal impedance, and consequently the parameters of the compact thermal model of the module treated as a whole or the parameters of each of the diodes contained in it.
In the paper [38], a thermal model of a large LED module was proposed, which makes it possible to determine the value of the junction temperature of each of the 16 LEDs contained in this module. Using the modeling concept presented in [38], it is necessary to use subcircuits modeling self-heating or mutual thermal couplings between individual pairs of LEDs contained in the considered module in a number equal to the square of the number of LEDs contained in the module. In the case considered in the cited paper, the module contains 16 LEDs, i.e., its model contains as many as 256 subcircuits. The disadvantage of the model described in the cited paper is its high degree of complexity. The results of the experimental verification of this model show that it correctly models both self-heating in each of the diodes and mutual thermal couplings between the diodes contained in this module. The correctness of the proposed model for various power dissipation conditions in the considered module was experimentally demonstrated.
In this paper, a new form of the compact thermal model of a large LED module is proposed. This model takes into account self-heating in each diode and mutual thermal couplings between each pair of the diodes contained in this module, and, at the same time, its structure is much simpler than the models described in the literature, because it consists of sub-circuits, the number of which is the product of the number 2 and the number of LEDs included in the module. The following sections describe the tested module, present the form of the developed model, describe the method of determining the values of the parameters of this model, and show the results of calculations and measurements illustrating the correctness of the developed model.
2. Tested Module
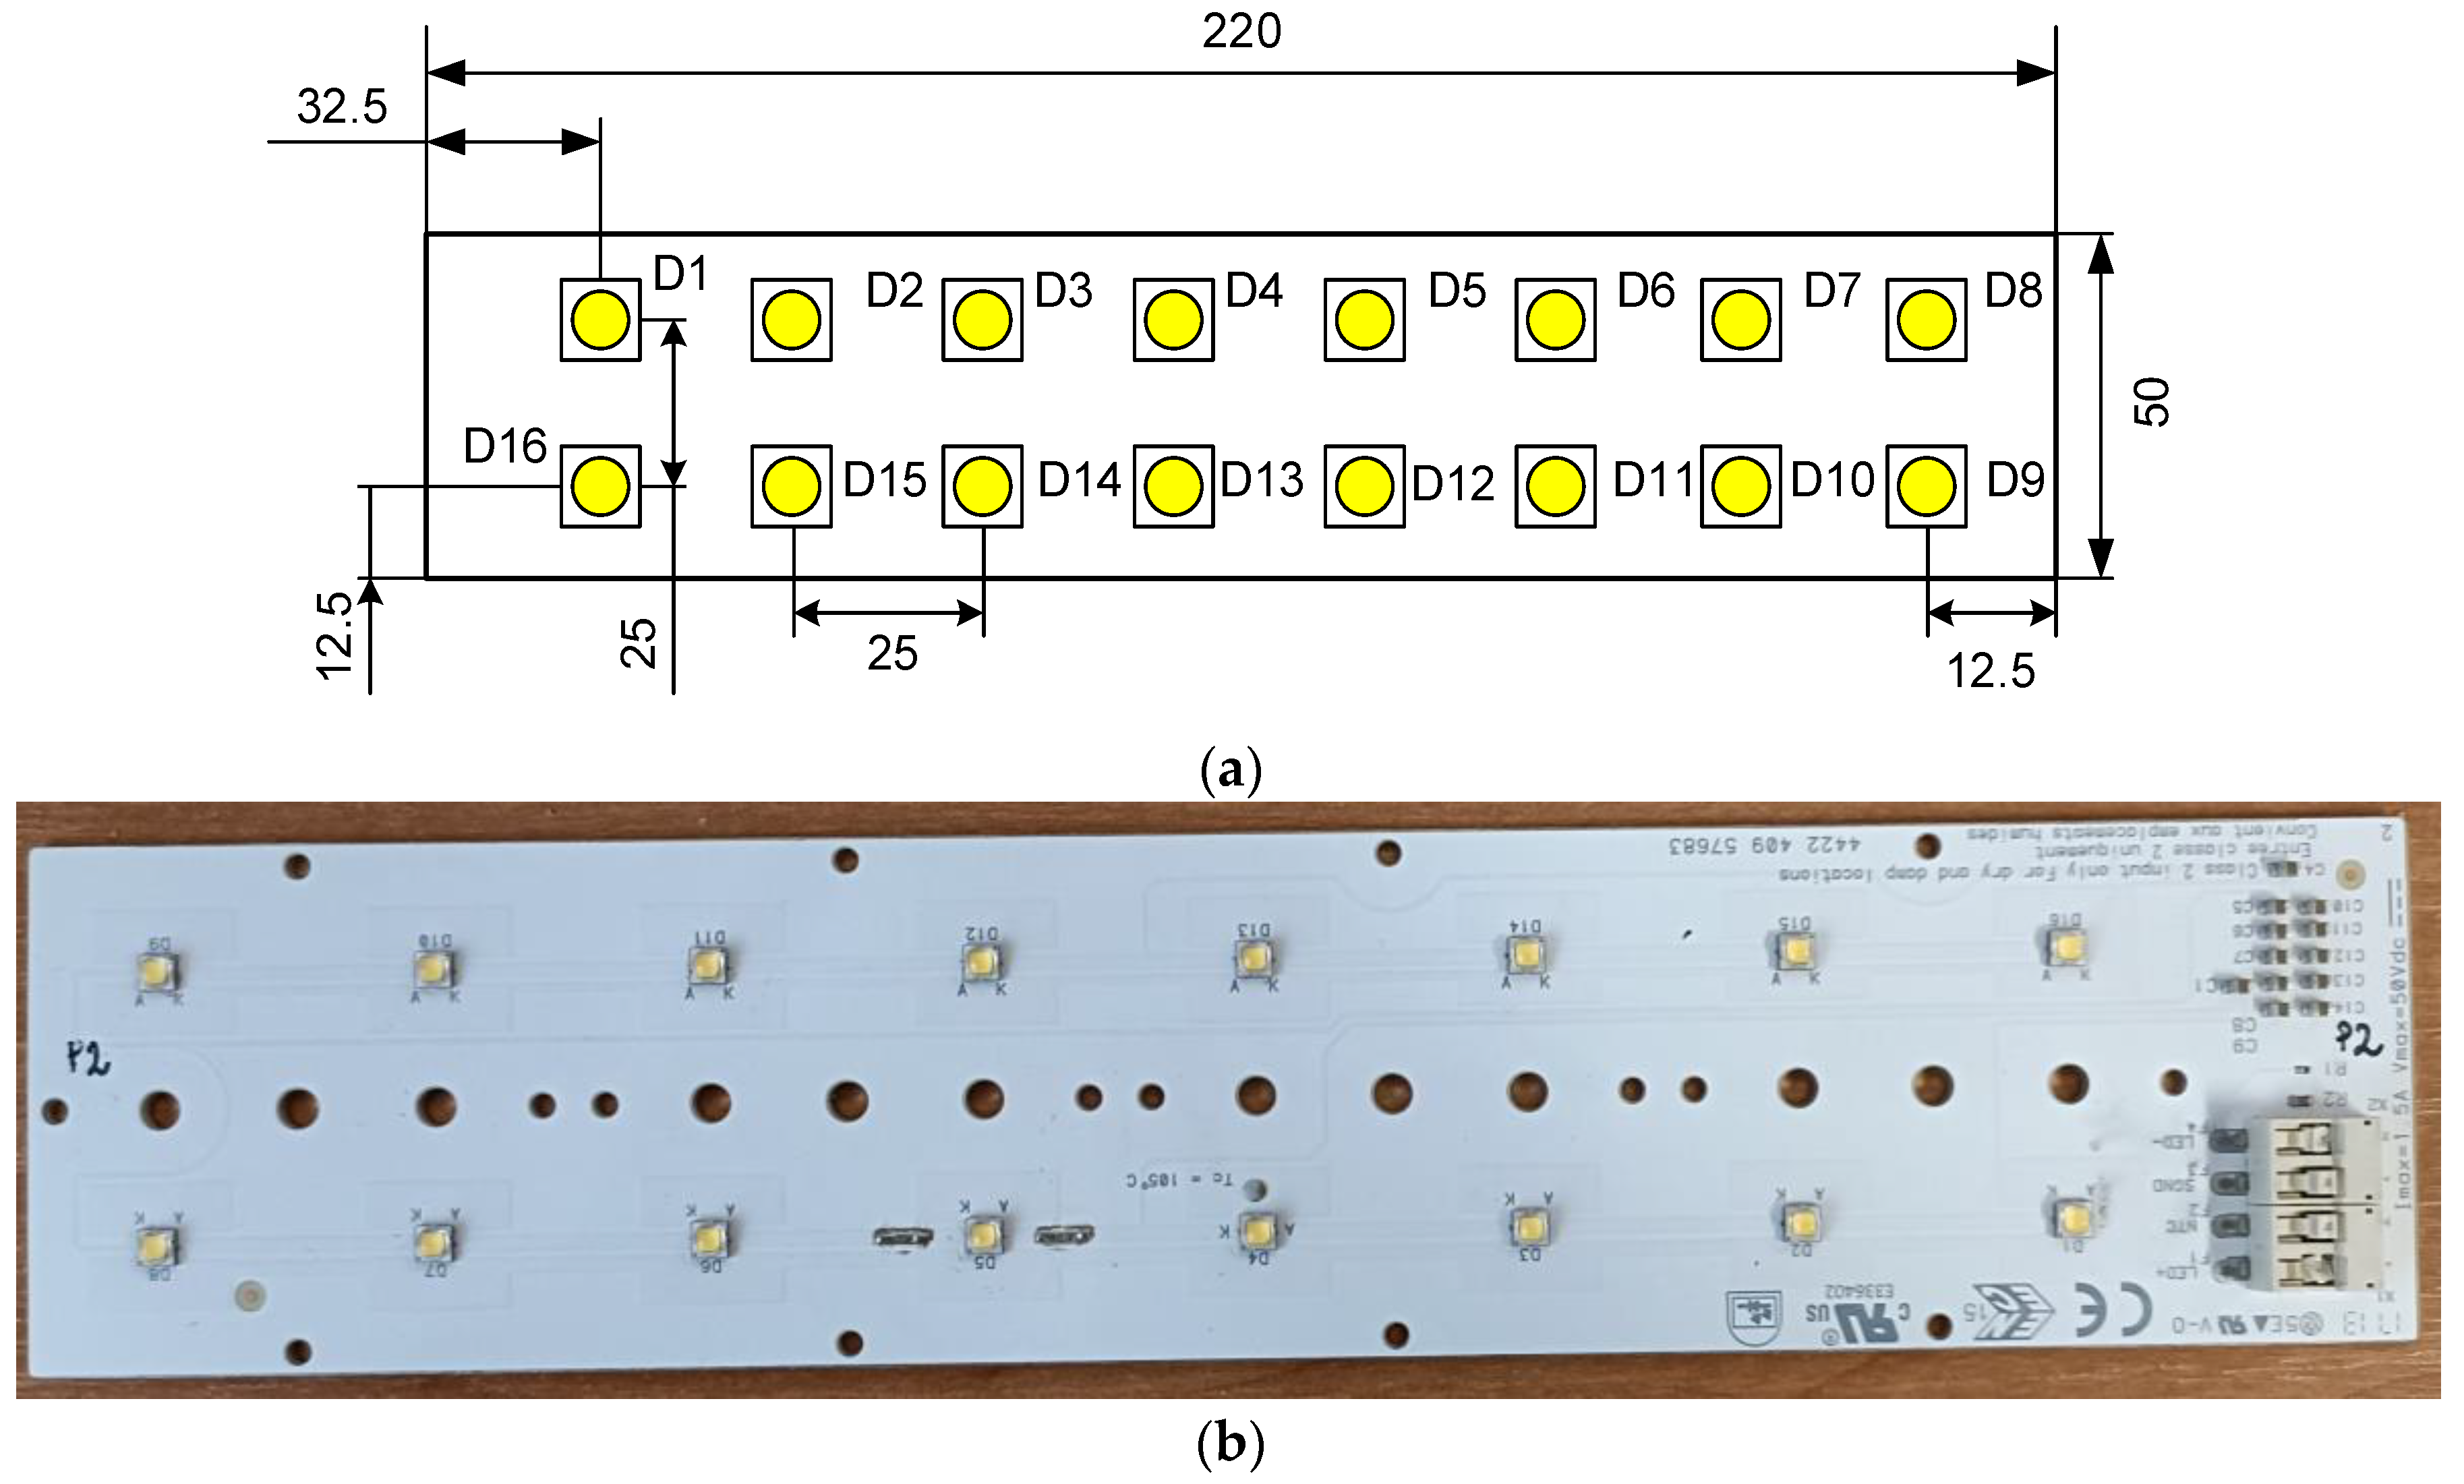
The LED module manufactured by Fideltronik Poland [39] was selected as the research object. This module contains 16 high power LEDs connected in series and mounted on a MCPCB of the dimensions 22.3 cm × 5 cm [40]. Every LED has one thermal pad and two electrical pads. The PCB comprises an aluminum-core base layer, a thin thermally conductive dielectric layer, and a copper-circuit layer of the thicknesses 1.5 mm, 100 μm, and 35 μm, respectively. The LEDs included in the module are soldered with the convection reflow technique [41,42,43,44].
The used power LEDs of the type XPGBWT-H1-CCKP-AFHE5KE40 (by CreeLED, Inc., Durham, NC, USA) are characterized by the maximum admissible forward current IDmax = 1.5A at forward voltage VF = 3.1 V. The value of luminous flux of the light emitted by the considered LED at temperature 25 °C is not lower than 150 lm [40]. Low values of thermal resistance between the junction and the thermal pad Rthj-s = 4 K/W occur. The maximum admissible junction temperature is equal to Tjmax = 150 °C. Figure 1 shows the dimensions of the considered module and the arrangement of the LEDs on its surface.
In the considered module, the LEDs are placed in two rows containing eight devices each. The distance between the rows and the distance between the centres of adjacent LEDs in a row are a = 25.5 mm.
In the description of the developed model, which is presented in Section 3, the distances between individual diodes included in the module under consideration are important. The distance between individual pairs of LEDs is shown in Table 1.
As can be seen in Table 1, in the considered module there are only 16 different values of the distance between the LEDs in the range from zero to . These values are identical for describing the distances between different pairs of LEDs.
3. Model Form
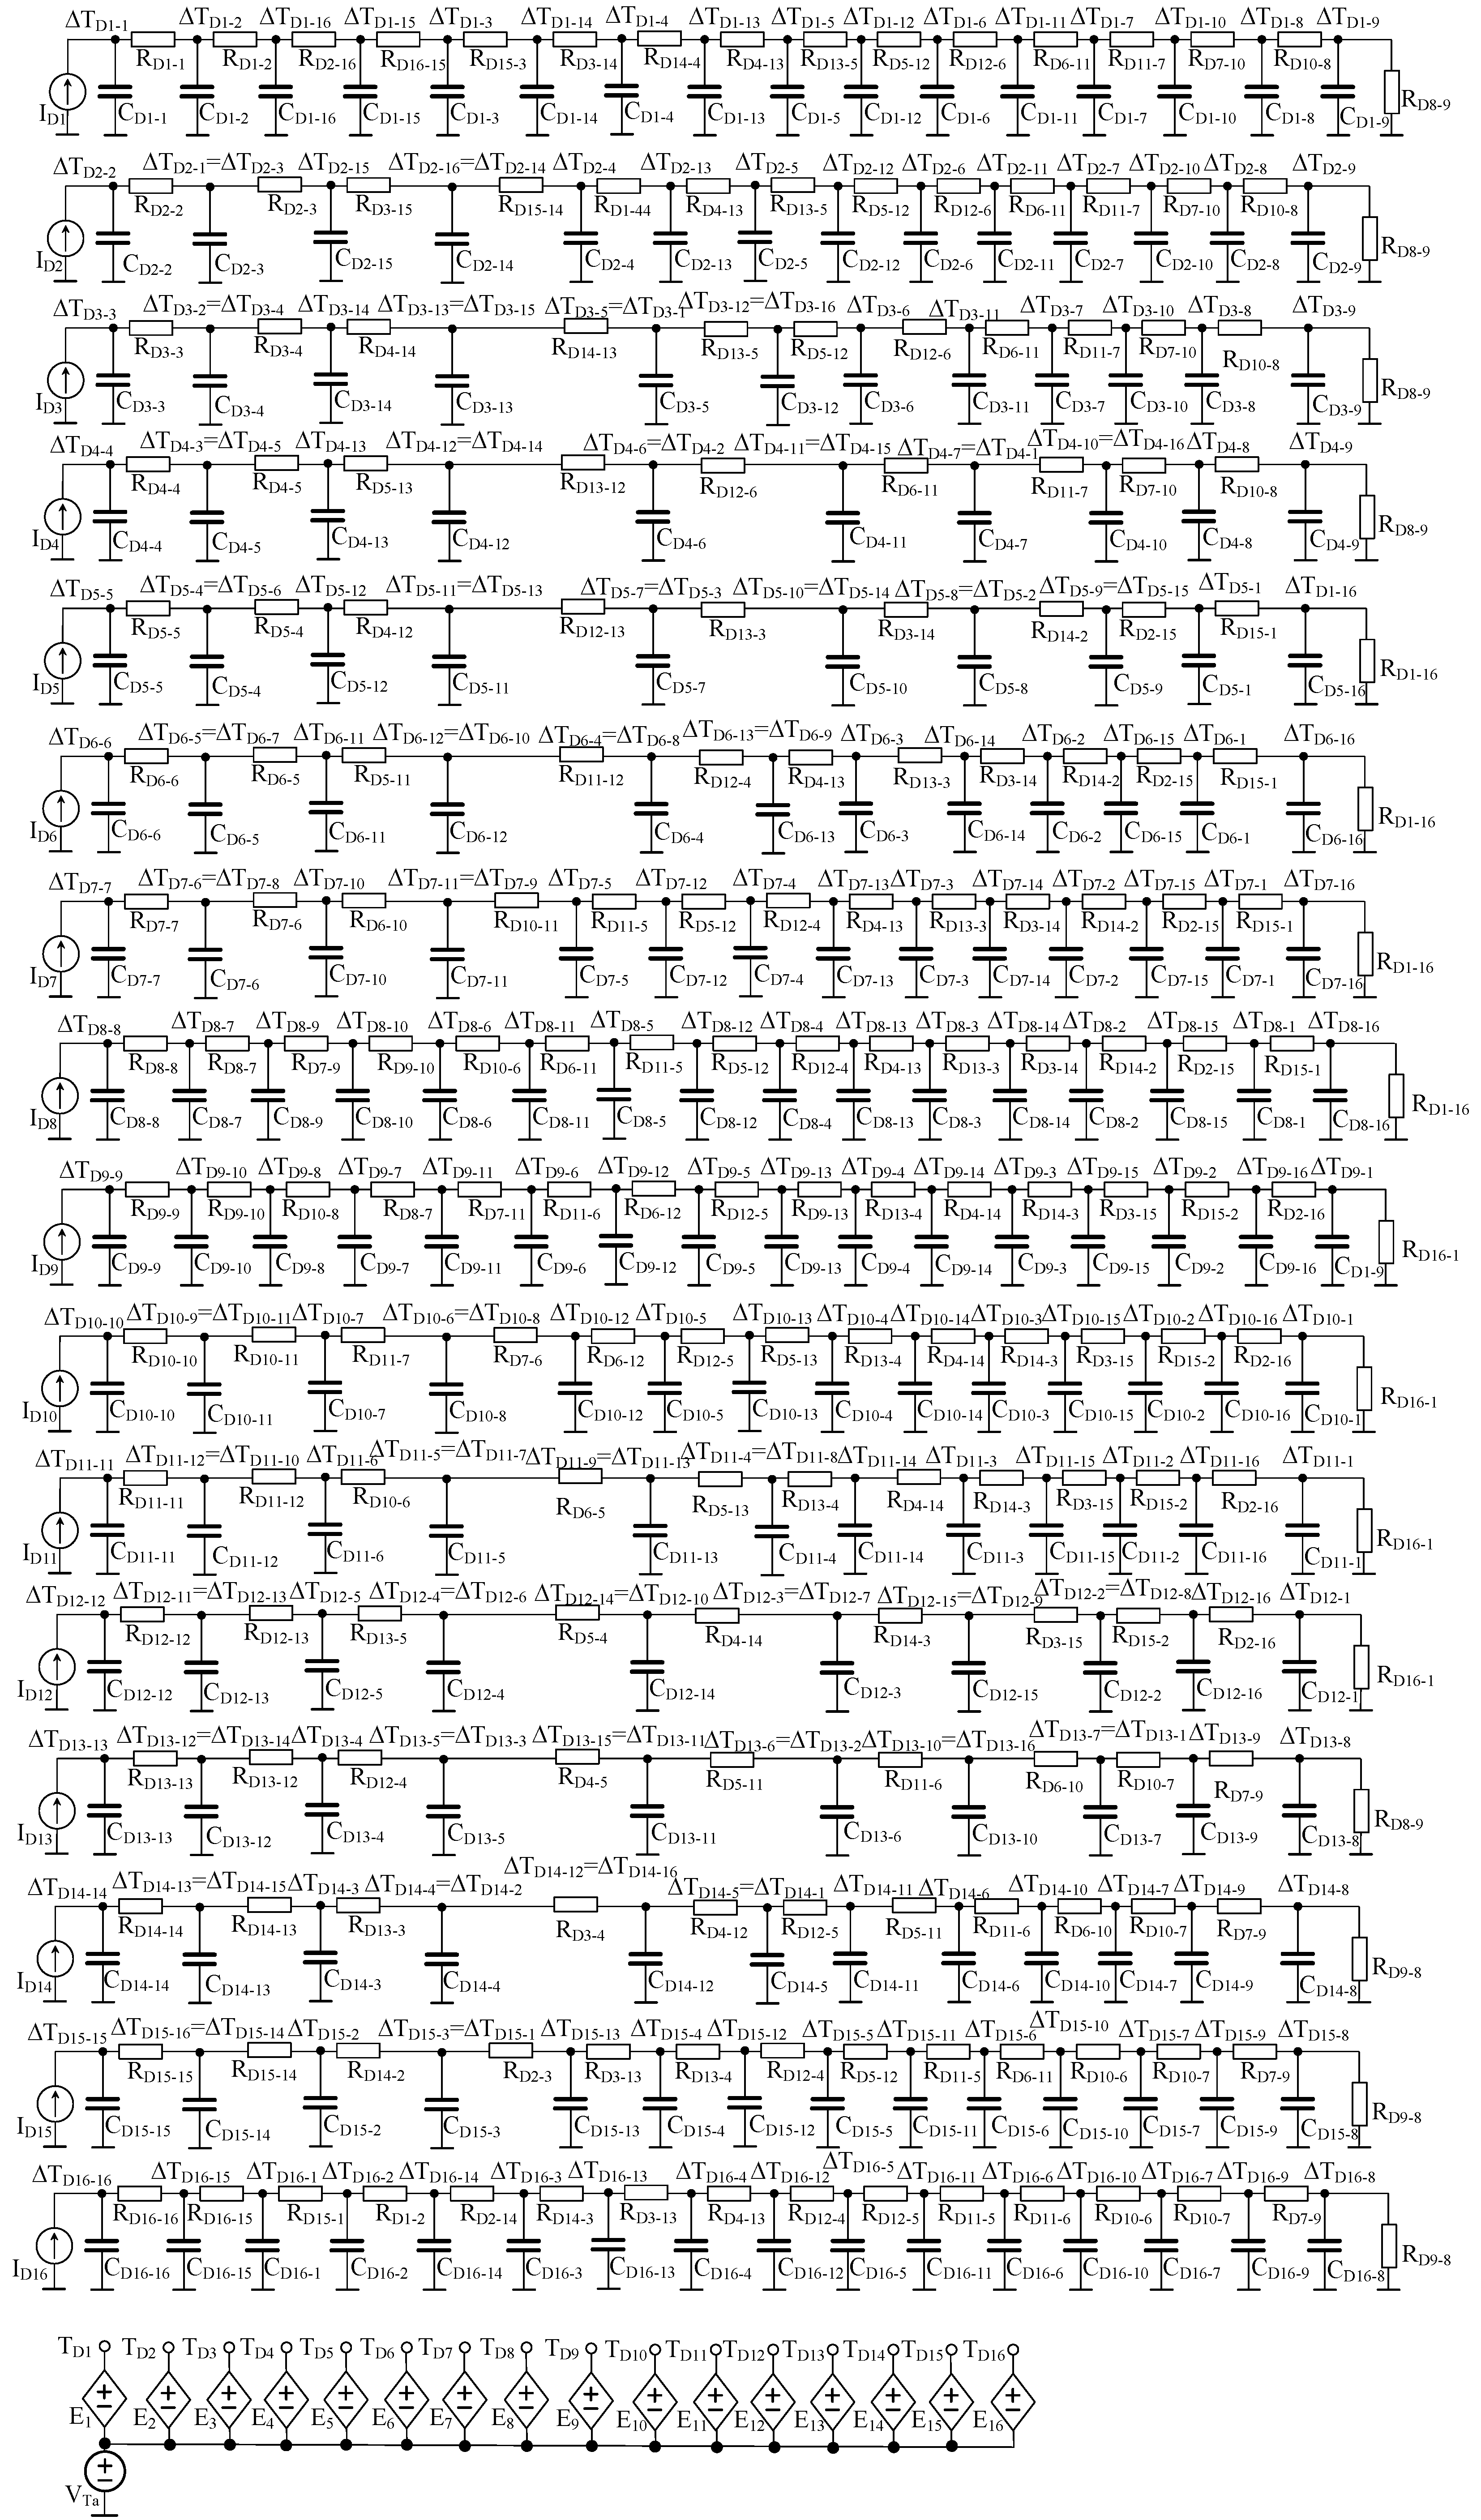
The compact thermal model of the LED module developed by the authors has the form of an electronic network, the diagram of which is shown in Figure 2.
There are 17 subcircuits in this model; 16 of them contain a current source and RC components. They make it possible to calculate the value of a junction temperature increase in each of the LEDs contained in the module caused by the power dissipation in one LED. In each of these subcircuits the current source represents the power dissipated in one of the LEDs contained in the module (sources ID1, ID2,.., ID15, ID16). In turn, the voltages in particular nodes mean an increased ΔTik of the junction temperature of the k-th LED caused by the power dissipation in the i-th LED. Due to the fact that the distances between the pairs of different LEDs may be identical, in some subcircuits, voltages in particular nodes correspond to a temperature increase in two LEDs at the same distance from the heat source.
The RC components model self and transfer transient thermal impedances present in the model. The transfer thermal resistances between individual pairs of LEDs increase with an increase in the distance between them. The same distance between the LEDs corresponds to the same value of transfer thermal resistance. The values of the junction temperature of individual LEDs are calculated using the subcircuit at the bottom of the figure. In this subcircuit, the voltage source VTa represents the ambient temperature, and the individual controlled voltage sources (E1, E2,..., E15, E16) determine an increase in the junction temperature of individual LEDs above the ambient temperature using the formula of the form
For example, the junction temperature increase in LED D1 is given by the formula
Due to the fact that the distances between different pairs of LEDs are identical, the junction temperature increases in LED D1 resulting from mutual thermal couplings are the same. In the case of LED D1, its distances from diodes D2 and D16 are the same, therefore ΔTD1–2 = ΔTD16–1. For LEDs located closer to the center of the module, there will be more pairs of diodes placed at the same distance from the tested diode.
The structure of individual subcircuits containing RC components corresponds to the classical Cauer model used to model thermal properties of discrete semiconductor devices [14,45,46]. However, in the presented model, individual nodes correspond to individual LEDs contained in the module, and not to structural components of the heat flow path. When formulating this model, it was assumed that heat conduction in the module (between individual LEDs) is responsible for the heat flow, and this flow is isotropic.
This means that a junction temperature increase in LED Di due to the dissipation of power pk in LED Dk is the same as a temperature increase in LED Dk due to the dissipation of power pi of the same value in LED Di. In addition, a junction temperature increase in LEDs at the same distance from the heat source, caused only by this source, is the same.
Due to the symmetry of the considered module, in order to describe its thermal properties, it is necessary to determine the values of RC components occurring only in four subcircuits visible in the upper part of Figure 2, i.e., 52 thermal resistances and 52 thermal capacitances. For comparison, the model from [38] uses 128 self or transfer thermal transient impedances, each of which is described using at least five thermal time constants. This means that for the application of the model from the cited paper, it is required to determine at least 640 thermal resistances and 640 thermal capacitances. Meanwhile, the new model requires 12 times fewer parameters than the literature model. The method of estimating the parameters of the new model is described in the next section.
4. Estimation Model Parameters Values
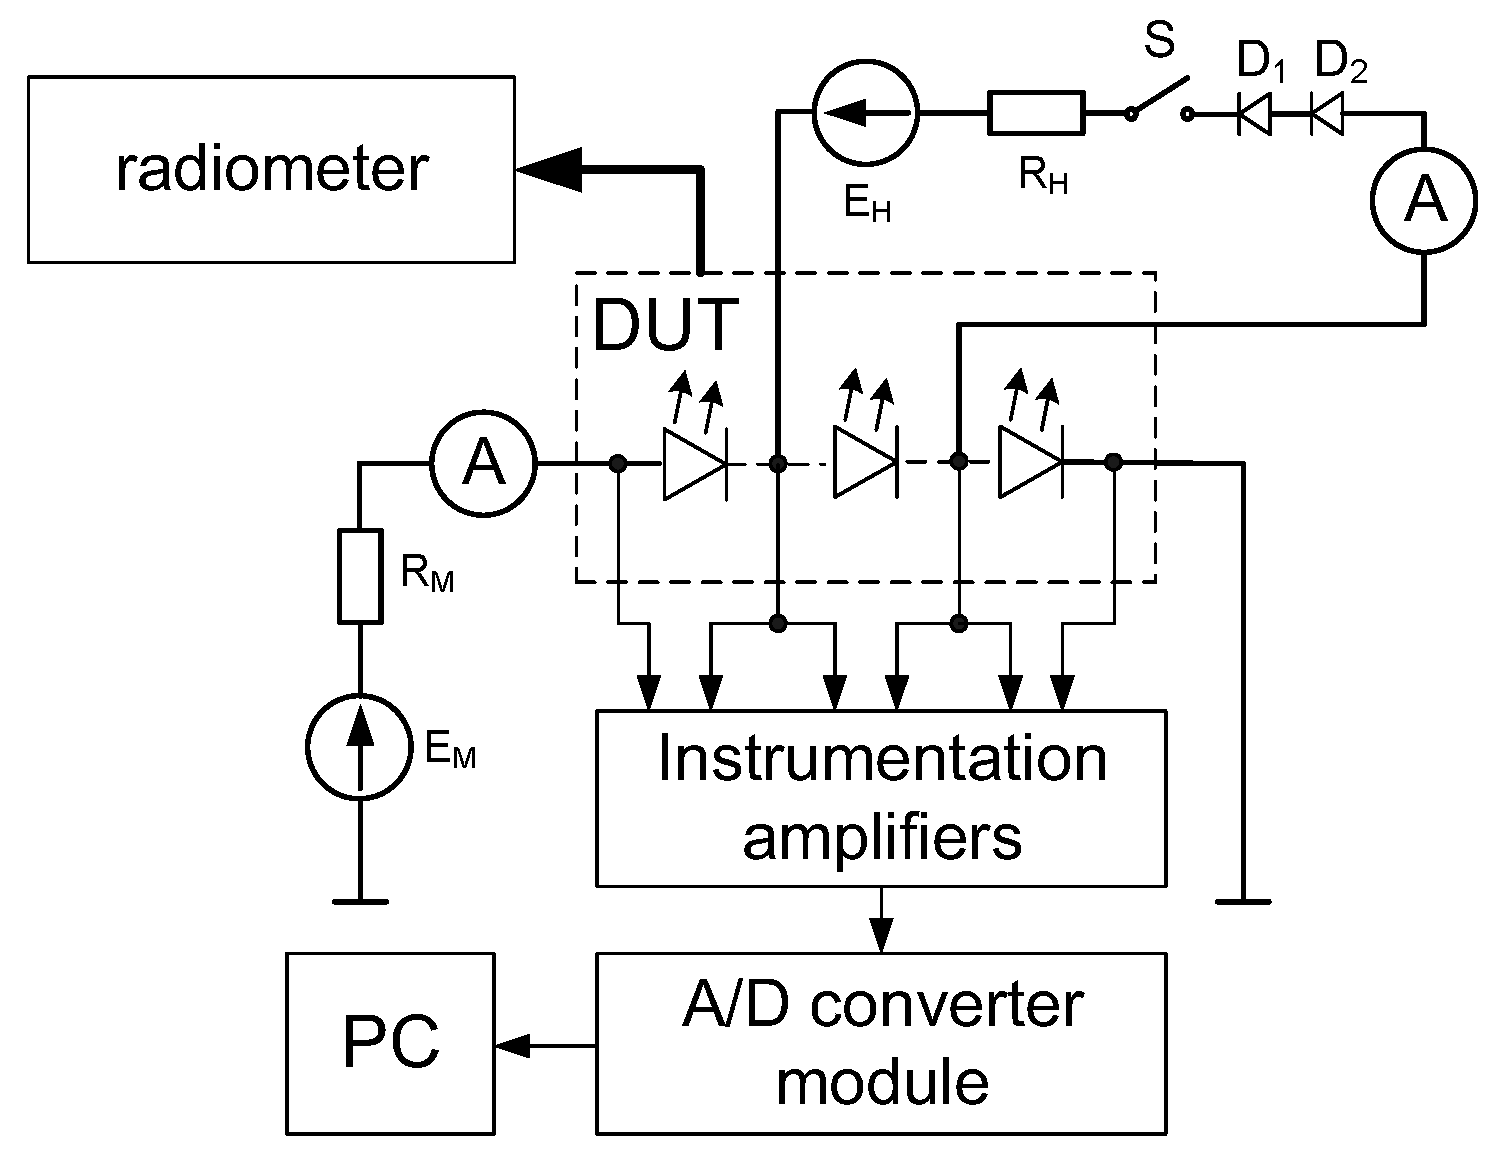
In order to estimate values of the parameters of the compact thermal model described in Section 3, it is necessary to perform the appropriate measurements and calculations. Self-transient thermal impedances Zthi(t) of individual LEDs (acting as heating devices) contained in the module are measured using the indirect electrical method described, among others, in the paper [47]. Simultaneously with the measurement of Zthi(t) of the individual LEDs contained in the tested module, the waveforms of the junction temperature of the other LEDs (acting as temperature sensors) contained in this module are measured. On the basis of the obtained results of temperature measurements of individual sensors, transfer transient thermal impedances between the heating device and each of the sensors are determined. Thanks to such a solution, the waveforms of the heating device’s self-transient thermal impedance and transfer transient thermal impedances between the heating device and each of the sensors are determined in one measurement. The measurement is performed in the measuring system presented in the diagram shown in Figure 3.
In the measurement method used, self and transfer transient thermal impedances are measured in accordance with the definition of these parameters given, among others, in [16,47]. The junction temperature in this definition is measured indirectly using the calibrated dependence of the voltage across the LED forward biased on temperature vD(T) called the thermometric characteristic.
The measurement is performed in three stages. The first stage is the measurement of the thermometric characteristics of each LED contained in the tested module. At this stage, switch S is open and all the LEDs connected in series cause the flow of the measuring current of a low value IM. The tested module is located in a thermostat, whose temperature is regulated. At each of the set temperature values, voltage on each of the tested LEDs is measured.
In the second stage of the measurement, switch S is closed and current IH flows through the heating device, the value of which depends on the efficiency of the voltage source EH and resistance of resistor RH. Due to the phenomenon of self-heating, the junction temperature of the heating LED increases until a steady state is reached. At the same time, as a result of mutual thermal couplings, the junction temperature of the other LEDs increases. After obtaining the steady state, the forward voltage of the heating device VDH, current IH, and the power density of the emitted radiation Φe are measured. Based on the Φe value measured with a radiometer and the catalog information on the spatial radiation patterns, the value of the optical power Popt is determined.
The third stage of the measurement begins at t = 0, when switch S opens and all the LEDs are forward biased by current IM. Then, the junction temperature of each LED decreases, causing an increase in the forward voltage of each LED, and the time courses of these voltages are recorded by means of an analog-to-digital converter and a computer (PC) until the steady state is reached. Finally, based on the recorded forward voltage time courses, measured thermometric characteristics and the values of voltage VDH, current IH, and power Popt, the time courses of self Zthi(t) and transfer Zthi-k(t) of the transient thermal impedances occurring in the presented model are calculated based on the equations given in [47].
where Ta is the ambient temperature, Pi—power supply of Di.
In order to determine values of the RC components contained in one subcircuit shown in Figure 2, the measured waveforms of mutual transient thermal impedances between this heat source and subsequent sensors should be successively subtracted from the course of the self-transient thermal impedance of the heat source, starting from the sensor located closest to this heat source. The obtained differential transient thermal impedances are approximated by the classic formula of the form
where Rthi-k is mutual thermal resistance between LED Di and LED Dk, and Cthi-k is thermal capacitance of LED Dk.
5. Investigations Results
In order to verify the correctness of the developed model, calculations and measurements of time courses of self and transfer transient thermal impedances in the module under consideration, as well as time courses of the junction temperature of individual LEDs contained in the tested module under different conditions of power dissipation in it, were carried out. The obtained results of measurements and calculations were compared for different conditions of power dissipation in LEDs contained in the tested module. In the figures presented below (Figure 4, Figure 5, Figure 6 and Figure 7), solid lines indicate the measurements results, and dashed lines—the calculations results. All the measurements results presented in this section were performed using the set-up of the diagram shown in Figure 3.
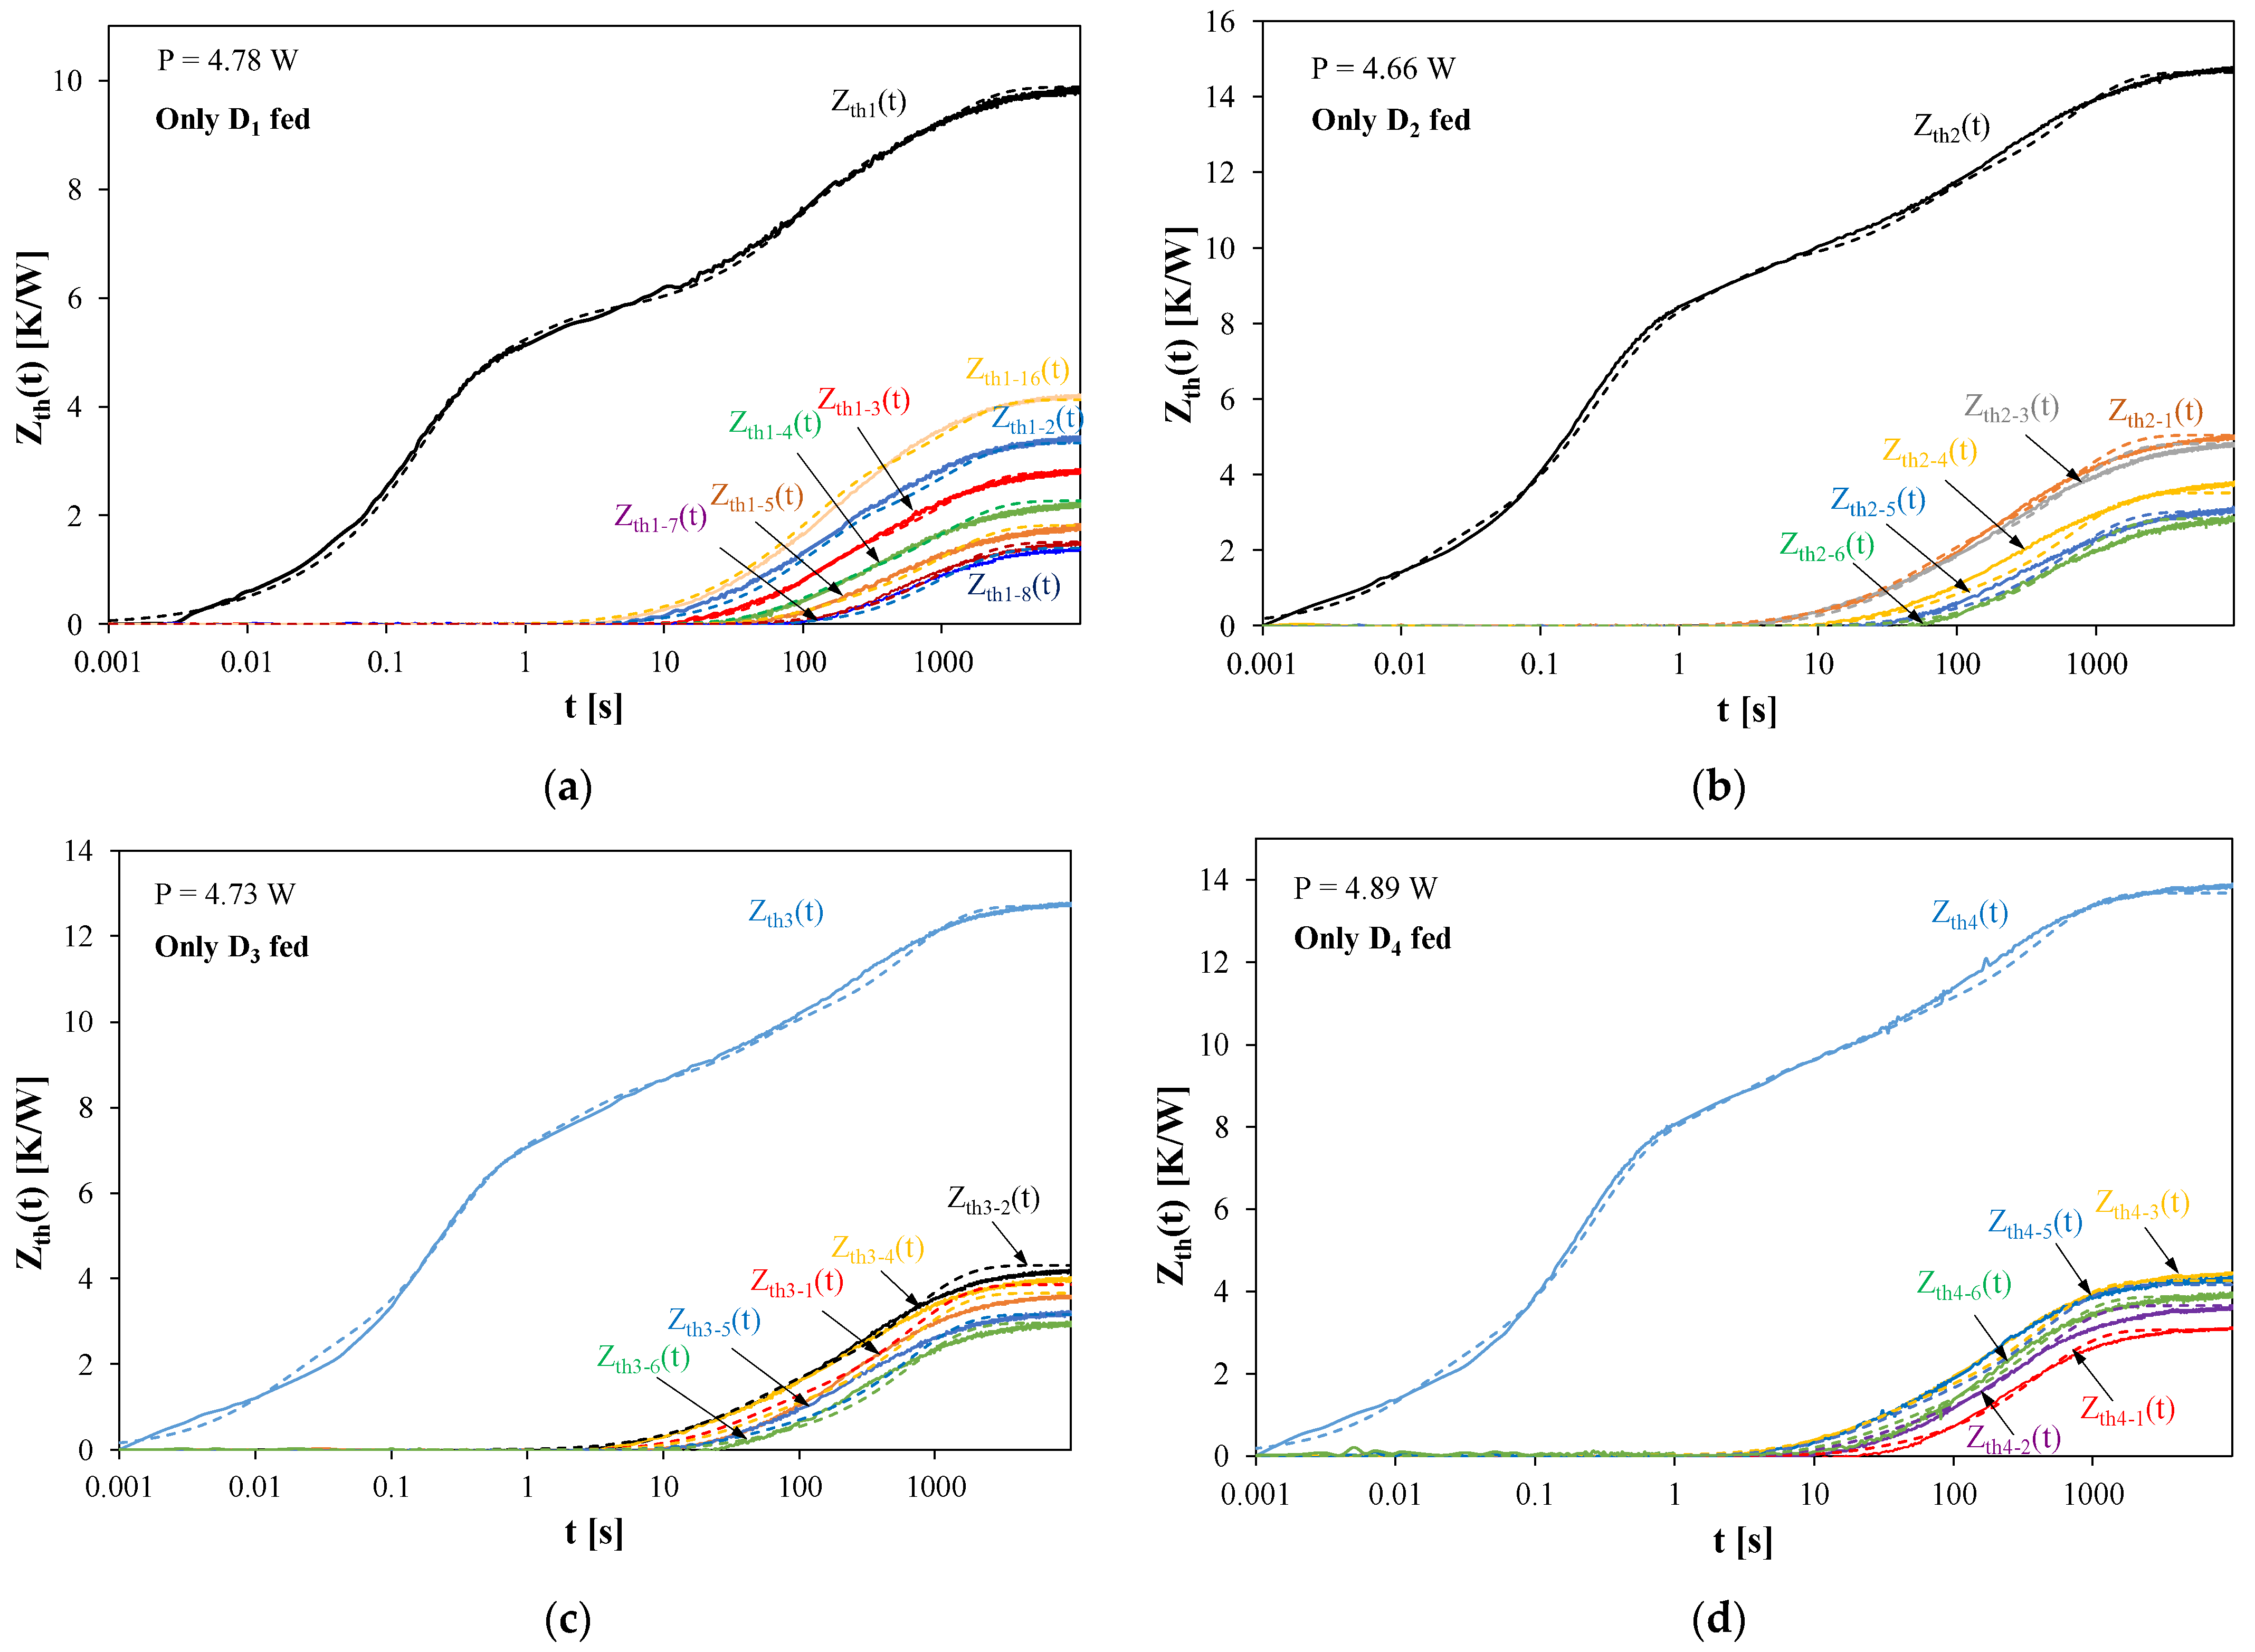
Figure 4 shows the waveforms of self and transfer transient thermal impedances between selected LEDs included in the tested module. In each of the examples presented in particular figures, the power is dissipated only in one LED: D1 (Figure 4a), D2 (Figure 4b), D3 (Figure 4c), and D4 (Figure 4d).
As is visible, in all the considered cases a good agreement between the measured and modeled waveforms is obtained. It is worth noting that the values of self-transient thermal impedances are always higher than transfer transient thermal impedances. In addition, the transfer transient thermal impedances between the LEDs decrease as the distance between the LEDs increases. In the steady state, the eigenvalues of transient thermal impedances are even seven times higher than mutual transient thermal impedances. It is also worth noting that the values of mutual transient thermal impedances may differ even twice (e.g., Zth1–16(t) and Zth1–8(t) in Figure 4a).
Comparing the waveforms of self-transient thermal impedances obtained for individual LEDs, it can be seen that they differ significantly, even by 30%. The lowest values of this parameter were obtained for D2, and the highest for D3. These differences may be caused by both imperfections in the assembly of D3 and the differences in the heat dissipation efficiency caused by different locations of the considered LEDs relative to the edge of the MCPCB. Regardless of the cause of these differences, they can be correctly described by the proposed thermal model.
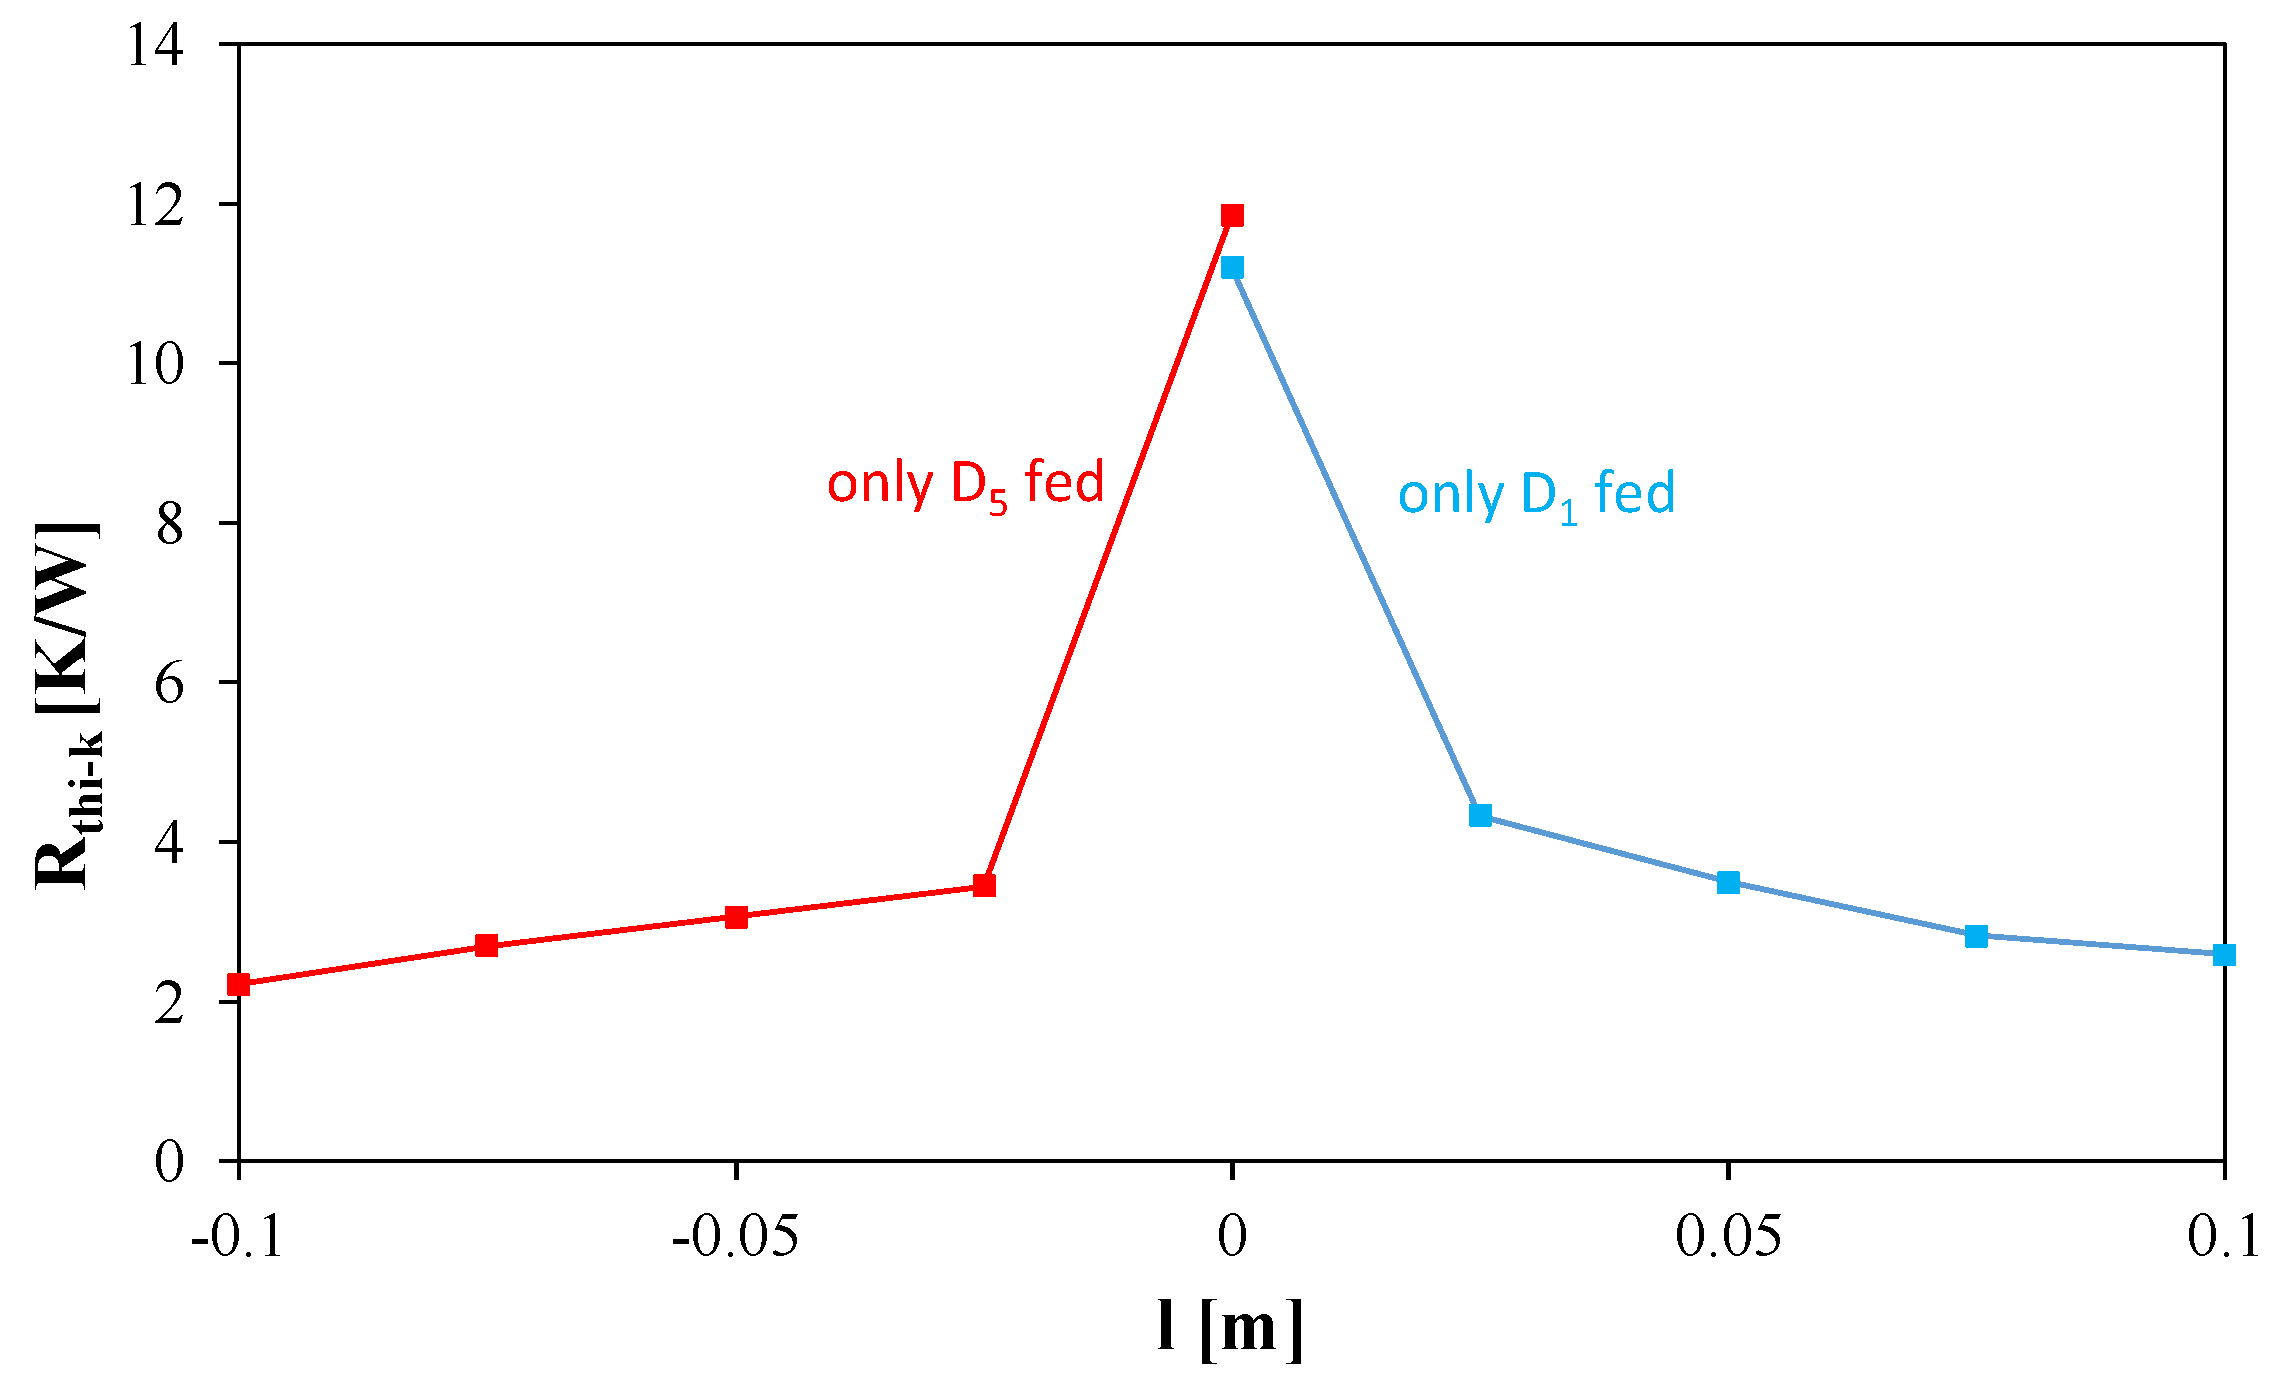
Figure 5 shows the dependences of self and mutual thermal resistances Rth in the considered module on the distance l from the heat source, measured and obtained using the model.
As can be seen, the presented relations Rthi-k(l) are even functions. For each of the considered heat sources, the highest Rthi-k values were obtained in the heat source (l = 0). While the thermal resistance values for l = 0 strongly depend on which LED is the heat source, transfer thermal resistances (for l ≠ 0) are a decreasing function of the distance from the heat source and practically do not depend on the choice of the heat source. With an increase in the distance of the LED from the heat source in the range of 25 to 100 mm, the value of the transfer thermal resistance decreases from 3.5 K/W to only 2.6 K/W. This relationship is correctly described in the proposed thermal model.
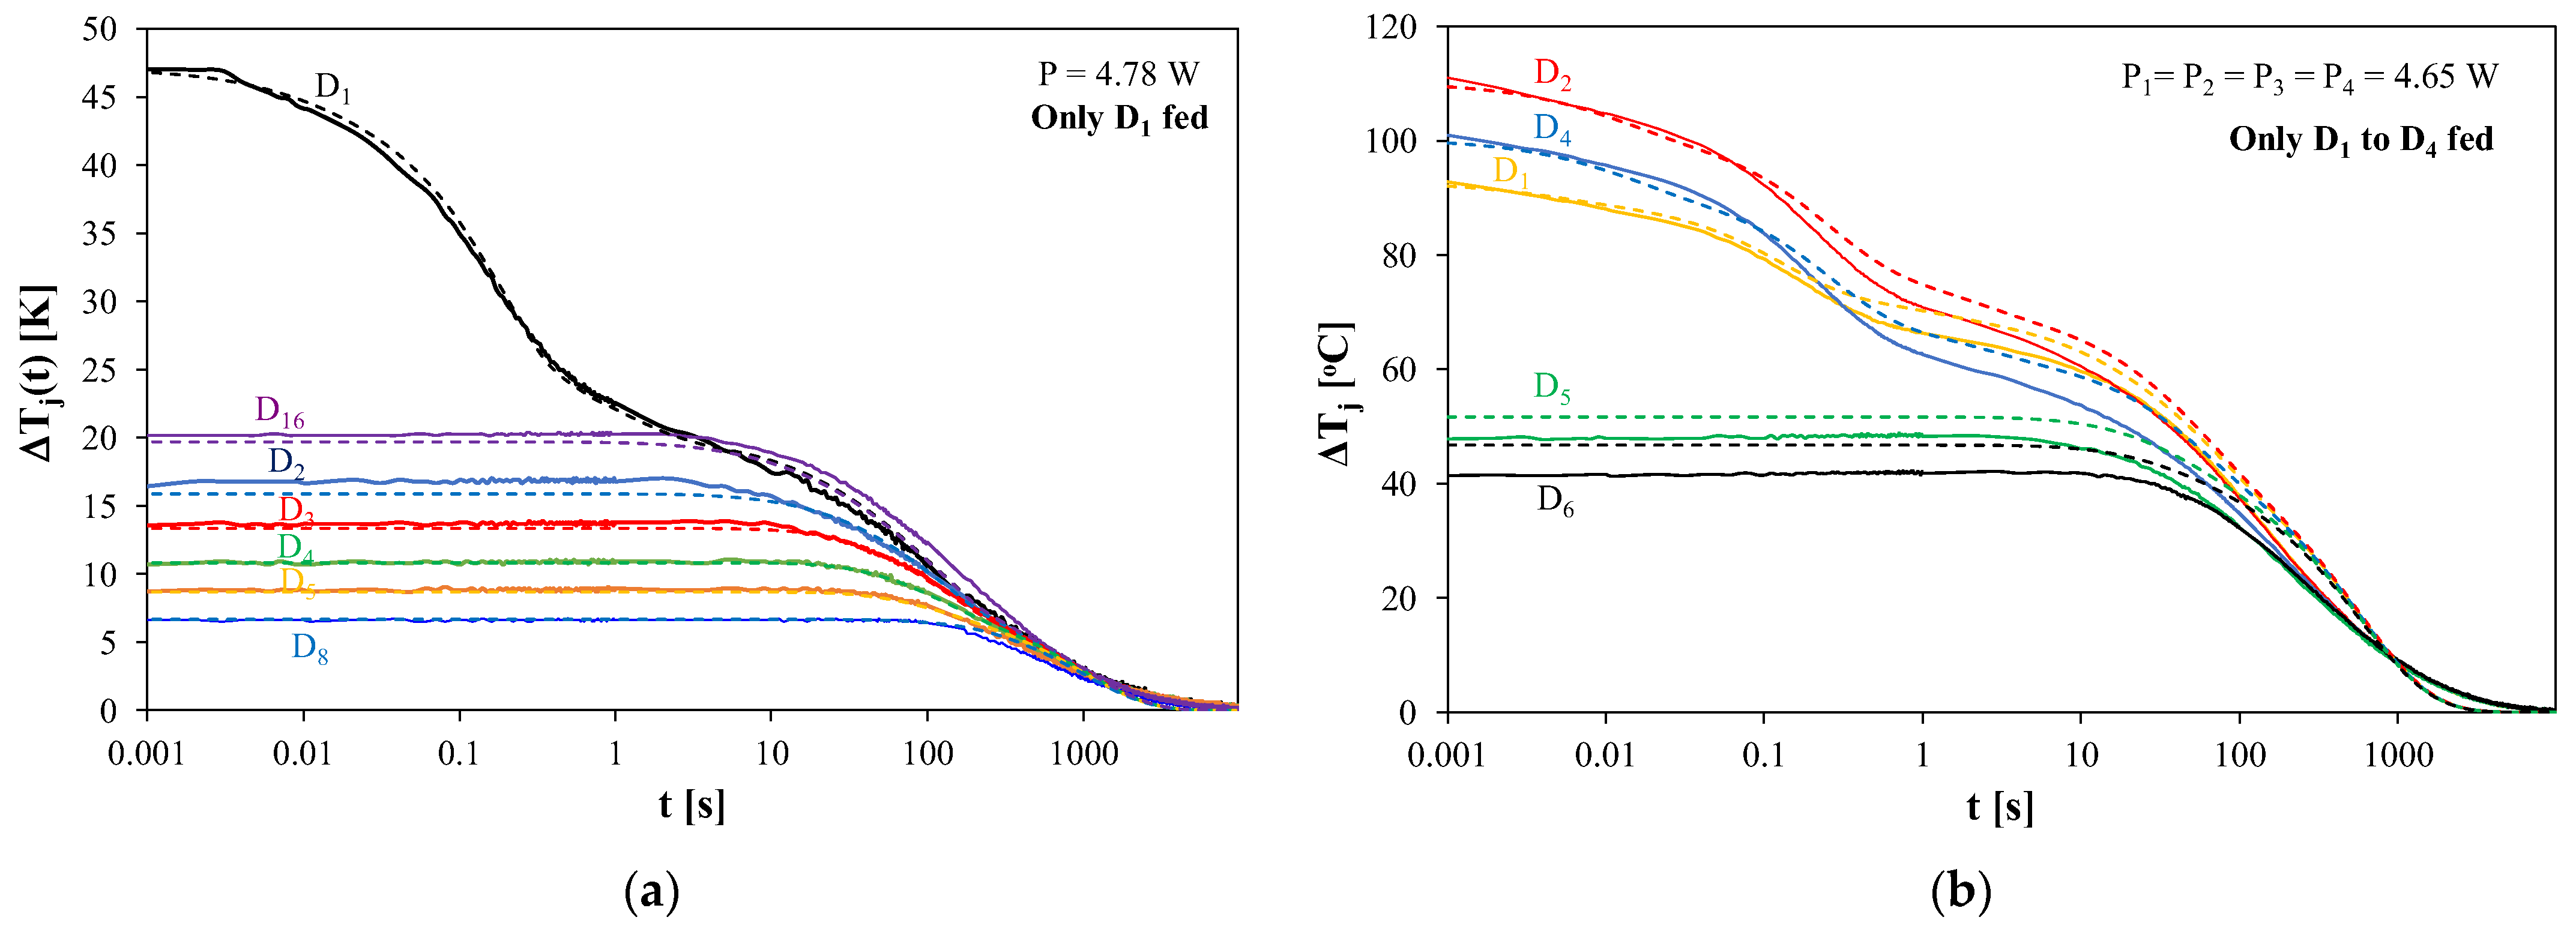
Figure 6 shows the measured and calculated waveforms of the junction temperatures of selected LEDs included in the considered module during its cooling. Before the cooling process, the module was in the steady state. In the case shown in Figure 6a, before the start of cooling, the power of 4.8 W was released only in D1, and in the case presented in Figure 6b, in each of LEDs D1–D4 the power of approximately 4.65 W was simultaneously released.
It can be seen that the junction temperature of LED D1, in which the power is dissipated, is much higher (even by 25 °C) than the junction temperature of the other LEDs. This indicates that in the steady state there is a strongly non-uniform temperature distribution in the module. The differences between the junction temperatures of individual LEDs disappear only after a few hundred seconds from the moment of turning off the power.
In Figure 6b, a large variation in the value of the junction temperature of LEDs D1–D4 can be observed, which at the moment t = 0 reaches even 20 °C. Due to the fact that in each of the tested LEDs the power of a similar value is lost, the observed temperature differences are mainly the effect of the differences in the thermal resistance values of individual LEDs. Hence, the highest value of the junction temperature was obtained for LED D2, and the lowest for LED D1. The junction temperatures of devices D5 and D6 before the start of cooling are much lower than for devices D1–D4 and they range from 40 to 50 °C. The discrepancies between the results of calculations and measurements are small and do not exceed 5 °C.
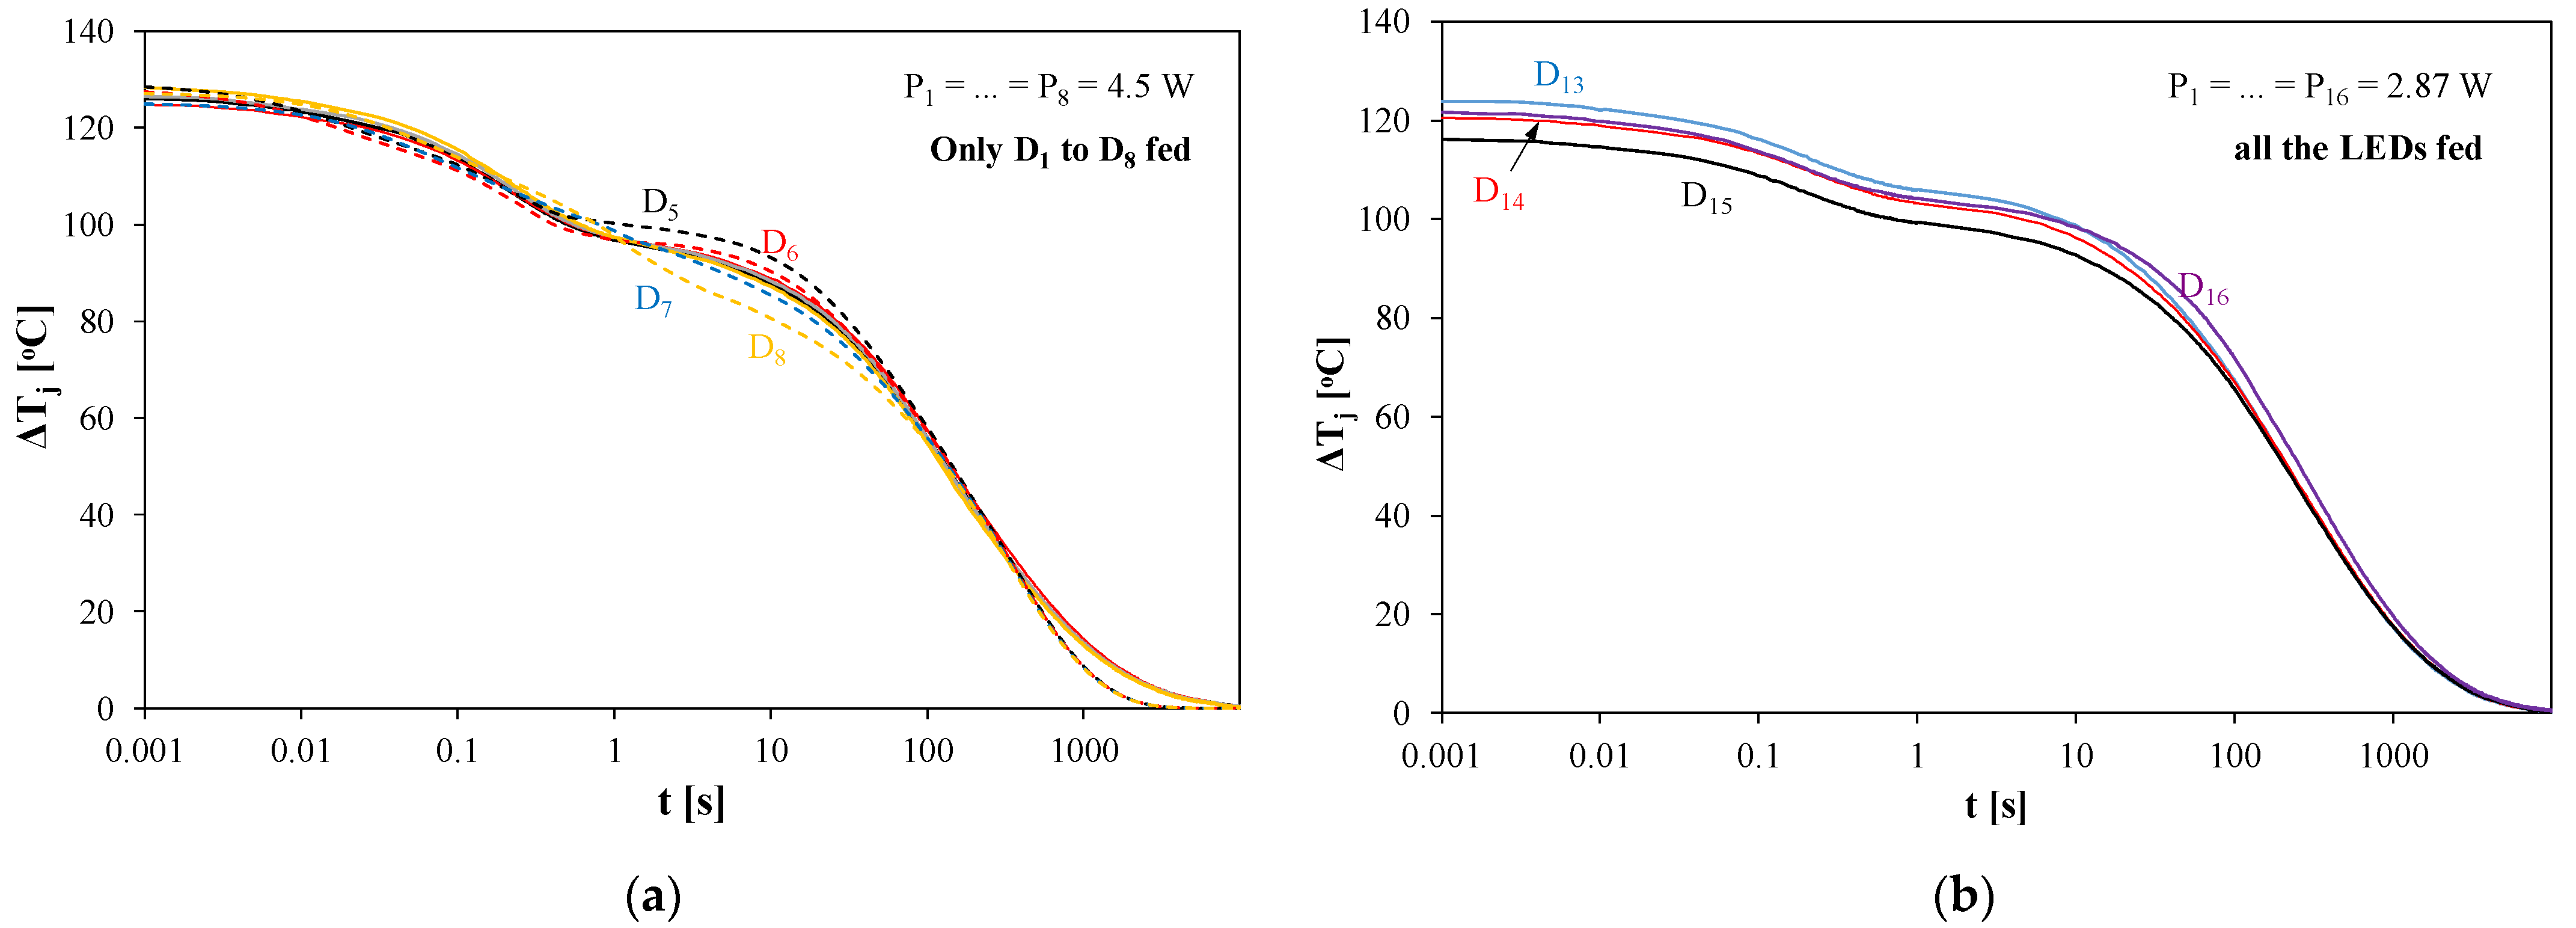
In turn, Figure 7a shows the calculated and measured waveforms of the junction temperature of the diodes while cooling the module after the power equal to about 4.5 W was dissipated in each of LEDs D1–D8 contained in the tested module, and Figure 7b shows the results for the power equal to 2.87 W in each of all the LEDs contained in the module.
Figure 7a shows a practically uniform temperature distribution in the area, where devices D5, D6, D7, and D8 are placed. The differences in the junction temperature of these LEDs do not exceed 3 °C. In the case shown in Figure 7b, it can be seen that the temperature differences between the adjacent LEDs when powering all the LEDs contained in the module reach 10 °C. It is worth noting that despite a low value of the power lost in each of the LEDs, their junction temperature exceeds as much as 120 °C due to mutual thermal couplings between the LEDs.
As is visible in Figure 4, Figure 5, Figure 6 and Figure 7, the obtained results of calculations fit very well the results of measurements. The good agreement between the obtained results corresponding to a different manner of power dissipation in the module proves the correctness of the proposed thermal model.
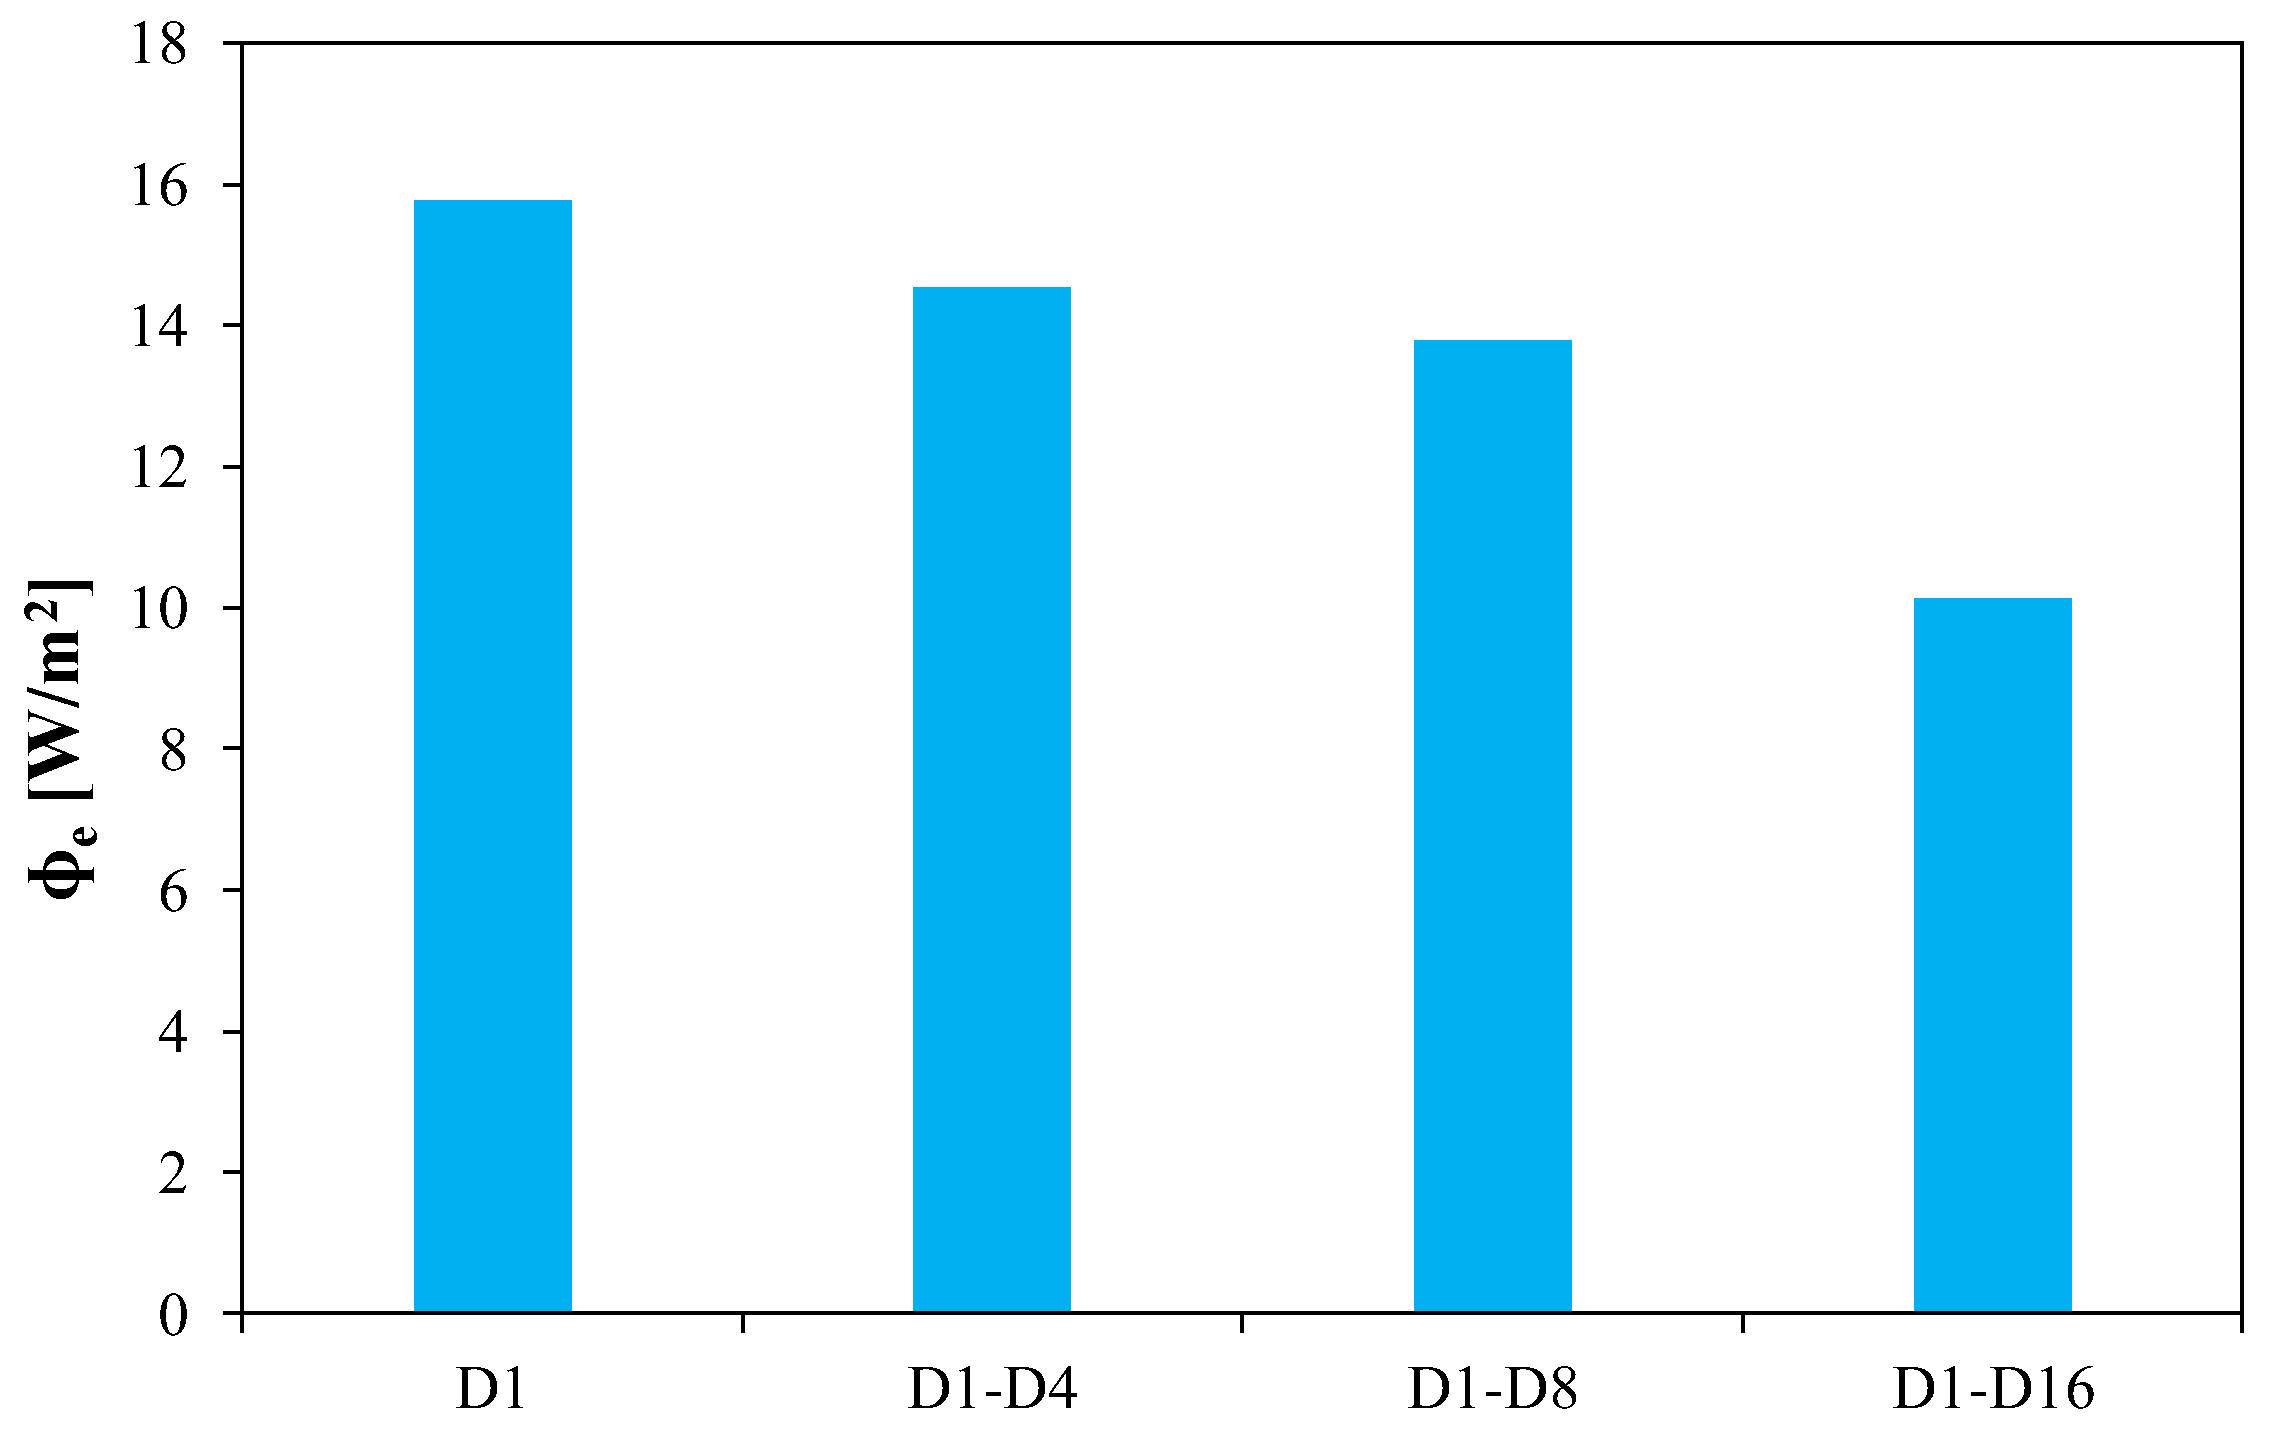
Changes in the value of the junction temperature of LEDs cause changes in the irradiance. Figure 8 shows the values of irradiance of LED D1 with the current flow of 1.5 A through a different number of LEDs.
As can be seen, with an increase in the number of LEDs that are simultaneously fed, the irradiance of D1 decreases. This is the effect of mutual thermal coupling between the LEDs. This causes an increase in the junction temperature of the considered LED, resulting in a decrease in the emitted optical power.
6. Conclusions
The paper proposes a new compact thermal model of a large LED module. This model makes it possible to calculate the junction temperature of each of the LEDs contained in this module, taking into account the phenomenon of self-heating and mutual thermal couplings between these devices.
The developed model has a much simpler form than the analogous thermal models described in the literature. This model was verified experimentally for a LED module with the area of about 100 cm2, containing 16 LEDs. In this case, the new model contains only 17 subcircuits instead of 256 subcircuits found in the classic literature models. Such a significant reduction in the number of circuit components did not deteriorate the accuracy of the model. A good agreement was obtained between the calculated and measured time courses of the junction temperature of the LEDs contained in the considered module for various variants of power dissipation in the considered module. At the same time, a time–spatial temperature distribution was obtained in the considered module in the form of the time courses of the junction temperature of each of the LEDs contained in this module.
It was also shown that mutual thermal resistances between the LEDs decrease with an increase in the distance between them. The values of self and transfer thermal resistances depend both on the location of the LEDs on the surface of the module and their distance from the edge of the MCPCB.
The presented method of formulating a thermal model can be used in the development of compact thermal models of electronic systems containing many components. An important advantage of the developed model is a simple and fast way to estimate the values of its parameters, which allows for the measuring of all the elements present in one subcircuit within one measurement process. This results in a significant reduction in the time necessary to estimate the parameter values.
It is worth noting that in the tested LED module, there is a non-uniform temperature distribution both in the case when the power dissipated in the individual LEDs differs significantly, and in the case when the power dissipated in all the LEDs is of a similar value. The temperature differences between the LEDs reach up to 30 °C.
The new compact thermal model presented in this paper may be useful in describing properties of electronic systems with different topologies, made in different technologies, and containing different electronic components. Such a model will contain such a number of branches visible in Figure 2 as the number of the components in which the power is dissipated. The values of each resistor and capacitor occurring in this model depend on the distances between each pair of such components and thermal properties of the used PCB and the cooling system. The formulation of such a model is not complicated, and the estimation of parameter values is fast. The developed model was prepared in a form dedicated to the SPICE program, but it can also be used in other programming environments or in other programs for the analysis of electronic circuits. Its limitation is a possibility to calculate only the junction temperatures of electronic components. Nevertheless, it is impossible to calculate the values of temperature in the points of the module.
The proposed model is verified at free cooling of the tested module only. In the future, the validation of this model for the module cooperation with selected systems of forced cooling will be performed.
Author Contributions
Conceptualization, K.G. and P.P.; methodology, K.G. and P.P.; investigation, P.P. and K.G.; writing—original draft preparation, K.G. and P.P.; writing—review and editing, K.G. and P.P.; visualization, K.G. and P.P.; supervision, K.G. All authors have read and agreed to the published version of the manuscript.
Funding
Project financed in the framework of the program by Ministry of Science and Higher Education called “Regionalna Inicjatywa Doskonałości” in the years 2019–2023, project number 006/RID/2018/19, the sum of financing 11,870,000 PLN.
Data Availability Statement
Data available for request.
Conflicts of Interest
The authors declares no conflict of interest.
Nomenclature
| Cthi-k | Thermal capacitance of the diode Dk |
| LED | Light-emitting diode |
| l | Distance between the heat source and the heat sensor |
| MCPCB | Metal core printed circuit board |
| Pi | Power supply of diode Di |
| Popt | Optical power |
| Rthi-k | Mutual thermal resistance between diodes Di and Dk |
| Ta | Ambient temperature |
| Tji | Junction temperature of diode Di |
| Zthi(t) | Self-transient thermal impedances of diode Di |
| Zthi-k(t) | Mutual transient thermal impedance between diodes Di and Dk |
| ΔTDi | An increase in the junction temperature of diode Di above the ambient temperature |
| ΔTDik | An increase in the junction temperature of diode Dk above the ambient temperature caused by power dissipation in diode Di |
| Φe | Power density of the emitted radiation |
References
- Schubert, E.F. Light Emitting Diodes, 2nd ed.; Cambridge University Press: New York, NY, USA, 2008. [Google Scholar]
- Lasance, C.J.M.; Poppe, A. Thermal Management for LED Applications; Springer Science & Business Media: New York, NY, USA, 2014. [Google Scholar]
- Di Napoli, F.; Magnani, A.; Coppola, M.; Guerriero, P.; D’Alessandro, V.; Codecasa, L.; Tricoli, P.; Daliento, S. On-Line Junction Temperature Monitoring of Switching Devices with Dynamic Compact Thermal Models Extracted with Model Order Reduction. Energies 2017, 10, 189. [Google Scholar] [CrossRef]
- Poppe, A.; Zhang, Y.; Wilson, J.; Rencz, M.; Székely, V. Thermal measurement and modeling of multi-die packages. IEEE Trans. Comp. Packag. Technol. 2009, 32, 484–492. [Google Scholar] [CrossRef]
- Chang, M.-H.; Das, D.; Varde, P.V.; Pecht, M. Light emitting diodes reliability review. Microelectr. Reliab. 2012, 52, 762–782. [Google Scholar] [CrossRef]
- Castellazzi, A.; Gerstenmaier, Y.C.; Kraus, R.; Wachutka, G.K.M. Reliability analysis and modeling of power MOSFETs in the 42-V-PowerNet. IEEE Trans. Power Electron. 2006, 21, 603–612. [Google Scholar] [CrossRef]
- Zhou, J.; Long, X.; He, J.; Ren, F.; Fang, L. Uncertainty Quantification for Junction Temperature of Automotive LED With Die-Attach Layer Microstructure. IEEE Trans. Device Mater. Reliab. 2018, 18, 86–96. [Google Scholar] [CrossRef]
- Farkas, G.; Bein, M.C.; Gaal, L. Multi domain modelling of power LEDs based on measured isothermal and transient I-V-L characteristics. In Proceedings of the 22nd International Workshop on Thermal Investigations of ICs and Systems (Therminic), Budapest, Hungary, 21–23 September 2016; pp. 181–186. [Google Scholar]
- Almeida, P.S.; Bender, V.C.; Braga, H.A.C.; Marchesan, T.B.; Alonso, J.M. Static and dynamic photoelectrothermal modeling of LED lamps including low-frequency current ripple effects. IEEE Trans. Power Electron. 2015, 30, 3841–3851. [Google Scholar] [CrossRef]
- Ciappa, M.; Carbognami, F.; Cora, P.; Fichtner, W. A novel thermomechanics-based lifetime prediction model for cycle fatigue failure mechnisms in power semiconductors. Microelectron. Reliab. 2002, 42, 1653–1658. [Google Scholar] [CrossRef]
- Tao, X. Performance characterization and theoretical modeling of emitted optical power for high-power white-LED devices. IEEE Trans. Electron Devices 2015, 62, 1511–1515. [Google Scholar]
- Chen, H.T.; Cheung, Y.F.; Choi, H.W.; Tan, S.C.; Hui, S.Y. Reduction of Thermal Resistance and Optical Power Loss Using Thin-Film Light-Emitting Diode (LED) Structure. IEEE Trans. Ind. Electron. 2015, 62, 6925–6933. [Google Scholar] [CrossRef]
- Adamas-Perez, H.; Ponce-Silva, M.; Osorio-Sanchez, R.; Alonso, J.M. Electrothermal Model for Power LEDs Based on the Equivalent Resistance Concept for LED Driver Design. IEEE Trans. Electron Devices 2021, 68, 6249–6254. [Google Scholar] [CrossRef]
- Zhang, Y.; Ding, M.; Zhao, D.; Zhang, B.; Cai, Y. Analysis and Modeling of Thermal-Electric Coupling Effect of High-Power Monolithically Integrated Light-Emitting Diode. IEEE Trans. Electron Devices 2018, 65, 564–571. [Google Scholar] [CrossRef]
- Górecki, K.; Górecki, P.; Zarębski, J. Measurements of parameters of the thermal model of the IGBT module. IEEE Trans. Instrum. Meas. 2019, 68, 4864–4875. [Google Scholar] [CrossRef]
- Górecki, K. Modelling mutual thermal interactions between power LEDs in SPICE. Microelectron. Reliab. 2015, 55, 389–395. [Google Scholar] [CrossRef]
- Schweitzer, D.; Ender, F.; Hantos, G.; Szabó, P.G. Thermal transient characterization of semiconductor devices with multiple heat sources—Fundamentals for a new thermal standard. Microelectron. J. 2015, 46, 174–182. [Google Scholar] [CrossRef]
- van der Broeck, C.; Ruppert, L.A.; Hinz, A.; Conrad, M.; De Doncker, R.W. Spatial Electro-Thermal Modeling and Simulation of Power Electronic Modules. IEEE Trans. Ind. Appl. 2018, 54, 404–415. [Google Scholar] [CrossRef]
- Reichl, J.; Ortiz-Rodriguez, J.M.; Hefner, A.; Lai, J.S. 3-D Thermal Component Model for Electrothermal Analysis of Multichip Power Modules With Experimental Validation. IEEE Trans. Power Electron. 2015, 30, 3300–3308. [Google Scholar] [CrossRef]
- Wang, J.; Chen, W.; Zhang, J.; Xu, M.; Wang, L.; Liu, J.; Gan, Y. A Novel Approach to Model and Analyze Uneven Temperature Distribution Among Multichip High-Power Modules and Corresponding Method to Respecify Device SOA. IEEE Trans. Power Electron. 2022, 37, 4626–4640. [Google Scholar] [CrossRef]
- Chang, Y.; Li, W.H.; Luo, H.Z.; He, X.N.; Iannuzzo, F.; Blaabjerg, F.; Lin, W.X. A 3D Thermal Network Model for Monitoring Imbalanced Thermal Distribution of Press-Pack IGBT Modules in MMC-HVDC Applications. Energies 2019, 12, 1319. [Google Scholar] [CrossRef]
- Zhang, Y.; Wang, H.; Wang, Z.; Yang, Y.; Blaabjerg, F. Simplified Thermal Modeling for IGBT Modules With Periodic Power Loss Profiles in Modular Multilevel Converters. IEEE Trans. Ind. Electron. 2019, 66, 2323–2332. [Google Scholar] [CrossRef]
- Dziurdzia, B.; Górecki, K.; Ptak, P. Influence of a soldering process on thermal parameters of large power LED modules. IEEE Trans. on Components. Packag. Manuf. Technol. 2019, 9, 2160–2167. [Google Scholar] [CrossRef]
- Lu, H.-L.; Lu, Y.-J.; Zhu, L.-H.; Chen, G.-L.; Chen, Z. Efficient Measurement of Thermal Coupling Effects on Multichip Light-Emitting Diodes. IEEE Trans. Power Electron. 2017, 32, 9280–9292. [Google Scholar] [CrossRef]
- Górecki, K.; Ptak, P. Modelling LED lamps in SPICE with thermal phenomena taken into account. Microelectron. Reliab. 2017, 79, 440–447. [Google Scholar] [CrossRef]
- Wang, C.-P.; Chen, T.-T.; Fu, H.-K.; Chang, T.-L.; Chou, P.-T. Transient analysis of partial thermal characteristics of multistructure power LEDs. IEEE Trans. Electron Devices 2013, 60, 1668–1672. [Google Scholar] [CrossRef]
- Poppe, A. Thermal Measurements and Modelling. The Transient and Multichip Issues. Tutorial, 11th THERMINIC Workshop, Belgirate, Italy. 2005. Available online: https://therminic.org/therminic2005/APoppe_Tutorial.pdf (accessed on 2 May 2023).
- Chi, W.-H.; Chou, T.-L.; Han, C.-N.; Yang, S.-Y.; Chiang, K.-N. Analysis of thermal and luminous performance of MR-16 LED lighting module. IEEE Trans. Compon. Packag. Technol. 2010, 33, 713–721. [Google Scholar] [CrossRef]
- Górecki, K.; Ptak, P. Thermal, photometric and radiometric properties of multi-color LEDs situated on the common PCB. Electronics 2020, 9, 1672. [Google Scholar] [CrossRef]
- Castellazzi, A. Comprehensive compact models for the circuit simulation of multichip power modules. IEEE Trans. Power Electron. 2010, 25, 1251–1264. [Google Scholar] [CrossRef]
- Bouguezzi, S.; Ayadi, M.; Ghariani, M. Developing a Simplified Analytical Thermal Model of Multi-chip Power Module. Microelectron. Reliab. 2016, 66, 64–77. [Google Scholar] [CrossRef]
- d’Alessandro, V.; Codecasa, L.; Catalano, A.P.; Scognamillo, C. Circuit-based electrothermal simulation of multicellular sic power MOSFETs using FANTASTIC. Energies 2020, 13, 4563. [Google Scholar] [CrossRef]
- Poppe, A. Multi-domain compact modeling of LEDs: An overview of models and experimental data. Microelectron. J. 2015, 46, 1138–1151. [Google Scholar] [CrossRef]
- Dong, J.; Zhang, G. Identification and Robust Control of the Nonlinear Photoelectrothermal Dynamics of LED Systems. IEEE Trans. Ind. Electron. 2017, 64, 2215–2225. [Google Scholar] [CrossRef]
- Torzewicz, T.; Janicki, M.; Napieralski, A. Experimental determination of junction-to-case thermal resistance in LED compact thermal model. In Proceedings of the 17th IEEE Intersociety Conf. on Thermal and Thermomechanical Phenomena in Electronic Systems, ITherm, San Diego, CA, USA, 26 July 2018; pp. 768–772. [Google Scholar]
- Torzewicz, T.; Baran, K.; Raszkowski, T.; Samson, A.; Wachta, H.; Napieralski, A. Compact thermal modelling of power LED light sources. In Proceedings of the 2017 IEEE 30th International Conference on Microelectronics (MIEL), Nis, Serbia, 14 December 2017; pp. 157–160. [Google Scholar]
- Wan, G.; Zhang, K.; Fu, K. A 3-D Finite Difference Method for Obtaining the Steady-State Temperature Field of a PCB Circuit. IEEE Trans. Power Electron. 2023, 38, 2032–2040. [Google Scholar] [CrossRef]
- Ptak, P.; Górecki, K.; Dziurdzia, B. Modelling thermal properties of large LED module. Mat. Sci. Pol. 2019, 37, 628–638. [Google Scholar] [CrossRef]
- Available online: http://fideltronik.com/pl/ (accessed on 28 September 2018).
- Datasheet XP-G2 Diode. Available online: https://www.cree.com/led-components/media/documents/XLampXPG2.pdf (accessed on 26 October 2023).
- Illes, B.; Skwarek, A.; Geczy, A.; Krammer, O.; Busek, D. Numerical modelling of the heat and mass transport processes in a vacuum vapour phase soldering system. Int. J. Heat Mass Transf. 2017, 114, 613–620. [Google Scholar] [CrossRef]
- Livovsky, L.; Pietrikova, A. Real-time profiling of reflow process in VPS chamber. Solder. Surf. Mt. Technol. 2017, 29, 42–48. [Google Scholar] [CrossRef]
- Synkiewicz, B.; Skwarek, A.; Witek, K. Voids investigation in solder joints performed with vapour phase soldering (VPS). Solder. Surf. Mt. Technol. 2014, 26, 8–11. [Google Scholar] [CrossRef]
- Ulzhöfer, C. Vacuum reflow. A simple approach for void reduction by means of an inline reflow system. SMT 2012, 4, 1–5. [Google Scholar]
- Sofia, J.W. Analysis of thermal transient data with synthesized dynamic-models for semiconductor-devices. IEEE Trans. Compon. Packag. Manuf. Technol. Part A 1995, 18, 39–47. [Google Scholar] [CrossRef]
- Bagnoli, P.E.; Casarosa, C.; Ciampi, M.; Dallago, E. Thermal resistance analysis by induced transient (TRAIT) method for power electronic devices thermal characterization. IEEE Trans. Power Electron. I. Fundam. Theory 1998, 13, 1208–1219. [Google Scholar] [CrossRef]
- Górecki, K.; Ptak, P. New method of measurements transient thermal impedance and radial power of power LEDs. IEEE Trans. Instrum. Meas. 2020, 69, 212–220. [Google Scholar] [CrossRef]
Figure 1.
Dimensions of the tested module with locations of the used LEDs (a) and the view of the tested module (b).
Figure 1.
Dimensions of the tested module with locations of the used LEDs (a) and the view of the tested module (b).

Figure 2.
Network representation of a new compact thermal model of the LED module.

Figure 3.
Diagram of the set-up to measure self and transfer transient thermal impedance of the diodes contained in the tested LED module.
Figure 3.
Diagram of the set-up to measure self and transfer transient thermal impedance of the diodes contained in the tested LED module.

Figure 4.
Measured and modeled waveforms of self and transfer transient thermal impedances in the tested module at power dissipation in: D1 (a), D2 (b), D3 (c), D4 (d).
Figure 4.
Measured and modeled waveforms of self and transfer transient thermal impedances in the tested module at power dissipation in: D1 (a), D2 (b), D3 (c), D4 (d).

Figure 5.
Dependence of thermal resistance Rthi-k on the distance l between the LEDs placed in the tested module.
Figure 5.
Dependence of thermal resistance Rthi-k on the distance l between the LEDs placed in the tested module.

Figure 6.
Measured and calculated waveforms of the junction temperature excess of selected LEDs included in the tested module while cooling after the dissipation power of 4.8 W in diode D1 only (a) and 4.65 W in each of diodes D1–D4 (b).
Figure 6.
Measured and calculated waveforms of the junction temperature excess of selected LEDs included in the tested module while cooling after the dissipation power of 4.8 W in diode D1 only (a) and 4.65 W in each of diodes D1–D4 (b).

Figure 7.
Measured and calculated waveforms of the junction temperature excess of selected diodes included in the tested module while cooling after the dissipation power of 4.5 W in diodes D1–D8 only (a) and 2.9 W in each diode in the module (b).
Figure 7.
Measured and calculated waveforms of the junction temperature excess of selected diodes included in the tested module while cooling after the dissipation power of 4.5 W in diodes D1–D8 only (a) and 2.9 W in each diode in the module (b).

Figure 8.
Irradiance of LED D1 when the current flows through a different number of LEDs contained in the module.
Figure 8.
Irradiance of LED D1 when the current flows through a different number of LEDs contained in the module.


Table 1.
Distances between individual pairs of LEDs included in the considered LED module.
| D1 | D2 | D3 | D4 | D5 | D6 | D7 | D8 | D9 | D10 | D11 | D12 | D13 | D14 | D15 | D16 | |
|---|---|---|---|---|---|---|---|---|---|---|---|---|---|---|---|---|
| D1 | ||||||||||||||||
| D2 | ||||||||||||||||
| D3 | ||||||||||||||||
| D4 | ||||||||||||||||
| D5 | ||||||||||||||||
| D6 | ||||||||||||||||
| D7 | ||||||||||||||||
| D8 | ||||||||||||||||
| D9 | ||||||||||||||||
| D10 | ||||||||||||||||
| D11 | ||||||||||||||||
| D12 | ||||||||||||||||
| D13 | ||||||||||||||||
| D14 | ||||||||||||||||
| D15 | ||||||||||||||||
| D16 |
Disclaimer/Publisher’s Note: The statements, opinions and data contained in all publications are solely those of the individual author(s) and contributor(s) and not of MDPI and/or the editor(s). MDPI and/or the editor(s) disclaim responsibility for any injury to people or property resulting from any ideas, methods, instructions or products referred to in the content. |
© 2023 by the authors. Licensee MDPI, Basel, Switzerland. This article is an open access article distributed under the terms and conditions of the Creative Commons Attribution (CC BY) license (https://creativecommons.org/licenses/by/4.0/).
Share and Cite
MDPI and ACS Style
Górecki, K.; Ptak, P. Simple Form of Compact Thermal Model of the Large LED Modules. Energies 2023, 16, 7329. https://doi.org/10.3390/en16217329
AMA Style
Górecki K, Ptak P. Simple Form of Compact Thermal Model of the Large LED Modules. Energies. 2023; 16(21):7329. https://doi.org/10.3390/en16217329
Chicago/Turabian StyleGórecki, Krzysztof, and Przemysław Ptak. 2023. "Simple Form of Compact Thermal Model of the Large LED Modules" Energies 16, no. 21: 7329. https://doi.org/10.3390/en16217329
Note that from the first issue of 2016, this journal uses article numbers instead of page numbers. See further details here.