Article

Establishment and Application of a Pattern for Identifying Sedimentary Microfacies of a Single Horizontal Well: An Example from the Eastern Transition Block in the Daqing Oilfield, Songliao Basin, China

1
School of Earth Sciences, Northeast Petroleum University, Daqing 163318, China
2
Key Laboratory of Oil and Gas Reservoir Formation Mechanism and Resource Evaluation of Heilongjiang Province, Northeast Petroleum University, Daqing 163318, China
3
Department of Petroleum Engineering, Northeast Petroleum University, Daqing 163318, China
4
Key Laboratory of Enhanced Oil Recovery, Northeast Petroleum University, Ministry of Education, Daqing 163318, China
5
Institute of Marxism, Guangzhou College of Applied Science and Technology, Guangzhou 526070, China
*
Author to whom correspondence should be addressed.
Energies 2023, 16(20), 7053; https://doi.org/10.3390/en16207053
Submission received: 25 July 2023 / Revised: 2 October 2023 / Accepted: 10 October 2023 / Published: 12 October 2023
(This article belongs to the Special Issue Advances in Petroleum Exploration and Production)

Abstract

:
The study of sedimentary microfacies of horizontal wells is important for improving oil recovery using horizontal well technology. Vertical well data alone do not provide accurate enough information to determine the sedimentary microfacies of horizontal wells. Therefore, a comprehensive method combining the data of both horizontal and vertical wells was established to identify sedimentary microfacies of horizontal wells and applied to a single horizontal well in the Daqing oilfield in China’s Songliao Basin. The results identified the study area as a delta sedimentary environment, mainly subdivided into four microfacies types: a distributary channel, the main overbank sand, the overbank sand, and an interdistributary bay. The criteria for identifying each sedimentary microfacies were established. Among them, the criteria for identifying distributary channels include a natural gamma value continuously less than 90 API; a resistivity value continuously greater than 11 Ω·m; a logging curve, which is typically bell-shaped or box-shaped with very high amplitude and amplitude difference; a mainly siltstone lithology; and a total hydrocarbon content (Tg) continuously greater than 3%. The variations in the two types of channel boundaries (narrowing of the channel boundary and reverse extension of the bifurcated channel boundary) were corrected. The research results can provide guidance for the efficient development of favorable reservoirs in oilfields using horizontal well technology.

1. Introduction

The horizontal well technique was introduced in China in the 1960s. The first horizontal well was constructed in Daqing Oilfield in 1991, and its output was 4–8 times that of the surrounding vertical wells. With the continuous improvement in logging technology and instruments, rapid progress has been made in recent years in horizontal-well-related technologies and construction [1,2,3], for instance, in horizontal well logging interpretation [4,5,6,7], drilling technology [8,9,10], completion technology [11,12,13], fracturing technology [14,15], development program optimization [16,17], and geologic steering [18,19]. Although many scholars have studied sedimentary microfacies, most have focused on vertical wells, and relatively few have studied sedimentary microfacies by combining horizontal and vertical wells to establish the pattern for identifying sedimentary microfacies of single horizontal wells. In recent years, several problems have been identified in the fine characterization of oil and gas reservoirs relying on horizontal well information. First, some of the complete drilling information on horizontal wells did not match the predictions based on the information from vertical wells. Second, the methods for reservoir description using horizontal well information were diversified. Third, horizontal and vertical wells information lacked convenient and easy methods of mutual verification and correction.
The focus area in this study is a thin sand–mud interbed developed using a combination of vertical and horizontal wells. The drilling length of the horizontal well is about 730~1400 m, and multiple sandstone sections are drilled, making it difficult to delineate channel boundaries using horizontal well technology [20,21]. The accurate and fine delineation of the horizontal well directly affects the development of the reservoir and its subsequent development adjustments. Thus, it is necessary and urgent to make full use of the horizontal well information to identify and characterize the sedimentary microfacies of the drilled reservoir.
The target layer of the study area is the subfacies deposition in the delta distributary plain [22,23], characterized mainly by four types of microfacies: the distributary channel microfacies, the main overbank sand microfacies, the overbank sand microfacies, and the interdistributary microfacies. The type classification of microfacies is conducive to characterizing the planar heterogeneity of terrigenous clastic rock reservoirs. It helps to accurately characterize the lateral changes in a given reservoir’s sand bodies using horizontal well information, which is convenient for the segmented description of individual facies in horizontal wells.
Using the above classification and the information from the horizontal and vertical wells in the study area, the relationship between the sedimentary microfacies of a horizontal well and the electrical property, lithology, oil content, and total hydrocarbon content (Tg) of the drilled reservoir is established. Four types of microfacies criteria for horizontal wells are determined. The intuitive and maneuverable microfacies-determination plate for a single horizontal well is established, and the reservoir in which the horizontal well is located is described in detail. Finally, the boundary of the distributary channel’s sand body in the reservoir is reasonably corrected by combining the vertical and horizontal well data, and the development range and scale of the channel sand body in the reservoir are more objectively revealed.
The research results can provide the necessary geological basis for developing and exploiting other similar reservoirs in this block. It can also provide a necessary reference for the broad application of horizontal well technology in similar reservoirs in other blocks. Therefore, it is of great significance to carry out research on the criteria for sedimentary microfacies identification and the description of horizontal wells’ segments to realize an efficient development of horizontal well areas and fine reservoir descriptions of similar reservoirs.

2. Geological Setting

The study area is located in the eastern transition block of the Daqing oilfield in Songliao Basin, China (Figure 1). The structure of the study area is relatively gentle, the formation dip angle is 2–3°, and no faults have developed. Saertu and Putaohua oil reservoirs are in the area and belong to a set of large fluvial delta deposits in the northern Songliao Basin, formed in the middle of the early Cretaceous [24,25]. The reservoirs were formed in a significant inversion during the depression process of Songliao Basin, between the late stage of the Qingshankou Formation regression cycle and the early stage of the Yaojia and Nenjiang Formations transgression cycle (Figure 2). The sedimentary environment is fluvial delta deposit, with a typical subfacies deposit of delta distributary plains, and the sand body mainly composed of a distributary channel, an abandoned channel, main overbank sand, overbank sand, an interdistributary bay, and other microfacies [26,27,28]. The burial depth of the target oil reservoir is about 990~1230 m and belongs to a clastic reservoir. The horizontal section of the horizontal well is located in formation SII7+8b, also the target layer of the study. The lithology is mainly siltstone and muddy siltstone, and the main components are quartz and feldspar. The cementation type is mainly contact with a pore contact type. The cement is mainly argillaceous. The main component of clay minerals in the cement is kaolinite, followed by illite, and the secondary diagenesis is weak.

3. Materials and Methods

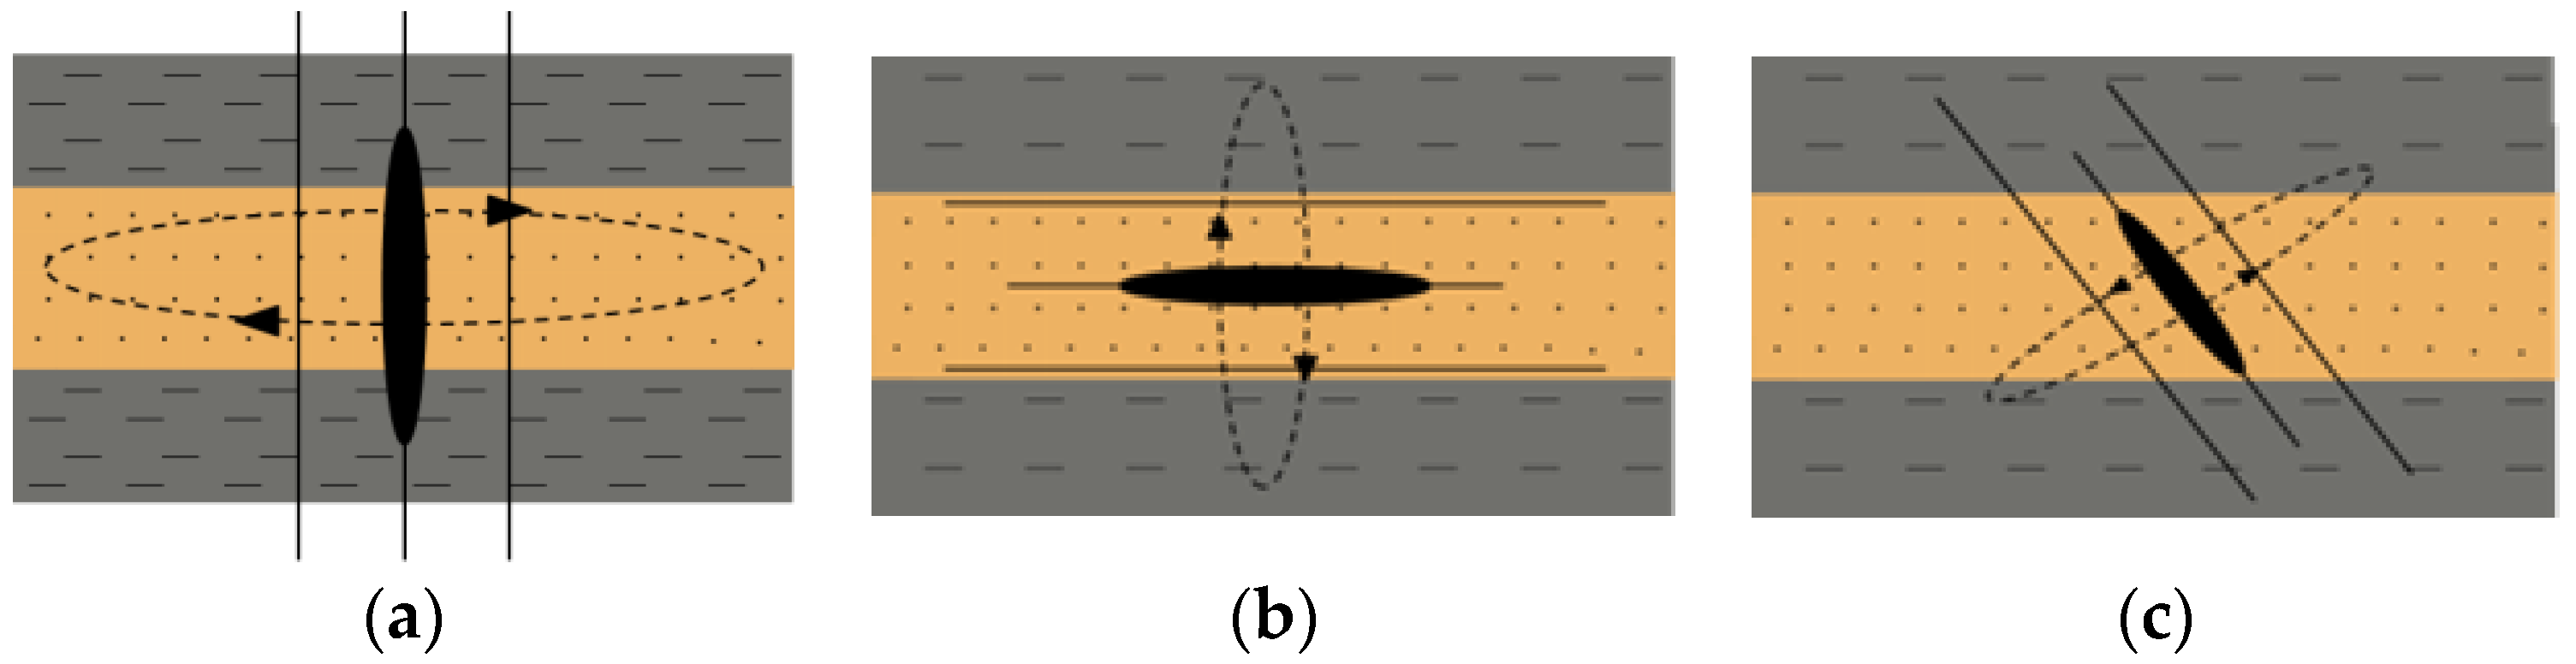
3.1. Logging Response Mechanism of Horizontal Wells

Conventional logging instruments are usually employed in the detection of horizontal well logging in China. The horizontal well trajectory often changes relative to the formation, resulting in the logging response mechanism of the horizontal well that is different from that of the vertical well [30,31]. During logging detection in vertical wells, the current loop is parallel to the stratification plane when using a measuring instrument, and the detection result obtained is the horizontal resistivity R h . In the detection process of inclined and horizontal wells, the measuring instrument may pass through the stratification plane, and the obtained result is the combined resistivity of horizontal resistivity R h and vertical resistivity R v . The result is usually affected by the anisotropy of formation resistivity (Figure 3). Therefore, the logging data for horizontal well cannot be directly used for logging evaluation, and the anisotropy of the formation resistivity in horizontal wells needs to be corrected [32,33,34].
The resistivity measured in vertical wells is generally considered to better reflect the horizontal resistivity of the formation. When the thickness of the formation is less than the resolution of the logging instrument, the resistivity measured using the instrument is inconsistent with the actual resistivity, which is usually characterized by introducing the anisotropy coefficient λ (the arithmetic square root of the ratio of R v to R h ):
λ = R v R h = [ h s d 2 ( h s d + h s h ) 2 + ( R s d R s h + R s h R s d ) · h s d h s h ( h s d + h s h ) 2 + h s h 2 ( h s d + h s h ) 2 ] 1 2
where R v is vertical resistivity, Ω·m; R h is horizontal resistivity, Ω·m; R s d is sandstone resistivity, Ω·m; R s h is mudstone resistivity, Ω·m; h s d is the cumulative thickness of sandstone, m; and h s h is the cumulative thickness of mudstone, m.
The study area is a thin sand–mudstone interbed. Without considering the influence of borehole and mud intrusion, the plane model of anisotropic formation in the horizontal well was simulated using a three-layer horizontal layered medium model. Since the thickness and permeability of the upper and lower rocks surrounding the sandstone group are different from those of the sandstone group, they have different irreducible water saturation in the formation and produce different influences on resistivity. After the thickness and resistivity of sand and mudstone of the vertical well around the horizontal well in the target layer were calculated, the thickness of the model was assumed to be unit thickness, and the proportion of upper and lower surrounding rocks and sandstone in the target layer was calculated. It is assumed that the thickness ratios of the upper surrounding rock, sandstone, and lower surrounding rock in the model are α, β, and γ; the sum of α, β, and γ is 1; and the resistivity is R α , R β , R γ .
Since the resistivity of each formation is continuously measured using the logging instrument when measuring vertical wells, each formation can be treated as one resistance in the resistance series to obtain the vertical resistivity R v   = α R α   + β R β   + γ R γ . When detecting horizontal wells, the resistivity of the target layer is measured using the logging instrument in parallel, and each formation can be considered as one resistance in the parallel resistance to obtain the horizontal resistivity R h   =   α R α + β R β + γ R γ R h 2 . The anisotropy coefficient λ of formation resistivity of the horizontal well can be obtained using Equation (1). The anisotropy coefficients λ of various types of sand bodies in the target layer are shown in Table 1.
The true resistivity R a of horizontal formation can be obtained using the anisotropy coefficient λ of formation resistivity of horizontal well in Equation (2):
R a = λ R h 1 + ( λ 2 1 )   cos 2 θ
where R a is the apparent resistivity, Ω·m; R h is the horizontal resistivity, Ω·m; λ is the anisotropy coefficient; and θ is the included angle between the axis of the electrode system and the direction of vertical layer interface (°). Since the dip angle of formation is 2~3°, the value of θ in this study is 87°.

3.2. Method Establishing the Pattern for Identifying Sedimentary Microfacies of Single Horizontal Well

The electrical property, lithology, and total hydrocarbon content (Tg) of the reservoir showed good consistency. On the basis of the above analysis of the logging response mechanism of the horizontal well, the electrical connection between the horizontal well and the vertical well was established. The relationship between sedimentary microfacies of the horizontal well, natural gamma, and resistivity was quantitatively characterized by establishing the chart of the relationship between sedimentary microfacies of the horizontal well and electrical properties. Then, the logging facies mode for the horizontal well was qualitatively built in the form of logs. Next, the relationship between the microfacies of the horizontal well and cuttings and gas-logging data was studied, and the pattern for identifying sedimentary microfacies of the horizontal well was established.

4. Results

4.1. Quantitative Characterization of Electrical Parameters of the Sedimentary Microfacies in the Horizontal Well

Logging facies analysis is an indispensable means to divide sedimentary microfacies of reservoirs based mainly on the quantitative characteristics of logging curves and the qualitative characteristics of the form of logs [35,36,37,38].
In our research, we have studied the sedimentary environment and logging response characteristics, analyzed the sedimentary microfacies and logging patterns in the study area, determined the relationship between the reservoir’s electrical properties and sedimentary microfacies, and established the standard microfacies map for identification via logging information. As a result, the electrical standards of sedimentary microfacies in the study area were divided using the corresponding logging curves’ characteristics (natural gamma and deep and shallow lateral resistivity) of vertical wells, and the cross plot of GR-LLD curves was drawn to define the electrical standards of different sedimentary microfacies in the study area (Figure 4).
As shown in Figure 4, by establishing the GR-LLD cross plot of vertical wells, the quantitative electrical criteria of different sedimentary microfacies of vertical wells in the study area were defined as GR < 90, LLD > 10 for the distributary channel microfacies, 90 < GR < 100, 7 < LLD < 10 for the microfacies of the main overbank sand, 100 < GR < 112, 5 < LLD < 7 for the overbank sand microfacies, and GR > 112, LLD < 5 for the interdistributary microfacies.
With the established electrical criteria for vertical wells, the resistivity curve of horizontal wells was corrected using the conversion relation between horizontal resistivity and the vertical resistivity in Equation (2), and the chart of the relationship between microfacies types in the horizontal well and electrical properties was established (Figure 5).
As shown in Figure 5, after the conversion of electrical properties, the electrical criteria of different sedimentary microfacies of the horizontal well in the study area were defined as GR < 90, LLD > 11 for the distributary channel microfacies, 90 < GR < 100, 8 < LLD < 11 for the microfacies of the main overbank sand, 100 < GR < 112, 6 < LLD < 8 for the overbank sand microfacies, and GR > 112, LLD < 6 for the interdistributary microfacies.

4.2. Relationship between Sedimentary Microfacies of Horizontal Well and Logging Curve Characteristics

Facies logging analysis is vital in studying sedimentary facies and sand body development [39,40,41]. The form, amplitude, amplitude difference, top–bottom contact mode, smoothness, and logging curve combinations are often closely related to the sedimentary environment and geological characteristics of the study area [42,43,44]. The natural gamma and deep and shallow lateral resistivity curves in the study area were selected to comprehensively analyze the characteristics of the logging curves and qualitatively analyze the relationship between the sedimentary microfacies of the horizontal well and the well logging data to establish the horizontal well facies log mode. The analysis indicated the following.
The logging curve of the distributary channel microfacies (Figure 6a) is a typical bell or box shape with high amplitude and amplitude difference. The curve is smooth and has a typical positive rhythm, with gradual contact at the top and sudden contact at the bottom. The bottom has a scoured surface;
The logging curve of the interdistributary microfacies (Figure 6b) is linear, with very low amplitude and amplitude difference;
The logging curve of the microfacies of the main overbank sand (Figure 6c) is finger-like or a finger-like interbed and slightly toothed, with moderate amplitude and amplitude difference, and it is a thin sand–mudstone interbed;
The logging curve of the overbank sand microfacies (Figure 6d) is finger-like and severely toothed, with low amplitude and amplitude difference.

4.3. Relationship between Horizontal Well Sedimentary Microfacies and Logging Parameters

4.3.1. Relationship between Sedimentary Microfacies of Horizontal Well and Cutting Logging Parameters

Cutting data can be as important as logging data in sedimentary facies research but with visible and intuitive advantages. By directly observing and describing the color, lithology, and oil-bearing properties of cuttings, the cuttings’ histogram can be plotted to analyze the lithology rhythm, sand body genesis, the sedimentary facies sequence and cycle, the sand body comparison and prediction, the sedimentary facies belt, and the direction of sediment transport [45,46,47,48,49]. The analysis of cuttings’ logging data shows a good correspondence between sedimentary microfacies, lithology, and oil-bearing properties in the study area. Figure 7 shows the ratio of sedimentary microfacies and lithology distribution in the horizontal well of the study area. According to the figure, the lithology of the reservoir in the study area is mainly siltstone, muddy siltstone, silty mudstone, and mudstone. The main composition is quartz, followed by feldspar. The cementation type is argillaceous cement, which is relatively loose. They are moderately sorted and subangular after rounding, without reaction after dripping acid.
The lithology of the distributary channel is mainly siltstone and contains a small amount of muddy siltstone. It is brownish-gray or grayish-brown. The lithology of the main overbank sand is mainly siltstone and muddy siltstone and contains a small amount of silty mudstone. It is gray or brownish-gray. The lithology of the overbank sand is mainly muddy siltstone and gray and also contains a small amount of silty mudstone and mudstone. The interdistributary lithology is mainly mudstone of greenish-gray color.

4.3.2. Relationship between Sedimentary Microfacies of Horizontal Well and Gas-Logging Parameters

Oil and gas bearing is an important reservoir-evaluation index, and gas-logging data strongly correlate with reservoir oil and gas bearing [50,51]. Gaslogging data on underground oil and gas relate only to the abundance of organic hydrocarbons in the reservoir and the content percentage of each component in hydrocarbons. The data are slightly affected by reservoir lithology, formation water properties, and physical properties [52,53]. The total hydrocarbon content (Tg) can indicate fluid changes in the reservoir in real time. According to the cross plot method of total hydrocarbon and natural gamma, a larger cross area indicates that the reservoir has good gas-bearing properties and reservoir space, and the trend of change in he total hydrocarbon value is positively correlated with the gas-producing capacity. The comprehensive chart of gas-logging curves in the study area shows good correspondence between the change in total hydrocarbon content and logging curves (natural gamma and deep and shallow lateral resistivity curves), lithology, and gas-bearing properties. At the same time, we divided it into four levels according to gas-bearing properties, reservoir space capacity, gas-logging curve, and sedimentary microfacies of the reservoir. The total hydrocarbon contents of distributary channel sand, the main overbank sand, the overbank sand, and the interdistributary bay were greater than 3%, 1.5~3%, 1~1.5%, and less than 1%, respectively.
The pattern for identifying horizontal well sedimentary microfacies was established based on the relationship between sedimentary microfacies of a horizontal well and reservoir electrical parameters, log forms, lithology, and total hydrocarbon content (Tg), as shown in Table 2.

4.4. Determination of Sedimentary Microfacies of a Single Horizontal Well

Reservoir sectional description is the basis for identifying sedimentary facies of the horizontal well. Using the principle of continuous description of the horizontal well, 1–3 complete sandstone sections were placed into one section, and the electrical parameters, log form characteristics, lithology, and total hydrocarbon content of horizontal well were determined in sections using the pattern for identifying sedimentary microfacies shown in Table 2 (Figure 8).
As shown in Figure 8, 14 sandstone sections are developed in the P4 well in the target layer, and their thicknesses are 37.8 m, 52.4 m, 33.4 m, 44.7 m, 65.0 m, 24.4 m, 13.5 m, 14.1 m, 115.1 m, 10.9 m, 336 m, 10.2 m, 149.4 m, and 50.3 m. The porosity of most sandstones in the single layer ranges from 19% to 27%, and the permeability ranges from 103 mD to 392 mD.
At depths of 1399.09–1447.50 m and 1649.80–1722.20 m, the natural gamma curve is continuously at 90~100 API, and the resistivity curve is continuously at 8~11 Ω·m. The curves are finger-like and slightly toothed, with a moderate amplitude and amplitude difference. The lithology is mainly grayish-brown or brownish-gray siltstone, and the total hydrocarbon content (Tg) is continuously at 1.5~3%. According to the pattern for identifying sedimentary microfacies of the horizontal well in Table 2, it is determined as the sedimentary microfacies of the main overbank sand.
At the depths of 1447.50~1524.40 m, 1584.70~1649.80 m, and 1861.70~1900.10 m, the natural gamma curve is continuously greater than 112 API, the resistivity curve is continuously less than 6 Ω·m. The curve is linear, with a very low amplitude and amplitude difference. The lithology is mainly greenish-gray mudstone mixed with greenish-gray silty mudstone, and the total hydrocarbon content (Tg) is continuously less than 1%. According to the pattern for identifying sedimentary microfacies of the horizontal well in Table 2, it is determined as the interdistributary sedimentary microfacies.
At the depths of 1524.40~1584.70 m, 1722.20~1861.70 m, and 1900.10~2445.20 m, the natural gamma curve is continuously less than 90API, and the resistivity curve is continuously greater than 11 Ω·m. The curve is box-shaped, with very high amplitude and amplitude difference. The lithology is mainly grayish brown or brownish gray siltstone, and the total hydrocarbon content (Tg) is continuously greater than 3%. According to the pattern for identifying sedimentary microfacies of the horizontal well in Table 2, it is determined as the sedimentary microfacies of the distributary channel.

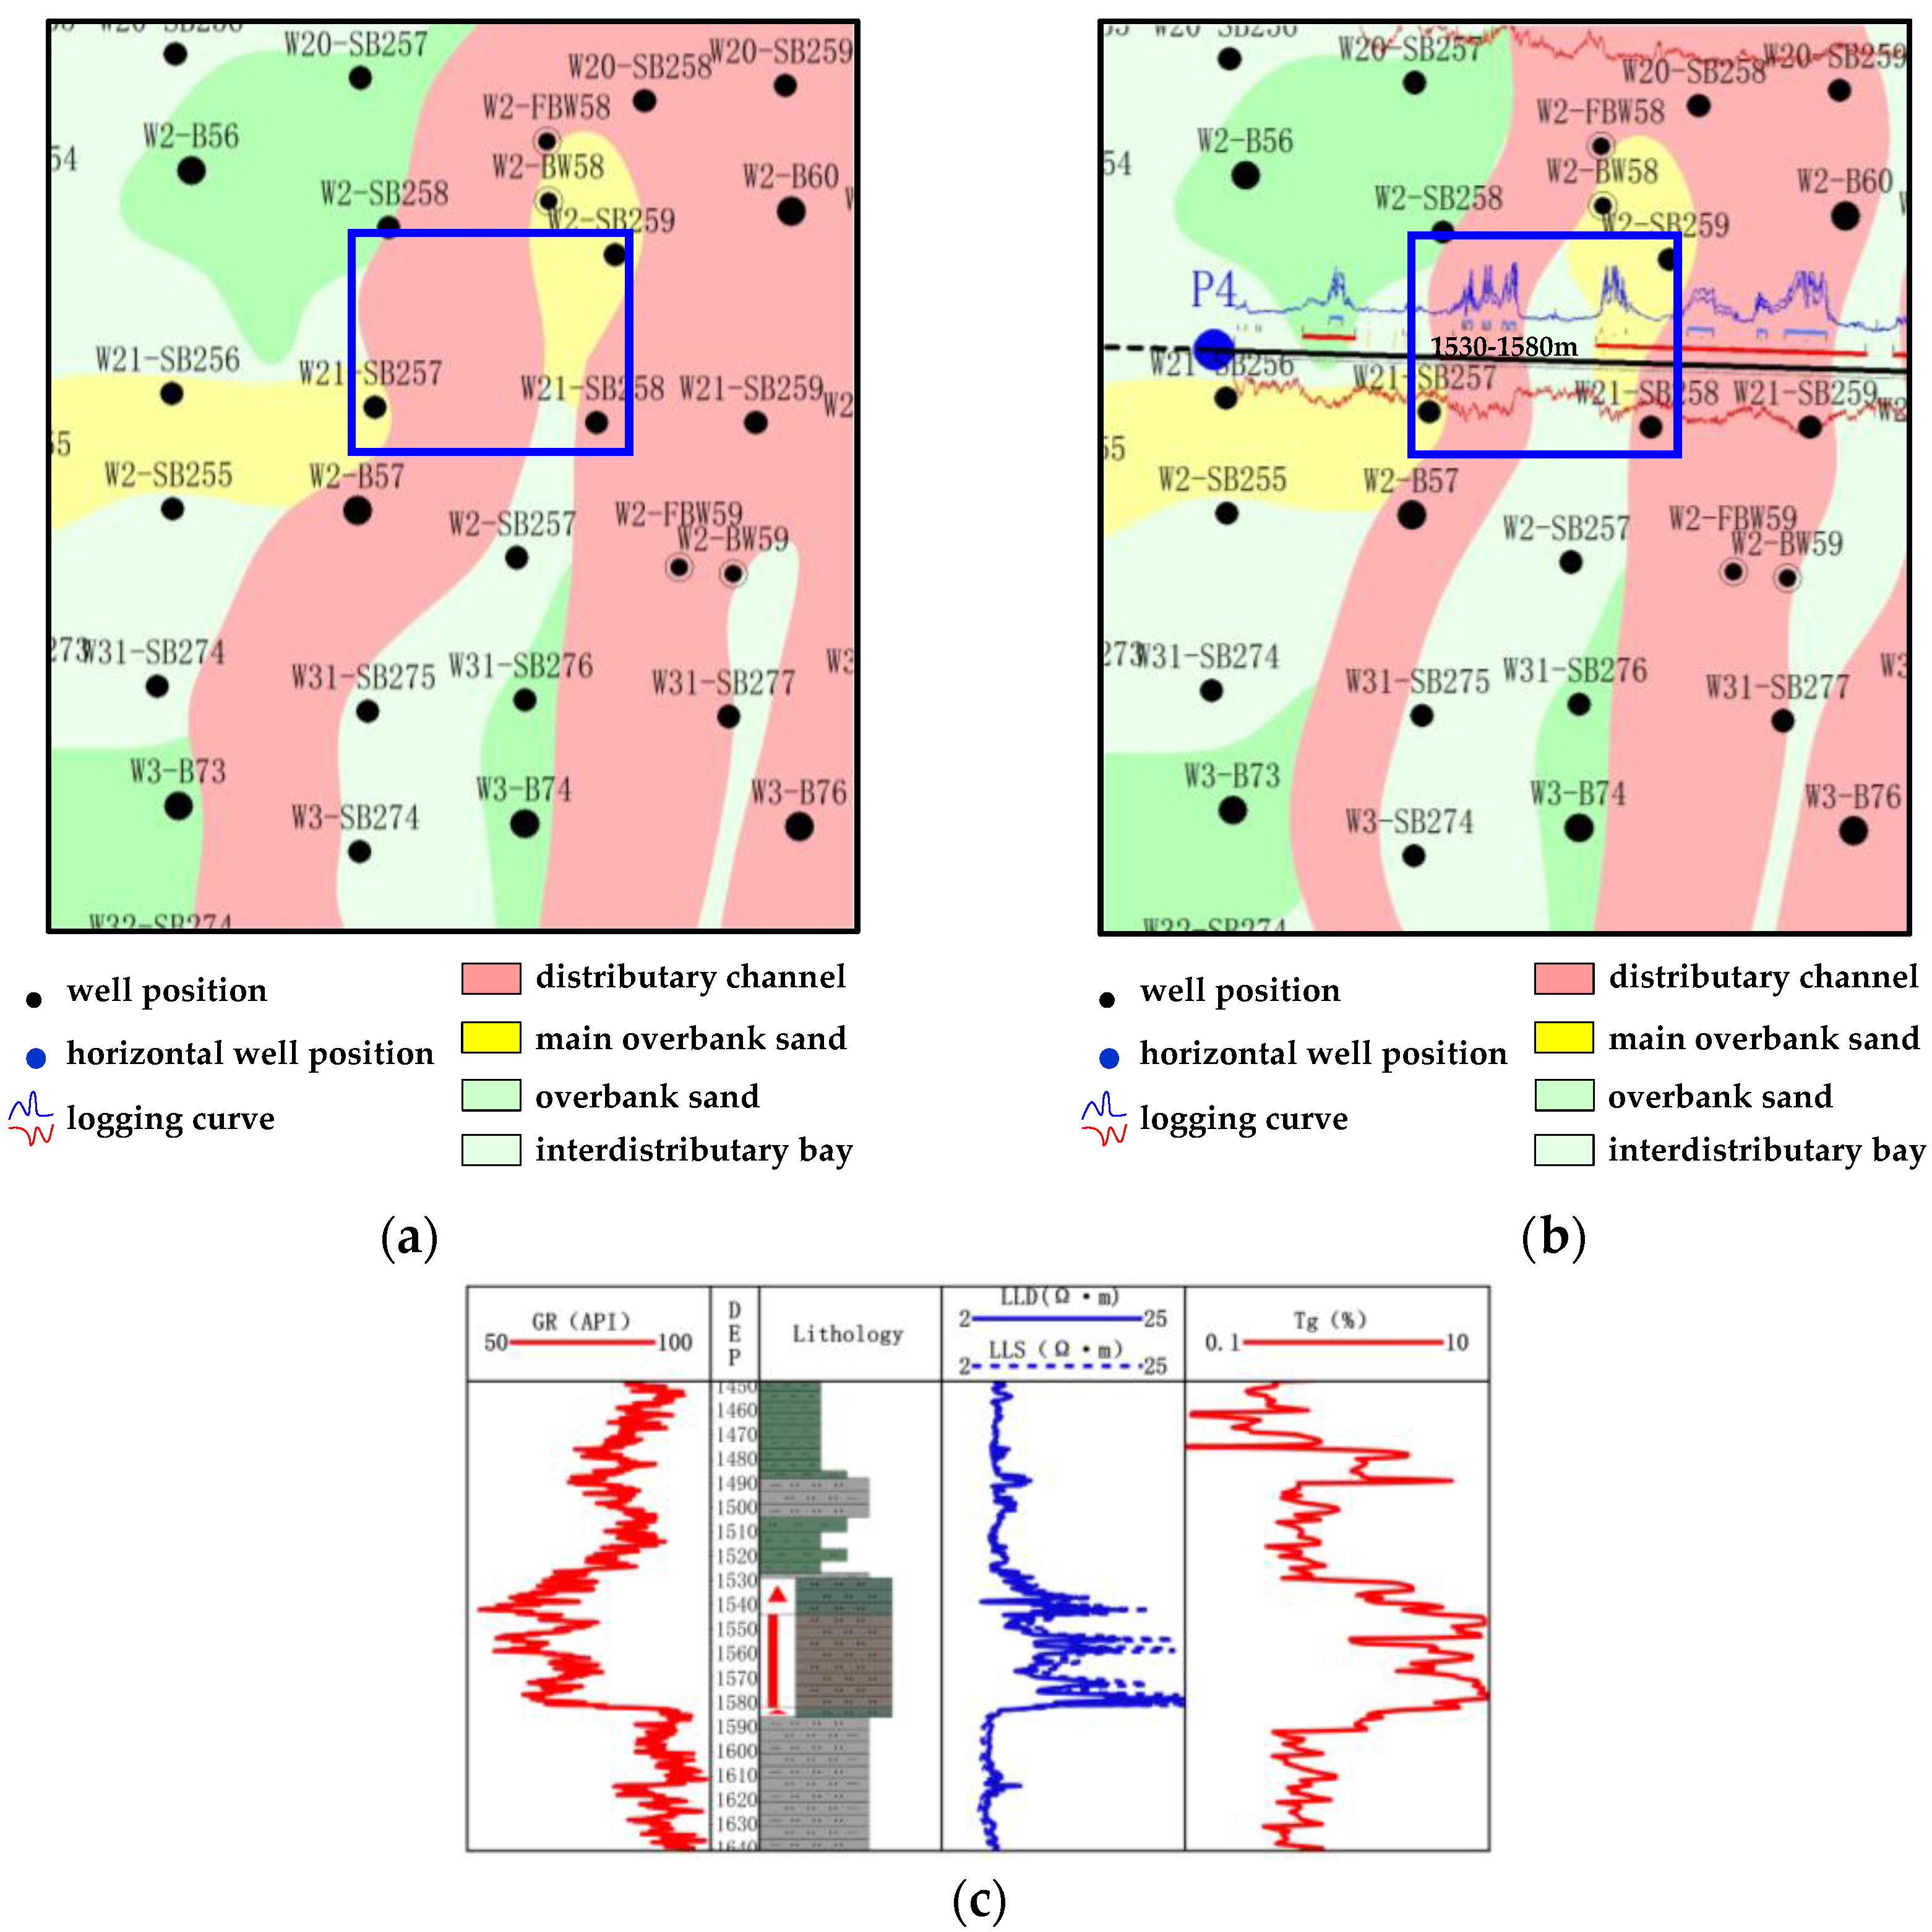
4.5. Identification of Sedimentary Microfacies of Target Formation

According to the color, grain size, petrology, and sedimentary structure characteristics of the mudstone in the coring well in the study area, the study area was classified on the basis of previous research as a delta sedimentary environment and subdivided into five microfacies types: delta distributary plain subfacies and distributary channel, abandoned channel, main overbank sand, overbank sand, and interdistributary bay. The sedimentary microfacies diagram of the target layer without horizontal well control was also plotted (Figure 9). Sedimentary microfacies were identified using a sectional description of the horizontal well, and the distributary channel boundary was corrected. The sedimentary microfacies diagram of the target layer with horizontal well control is shown in Figure 10.

5. Discussion

Comparing Figure 9 and Figure 10, we can see that the channel boundary has been corrected using the combination of vertical and horizontal wells. The channel boundary correction mainly includes the narrowing of the channel boundary and the reverse extension of the bifurcated channel boundary.

5.1. Narrowing of Channel Boundary

Before horizontal well P4 control is applied, a bifurcated channel in the south of the study area starts to split from well W2-BW58. The channel width is about 140 m, and the channel boundary depends on one-quarter to one-half of the vertical well spacing or the well location with prominent channel edge features (Figure 11a).
Horizontal well P4 is located at a depth of 1530–1580 m (Figure 11c), and the well trajectory is in the target layer of the study area. The natural gamma curve is continuously less than 90 API, and the resistivity curve is continuously greater than 11 Ω·m. The logging curve is bell-shaped, with very high amplitude and amplitude differences. The curve is smooth and has a typical positive rhythm, with gradual contact at the top and abrupt contact at the bottom, and the bottom has a scoured surface. The lithology is brownish-gray or grayish-brown siltstone. The main composition is quartz, followed by feldspar. The cementation type is argillaceous cement, which is relatively loose. They are moderately sorted and subangular after rounding, without a reaction after dripping acid. The total hydrocarbon content is continuously greater than 3%. According to the pattern for identifying sedimentary microfacies of the horizontal well in Table 2, it is classified as the sedimentary microfacies of distributary channel.
Horizontal well P4 has a distributary channel deposit at a depth of 1530~1580 m, and the front and back of this depth section are argillaceous deposits or overbank sand deposits, so the boundary of the distributary channel can be well constrained. After horizontal well control, the width of the bifurcated channel becomes 50 m, and the boundary of the bifurcated channel is almost determined (Figure 11b).

5.2. Reverse Extension of Bifurcated Channel Boundary

Before the application of the horizontal wells’ P3 and P4 control, the large distributary channel in the south of the study area splits into four branches; the second bifurcated channel starts to diverge at Well W2-BW89. The bifurcated channel is about 140 m wide and 550 m long (Figure 12a).
The horizontal well P3 is located at a depth of 1770–1840 m, and the well trajectory is in the target layer. The natural gamma curve is continuously greater than 112 API, and the resistivity is continuously less than 6 Ω·m. The logging curve is linear, with a very low amplitude difference. The lithology in this section is greenish-gray mudstone, which is impure, soft, and easy-to-make slurry, and the total hydrocarbon content is continuously less than 1% (Figure 12c). According to the pattern for identifying sedimentary microfacies of the horizontal well in Table 2, it is determined as the interdistributary bay. Horizontal well P4 is located at a depth of 1870–1905 m, and the well trajectory is in the target layer. The natural gamma curve is continuously greater than 112 API, the resistivity is continuously less than 6 Ω·m, and the logging curve is linear with a very low amplitude difference. The lithology in this section is mainly greenish-gray mudstone mixed with silty mudstone. It is an impure, slightly sandy, easy-to-make slurry, and the total hydrocarbon content is continuously less than 1% (Figure 12d). According to the pattern for identifying sedimentary microfacies of the horizontal well in Table 2, it is determined as interdistributary microfacies.
Since there is a continuous argillaceous deposit in both horizontal wells P3 and P4, there are good channel sands around the argillaceous deposit. It was considered that the bifurcated channel boundary should be extended reversely to well W1-SB289, and it was determined that wells W20-SB259 and W20-SB260 are disconnected using the inter-well-tracer technique and the comprehensive analysis of fluid properties. According to the above discussion, the sedimentary microfacies diagram of the reverse extension of the bifurcated channel boundary under horizontal wells P3 and P4 control was corrected. After correction, the bifurcated channel divides into two medium distributary channels with widths of about 300 m and 405 m at well W1-SB289, and the length of the channel extends southward by 1050 m (Figure 12b).

5.3. Limitations in This Study

A few limitations in this study are addressed below:
(1)
This technique applies to large shallow-lake basins with fluvial delta sedimentary environments and is well-suited for promotion and reference work in the establishment of the criteria for identifying sedimentary microfacies of single horizontal wells and the description of sedimentary microfacies in continuous sections of distributary channels.
(2)
There could be inherent limitations in applying the variations of the criteria for identifying sedimentary microfacies to the correction of the two types of channel boundaries (narrowing of channel boundaries and reverse extension of bifurcated channel boundaries). There may also be other variations in channel boundaries, including the outward expansion of distributary channel boundaries, the change in bifurcated channel and branch channel boundaries, the merging and splitting of channel boundaries, etc.

5.4. The Aspects of the Microfacies Study of Horizontal Wells Requiring Attention and In-Depth Analysis

In the comparative studies at home and abroad, mainly foreign horizontal well technology is used in the development of marine oil and gas and unconventional oil and gas. The reservoir sedimentary environment is relatively stable, and the technology for horizontal well development is relatively mature [54,55,56,57,58]. Compared with other countries, China’s reservoir of terrigenous clastic rock sand bodies has stronger vertical and horizontal heterogeneity; thus, studying the fine sedimentary microfacies of horizontal wells is recommended [59,60,61]. The segmented microfacies description of a single horizontal well combined with vertical well data is essential for objectively characterizing different reservoir sand bodies.
However, in specific research and practical applications, three aspects of the microfacies study of horizontal wells still require attention and in-depth analysis:
(1)
Identifying a single horizontal well is a “multi-solution”. In applying the criteria for well identification (its identification plate), it is necessary to include the data on the area around the location of the vertical well to obtain fine three-dimensional seismic information to conduct a comprehensive analysis before determining the microfacies of a single horizontal well.
(2)
The microfacies information of a single horizontal well contains “false information”. The horizontal well can sometimes swing into the adjacent layers above and below the target layer. Therefore, the horizontal well information is not entirely that of the target layer but contains the information on the upper and lower surrounding rocks. Identifying the real target layer information on horizontal wells requires further, in-depth research and analysis.
(3)
The technology for the description of horizontal well sections should be a “three-dimensional visualization”. Because the terrigenous clastic reservoir sand bodies are mostly fluvial delta deposits, the reservoir sand bodies have the characteristics of thin and quick pinch-out in the vertical direction, frequent lateral swing, and a high proportion of suspended components, resulting in thin reservoir sand bodies, and the overall performance of sand–mud interbeds. The segmented microfacies description of a single horizontal well should be best carried out in the three-dimensional geological model of the reservoir. The current two-dimensional research needs to transition to three-dimensional research.

6. Conclusions

In this study, the combined horizontal and vertical well data, such as electrical parameters, logarithmic forms, cuttings logging, gas logging, the relationship between the sedimentary microfacies of horizontal wells and reservoir electrical parameters, lithology, and total hydrocarbon content (Tg), were clarified with a comprehensive method of qualitative analysis and quantitative characterization. Using this method, the pattern for identifying sedimentary microfacies in horizontal wells was established and applied to determine the sedimentary microfacies type of a single horizontal well. Then, a sectional description was developed for a single horizontal well, and the channel boundary was delineated and corrected. The following six conclusions were drawn:
(1)
The anisotropy coefficient λ of formation resistivity in different sedimentary microfacies of a horizontal well in the target layer was calculated. The λ values of distributary channel microfacies, main overbank sand microfacies, overbank sand microfacies, and interdistributary microfacies were 1.0, 1.13, 1.04, and 1.0, respectively. The true resistivity of horizontal formation was obtained using the anisotropy coefficient λ of the horizontal well formation resistivity to complete the correction of the resistivity curve of the horizontal well.
(2)
If the natural gamma value is continuously less than 90 API, the resistivity value is continuously greater than 11 Ω·m, the logging curve is a typical a bell shape or a box shape with very high amplitude and amplitude difference, the lithology is mainly siltstone, and the total hydrocarbon content (Tg) is continuously greater than 3%, it is determined as distributary channel.
(3)
If the natural gamma value is continuously between 90 and 100 API, the resistivity value is continuously between 8 and 11 Ω·m, the logging curve is finger-like or a finger-like interbed, slightly toothed, with moderate amplitude and amplitude difference, the lithology is mainly siltstone or argillaceous siltstone, and the total hydrocarbon content (Tg) continuously ranges from 1.5 to 3%, it is determined as mainly overbank sand.
(4)
If the natural gamma value is continuously between 100 and 112 API, the resistivity value is continuously between 6 and 8 Ω·m, the logging curve is finger-like and severely toothed with very low amplitude and amplitude difference, the lithology is mainly argillaceous siltstone, and the total hydrocarbon content (Tg) continuously ranges from 1 to 1.5%, it is determined as overbank sand.
(5)
If the natural gamma value is continuously greater than 112 API, the resistivity value is continuously less than 6 Ω·m, the logging curve is linear with very low amplitude and amplitude difference, the lithology is mainly mudstone, and the total hydrocarbon content (Tg) is continuously less than 1%, it is determined as interdistributary microfacies.
(6)
The sedimentary microfacies of a single horizontal well were identified using a comprehensive pattern for identifying sedimentary microfacies of a single horizontal well. By applying the sedimentary microfacies identification results from a single horizontal well to the plane sedimentary facies belt map, the variation in the two types of channel boundaries (narrowing of channel boundary and reverse extension of bifurcated channel boundary) was corrected.

Author Contributions

Conceptualization, G.F., T.D. and Y.Z. (Yuejun Zhao); methodology, G.F., T.D. and Y.Z. (Yuejun Zhao); software, G.F., Y.Z. (Yalou Zhou), W.Z., J.W. and Y.W.; validation, G.F., T.D. and Y.Z. (Yuejun Zhao); formal analysis, W.Z., J.W. and Y.W.; investigation, Y.Z. (Yalou Zhou), W.Z., J.W. and Y.W.; resources, T.D.; data curation, G.F., T.D., Y.Z. (Yalou Zhou), W.Z., J.W. and Y.W.; writing—original draft preparation, G.F., T.D., Y.Z. (Yuejun Zhao), and Y.Z. (Yalou Zhou); writing—review and editing, G.F., T.D. and Y.Z. (Yuejun Zhao); visualization, G.F. and Y.Z. (Yalou Zhou); supervision, G.F., T.D. and Y.Z. (Yuejun Zhao); project administration, G.F. and Y.Z. (Yuejun Zhao); funding acquisition, G.F. and Y.Z. (Yuejun Zhao). All authors have read and agreed to the published version of the manuscript.

Funding

This research was funded by the National Natural Science Foundation of China (grant number: 42002154).

Data Availability Statement

The data are not publicly available due to privacy.

Acknowledgments

Many thanks to Shizhong Ma for his technical support in this study.

Conflicts of Interest

The authors declare no conflict of interest. The funders had no role in the design of the study; in the collection, analyses, or interpretation of data; in the writing of the manuscript; or in the decision to publish the results.

References

  1. Zhang, D.; Liu, Y.; Luo, H.; Cao, S.; Cao, J.; Li, X. Staged fracturing of horizontal wells in continental tight sandstone oil reservoirs: A case study of Yanchang Formation in western Ordos basin, China. Front. Earth Sci. 2021, 9, 760976. [Google Scholar] [CrossRef]
  2. Jiang, Q.; Song, W.; Yu, G.; Gao, Z.; Qian, Y.; Guo, H. Study on the Interpretation Method of Layered Flow Imaging Logging for Oil-water, Two-Phase Flow in Horizontal Wells. Math. Probl. Eng. 2022, 2022, 8552743. [Google Scholar] [CrossRef]
  3. Lei, Q.; Xu, Y.; Cai, B.; Guan, B.; Wang, X.; Bi, G.; Li, H.; Li, S.; Ding, B.; Fu, H.; et al. Progress and prospects of horizontal well fracturing technology for shale oil and gas reservoirs. Pet. Explor. Dev. 2022, 49, 191–199. [Google Scholar] [CrossRef]
  4. Song, W.; Jia, N.; Jiang, Q. An Interpretation Model for the Production Profile on the Same Angle of a Horizontal Well Trajectory. Front. Energy Res. 2020, 8, 203. [Google Scholar] [CrossRef]
  5. Song, H.; Guo, H.; Shi, X.; Shi, H. Simulation logging experiment and interpretation model of array production logging measurements in a horizontal well. Appl. Geophys. 2021, 18, 171–184. [Google Scholar] [CrossRef]
  6. Wang, L.; Liu, Y.; Wang, C.; Fan, Y.; Wu, Z. Real-time forward modeling and inversion of logging-while-drilling electromagnetic measurements in horizontal wells. Pet. Explor. Dev. 2021, 48, 159–168. [Google Scholar] [CrossRef]
  7. Ghosh, S. A review of basic well log interpretation techniques in highly deviated wells. J. Pet. Explor. Prod. Technol. 2022, 12, 1889–1906. [Google Scholar] [CrossRef]
  8. Bina, S.; Fujii, H.; Tsuya, S.; Kosukegawa, H.; Naganawa, S.; Harada, R. Evaluation of utilizing horizontal directional drilling technology for ground source heat pumps. Geothermics 2020, 85, 101769. [Google Scholar] [CrossRef]
  9. Wisniowski, R.; Lopata, P.; Orlowicz, G. Numerical methods for optimization of the horizontal directional drilling (HDD) well path trajectory. Energies 2020, 13, 3806. [Google Scholar] [CrossRef]
  10. Meng, H.; Wang, S.; Yang, C.; Wu, L.; Chen, Y.; Cai, F. Key drilling technology of 4000m ultra long horizontal well in tight gas reservoir of Changqing oilfield, China. Fresen. Environ. Bull. 2021, 30, 8343–8350. [Google Scholar]
  11. Al-Rbeawi, S.; Artun, E. Fishbone type horizontal wellbore completion: A study for pressure behavior, flow regimes, and productivity index. J. Pet. Sci. Eng. 2019, 176, 172–202. [Google Scholar] [CrossRef]
  12. Liang, Q.; Xia, B.; Liu, B.; Nie, Z.; Gao, B. Experimental study on the local drag of completion string with packers in horizontal wells. Coatings 2020, 10, 657. [Google Scholar] [CrossRef]
  13. Ma, G.; Wu, X.; Han, G.; Xiong, H.; Xiang, H. A semianalytical coupling model between reservoir and horizontal well with different well completions. Geofluids 2020, 2020, 8890174. [Google Scholar] [CrossRef]
  14. Liu, Y.; Yang, X.; Guo, J.; Wang, S.; Zhao, Z. Optimization method of fracture parameters in multistage fracturing of horizontal wells. Energy Source Part A 2021, 1914243. [Google Scholar] [CrossRef]
  15. Wu, Z.; Jiang, S.; Xie, C.; Chen, K.; Zhang, Z. Production performance of multiple-fractured horizontal well based on potential theory. J. Energy Resour.-ASME 2022, 144, 103005. [Google Scholar] [CrossRef]
  16. Li, X.; Tian, Y.; Zhang, X.; Song, G.; Zhao, M.; Liang, J.; Huang, W.; Meng, F. Numerical simulation study on the effect of horizontal well reservoir stimulation for gas hydrate production. ACTA Geol. Sin.-Engl. 2022, 96, 701–712. [Google Scholar] [CrossRef]
  17. Wang, H.; Qiao, L.; Zhang, J.; Lu, S.; Chen, F.; Liu, Y.; Fu, Z. An effective integration optimization algorithm for regional fracturing design and drilling placement. J. Nat. Gas Sci. Eng. 2022, 101, 104505. [Google Scholar] [CrossRef]
  18. Prundeanu, I.M.; Chelariu, C.; Perez, D.R.C. Elemental geochemistry of the Upper Cretaceous reservoir and surrounding formations applied in geosteering of horizontal wells, Lebada Field—Western Black Sea. Oil Gas Sci. Technol. 2020, 76, 1. [Google Scholar] [CrossRef]
  19. Wu, Z.; Deng, S.; He, X.; Zhang, R.; Fan, Y.; Yuan, X.; Wu, Y.; Liu, Q. Numerical simulation and dimension reduction analysis of electromagnetic logging while drilling of horizontal wells in complex structures. Pet. Sci. 2020, 17, 645–657. [Google Scholar] [CrossRef]
  20. Liang, H.; Zhao, X.; Zhou, P. Meandering river sandstone architecture characterization based on seisimic sedimentology in Kumkol South oilfields. Indian J. Mar. Sci. 2019, 48, 1460–1471. [Google Scholar]
  21. Dou, L.; Hou, J.; Liu, Y.; Zhang, L.; Song, S.; Wang, X. Sedimentary infill of shallow water deltaic sand bodies controlled by small-scale syndepositional faults related paleogeomorphology: Insights from the paleogene Shahejie formation in the Dongying depression, Bohai Bay Basin, Eastern China. Mar. Pet. Geol. 2020, 118, 104420. [Google Scholar] [CrossRef]
  22. Nabawy, B.S.; Abd El Aziz, E.A.; Ramadan, M.; Shehata, A.A. Implication of the micro- and lithofacies types on the quality of a gas-bearing deltaic reservoir in the Nile Delta, Egypt. Sci. Rep. 2023, 13, 8873. [Google Scholar] [CrossRef] [PubMed]
  23. Shehata, A.A.; Sarhan, M.A.; Abdel-Fattah, M.I.; Assal, E.M. Sequence stratigraphic controls on the gas-reservoirs distribution and characterization along the Messinian Abu Madi incision, Nile Delta Basin. Mar. Pet. Geol. 2023, 147, 105988. [Google Scholar] [CrossRef]
  24. Deng, Q.; Hu, M.; Hu, Z. Depositional characteristics and evolution of the shallow water deltaic channel sand bodies in Fuyu oil layer of central downwarp zone of Songliao Basin, NE China. Arab. J. Geosci. 2019, 12, 607. [Google Scholar] [CrossRef]
  25. Cao, Z.; Azmy, K.; Lin, C.; Dong, C.; Ren, L.; Qin, M.; Li, Z.; Tan, X.; Zhang, L.; Li, X. Diagenetic evolution of the lower Yaojia Formation of Songliao Basin, China: Impact on reservoir quality. J. Pet. Sci. Eng. 2022, 213, 110415. [Google Scholar] [CrossRef]
  26. Li, Z.; Zhang, L.; Were, P.; Wang, D. Sedimentary characteristics of 1st member of Yaojia Formation in Zhaoyuan-Tai pingchuan region of Songliao Basin. J. Pet. Sci. Eng. 2017, 148, 52–63. [Google Scholar] [CrossRef]
  27. Zhu, X.; Zeng, H.; Li, S.; Dong, Y.; Zhu, S.; Zhao, D.; Huang, W. Sedimentary characteristics and seismic geomorphologic responses of a shallow-water delta in the Qingshankou Formation from the Songliao Basin, China. Mar. Pet. Geol. 2017, 79, 131–148. [Google Scholar] [CrossRef]
  28. Zhang, L.; Bao, Z.; Dou, L.; Zang, D.; Mao, S.; Song, J.; Zhao, J.; Wang, Z. Sedimentary characteristics and pattern of distributary channels in shallow water deltaic red bed succession: A case from the Late Cretaceous Yaojia formation, southern Songliao Basin, NE China. J. Pet. Sci. Eng. 2018, 171, 1171–1190. [Google Scholar] [CrossRef]
  29. Er, C.; Zhao, J.; Li, Y.; Si, S.; Bai, Y.; Wu, W.; Han, Q. Relationship between tight reservoir diagenesis and hydrocarbon accumulation: An example from the early Cretaceous Fuyu reservoir in the Daqing oil field, Songliao Basin, China. J. Pet. Sci. Eng. 2022, 208, 109422. [Google Scholar] [CrossRef]
  30. Hu, S.; Li, J.; Guo, H.; Wang, C. Analysis and application of the response characteristics of DLL and LWD resistivity in horizontal well. Appl. Geophys. 2017, 14, 351–362. [Google Scholar] [CrossRef]
  31. Wang, L.; Wu, Z.; Fan, Y.; Huo, L. Fast anisotropic resistivities inversion of logging-while-drilling resistivity measurements in high-angle and horizontal wells. Appl. Geophys. 2020, 17, 390–400. [Google Scholar] [CrossRef]
  32. Pardo, D.; Torres-Verdin, C. Fast 1D inversion of logging-while-drilling resistivity measurements for improved estimation of formation resistivity in high-angle and horizontal wells. Geophysics 2015, 80, E111–E124. [Google Scholar] [CrossRef]
  33. Puzyrev, V.; Torres-Verdin, C.; Calo, V. Interpretation of deep directional resistivity measurements acquired in high-angle and horizontal wells using 3-D inversion. Geophys. J. Int. 2018, 213, 1135–1145. [Google Scholar] [CrossRef]
  34. Deng, S.; Liu, T.; Cai, L.; Lai, S.; Song, L.; Wang, Z. Fast extraction of horizontal formation resistivity based on multi-component induction logging and its application. Chin. J. Geophys. 2021, 64, 2199–2209. [Google Scholar] [CrossRef]
  35. Torghabeh, A.K.; Rezaee, R.; Moussavi-Harami, R.; Pimentel, N. Using electrofacies cluster analysis to evaluate shale-gas potential: Carynginia Formation, Perth Basin, Western Australia. Int. J. Oil Gas Coal. Technol. 2015, 10, 250–271. [Google Scholar] [CrossRef]
  36. El Sharawy, M.S.; Nabawy, B.S. Determination of electrofacies using wireline logs based on multivariate statistical analysis for the Kareem Formation, Gulf of Suez, Egypt. Environ. Earth Sci. 2016, 75, 1394. [Google Scholar] [CrossRef]
  37. Soleimani, B.; Zahmatkesh, I.; Sheikhzadeh, H. Electrofacies analysis of the Asmari reservoir, Marun oil field, SW Iran. Geosci. J. 2020, 24, 195–207. [Google Scholar] [CrossRef]
  38. Kassem, A.A.; Osman, O.; Nabawy, B.; Baghdady, A.; Shehata, A.A. Microfacies Analysis and Reservoir Discrimination of Channelized Carbonate Platform Systems: An Example from the Turonian Wata Formation, Gulf of Suez, Egypt. J. Pet. Sci. Eng. 2022, 212, 110272. [Google Scholar] [CrossRef]
  39. Roslin, A.; Esterle, J.S. Electrofacies analysis using high-resolution wireline geophysical data as a proxy for inertinite-rich coal distribution in Late Permian Coal Seams, Bowen Basin. Int. J. Coal Geol. 2015, 152, 10–18. [Google Scholar] [CrossRef]
  40. Abdideh, M.; Ameri, A. Cluster analysis of petrophysical and geological parameters for separating the electrofacies of a gas carbonate reservoir sequence. Nat. Resour. Res. 2020, 29, 1843–1856. [Google Scholar] [CrossRef]
  41. Lai, J.; Wang, G.; Wang, S.; Cao, J.; Li, M.; Pang, X.; Zhou, Z.; Fan, X.; Dai, Q.; Yang, L.; et al. Review of diagenetic facies in tight sandstones: Diagenesis, diagenetic minerals, and prediction via well logs. Earth-Sci. Rev. 2018, 185, 234–258. [Google Scholar] [CrossRef]
  42. Puskarczyk, E. Application of multivariate statistical methods and artificial neural network for facies analysis from well logs data: An example of Miocene deposits. Energies 2020, 13, 1548. [Google Scholar] [CrossRef]
  43. Abd El Aziz, E.A.; Gomaa, M.M. Electrical properties of sedimentary microfacies and depositional environment deduced from core analysis of the syn-rift sediments, Northwestern shore of Gulf of Suez, Egypt. J. Pet. Explor. Prod. Technol. 2022, 12, 2915–2936. [Google Scholar] [CrossRef]
  44. Shehata, A.A.; Kassem, A.A.; Brooks, H.L.; Zuchuat, V.; Radwan, A.E. Facies analysis and sequence-stratigraphic control on reservoir architecture: Example from mixed carbonate/siliciclastic sediments of Raha Formation, Gulf of Suez, Egypt. Mar. Pet. Geol. 2021, 131, 105160. [Google Scholar] [CrossRef]
  45. Korngreen, D.; Benjamini, C. The epicontinental subsiding margin of the Triassic in Northern Israel, North Arabian Plate. Sediment. Geol. 2010, 228, 14–45. [Google Scholar] [CrossRef]
  46. Sun, M.; Wang, H.; Liao, J.; Gan, H.; Xiao, J.; Ren, J.; Zhao, S. Sedimentary characteristics and model of gravity flow depositional system for the first member of upper Miocene Huangliu Formation in Dongfang area, Yinggehai basin, northwestern South China Sea. J. Earth Sci. 2014, 25, 506–518. [Google Scholar] [CrossRef]
  47. Guo, Q.Z.; Tan, J.M.; Li, D.Q.; Lan, H.; Qiu, P.; Xu, T.; Sun, T.B.; Yin, W. Grain Size Curve Characteristics of 2nd Member of Sangonghe Formation in Qianshao Area and Its Indicative Significance of Hydrodynamic Environment. Appl. Sci. 2022, 12, 9852. [Google Scholar] [CrossRef]
  48. Mahmoodabadi, R.M. Facies analysis, sedimentary environments and correlative sequence stratigraphy of Gachsaran formation in SW Iran. Carbonate Evaporite 2020, 35, 25. [Google Scholar] [CrossRef]
  49. Lesage, C.; Barbieri, A.; Galfi, J.; Jovanovic, D.; Petrovic, V.B. The becoming of a prehistoric landscape: Palaeolithic occupations and geomorphological processes at Lojanik (Serbia). Land 2022, 11, 2292. [Google Scholar] [CrossRef]
  50. Wang, D.; Peng, J.; Yu, Q.; Chen, Y.; Yu, H. Support vector machine algorithm for automatically identifying depositional microfacies using well logs. Sustainability 2019, 11, 1919. [Google Scholar] [CrossRef]
  51. Wang, S.; Cui, Y.; Luan, K.; Lin, X.; Cai, F.; Liu, Y. Reservoir architecture of Sudong X dense well pattern zone in the lower part of Shihezi 8 formation in Sulige gas field, China. Fresen. Environ. Bull. 2022, 31, 8752–8759. [Google Scholar]
  52. Feng, Q.; Xiao, Y.; Hou, X.; Chen, H.; Wang, Z.; Feng, Z.; Tian, H.; Jiang, H. Logging identification method of depositional facies in Sinian Dengying Formation of the Sichuan Basin. Pet. Sci. 2021, 18, 1086–1096. [Google Scholar] [CrossRef]
  53. Li, J.; Li, H.; Yang, C.; Wu, Y.; Gao, Z.; Jiang, S. Geological characteristics and controlling factors of deep shale gas enrichment of the Wufeng-Longmaxi formation in the southern Sichuan basin, China. Lithosphere 2022, 2022, 4737801. [Google Scholar] [CrossRef]
  54. Dengaev, A.; Shishulin, V.; Safiullina, E.; Palyanitsina, A. Modeling results for the real horizontal heavy-oil-production well of mechanical solids. Energies 2022, 15, 5182. [Google Scholar] [CrossRef]
  55. Alarifi, S.A.; Miskimins, J. A new approach uo estimating ultimate recovery for multistage hydraulically fractured horizontal wells by utilizing completion parameters using machine learning. SPE Prod. Oper. 2021, 36, 468–483. [Google Scholar] [CrossRef]
  56. Dahim, S.; Taghavinejad, A.; Razghandi, M.; Rigi, H.R.; Moeini, K.; Jamshidi, S.; Sharifi, M. Pressure and rate transient modeling of multi fractured horizontal wells in shale gas condensate reservoirs. J. Pet. Sci. Eng. 2020, 185, 106566. [Google Scholar] [CrossRef]
  57. Mirani, A.; Marongiu-Porcu, M.; Wang, H.; Enkababian, P. Production-Pressure-Drawdown Management for Fractured Horizontal Wells in Shale-Gas Formations. SPE Reserv. Eval. Eng. 2018, 21, 550–565. [Google Scholar] [CrossRef]
  58. Saputra, W.; Kirati, W.; Patzek, T. Physical Scaling of Oil Production Rates and Ultimate Recovery from All Horizontal Wells in the Bakken Shale. Energies 2020, 13, 2052. [Google Scholar] [CrossRef]
  59. Gao, C.; Cheng, S.; Wang, M.; Wu, W.; Gao, Z.; Li, S.; Meng, X. Optimization of volume fracturing technology for shallow bow horizontal well in a tight sandstone oil reservoir. Front. Energy Res. 2023, 10, 976240. [Google Scholar] [CrossRef]
  60. Yang, H.; Xie, B.; Liu, X.; Chu, X.; Ruan, J.; Luo, Y.; Yue, J. Breakdown pressure prediction of tight sandstone horizontal wells based on the mechanism model and multiple linear regression model. Energies 2022, 15, 6944. [Google Scholar] [CrossRef]
  61. Wang, J.; Liu, J.; Li, Z.; Li, H.; Zhang, J.; Li, W.; Zhang, Y.; Ping, Y.; Yang, H.; Wang, P. Synchronous injection-production energy replenishment for a horizontal well in an ultra-low permeability sandstone reservoir: A case study of Changqing oilfield in Ordos Basin, NW China. Pet. Explor. Dev. 2020, 47, 827–835. [Google Scholar] [CrossRef]
Figure 1. Location map showing the study area in the Songliao Basin [29]. I—western slope zone; II—northern plunge zone; III—central downwarp zone; III1—Daqing Anticline (DA); III2—Sanzhao Sag (SS); IV—northeastern uplift zone; V—southeastern uplift zone; VI—southwestern uplift zone.
Energies 16 07053 g001
Figure 2. Upper Jurassic–Cenozoic stratigraphy of the Songliao Basin [29].
Energies 16 07053 g002
Figure 3. Schematic diagram of resistivity anisotropy measured in vertical, horizontal, and inclined wells. (a) Vertical well; (b) horizontal well; (c) inclined well.
Energies 16 07053 g003
Figure 4. Relationship between microfacies types of a vertical well and electrical properties.
Energies 16 07053 g004
Figure 5. Relationship between microfacies types of horizontal well and electrical properties.
Energies 16 07053 g005
Figure 6. Horizontal well logging microfacies modes of formation SII7+8b. (a) Distributary channel; (b) interdistributary bay; (c) main overbank sand; (d) overbank sand. GR—natural gamma ray; DEP—well depth; JS—logging interpretation; LLD—deep lateral resistivity; LLS—shallow lateral resistivity; Tg—total hydrocarbon in gas logging.
Energies 16 07053 g006
Figure 7. Proportion of corresponding lithology of sedimentary microfacies.
Energies 16 07053 g007
Figure 8. Determination of sedimentary microfacies of horizontal well P4 in formation SII7+8b. SP—spontaneous potential; GR—natural gamma ray; DEP—well depth, JS—logging interpretation; YX—effective thickness of sand; SY—water flooded; POR—porosity; K—permeability; CJX—sedimentary facies; LLD—deep lateral resistivity; LLS—shallow lateral resistivity; Tg—total hydrocarbon in gas logging.
Energies 16 07053 g008
Figure 9. Sedimentary microfacies of formation SII7+8b without horizontal well control.
Energies 16 07053 g009
Figure 10. Sedimentary microfacies of formation SII7+8b with horizontal well control.
Energies 16 07053 g010
Figure 11. Comparison diagram of channel boundary changes before and after horizontal well P4 control. (a) Channel boundary in formation SII7+8b before horizontal well P4 control. (b) Channel boundary in formation SII7+8b after horizontal well P4 control. (c) Logging microfacies column of horizontal well P4 at 1448~1641 m depth in formation SII7+8b. GR—natural gamma ray; DEP—well depth; LLD—deep lateral resistivity; LLS—shallow lateral resistivity; Tg—total hydrocarbon in gas logging.
Energies 16 07053 g011
Figure 12. Comparison of the bifurcated channel’s boundary changes before and after the control of horizontal wells. (a) Bifurcated channel boundary in formation SII7+8b before the control of horizontal wells P3 and P4; (b) bifurcated channel boundary in formation SII7+8b after the control of horizontal wells P3 and P4; (c) logging microfacies column of horizontal well P3 at 1770~1840 m depth in formation SII7+8b; (d) logging microfacies column of horizontal well P4 at 1870~1905 m depth in formation SII7+8b. GR—natural gamma ray; DEP—well depth; LLD—deep lateral resistivity; LLS—shallow lateral resistivity; Tg—total hydrocarbon in gas logging.
Energies 16 07053 g012
Table 1. Values of different types of sedimentary microfacies in horizontal wells.
No.Sedimentary MicrofaciesCumulative Thickness of Sandstone
/m
Cumulative Thickness of Mudstone
/m
Average Resistivity of Sandstone
/(Ω·m)
Average Resistivity of Mudstone
/(Ω·m)
Horizontal   Resistivity   R h
/(Ω·m)
Vertical   Resistivity   R v
/(Ω·m)
Anisotropy Coefficient
λ
1Distributary channel3.600.0016.70/16.7016.701.00
2Main overbank sand1.200.8011.884.259.356.831.13
3Overbank sand0.401.608.634.254.473.901.04
4Interdistributary bay 0.002.50/4.254.254.251.00
Table 2. Pattern for identifying horizontal well sedimentary microfacies.
Microfacies TypesDistributary ChannelMain Overbank SandOverbank SandInterdistributary Bay
Characterization Parameters
Electrical CriteriaGR/API<9090~100100~112>112
LLD/(Ω·m)>118~116~8<6
Form of logsHigh resistivity, low natural gamma ray, high amplitude, high amplitude difference, box or bell shape, visible positive rhythm, thickSlightly toothed,
medium to medium-high resistivity,
medium to medium-high natural gamma ray,
medium to medium-high amplitude,
medium to medium-high amplitude difference,
thin sand–mudstone interbedded, with a certain thickness
Severely toothed, medium to medium-low resistivity,
medium to medium-low natural gamma ray,
medium to medium-low amplitude,
medium to medium-low amplitude difference, thin
Linear curve, very low
amplitude
Logging CriteriaCuttings loggingLithologyMainly siltstone mixed with muddy siltstoneMainly siltstone, muddy siltstoneMainly muddy siltstone mixed with silty mudstone and mudstoneMainly mudstone mixed with silty mudstone
Color Brownish gray or grayish brownGray or brownish grayGrayGreenish gray
Gas loggingTotal hydrocarbon content (%)>31.5~31~1.5<1
Disclaimer/Publisher’s Note: The statements, opinions and data contained in all publications are solely those of the individual author(s) and contributor(s) and not of MDPI and/or the editor(s). MDPI and/or the editor(s) disclaim responsibility for any injury to people or property resulting from any ideas, methods, instructions or products referred to in the content.

