Article

Hybrid CSP—PV Plants for Jordan, Tunisia and Algeria

1
Institute of Solar Research, German Aerospace Center (DLR), 51147 Cologne, Germany
2
Laboratory of Atmospheric Physics, Physics Department, University of Patras, 26504 Rio Achaia, Greece
3
Mechanical Engineering Department, The University of Jordan, Amman 11942, Jordan
4
Centre de Développement des Energies Renouvelable (CDER), Algiers 16340, Algeria
5
Research and Technology Center of Energy (CRTEn), Technopole De Borj-Cédria, Hammam-Lif 2050, Tunisia
*
Author to whom correspondence should be addressed.
Energies 2023, 16(2), 924; https://doi.org/10.3390/en16020924
Submission received: 17 November 2022 / Revised: 20 December 2022 / Accepted: 11 January 2023 / Published: 13 January 2023
(This article belongs to the Special Issue Solar Photovoltaics and Solar Power Plants)

Abstract

:
Hybrid concentrated solar thermal power (CSP) and photovoltaic (PV) plants are gaining relevance because they combine their advantages: easy installation and low cost of PV plus dispatchability of CSP. This paper presents results of a techno-economic modelling of this hybrid approach for sites in Jordan, Tunisia and Algeria. Local boundary conditions such as meteorology, cost and electricity demand have been considered to determine the best configurations for these three sites. Different CSP technologies with thermal energy storage have been selected. Hybridization with natural gas has also been included. The optimization is done towards minimizing the LCOE while covering the electrical demand 24/7. Results are presented for different CO2 emissions ranges, as the use of fossil fuel has a strong impact on the LCOE and for environmental reasons, it may be preferred to be kept to a minimum. For most of the cases analyzed, the fraction of energy from PV that leads to minimum LCOE is lower than the energy from CSP. It is shown that for countries with a high fuel price, the use of natural gas reduces the LCOE until a share from this source of about 20%. A higher integration of fossil fuel for sites rich in solar irradiation is considered not advantageous if the price of natural gas is above EUR 40/MWh.

1. Introduction

It is common to most Middle East and North African (MENA) countries that the energy demand increases (Figure 1) while its cost is high due to the dependence on external energy sources and the very low share of renewables. Current energy policies promote the use of renewable energy to minimize the CO2 emissions and to be less dependent on foreign energy sources. Several technologies can address this issue and, due to the excellent solar resources in this region, solar power plants are in the focus of MENA’s energy transition. The goal is to combine cost-effective technologies such that a large fraction of renewables can be fed into the grid without affecting its stability. In contrast to the needs and goals described above, the operation of solar power plants in the analyzed countries is very low compared to fossil fuels (Figure 2). Nevertheless, especially for Jordan and to some extent for Tunisia, there has been a growth in renewable energy for electricity in the past decade (Figure 3).
Although the market for renewables in Jordan, Tunisia and Algeria is growing, their share on the total production is still very low compared with European countries. According to Abu-Rumman et al., by 2020, Jordan covered only about 7% of its total energy demand with clean energy sources [1]. Based on data published by the International Trade Administration [2], only 3% of Tunisia’s electricity was generated from renewables, including hydroelectric, solar, and wind energy in 2020. In the case of Algeria, RECREEEE accounts that only 3.4% of its installed energy capacity is from renewable energy resources (hydro and solar) [3]. Moreover, due to the reduced number of operating solar power plants, there is low participation of the local industry in solar projects; therefore, the reaction time for the development of new solar projects is long and the costs associated with the risks are high.
The deployment of solutions that fulfil the objectives mentioned above depends on the availability of local technical and economic data, such as the selection of a plant configuration influencing directly on its levelized cost of electricity (LCOE), availability and ecological impact, among others. For this reason, the authors consider capacity building and dissemination activities as an important component for sustainable renewable energy solutions. To fulfill part of these gaps, researchers from Europe (Germany and Greece), North Africa (Tunisia and Algeria) and Western Asia (Jordan) cooperated in the project HYMENSO* (http://www.hymenso.eu/), funded by each participant country in the framework of ERANETMED** (https://cordis.europa.eu/project/id/609475/reporting). Based on these outcomes, this paper presents the optimized configurations of hybrid CSP-PV plants which are able to provide energy for relatively low LCOE while covering the demand during day and night.
Commonly, CSP and PV plants are designed and installed independently, being the installed capacity of large PV plants (>10 MW) in MENA countries about the double of CSP (2200 MW of PV according to [4] and 1150 MW based on [5]). The main reasons for preferring PV over CSP are its lower LCOE and the lower installation and maintenance effort required by the plants. The way in which these plants generate electricity is also different: PV converts the global irradiation into electricity instantaneously, while CSP with thermal storage converts the direct irradiation into heat which can be transformed into electricity in a Rankine steam cycle or stored for electricity generation that can fulfill specific demand profiles, also during night.
The term hybrid CSP-PV plants used here refers to decoupled systems, in which no exchange of mass or energy occurs between the CSP and PV plants directly. This concept optimizes the selection of components to fulfill a load curve at a minimum LCOE and the plant operation is controlled such that the sum of the output from the CSP and the PV systems meets the electrical demand. Coupled systems integrate the energy flows between the systems and have not yet been commercialized [6].
This paper is an extension of the content presented on the IREC 2019 [7] and GCREEDER 2018 [8] and has the added value of including results for Algeria and comparing the results obtained for the three analyzed countries; the two papers cited above presented the results for Jordan and Tunisia independently.
Other studies on hybrid CSP-PV plants are focused on Chile [9,10], South Africa [11,12] or include other technologies in the hybridization, such as wind turbines and batteries [13] or concentrated photovoltaics (CPV) [11] or organic Rankine cycles and electrochemical storage [14]. The novelty of this paper is the comparison of LCOE optimized CSP-PV hybrid plants with thermal energy storage for Jordan, Algeria and Tunisia which lead to unique results due to the specific local boundary conditions, especially regarding solar resource and the power demand curve.

2. Materials and Methods

2.1. Local Boundary Conditions

For the simulation of the hybrid CSP-PV plants, the cities of Ma’an, Ghardaia and Tataouine were selected. Their proximity to the enerMENA stations [15] allows the use of available meteorological data of high accuracy. One year of meteorological data required for the simulation of the hybrid solar power plants for the selected locations was acquired from the enerMENA network [15,16]. Out of multi-year measurements, the measurement year 2015 has been chosen because of its data completeness compared to other years (see Table 1). For simulation purposes, a complete year of data without gaps is required. Data loss could be caused by sensor cleaning, tracker failures, connection loss, power cut or other. The process applied to fill-in data gaps has been proposed by Hoyer-Klick C. et al. [17].
With data about the monthly electrical energy demand for Jordan, Algeria and Tunisia, representative electrical load curves for the three locations were created (Figure 4). It can be seen the demand profile reaches its maximum during daytime and does not go below 60% during the night. The analysis of data revealed a seasonal difference for Jordan and Algeria but not for Tunisia.
Other local factors that affect the levelized cost of electricity regarding running cost are the water and the natural gas price. Table 2 shows the values selected for these locations. Different land costs were also considered, but these do not affect the investment cost, importantly for this comparison.

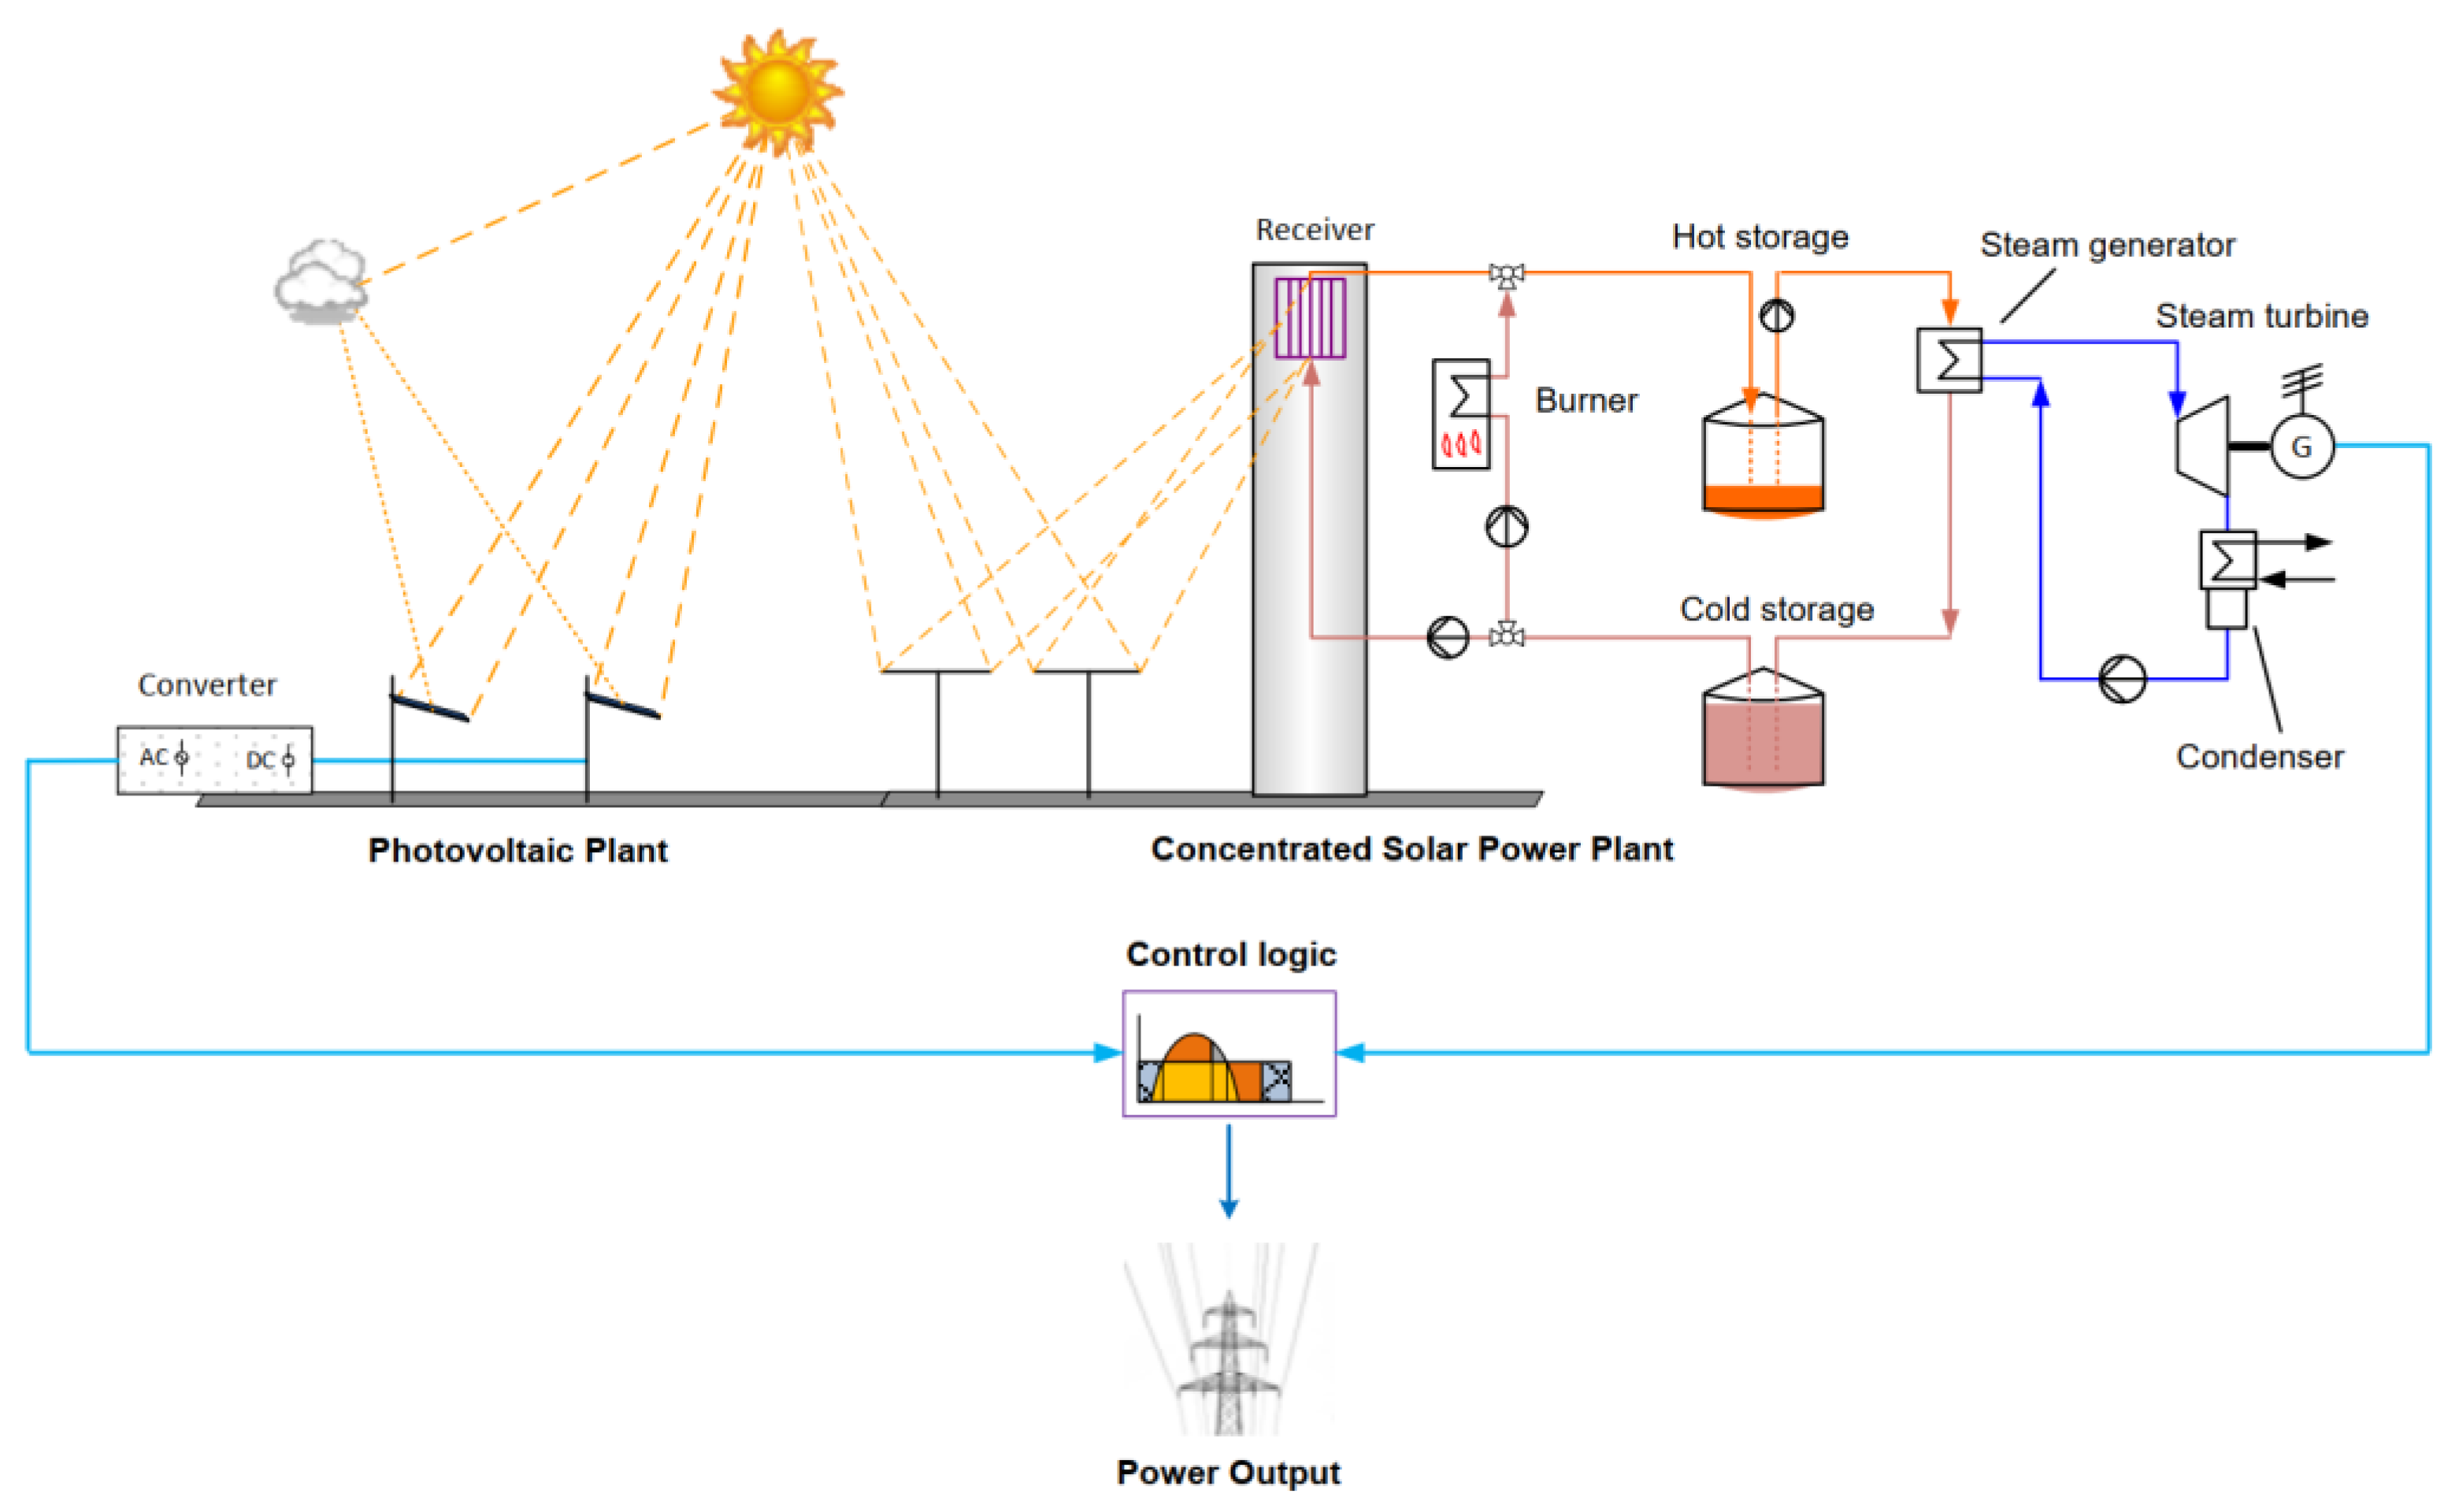
2.2. Hybrid Plant Concepts

In this paper, hybrid CSP-PV plants refer to decoupled systems in which no exchange of mass or energy occurs between the two plants. Three plant configuration cases were defined:
CP1: CSP plant with parabolic trough collectors using thermal–oil heat transfer fluid (HTF) in the solar field, with indirect molten salt thermal energy storage system (TES), including a fossil-fuel back-up system and a polycrystalline single-axis tracked PV plant.
CP2: CSP plant with parabolic trough collectors using molten salt as HTF in the solar field, with direct molten salt thermal energy storage system, including a fossil-fuel back-up system and a polycrystalline single-axis tracked PV plant.
CP3: CSP plant with central solar tower using molten salt as HTF, with direct molten salt thermal energy storage system, including a fossil-fuel back-up system and a polycrystalline single-axis tracked PV plant. Figure 5 shows a simplified sketch of this case.
The nominal net electrical output of the hybrid plant is 100 MW and the operation is controlled in a way that the sum of the electrical output from both systems fits to the electrical demand during the day and night.
The design capacity of the CSP plants is fixed to 100 MW, which is close to many existing CSP plants worldwide (see examples in [2]) and therefore, sufficient information regarding costs and performance is available. Working principles about the CSP technologies can be consulted in [18,19]. The size of the CSP solar field is such that a fraction of the collected heat is used to generate electricity in the power block and the rest is used to charge the molten salt thermal storage tanks. This is expressed by the “solar multiple” which equals to the design thermal power collected at the receiver divided by the nominal thermal power required by the power block.
The PV plants capacities range from 0 to 250 MW. Battery storage has not been included in the PV systems because the main advantage of the CSP systems is their capability to include low-cost/large-capacity thermal storage.
Due to the relevance for some MENA countries, fossil back-up systems are also considered by incorporating a natural gas heater into in the heat transfer fluid cycle of the CSP plant. Because these technological solutions are focused on renewable systems, the CO2 emissions due to the back-up heater are considered for the optimization.
Table 3 and Table 4 below present key technical–economic data of the components selected. More details about the parameters used for the simulations can be found under [3].

2.3. Simulation Methodology

Semi-automatic optimization is done to determine for each technology case and site the best configuration by minimizing the LCOE; as natural gas is used as backup, the CO2 emissions are considered for the classification of the results.
The calculation of the annual yields is done with the simulation tool INSEL [20]. This tool has been used by DLR in similar research projects and pre-feasibility studies [21,22,23]. INSEL has undergone and successfully passed an in-depth validation procedure with the best available tools for the analysis of CSP and PV systems. The expected performance difference in comparison to such tools is of up to approx. ±2% (net power generation on annual basis) [23]. Sensitivity analyses and parametric studies are carried out by means of batch scripts by varying the parameters shown in Table 5. These variations lead to a total of 700 different configurations per case and site selected. The plant LCOE is calculated with MS Excel with the annual yield as well as the economic assumptions over the plant lifetime.
The control strategy of the overall plant is that, depending on the CSP solar multiple and the PV capacity, a fraction of the heat generated by the CSP solar field is sent to the thermal storage while the rest is sufficient to cover the electrical demand with the addition of power from PV. When the solar irradiation decreases (due to clouds or sunset) the energy in the thermal storage is extracted and converted into electrical energy in the CSP power block. Only in the case that the thermal storage runs empty (during night or a series of cloudy days), the natural gas heater provides back-up thermal power to the CSP plant cycle, fulfilling the electricity demand during all times.
Simulated plant operation of seven consecutive days for Ma’an, Jordan, in summer is shown in Figure 6. The orange area is the energy generated by the CSP plant, the blue area is the energy from the PV system and the stripped brown–orange area is the energy from natural gas. The red line corresponds to the charge level of the thermal energy storage, the blue line is the direct solar irradiance, and the black line is the electrical demand.

3. Results

3.1. Techno–Economic Simulation Results

After simulating the 700 combinations per country and technology case mentioned above, the configurations that lead to minimum LCOE are selected for four CO2 emissions ranges. The results presented in Figure 7 include the following data: Solar multiple (SM), thermal storage capacity in full load hours (TES), the nominal PV capacity in MW and CO2 emissions from the back-up system in g/kWh of generated electricity (CO2). The sections of each bar represent the amount of net electrical energy generated per source in one year. In each plot, four calculation results are shown, each bar representing an optimal configuration while permitting more CO2 emissions from the left to the right.
For a better overview of the results, Table 6, Table 7 and Table 8 summarize them.

3.2. Analysis of the Results

The main factors that affect the LCOE are the solar irradiation available, the natural gas price and the demand curves. Since the optimization methodology consists in identifying the plant design that leads to the lowest LCOE at given CO2 emission ranges, the configurations found for each technology case differ between countries. Therefore, a direct comparison of the results is difficult, because, e.g., Jordan has the better meteorological conditions but also the highest fuel price, which leads to a smaller solar field for the same electrical yield but also to larger OPEX due to the fuel used.
The electrical demand curve has a strong impact because although the net electrical output for all cases and sites is the same (100 MW), the distribution during the day influences on the technology (PV is preferably for daytime generation while CSP with larger storage is required for nighttime generation) and its shape affects the total energy to be delivered. The largest energy is generated for the curve of Tunisia since it is closer to full load during more hours in the year and the smallest energy demand is for Algeria. Compared to the demand of the Algerian plant (close to 745 GWh/year), the plant in Tunisia delivers 6% more energy, and that in Jordan 3% more. This also leads to higher LCOE in Tunisia for most cases.
Nevertheless, these somehow opposing conditions enrich the analysis and show the variety of configurations that can be obtained. For example, the slope of the LCOE curve for Ma’an, Jordan, is much lower with the increase of fossil fuel because of the high fuel price and good solar irradiation, which is not the case for Ghardaia, Algeria, with much cheaper fossil fuels. In general, the LCOE curve for Tunisia and Jordan follows a similar trend, only that the absolute values for Jordan are lower due to its better solar resource and smaller energy demand.
In an effort to compare the results per country, the following can be summarized:
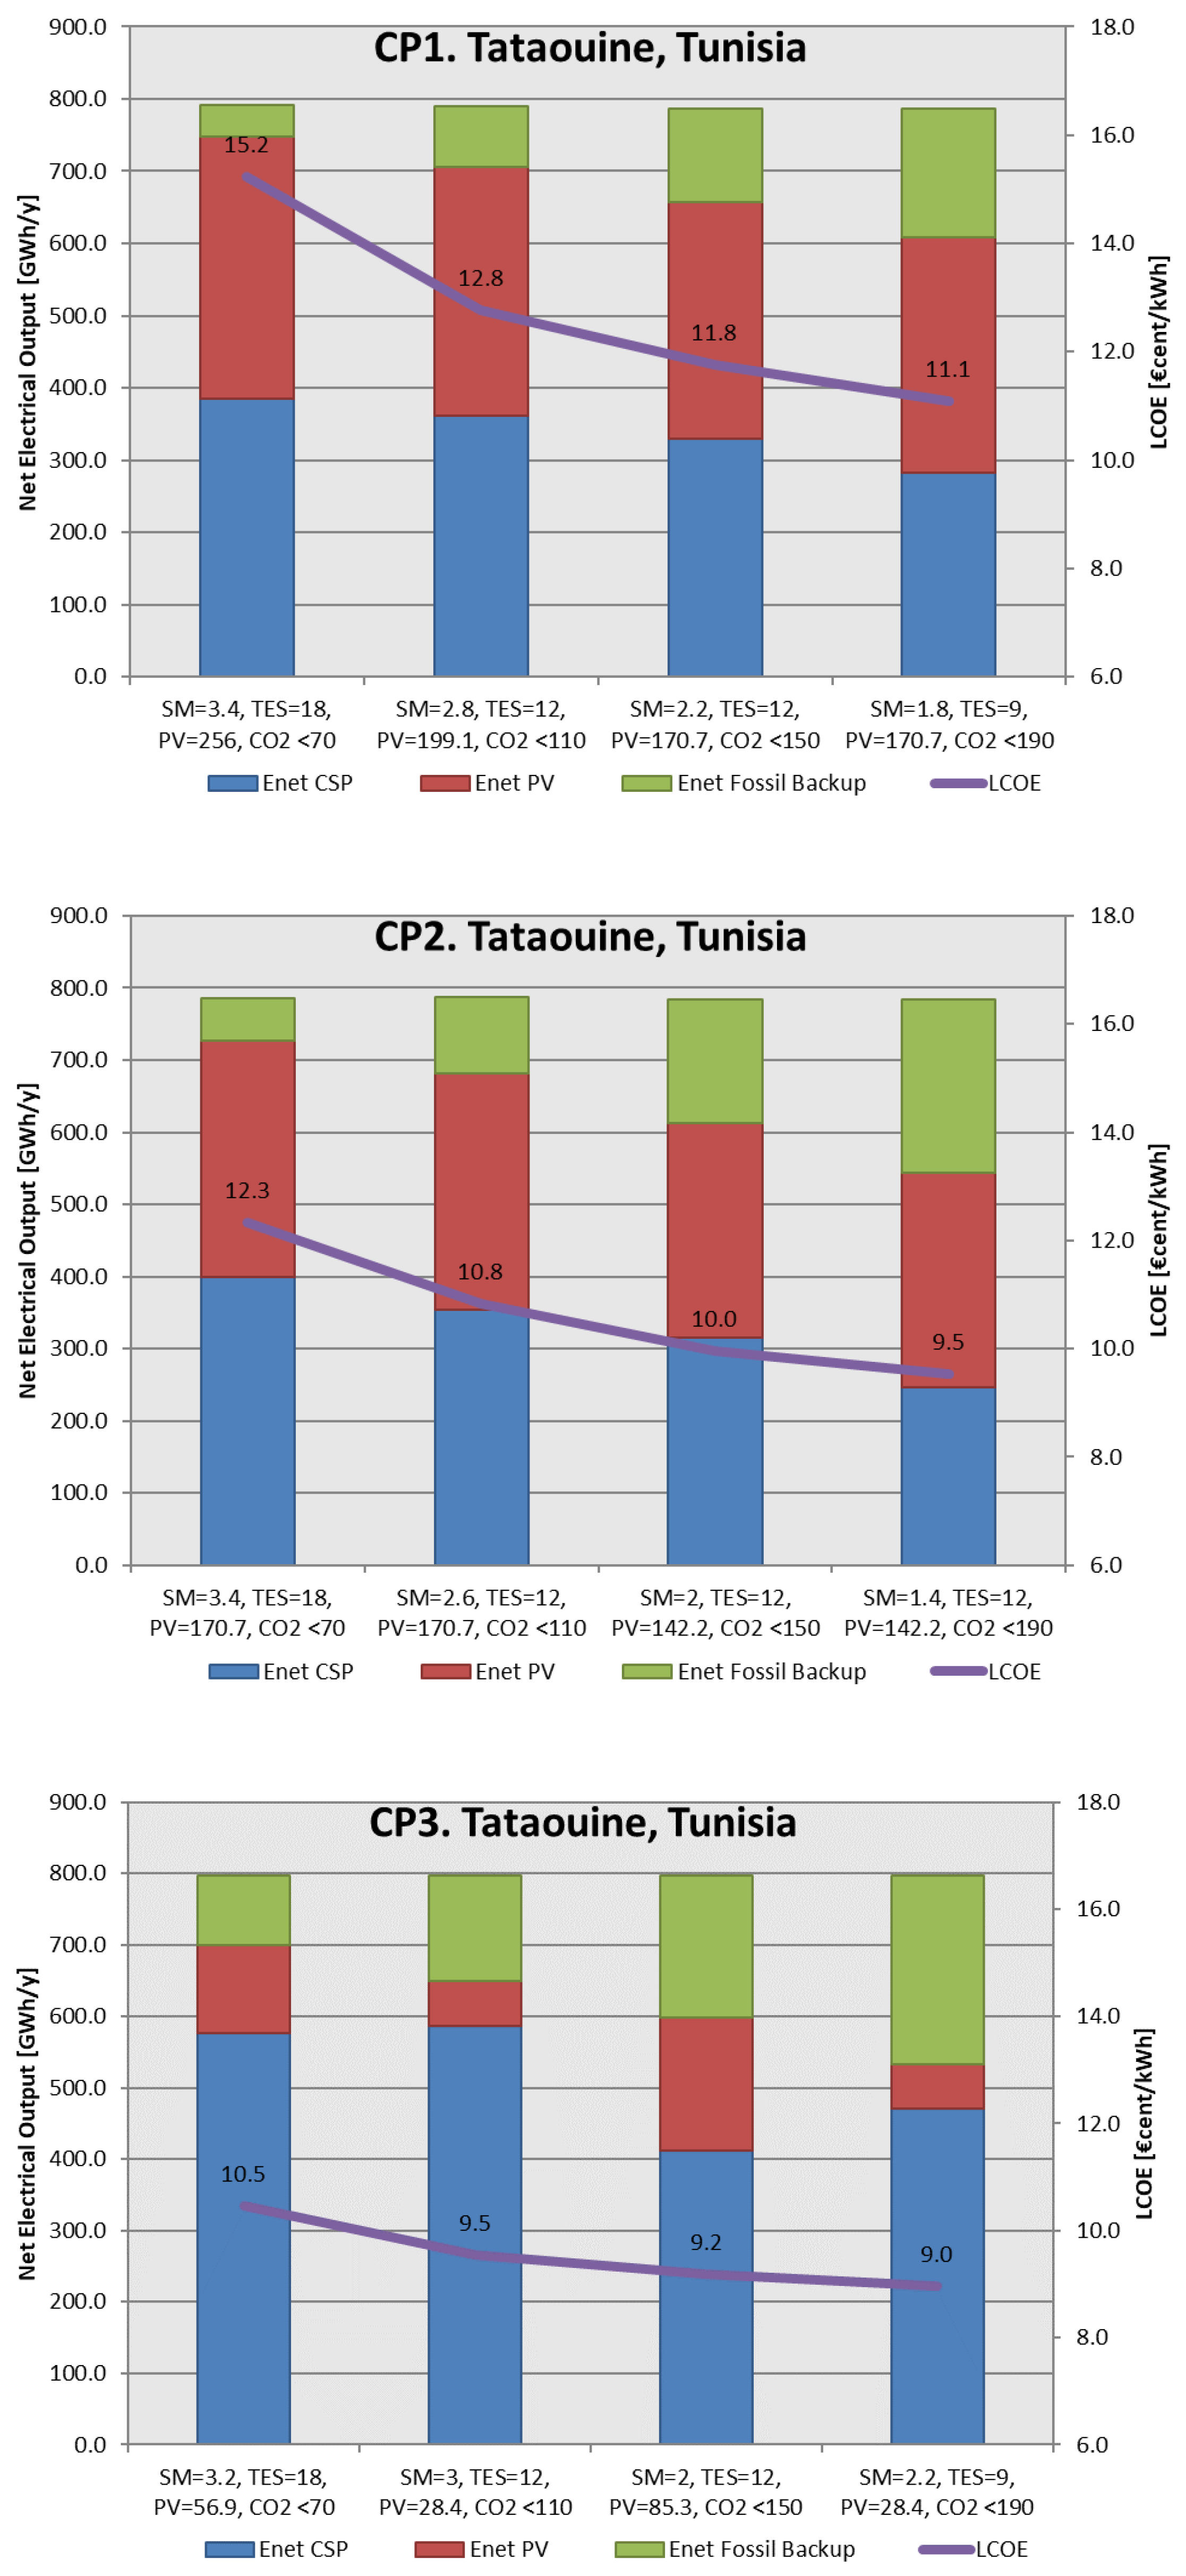
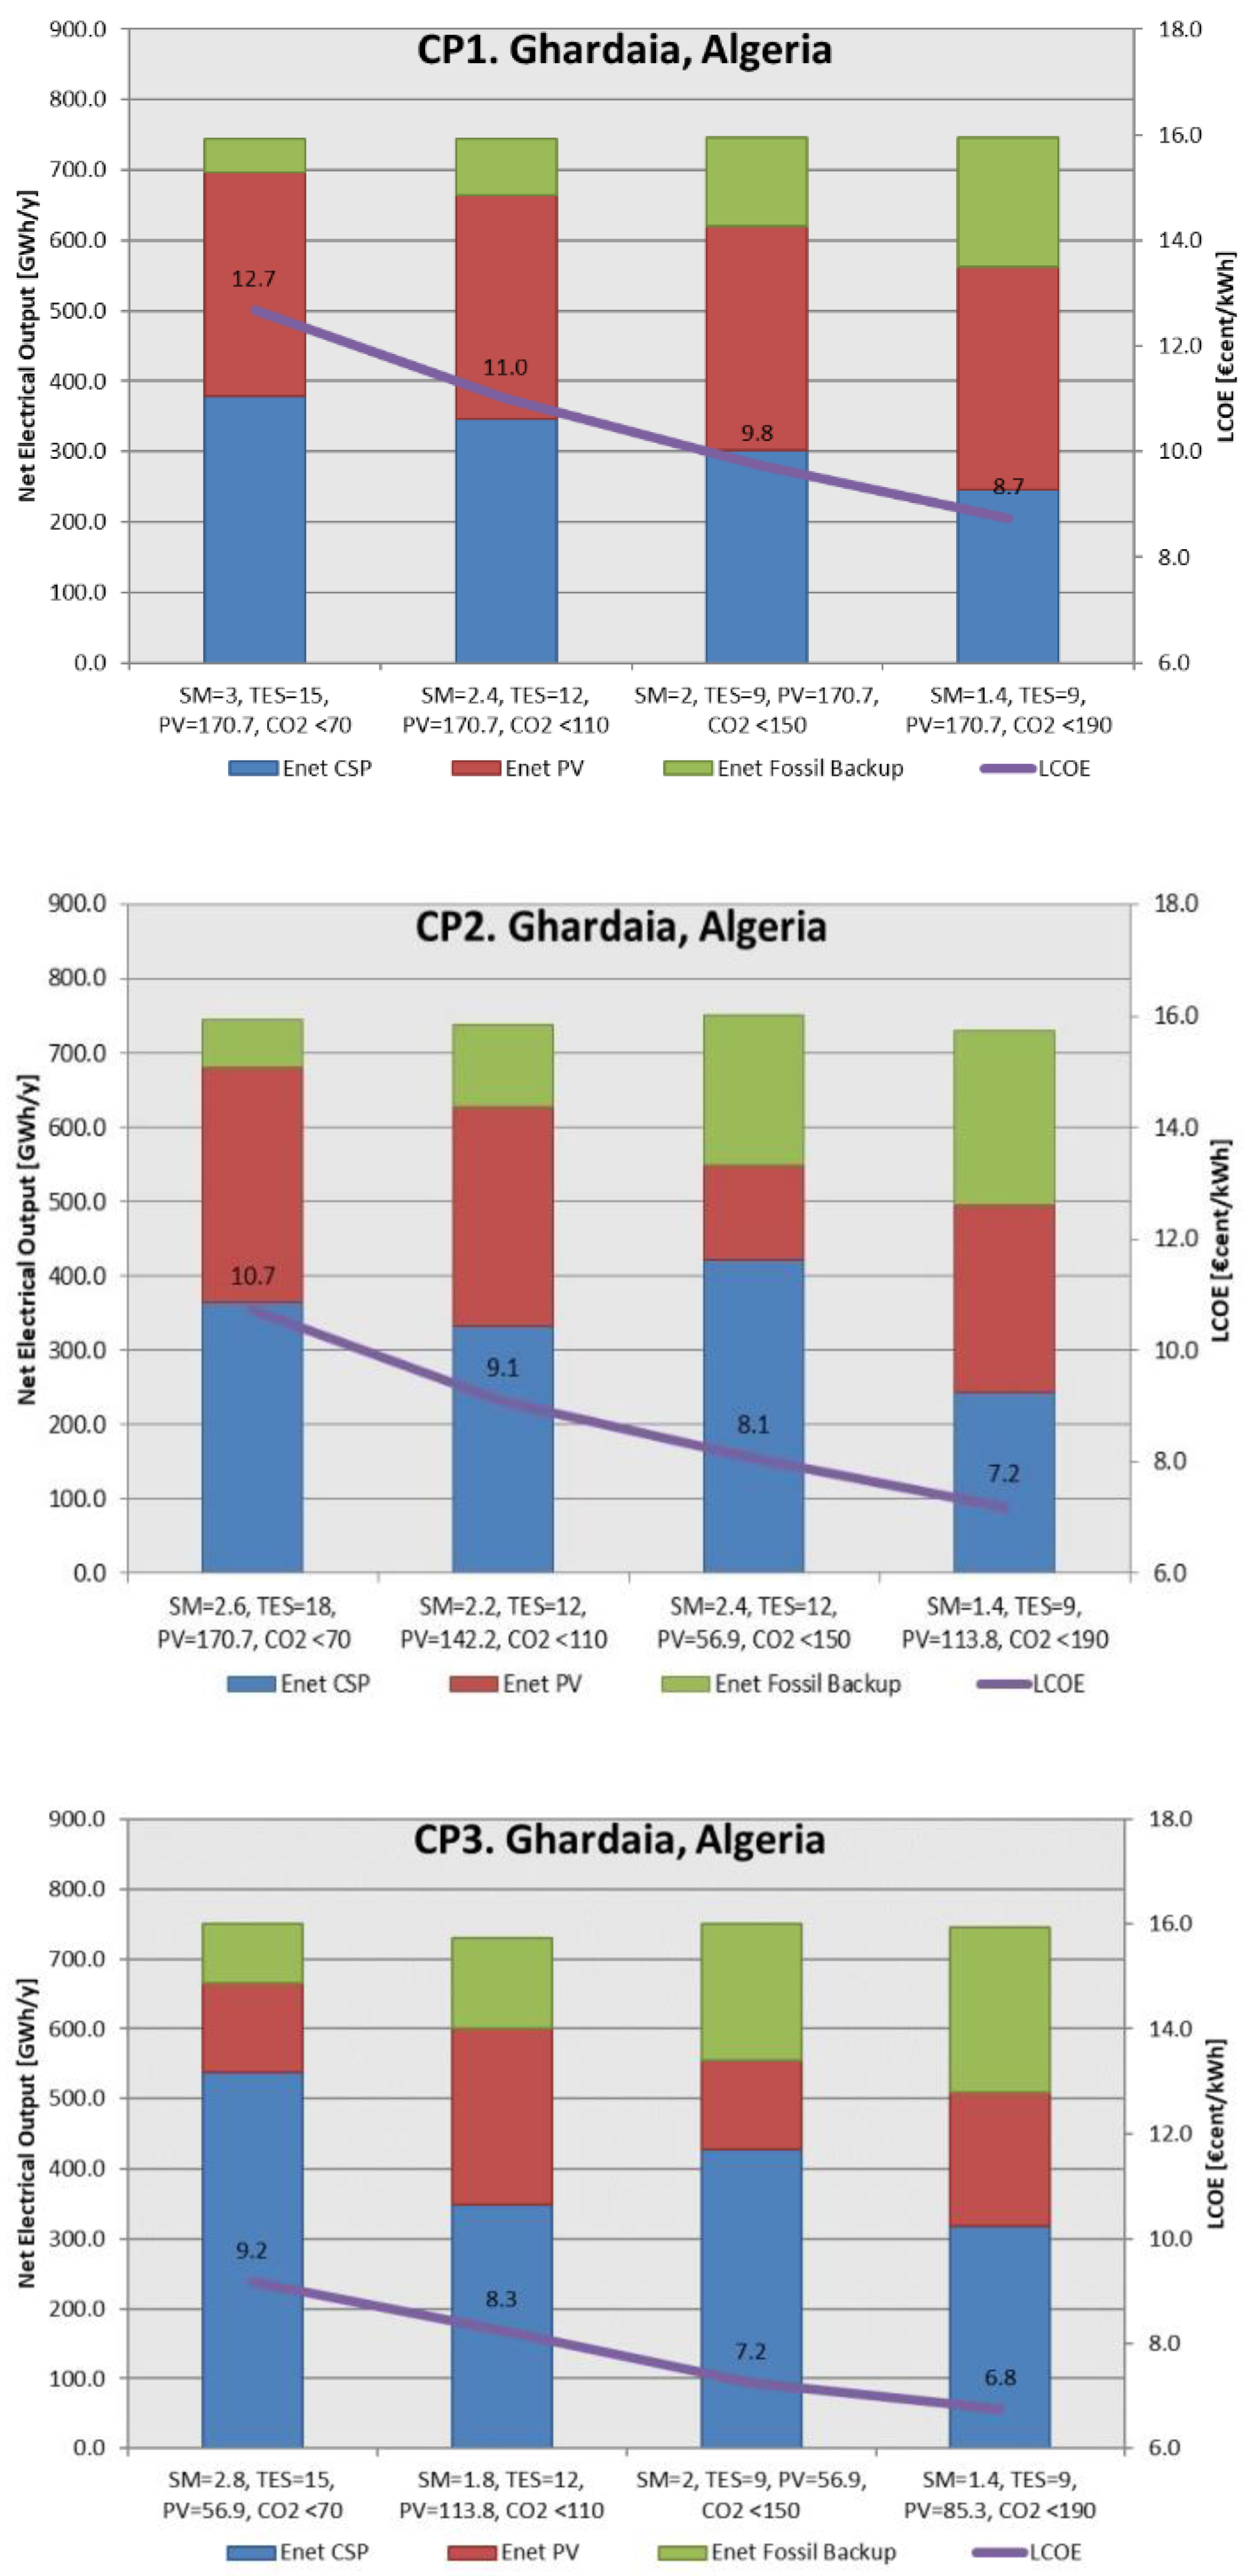
  • With very few exceptions, the CSP solar field, thermal storage and PV capacities required in the site in Tunisia are larger than for Algeria and Jordan.
  • For all configurations, the LCOE of Tunisia is on average 23% larger than that of Algeria, basically due to the difference in natural gas price, solar resource and larger energy demand.
  • With only one exception (CP2 case and <70 gCO2/kWh), the lowest LCOE is obtained for the site in Algeria, which, although it does not have the higher solar resource, has the lowest fuel price and energy demand.
Additionally, some general outcomes can be identified: for most cases, the fraction of energy from PV that leads to minimum LCOE is lower than the energy from CSP because, although the cost per MWh of PV is lower than that of CSP, PV is more modular and can be better adjusted to cover the remaining outlet power. For CSP plants with thermal storage, the size of components such as the power block (steam generator, turbine, generator and auxiliaries) and heat exchangers are fixed in order to be able to cover the maximum demand also during nighttime (in this case, 100 MWe). Therefore, once these components are purchased, it is economically efficient to obtain a higher energy from them and reduce the investment on the PV side.
For all three locations, the LCOE of the CP3 (solar tower + PV) is lower than the CP2 (parabolic trough with molten salt + PV). Moreover, CP2 is lower than CP1 (parabolic trough with thermal oil + PV). Although currently the commercially most implemented CSP technology is parabolic trough with thermal oil, it is expected that the other two plant types will result in lower LCOE. This also leads to a larger energy contribution of CSP than PV for the CP3 configuration.
For the case of large thermal energy storage (selected for low CO2 emissions), its capacity is not completely required during summer days with good solar irradiation. However, during winter, it allows the plant to operate continuously for several days even if a couple of cloudy days occur. For the strategy selected, the storage is not charged with energy from fossil fuel, PV electricity or temporal surplus energy from the electricity network; this could also be done if the local regulations allow it and it is proven technically and economically viable.

3.3. Effect of the Natural Gas Price on the Results

The hybrid plants analyzed have in average a maximal fraction of energy from fossil fuel of about 30%. This has been defined this way to limit the maximal emissions to 190 gCO2/kWhe. According to Mletzko, et al., state-of-the-art combined cycle plants have emissions of approximately 350 gCO2/kWhe [24]. For comparison, the LCOE of a 500 MW combined cycle gas turbine (CCGT) power plant in Germany as for 2018 ranges from 7.78 to EUR 9.96/kWh, depending on the assumed full load hours and CO2 certificate prices, with a natural gas price going from EUR 21/MWh in 2018 to an assumed EUR 33.8/MWh in 2035 (Fraunhofer ISE, 2018 [25]), which in average is similar to the fuel price assumed for Jordan and Tunisia in this paper. Table 9 compares the LCOE and specific CO2 emissions of hybrid CSP–PV plants in Tunisia compared to a CCGT power plant in Germany. Unexpectedly, the natural gas price has skyrocketed in Europe to above EUR 200/MWh in August 2022; nevertheless, due to the state-controlled gas price, this huge increase in prices has not been seen in Jordan, Algeria and Tunisia during 2022.
With the cost data used in the project HYMENSO by 2017, the LCOE is lower if the fraction of natural gas used is larger and no indirect cost or carbon emissions taxes are considered. Nevertheless, with the natural gas price of Jordan in 2017 of almost EUR 30/MWh, the LCOE curve becomes flat for higher emission levels. This means that permitting high CO2 emissions not always reduces the LCOE considerably or at all. Otherwise, if the fuel price is very low, as for the case of Algeria with EUR < 3/MWh, the LCOE decreases practically linear with the use of natural gas.
As seen during 2022, the natural gas price can be very volatile, having a strong impact in the electricity price generated from this source. This is key for promoting the installation of solar power plants, with a LCOE being more stable over time and independent of any market turbulences, since the biggest investment is done at the beginning of the project.
To exemplify the effect of the gas price, if for Tunisia the price increases from EUR 25.8/MWh (status 2017) up to EUR 100/MWh, the LCOE of the plant configuration CP3 with highest consumption will rise from EUR 9.0/kWh to EUR 15.7/kWh (+75%). Similarly, for the lower gas consumptions, an increase from EUR 10.5/kWh to EUR 13.0/kWh (+24%) is calculated, being then the optimum at lower gas consumption.

4. Discussion

In this study, results of hybrid CSP-PV plants simulations are presented. It uses local boundary conditions for three locations in Jordan, Algeria and Tunisia in order to investigate the configurations with optimized LCOE. It shows that PV plants co-located with CSP plants lead to competitive LCOE prices and can cover a large part of the local demand, also during nighttime. Solar field, thermal storage and PV plant size vary depending on the CSP technology selected and local conditions such as solar resource and fuel costs. When hybridizing with natural gas, the volatility of its price needs to be considered, since a high gas price (higher than EUR 40/MWh) shifts the optimum towards less gas consumption. One key for promoting the installation of solar power plants with low or no fossil fuel use in sunny regions is that the LCOE is more stable over time and independent of any market turbulences.
It is important to note that only the LCOE has been considered for the plant selection. If also the revenues related to different electricity tariffs depending on the time or season were considered, a higher tariff during the night could shift the optimum towards larger thermal storage and smaller PV field. A penalization to the CO2 emissions would shift the optima towards larger solar fields. Furthermore, if the local content is to be considered, probably the CSP plant would contribute more to achieve this goal than the PV components.
For countries with low gas reserves, solar-only plants can be more attractive for environmental and economic stability reasons. Generally, for countries in sunny regions with large gas reserves it would be economically more beneficial to use the high gas prices for exporting a large part of the fossil resources to non-sunny regions and invest the benefits in local renewable energy plants.

Author Contributions

Conceptualization, D.B. and M.R.; Data curation, D.B. and A.K.; Funding acquisition, D.B., A.K., A.A.-S., S.B. and A.G.; Investigation, D.B., A.A.-S., S.B., M.B. and A.G.; Methodology, D.B. and M.R.; Resources, D.B., A.A.-S., S.B., M.B. and A.G.; Software, D.B.; Validation, D.B.; Writing—original draft, D.B.; Writing—review & editing, M.R., A.K., S.B., M.B. and A.G. All authors have read and agreed to the published version of the manuscript.

Funding

This research was funded in the framework of ERANETMED ENERG-11-103. The funding was provided by the following entities: Germany’s Federal Ministry of Education and Research (funding number 01DH16023), Tunisian Ministry of Higher Education and Scientific Research (funding number ERANETMED EN012015), Greece’s European Regional Development Fund through the Operational Program “Human Resources Development, Education and Lifelong Learning” (funding number T3EPA-00098), Algerian’s General Directorate for scientific research and technological development (funding number 197882) and Jordan’s Higher Council of Science and Technology.

Data Availability Statement

General data have been published in other papers by the authors listed in the reference.

Acknowledgments

The authors acknowledge the technical support given by Massimo Moser, former researcher at DLR’s Institute of Engineering Thermodynamics on the techno-economic modelling of the hybrid power plants.

Conflicts of Interest

The authors declare no conflict of interest.

References

  1. Abu-Rumman, G.; Khdair, A.; Khdair, S. Current status and future investment potential in renewable energy in Jordan: An overview. Heliyon 2020, 6, e03346. [Google Scholar] [CrossRef] [PubMed]
  2. Electrical Power Systems and Renewable Energy. 2020. Available online: https://www.trade.gov/country-commercial-guides/tunisia (accessed on 27 August 2021).
  3. Regional Centre for Renewable Energy and Energy Efficiency, RECREEEE. Available online: https://rcreee.org/member_states/4012/ (accessed on 27 August 2021).
  4. Global Solar Power Tracker Database. Available online: https://globalenergymonitor.org/projects/global-solar-power-tracker/ (accessed on 15 December 2022).
  5. National Renewable Energy Laboratory. Available online: https://www.nrel.gov/csp/solarpaces/index.cfm (accessed on 25 March 2022).
  6. Ju, X.; Xu, C.; Han, X.; Zhang, H.; Wei, G.; Chen, L. Recent advances in the PV-CSP hybrid solar power technology. AIP Conf. Proc. 2017, 1850, 110006. [Google Scholar] [CrossRef] [Green Version]
  7. Benitez, D.; Kazantzidis, A.; Al-Salaymeh, A.; Bouaichaoui, S.; Ben Haj Ali, A.; Balghouthi, M.; Guizani, A. Study about Hybrid CSP—PV plants for the MENA Region. In Proceedings of the 10th International Renewable Energy Congress (IREC), Sousse, Tunisia, 26–28 March 2019; pp. 1–6. [Google Scholar] [CrossRef]
  8. Benitez, D.; Kazantzidis, A.; Al-Salaymeh, A.; Bouaichaoui, S.; Guizani, A. Combined CSP–PV plants for MENA Region. In Proceedings of the Global Conference on Renewables and Energy Efficiency for DEsert Regions (GCREEDER), Amman, Jordan, 3–5 April 2018. [Google Scholar]
  9. Green, A.; Diep, C.; Dunn, R.; Dent, J. High capacity factor CSP-PV hybrid systems. In Proceedings of the International Conference on Concentrating Solar Power and Chemical Energy Systems, SolarPACES, Beijing, China, 16–19 September 2014. [Google Scholar]
  10. Starke, A.R.; Cardemil, J.M.; Escobar, R.A.; Colle, S. Assessing the performance of hybrid CSP+PV plants in northern Chile. Solar Energy 2016, 138, 88–97. [Google Scholar] [CrossRef]
  11. Platzer, W.J. Combined solar thermal and photovoltaic power plants—An approach to 24h solar electricity? AIP Conf. Proc. 2016, 1734, 0700260. [Google Scholar] [CrossRef] [Green Version]
  12. Pan, C.; Dinter, F. Combination of PV and central receiver CSP plants for base load power generation in South Africa. Solar Energy 2017, 146, 379–388. [Google Scholar] [CrossRef]
  13. Chennaif, M.; Zahboune, H.; Elhafyani, M.; Zouggar, S. Electric System Cascade Extended Analysis for optimal sizing of an autonomous hybrid CSP/PV/wind system with Battery Energy Storage System and thermal energy storage. Energy 2021, 227, 120444. [Google Scholar] [CrossRef]
  14. Petrollese, M.; Cocco, D. Optimal design of a hybrid CSP-PV plant for achieving the full dispatchability of solar energy power plants. Solar Energy 2016, 137, 477–489. [Google Scholar] [CrossRef]
  15. Schüler, D.; Wilbert, S.; Geuder, N.; Affolter, R.; Wolfertstetter, F.; Prahl, C.; Röger, M.; Schroedter-Homscheidt, M.; Ghennioui, A.; Guizani, A.; et al. The Enermena Meteorological Network—Solar Radiation Measurements in the Mena Region. AIP Conf. Proc. 2016, 1734, 150008. [Google Scholar] [CrossRef] [Green Version]
  16. DLR, Institute of Solar Research, enerMENA Meteo Network. Available online: https://www.dlr.de/sf/en/desktopdefault.aspx/tabid-8680/12865_read-32404/ (accessed on 25 March 2022).
  17. Hoyer-Klick, C.; Hustig, F.; Schwandt, M.; Meyer, R. Characteristic meteorological years from ground and satellite data. In Proceedings of the 15th SolarPACES Symposium, Berlin, Germany, 15–18 September 2009. [Google Scholar]
  18. Spiros, A.; Kalogirou, S.A. Solar Thermal Energy; Encyclopedia of Sustainability Science and Technology Series; Springer: Berlin/Heidelberg, Germany, 2022; ISBN 978-1-0716-1422-8. [Google Scholar]
  19. Available online: https://www.solarpaces.org/how-csp-works/ (accessed on 25 March 2022).
  20. INSEL Software, Developed by Doppelintegral GmbH. Available online: http://www.insel.eu/index.php?id=301&L=1 (accessed on 10 December 2016).
  21. THERMVOLT Project, Techno-Economic Analysis and Comparison of CSP with Hybrid PV-Battery Power Plants—DLR, M+W, Fichtner; Lappeenranta University: Lappeenranta, Finland, 2016.
  22. Moser, M.; Trieb, F.; Kern, J.; Allal, H.; Cottret, N.; Scharfe, J.; Tomasek, M.; Savoldi, E. The MED-CSD Project: Potential for Concentrating Solar Power Desalination Development in Mediterranean Countries. J. Sol. Energy Eng. 2011, 133, 031012. [Google Scholar] [CrossRef]
  23. Laukemann, T.; Verdier, F.; Baten, R.; (Fichtner) Trieb, F.; Moser, M.; Fichter, T. (DLR) MENA Regional Water Outlook; Phase II, Desalination Using Renewable Energy, Study Commissioned by the World Bank; World Bank: Washington, DC, USA, 2012. [Google Scholar]
  24. Mletzkoa, J.; Ehlersa, S.; Kathera, A. Comparison of natural gas combined cycle power plants with post combustion and oxyfuel technology at different CO2 capture rates. Energy Procedia 2016, 86, 2–11. [Google Scholar] [CrossRef]
  25. Frauhofer ISE. Levelized Cost of Electricity Renewable Energy Technologies. 2018. Available online: https://www.ise.fraunhofer.de/content/dam/ise/en/documents/publications/studies/EN2018_Fraunhofer-ISE_LCOE_Renewable_Energy_Technologies.pdf (accessed on 29 November 2019).
Figure 1. Electricity generation for Algeria, Tunisia and Jordan. Source: Our World in Data based on BP Statistical Review of World Energy (2022) and on Ember’s Global Electricity Review (2022). OurWorldInData.org/energy, CC BY.
Energies 16 00924 g001
Figure 2. Share of electricity production by source for Tunisia, Algeria and Jordan. Source: Our World in Data based on BP Statistical Review of World Energy. OurWorldInData.org/energy, CC BY.
Energies 16 00924 g002
Figure 3. Share of electricity production from renewables for Tunisia, Algeria and Jordan. Source: Our World in Data based on BP Statistical Review of World Energy. OurWorldInData.org/energy, CC BY.
Energies 16 00924 g003
Figure 4. Demand profile for: (a) Ma’an, Jordan, (b) Tataouine, Tunisia and (c) Ghardaia, Algeria for summer “S” and winter W”. Source: HYMENSO partners.
Energies 16 00924 g004
Figure 5. Sketch of a CSP + PV + gas burner hybrid plant (CP3 case).
Energies 16 00924 g005
Figure 6. Weekly energy production example for Ma’an, Jordan.
Energies 16 00924 g006
Figure 7. Energy production per configuration case (CP) and location. Solar multiple (SM), thermal storage capacity in full load hours (TES), nominal PV capacity in MW and CO2 emissions in g CO2/kWhe.
Energies 16 00924 g007aEnergies 16 00924 g007bEnergies 16 00924 g007c
Table 1. Meteorological data of selected sites.
ItemUnitTunisiaAlgeriaJordan
Location-TatouineGhardaiaMa’an
Latitude(°) N32.97432.38630.172
Longitude(°) E10.4853.7835.818
Altitude(m)2104631069
DNI(kWh/m2 a)226423682645
GHI(kWh/m2 a)207821552275
Ambient temperature (mean/min/max)(°C)20.4/0.2/43.822.5/1.9/45.118.8/−3.7/41.2
Wind velocity
(mean/min/max)
(m/s)3.2/0/15.92.1/0/8.93.7/0/18.1
Table 2. Water and natural gas costs.
ItemUnitTunisiaAlgeriaJordan
Water costEUR/m30.200.040.06
Natural gas costEUR/MWh25.802.1328.86
Table 3. Main technology data for CP3 with solar multiple = 2.4.
ItemUnitValue
Number of heliostats(-)8860
Net reflective area per heliostat(m2)121
Tower height(m)275.7
Optical efficiency of solar field design(%)68.5
Total land area(m2)5,407,294
Receiver type(-)External, cylindrical tube receiver
Heat transfer fluid and storage media(-)Solar Salt
Solar field thermal power design(MW)628.3
Receiver efficiency design(-)0.886
HTF inlet temperature(°C)290
HTF outlet temperature(°C)580
Mean flux density design(kW/m2)575
Storage discharge time(full load hours)10
Storage thermal capacity(MWhth)2618
Design net electrical power(MWel)100
Design gross electrical power(MWel)112.1
Power block design gross efficiency(%)42.82
Cooling type(-)Air Cooled Condenser
Live steam parameters(°C/bar)565/165
Inlet/outlet temperature HTF steam generator(°C)239/565
Power block thermal input(MWth)261.8
Back-up fossil fuel(-)Natural gas
Thermodynamic efficiency of burner(%)93
Burner design thermal capacity(MWth)300
PV manufacturer-JA Solar
PV module Type-JAP6 72-320/3BB
Tracking(yes/no)Yes. Single axis
Nominal module powerW380
Nominal module efficiency%19.6
Number of serial modules-20
Number of parallel module strings-220
Inverter type-SunnyCentral CP1000-XT
Nominal inverter powerkW1190
Nominal inverter DC voltageV688
Inverter design efficiency%98.7
Wiring losses at full power (STC), AC+DC%1.44
Module quality + module array losses%1.1
Other losses%2
PV/Battery(yes/no)no
Module plane inclination variable
Required power factorCos(phi)1.0
Table 4. Main economic data for CP3.
ItemUnitValue
Heliostat Field (incl. Land & HTF)EUR per m2 mirror apertureTunisia: 103.68
Algeria: 103.72
Jordan: 104.42
Tower (275 m height)Mio. EUR28.4
ReceiverEUR/kWth97
Thermal StorageEUR/kWhth22.6
Power Block (incl. Cooling)EUR/kWel968
Fossil Backup SystemEUR/kWth50
Contingency% of direct cost26
CSP O&M and insurance% of direct cost/y2.3
Water Cost for CSP plantEUR/m3Tunisia: 0.20
Algeria: 0.04
Jordan: 0.06
Natural Gas priceEUR/MWh LHVTunisia: 25.80
Algeria: 2.13
Jordan: 28.86
PV modulesEUR/kWp809
InvertersEUR/kWp inverterincl. in modules cost
TrackersEUR/kWp154
PV O&M and insurance% DC/y1.5
Debt periody25
Discount rate%7
Annual degradation%/y0.3
Plant availability%97
Table 5. Variation of key design parameters to identify optimal configurations.
ParameterMinimumMaximumStep Size
Thermal energy storage capacity3 h21 h3 h
CSP solar multiple1.83.40.2
PV capacity0 MW (DC)227.2 MW (DC)28.4 MW
Table 6. Key results of LCOE optimization for CP1 case.
CP1 ConfigurationTunisiaAlgeriaJordan
CO2 emissions67.869.966.5
CSP solar multiple [-]3.43.02.8
Thermal storage capacity [h]181212
PV capacity [MW]256170.7199.1
LCOE15.211.012.67
CO2 emissions107.9101.4106.5
CSP solar multiple [-]2.82.42.0
Thermal storage capacity [h]121212
PV capacity [MW]199.1170.7142.2
LCOE12.7811.0011.05
CO2 emissions140.5147.6146.5
CSP solar multiple [-]2.22.01.4
Thermal storage capacity [h]129.012
PV capacity [MW]170.7170.7142.2
LCOE11.759.7610.57
CO2 emissions182.1183.2182.7
CSP solar multiple [-]1.81.41.4
Thermal storage capacity [h]99.09.0
PV capacity [MW]170.7170.7113.8
LCOE11.098.7310.24
Table 7. Key results of LCOE optimization for CP2 case.
CP2 ConfigurationTunisiaAlgeriaJordan
CO2 emissions69.868.766.3
CSP solar multiple [-]3.42.62.6
Thermal storage capacity [h]181815
PV capacity [MW]170.7170.7142.2
LCOE12.3410.7410.66
CO2 emissions105.5105.4101
CSP solar multiple [-]2.62.21.8
Thermal storage capacity [h]121212
PV capacity [MW]170.7142.2142.2
LCOE10.839.089.51
CO2 emissions141.2150145.3
CSP solar multiple [-]22.42
Thermal storage capacity [h]121212
PV capacity [MW]142.256.956.9
LCOE9.978.079.13
CO2 emissions180.2188.8183.4
CSP solar multiple [-]1.41.41.4
Thermal storage capacity [h]1299
PV capacity [MW]142.2113.885.3
LCOE9.537.198.84
Table 8. Key results of LCOE optimization for CP3 case.
CP3 ConfigurationTunisiaAlgeriaJordan
CO2 emissions6966.369.4
CSP solar multiple [-]3.22.81.8
Thermal storage capacity [h]181512
PV capacity [MW]56.956.9142.2
LCOE10.59.189.21
CO2 emissions103.7106.5107
CSP solar multiple [-]31.82
Thermal storage capacity [h]121212
PV capacity [MW]28.4113.856.9
LCOE9.58.268.72
CO2 emissions141.1148.6145.3
CSP solar multiple [-]222
Thermal storage capacity [h]1299
PV capacity [MW]85.356.928.4
LCOE9.27.248.6
CO2 emissions184.1182.8188.3
CSP solar multiple [-]2.21.41.4
Thermal storage capacity [h]999
PV capacity [MW]28.485.356.9
LCOE96.768.61
Table 9. Comparison between the LCOE and the CO2 emissions.
TechnologyLocationLCOE
€cent/kWh
gCO2/kWhe
CP1Tunisia11.1182
CP2Tunisia9.5180
CP3Tunisia9.0184
CCGTGermany8.9350
Disclaimer/Publisher’s Note: The statements, opinions and data contained in all publications are solely those of the individual author(s) and contributor(s) and not of MDPI and/or the editor(s). MDPI and/or the editor(s) disclaim responsibility for any injury to people or property resulting from any ideas, methods, instructions or products referred to in the content.

