
Utilisation of Spatial Data in Energy Biomass Supply Chain Research—A Review

Abstract
:1. Introduction
Purpose of the Work
- A dataset fulfilling the requirements is not available or is too expensive (e.g., in countries or regions in which the public distribution of spatial datasets is restricted);
- Collecting the required data independently is too laborious or expensive (e.g., accurate data presumes a vast amount of field measurements);
- Data processing capacity is insufficient with regard to the high spatial resolution (e.g., the large spatial extent of the study area and the high number of origin and/or destination locations);
- The importance of spatial information is low in relation to the scope of the study.
2. Materials and Methods
2.1. Bibliometric Analysis
2.2. Paper Screening
- Does the article include a case study in which
- ∘
- biomass is considered as a source of energy and
- ∘
- in which biomass is procured from several geographical locations, and moved to one or many locations for end-use or intermediate storage purposes?
- Was the focus area of the case study smaller than or equal to 10,000,000 km2?
- Was the biomass transported by road, rail, waterway or by pipelines from the origin to the destination, or to an intermediate location mentioned in the case study?
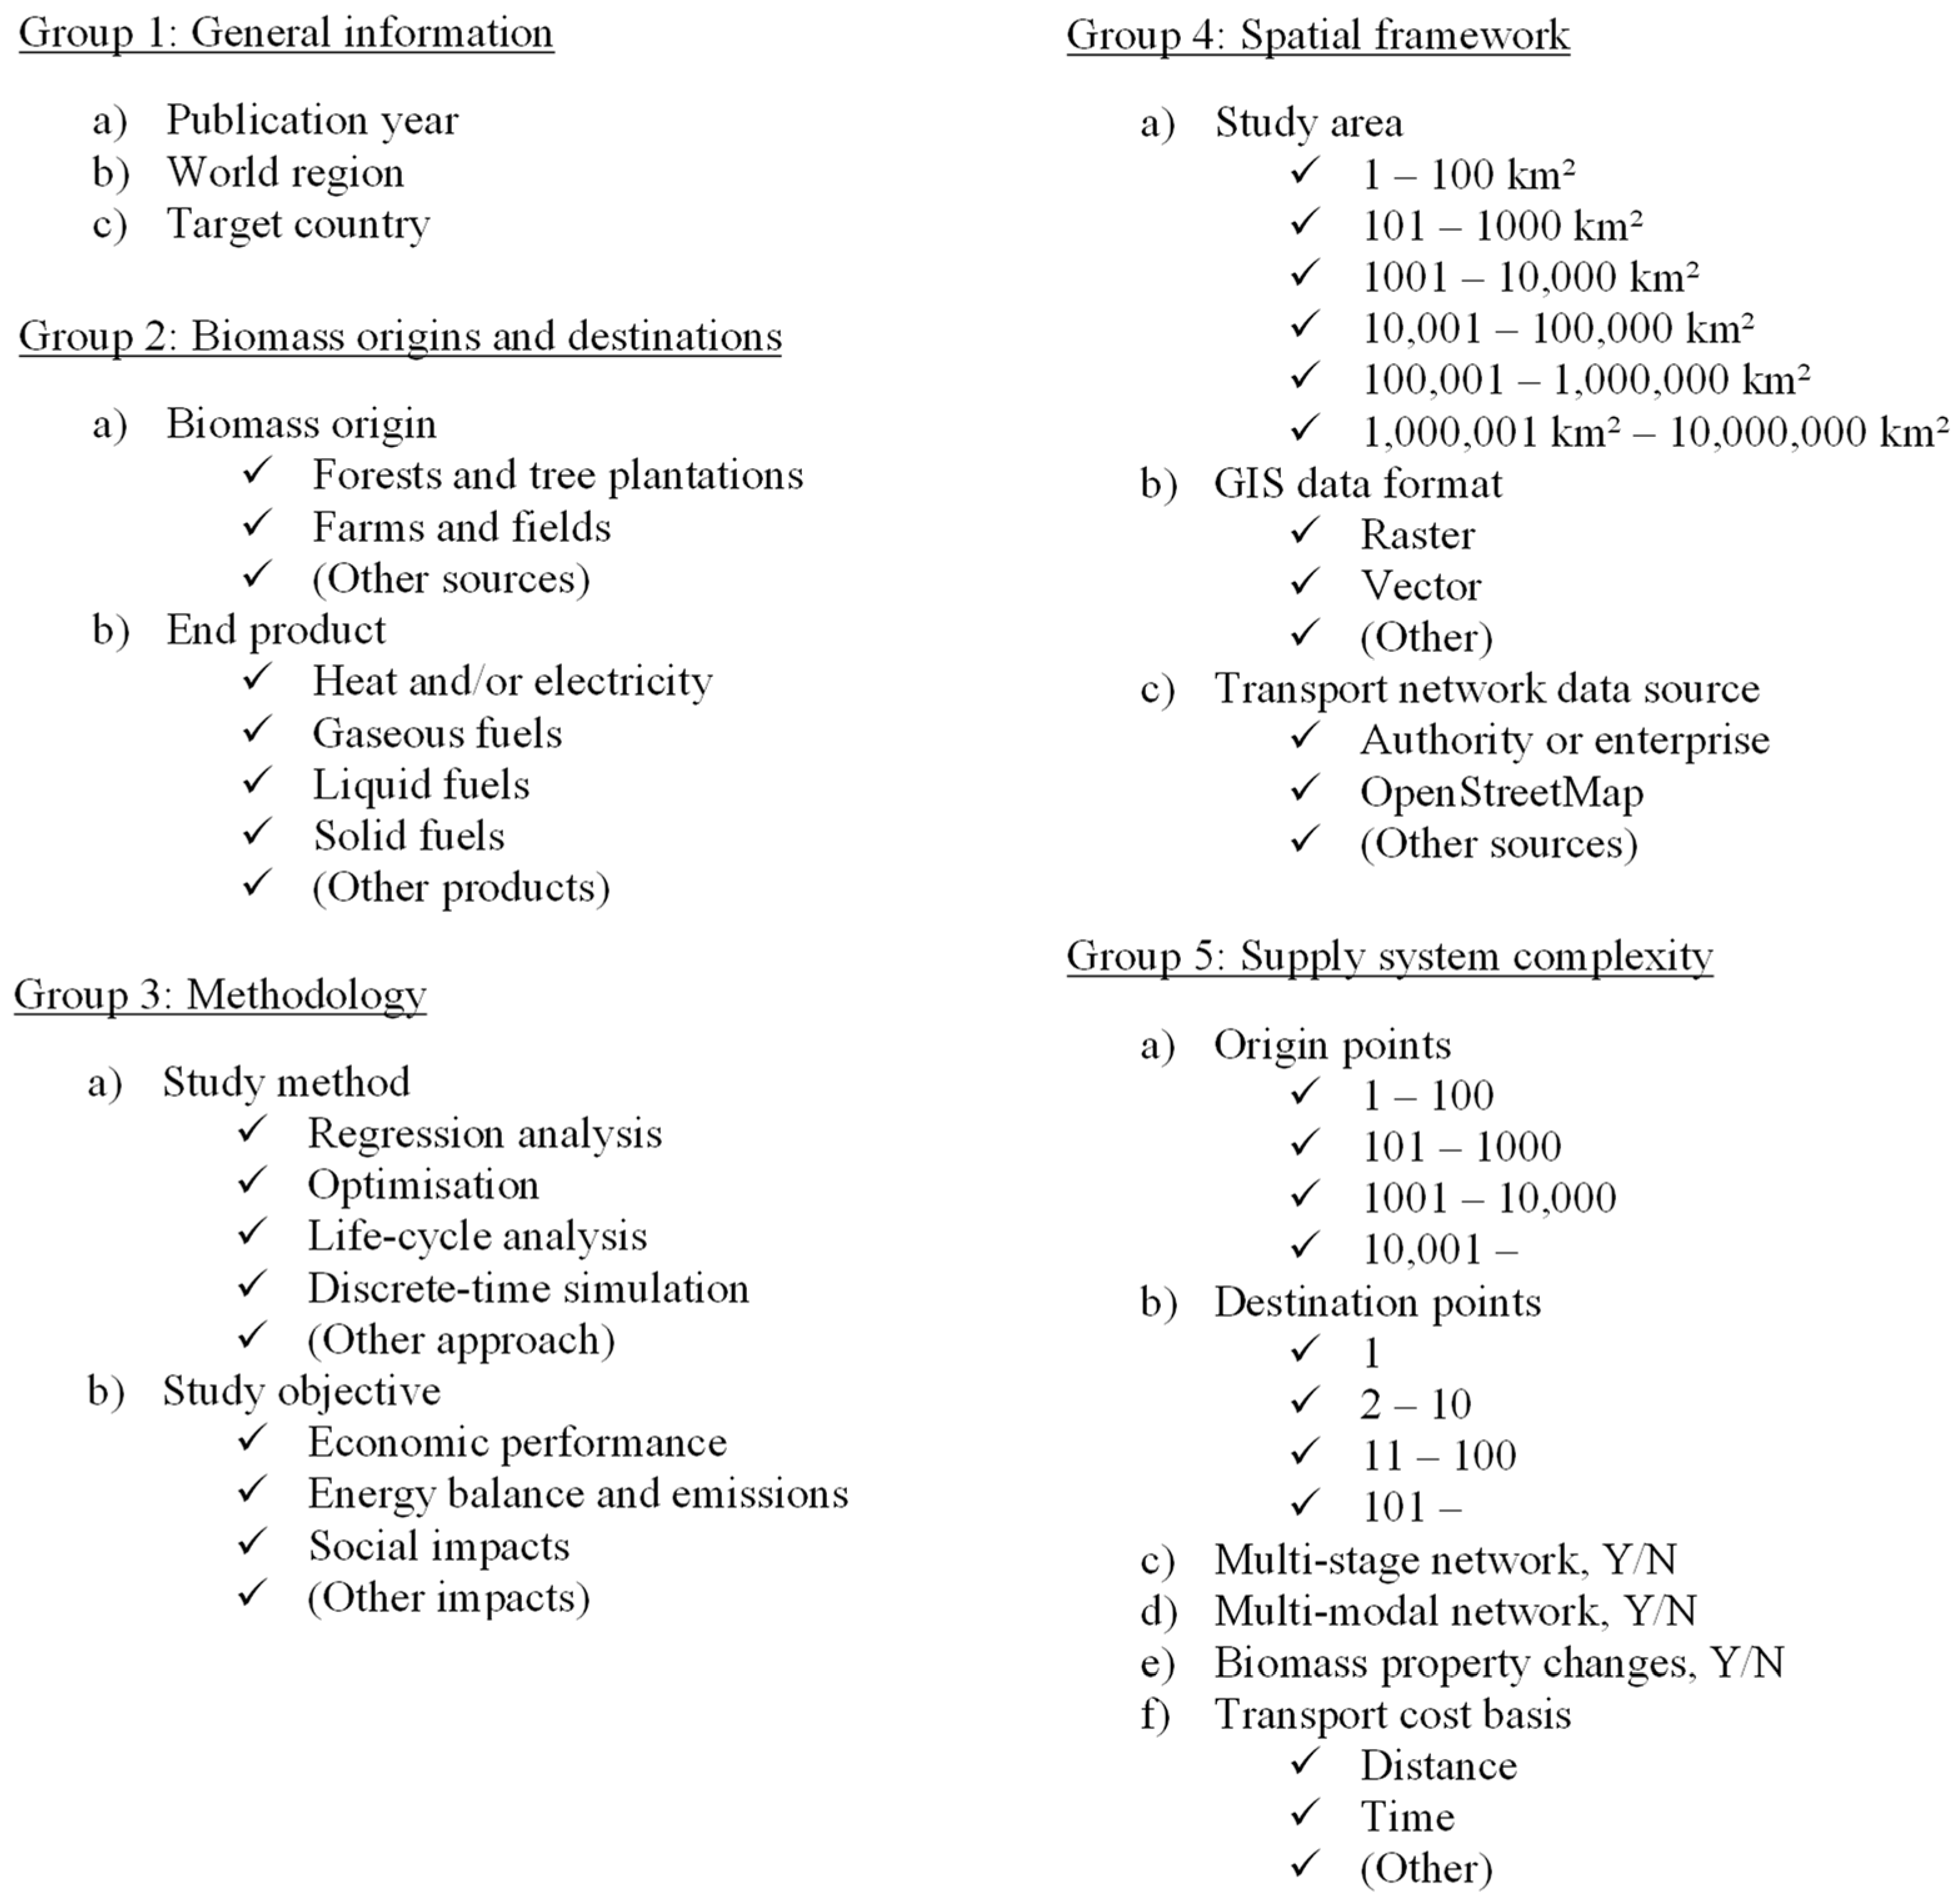
2.3. Classification of Case Studies
3. Results
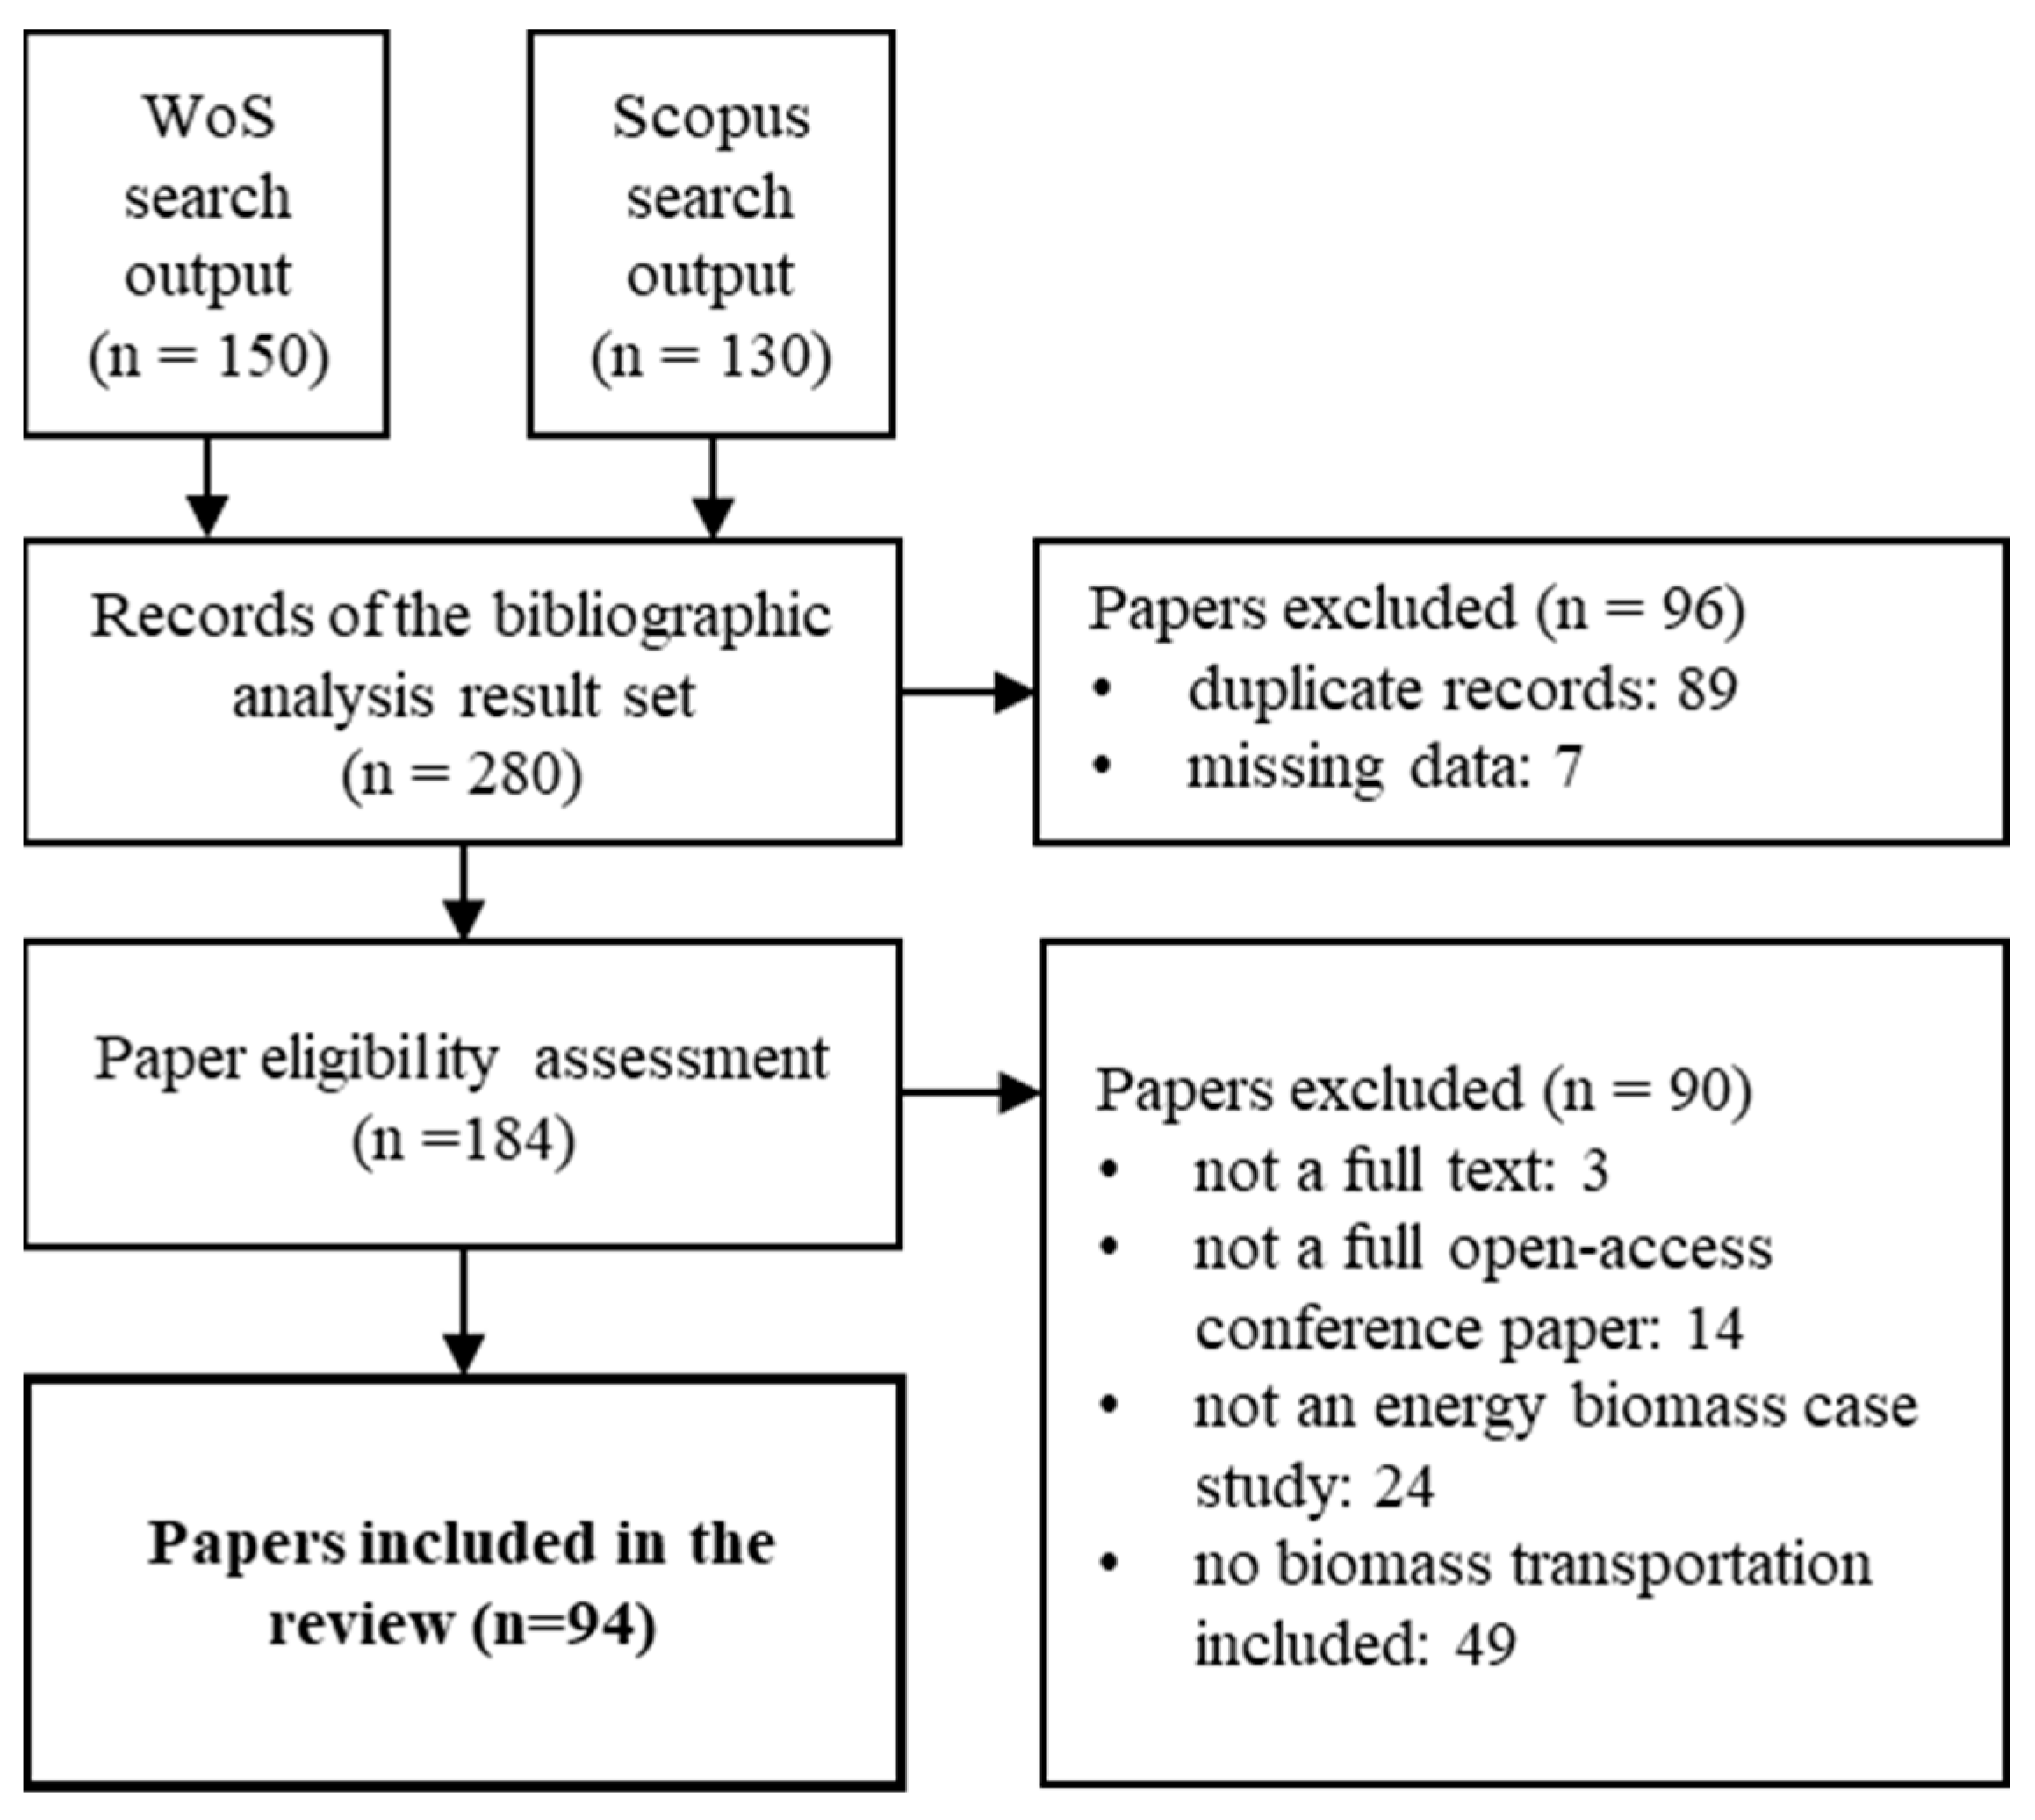
3.1. Bibliometric Analysis and Paper Screening
3.2. Classification Analysis
4. Discussion
Supplementary Materials
Author Contributions
Funding
Data Availability Statement
Conflicts of Interest
Appendix A
The Results of the Classification Analysis, in Relation to the Publication Year of the Study

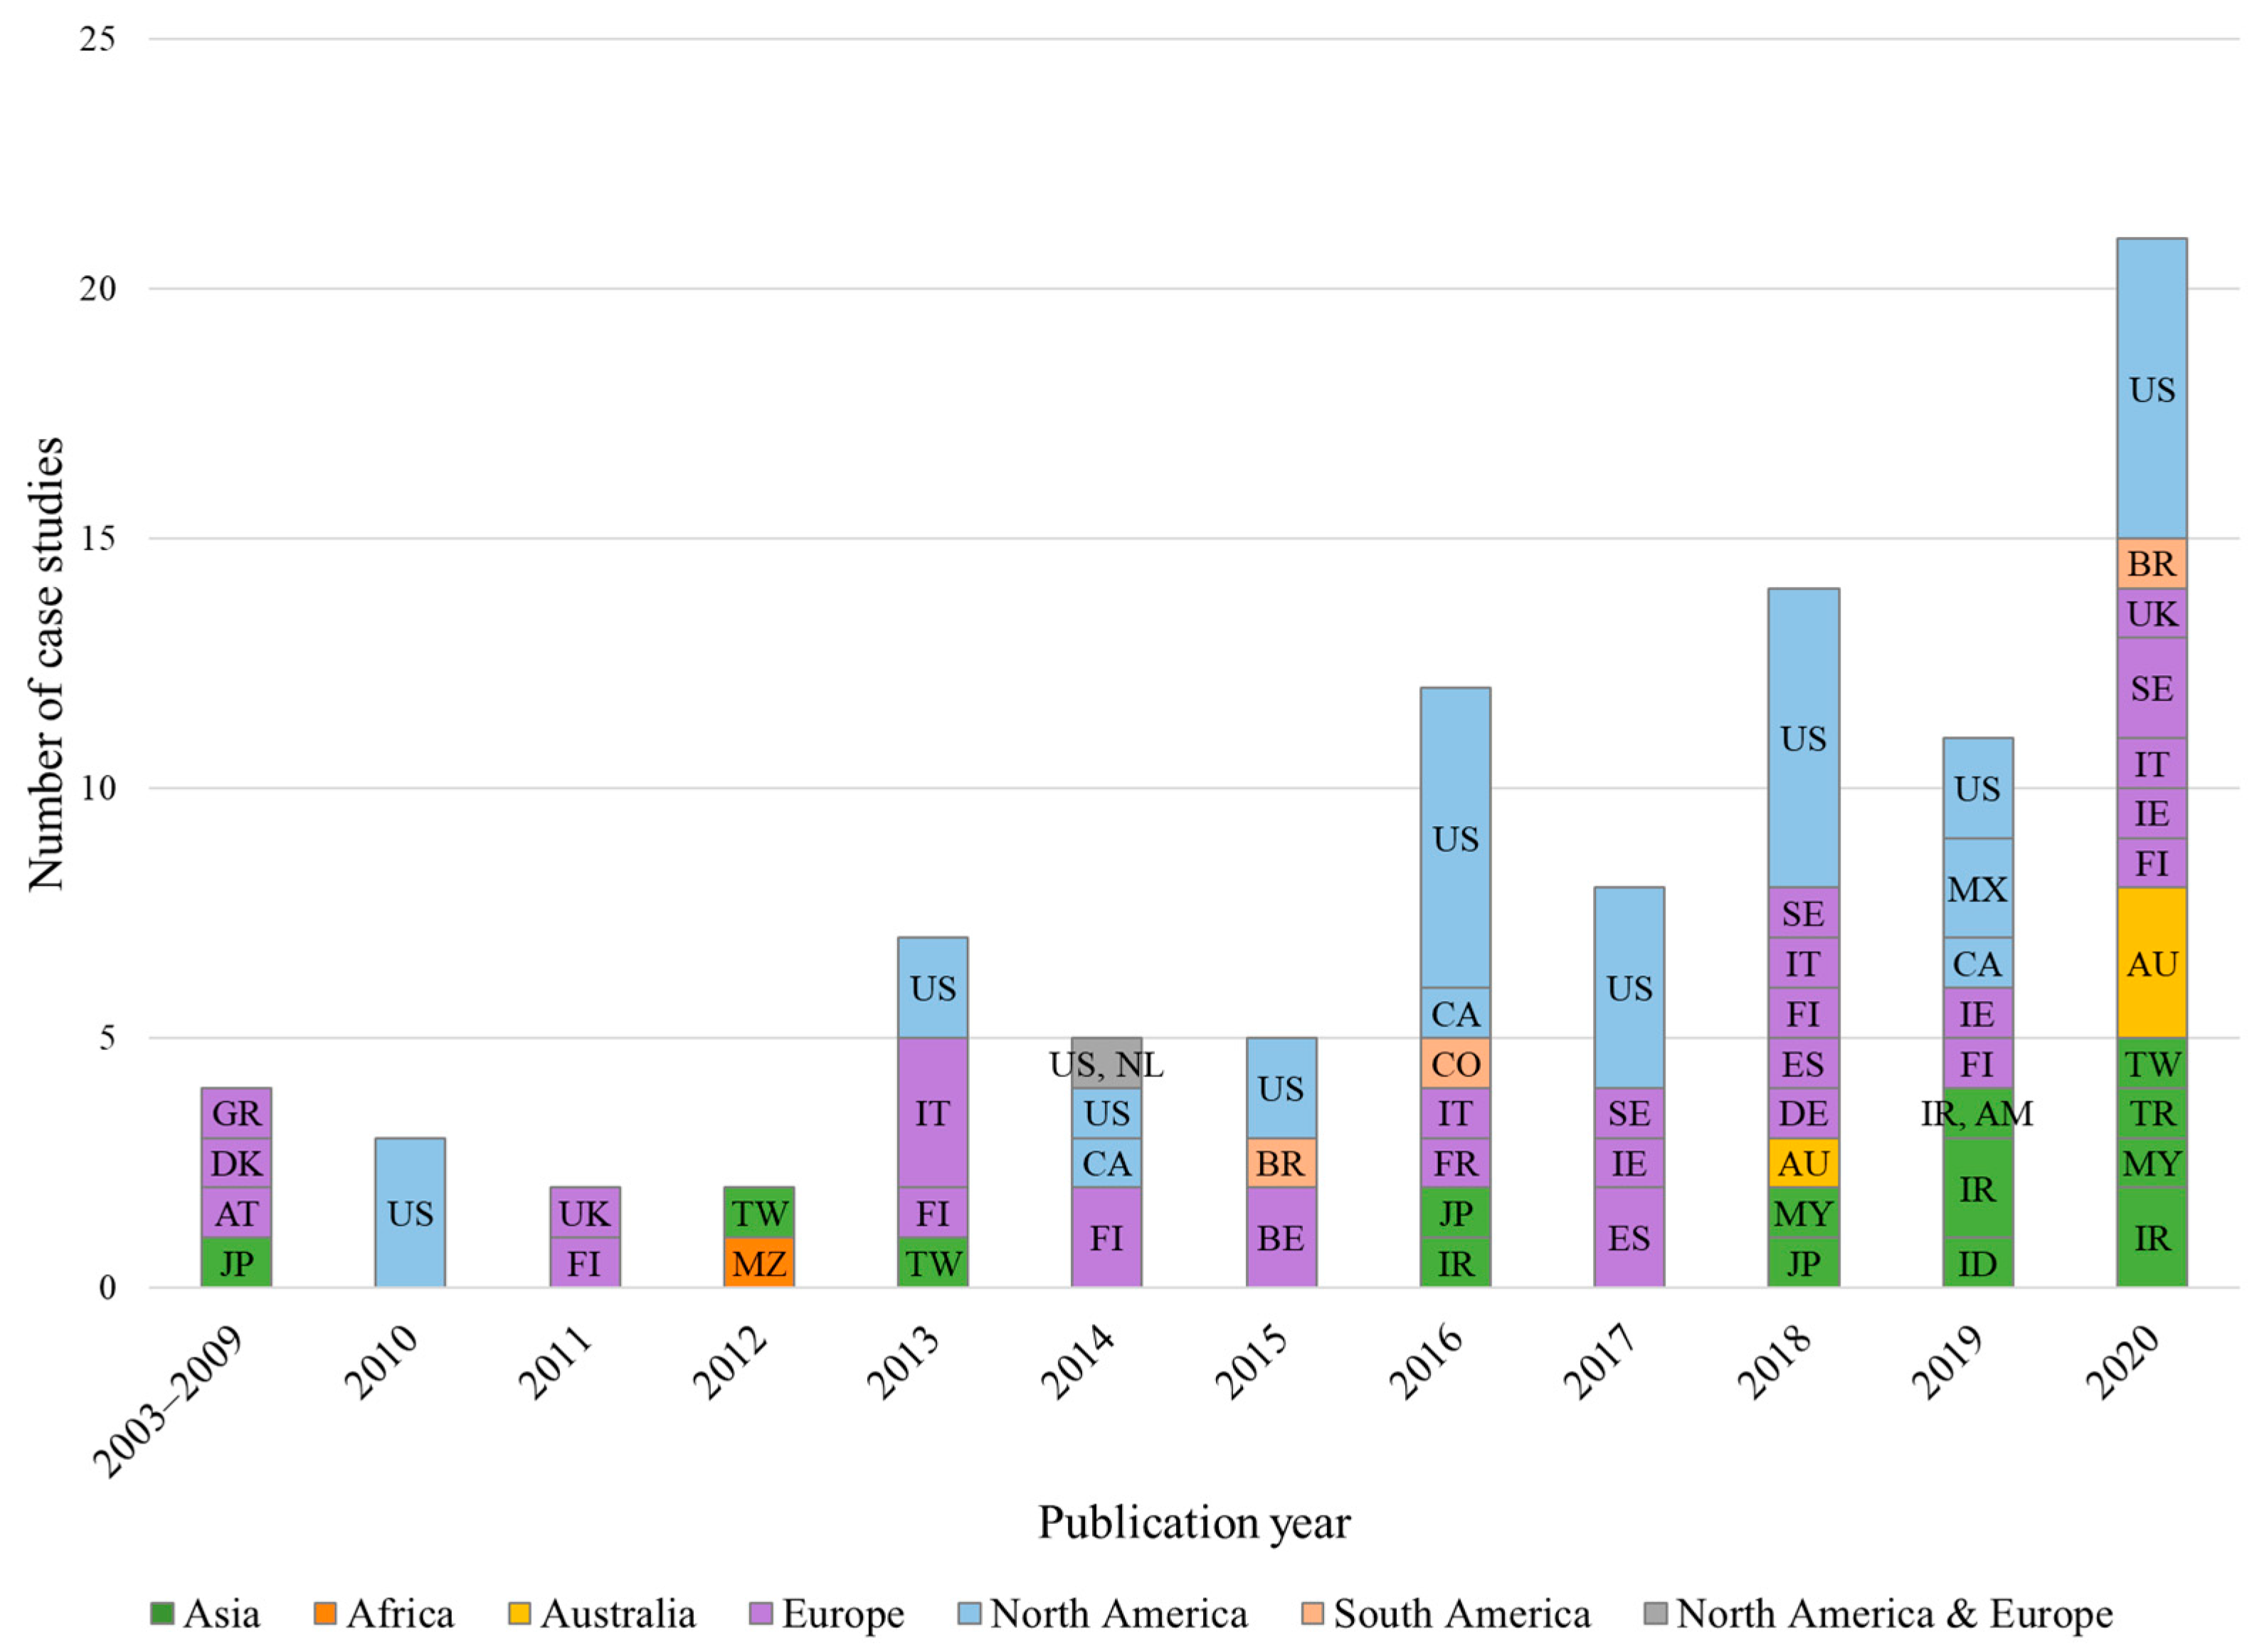
| 1 b. World Region | 2003–2009 | 2010 | 2011 | 2012 | 2013 | 2014 | 2015 | 2016 | 2017 | 2018 | 2019 | 2020 | Total |
|---|---|---|---|---|---|---|---|---|---|---|---|---|---|
| Africa | - | - | - | 1 | - | - | - | - | - | - | - | - | 1 |
| Asia | 1 | - | - | 1 | 1 | - | - | 2 | - | 2 | 4 | 5 | 16 |
| Australia | - | - | - | - | - | - | - | - | - | 1 | - | 3 | 4 |
| Europe | 3 | - | 2 | - | 4 | 2 | 2 | 2 | 4 | 5 | 2 | 6 | 32 |
| North America | - | 3 | - | - | 2 | 2 | 2 | 7 | 4 | 6 | 5 | 6 | 37 |
| South America | - | - | - | - | - | - | 1 | 1 | - | - | - | 1 | 3 |
| North America & Europe | - | - | - | - | - | 1 | - | - | - | - | - | - | 1 |
| Total | 4 | 3 | 2 | 2 | 7 | 5 | 5 | 12 | 8 | 14 | 11 | 21 | 94 |
| 1 c. Focus Country | 2003–2009 | 2010 | 2011 | 2012 | 2013 | 2014 | 2015 | 2016 | 2017 | 2018 | 2019 | 2020 | Total |
|---|---|---|---|---|---|---|---|---|---|---|---|---|---|
| AT | 1 | - | - | - | - | - | - | - | - | - | - | - | 1 |
| AU | - | - | - | - | - | - | - | - | - | 1 | - | 3 | 4 |
| BE | - | - | - | - | - | - | 2 | - | - | - | - | - | 2 |
| BR | - | - | - | - | - | - | 1 | - | - | - | - | 1 | 2 |
| CA | - | - | - | - | - | 1 | - | 1 | - | - | 1 | - | 3 |
| CO | - | - | - | - | - | - | - | 1 | - | - | - | - | 1 |
| DE | - | - | - | - | - | - | - | - | - | 1 | - | - | 1 |
| DK | 1 | - | - | - | - | - | - | - | - | - | - | - | 1 |
| ES | - | - | - | - | - | - | - | - | 2 | 1 | - | - | 3 |
| FI | - | - | 1 | - | 1 | 2 | - | - | - | 1 | 1 | 1 | 7 |
| FR | - | - | - | - | - | - | - | 1 | - | - | - | - | 1 |
| GR | 1 | - | - | - | - | - | - | - | - | - | - | - | 1 |
| ID | - | - | - | - | - | - | - | - | - | - | 1 | - | 1 |
| IE | - | - | - | - | - | - | - | - | 1 | - | 1 | 1 | 3 |
| IR | - | - | - | - | - | - | - | 1 | - | - | 2 | 2 | 5 |
| IT | - | - | - | - | 3 | - | - | 1 | - | 1 | - | 1 | 6 |
| JP | 1 | - | - | - | - | - | - | 1 | - | 1 | - | - | 3 |
| MX | - | - | - | - | - | - | - | - | - | - | 2 | - | 2 |
| MY | - | - | - | - | - | - | - | - | - | 1 | - | 1 | 2 |
| MZ | - | - | - | 1 | - | - | - | - | - | - | - | - | 1 |
| SE | - | - | - | - | - | - | - | - | 1 | 1 | - | 2 | 4 |
| TR | - | - | - | - | - | - | - | - | - | - | - | 1 | 1 |
| TW | - | - | - | 1 | 1 | - | - | - | - | - | - | 1 | 3 |
| UK | - | - | 1 | - | - | - | - | - | - | - | - | 1 | 2 |
| US | - | 3 | - | - | 2 | 1 | 2 | 6 | 4 | 6 | 2 | 6 | 32 |
| IR, AM | - | - | - | - | - | - | - | - | - | - | 1 | - | 1 |
| US, NL | - | - | - | - | - | 1 | - | - | - | - | - | - | 1 |
| 2 a. Biomass Origin | 2003–2009 | 2010 | 2011 | 2012 | 2013 | 2014 | 2015 | 2016 | 2017 | 2018 | 2019 | 2020 | Total |
|---|---|---|---|---|---|---|---|---|---|---|---|---|---|
| 1 From forests and tree plantations | 3 | - | 2 | - | 2 | 3 | - | 5 | 6 | 5 | 4 | 8 | 38 |
| 2 From farms and fields | 1 | 1 | - | 1 | 3 | - | 4 | 4 | 1 | 4 | 4 | 4 | 27 |
| 3 From other sources | - | - | - | - | - | - | - | 1 | - | - | 2 | 5 | 8 |
| 1, 2 | - | - | - | 1 | 1 | 2 | 1 | 1 | 1 | 3 | - | 1 | 11 |
| 1, 3 | - | - | - | - | - | - | - | - | - | 1 | - | 1 | 2 |
| 2, 3 | - | - | - | - | - | - | - | - | - | - | - | 1 | 1 |
| 1, 2, 3 | - | 2 | - | - | 1 | - | - | 1 | - | 1 | 1 | 1 | 7 |
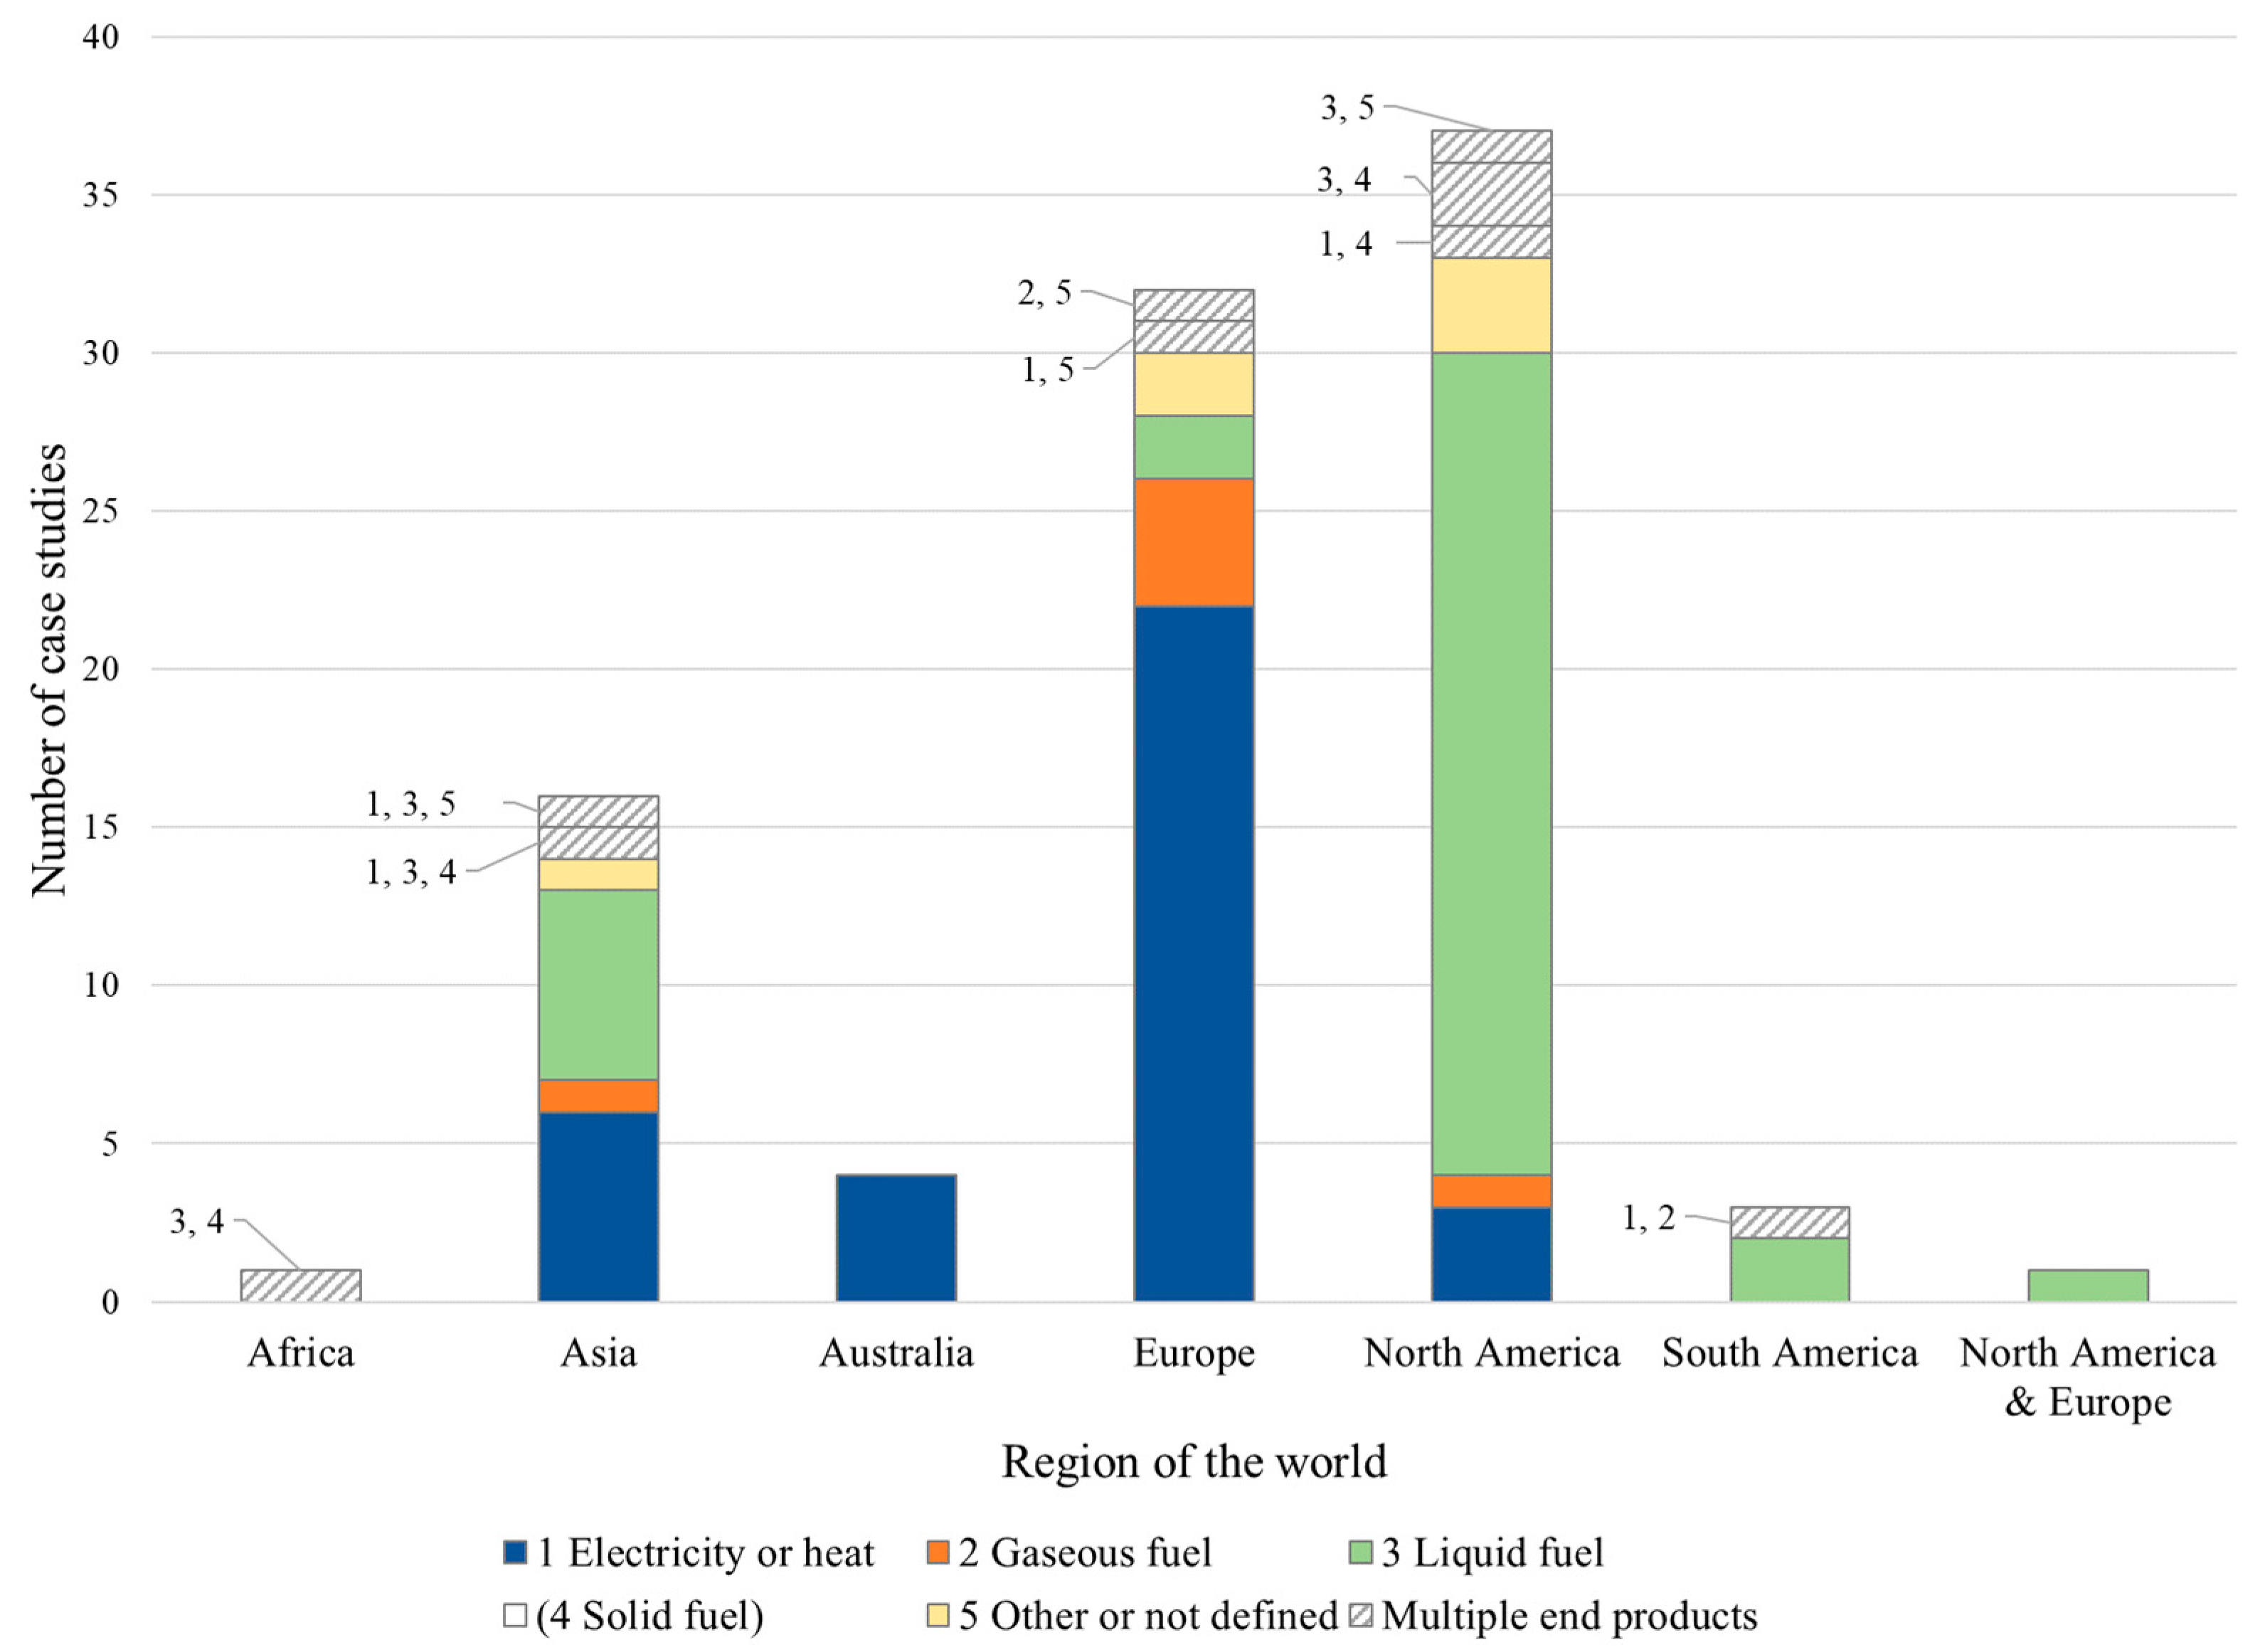
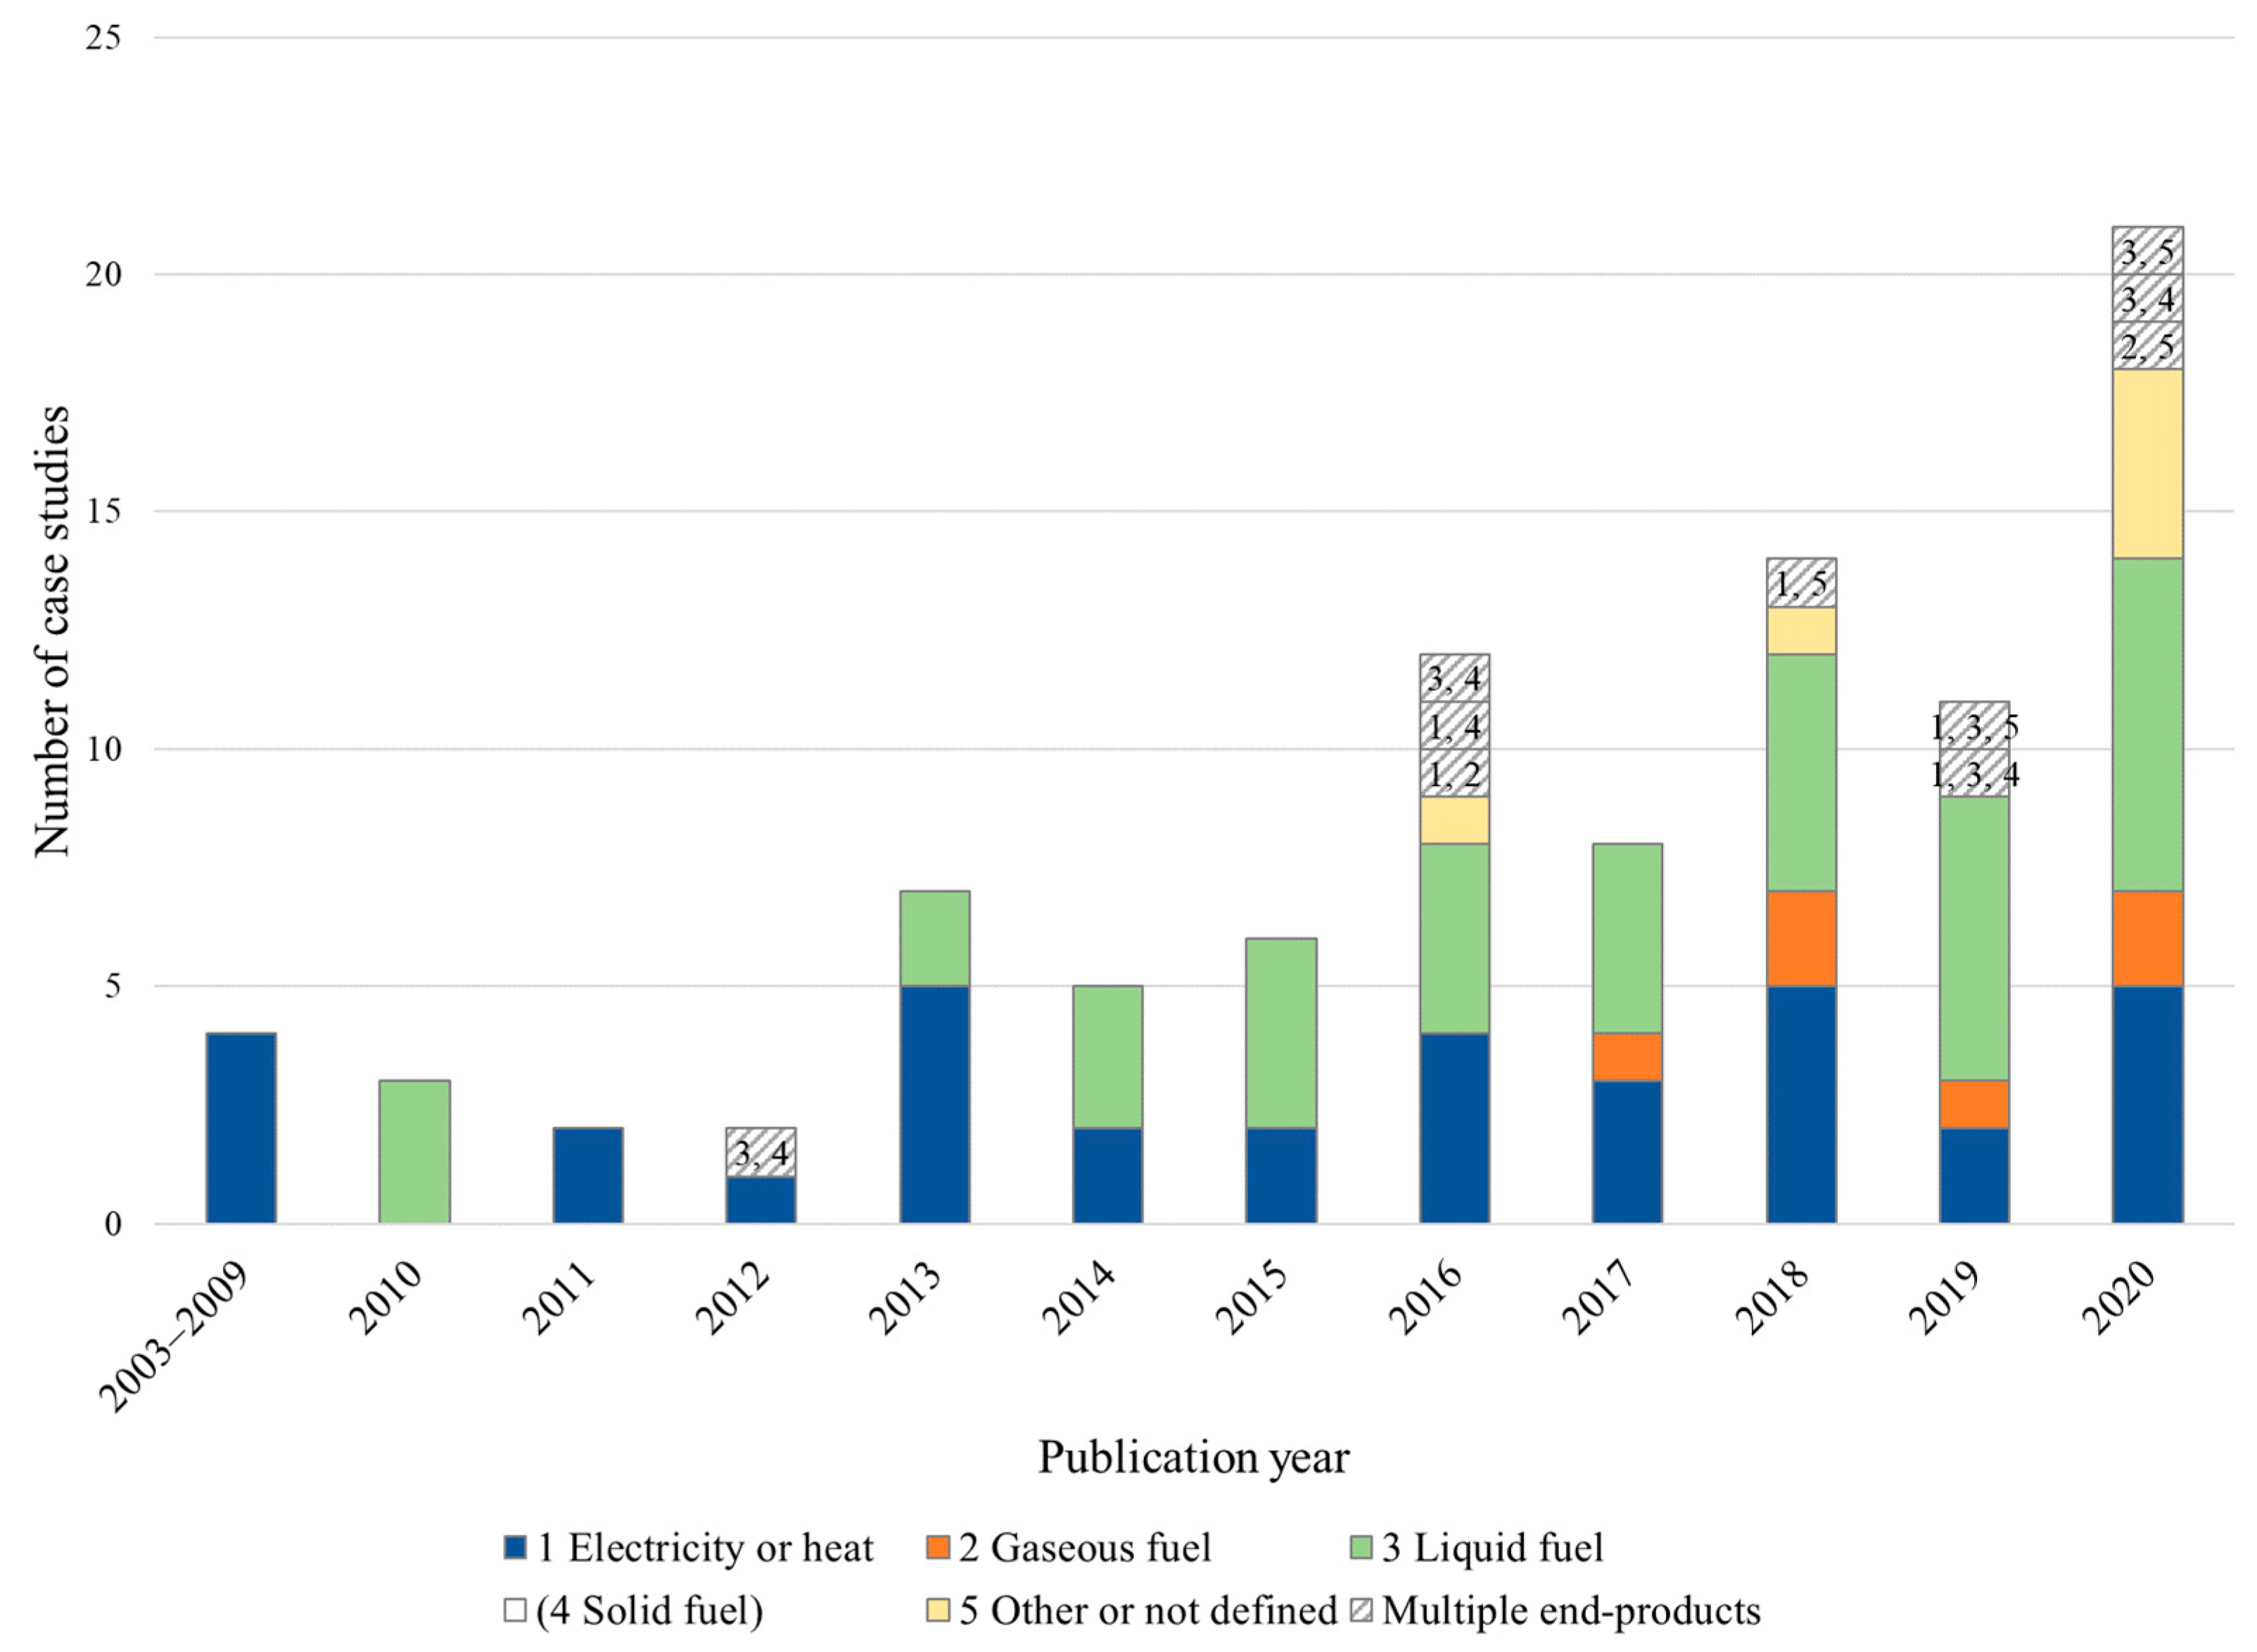
| 2 b. End Product | 2003–2009 | 2010 | 2011 | 2012 | 2013 | 2014 | 2015 | 2016 | 2017 | 2018 | 2019 | 2020 | Total |
|---|---|---|---|---|---|---|---|---|---|---|---|---|---|
| 1 Electricity or heat | 4 | - | 2 | 1 | 5 | 2 | 2 | 4 | 3 | 5 | 2 | 5 | 35 |
| 2 Gaseous fuel | - | - | - | - | - | - | - | - | 1 | 2 | 1 | 2 | 6 |
| 3 Liquid fuel | - | 3 | - | - | 2 | 3 | 3 | 4 | 4 | 5 | 6 | 7 | 37 |
| 4 Solid fuel | - | - | - | - | - | - | - | - | - | - | - | - | - |
| 5 Other or not defined | - | - | - | - | - | - | - | 1 | - | 1 | - | 4 | 6 |
| 1, 2 | - | - | - | - | - | - | - | 1 | - | - | - | - | 1 |
| 1, 4 | - | - | - | - | - | - | - | 1 | - | - | - | - | 1 |
| 1, 5 | - | - | - | - | - | - | - | - | - | 1 | - | - | 1 |
| 2, 5 | - | - | - | - | - | - | - | - | - | - | - | 1 | 1 |
| 3, 4 | - | - | - | 1 | - | - | - | 1 | - | - | - | 1 | 3 |
| 3, 5 | - | - | - | - | - | - | - | - | - | - | - | 1 | 1 |
| 1, 3, 4 | - | - | - | - | - | - | - | - | - | - | 1 | - | 1 |
| 1, 3, 5 | - | - | - | - | - | - | - | - | - | - | 1 | - | 1 |
| 3 a. Study Method | 2003–2009 | 2010 | 2011 | 2012 | 2013 | 2014 | 2015 | 2016 | 2017 | 2018 | 2019 | 2020 | Total |
|---|---|---|---|---|---|---|---|---|---|---|---|---|---|
| 1 Regression analysis | 1 | 1 | 2 | 2 | 1 | 3 | - | 2 | 1 | 4 | - | 2 | 19 |
| 2 Optimisation | 2 | 2 | - | - | 4 | - | 5 | 8 | 7 | 8 | 9 | 15 | 60 |
| 3 LCA | - | - | - | - | 1 | 1 | - | - | - | - | - | 2 | 4 |
| 4 Simulation | - | - | - | - | - | - | - | 1 | - | - | 1 | - | 2 |
| 5 Other | - | - | - | - | - | 1 | - | - | - | 1 | - | - | 2 |
| 1, 3 | - | - | - | - | - | - | - | - | - | - | 1 | - | 1 |
| 2, 3 | - | - | - | - | 1 | - | - | - | - | - | - | 1 | 2 |
| 2, 4 | 1 | - | - | - | - | - | - | 1 | - | 1 | - | - | 3 |
| 3, 4 | - | - | - | - | - | - | - | - | - | - | - | 1 | 1 |
| 3 b. Study Objective | 2003–2009 | 2010 | 2011 | 2012 | 2013 | 2014 | 2015 | 2016 | 2017 | 2018 | 2019 | 2020 | Total |
|---|---|---|---|---|---|---|---|---|---|---|---|---|---|
| 1 Economic performance | 3 | 3 | 2 | 1 | 4 | 2 | 2 | 10 | 5 | 8 | 6 | 15 | 61 |
| 2 Energy balance and emissions | - | - | - | - | 2 | 1 | 1 | - | - | - | - | 3 | 7 |
| 3 Social impacts | - | - | - | - | - | 1 | - | - | - | - | - | - | 1 |
| 4 Other impacts | - | - | - | - | - | - | - | - | - | 1 | 1 | - | 2 |
| 1, 2 | - | - | - | 1 | 1 | 1 | 1 | 1 | 3 | 2 | 2 | 2 | 14 |
| 1, 4 | - | - | - | - | - | - | - | 1 | - | - | - | - | 1 |
| 1, 2, 3 | - | - | - | - | - | - | 1 | - | - | - | - | - | 1 |
| 1, 2, 3 | 1 | - | - | - | - | - | - | - | - | 2 | 2 | 1 | 6 |
| 1, 3, 4 | - | - | - | - | - | - | - | - | - | 1 | - | - | 1 |
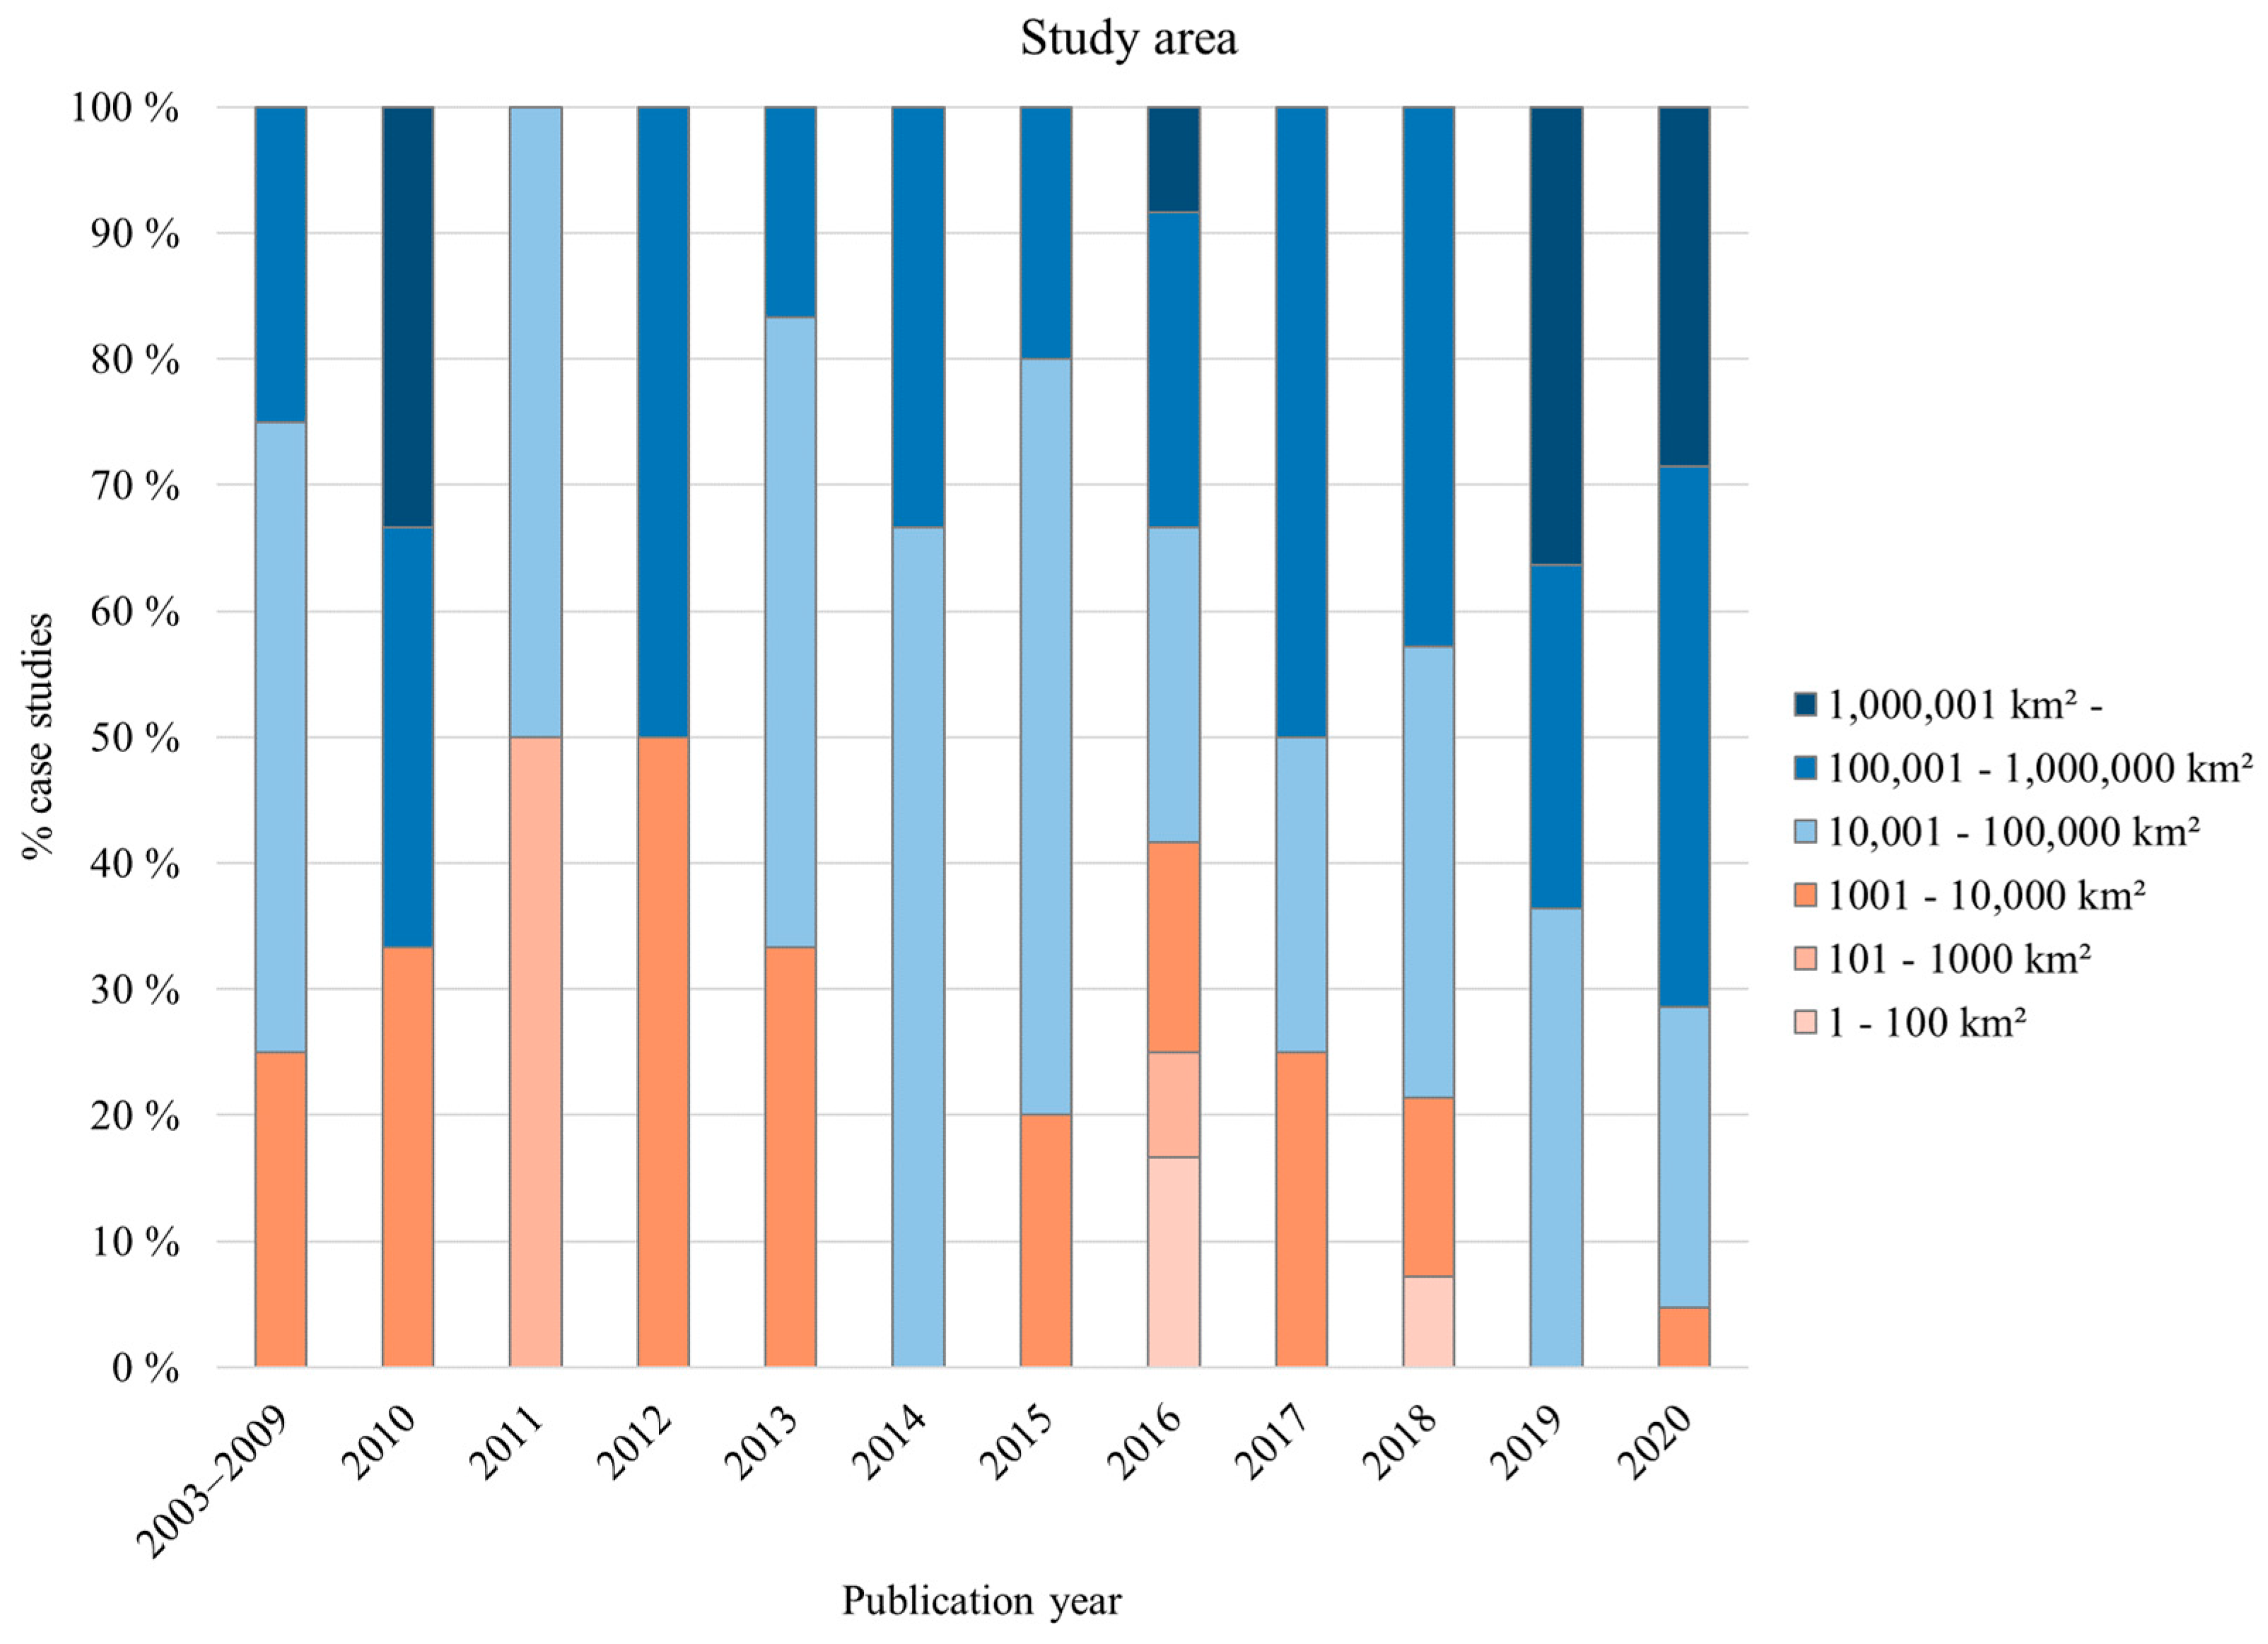
| 4 a. Study Area | 2003–2009 | 2010 | 2011 | 2012 | 2013 | 2014 | 2015 | 2016 | 2017 | 2018 | 2019 | 2020 | Total |
|---|---|---|---|---|---|---|---|---|---|---|---|---|---|
| 1–100 km2 | - | - | - | - | - | - | - | 2 | - | 1 | - | - | 3 |
| 101–1000 km2 | - | - | 1 | - | - | - | - | 1 | - | - | - | - | 2 |
| 1001–10,000 km2 | 1 | 1 | - | 1 | 2 | - | 1 | 2 | 2 | 2 | - | 1 | 13 |
| 10,001–100,000 km2 | 2 | - | 1 | - | 3 | 2 | 3 | 3 | 2 | 5 | 4 | 5 | 30 |
| 100,001–1,000,000 km2 | 1 | 1 | - | 1 | 1 | 1 | 1 | 3 | 4 | 6 | 3 | 9 | 31 |
| 1,000,001 km2 – | - | 1 | - | - | - | - | - | 1 | - | - | 4 | 6 | 12 |
| Unknown | - | - | - | - | 1 | 2 | - | - | - | - | - | - | 3 |
| 4 b. GIS Data Format | 2003–2009 | 2010 | 2011 | 2012 | 2013 | 2014 | 2015 | 2016 | 2017 | 2018 | 2019 | 2020 | Total |
|---|---|---|---|---|---|---|---|---|---|---|---|---|---|
| 1 Raster | 1 | - | - | 1 | 2 | - | 1 | 1 | - | 3 | 1 | 1 | 11 |
| 2 Vector | 1 | 2 | 2 | 1 | 4 | 4 | 4 | 7 | 6 | 7 | 6 | 12 | 56 |
| 3 Unknown | 2 | 1 | - | - | 1 | - | - | 4 | 2 | 3 | 4 | 8 | 25 |
| 1, 2 | - | - | - | - | - | 1 | - | - | - | 1 | - | - | 2 |
| 4 c. Transport Network Data Source | 2003–2009 | 2010 | 2011 | 2012 | 2013 | 2014 | 2015 | 2016 | 2017 | 2018 | 2019 | 2020 | Total |
|---|---|---|---|---|---|---|---|---|---|---|---|---|---|
| 1 Authority or enterprise | 1 | 1 | - | 1 | 5 | 3 | 3 | 2 | 3 | 4 | 4 | 7 | 34 |
| 2 OpenStreetMap | - | - | - | - | - | - | - | - | 2 | 1 | 2 | 1 | 6 |
| 3 No GIS data used | - | 1 | - | - | - | 2 | - | 5 | 1 | 2 | 1 | 1 | 13 |
| 4 Other or unknown | 3 | 1 | 1 | 1 | 2 | - | 2 | 5 | 2 | 7 | 4 | 12 | 40 |
| 1, 4 | - | - | 1 | - | - | - | - | - | - | - | - | - | 1 |
| 5 a. Origin Points | 2003–2009 | 2010 | 2011 | 2012 | 2013 | 2014 | 2015 | 2016 | 2017 | 2018 | 2019 | 2020 | Total |
|---|---|---|---|---|---|---|---|---|---|---|---|---|---|
| 1–100 | - | 1 | - | 1 | 1 | - | - | 4 | 2 | 3 | 3 | 7 | 22 |
| 101–1000 | - | - | 1 | - | 2 | - | 4 | 5 | 2 | 3 | 5 | 5 | 27 |
| 1001–10,000 | 1 | - | - | - | - | 1 | 1 | - | 3 | 1 | 2 | 3 | 12 |
| 10,000 – | 1 | - | 1 | 1 | 1 | 1 | - | 2 | - | 5 | - | 6 | 18 |
| Unknown | 2 | 2 | - | - | 3 | 3 | - | 1 | 1 | 2 | 1 | - | 15 |
| 5 b. Destination Points | 2003–2009 | 2010 | 2011 | 2012 | 2013 | 2014 | 2015 | 2016 | 2017 | 2018 | 2019 | 2020 | Total |
|---|---|---|---|---|---|---|---|---|---|---|---|---|---|
| 1 | 1 | 1 | 2 | 1 | 1 | 5 | 1 | 2 | 2 | 6 | 2 | 2 | 26 |
| 2–10 | - | - | - | 1 | 2 | - | 1 | 3 | 3 | 4 | 5 | 8 | 27 |
| 11–100 | 2 | 1 | - | - | 3 | - | 2 | 4 | 2 | 3 | 3 | 6 | 26 |
| 101 – | 1 | 1 | - | - | 1 | - | 1 | 1 | 1 | 1 | 1 | 4 | 12 |
| Unknown | - | - | - | - | - | - | - | 2 | - | - | - | 1 | 3 |
| 5 c. Multi-Stage Network | 2003–2009 | 2010 | 2011 | 2012 | 2013 | 2014 | 2015 | 2016 | 2017 | 2018 | 2019 | 2020 | Total |
|---|---|---|---|---|---|---|---|---|---|---|---|---|---|
| Yes | 1 | 1 | - | - | - | - | 1 | 1 | - | 2 | 2 | 1 | 9 |
| No | 3 | 2 | 2 | 2 | 7 | 5 | 4 | 11 | 8 | 12 | 9 | 20 | 85 |
| 5 d. Multi-Modal Network | 2003–2009 | 2010 | 2011 | 2012 | 2013 | 2014 | 2015 | 2016 | 2017 | 2018 | 2019 | 2020 | Total |
|---|---|---|---|---|---|---|---|---|---|---|---|---|---|
| Yes | 2 | 2 | 1 | 1 | 3 | 2 | 2 | 4 | 4 | 7 | 7 | 9 | 44 |
| No | 2 | 1 | 1 | 1 | 4 | 3 | 3 | 8 | 4 | 7 | 4 | 12 | 50 |
| 5 e. Biomass Property Changes | 2003–2009 | 2010 | 2011 | 2012 | 2013 | 2014 | 2015 | 2016 | 2017 | 2018 | 2019 | 2020 | Total |
|---|---|---|---|---|---|---|---|---|---|---|---|---|---|
| Yes | - | 2 | 1 | - | 2 | 2 | - | 1 | 1 | - | 5 | 6 | 20 |
| No | 4 | 1 | 1 | 2 | 5 | 3 | 5 | 11 | 7 | 14 | 6 | 15 | 74 |
| 5 f. Transport Cost Basis | 2003–2009 | 2010 | 2011 | 2012 | 2013 | 2014 | 2015 | 2016 | 2017 | 2018 | 2019 | 2020 | Total |
|---|---|---|---|---|---|---|---|---|---|---|---|---|---|
| 1 Distance | - | - | 1 | 2 | 4 | 3 | 5 | 6 | 5 | 8 | 6 | 18 | 58 |
| 2 Time | 2 | 1 | - | - | 2 | - | - | 2 | 1 | 1 | 1 | - | 10 |
| 3 Other or unknown | 1 | - | - | - | - | 1 | - | - | - | 3 | 3 | - | 8 |
| 1, 2 | 1 | 2 | 1 | - | 1 | 1 | - | 4 | 2 | 2 | 1 | 3 | 18 |
References
- Nikula, R.-P.; Ruusunen, M.; Leiviskä, K. Data-driven framework for boiler performance monitoring. Appl. Energy 2016, 183, 1374–1388. [Google Scholar] [CrossRef]
- Alakangas, E.; Hurskainen, M.; Laatikainen-Luntama, J.; Korhonen, J. Properties of Indigenous Fuels in Finland; VTT Technical Research Centre of Finland: Espoo, Finland, 2016; Volume 272. [Google Scholar]
- Merry, K.; Bettinger, P.; Grebner, D.; Siry, J.; Cieszewski, C.; Weaver, S.; Ucar, Z. Assessment of potential agricultural and short-rotation forest bioenergy crop establishment sites in Jackson County, Florida, USA. Biomass Bioenergy 2017, 105, 453–463. [Google Scholar] [CrossRef]
- Gnansounou, E.; Dauriat, A. Techno-economic analysis of lignocellulosic ethanol: A review. Bioresour. Technol. 2010, 101, 4980–4991. [Google Scholar] [CrossRef] [PubMed]
- Awudu, I.; Zhang, J. Uncertainties and sustainability concepts in biofuel supply chain management: A review. Renew. Sustain. Energy Rev. 2012, 16, 1359–1368. [Google Scholar] [CrossRef]
- Elia, J.A.; Floudas, C.A. Energy Supply Chain Optimization of Hybrid Feedstock Processes: A Review. Annu. Rev. Chem. Biomol. Eng. 2014, 5, 147–179. [Google Scholar] [CrossRef]
- O’Keeffe, S.; Majer, S.; Bezama, A.; Thrän, D. When considering no man is an island—assessing bioenergy systems in a regional and LCA context: A review. Int. J. Life Cycle Assess. 2016, 21, 885–902. [Google Scholar] [CrossRef]
- Ghaderi, H.; Pishvaee, M.S.; MoIni, A. Biomass supply chain network design: An optimization-oriented review and analysis. Ind. Crop. Prod. 2016, 94, 972–1000. [Google Scholar] [CrossRef]
- Mirkouei, A.; Haapala, K.R.; Sessions, J.; Murthy, G.S. A review and future directions in techno-economic modeling and optimization of upstream forest biomass to bio-oil supply chains. Renew. Sustain. Energy Rev. 2017, 67, 15–35. [Google Scholar] [CrossRef]
- Ghaffariyan, M.R.; Brown, M.; Acuna, M.; Sessions, J.; Gallagher, T.; Kühmaier, M.; Spinelli, R.; Visser, R.; Devlin, G.; Eliasson, L.; et al. An international review of the most productive and cost effective forest biomass recovery technologies and supply chains. Renew. Sustain. Energy Rev. 2017, 74, 145–158. [Google Scholar] [CrossRef]
- Erber, G.; Kühmaier, M. Research Trends in European Forest Fuel Supply Chains: A Review of the Last Ten Years (2007–2016)—Part Two: Comminution, Transport & Logistics. Croat. J. For. Eng. 2017, 38, 269–278. [Google Scholar]
- Aalto, M.; Kc, R.; Korpinen, O.-J.; Karttunen, K.; Ranta, T. Modeling of biomass supply system by combining computational methods—A review article. Appl. Energy 2019, 243, 145–154. [Google Scholar] [CrossRef]
- Azevedo, S.G.; Santos, M.; Antón, J.R. Supply chain of renewable energy: A bibliometric review approach. Biomass Bioenergy 2019, 126, 70–83. [Google Scholar] [CrossRef]
- Santos, A.; Carvalho, A.; Barbosa-Póvoa, A.P.; Marques, A.; Amorim, P. Assessment and optimization of sustainable forest wood supply chains—A systematic literature review. For. Policy Econ. 2019, 105, 112–135. [Google Scholar] [CrossRef]
- Visser, L.; Hoefnagels, R.; Junginger, M. Wood pellet supply chain costs—A review and cost optimization analysis. Renew. Sustain. Energy Rev. 2019, 118, 109506. [Google Scholar] [CrossRef]
- Nunes, L.; Causer, T.; Ciolkosz, D. Biomass for energy: A review on supply chain management models. Renew. Sustain. Energy Rev. 2019, 120, 109658. [Google Scholar] [CrossRef]
- De Meyer, A.; Cattrysse, D.; Rasinmäki, J.; Van Orshoven, J. Methods to optimise the design and management of biomass-for-bioenergy supply chains: A review. Renew. Sustain. Energy Rev. 2014, 31, 657–670. [Google Scholar] [CrossRef] [Green Version]
- Calvert, K. Geomatics and bioenergy feasibility assessments: Taking stock and looking forward. Renew. Sustain. Energy Rev. 2011, 15, 1117–1124. [Google Scholar] [CrossRef]
- Zhu, A.-X.; Zhao, F.-H.; Liang, P.; Qin, C.-Z. Next generation of GIS: Must be easy. Ann. GIS 2020, 27, 71–86. [Google Scholar] [CrossRef]
- Yue, P.; Jiang, L. BigGIS: How big data can shape next-generation GIS. In Proceedings of the 2014 The 3rd International Conference on Agro-Geoinformatics, Agro-Geoinformatics 2014, Beijing, China, 11–14 August 2014; pp. 1–6. [Google Scholar]
- Mongeon, P.; Paul-Hus, A. The journal coverage of Web of Science and Scopus: A comparative analysis. Scientometrics 2016, 106, 213–228. [Google Scholar] [CrossRef]
- OpenStreetMap (OSM). Geofabrik Download Server; Geofabrik GmbH: Karlsruhe, Germany, 2018. [Google Scholar]
- Esri. Discrete and Continuous Data. ArcGIS Desktop 10.8 Help. Available online: https://desktop.arcgis.com/en/arcmap/latest/manage-data/raster-and-images/discrete-and-continuous-data.htm (accessed on 9 April 2021).
- Tatsiopoulos, I.; Tolis, A.J. Economic aspects of the cotton-stalk biomass logistics and comparison of supply chain methods. Biomass Bioenergy 2003, 24, 199–214. [Google Scholar] [CrossRef]
- Möller, B.; Nielsen, P.S. Analysing transport costs of Danish forest wood chip resources by means of continuous cost surfaces. Biomass Bioenergy 2007, 31, 291–298. [Google Scholar] [CrossRef]
- Ayoub, N.; Martins, R.; Wang, K.; Seki, H.; Naka, Y. Two levels decision system for efficient planning and implementation of bioenergy production. Energy Convers. Manag. 2007, 48, 709–723. [Google Scholar] [CrossRef]
- Kanzian, C.; Holzleitner, F.; Stampfer, K.; Ashton, S. Regional energy wood logistics—Optimizing local fuel supply. Silva Fenn. 2009, 43, 113–128. [Google Scholar] [CrossRef] [Green Version]
- Parker, N.; Tittmann, P.; Hart, Q.; Nelson, R.; Skog, K.; Schmidt, A.; Gray, E.; Jenkins, B. Development of a biorefinery optimized biofuel supply curve for the Western United States. Biomass Bioenergy 2010, 34, 1597–1607. [Google Scholar] [CrossRef]
- Tittmann, P.W.; Parker, N.C.; Hart, Q.J.; Jenkins, B.M. A spatially explicit techno-economic model of bioenergy and biofuels production in California. J. Transp. Geogr. 2010, 18, 715–728. [Google Scholar] [CrossRef]
- Larson, J.A.; Yu, T.-H.; English, B.C.; Mooney, D.F.; Wang, C. Cost evaluation of alternative switchgrass producing, harvesting, storing, and transporting systems and their logistics in the Southeastern USA. Agric. Finance Rev. 2010, 70, 184–200. [Google Scholar] [CrossRef]
- Tahvanainen, T.; Anttila, P. Supply chain cost analysis of long-distance transportation of energy wood in Finland. Biomass Bioenergy 2011, 35, 3360–3375. [Google Scholar] [CrossRef]
- Röser, D.; Sikanen, L.; Asikainen, A.; Parikka, H.; Väätäinen, K. Productivity and cost of mechanized energy wood harvesting in Northern Scotland. Biomass Bioenergy 2011, 35, 4570–4580. [Google Scholar] [CrossRef]
- Chiueh, P.-T.; Lee, K.-C.; Syu, F.-S.; Lo, S.-L. Implications of biomass pretreatment to cost and carbon emissions: Case study of rice straw and Pennisetum in Taiwan. Bioresour. Technol. 2012, 108, 285–294. [Google Scholar] [CrossRef]
- Van der Hilst, F.; Faaij, A.P. Spatiotemporal cost-supply curves for bioenergy production in Mozambique. Biofuels Bioprod. Biorefin. 2012, 6, 405–430. [Google Scholar] [CrossRef]
- Lin, T.; Rodríguez, L.F.; Shastri, Y.N.; Hansen, A.C.; Ting, K.C. GIS-enabled biomass-ethanol supply chain optimization: Model development and Miscanthus application. Biofuels Bioprod. Biorefin. 2013, 7, 314–333. [Google Scholar] [CrossRef]
- Jappinen, E.; Korpinen, O.J.; Ranta, T. The Effects of Local Biomass Availability and Possibilities for Truck and Train Transportation on the Greenhouse Gas Emissions of a Small-Diameter Energy Wood Supply Chain. BioEnergy Res. 2013, 6, 166–177. [Google Scholar] [CrossRef]
- Fiorese, G.; Gatto, M.; Guariso, G. Optimisation of combustion bioenergy in a farming district under different localisation strategies. Biomass Bioenergy 2013, 58, 20–30. [Google Scholar] [CrossRef]
- Hu, M.-C.; Huang, A.-L.; Wen, T.-H. GIS-based biomass resource utilization for rice straw cofiring in the Taiwanese power market. Energy 2013, 55, 354–360. [Google Scholar] [CrossRef]
- Wang, X.; Ouyang, Y.; Yang, H.; Bai, Y. Optimal biofuel supply chain design under consumption mandates with renewable identification numbers. Transp. Res. Part B Methodol. 2013, 57, 158–171. [Google Scholar] [CrossRef]
- De Montis, A.; Trogu, D. Planning Land-Use Change for Biomass-Fuelled Energy-Production Plants: Spatial Analyses Applied to the Case of Sardinia, Italy. Cartographica 2013, 48, 13–21. [Google Scholar] [CrossRef]
- Cozzi, M.; Di Napoli, F.; Viccaro, M.; Romano, S. Use of Forest Residues for Building Forest Biomass Supply Chains: Technical and Economic Analysis of the Production Process. Forests 2013, 4, 1121–1140. [Google Scholar] [CrossRef] [Green Version]
- Korpinen, O.-J.; Jäppinen, E.; Anttila, P.; Ranta, T. Optimal Location for a Large Forest-Fuel Terminal Near Helsinki Metropolitan Area. In European Biomass Conference and Exhibition Proceedings; ETA Florence: Hamburg, Germany, 2014; pp. 16–20. [Google Scholar] [CrossRef]
- Hoefnagels, R.; Searcy, E.; Cafferty, K.; Cornelissen, T.; Junginger, M.; Jacobson, J.; Faaij, A. Lignocellulosic Feedstock Supply Systems with Intermodal and Overseas Transportation. Biofuels Bioprod. Biorefin. 2014, 8, 794–818. [Google Scholar] [CrossRef]
- Martinkus, N.; Shi, W.; Lovrich, N.; Pierce, J.; Smith, P.; Wolcott, M. Integrating biogeophysical and social assets into biomass-to-biofuel supply chain siting decisions. Biomass Bioenergy 2014, 66, 410–418. [Google Scholar] [CrossRef]
- Jäppinen, E.; Korpinen, O.-J.; Ranta, T. GHG emissions of forest-biomass supply chains to commercial-scale liquid-biofuel production plants in Finland. GCB Bioenergy 2013, 6, 290–299. [Google Scholar] [CrossRef]
- Calvert, K.; Mabee, W. Spatial Analysis of Biomass Resources within a Socio-Ecologically Heterogeneous Region: Identifying Opportunities for a Mixed Feedstock Stream. ISPRS Int. J. Geo-Inform. 2014, 3, 209–232. [Google Scholar] [CrossRef] [Green Version]
- Sahoo, K.; Mani, S. GIS based discrete event modeling and simulation of biomass supply chain. In Proceedings of the Winter Simulation Conference, Huntington Beach, CA, USA, 6–9 December 2015; pp. 967–978. [Google Scholar] [CrossRef]
- Van Meerbeek, K.; Ottoy, S.; De Meyer, A.; Van Schaeybroeck, T.; Van Orshoven, J.; Muys, B.; Hermy, M. The bioenergy potential of conservation areas and roadsides for biogas in an urbanized region. Appl. Energy 2015, 154, 742–751. [Google Scholar] [CrossRef]
- De Meyer, A.; Cattrysse, D.; Van Orshoven, J. A generic mathematical model to optimise strategic and tactical decisions in biomass-based supply chains (OPTIMASS). Eur. J. Oper. Res. 2015, 245, 247–264. [Google Scholar] [CrossRef] [Green Version]
- Baglivi, A.; Fiorese, G.; Guariso, G.; Uggè, C. Valuing crop diversity in biodiesel production plans. Energy 2015, 93, 2351–2362. [Google Scholar] [CrossRef]
- Lin, T.; Wang, S.; Rodríguez, L.F.; Hu, H.; Liu, Y. CyberGIS-enabled decision support platform for biomass supply chain optimization. Environ. Model. Softw. 2015, 70, 138–148. [Google Scholar] [CrossRef] [Green Version]
- Larson, J.A.; Yu, T.E.; English, B.C.; Jensen, K.L.; Gao, Y.; Wang, C. Effect of outdoor storage losses on feedstock inventory management and plant-gate cost for a switchgrass conversion facility in East Tennessee. Renew. Energy 2015, 74, 803–814. [Google Scholar] [CrossRef] [Green Version]
- Jacobson, R.A.; Keefe, R.F.; Smith, A.M.; Metlen, S.; Saul, D.A.; Newman, S.M.; Laninga, T.J.; Inman, D. Multi-spatial analysis of forest residue utilization for bioenergy. Biofuels Bioprod. Biorefin. 2016, 10, 560–575. [Google Scholar] [CrossRef]
- De Laporte, A.V.; Weersink, A.J.; McKenney, D.W. Effects of supply chain structure and biomass prices on bioenergy feedstock supply. Appl. Energy 2016, 183, 1053–1064. [Google Scholar] [CrossRef]
- Montgomery, T.D.; Han, H.-S.; Kizha, A.R. Modeling work plan logistics for centralized biomass recovery operations in mountainous terrain. Biomass Bioenergy 2016, 85, 262–270. [Google Scholar] [CrossRef]
- Ishii, K.; Furuichi, T.; Fujiyama, A.; Watanabe, S. Logistics cost analysis of rice straw pellets for feasible production capacity and spatial scale in heat utilization systems: A case study in Nanporo town, Hokkaido, Japan. Biomass Bioenergy 2016, 94, 155–166. [Google Scholar] [CrossRef]
- Escalante, H.; Castro, L.; Gauthier-Maradei, P.; De La Vega, R.R. Spatial decision support system to evaluate crop residue energy potential by anaerobic digestion. Bioresour. Technol. 2016, 219, 80–90. [Google Scholar] [CrossRef] [PubMed]
- Poudel, S.R.; Marufuzzaman, M.; Bian, L. Designing a reliable bio-fuel supply chain network considering link failure probabilities. Comput. Ind. Eng. 2016, 91, 85–99. [Google Scholar] [CrossRef]
- Mohseni, S.; Pishvaee, M.S.; Sahebi, H. Robust design and planning of microalgae biomass-to-biodiesel supply chain: A case study in Iran. Energy 2016, 111, 736–755. [Google Scholar] [CrossRef]
- Zhang, F.; Johnson, D.; Johnson, M.; Watkins, D.; Froese, R.; Wang, J. Decision support system integrating GIS with simulation and optimisation for a biofuel supply chain. Renew. Energy 2016, 85, 740–748. [Google Scholar] [CrossRef] [Green Version]
- Goncalves, G.; Masson, E.; Wei, X. Sustainable Management of Energy Wood Chips Sector: Case Study of the Regional Park “Caps et Marais d’Opale”. Procedia Soc. Behav. Sci. 2016, 221, 352–361. [Google Scholar] [CrossRef] [Green Version]
- Memişoğlu, G.; Üster, H. Integrated Bioenergy Supply Chain Network Planning Problem. Transp. Sci. 2016, 50, 35–56. [Google Scholar] [CrossRef]
- Guariso, G.; de Maria, F. Economic feasibility of a wood biomass energy system under evolving demand. AIMS Energy 2016, 4, 104–118. [Google Scholar] [CrossRef] [Green Version]
- Singlitico, A.; Kilgallon, I.; Goggins, J.; Monaghan, R.F.D. GIS-Based Optimization Model for the Smart Design of a Nationwide Bio-SNG Production System for Ireland. In Proceedings of the European Biomass Conference and Exhibition, Stockholm, Sweden, 12 June 2017; Volume 2017, pp. 1852–1862. [Google Scholar]
- Annevelink, B.; Galindo, D.G.; Espatolero, S.; Staritsky, I.; Vanmeulebrouk, B. Logistical Case Study for the Aragon Region Using the Locagistics Tool. In Proceedings of the European Biomass Conference and Exhibition, Stockholm, Sweden, 12 June 2017; Volume 2017, pp. 41–47. [Google Scholar]
- Hu, H.; Lin, T.; Wang, S.; Rodriguez, L.F. A cyberGIS approach to uncertainty and sensitivity analysis in biomass supply chain optimization. Appl. Energy 2017, 203, 26–40. [Google Scholar] [CrossRef]
- Mirkouei, A.; Haapala, K.R.; Sessions, J.; Murthy, G.S. A mixed biomass-based energy supply chain for enhancing economic and environmental sustainability benefits: A multi-criteria decision making framework. Appl. Energy 2017, 206, 1088–1101. [Google Scholar] [CrossRef]
- Zhang, F.; Wang, J.; Liu, S.; Zhang, S.; Sutherland, J.W. Integrating GIS with optimization method for a biofuel feedstock supply chain. Biomass Bioenergy 2017, 98, 194–205. [Google Scholar] [CrossRef]
- Sánchez-García, S.; Athanassiadis, D.; Martínez-Alonso, C.; Tolosana, E.; Majada, J.; Canga, E. A GIS methodology for optimal location of a wood-fired power plant: Quantification of available woodfuel, supply chain costs and GHG emissions. J. Clean. Prod. 2017, 157, 201–212. [Google Scholar] [CrossRef]
- Li, Y.; Tittmann, P.; Parker, N.; Jenkins, B. Economic impact of combined torrefaction and pelletization processes on forestry biomass supply. GCB Bioenergy 2016, 9, 681–693. [Google Scholar] [CrossRef]
- Athanassiadis, D.; Nordfjell, T. Regional GIS-based evaluation of the potential and supply costs of forest biomass in Sweden. Front. Agric. Sci. Eng. 2017, 4, 493–501. [Google Scholar] [CrossRef] [Green Version]
- Korpinen, O.-J.; Aalto, M.; Ovaskainen, H.; Venäläinen, P.; Ranta, T. Pulpwood Terminals and Their Potential to Support Biomass Supply to Power Plants in Eastern Finland. In Proceedings of the European Biomass Conference and Exhibition, Copenhagen, Denmark, 14–17 May 2018; Volume 2018, pp. 274–278. [Google Scholar]
- Kesharwani, R.; Sun, Z.; Dagli, C. Biofuel supply chain optimal design considering economic, environmental, and societal aspects towards sustainability. Int. J. Energy Res. 2018, 42, 2169–2198. [Google Scholar] [CrossRef]
- He-Lambert, L.; English, B.C.; Lambert, D.M.; Shylo, O.; Larson, J.A.; Yu, T.E.; Wilson, B. Determining a geographic high resolution supply chain network for a large scale biofuel industry. Appl. Energy 2018, 218, 266–281. [Google Scholar] [CrossRef]
- Sahoo, K.; Mani, S.; Das, L.; Bettinger, P. GIS-based assessment of sustainable crop residues for optimal siting of biogas plants. Biomass Bioenergy 2018, 110, 63–74. [Google Scholar] [CrossRef]
- Ouraich, I.; Wetterlund, E.; Forsell, N.; Lundmark, R. A spatial-explicit price impact analysis of increased biofuel production on forest feedstock markets: A scenario analysis for Sweden. Biomass Bioenergy 2018, 119, 364–380. [Google Scholar] [CrossRef]
- Schröder, T.; Lauven, L.-P.; Geldermann, J. Improving biorefinery planning: Integration of spatial data using exact optimization nested in an evolutionary strategy. Eur. J. Oper. Res. 2018, 264, 1005–1019. [Google Scholar] [CrossRef]
- Idris, M.N.M.; Hashim, H.; Razak, N.H. Spatial optimisation of oil palm biomass co-firing for emissions reduction in coal-fired power plant. J. Clean. Prod. 2018, 172, 3428–3447. [Google Scholar] [CrossRef]
- Furubayashi, T.; Nakata, T. Cost and CO2 reduction of biomass co-firing using waste wood biomass in Tohoku region, Japan. J. Clean. Prod. 2018, 174, 1044–1053. [Google Scholar] [CrossRef]
- Jeong, J.S.; Ramírez-Gómez, A. Optimizing the location of a biomass plant with a fuzzy-DEcision-MAking Trial and Evaluation Laboratory (F-DEMATEL) and multi-criteria spatial decision assessment for renewable energy management and long-term sustainability. J. Clean. Prod. 2018, 182, 509–520. [Google Scholar] [CrossRef]
- Salimi, F.; Vahdani, B. Designing a bio-fuel network considering links reliability and risk-pooling effect in bio-refineries. Reliab. Eng. Syst. Saf. 2018, 174, 96–107. [Google Scholar] [CrossRef]
- Kim, S.; Kim, S.; Kiniry, J.R. Two-phase simulation-based location-allocation optimization of biomass storage distribution. Simul. Model. Pract. Theory 2018, 86, 155–168. [Google Scholar] [CrossRef]
- Woo, H.; Acuna, M.; Moroni, M.; Taskhiri, M.S.; Turner, P. Optimizing the Location of Biomass Energy Facilities by Integrating Multi-Criteria Analysis (MCA) and Geographical Information Systems (GIS). Forests 2018, 9, 585. [Google Scholar] [CrossRef] [Green Version]
- Hogland, J.; Anderson, N.; Chung, W. New Geospatial Approaches for Efficiently Mapping Forest Biomass Logistics at High Resolution over Large Areas. ISPRS Int. J. Geo-Inform. 2018, 7, 156. [Google Scholar] [CrossRef] [Green Version]
- Bonazzi, F.A.; Cividino, S.R.; Zambon, I.; Mosconi, E.M.; Poponi, S. Building Energy Opportunity with a Supply Chain Based on the Local Fuel-Producing Capacity. Sustainability 2018, 10, 2140. [Google Scholar] [CrossRef] [Green Version]
- Lemire, P.-O.; Delcroix, B.; Audy, J.-F.; Labelle, F.; Mangin, P.; Barnabé, S. GIS method to design and assess the transportation performance of a decentralized biorefinery supply system and comparison with a centralized system: Case study in southern Quebec, Canada. Biofuels Bioprod. Biorefin. 2019, 13, 552–567. [Google Scholar] [CrossRef]
- Martinez-Hernandez, E.; Cui, X.; Scown, C.D.; Amezcua-Allieri, M.A.; Aburto, J.; Simmons, B.A. Techno-economic and greenhouse gas analyses of lignin valorization to eugenol and phenolic products in integrated ethanol biorefineries. Biofuels Bioprod. Biorefin. 2019, 13, 978–993. [Google Scholar] [CrossRef]
- Jeong, H.; Sieverding, H.L.; Stone, J.J. Biodiesel Supply Chain Optimization Modeled with Geographical Information System (GIS) and Mixed-Integer Linear Programming (MILP) for the Northern Great Plains Region. BioEnergy Res. 2018, 12, 229–240. [Google Scholar] [CrossRef]
- Singlitico, A.; Kilgallon, I.; Goggins, J.; Monaghan, R.F.D. GIS-based techno-economic optimisation of a regional supply chain for large-scale deployment of bio-SNG in a natural gas network. Appl. Energy 2019, 250, 1036–1052. [Google Scholar] [CrossRef]
- Razm, S.; Nickel, S.; Sahebi, H. A multi-objective mathematical model to redesign of global sustainable bioenergy supply network. Comput. Chem. Eng. 2019, 128, 1–20. [Google Scholar] [CrossRef]
- Arabi, M.; Yaghoubi, S.; Tajik, J. A mathematical model for microalgae-based biobutanol supply chain network design under harvesting and drying uncertainties. Energy 2019, 179, 1004–1016. [Google Scholar] [CrossRef]
- Babazadeh, R. Application of Fuzzy Optimization to Bioenergy-Supply-Chain Planning under Epistemic Uncertainty: A New Approach. Ind. Eng. Chem. Res. 2019, 58, 6519–6536. [Google Scholar] [CrossRef]
- Santibañez-Aguilar, J.E.; Lozano-Garcia, D.F.; Lozano, F.J.; Flores-Tlacuahuac, A. Sequential Use of Geographic Information System and Mathematical Programming for Optimal Planning for Energy Production Systems from Residual Biomass. Ind. Eng. Chem. Res. 2019, 58, 15818–15837. [Google Scholar] [CrossRef]
- Aalto, M.; Korpinen, O.-J.; Ranta, T. Feedstock availability and moisture content data processing for multi-year simulation of forest biomass supply in energy production. Silva Fenn. 2019, 53, 10147. [Google Scholar] [CrossRef]
- Harahap, F.; Leduc, S.; Mesfun, S.; Khatiwada, D.; Kraxner, F.; Silveira, S. Opportunities to Optimize the Palm Oil Supply Chain in Sumatra, Indonesia. Energies 2019, 12, 420. [Google Scholar] [CrossRef] [Green Version]
- Sharma, B.; Brandt, C.; McCullough-Amal, D.; Langholtz, M.; Webb, E. Assessment of the feedstock supply for siting single- and multiple-feedstock biorefineries in the USA and identification of prevalent feedstocks. Biofuels Bioprod. Biorefin. 2020, 14, 578–593. [Google Scholar] [CrossRef]
- Kang, S.; Heo, S.; Realff, M.J.; Lee, J.H. Three-stage design of high-resolution microalgae-based biofuel supply chain using geographic information system. Appl. Energy 2020, 265, 114773. [Google Scholar] [CrossRef]
- Durmaz, Y.G.; Bilgen, B. Multi-objective optimization of sustainable biomass supply chain network design. Appl. Energy 2020, 272, 115259. [Google Scholar] [CrossRef]
- Van Holsbeeck, S.; Srivastava, S.K. Feasibility of locating biomass-to-bioenergy conversion facilities using spatial information technologies: A case study on forest biomass in Queensland, Australia. Biomass Bioenergy 2020, 139, 105620. [Google Scholar] [CrossRef]
- Singlitico, A.; Goggins, J.; Monaghan, R.F.D. Life cycle assessment-based multiobjective optimisation of synthetic natural gas supply chain: A case study for the Republic of Ireland. J. Clean. Prod. 2020, 258, 120652. [Google Scholar] [CrossRef]
- Rahemi, H.; Torabi, S.A.; Avami, A.; Jolai, F. Bioethanol supply chain network design considering land characteristics. Renew. Sustain. Energy Rev. 2019, 119, 109517. [Google Scholar] [CrossRef]
- Robles, I.; O’Dwyer, E.; Guo, M. Waste-to-Resource value chain optimisation: Combining spatial, chemical and technoeconomic aspects. Water Res. 2020, 178, 115842. [Google Scholar] [CrossRef]
- Zhao, N.; Lehmann, J.; You, F. Poultry Waste Valorization via Pyrolysis Technologies: Economic and Environmental Life Cycle Optimization for Sustainable Bioenergy Systems. ACS Sustain. Chem. Eng. 2020, 8, 4633–4646. [Google Scholar] [CrossRef]
- Berg, S.; Athanassiadis, D. The cost of closed terminals in the supply chain for a potential biorefinery in northern Sweden. Scand. J. For. Res. 2020, 35, 165–176. [Google Scholar] [CrossRef] [Green Version]
- Berg, S.; Athanassiadis, D. Opportunity cost of several methods for determining forest biomass terminal locations in Northern Sweden. Int. J. For. Eng. 2020, 31, 37–50. [Google Scholar] [CrossRef] [Green Version]
- Cervi, W.R.; Lamparelli, R.A.C.; Seabra, J.E.A.; Junginger, M.; De Jong, S.; Van Der Hilst, F. Spatial modeling of techno-economic potential of biojet fuel production in Brazil. GCB Bioenergy 2019, 12, 136–157. [Google Scholar] [CrossRef] [Green Version]
- Raghu, K.C.; Aalto, M.; Korpinen, O.-J.; Ranta, T.; Proskurina, S. Lifecycle Assessment of Biomass Supply Chain with the Assistance of Agent-Based Modelling. Sustainability 2020, 12, 1964. [Google Scholar] [CrossRef] [Green Version]
- Ghani, N.M.A.M.A.; Szmerekovsky, J.G.; Vogiatzis, C. Plant capacity level and location as a mechanism for sustainability in biomass supply chain. Energy Syst. 2019, 11, 1075–1109. [Google Scholar] [CrossRef]
- Jeong, H.; Karim, R.A.; Sieverding, H.L.; Stone, J.J. An Application of GIS-Linked Biofuel Supply Chain Optimization Model for Various Transportation Network Scenarios in Northern Great Plains (NGP), USA. BioEnergy Res. 2020, 14, 612–622. [Google Scholar] [CrossRef]
- Mahjoub, N.; Sahebi, H. The water-energy nexus at the hybrid bioenergy supply chain: A sustainable network design model. Ecol. Indic. 2020, 119, 106799. [Google Scholar] [CrossRef]
- Latterini, F.; Stefanoni, W.; Suardi, A.; Alfano, V.; Bergonzoli, S.; Palmieri, N.; Pari, L. A GIS Approach to Locate a Small Size Biomass Plant Powered by Olive Pruning and to Estimate Supply Chain Costs. Energies 2020, 13, 3385. [Google Scholar] [CrossRef]
- Melara, A.J.; Singh, U.; Colosi, L.M. Is aquatic bioenergy with carbon capture and storage a sustainable negative emission technology? Insights from a spatially explicit environmental life-cycle assessment. Energy Convers. Manag. 2020, 224, 113300. [Google Scholar] [CrossRef]
- Van Holsbeeck, S.; Ezzati, S.; Röser, D.; Brown, M. A Two-Stage DSS to Evaluate Optimal Locations for Bioenergy Facilities. Forests 2020, 11, 968. [Google Scholar] [CrossRef]
- Ong, C.; Deprés, G.; Hollebecq, J.E.; Hishamudin, M.O.S.; Kamaruddin, N.; Anugerah, A.R.; Mustafa, A.N.A.; Roda, J.M. Quantifying the effect of landscape structure on transport costs for biorefinery of agricultural and forestry wastes in Malaysia. GCB Bioenergy 2020, 12, 910–922. [Google Scholar] [CrossRef]
- Lin, C.-C.; Kang, J.-R.; Huang, G.-L.; Liu, W.-Y. Forest biomass-to-biofuel factory location problem with multiple objectives considering environmental uncertainties and social enterprises. J. Clean. Prod. 2020, 262, 121327. [Google Scholar] [CrossRef]
- Panichelli, L.; Gnansounou, E. GIS-based approach for defining bioenergy facilities location: A case study in Northern Spain based on marginal delivery costs and resources competition between facilities. Biomass Bioenergy 2008, 32, 289–300. [Google Scholar] [CrossRef]
- Frombo, F.; Minciardi, R.; Robba, M.; Rosso, F.; Sacile, R. Planning woody biomass logistics for energy production: A strategic decision model. Biomass Bioenergy 2009, 33, 372–383. [Google Scholar] [CrossRef]
- Perpiñá, C.; Alfonso, D.; Pérez-Navarro, A.; Peñalvo, E.; Vargas, C.; Cárdenas, R. Methodology based on Geographic Information Systems for biomass logistics and transport optimisation. Renew. Energy 2009, 34, 555–565. [Google Scholar] [CrossRef]
- Morrow, W.R.; Griffin, W.M.; Matthews, H.S. Modeling Switchgrass Derived Cellulosic Ethanol Distribution in the United States. Environ. Sci. Technol. 2006, 40, 2877–2886. [Google Scholar] [CrossRef] [Green Version]
- Sharma, B.; Ingalls, R.G.; Jones, C.L.; Huhnke, R.L.; Khanchi, A. Scenario optimization modeling approach for design and management of biomass-to-biorefinery supply chain system. Bioresour. Technol. 2013, 150, 163–171. [Google Scholar] [CrossRef] [PubMed]
- Steiniger, S.; Hunter, A.J.S. The 2012 free and open source GIS software map—A guide to facilitate research, development, and adoption. Comput. Environ. Urban Syst. 2013, 39, 136–150. [Google Scholar] [CrossRef]
- Pashova, L.; Bandrova, T. A brief overview of current status of European spatial data infrastructures − relevant developments and perspectives for Bulgaria. Geo-Spatial Inf. Sci. 2017, 20, 97–108. [Google Scholar] [CrossRef] [Green Version]
- Neis, P. OSM Stats—Elements. Available online: https://osmstats.neis-one.org/?item=elements (accessed on 9 April 2021).
- Raifer, M.; Troilo, R.; Kowatsch, F.; Auer, M.; Loos, L.; Marx, S.; Przybill, K.; Fendrich, S.; Mocnik, F.-B.; Zipf, A. OSHDB: A framework for spatio-temporal analysis of OpenStreetMap history data. Open Geospat. Data Softw. Stand. 2019, 4, 3. [Google Scholar] [CrossRef]
- U.S. Energy Information Administration. Use of Energy Explained: Energy Use for Transportation. U.S. EIA. Available online: https://www.eia.gov/energyexplained/use-of-energy/transportation.php (accessed on 9 April 2021).
- Klöpffer, W.; Grahl, B. Life Cycle Assessment (LCA): A Guide to Best Practice; Wiley: Hoboken, NJ, USA, 2014. [Google Scholar] [CrossRef] [Green Version]
- Grimm, V.; Berger, U.; DeAngelis, D.L.; Polhill, J.G.; Giske, J.; Railsback, S.F. The ODD protocol: A review and first update. Ecol. Model. 2010, 221, 2760–2768. [Google Scholar] [CrossRef]


| Authors | Focus of the Review |
|---|---|
| Gnansounou and Dauriat [4] | Ethanol production cost comparison. |
| Awudu et al. [5] | Decision making and uncertainties in supply chains. |
| Elia et al. [6] | Categorization, based on specific features of the mathematical models in studies including heat, power and liquid biofuel production. |
| O’Keeffe et al. [7] | Classification of LCA studies of bioenergy production systems in three regional contexts. |
| Ghaderi et al. [8] | Optimisation methods used in the design and management of supply chains. |
| Mirkouei et al. [9] | Techno–economic studies, focusing on supply chains for bio-oil production. |
| Ghaffariyan et al. [10] | State-of-the art of machines and working methods in forest biomass supply chains. |
| Erber and Kühmaier [11] | Technology and productivity of machines in forest fuel supply. |
| Aalto et al. [12] | Use of geographical information systems, life-cycle assessments and discrete time simulations and their combinations in EBSC studies. |
| Azevedo et al. [13] | Total scholarly production of studies on supply chain performance; number of citations; and the most productive authors, journals and countries. |
| Santos et al. [14] | Assessment and optimisation studies considering forest wood supply chains and their sustainability dimensions. |
| Visser et al. [15] | Optimisation of wood pellet supply chain costs. |
| Nunes et al. [16] | Characterization of supply chain management models. |
| De Meyer et al. [17] | Classification of BSC studies, according to decision-making levels, and the optimisation methods and their objectives. |
| Calvert [18] | Spatio-temporal variables used in bioenergy feasibility studies. |
| Number of Supply Chain Destination Points | |||||
|---|---|---|---|---|---|
| Study Method | 1 | 2–10 | 11–100 | 101– | Unknown |
| 1 Regression analysis | 12 | 4 | 1 | 1 | 1 |
| 2 Optimisation | 8 | 18 | 21 | 11 | 2 |
| 3 Life cycle assessment | 2 | 2 | - | - | - |
| 4 Simulation | 1 | 1 | - | - | - |
| 5 Other | 2 | 0 | - | - | - |
| 1, 3 | - | 1 | - | - | - |
| 2, 3 | - | - | 2 | - | - |
| 2, 4 | - | 1 | 2 | - | - |
| 3, 4 | 1 | - | - | - | - |
| Category | Europe | North America |
|---|---|---|
| 2 a. Biomass source | Forests and tree plantations (72%) | Farms and fields (53%) |
| 2 b. End product | Heat and/or electricity (65%) | Liquid fuels (71%) |
| 4 a. Study area | 10,001–100,000 km2 (41%) | 101,000–1,000,000 km2 (54%) |
| 5 b. Destination points | 1 (41%) | 2–10 (33%) |
| 5 c. Multi-stage system | No (66%) | Yes (65%) |
Disclaimer/Publisher’s Note: The statements, opinions and data contained in all publications are solely those of the individual author(s) and contributor(s) and not of MDPI and/or the editor(s). MDPI and/or the editor(s) disclaim responsibility for any injury to people or property resulting from any ideas, methods, instructions or products referred to in the content. |
© 2023 by the authors. Licensee MDPI, Basel, Switzerland. This article is an open access article distributed under the terms and conditions of the Creative Commons Attribution (CC BY) license (https://creativecommons.org/licenses/by/4.0/).
Share and Cite
Korpinen, O.-J.; Aalto, M.; KC, R.; Tokola, T.; Ranta, T. Utilisation of Spatial Data in Energy Biomass Supply Chain Research—A Review. Energies 2023, 16, 893. https://doi.org/10.3390/en16020893
Korpinen O-J, Aalto M, KC R, Tokola T, Ranta T. Utilisation of Spatial Data in Energy Biomass Supply Chain Research—A Review. Energies. 2023; 16(2):893. https://doi.org/10.3390/en16020893
Chicago/Turabian StyleKorpinen, Olli-Jussi, Mika Aalto, Raghu KC, Timo Tokola, and Tapio Ranta. 2023. "Utilisation of Spatial Data in Energy Biomass Supply Chain Research—A Review" Energies 16, no. 2: 893. https://doi.org/10.3390/en16020893