
Effects of Catalyst Ink Storage on Polymer Electrolyte Fuel Cells
 , , , , and
Abstract
:1. Introduction
- Catalyst on supportive material, mostly platinum on carbon (Pt/C), for the HOR and ORR;
- A mixture of water and an organic solvent to disperse the catalyst particles and the ionomer as well as to control the pore structure and morphology of the CL [17].
2. Materials and Methods
2.1. Physical Analysis—UV-Vis Spectroscopy, Zeta Potential
2.2. Chemical Analysis—GC/MS, GC/FID
2.3. Electrochemical Analysis—RDE, MEA
3. Results and Discussion
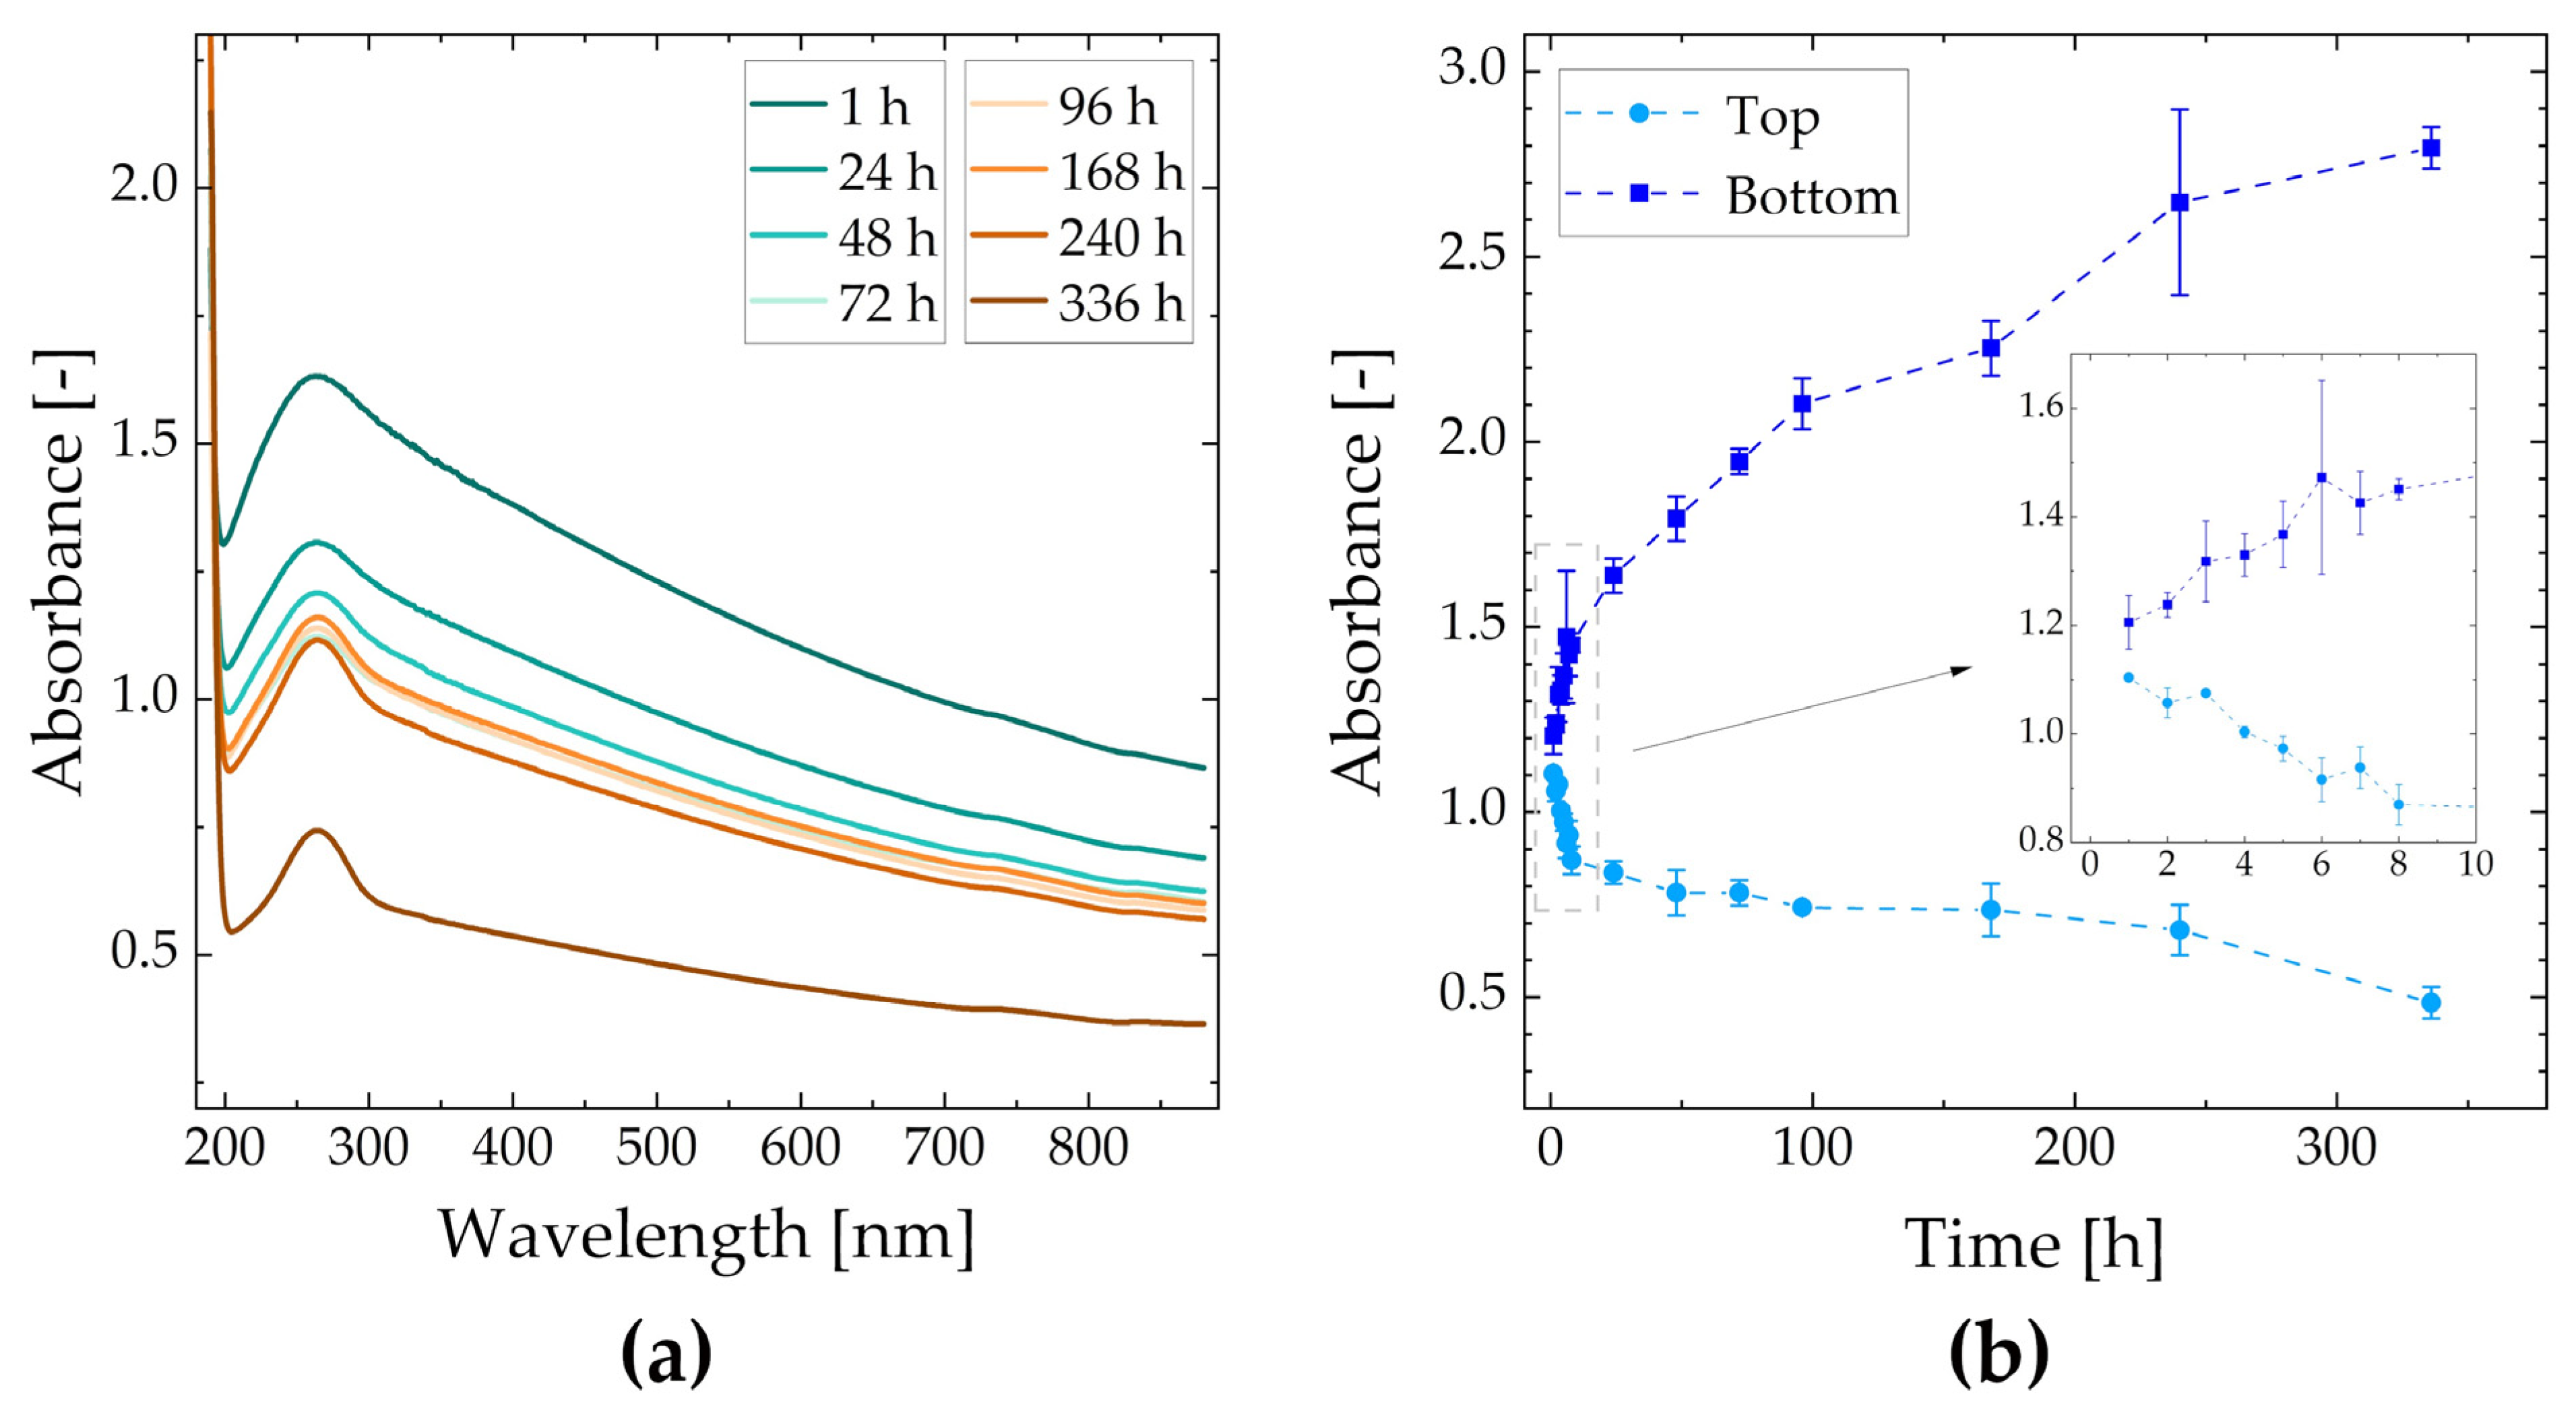
3.1. Physical Analysis—UV-Vis Spectroscopy, Zeta Potential
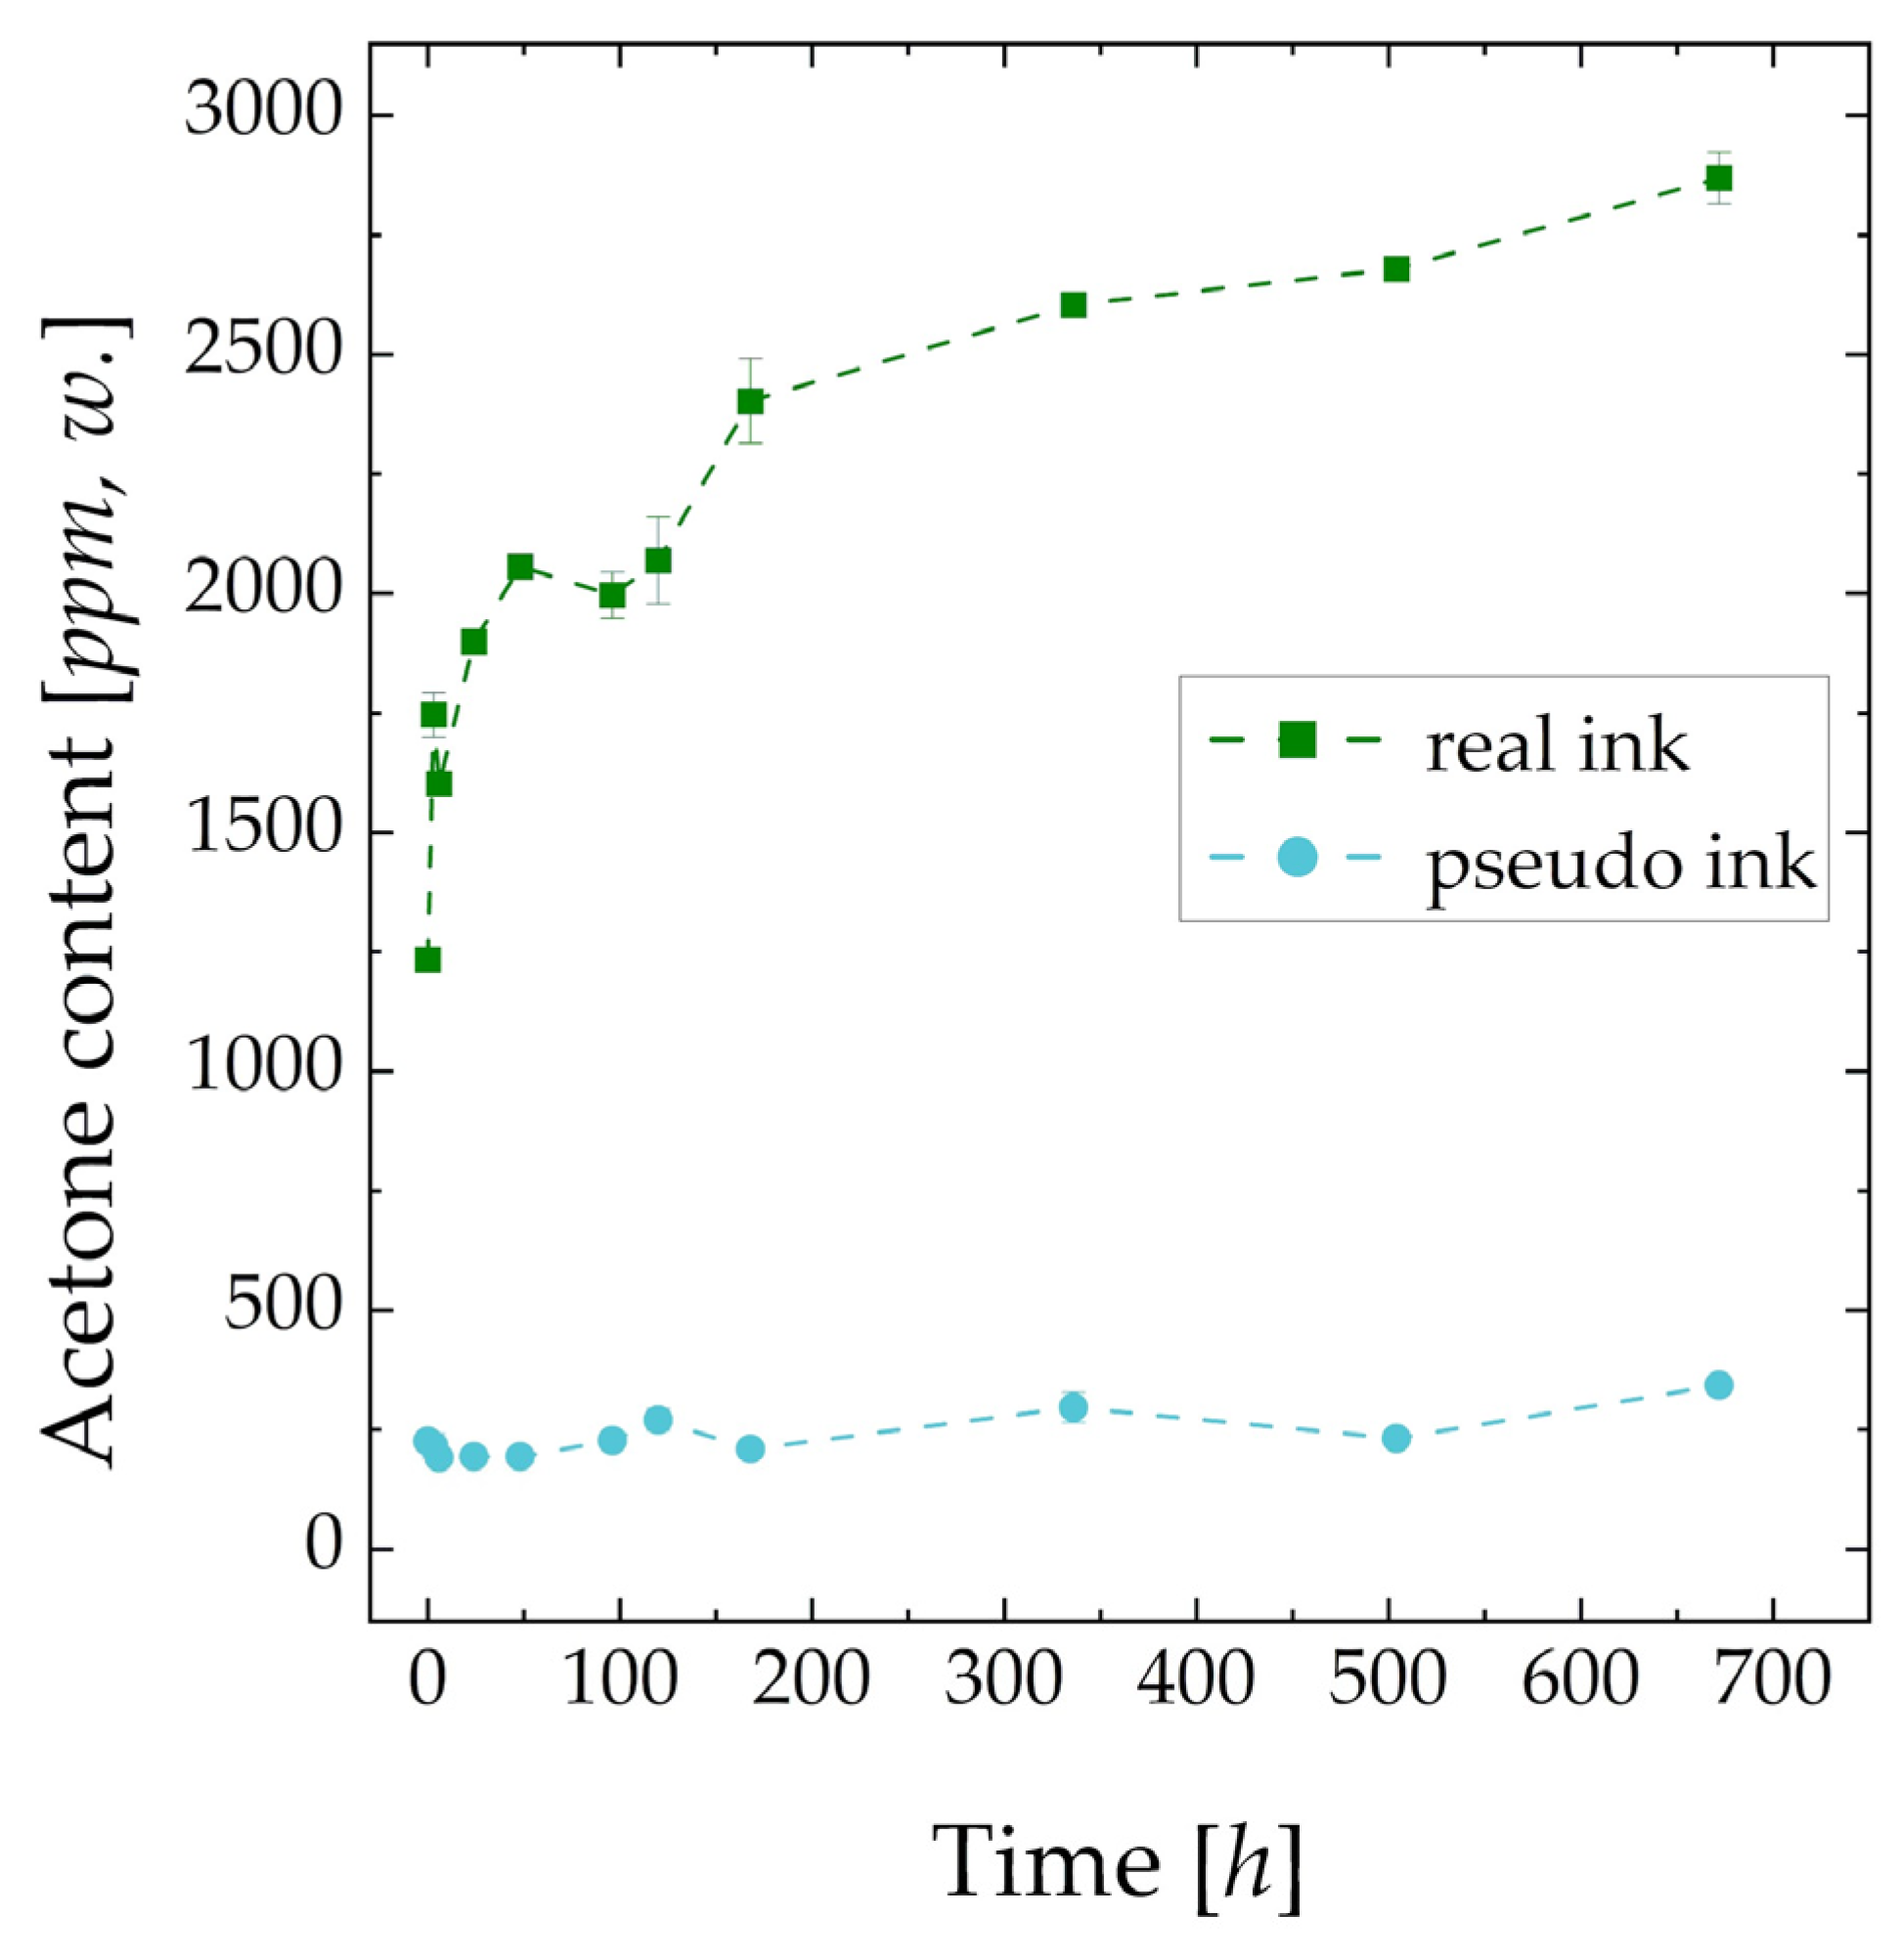
3.2. Chemical Analysis—GC/MC, GC/FID
3.3. Electrochemical Analysis—RDE, MEA
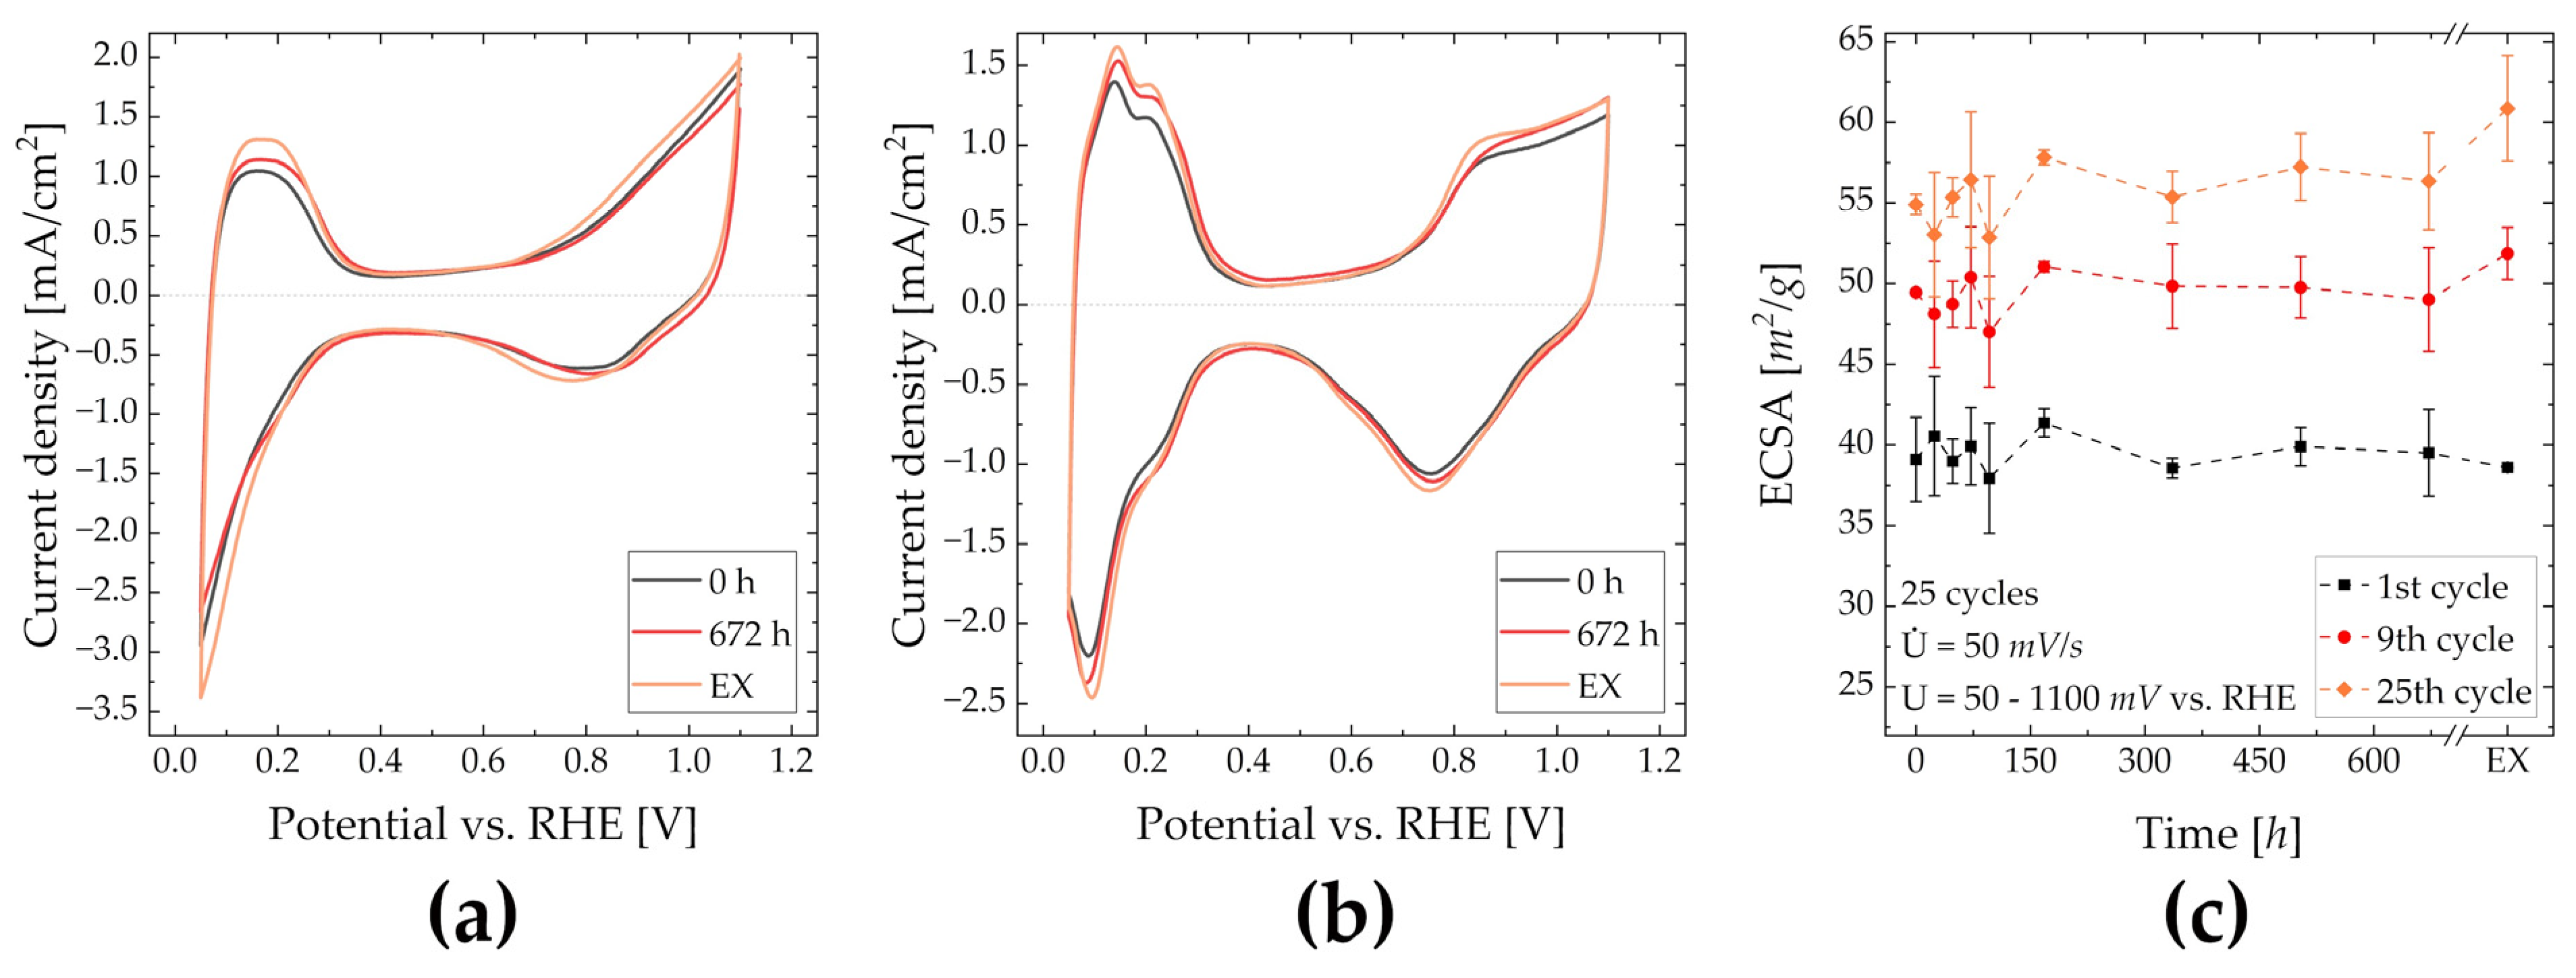
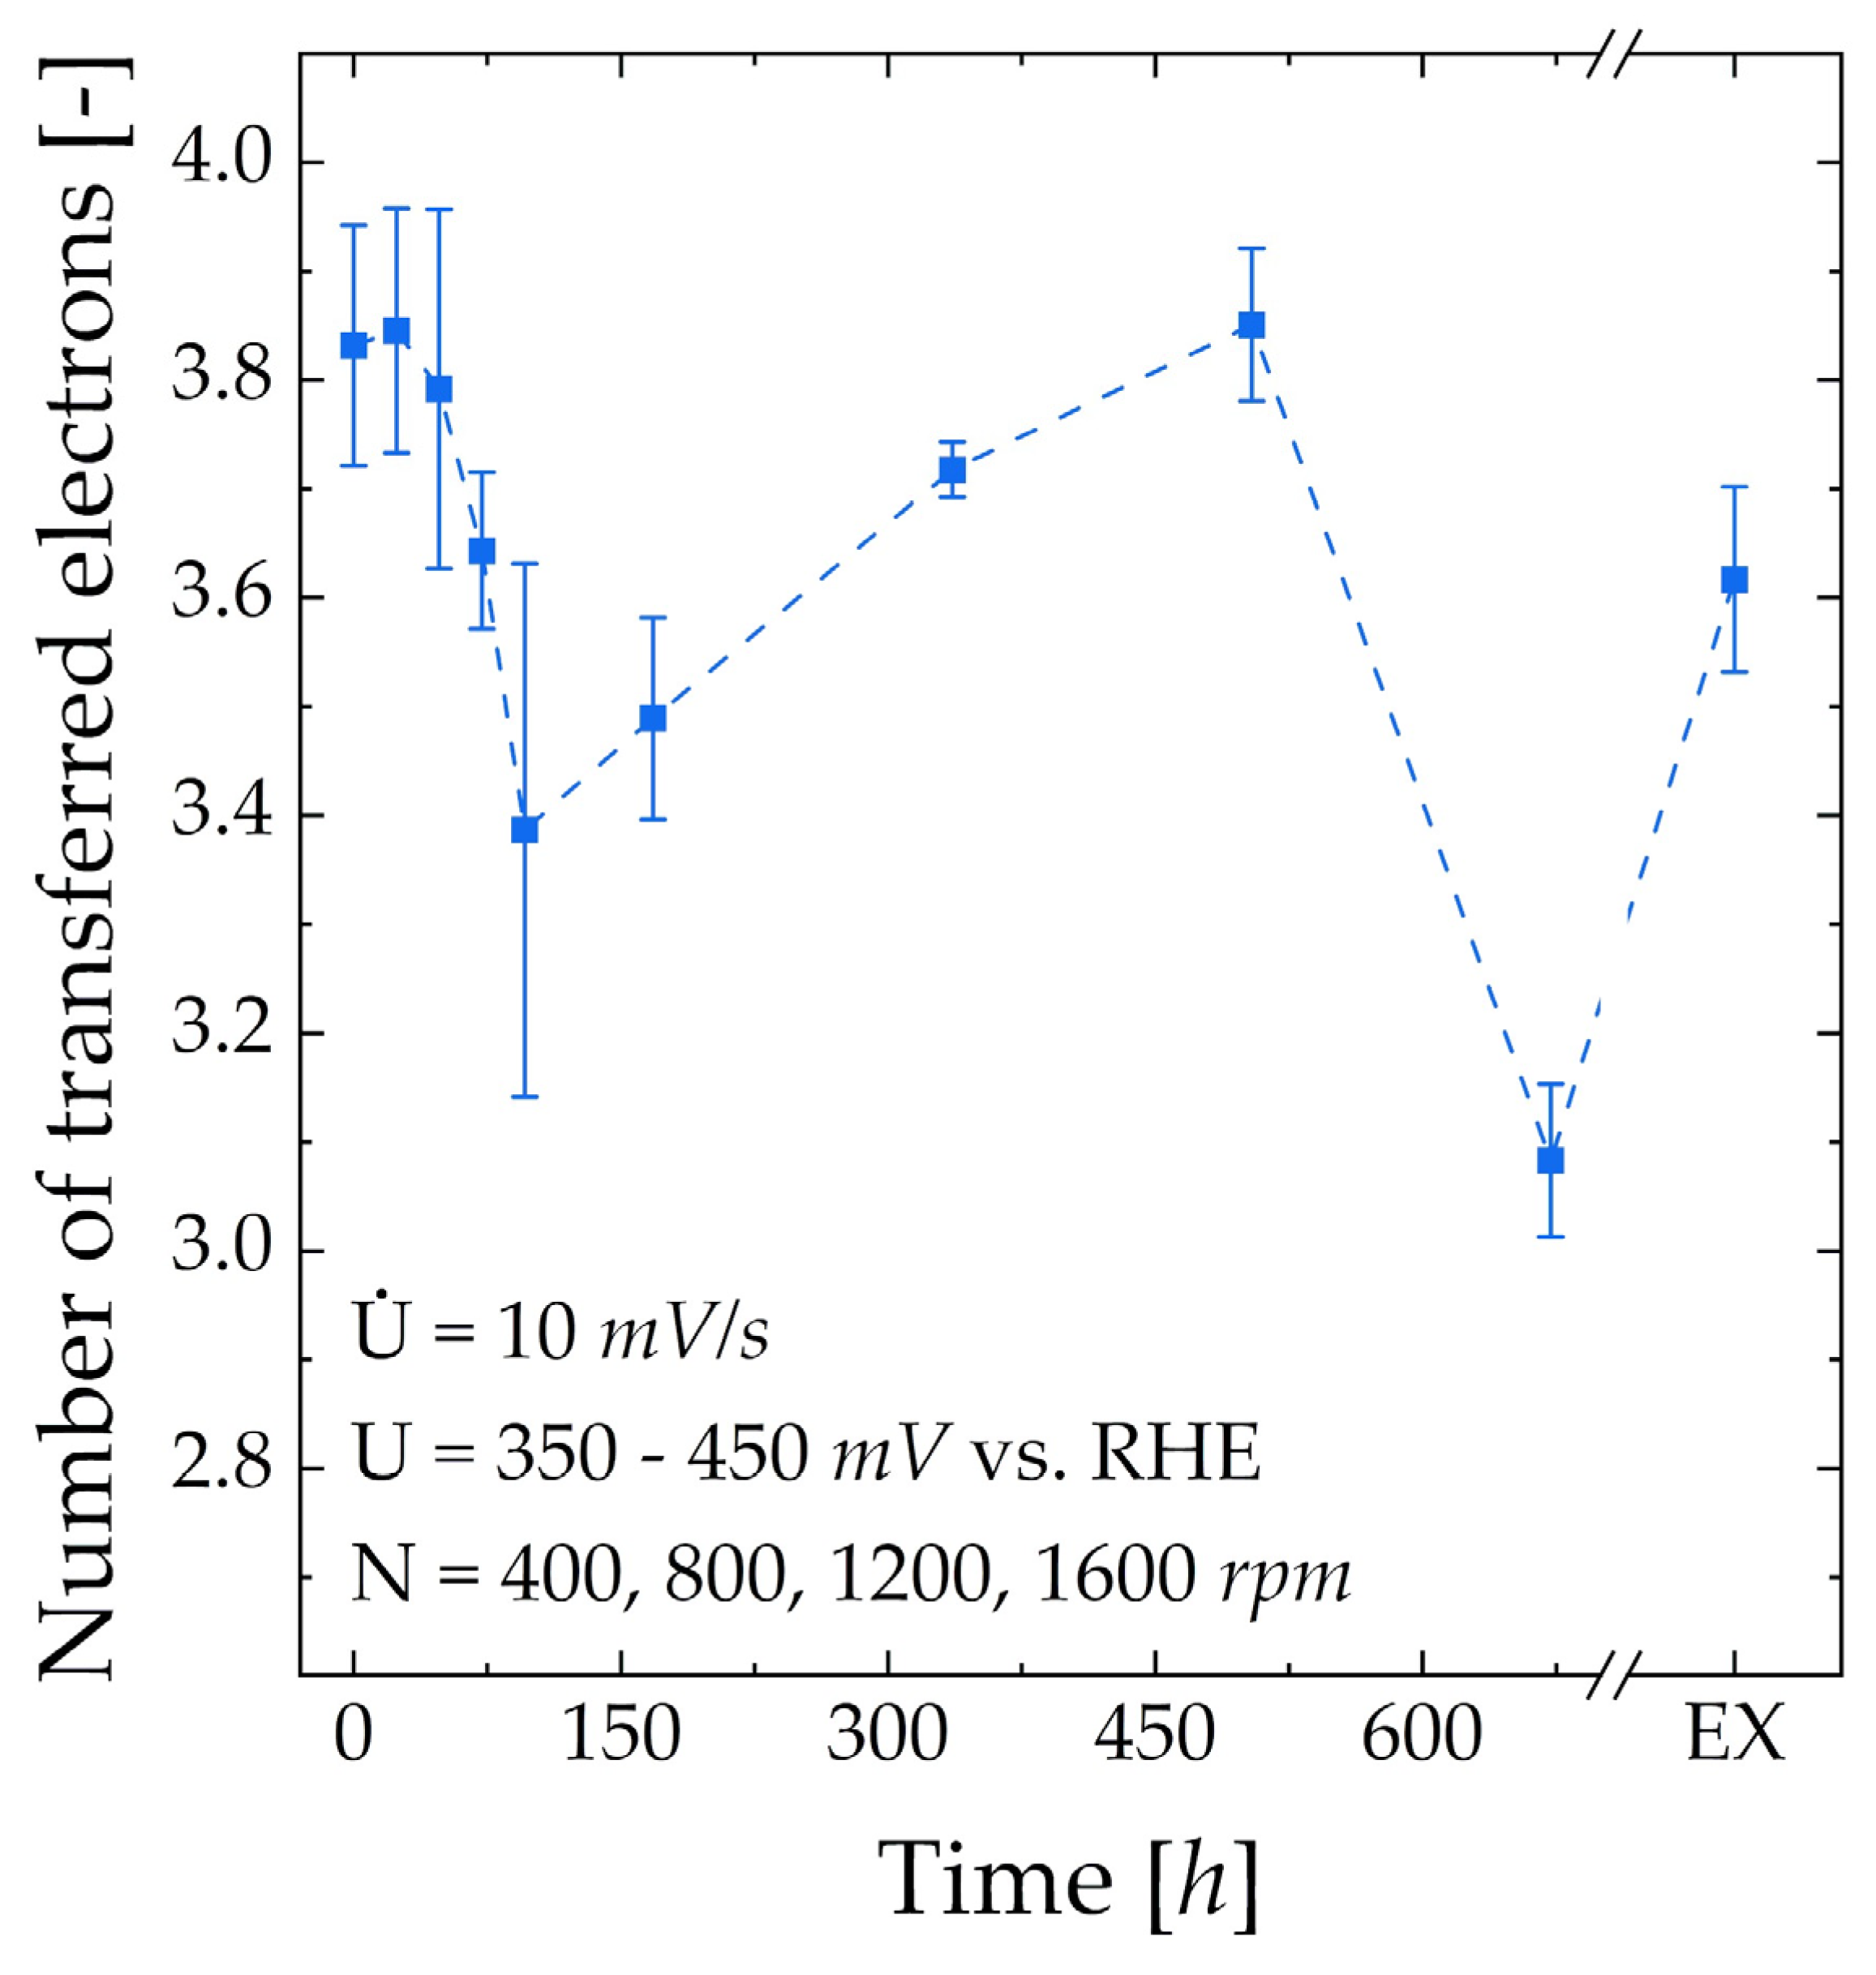
3.3.1. RDE
3.3.2. MEA
4. Conclusions
Supplementary Materials
Author Contributions
Funding
Data Availability Statement
Acknowledgments
Conflicts of Interest
References
- Ritchie, H.; Roser, M.; Rosado, P. CO2 and Greenhouse Gas Emissions. Available online: https://ourworldindata.org/co2-emissions?utm_source=tri-city%20news&utm_campaign=tricity%20news%3A%20outbound&utm_medium=referral (accessed on 25 July 2023).
- U.S. Energy Information Administration. Use of Energy Explained: Energy Use for Transportation. Available online: https://www.eia.gov/energyexplained/use-of-energy/transportation.php (accessed on 11 April 2022).
- Cullen, D.A.; Neyerlin, K.C.; Ahluwalia, R.K.; Mukundan, R.; More, K.L.; Borup, R.L.; Weber, A.Z.; Myers, D.J.; Kusoglu, A. New roads and challenges for fuel cells in heavy-duty transportation. Nat. Energy 2021, 6, 462–474. [Google Scholar] [CrossRef]
- Fan, L.; Tu, Z.; Chan, S.H. Recent development of hydrogen and fuel cell technologies: A review. Energy Rep. 2021, 7, 8421–8446. [Google Scholar] [CrossRef]
- Olabi, A.; Wilberforce, T.; Abdelkareem, M.A. Fuel cell application in the automotive industry and future perspective. Energy 2021, 214, 118955. [Google Scholar] [CrossRef]
- Trencher, G. Strategies to accelerate the production and diffusion of fuel cell electric vehicles: Experiences from California. Energy Rep. 2020, 6, 2503–2519. [Google Scholar] [CrossRef]
- Trencher, G.; Taeihagh, A.; Yarime, M. Overcoming barriers to developing and diffusing fuel-cell vehicles: Governance strategies and experiences in Japan. Energy Policy 2020, 142, 111533. [Google Scholar] [CrossRef]
- Wang, J.; Wang, H.; Fan, Y. Techno-Economic Challenges of Fuel Cell Commercialization. Engineering 2018, 4, 352–360. [Google Scholar] [CrossRef]
- Grandi, M.; Rohde, S.; Liu, D.; Gollas, B.; Hacker, V. Recent advancements in high performance polymer electrolyte fuel cell electrode fabrication—Novel materials and manufacturing processes. J. Power Sources 2023, 562, 232734. [Google Scholar] [CrossRef]
- Peron, J.; Mani, A.; Zhao, X.; Edwards, D.; Adachi, M.; Soboleva, T.; Shi, Z.; Xie, Z.; Navessin, T.; Holdcroft, S. Properties of Nafion® NR-211 membranes for PEMFCs. J. Membr. Sci. 2010, 356, 44–51. [Google Scholar] [CrossRef]
- Heras, A.D.L.; Vivas, F.; Segura, F.; Andújar, J. From the cell to the stack. A chronological walk through the techniques to manufacture the PEFCs core. Renew. Sustain. Energy Rev. 2018, 96, 29–45. [Google Scholar] [CrossRef]
- Mayyas, A.; Mann, M. Emerging Manufacturing Technologies for Fuel Cells and Electrolyzers. Procedia Manuf. 2019, 33, 508–515. [Google Scholar] [CrossRef]
- Berlinger, S.A.; Garg, S.; Weber, A.Z. Multicomponent, multiphase interactions in fuel-cell inks. Curr. Opin. Electrochem. 2021, 29, 100744. [Google Scholar] [CrossRef]
- Bapat, S.; Giehl, C.; Kohsakowski, S.; Peinecke, V.; Schäffler, M.; Segets, D. On the state and stability of fuel cell catalyst inks. Adv. Powder Technol. 2021, 32, 3845–3859. [Google Scholar] [CrossRef]
- Yang, F.; Xin, L.; Uzunoglu, A.; Qiu, Y.; Stanciu, L.; Ilavsky, J.; Li, W.; Xie, J. Investigation of the Interaction between Nafion Ionomer and Surface Functionalized Carbon Black Using Both Ultrasmall Angle X-ray Scattering and Cryo-TEM. ACS Appl. Mater. Interfaces 2017, 9, 6530–6538. [Google Scholar] [CrossRef]
- Shukla, S.; Bhattacharjee, S.; Weber, A.Z.; Secanell, M. Experimental and Theoretical Analysis of Ink Dispersion Stability for Polymer Electrolyte Fuel Cell Applications. J. Electrochem. Soc. 2017, 164, F600–F609. [Google Scholar] [CrossRef]
- Chisaka, M.; Matsuoka, E.; Daiguji, H. Effect of Organic Solvents on the Pore Structure of Catalyst Layers in Polymer Electrolyte Membrane Fuel Cells. J. Electrochem. Soc. 2010, 157, B1218–B1221. [Google Scholar] [CrossRef]
- Dixit, M.B.; Harkey, B.A.; Shen, F.; Hatzell, K.B. Catalyst Layer Ink Interactions That Affect Coatability. J. Electrochem. Soc. 2018, 165, F264–F271. [Google Scholar] [CrossRef]
- Berlinger, S.A.; Chowdhury, A.; Van Cleve, T.; He, A.; Dagan, N.; Neyerlin, K.C.; McCloskey, B.D.; Radke, C.J.; Weber, A.Z. Impact of Platinum Primary Particle Loading on Fuel Cell Performance: Insights from Catalyst/Ionomer Ink Interactions. ACS Appl. Mater. Interfaces 2022, 14, 36731–36740. [Google Scholar] [CrossRef]
- Guo, Y.; Pan, F.; Chen, W.; Ding, Z.; Yang, D.; Li, B.; Ming, P.; Zhang, C. The Controllable Design of Catalyst Inks to Enhance PEMFC Performance: A Review. Electrochem. Energy Rev. 2021, 4, 67–100. [Google Scholar] [CrossRef]
- Alink, R.; Singh, R.; Schneider, P.; Christmann, K.; Schall, J.; Keding, R.; Zamel, N. Full Parametric Study of the Influence of Ionomer Content, Catalyst Loading and Catalyst Type on Oxygen and Ion Transport in PEM Fuel Cell Catalyst Layers. Molecules 2020, 25, 1523. [Google Scholar] [CrossRef]
- Park, J.-H.; Shin, M.-S.; Park, J.-S. Effect of dispersing solvents for ionomers on the performance and durability of catalyst layers in proton exchange membrane fuel cells. Electrochim. Acta 2021, 391, 138971. [Google Scholar] [CrossRef]
- Guo, Y.; Yang, D.; Tang, H.; Li, B.; Yang, D.; Ming, P.; Zhang, C. Solvent effects on the rheology of fuel cell catalyst ink and the adsorption of ionomers on the particles. Phys. Fluids 2022, 34, 103113. [Google Scholar] [CrossRef]
- Biddinger, E.J.; von Deak, D.; Marsh, H.S.; Ozkan, U.S. RRDE Catalyst Ink Aging Effects on Selectivity to Water Formation in ORR. Electrochem. Solid-State Lett. 2010, 13, B98–B100. [Google Scholar] [CrossRef]
- Shirlaine Koh, P.S. Dealloyed Pt Nanoparticle Fuel Cell Electrocatalysts: Stability and Aging Study of Cata-lyst Powders, Thin Films, and Inks. J. Electrochem. Soc. 2010, 157, B585–B591. [Google Scholar]
- Uemura, S.; Kameya, Y.; Iriguchi, N.; Yoshida, T.; Hirai, S. Time Lapse Visualization of Catalyst Ink Degradation by X-ray CT. ECS Trans. 2017, 80, 403–407. [Google Scholar] [CrossRef]
- Uemura, S.; Yoshida, T.; Koga, M.; Matsumoto, H.; Yang, X.; Shinohara, K.; Sasabe, T.; Hirai, S. Ink Degradation and Its Effects on the Crack Formation of Fuel Cell Catalyst Layers. J. Electrochem. Soc. 2019, 166, F89–F92. [Google Scholar] [CrossRef]
- Uemura, S.; Sasabe, T.; Sakai, K.; Shinohara, K.; Hirai, S. Relation between Degradation Reaction and Mixing at Fuel Cell Catalyst Ink Fabrication Process. ECS Trans. 2019, 92, 183–187. [Google Scholar] [CrossRef]
- Uemura, S.; Sakai, K.; Sasabe, T.; Matsumoto, H.; Sugimori, H.; Shinohara, K.; Hirai, S. Effect of Reaction Products on the PEFC Catalyst Ink Property and Catalyst Layer Quality. ECS Trans. 2020, 98, 61–65. [Google Scholar] [CrossRef]
- Uemura, S.; Sasabe, T.; Sakai, K.; Matsumoto, H.; Sugimori, H.; Shinohara, K.; Hirai, S. Reaction Products Affecting the PEFC Catalyst Ink Property. J. Electrochem. Soc. 2021, 168, 104504. [Google Scholar] [CrossRef]
- Liu, P.; Yang, D.; Li, B.; Zhang, C.; Ming, P. Influence of Degassing Treatment on the Ink Properties and Performance of Proton Exchange Membrane Fuel Cells. Membranes 2022, 12, 541. [Google Scholar] [CrossRef]
- Ren, H.; Meng, X.; Lin, Y.; Shao, Z. Structural stability of catalyst ink and its effects on the catalyst layer microstructure and fuel cell performance. J. Power Sources 2022, 517, 230698. [Google Scholar] [CrossRef]
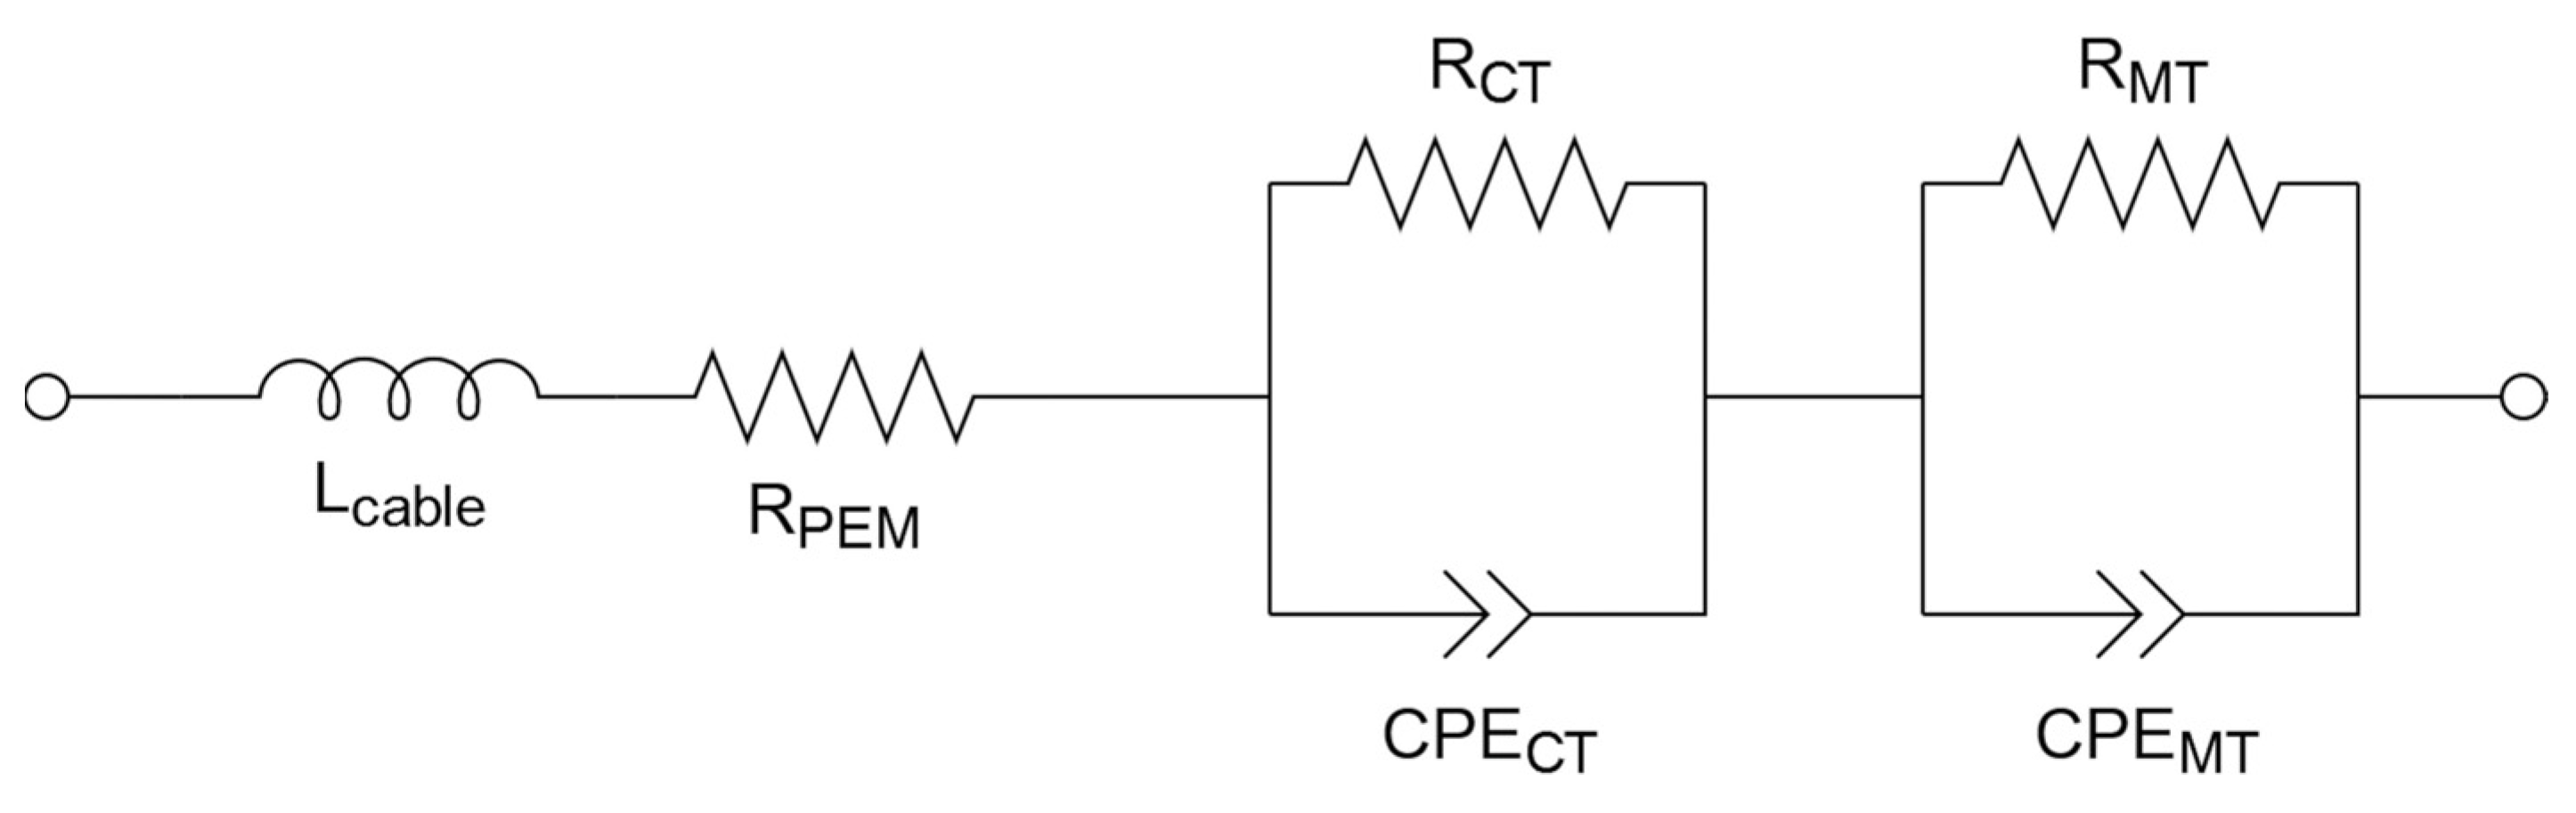
- Grandi, M.; Mayer, K.; Gatalo, M.; Kapun, G.; Ruiz-Zepeda, F.; Marius, B.; Gaberšček, M.; Hacker, V. The Influence Catalyst Layer Thickness on Resistance Contributions of PEMFC Determined by Electrochemical Impedance Spectroscopy. Energies 2021, 14, 7299. [Google Scholar] [CrossRef]
- Ferstl, E.; Gabriel, M.; Gomernik, F.; Müller, S.M.; Selinger, J.; Thaler, F.; Bauer, W.; Uhlig, F.; Spirk, S.; Chemelli, A. Investigation of the Adsorption Behavior of Jet-Cooked Cationic Starches on Pulp Fibers. Polymers 2020, 12, 2249. [Google Scholar] [CrossRef] [PubMed]
- Roschger, M.; Wolf, S.; Hasso, R.; Genorio, B.; Gorgieva, S.; Hacker, V. Influence of the Electrode Deposition Method of Graphene-Based Catalyst Inks for ADEFC on Performance. ACS Appl. Mater. Interfaces 2023, 15, 40687–40699. [Google Scholar] [CrossRef] [PubMed]
- Hicks, L.M. (Ed.) Antimicrobial Peptides; Academic Press: Cambridge, MA, USA; San Diego, CA, USA; Oxford, UK; London, UK, 2022. [Google Scholar]
- Cooper, K. Laboratory #4—Fuel Crossover by Linear Sweep Voltammetry & Electrochemical Surface Area by Cyclic Voltammetry. Fuel Cell Magazine 2009. Available online: https://www.scribner.com/files/tech-papers/Scribner-on-Crossover-Fuel-Cell-Magazine-2008.pdf (accessed on 4 September 2023).
- Wolf, S.; Roschger, M.; Genorio, B.; Garstenauer, D.; Radić, J.; Hacker, V. Ce-modified Co–Mn oxide spinel on reduced graphene oxide and carbon black as ethanol tolerant oxygen reduction electrocatalyst in alkaline media. RSC Adv. 2022, 12, 35966–35976. [Google Scholar] [CrossRef]
- Wei, Y.-C.; Liu, C.-W.; Wang, K.-W. Improvement of oxygen reduction reaction and methanol tolerance characteristics for PdCo electrocatalysts by Au alloying and CO treatment. Chem. Commun. 2011, 47, 11927–11929. [Google Scholar] [CrossRef]
- Santana, J.; Espinoza-Andaluz, M.; Li, T.; Andersson, M. A Detailed Analysis of Internal Resistance of a PEFC Comparing High and Low Humidification of the Reactant Gases. Front. Energy Res. 2020, 8, 1–12. [Google Scholar] [CrossRef]
- Ferreira, R.B.; Falcão, D.; Oliveira, V.; Pinto, A. Experimental study on the membrane electrode assembly of a proton exchange membrane fuel cell: Effects of microporous layer, membrane thickness and gas diffusion layer hydrophobic treatment. Electrochim. Acta 2017, 224, 337–345. [Google Scholar] [CrossRef]
- Xu, R.; Wu, C.; Xu, H. Particle size and zeta potential of carbon black in liquid media. Carbon 2007, 45, 2806–2809. [Google Scholar] [CrossRef]
- Kim, O.; Oh, S.; Ahn, C.; Kim, S.; Kim, J.K.; Yang, S.; Choi, M.; Cho, Y.; Sung, Y. Enhanced Performance of Ionomer Binder with Shorter Side-Chains, Higher Dispersibility, and Lower Equivalent Weight. Fuel Cells 2018, 18, 711–722. [Google Scholar] [CrossRef]
- Esplandiu, M.J.; Reguera, D.; Romero-Guzmán, D.; Gallardo-Moreno, A.M.; Fraxedas, J. From radial to unidirectional water pumping in zeta-potential modulated Nafion nanostructures. Nat. Commun. 2022, 13, 2812. [Google Scholar] [CrossRef] [PubMed]
- Berens, S.J.; Yahya, A.; Fang, J.; Angelopoulos, A.P.; Nickels, J.D.; Vasenkov, S. Transition between Different Diffusion Regimes and Its Relationship with Structural Properties in Nafion by High Field Diffusion NMR in Combination with Small-Angle X-ray and Neutron Scattering. J. Phys. Chem. B 2020, 124, 8943–8950. [Google Scholar] [CrossRef] [PubMed]
- Wieckowski, A.; Zelenay, P.; Szklarczyk, M.; Sobkowski, J. The Pt-acetone-water system investigated by radiotracer and electrochemical methods. J. Electroanal. Chem. Interfacial Electrochem. 1982, 135, 285–299. [Google Scholar] [CrossRef]
- Akterian, S. Evaluating the Vapour Evaporation from the Surface of Pure Organic Solvents and Their Mixtures. Food Sci. Appl. Biotechnol. 2020, 3, 77–84. [Google Scholar] [CrossRef]
- Shinozaki, K.; Zack, J.W.; Pylypenko, S.; Pivovar, B.S.; Kocha, S.S. Oxygen reduction reaction measurements on platinum electrocatalysts utilizing rotating disk electrode technique: II. Influence of ink formulation, catalyst layer uniformity and thickness. J. Electrochem. Soc. 2015, 162, F1384–F1396. [Google Scholar] [CrossRef]
- Shinozaki, K.; Zack, J.W.; Richards, R.M.; Pivovar, B.S.; Kocha, S.S. Oxygen Reduction Reaction Measurements on Platinum Electrocatalysts Utilizing Rotating Disk Electrode Technique: I. Impact of impurities, measurement protocols and applied corrections. J. Electrochem. Soc. 2015, 162, F1144–F1158. [Google Scholar] [CrossRef]
- Fisher Scientific, Summary of Key Physical Data for Solvents. Available online: https://www.fishersci.co.uk/gb/en/scientific-products/technical-tools/summary-key-physical-data-solvents.html (accessed on 1 September 2023).
- Gmehling, J.; Kleiber, M.; Kolbe, B.; Rarey, J. Chemical Thermodynamics for Process Simulation, 4th ed.; Wiley-VCH Verlag GmbH & Co. KGaA: Weinheim, Germany, 2015. [Google Scholar]
- Miller, C.G.; Maass, O. Determination of dielectric constant in binary organic sys-tems. Can. J. Chem. 1960, 38, 1606–1616. [Google Scholar] [CrossRef]
- Gong, Q.; Li, C.; Liu, Y.; Ilavsky, J.; Guo, F.; Cheng, X.; Xie, J. Effects of Ink Formulation on Construction of Catalyst Layers for High-Performance Polymer Electrolyte Membrane Fuel Cells. ACS Appl. Mater. Interfaces 2021, 13, 37004–37013. [Google Scholar] [CrossRef]
- Lei, C.; Yang, F.; Macauley, N.; Spinetta, M.; Purdy, G.M.; Jankovic, J.; Cullen, D.A.; More, K.L.; Kim, Y.S.; Xu, H. Impact of Catalyst Ink Dispersing Solvent on PEM Fuel Cell Performance and Durability. J. Electrochem. Soc. 2021, 168, 044517. [Google Scholar] [CrossRef]
- Horsley, L.H. (Ed.) Azeotropic Data; American Chemical Society: Washington, DC, USA, 1973; Volume 116, ISBN 8412-0166-8. [Google Scholar]
- Liu, H.; Ney, L.; Zamel, N.; Li, X. Effect of Catalyst Ink and Formation Process on the Multiscale Structure of Catalyst Layers in PEM Fuel Cells. Appl. Sci. 2022, 12, 3776. [Google Scholar] [CrossRef]
- Moore, M.; Shukla, S.; Voss, S.; Karan, K.; Weber, A.; Zenyuk, I.; Secanell, M. A Numerical Study on the Impact of Cathode Catalyst Layer Loading on the Open Circuit Voltage in a Proton Exchange Membrane Fuel Cell. J. Electrochem. Soc. 2021, 168, 044519. [Google Scholar] [CrossRef]
- Bondue, C.J.; Liang, Z.; Koper, M.T.M. Dissociative Adsorption of Acetone on Platinum Single-Crystal Electrodes. J. Phys. Chemistry C Nanomater. Interfaces 2021, 125, 6643–6649. [Google Scholar] [CrossRef] [PubMed]


| Name | Electrochemical Parameters | Gas |
|---|---|---|
| Conditioning (CV) | U = 50 − = 50 mV/s 25 cycles | N2 |
| CV | U = 50 − = 10 mV/s 4 cycles (4th evaluated) | N2 |
| CV for ORR | U = 50 − = 10 mV/s 4 cycles (4th evaluated) N = 400, 800, 1200, 1600 rpm | O2 |
| Name | Electrochemical Parameters | Gas Parameters | |
|---|---|---|---|
| Anode | Cathode | ||
| CV | U = 50 − = 100 mV/s 4 cycles (4th evaluated) | = 200 mL/min p = 1 bara | = 80 mL/min p = 1 bara |
| Conditioning (Break-in) | U = 400 − = 3.33 mV/s 20 cycles | = 400 mL/min p = 1 bara | = 1244 mL/min p = 1 bara |
| CV | U = 50 − = 100 mV/s 4 cycles (4th evaluated) | = 200 mL/min p = 1 bara | = 80 mL/min p = 1 bara |
| EIS | i = 0.4, 0.6, 0.8, 1.0, 1.2 A/cm2 a = 0.1 ∙ i f = 1 kHz − 300 mHz | H2 λ = 1.5 p = 2 bara | SA λ = 3 p = 2 bara |
| Polarization curve | i = 0 − 1.4 A/cm2 thold = 180 s (last 60 s evaluated) | H2 λ = 1.5 p = 2 bara | SA λ = 3 p = 2 bara |
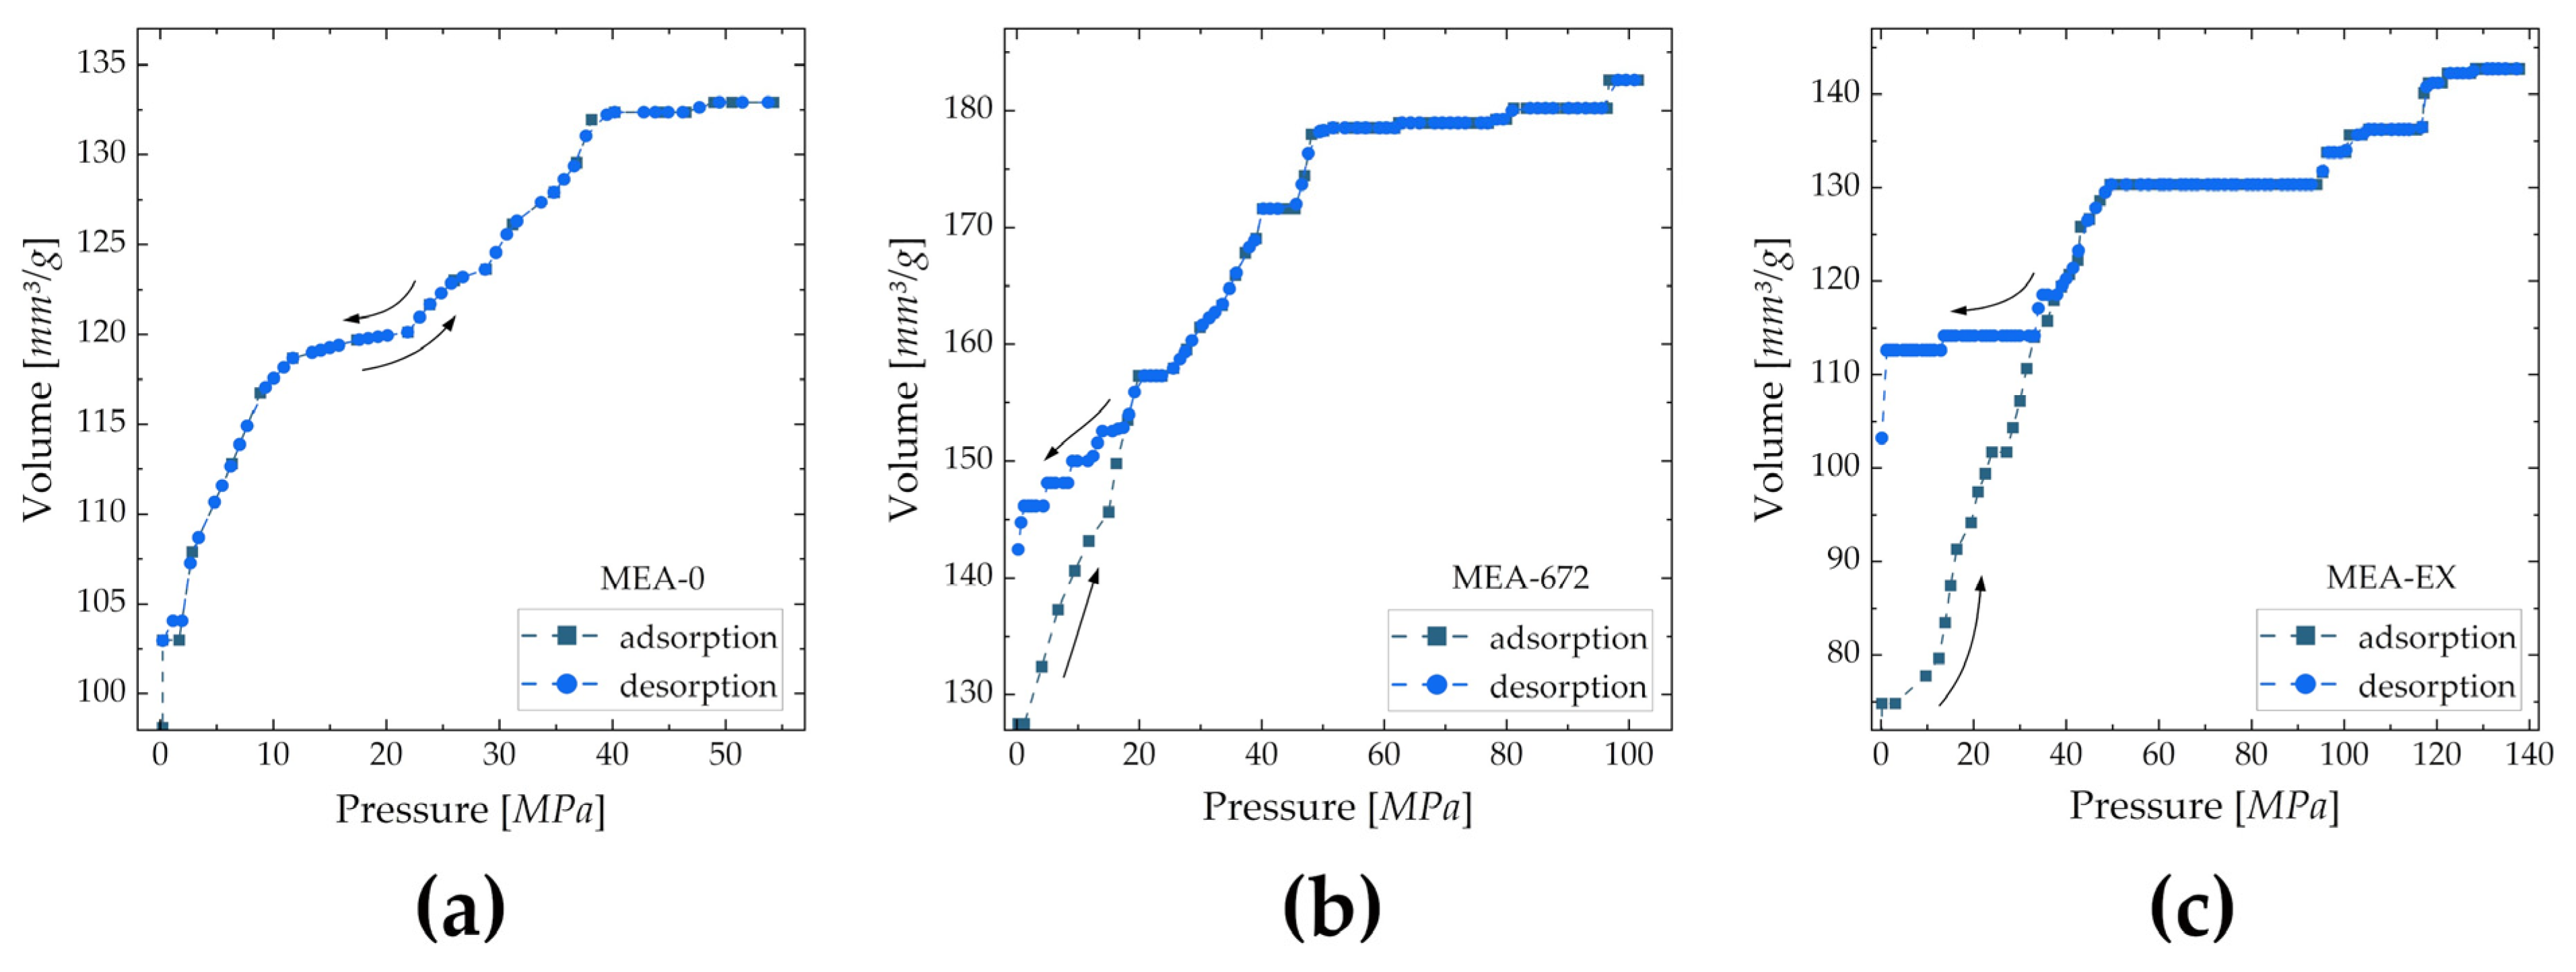
| Cell | Average Pore Diameter [nm] | Specific Surface Area [m2/g] |
|---|---|---|
| MEA-0 | 311.6 | 1.706 |
| MEA-672 | 150.6 | 4.850 |
| MEA-EX | 62.58 | 9.121 |
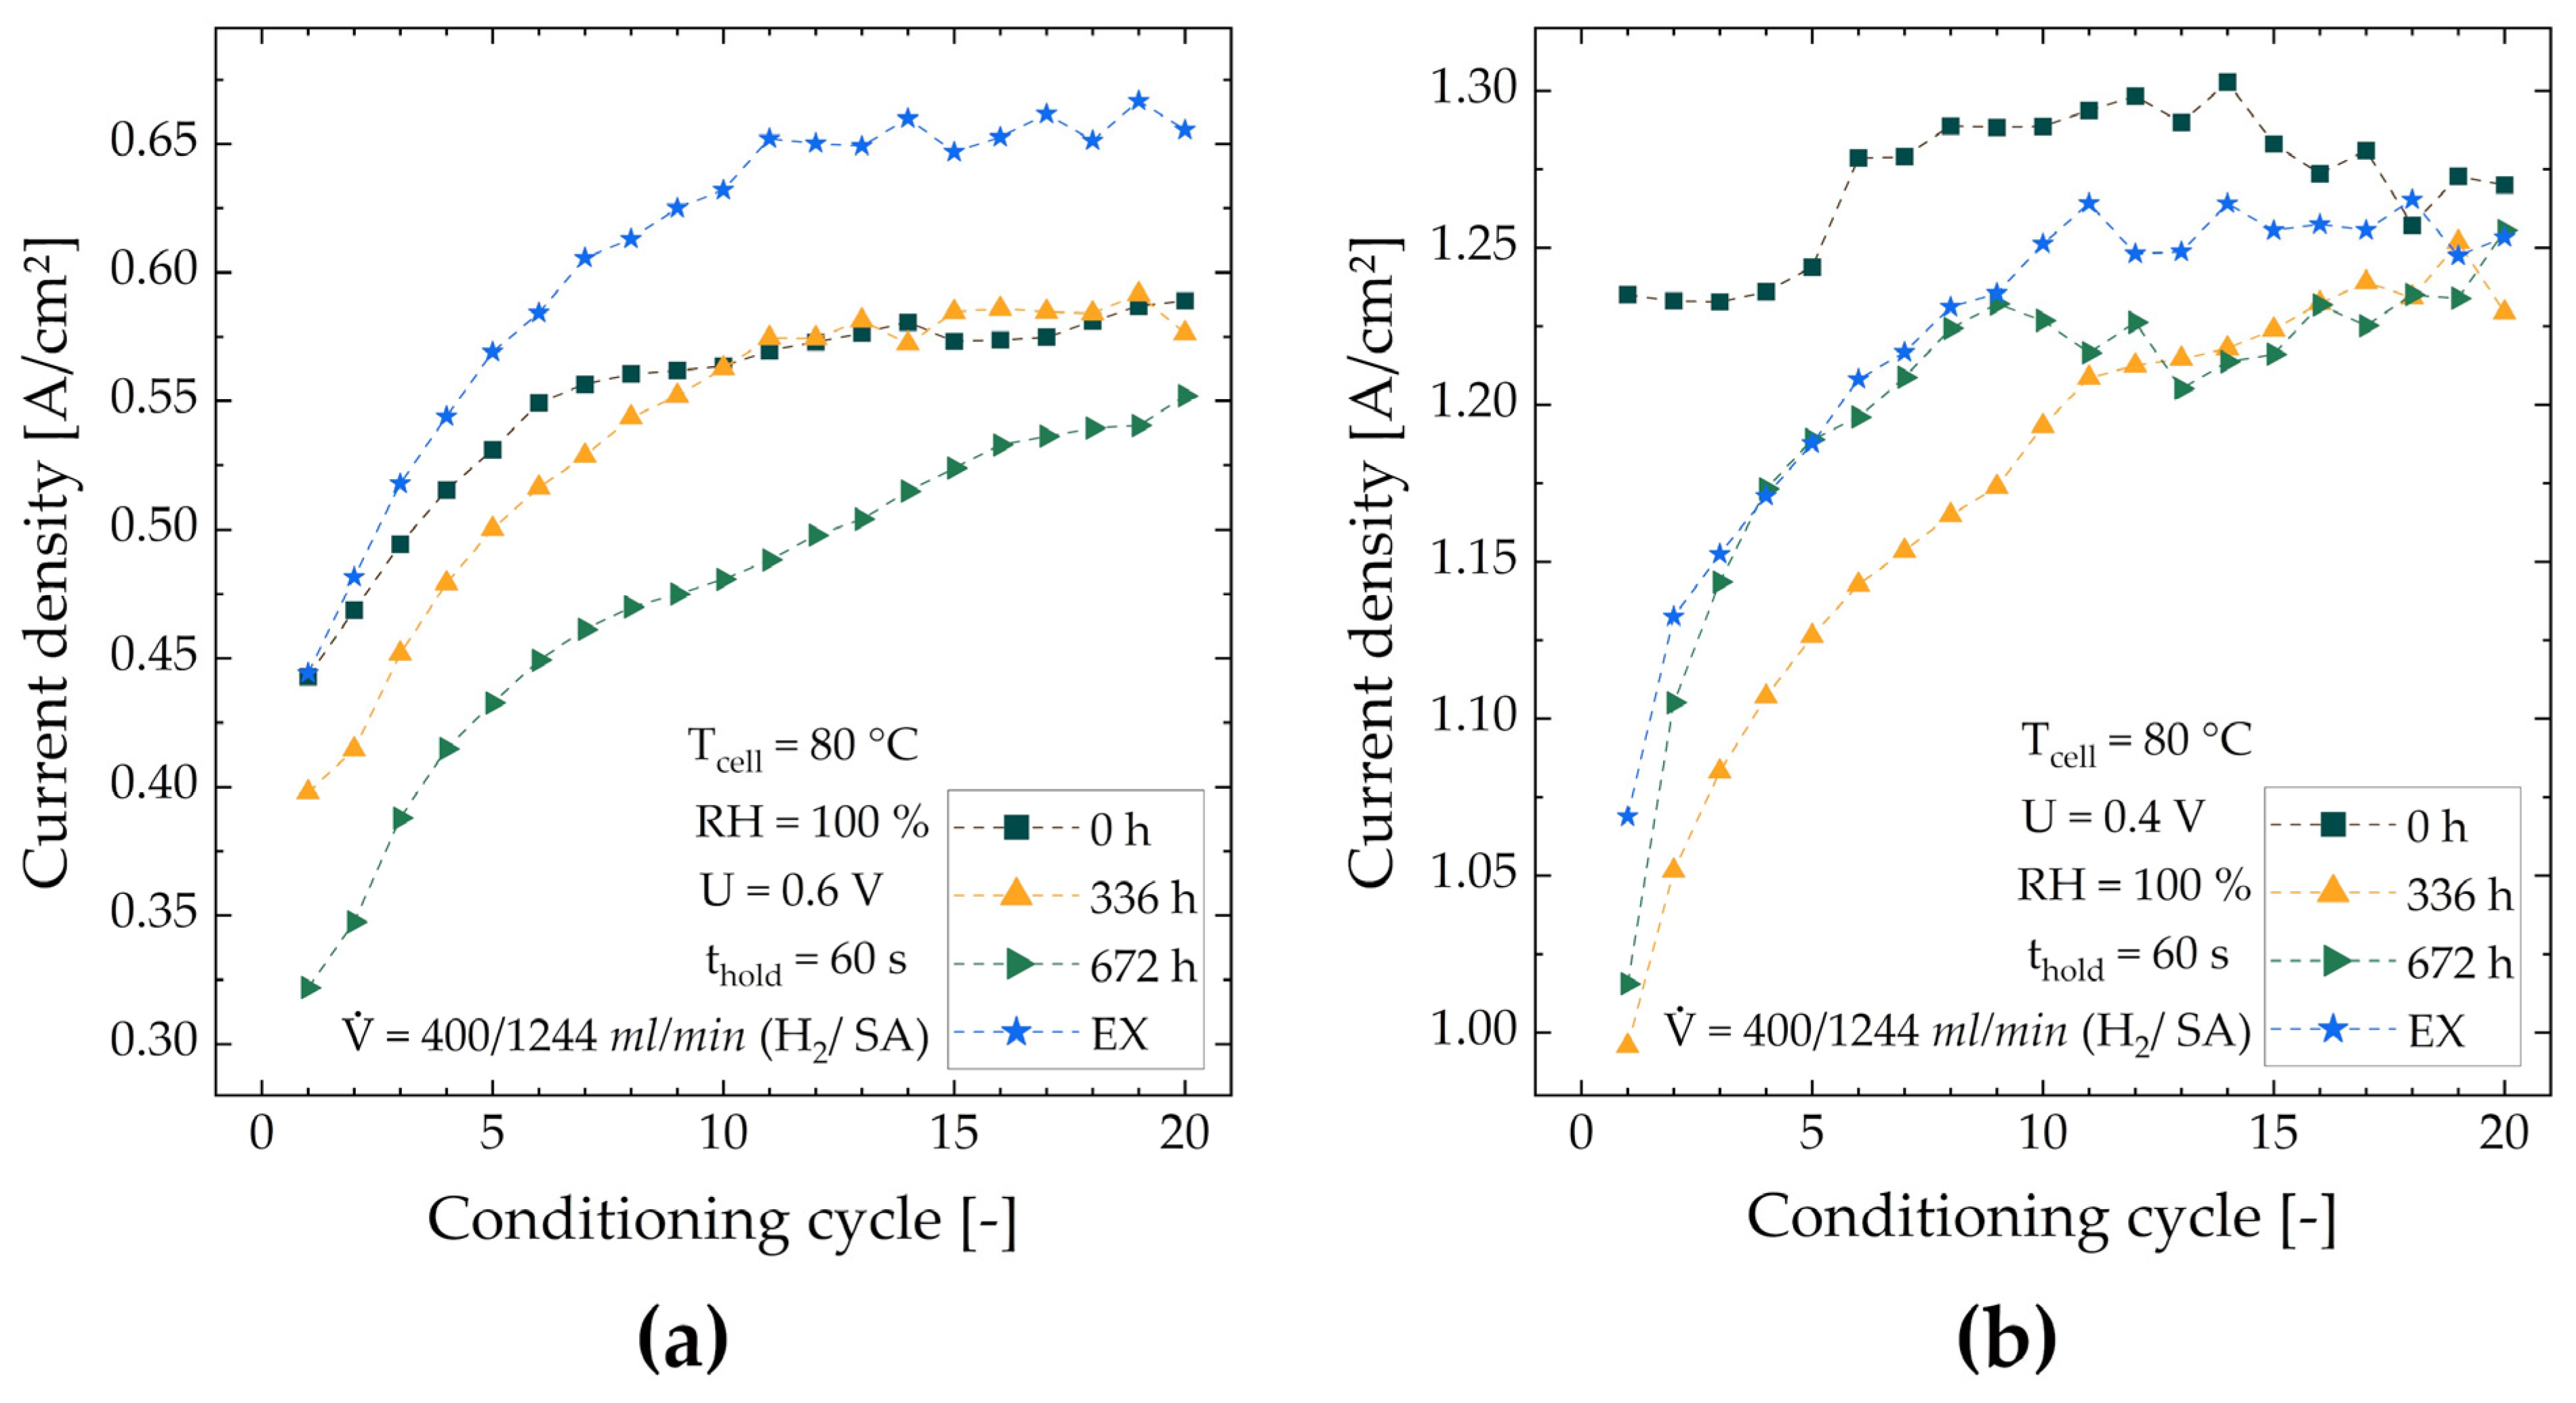
| Cell | Current Density at 0.6 V [A/cm2] | Current Density at 0.4 V [A/cm2] | ||||
|---|---|---|---|---|---|---|
| Cycle 1 | Cycle 20 | Relative Improvement | Cycle 1 | Cycle 20 | Relative Improvement | |
| MEA-0 | 0.443 | 0.589 | 33.0% | 1.235 | 1.270 | 2.80% |
| MEA-336 | 0.398 | 0.576 | 44.7% | 0.996 | 1.229 | 23.4% |
| MEA-672 | 0.322 | 0.552 | 71.4% | 1.016 | 1.256 | 23.6% |
| MEA-EX | 0.444 | 0.655 | 47.5% | 1.069 | 1.253 | 17.2% |
| Cell | ECSA [m2/g] | Relative Improvement | |
|---|---|---|---|
| Before Conditioning | After Conditioning | ||
| MEA-0 | 22.7 | 36.2 | 59.5% |
| MEA-168 | 16.7 | 31.6 | 89.5% |
| MEA-336 | 23.0 | 43.4 | 88.8% |
| MEA-504 | 19.7 | 37.6 | 90.9% |
| MEA-672 | 20.4 | 39.6 | 94.0% |
| MEA-EX | 18.3 | 39.1 | 113.4% |
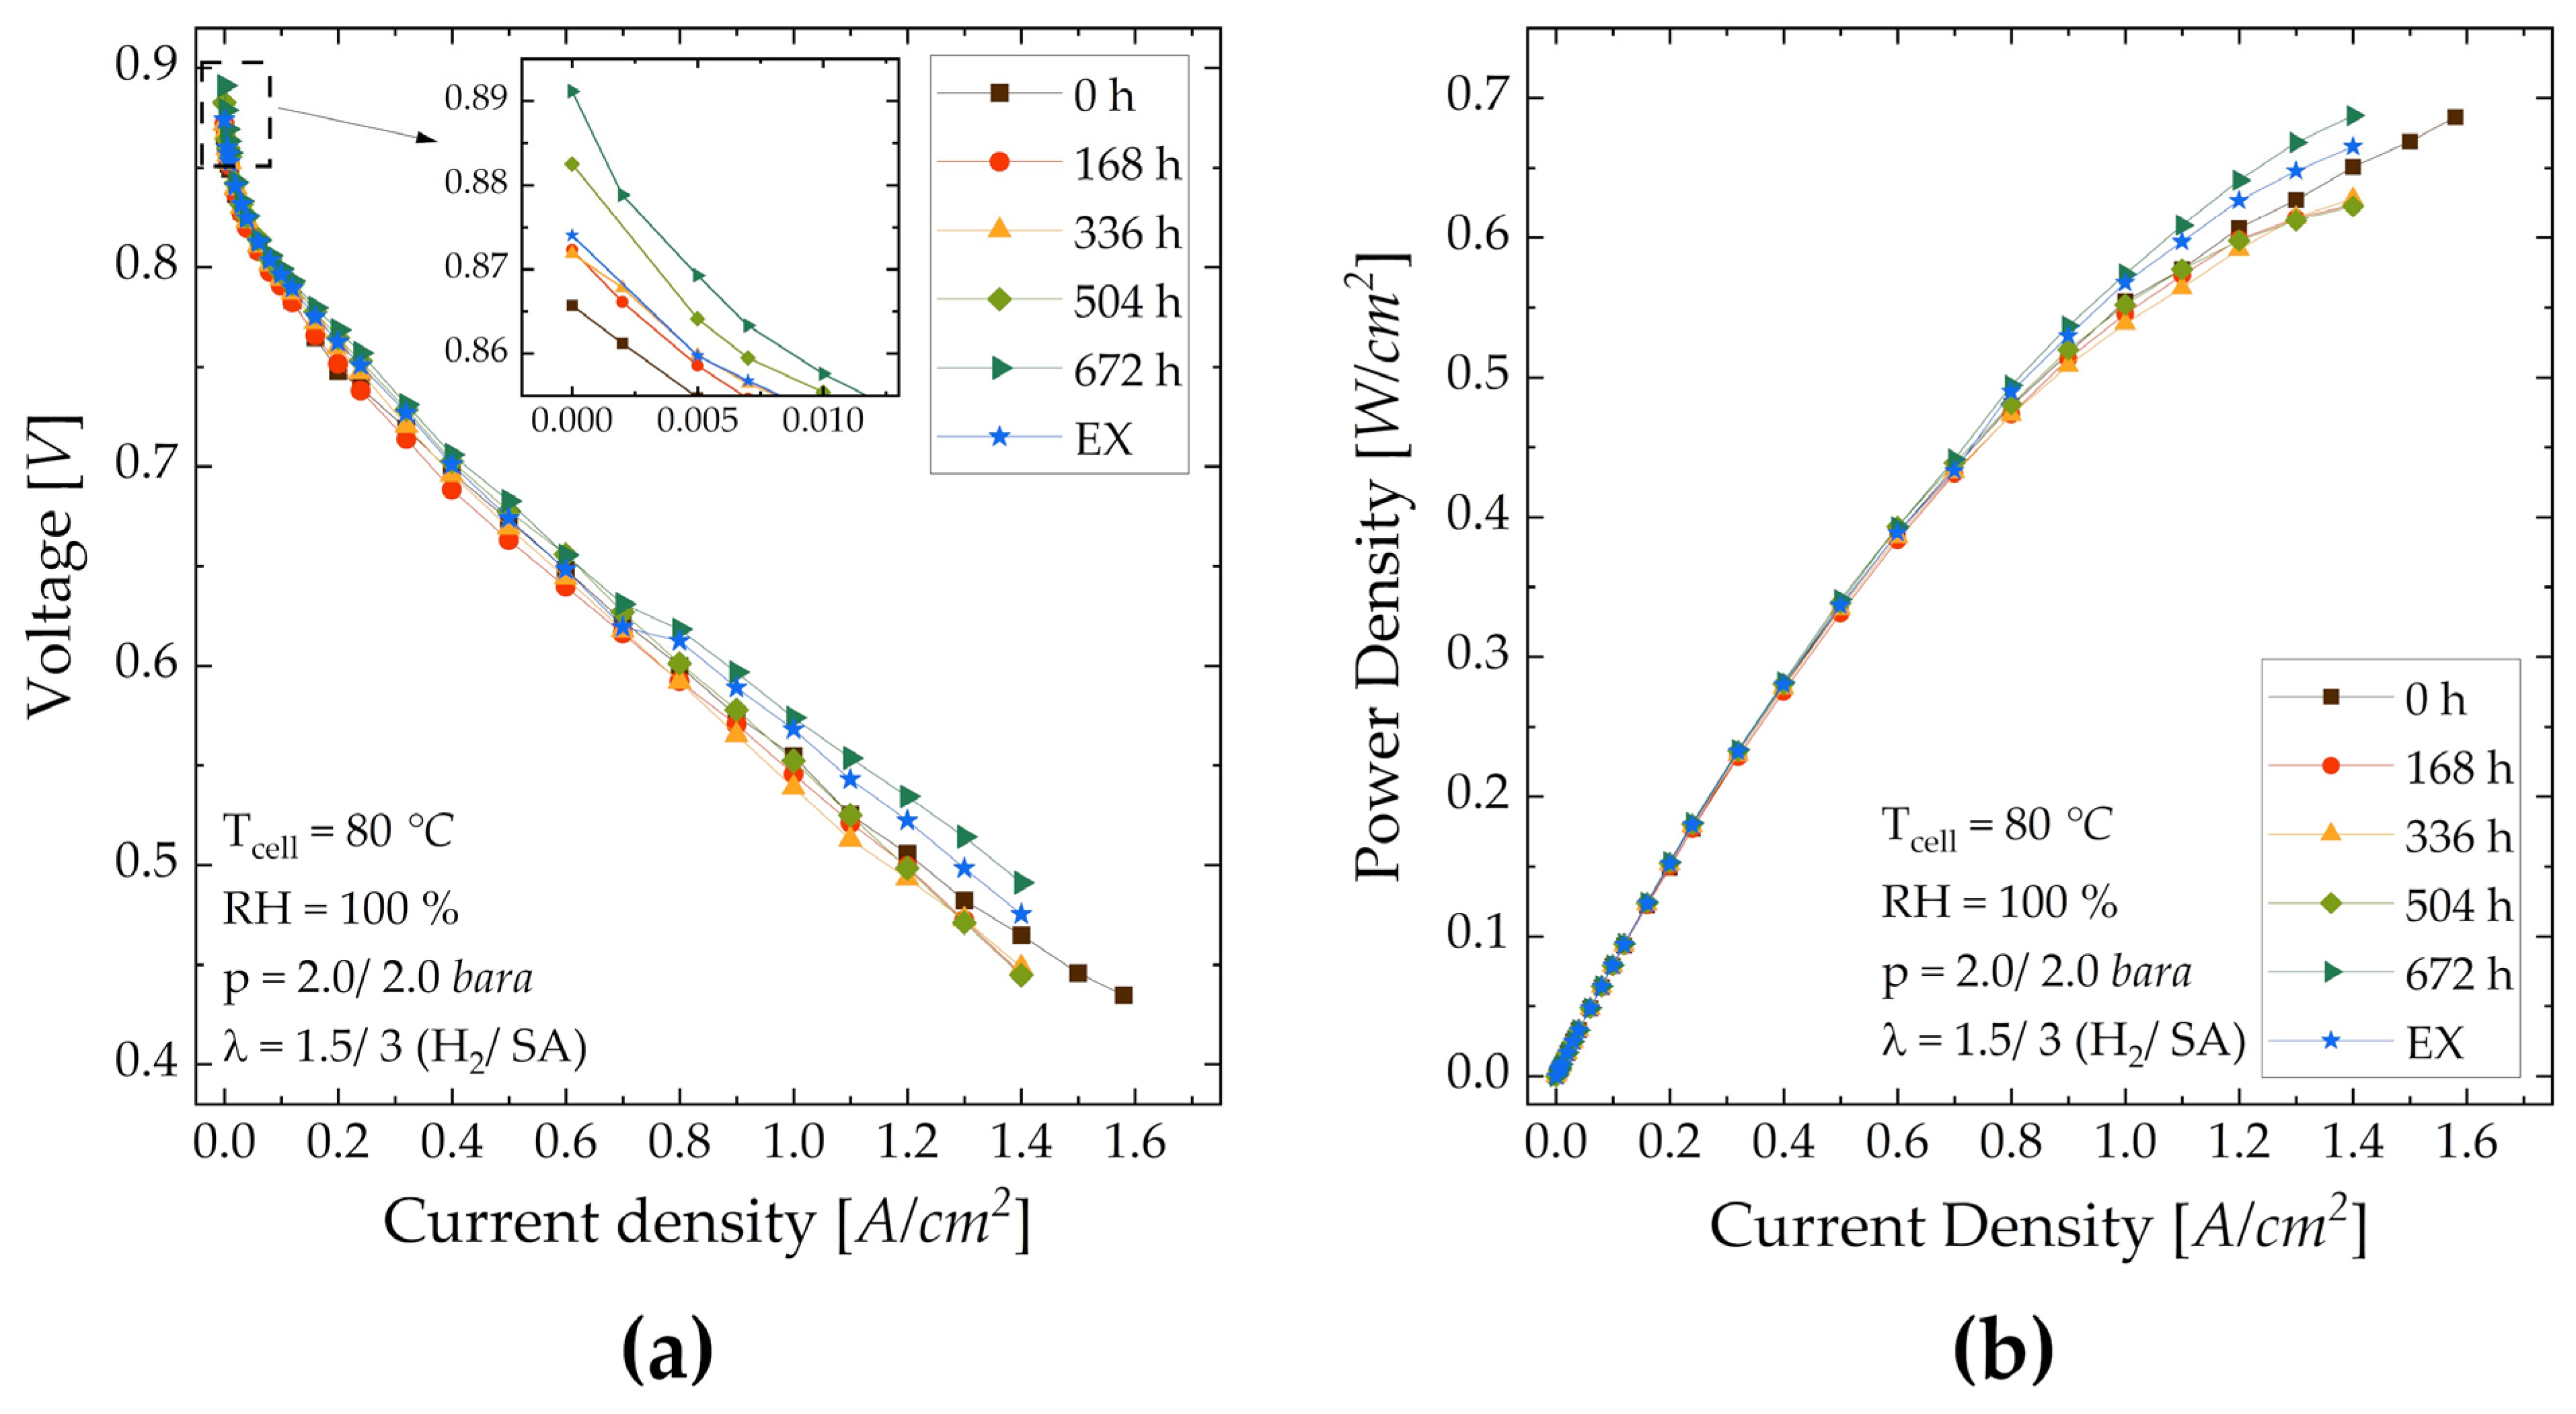
| Cell | OCV [V] | Current Density [mA/cm2] | Voltage [V] | ||
|---|---|---|---|---|---|
| at 0.8 V | at 0.7 V | at 0.6 V | at 1.4 A/cm2 | ||
| MEA-0 | 0.865 | 80.0 | 390 | 800 | 0.465 |
| MEA-168 | 0.873 | 75.2 | 363 | 768 | 0.446 |
| MEA-336 | 0.872 | 84.5 | 385 | 769 | 0.448 |
| MEA-504 | 0.882 | 92.5 | 410 | 805 | 0.445 |
| MEA-672 | 0.891 | 97.5 | 426 | 885 | 0.491 |
| MEA-EX | 0.874 | 79.5 | 404 | 853 | 0.475 |
Disclaimer/Publisher’s Note: The statements, opinions and data contained in all publications are solely those of the individual author(s) and contributor(s) and not of MDPI and/or the editor(s). MDPI and/or the editor(s) disclaim responsibility for any injury to people or property resulting from any ideas, methods, instructions or products referred to in the content. |
© 2023 by the authors. Licensee MDPI, Basel, Switzerland. This article is an open access article distributed under the terms and conditions of the Creative Commons Attribution (CC BY) license (https://creativecommons.org/licenses/by/4.0/).
Share and Cite
Kircher, M.; Roschger, M.; Koo, W.Y.; Blaschke, F.; Grandi, M.; Bodner, M.; Hacker, V. Effects of Catalyst Ink Storage on Polymer Electrolyte Fuel Cells. Energies 2023, 16, 7011. https://doi.org/10.3390/en16197011
Kircher M, Roschger M, Koo WY, Blaschke F, Grandi M, Bodner M, Hacker V. Effects of Catalyst Ink Storage on Polymer Electrolyte Fuel Cells. Energies. 2023; 16(19):7011. https://doi.org/10.3390/en16197011
Chicago/Turabian StyleKircher, Mario, Michaela Roschger, Wai Yee Koo, Fabio Blaschke, Maximilian Grandi, Merit Bodner, and Viktor Hacker. 2023. "Effects of Catalyst Ink Storage on Polymer Electrolyte Fuel Cells" Energies 16, no. 19: 7011. https://doi.org/10.3390/en16197011