
Analysis of the Output Characteristics of a Vertical Photovoltaic System Based on Operational Data: A Case Study in Republic of Korea
Abstract
:1. Introduction
2. Methods
2.1. Purpose of Research
2.2. Status of Solar PV Integration in Republic of Korea
2.3. Characteristics of Vertical Solar Photovoltaic Systems
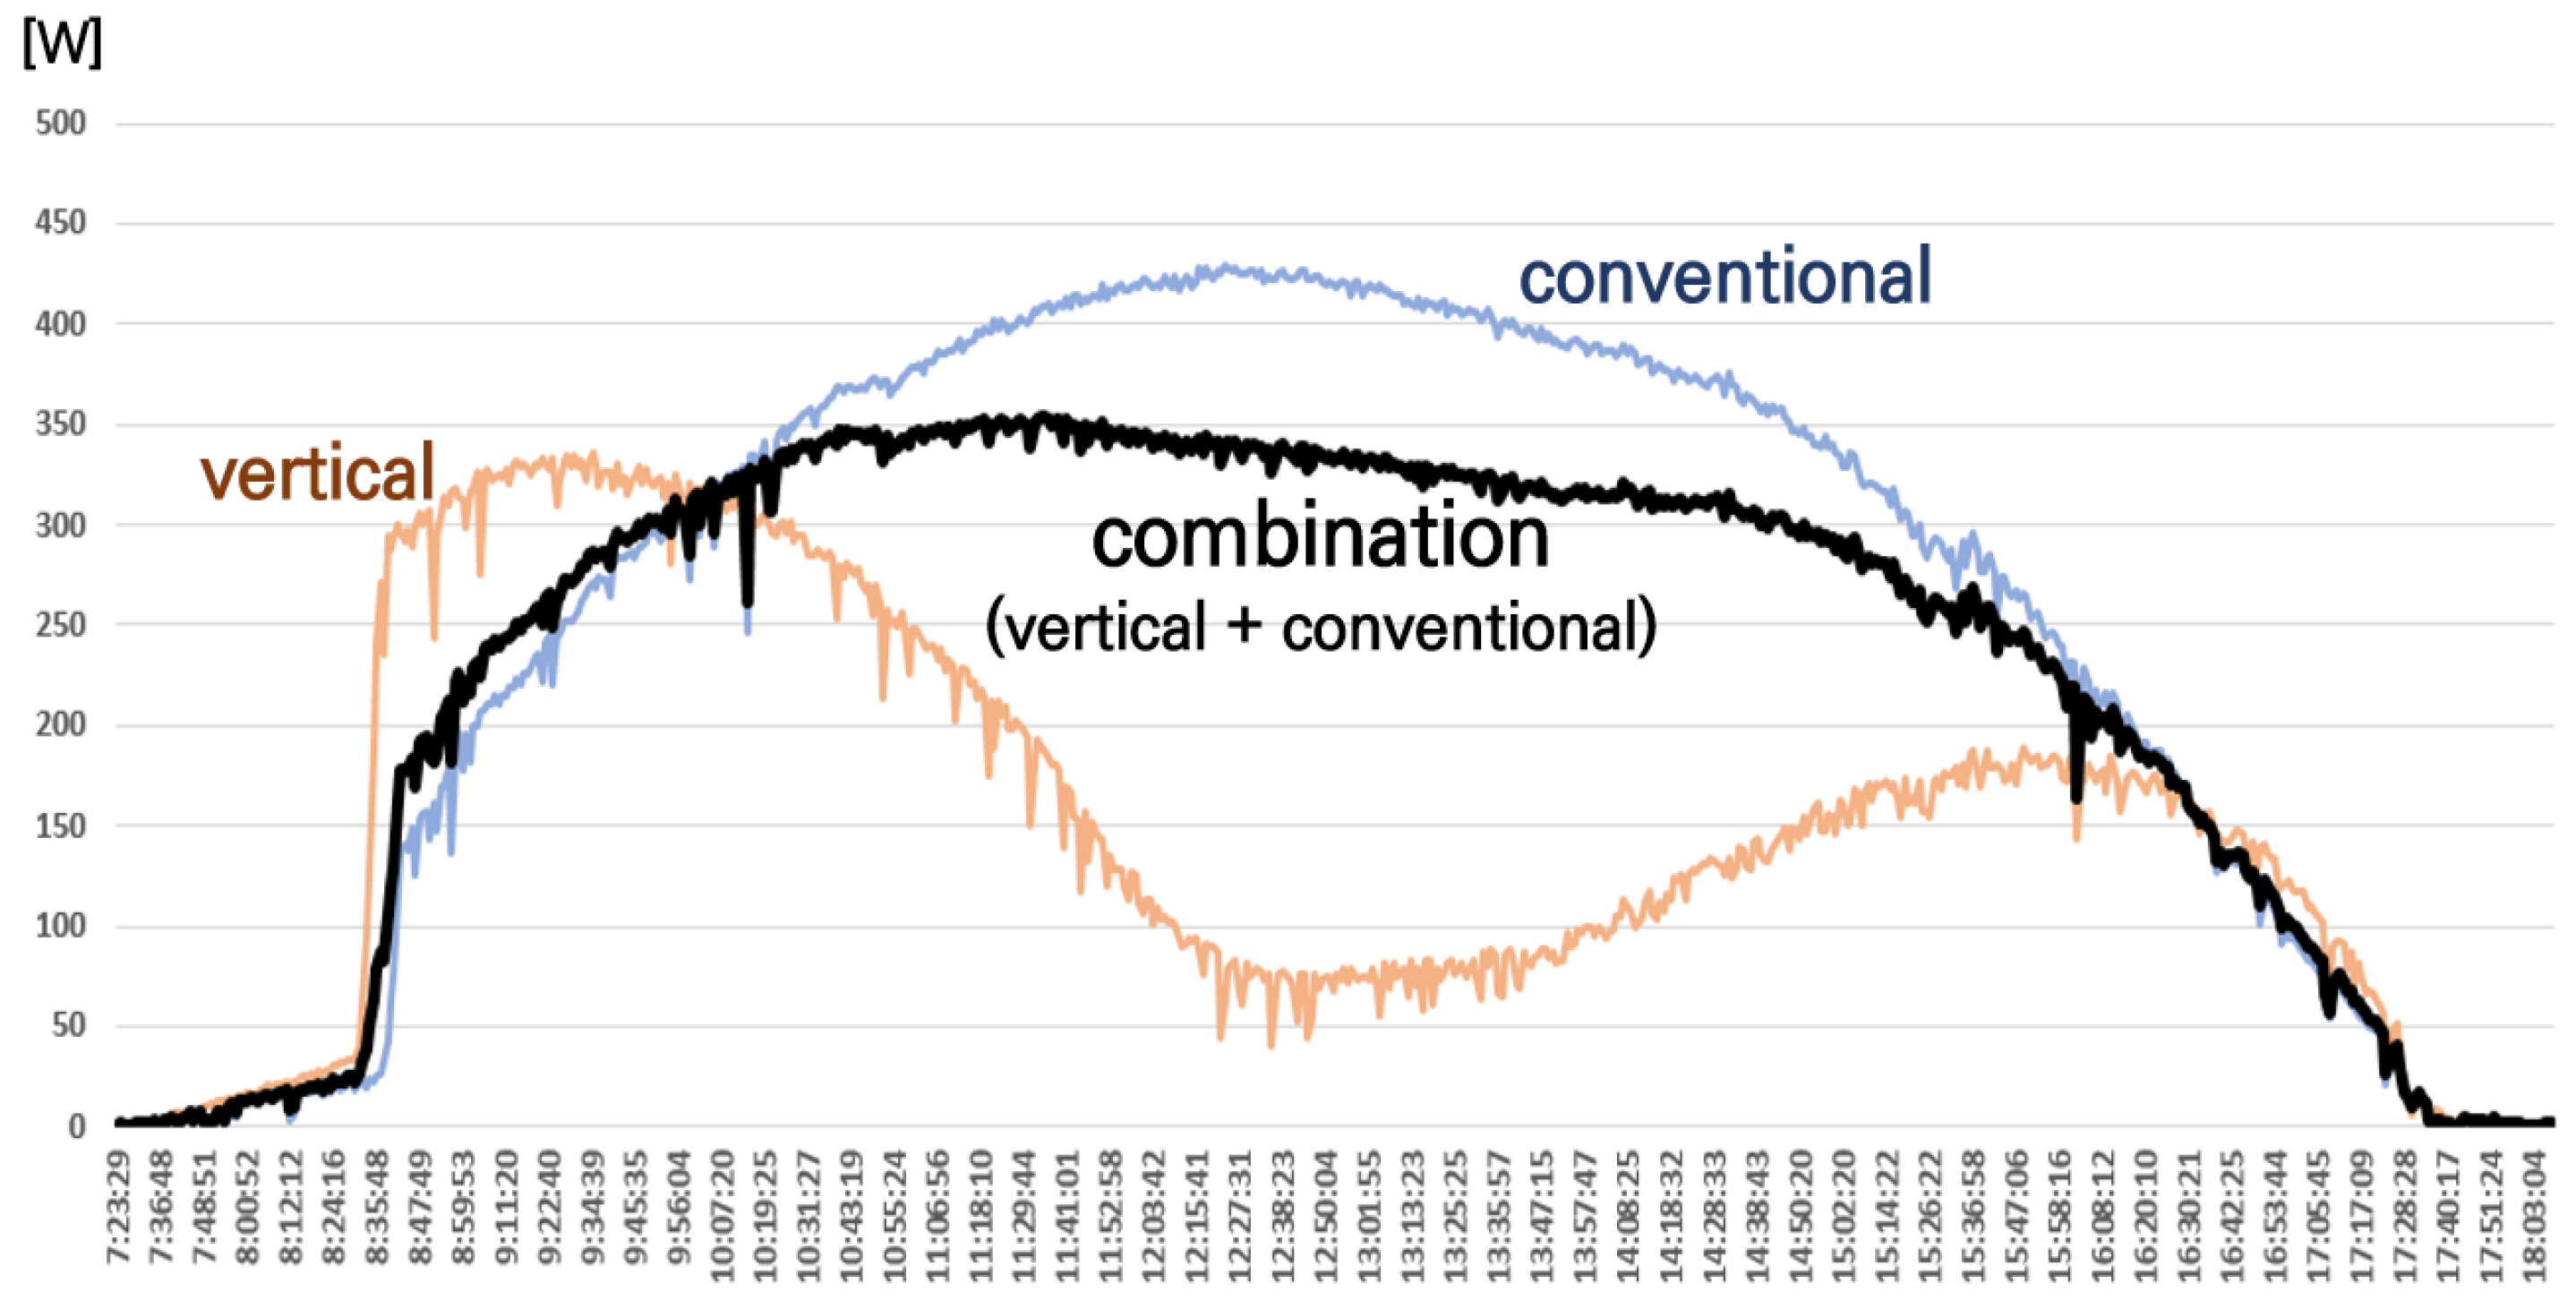
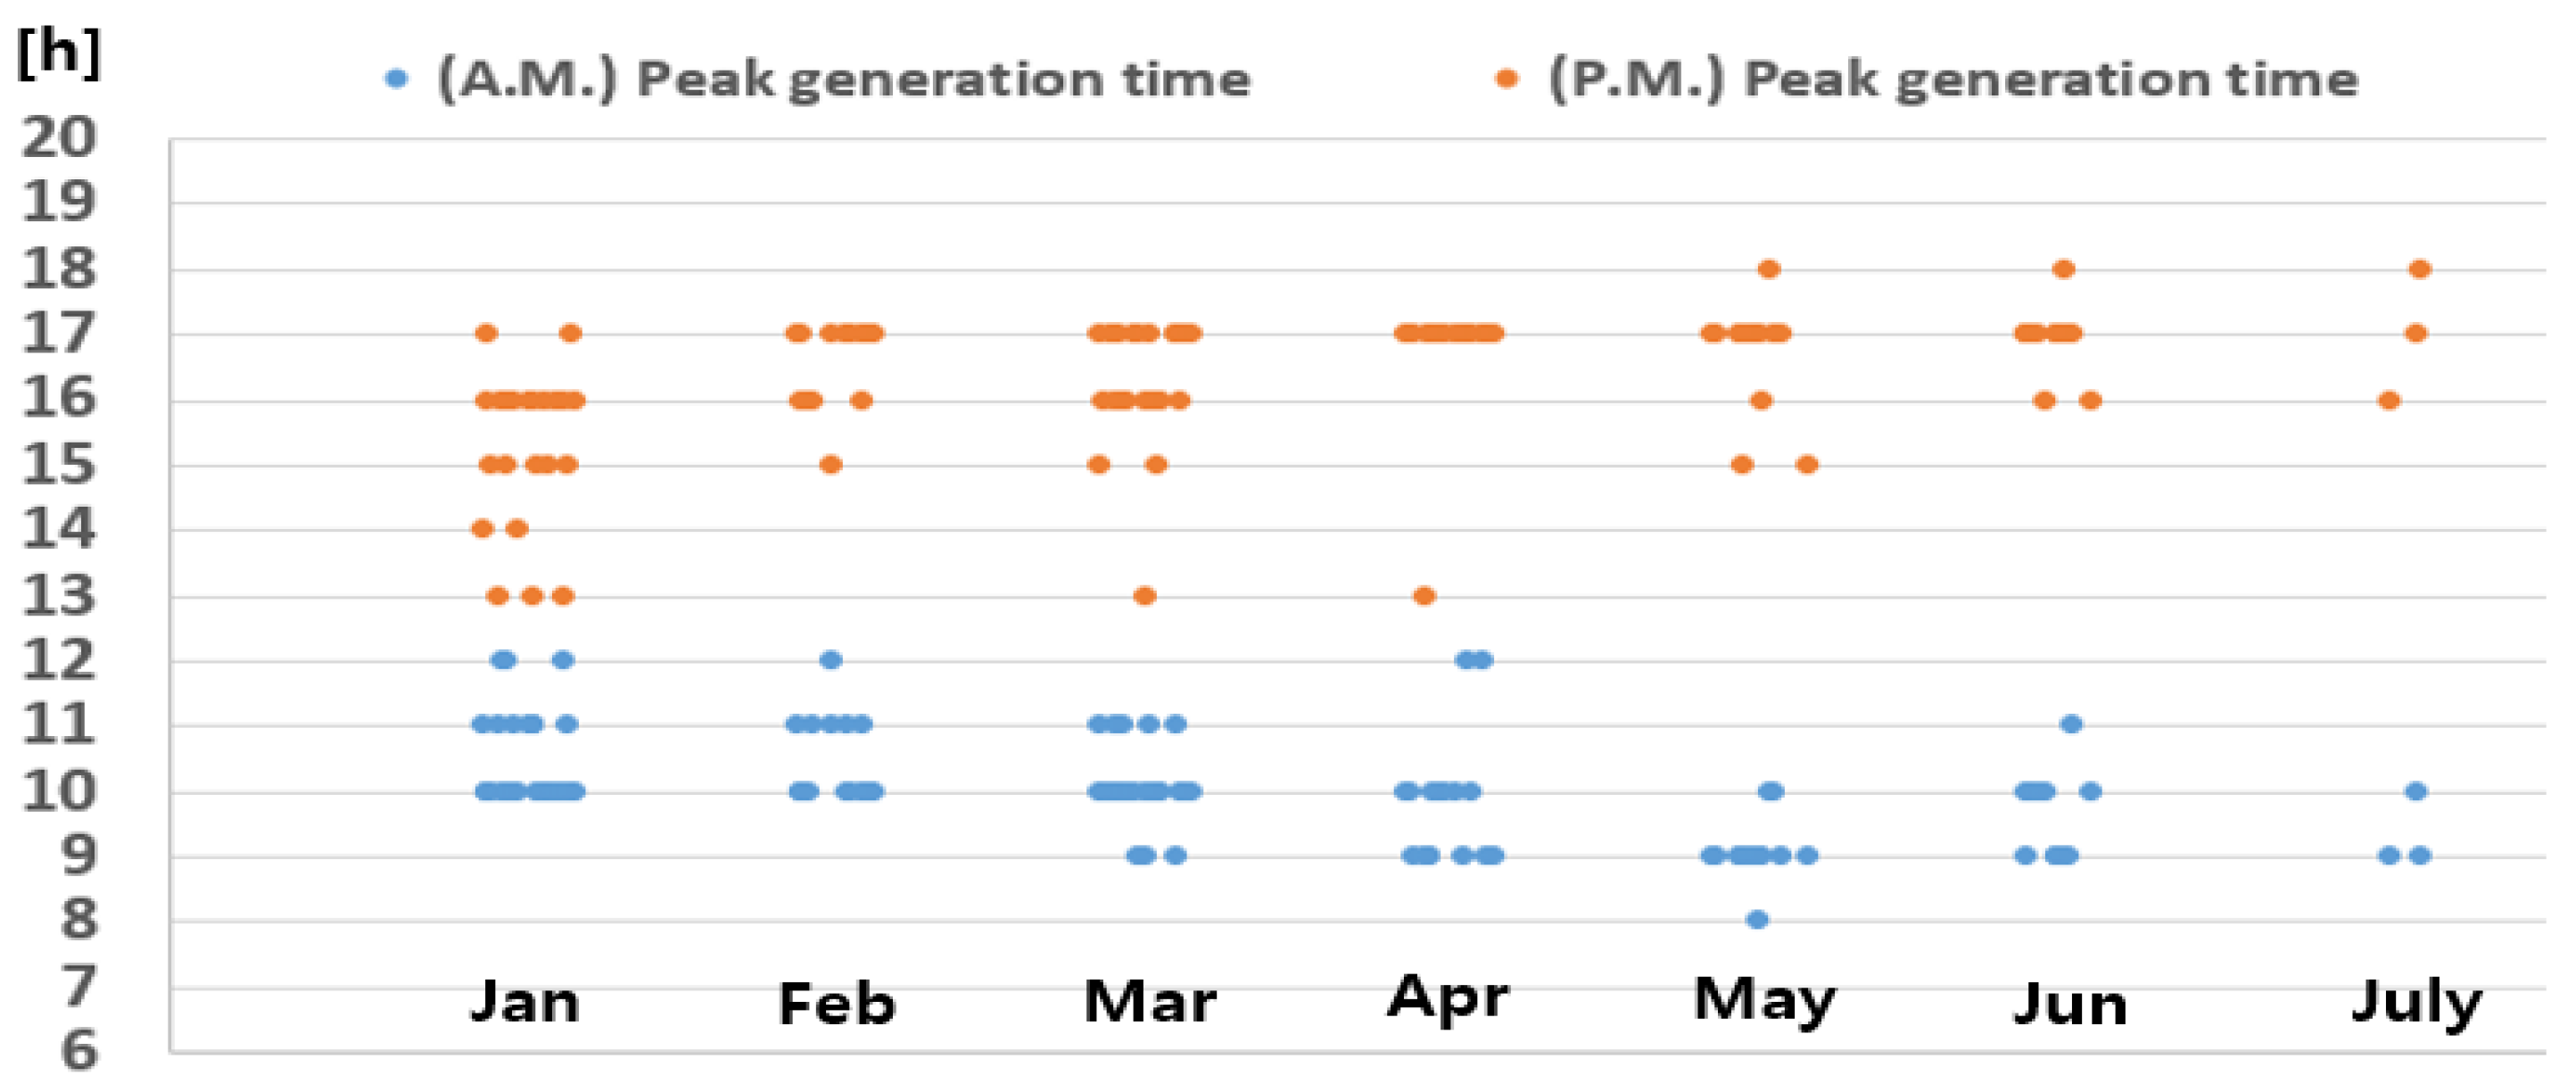
2.4. Trends in Vertical Solar Photovoltaic Generation
2.5. Design of Vertical Solar Photovoltaic Systems
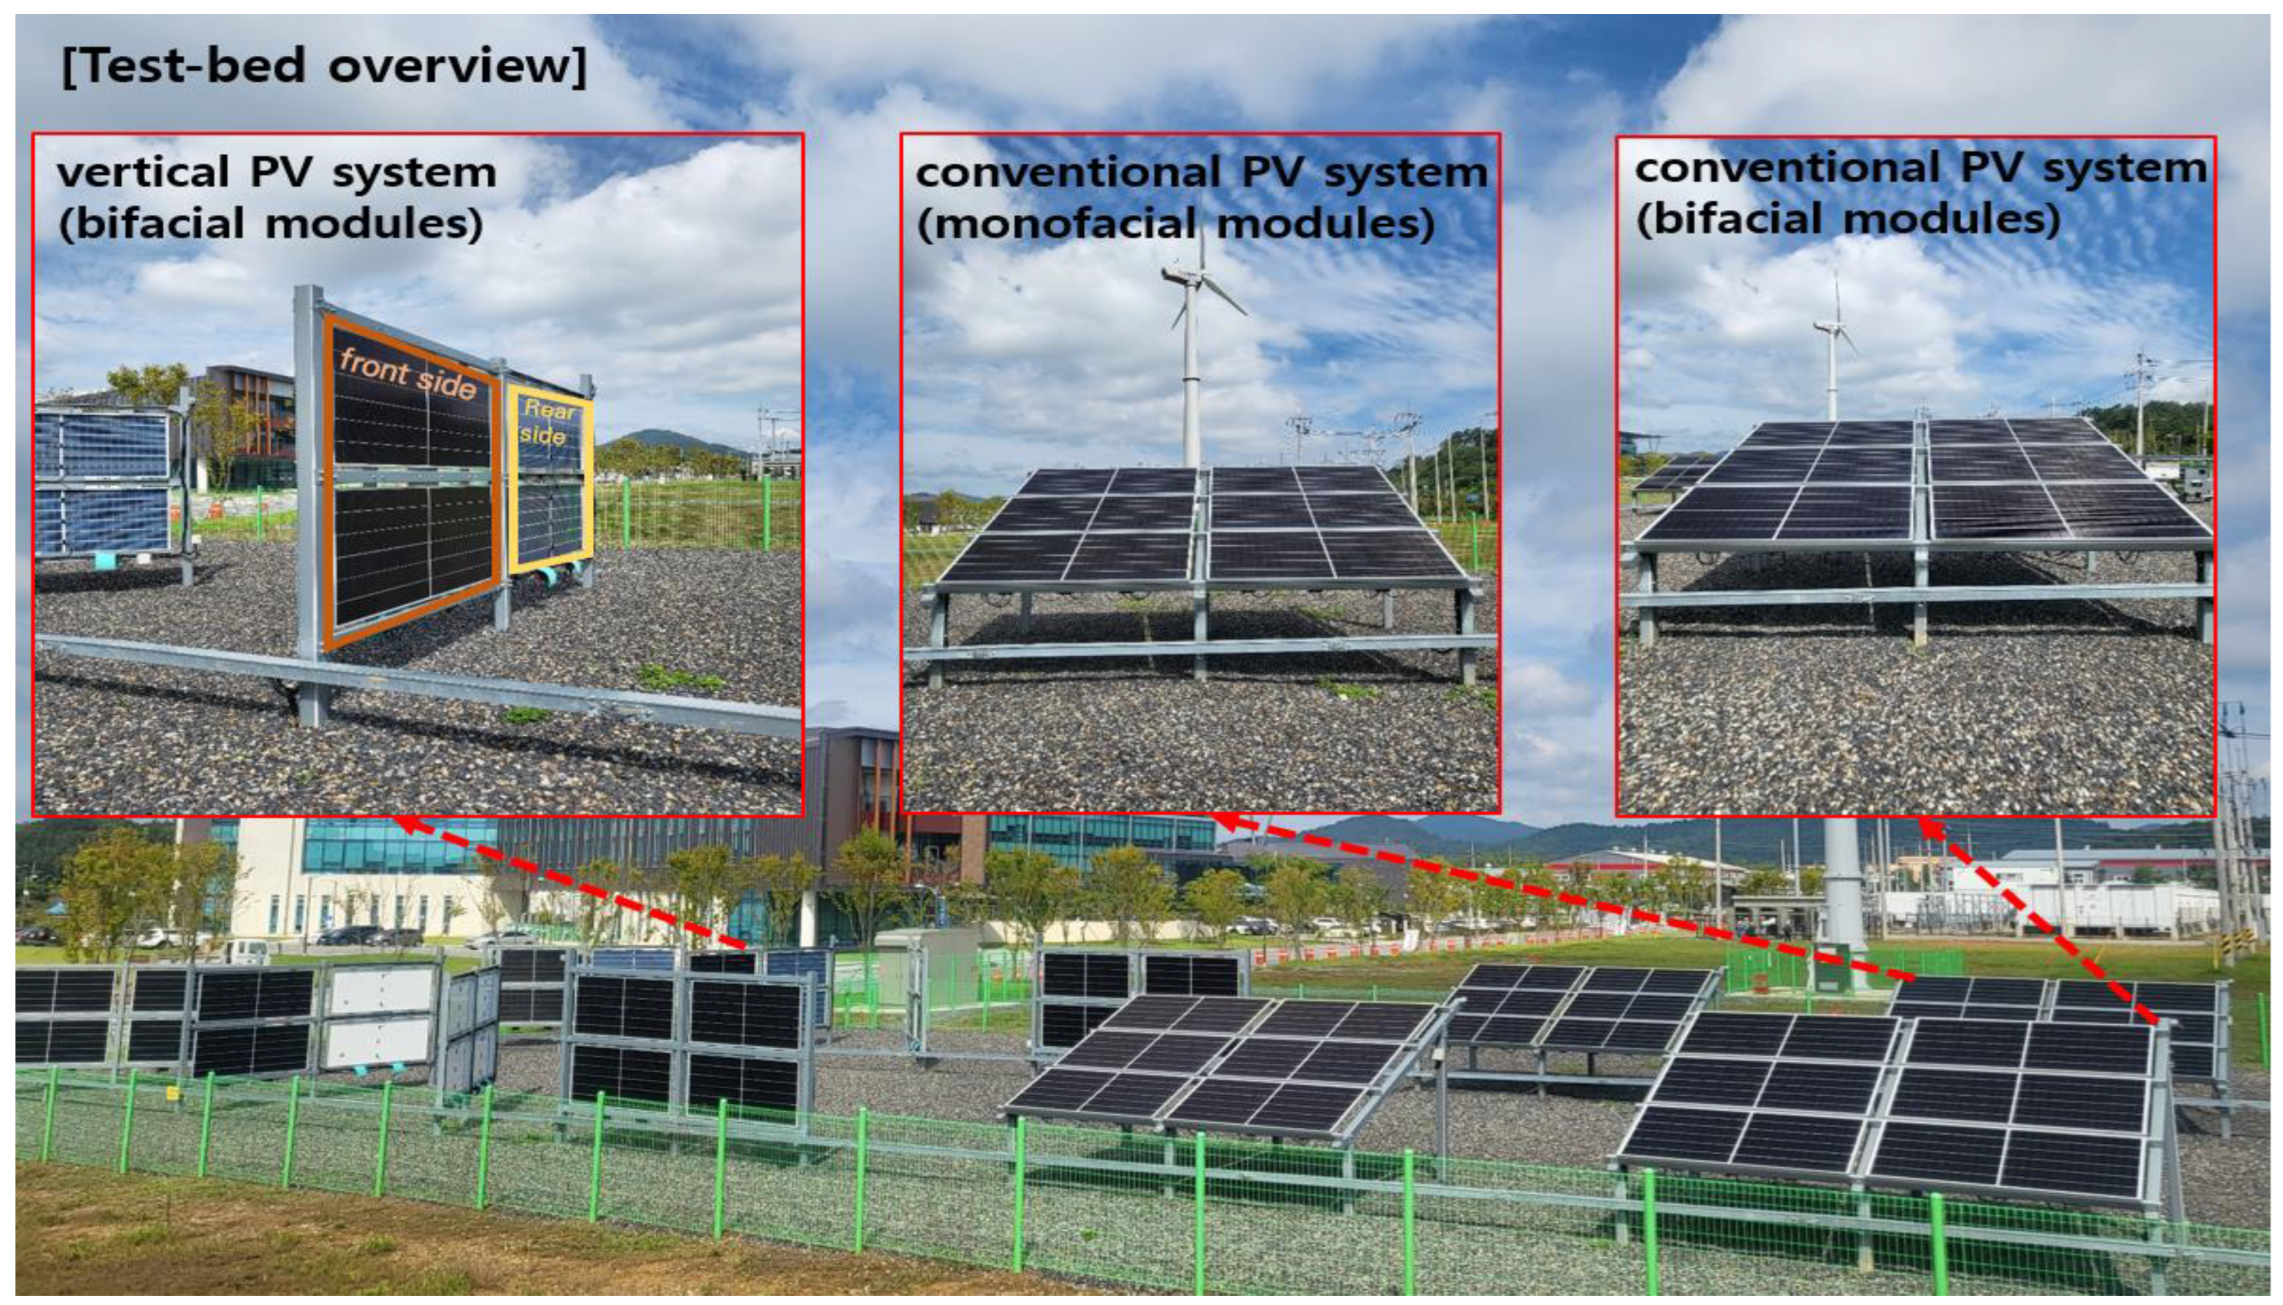
2.6. Construction of a Photovoltaic Generation System Test Bed
3. Results and Discussion
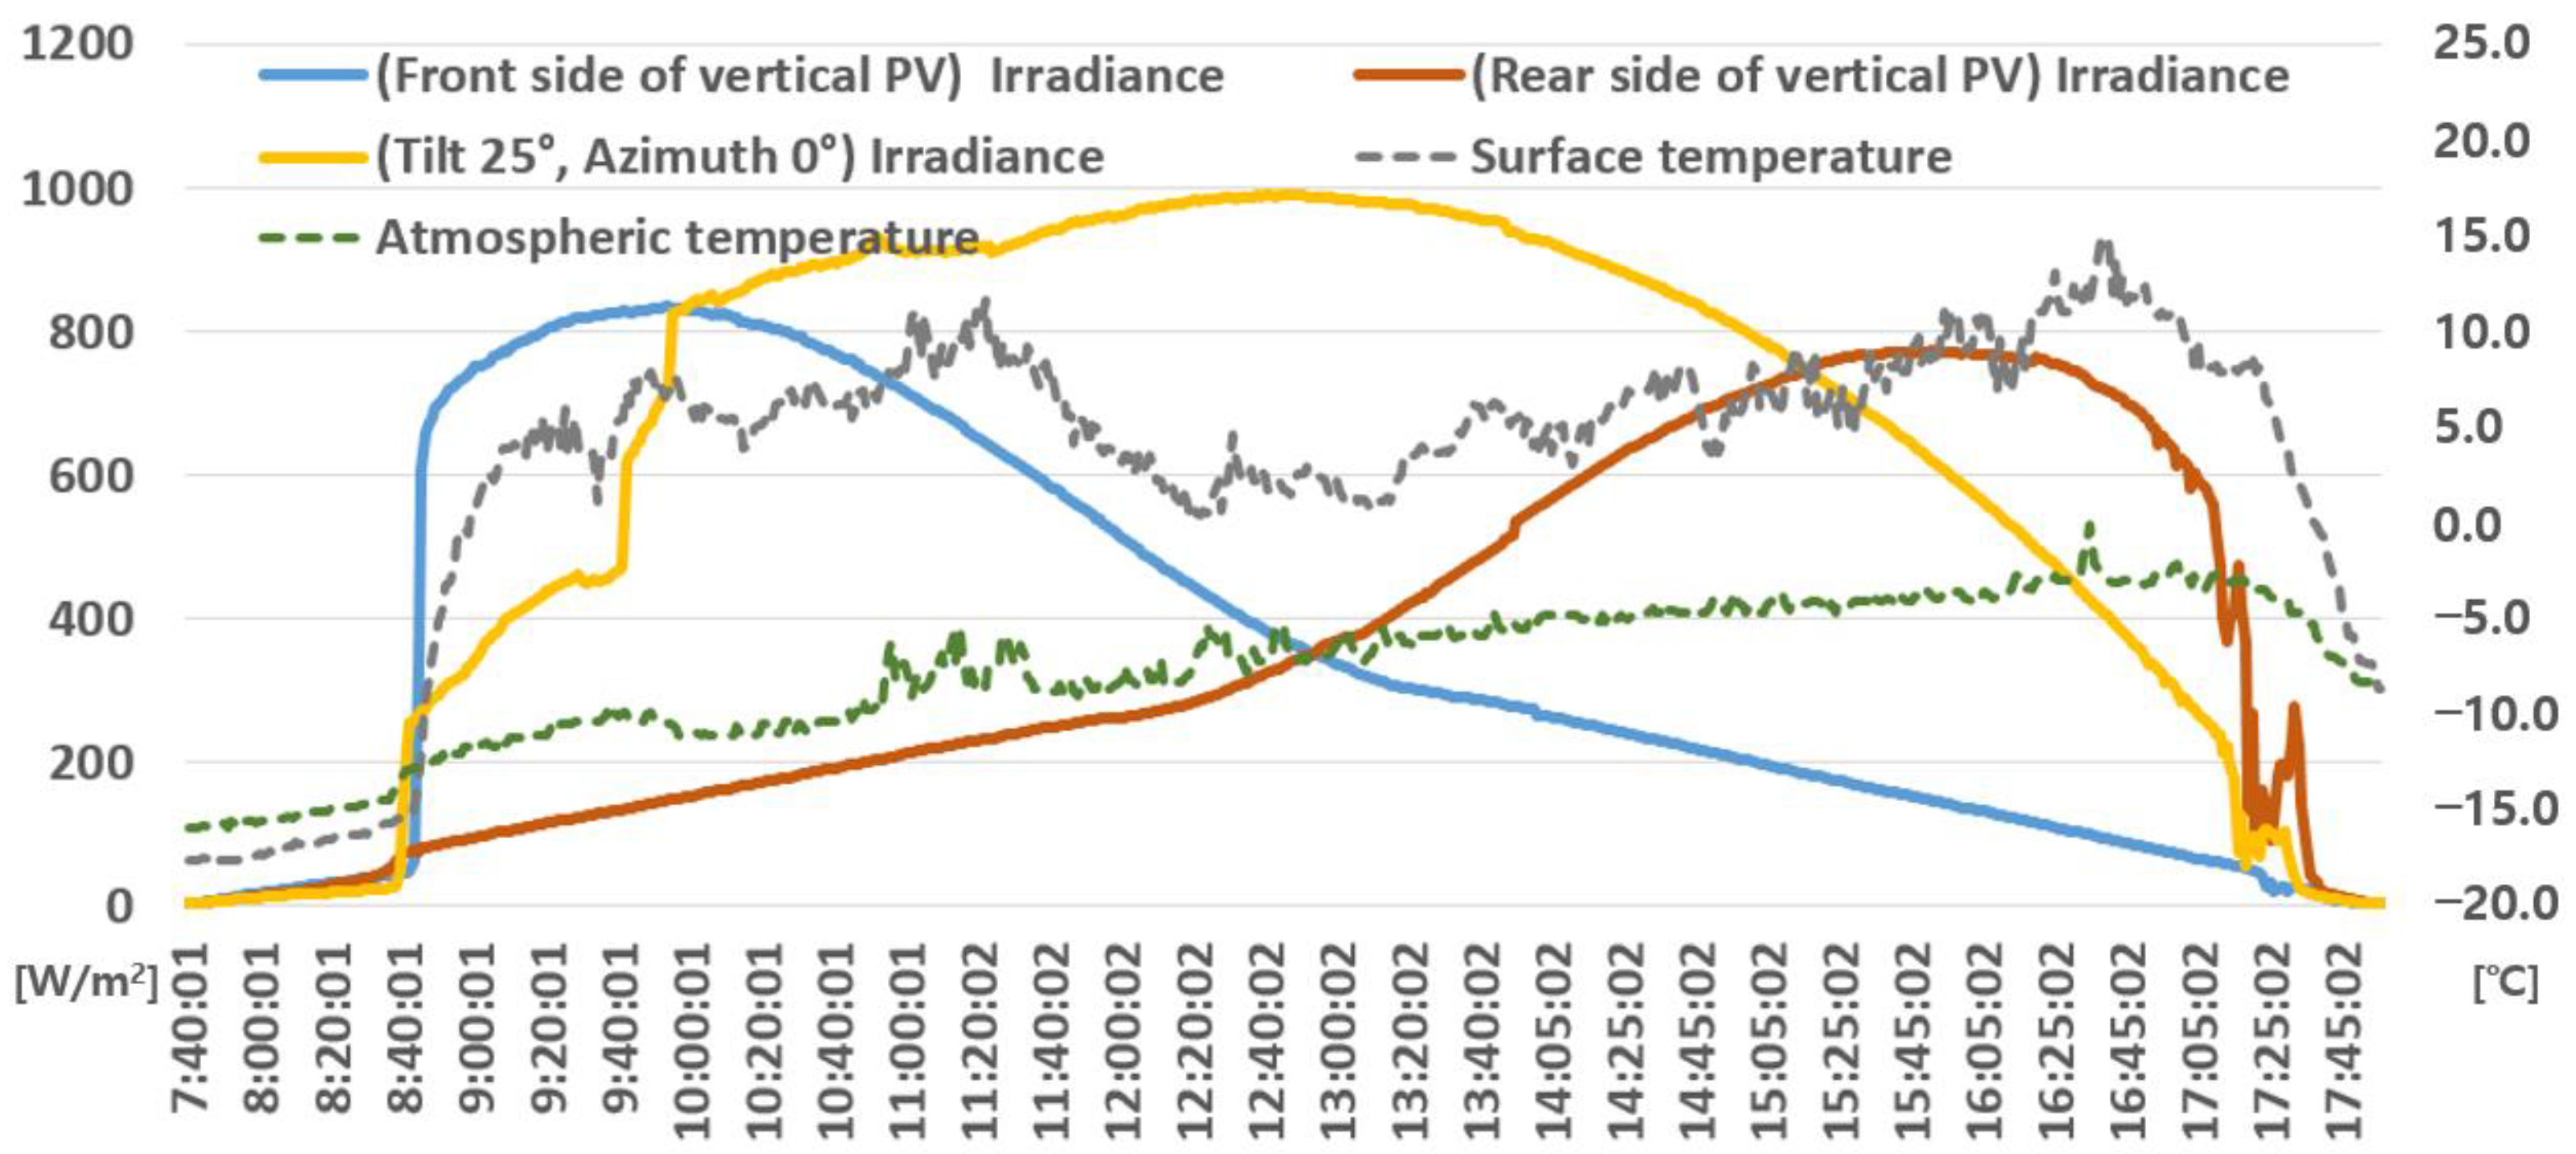
3.1. Data Analysis of East–West-Facing Vertical Solar Photovoltaic System
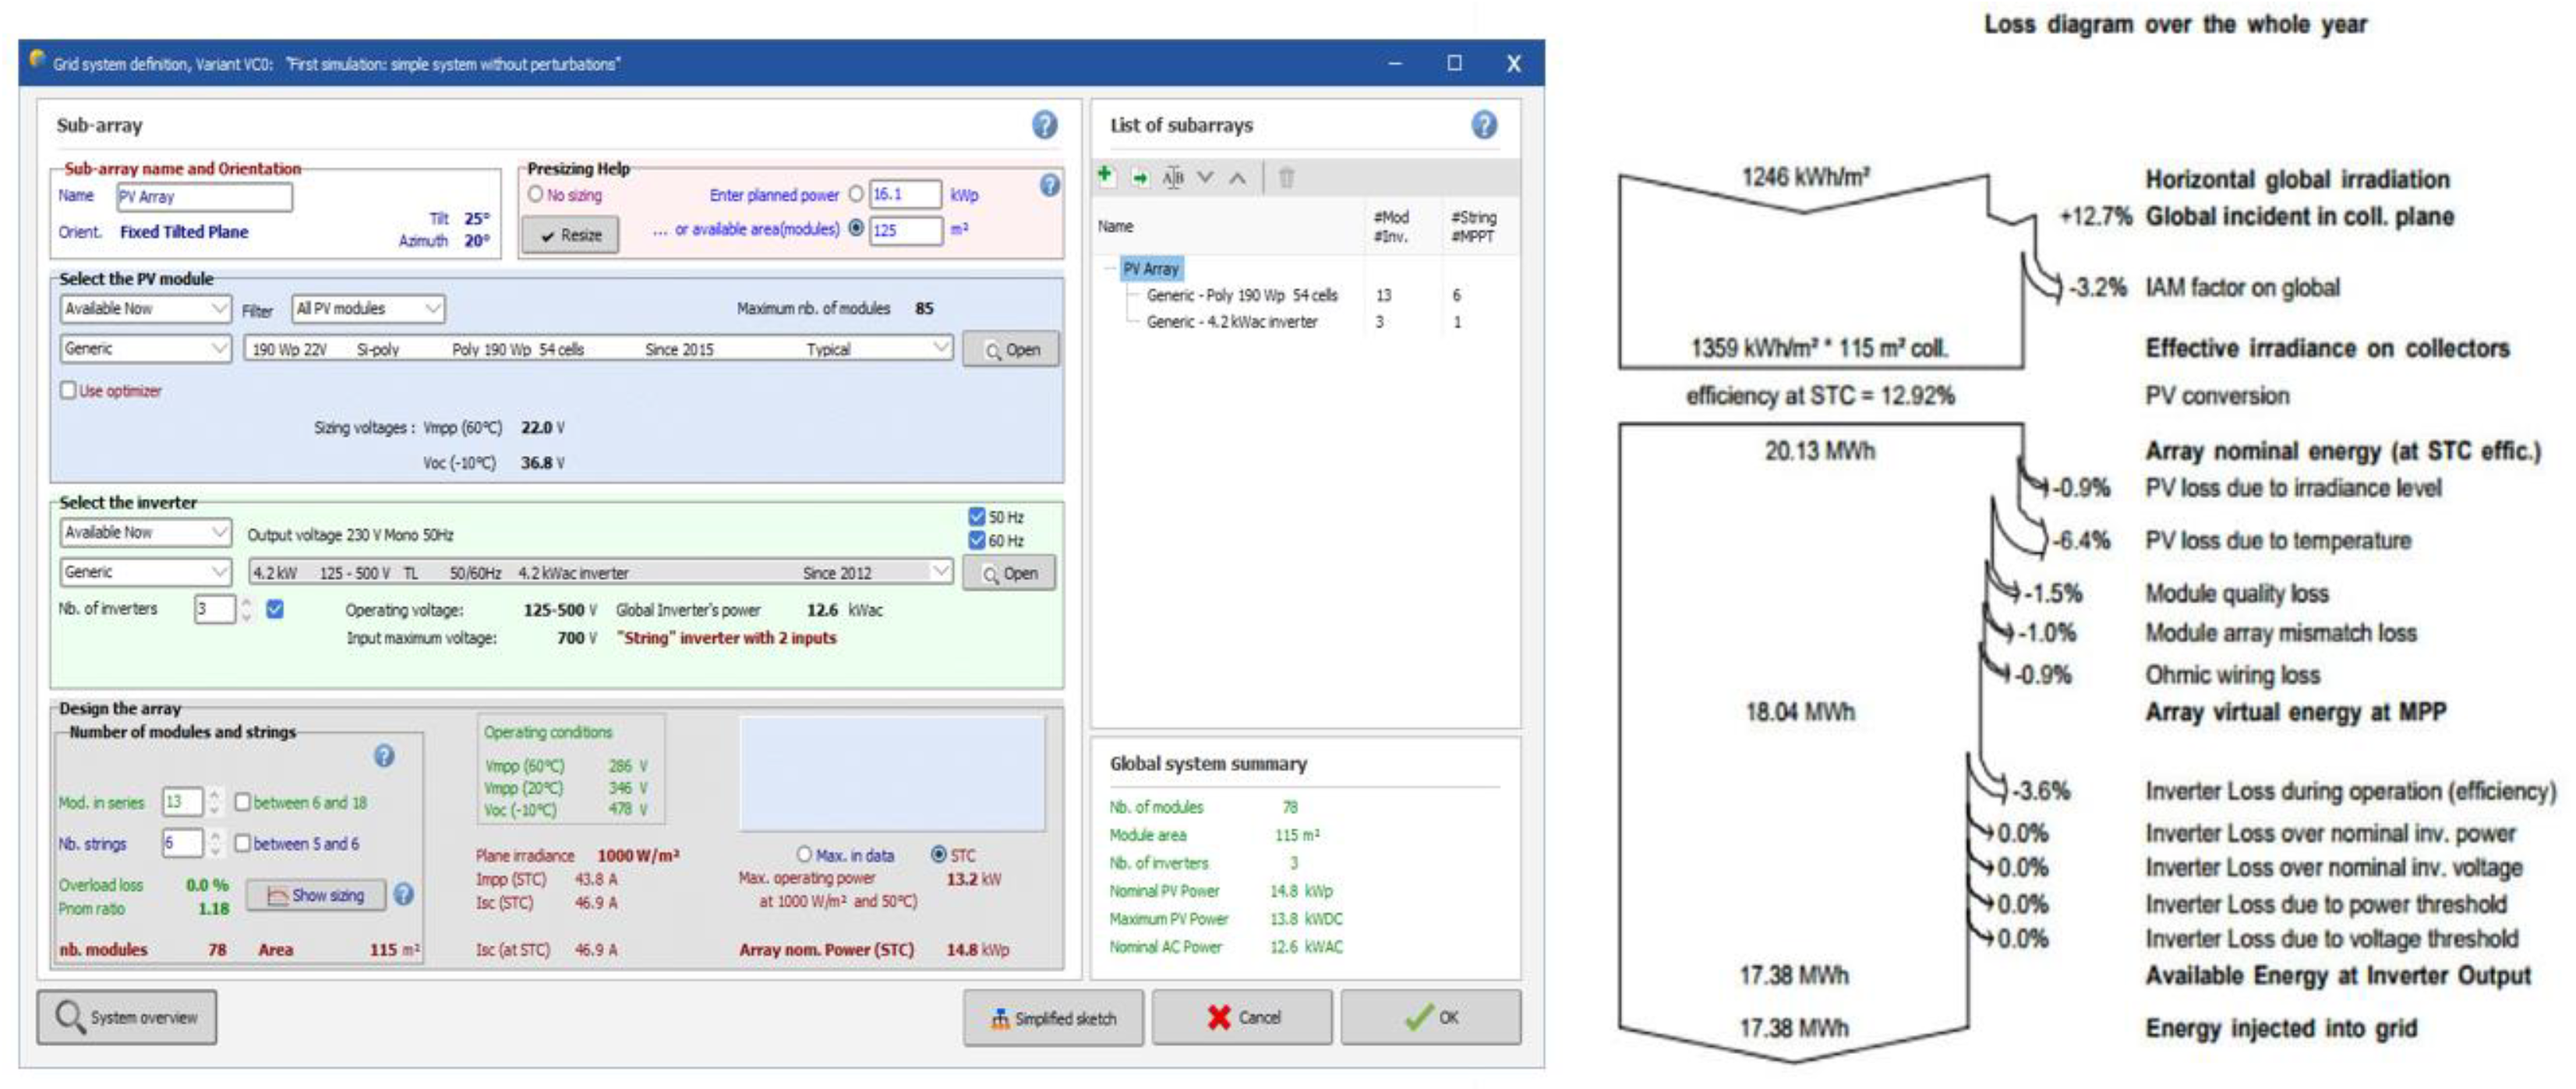
3.2. PVsyst Simulation Modeling
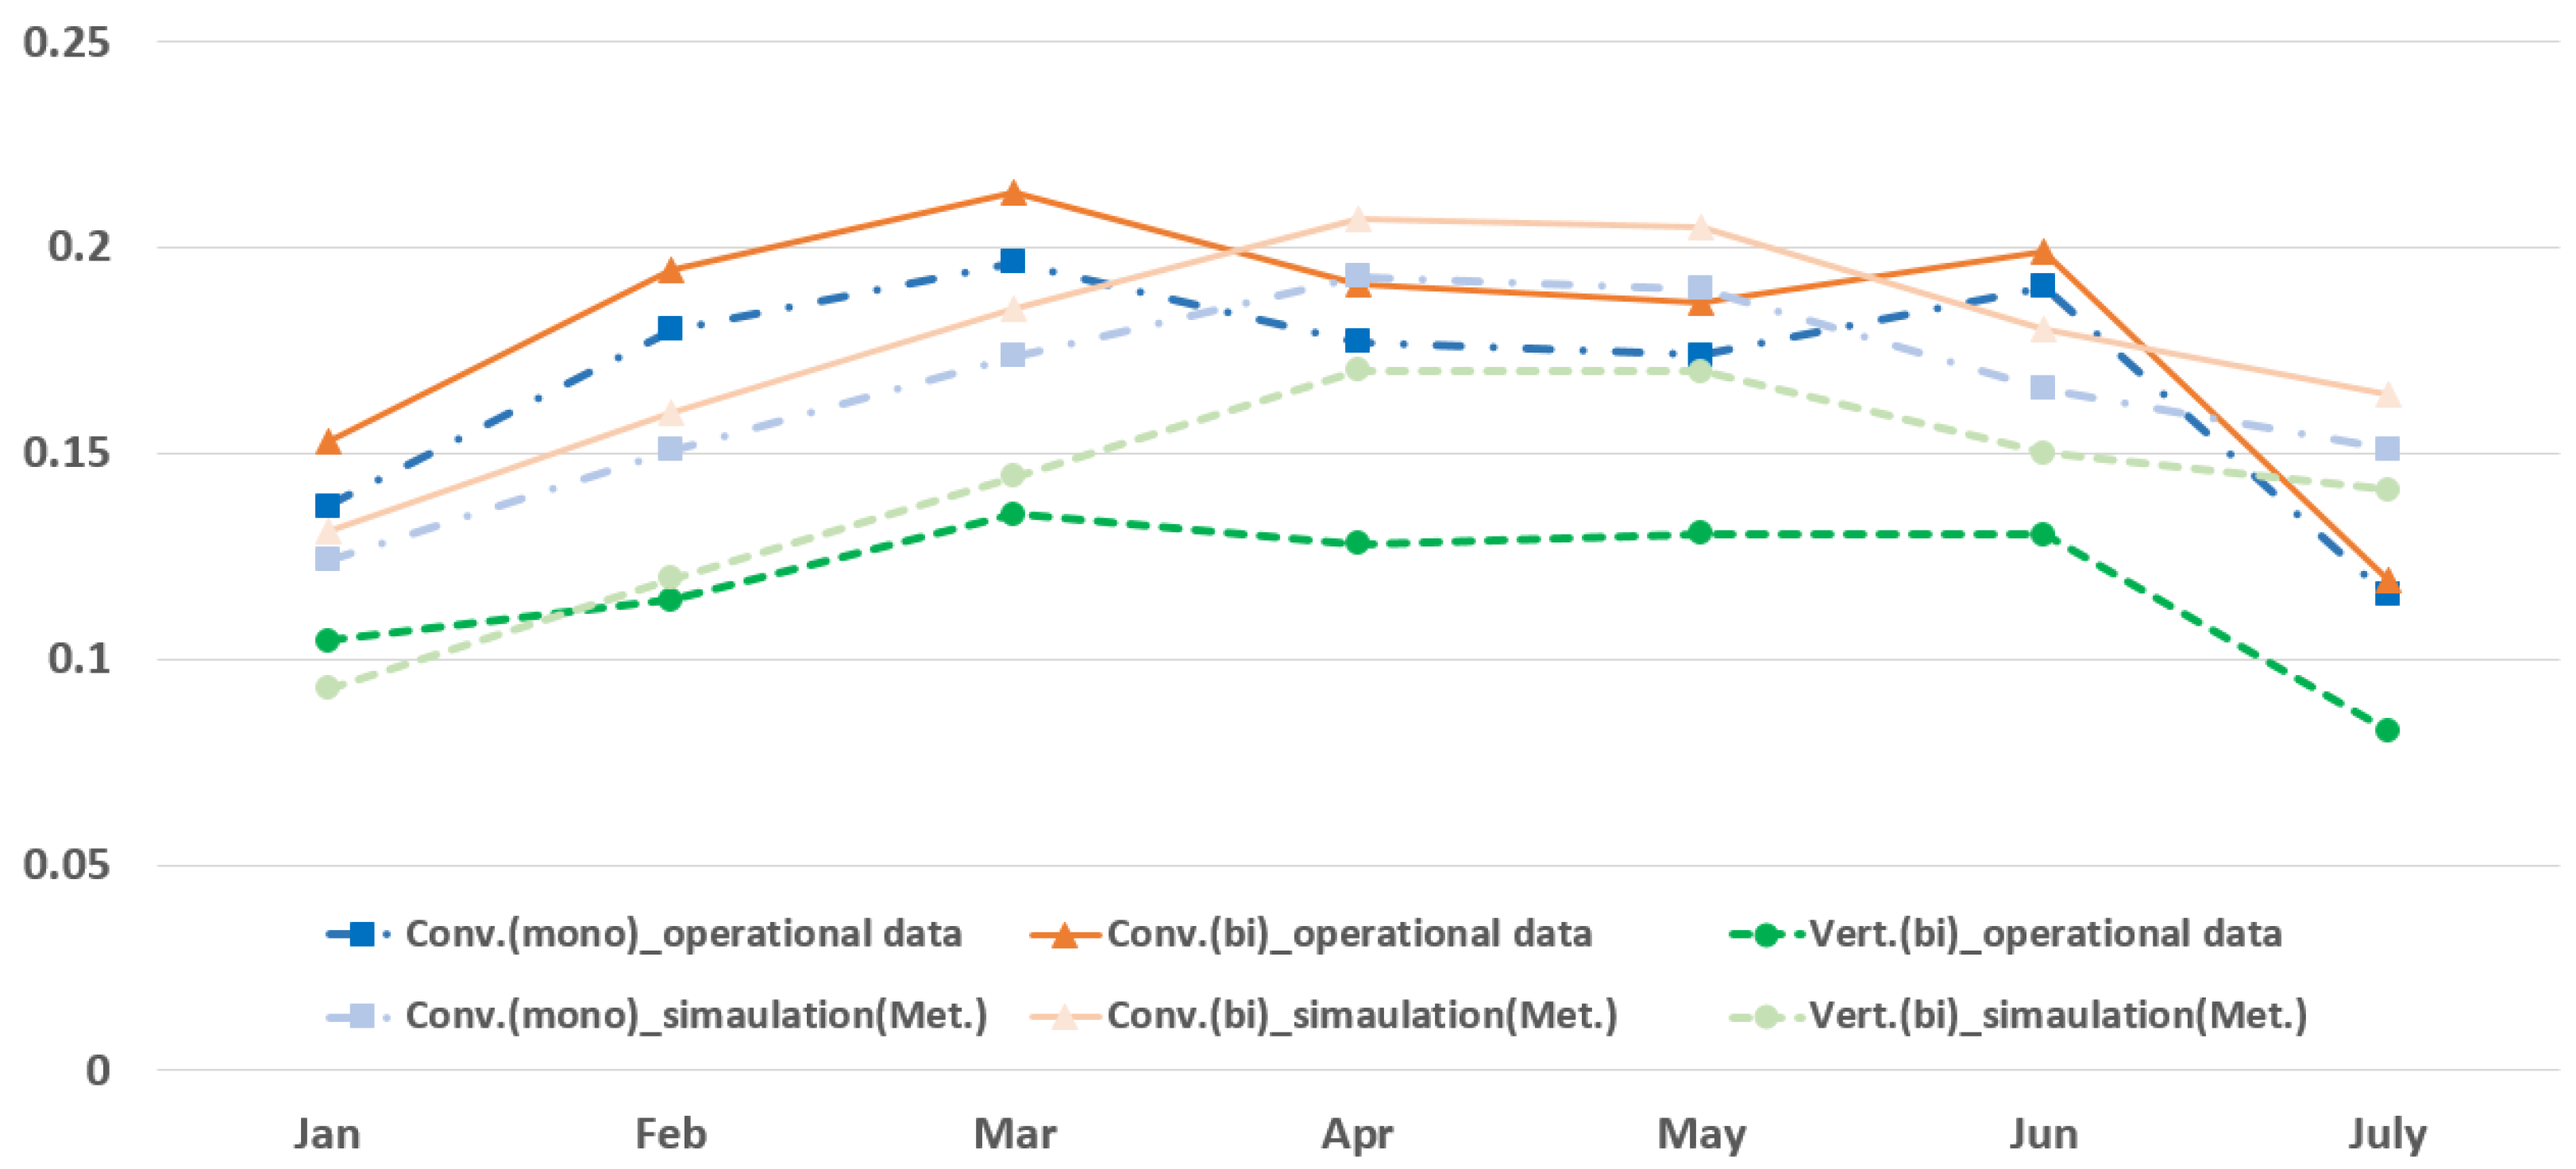
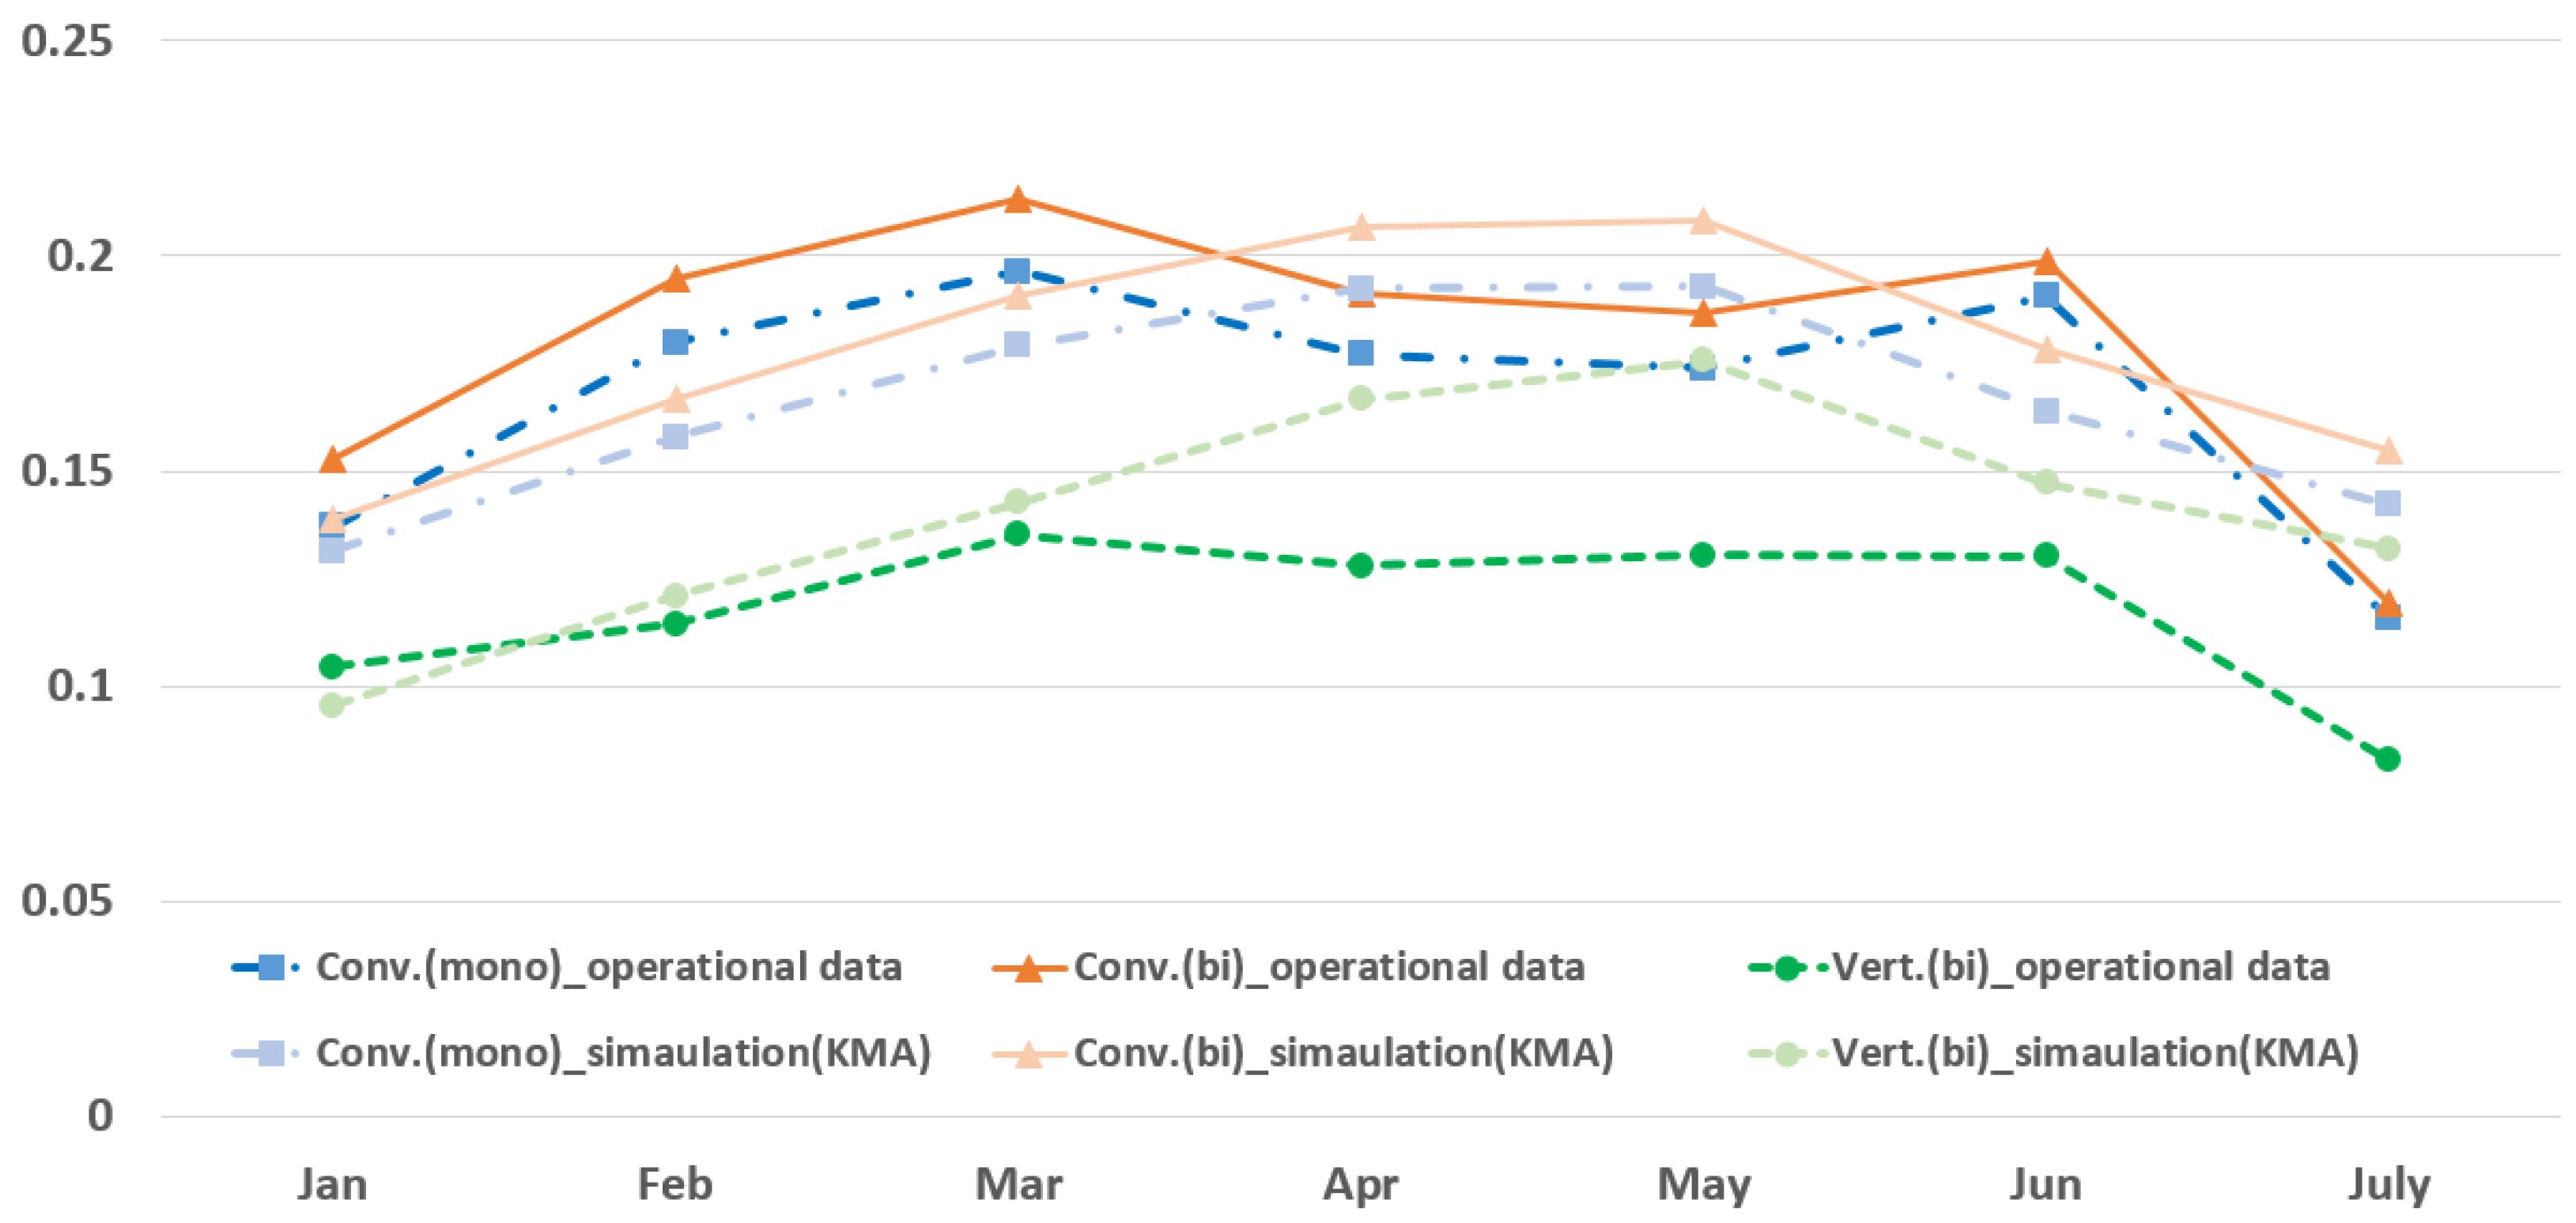
3.3. Comparison of PVsyst Simulation Results with Operational Data
4. Conclusions
Supplementary Materials
Author Contributions
Funding
Data Availability Statement
Conflicts of Interest
References
- Fregosi, D. Bifacial PV Perfomance Modeling. EPRI, U.S. In Proceedings of the IEEE 48th Photovoltaic Specialists Conference (PVSC), Fort Lauderdale, FL, USA, 20–25 June 2021. [Google Scholar]
- Jouttijärvi, S.; Lobaccaro, G.; Kamppinen, A.; Miettunen, K. Benefits of bifacial solar cells combined with low voltage power grids at high latitudes. Renew. Sustain. Energy Rev. 2022, 161, 112354. [Google Scholar] [CrossRef]
- Singh, J.O.; Aberle, A.G.; Walsh, T.M. Electrical characterization method for bifacial photovoltaic modules. Sol. Energy Mater. Sol. Cells 2014, 127, 136–142. [Google Scholar] [CrossRef]
- García, M.A.; Quispe, G.R.; Zamudio, M.A.; Conde, L.A.; Angulo, J.E.; Berastain, A.E.; Töfflinger, J.A. Outdoor I-V characterization of tilted and vertical bifacial PV modules. J. Phys. Conf. Ser. 2023, 2538, 012002. [Google Scholar] [CrossRef]
- Baumann, T.; Carigiet, F.; Knecht, R.; Klenk, M.; Dreisiebner, A.; Nussbaumer, H.; Baumgartner, F. Performance analysis of vertically mounted bifacial pv modules on green roof system. In Proceedings of the 35th European Photovoltaic Solar Energy Conference and Exhibition (EU PVSEC 2018), Brussels, Belgium, 24–28 September 2018. [Google Scholar]
- Reker, S.; Schneider, J.; Gerhards, C. Integration of vertical solar power plants into a future German energy system. Smart Energy 2022, 7, 100083. [Google Scholar] [CrossRef]
- Sun, X.; Khan, M.R.; Deline, C.; Alam, M.A. Optimization and Performance of Bifacial Solar Modules: A Global Perspective. Appl. Energy 2018, 212, 1601–1610. [Google Scholar] [CrossRef]
- Chudinzow, D.; Nagel, S.; Gusewell, J.; Eltrop, L. Vertical bifacial photovoltaics—A complementary technology for the European electricity supply? Appl. Energy 2020, 264, 114782. [Google Scholar] [CrossRef]
- Jouttij, S.A.; Thorning, J.; Manni, M.; Huerta, H.; Ranta, S.; Di Sabatino, M.; Lobaccaro, G.; Miettunen, K. A comprehensive methodological workflow to maximize solar energy in low-voltage grids: A case study of vertical bifacial panels in Nordic conditions. Sol. Energy 2023, 262, 111819. [Google Scholar] [CrossRef]
- Honsberg, C.; Bowden, S. PV CDROM; Photovoltaic Education Network: Solar Power Labs, Arizona State University: Tempe, AZ, USA, 2016; pp. 71–155. [Google Scholar]
- KNREC. Available online: https://www.knrec.or.kr/biz/statistics/supply/supply03_01_list.do (accessed on 12 September 2023).
- KEPCO. Available online: https://home.kepco.co.kr/kepco/KO/ntcob/list.do?boardCd=BRD_000097&menuCd=FN05030101 (accessed on 12 September 2023).
- KPX. Available online: https://epsis.kpx.or.kr/epsisnew/selectEkifBoardList.do?menuId=080200&boardId=020000 (accessed on 12 September 2023).
- Khanb, M.R.; Hannaa, A.; Sunb, X.; Alam, M.A. Vertical bifacial solar farms: Physics, design, and global optimization. Appl. Energy 2017, 206, 240–248. [Google Scholar] [CrossRef]
- ISO 12006-2:2015; Building Construction—Organization of Information about Construction Works. ISO: Geneva, Switzerland, 2015.
- IEC 60364-1:2005; Low-Voltage Electrical Installations-Part 1: Fundamental Principles, Assessment of General Characteristics, Definitions. IEC: Geneva, Switzerland, 2005.
- IEC 61936-2:2023; Power Installations Exceeding 1 kV AC and 1,5 kV DC-Part 2: DC. IEC: Geneva, Switzerland, 2023.
- IEC 60909-0:2016; Short-Circuit Currents in Three-Phase A.C. Systems-Part 0: Calculation of Currents. IEC: Geneva, Switzerland, 2016.
- IEC 61850:2023; SER, Communication Networks and Systems for Power Utility Automation-All Parts. IEC: Geneva, Switzerland, 2023.
- Dunlop, E.D.; Gracia Amillo, A.; Salis, E.; Sample, T.; Taylor, N. Standards for the Assessment of the Environmental Performance of Photovoltaic Modules, Power Conditioning Components and Photovoltaic Systems. European Union, Luxembourg. 2018. Available online: https://core.ac.uk/download/pdf/168398814.pdf (accessed on 20 September 2023).
- Sarkar, S.; Bhaskar, M.S.; Rao, K.U.; Prema, V.; Almakhles, D.; Subramaniam, U. Solar PV network installation standards and cost estimation guidelines for smart cities. Alex. Eng. J. 2022, 61, 1277–1287. [Google Scholar] [CrossRef]
- Firstsilicon. Available online: http://www.firstsilicon.co.kr/bbs/content.php?co_id=PowerOptimizer (accessed on 20 September 2023).
- Cleantechnica. Available online: https://cleantechnica.com/2019/02/18/nrel-builds-first-solar-database-for-bifacial-albedo/ (accessed on 12 September 2023).
- Gi-Cheol, K.; Min-Seok, O.; Kyu-Hong, H.; Seong-Ryong, R. Comparative Analysis for Vertical Photovoltaic System Based on Light-receiving Efficiency and Solar Installation Area. J. Korean Inst. Archit. Sustain. Environ. Build. Syst. 2022, 16, 35–44. [Google Scholar]
- Bourne, B. Ground Albedo Field Measurements. In Proceedings of the NREL Bifacial PV Workshop 2018. SUNPOWER, Lakewood, CO, USA, 10–11 September 2018. [Google Scholar]
- Woo-young, L.; Seoul 04789, Republic of Korea. Personal communication, 2023.
- Obara, S.; Konno, D.; Utsugi, Y.; Morel, J. Analysis of output power and capacity reduction in electrical storage facilities by peak shift control of PV system with bifacial modules. Appl. Energy 2014, 128, 35–48. [Google Scholar] [CrossRef]


| KPX Market | KEPCO PPA | BTM, etc. | Total | |
|---|---|---|---|---|
| Capacity (GW) | 5.8 | 13.2 | 2.4 | 21.2 |
| Details | |
|---|---|
| Solar module | 460 W monofacial/bifacial (Hanhwa Qcell Co., Seoul, Republic of Korea) |
| Inverter | 110 kW multistring type (Hyundai Co., Seoul, Republic of Korea) |
| Power optimizer | 600 W (First Silicon Co., Seoul, Republic of Korea) |
| Tilt | 90° (vertical type), 25° (conventional type), tracker type |
| Azimuth of vertical PV | 0°, 45°, 90°, 135°, 225°, 270°, 315° |
| AM 10:00 | PM 15:00 | |
|---|---|---|
| Overall bird’s-eye view |  |  |
 |  | |
| South direction |  |  |
| Details | |
|---|---|
| Module name | Q.PEAK_DUO_XL-G9.3 BFG 460 |
| Max. power | 460 W |
| Efficiency | 20.6% |
| Temp. coefficient of PMPP | −0.35% |
| Bifaciality | (70 ± 5)% |
| Front glass thickness | 2 mm |
| Rear glass thickness | 2 mm |
| Details | |
|---|---|
| Module name | Q.PEAK_DUO_XL-G9.3 KR1 460 |
| Max. power | 460 W |
| Efficiency | 20.6% |
| Temp. coefficient of PMPP | −0.35% |
| Front glass thickness | 3.2 mm |
| Clear Sky | A Little Cloud | Lots of Cloud | Cloudy | |
|---|---|---|---|---|
| Amount of cloud | 0~2 | 3~5 | 6~8 | 9~10 |
| Generation (Wh) | Jan | Feb | Mar | Apr | May | Jun | July | |
|---|---|---|---|---|---|---|---|---|
| Vertical (bifacial) | daily average | 1152 | 1262 | 1492 | 1413 | 1440 | 1437 | 913 |
| clear days average | 1481 | 1733 | 1859 | 2156 | 2254 | 1910 | 1604 | |
| Conventional (monofacial) | daily average | 1514 | 1986 | 2166 | 1955 | 1917 | 2103 | 1277 |
| clear days average | 1826 | 2703 | 2705 | 2977 | 2945 | 2759 | 2121 | |
| Conventional (bifacial) | daily average | 1686 | 2148 | 2354 | 2110 | 2060 | 2194 | 1317 |
| clear days average | 2026 | 2922 | 2911 | 3173 | 3182 | 2888 | 2178 | |
| Monthly capacity factor (%) | Jan | Feb | Mar | Apr | May | Jun | July | |
| Vertical (bifacial) | daily average | 10.4 | 11.4 | 13.5 | 12.8 | 13.0 | 13.0 | 8.3 |
| clear days average | 1.34 | 15.7 | 16.8 | 19.5 | 20.4 | 17.3 | 14.5 | |
| Conventional (monofacial) | daily average | 13.7 | 18.0 | 19.6 | 17.7 | 17.4 | 19.0 | 11.6 |
| clear days average | 16.5 | 24.5 | 24.5 | 27.0 | 26.7 | 25.0 | 19.2 | |
| Conventional (bifacial) | daily average | 15.3 | 19.5 | 21.3 | 19.1 | 18.7 | 19.9 | 11.9 |
| clear days average | 18.4 | 26.5 | 26.4 | 28.7 | 28.8 | 26.2 | 19.7 | |
| Jan | Feb | Mar | Apr | May | Jun | July |
|---|---|---|---|---|---|---|
| 11/16 | 10/16 | 10/16 | 9/17 | 9/17 | 10/16 | 10/17 |
| Jan | Feb | Mar | Apr | May | Jun | July | |
|---|---|---|---|---|---|---|---|
| Vertical PV module | 409.7 | 340.4 | 349.7 | 357.1 | 338.2 | 290.6 | 277.9 |
| Compared with facility capacity (%) | 89.1 | 74.0 | 76.0 | 77.6 | 73.5 | 63.2 | 60.4 |
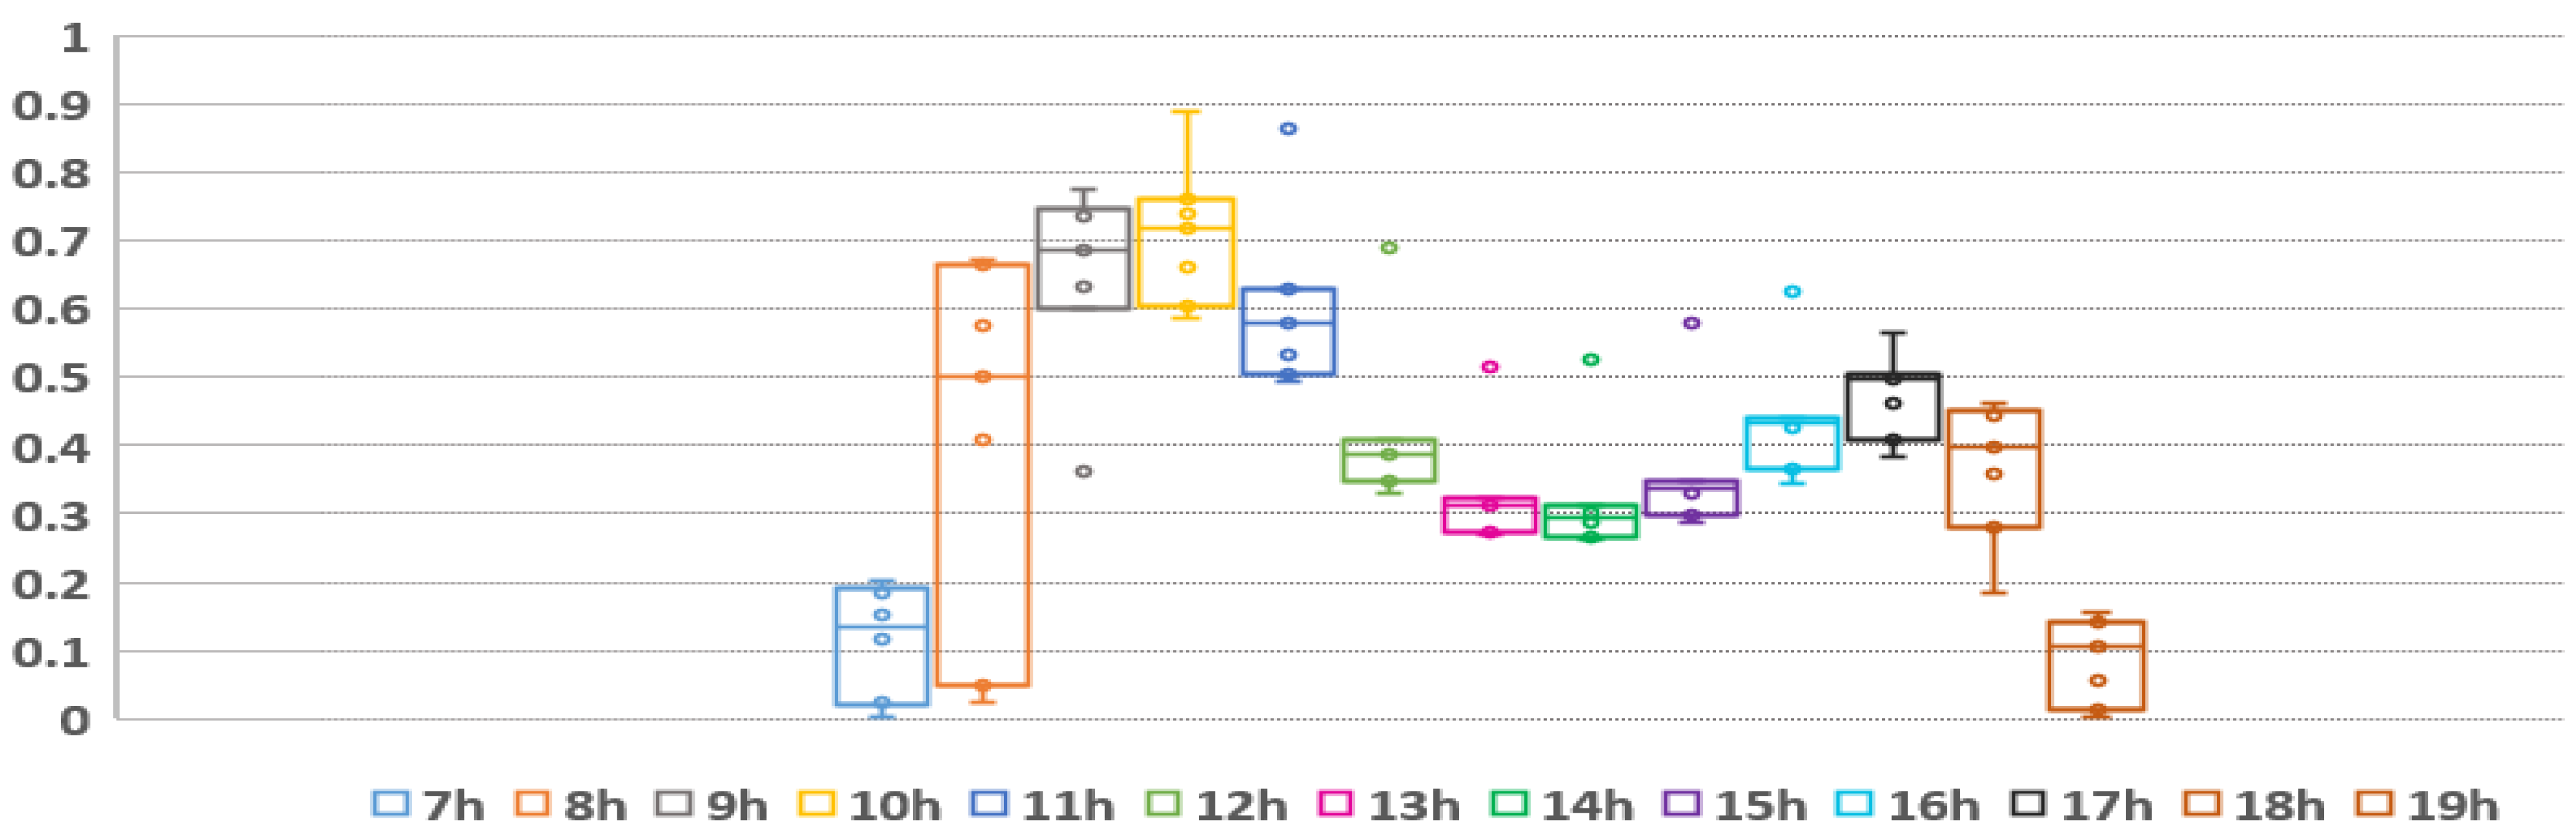
| Time | 7 h | 8 h | 9 h | 10 h | 11 h | 12 h | 13 h | 14 h | 15 h | 16 h | 17 h | 18 h | 19 h |
|---|---|---|---|---|---|---|---|---|---|---|---|---|---|
| Vertical-type bifacial module (W) | 92.3 | 310.0 | 357.1 | 409.7 | 398.5 | 317.7 | 236.4 | 242.6 | 266.0 | 288.3 | 260.1 | 213.3 | 71.7 |
| Compared with facility capacity (%) | 20.1 | 67.4 | 77.6 | 89.1 | 86.6 | 69.1 | 51.4 | 52.7 | 57.8 | 62.7 | 56.5 | 46.4 | 15.6 |
| Details | ||
|---|---|---|
| Weather data | Meteonorm 8.1, KMA | |
| Location | latitude 34.98° N/longitude 126.69° E | |
| Installation conditions | vertical | tilt 90°, east–west oriented (azimuth 90°) |
| conventional | tilt 25°, azimuth south (0°) | |
| DC side design | vertical | 460 W × four serial × three parallel |
| conventional | 460 W × six serial × two parallel | |
| Albedo | 0.18 (dry compacted gravel) [25] | |
| Meteonorm 8.1 | KMA | |||||
|---|---|---|---|---|---|---|
| Vertical (Bifacial) | Conventional (Monofacial) | Conventional (Bifacial) | Vertical (Bifacial) | Conventional (Monofacial) | Conventional (Bifacial) | |
| Jan | 381 | 509.4 | 538.6 | 391.5 | 539.5 | 569.1 |
| Feb | 443.5 | 559.4 | 592.2 | 448.1 | 585.8 | 619.4 |
| Mar | 593.1 | 712.5 | 759.4 | 586 | 735.8 | 782.6 |
| Apr | 675.8 | 766.4 | 822.7 | 662.3 | 764.5 | 820.5 |
| May | 698 | 780 | 842.6 | 721.1 | 792.1 | 856 |
| Jun | 596.8 | 658.1 | 716.1 | 585.1 | 651.4 | 708.4 |
| July | 579.7 | 620.1 | 675 | 541.2 | 583.4 | 635.9 |
| Aug | 605.2 | 687.4 | 742.3 | 567 | 620.5 | 673.4 |
| Sep | 551 | 651.1 | 695.9 | 541.2 | 621.7 | 666.7 |
| Oct | 550.4 | 684.6 | 726.1 | 532.7 | 682.9 | 723.2 |
| Nov | 391.6 | 518.8 | 549.5 | 407.6 | 537.1 | 568.4 |
| Dec | 334.8 | 454.6 | 483.2 | 358.4 | 490.8 | 519.7 |
Disclaimer/Publisher’s Note: The statements, opinions and data contained in all publications are solely those of the individual author(s) and contributor(s) and not of MDPI and/or the editor(s). MDPI and/or the editor(s) disclaim responsibility for any injury to people or property resulting from any ideas, methods, instructions or products referred to in the content. |
© 2023 by the authors. Licensee MDPI, Basel, Switzerland. This article is an open access article distributed under the terms and conditions of the Creative Commons Attribution (CC BY) license (https://creativecommons.org/licenses/by/4.0/).
Share and Cite
Lee, S.-M.; Lee, E.-C.; Lee, J.-H.; Yu, S.-H.; Heo, J.-S.; Lee, W.-Y.; Kim, B.-S. Analysis of the Output Characteristics of a Vertical Photovoltaic System Based on Operational Data: A Case Study in Republic of Korea. Energies 2023, 16, 6971. https://doi.org/10.3390/en16196971
Lee S-M, Lee E-C, Lee J-H, Yu S-H, Heo J-S, Lee W-Y, Kim B-S. Analysis of the Output Characteristics of a Vertical Photovoltaic System Based on Operational Data: A Case Study in Republic of Korea. Energies. 2023; 16(19):6971. https://doi.org/10.3390/en16196971
Chicago/Turabian StyleLee, Seung-Min, Eui-Chan Lee, Jung-Hun Lee, Sun-Ho Yu, Jae-Sil Heo, Woo-Young Lee, and Bong-Suck Kim. 2023. "Analysis of the Output Characteristics of a Vertical Photovoltaic System Based on Operational Data: A Case Study in Republic of Korea" Energies 16, no. 19: 6971. https://doi.org/10.3390/en16196971