Article

Detection of Manufacturing Defects in Lithium-Ion Batteries-Analysis of the Potential of Computed Tomography Imaging

1
Research Institute for Automotive Electronics (E-LAB), HELLA GmbH und Co. KGaA, Beckumer Str. 130, D-59555 Lippstadt, Germany
2
Electrical Energy Storage Technology, Department of Energy and Automation Technology, Faculty IV, Secr. EMH 2, Technische Universität Berlin, Einsteinufer 11, D-10587 Berlin, Germany
*
Authors to whom correspondence should be addressed.
Energies 2023, 16(19), 6958; https://doi.org/10.3390/en16196958
Submission received: 24 August 2023 / Revised: 20 September 2023 / Accepted: 29 September 2023 / Published: 5 October 2023
(This article belongs to the Collection Renewable Energy and Energy Storage Systems)

Abstract

:
Realising an ideal lithium-ion battery (LIB) cell characterised by entirely homogeneous physical properties poses a significant, if not an impossible, challenge in LIB production. Even the slightest deviation in a process parameter in its production leads to inhomogeneities and causes a deviation in performance parameters of LIBs within the same batch. The greater the number and/or intensity of inhomogeneities, the more they need to be avoided. Severe inhomogeneities (defects), such as metal particle contamination, significantly impact the cell’s performance. Besides electrical measurements, image-based measurement methods can be used to identify defects and, thus, ensure the production quality and safety of LIBs. While the applicability of computed tomography (CT) as an image-based measurement method for detecting defects has been proven, the limitations of this method still need to be determined. In this study, a systematic analysis of the capabilities of CT imaging was conducted. A multilayer pouch cell without an electrolyte was reassembled with several defects on one of the middle anodes. To investigate the boundaries of CT, defects such as a partial and complete removal of the coating, a cut, or a kink, as well as particle contaminations of various sizes and materials (aluminium, copper, iron) were chosen. By comparing the CT images of the cell using laser scanning microscope images of the defective anode, it could be proven that all selected defects except the kink were detectable.

1. Introduction

The lithium-ion battery (LIB) cell performance at beginning-of-life (BOL) and during its lifetime is highly dependent on the cell’s manufacturing process. Since battery cell manufacturing can be out of the scope of battery system suppliers, incoming goods inspection is carried out in addition to the cell suppliers’ process quality supervision and end-of-line testing. Due to long testing times and resulting costs, not all inspection methods can be used for 100% of produced or incoming LIBs. Methods like computed tomography (CT) imaging, which enables the non-destructive detection and investigation of inhomogeneities, can be carried out on a random basis. While several authors [1,2,3,4,5,6,7,8,9,10,11,12] have shown the general applicability of CT imaging to detect manufacturing defects such as foreign matter contamination (FMD) or anode–cathode misalignments, further investigations are needed to determine the limits of defect detectability. The aim of this work is the controlled reproduction of typical cell production defects in different gradations and the assessment of detectability, with the help of CT imaging.

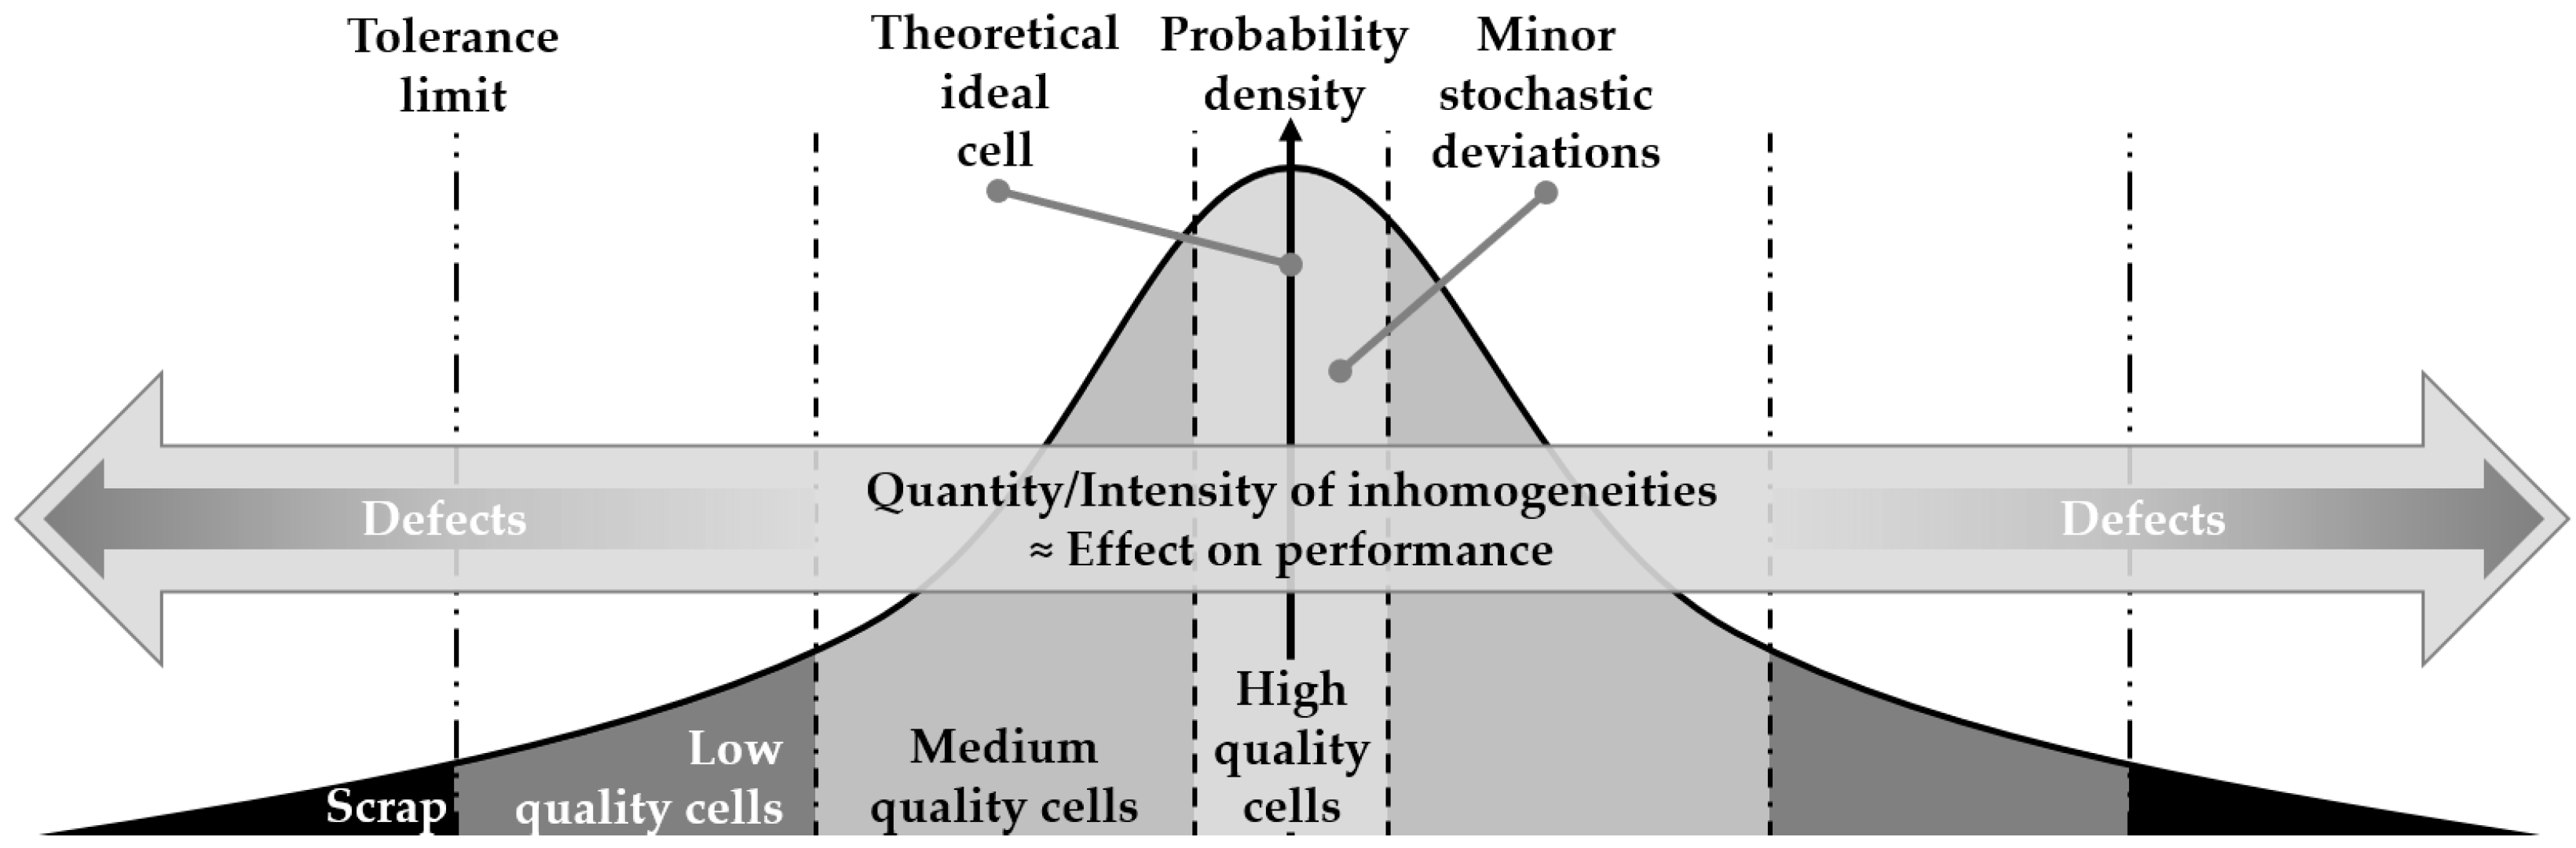
1.1. Terminology of Inhomogeneities

In the literature, the terms inhomogeneity [13,14], defect [13,15], error [16], flaw [17,18], imperfection [19,20,21], disparity [22] or impurity [15] are often assigned the same meaning. In this work, the two terms inhomogeneity and defect (as a subset of inhomogeneities) were used. A mixture of substances or a surface is inhomogeneous if there is an uneven distribution of an observed property. This can be due to accumulations of particles [23] or fluctuations in the surface quality [24]. Common to both examples is a gradual transition of the observed property, such as a continuous increase in particle density or a wave crest on uneven surfaces. The term defect appears in battery production when there is a discrete transition from a desired to an undesired property rather than a gradual one.
According to this principle, an FMD, like a metal chip on the graphite surface, would be a defect, and a deviation in the pore density of the graphite coating would be an inhomogeneity. This approach allows a rough classification into defect and inhomogeneity. However, some examples, such as a large pore in an otherwise uniform, small-pored coating or a very large increase in the surface profile due to a kink, cannot be clearly classified. To be able to distinguish between the two terms inhomogeneity and defect more clearly, two definitions are introduced below and used in this paper.
Inhomogeneity: Inhomogeneities in battery cell components (e.g., electrode, separator, electrolyte, case) describe all deviations in physical properties from a theoretically ideal definition.
Defect: Defects are local inhomogeneities that differ significantly from their homogeneous surroundings due to their shape, size or intensity and usually have a significant impact on the performance of the battery cell.
Figure 1 is intended to clarify both definitions. Defects, as a subset of inhomogeneities, tend to have a stronger impact on cell quality. In general, it can be stated that the greater the number and/or intensity of the inhomogeneities, the more the cell’s performance is affected. Even the smallest deviation from a theoretically ideal property can be defined as inhomogeneity. According to [22], inhomogeneities do not automatically lead to poor cell quality, but the inevitable statistical distribution of process parameters causes cells from the same batches to age differently [25,26,27,28]. Therefore, zero-defect manufacturing in battery production would mean to produce exclusively high-quality cells but no theoretically ideal cells.
If the tolerance limits specified by the manufacturer for the considered properties of a battery component are not met within a process step, the component leaves the process as scrap (e.g., exceeding the number of divots per area after the coating process). Even though the LIB component lies within the tolerance limits in all process steps, the quality of the finished LIB will differ and can be classified as low, intermediate and high [29,30,31] due to accumulations of minor deviations or non-critical inhomogeneities.

1.2. Intrinsic Inhomogeneities

According to [25], inhomogeneities can be divided into intrinsic (occurrence: production) and extrinsic inhomogeneities (occurrence: after production due to external influences such as insufficient temperature management, voltage fluctuations or inhomogeneous cell pressure). This paper refers to intrinsic inhomogeneities only.
Scrap or rejects emerge during the switch-on of production and operation [16]. In a survey by Kehrer et al., 250 experts from industry and research voted independently on which five process steps within battery production (electrode production, cell assembly, formation and testing) cause the highest rejection. The most votes went to electrode production, especially during coating (68%) followed by the cell assembly, especially the stacking (44%) and electrolyte filling (40%). This evaluation can be backed by the review of du Baret de Limé et al., who found metal contaminations and line defects which occur during the coating as typical and significant intrinsic inhomogeneities [22].
Typical metal contaminations as a part of FMD are copper from the anode and aluminium particles from the cathode substrate, as well as iron, often combined with zirconium or zinc mainly from machine abrasion. Positioned on the electrode’s surface, foreign particles can penetrate the separator in the assembled LIB and can cause higher self-discharge rates or even short circuits and, therefore, lower the LIB performance and safety drastically [15,22,32,33].
Other implications of the existence of metal particles on or within the electrodes are alloy formations with lithium and other parasitic reactions, resulting in a decrease in their capacity and coulombic efficiency [34]. Metal contaminations are, therefore, a very critical defect and must be detected during production.
Line defects can emerge as intrinsic and extrinsic inhomogeneities in many forms. According to [13] line defects are stripe-like uncoated areas caused by obstructions in the slot-die coater, causing severe capacity fades during cycling when occurring on the cathode. In a review paper addressing the impact of defects, [22] added cracks as another form of line defect. Cracks, as one of the most researched inhomogeneities [35,36,37,38,39,40], can be classified into intergranular [37] and intragranular [35] cracks [38]. While intergranular cracks appear along grain boundaries, such as mud cracks, intragranular cracks appear within the grains of the active material and can be distinguished into bisects, micro-cracks, multi-prong, prong and shatter cracks [41]. The majority of the named cracks are initiated during production and become more severe during operation, especially at high voltages [35,41].
Other terms and types of elongated defects found in the literature are scratches, streaks, stripes, kinks and tears [20,42,43,44,45]. Even though kinks mainly occur in the centre of jelly rolls in winded cells due to volumetric changes in operation, their positioning is a result of inhomogeneous core geometry [20,46]. Similarly, the bending of electrodes in the production line (bending around rolls or shafts during handling) can cause delamination or cracks due to tension on the inside and compression on the outside of the bent electrode [47]. Schilling et al. demonstrated the severe impact of when electrodes were bent on a radius less than r = 1.5 mm and below.
Due to the simplicity of reproduction and their criticality, this paper will investigate metal-particle contamination in different sizes and a variety of line defects. For the metal-particle contamination, aluminium, iron and copper were investigated. The choices for line defects were a completely uncoated stripe, a partially uncoated stripe with spallings (small areas with fully removed coating), a scratch through the active material, a cut as a simplified tear and an unfolded 90-degree kink around a sharp edge with a small diameter (d = 1 mm) as a representation of high bending stress. These choices were also made due to the impact on the electrical performance of the cell and their possible occurrence in production [13,47]. Therefore, the detection of the defects is critical, to achieve safe and well-performing cells.

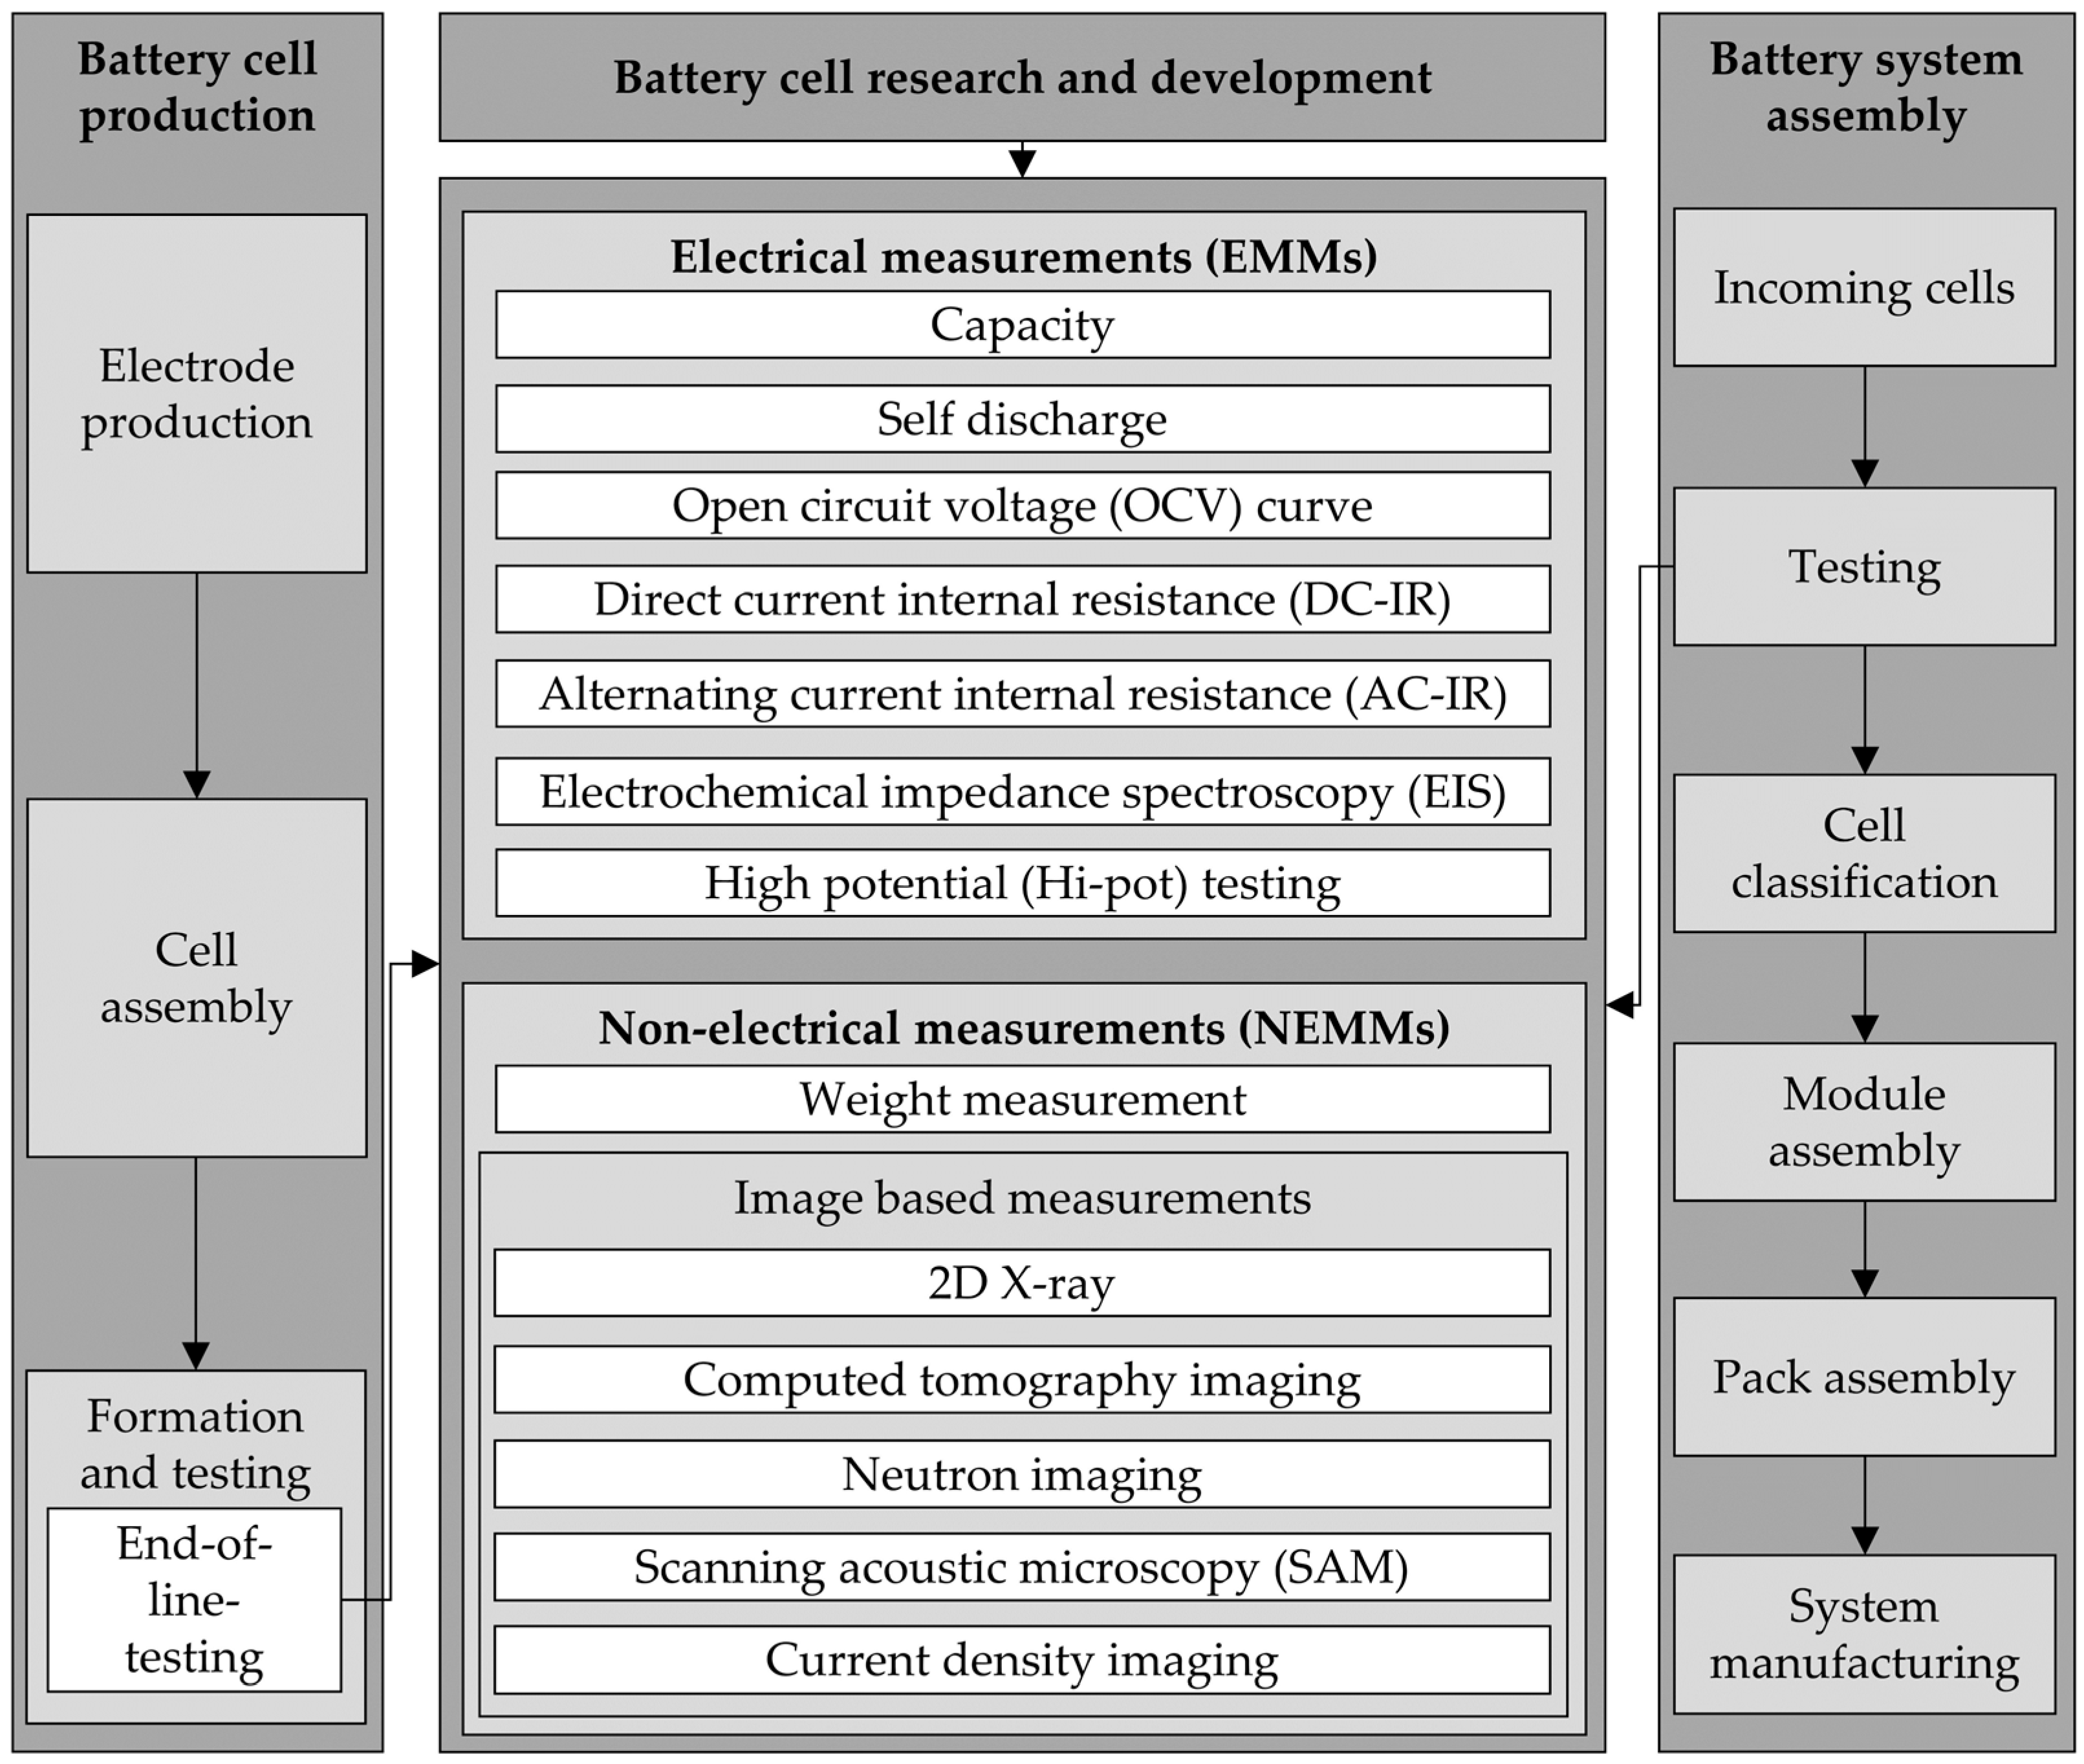
1.3. Measurement Methods

Two measurement approaches have been demonstrated to identify the inhomogeneities mentioned above. Electrical measurement methods (EMMs) aim to identify defects by their negative impact on electrical performance. In contrast, non-electrical measurement methods (NEMMs) aim to directly identify defects based on changes in physical properties of the LIBs due to the defects e.g., the geometry or material. The defects investigated in this work are metal particles (copper, aluminium and iron) and line defects (partly and fully uncoated strips, cut, tear and kink). Both their impact on the electrical performance of the cell and the underlying geometrical and physical changes offer perspectives for non-destructive identification or indication.
EMMs can indicate defects if cell properties substantially differ from the cell batch average. The impact of inhomogeneities on the electrical performance of battery cells has been investigated [10,12,13,15,17,22,34,48]. Thus, EMMs with potential applications in battery cell production and system assembly include a variety of methods such as self-discharge measurements, capacity measurements, recording of open circuit voltage (OCV) curves, differential voltage analysis (DVA) and incremental capacity analysis (ICA), internal resistance testing based on alternating (AC-IR) and direct currents (DC-IR), and high-potential (Hi-Pot) testing, as well as electrochemical impedance spectroscopy (EIS) [29,49,50,51,52,53]. An overview of the measurement methods and their potential fields of application are shown in Figure 2.
Unfortunately, the identification and localisation of inhomogeneities based on EMMs are usually complicated due to the variety of potential sources. However, several authors have shown the ability of EMMs to detect specific defects. Roth et al. and Sazhin et al. highlighted the potential of self-discharge measurements to identify short circuits, e.g., caused by particle contamination and other small inhomogeneities [52,53]. An alternative approach for the detection of FMD was shown by Pan et al. and is based on Hi-Pot testing [51]. Ank et al. investigated the behaviour of coin cells with various inhomogeneities (e.g., particle contamination, electrolyte and moisture deviations) [12]. The authors evaluated the detection quality of the characterisation methods and concluded that DVA at low currents (compared to capacitance screening, DC-IR, EIS and OCV tests) showed the highest robustness in detecting and distinguishing the investigated inhomogeneities. Besides the potential for improvement regarding the detection of inhomogeneities via EMMs, such as investigations on larger cell formats, the ability to localise inhomogeneities within an LIB has not yet been shown.
NEMMs include image-based/optical inspections and dimension and weight tolerance checks [12]. While EMMs can indicate the occurrence of inhomogeneities, image-based methods can detect and localise inhomogeneities directly. Thus, they are widely used in the electronics industry for in-line quality control and off-line analysis. Image-based inspection methods applied to battery cells include widely used 2D X-ray and 3D X-ray or CT, neutron imaging, scanning acoustic microscopy (SAM), current density imaging based on magnetic fields, XRD (X-ray-diffraction) and XRD-CT [5,9,10,15,54,55,56,57,58]. These methods can be used for non-destructive analysis, as the cell must not be opened for investigation [6,11]. Two-dimensional X-ray and conventional CT imaging have already been applied to industrial applications and rely on material-specific differences in X-ray absorption. CT scanners for industrial applications are often based on a static X-ray source and detector while the inspected object is rotated in the X-ray beam [6]. To improve the object’s magnification and pixel resolution, the rotation axis is moved towards the X-ray source. As demonstrated by Kruth et al., this may lead to blurring of the object [11].
X-ray-based methods have been used for the visualisation of inhomogeneities (e.g., particle contamination, the misalignment of the anode and cathode, tab burrs, delamination, electrode gapping and a non-uniform cathode thickness), electrolyte filling in fully assembled cells and for quality assessment during cell manufacturing [5,10,15,55,56]. Gom et al. investigated the main capabilities of 3D X-ray to evaluate batteries based on the imaging technique. The authors summarised that micro- and macro-CT with a typical resolution between 10 and 500 μm can be used to conduct cell- and module-assembly defect analysis depending on the cell size and type. The analysis of electrodes (e.g., to characterise the morphology or tortuosity of coatings) and particles are in the scope of technologies with higher resolution (sub-micrometre and nanoscale X-ray microscopy) [5]. Due to the limited probe size of technologies with higher resolution, the potential of micro-CT with a lower resolution is further investigated in this work. It allows the non-destructive analysis of complete battery cells (e.g., large prismatic and pouch cells) with a single scan. The potential to identify defects with a single scan is beneficial as it does not require knowledge of the exact location of the local defect prior to the CT scan. However, the visibility of selected inhomogeneities (e.g., scratches, uncoated regions) and limitations of the method for inhomogeneity detection (e.g., size and material of particles) still need to be determined.

2. Experimental

2.1. Cell Specifications

To analyse the limitations of CT imaging, the visibility of defects in a pouch cell was investigated. The manipulated cell was a nickel manganese cobalt oxide/graphite pouch cell without an electrolyte for better handling and transport to the CT imaging facilities. As the electrolyte has a comparably low density, the impact of its absence on the visibility of the defects was expected to be low. The cell was based on a z-folded stack of eight anodes and seven cathodes. Anodes and cathodes were coated double-sided, except the outer anodes, which were coated one-sided. The dimensions of the cell components are summarised in Table 1.

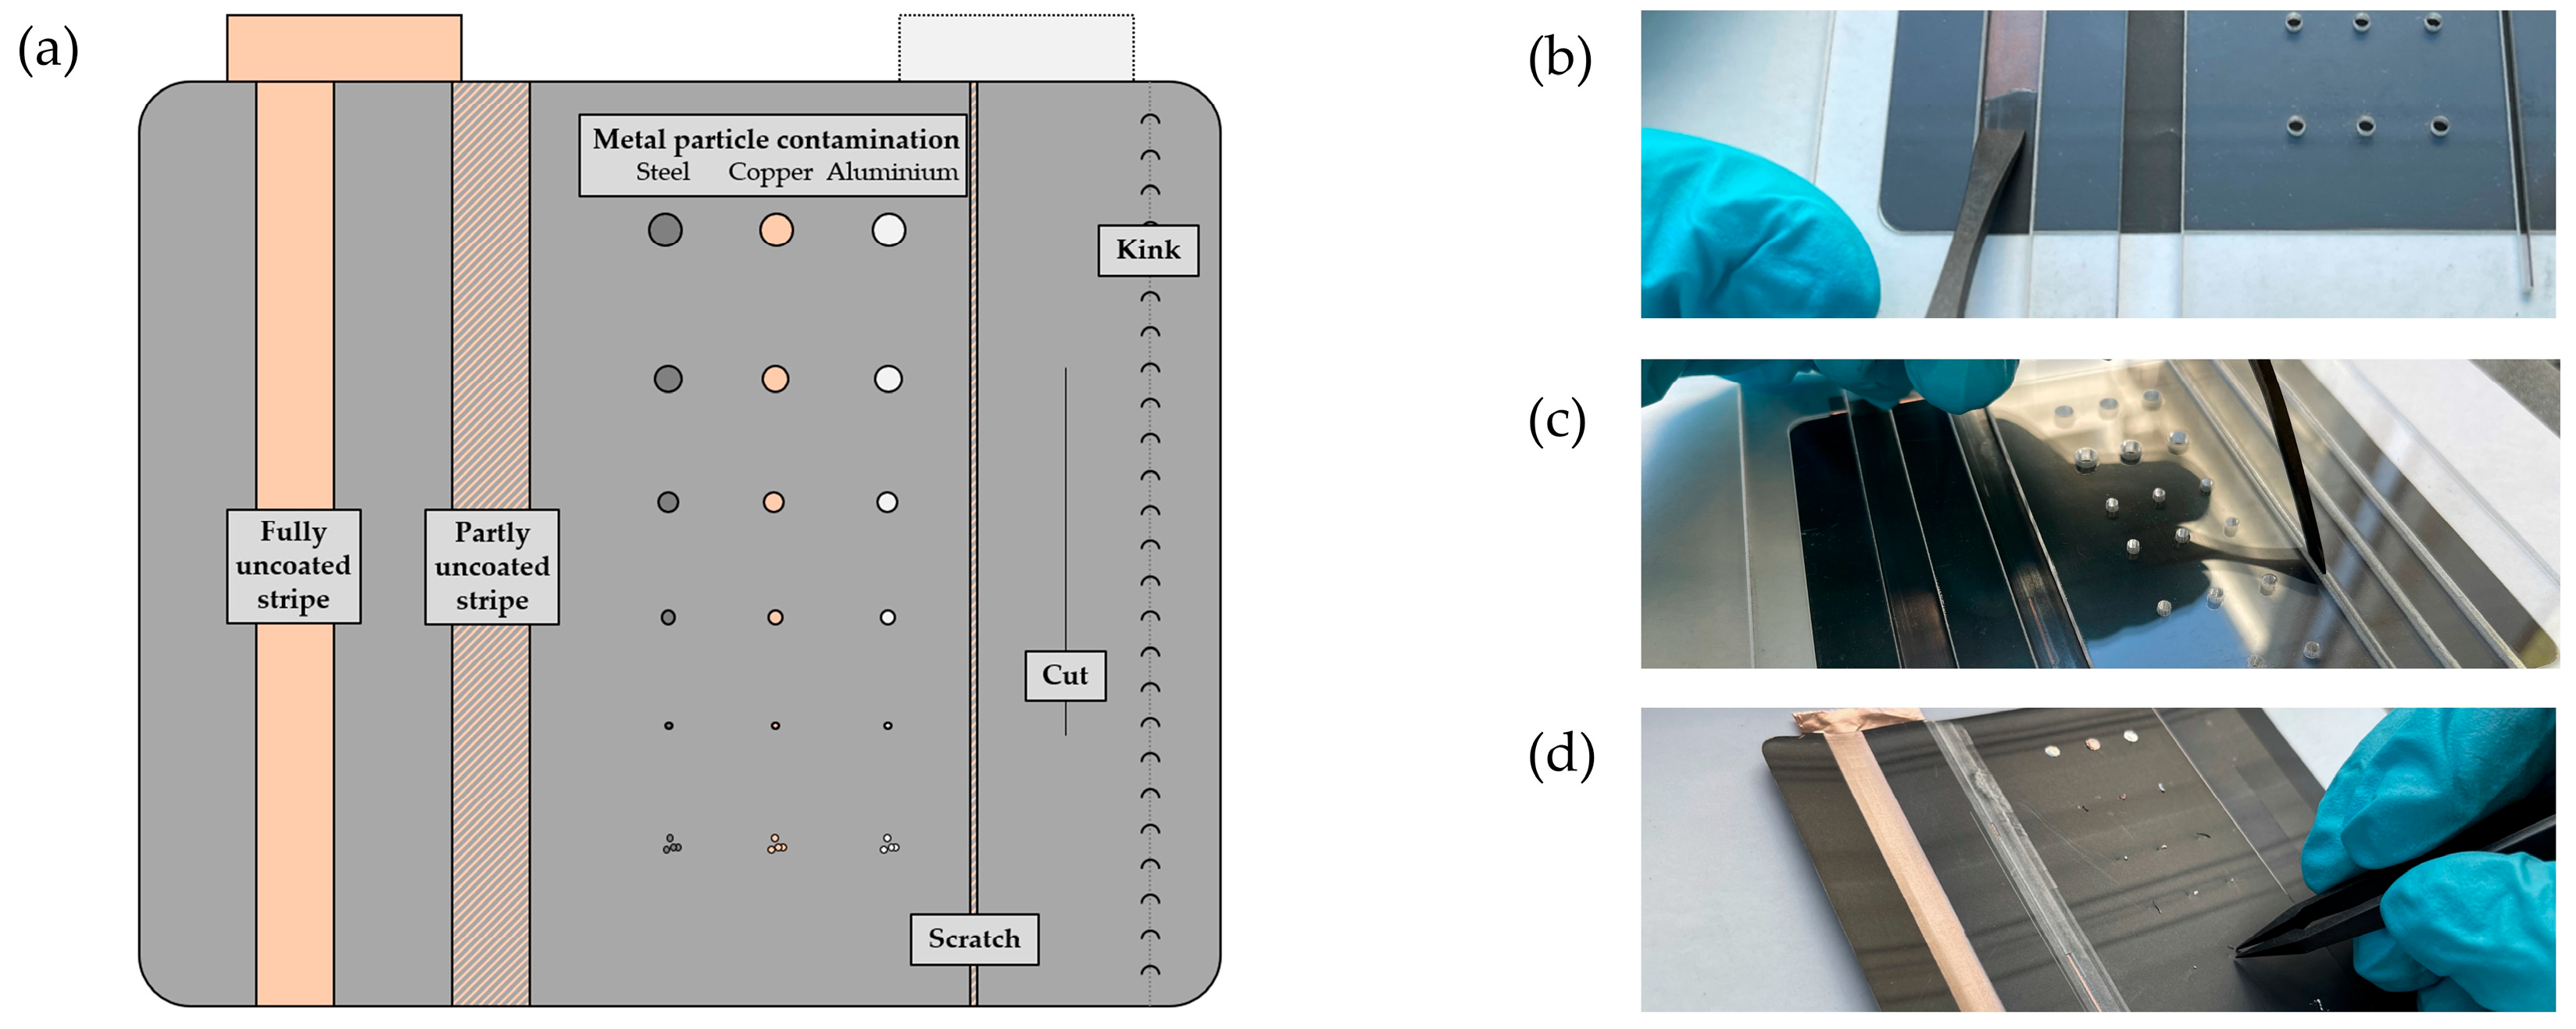
2.2. Preparation and Manipulation of the Cell

For preparation of the cell, the pouch case was opened and disassembled. The stack was separated from the positive and negative tabs for easier handling of the cell components. The z-folded electrode–separator compound was unwound. After insertion of the defects, laser scanning microscope (LSM) measurements were performed. The anode was placed in its original position within the stack. After the manual reassembly, the cell got sealed and evacuated.
As shown in Figure 3, several defects were added to the anode. The use of a template increased the reproducibility of the insertion. To analyse the visibility of coating defects, the active material of the predefined areas was partially and entirely removed. Due to the low adhesive force, the graphite layer was easily removed using a spatula (Figure 3b). To ensure that the substrate was not penetrated, the anode needed to be placed on a hard, even and clean surface such as glass. To analyse if slight changes to the surface of the anode were visible in the CT imaging, a second stripe with the spatula was scratched with reduced pressure. The partially removed area showed parts with a reduced coating thickness due to the removal and compression of the active material as well as the thin spallings. On the right side of the electrode, the coating was scratched, cut and kinked. To induce a thin scratch, the thin side of the spatula could be used (Figure 3c). For the cut, a razor blade was used. The anode was bent around a defined edge with a small diameter (d = 1 mm) and unfolded to recreate a kink.
Several particles were inserted into the cell (Figure 3d) to analyse defects at the cell level. Table 2 gives an overview of the particles regarding their material, estimated volume and shape. While the 2.5D volumes of each contamination were measured (bottom structure was estimated to be the lowest plane since it was not detectable from the top view), the 3D volumes were approximated. The particle materials were aluminium, copper and iron and each had a theoretical density of 2.70, 8.92 and 7.87 g/cm3, respectively. Each particle was fixated to the anode with instant adhesive to prevent movement of the particles during the handling and evacuation of the cell.

2.3. CT, 2D X-Ray and LSM Measurements

The CT measurement was conducted with the device Metrotom 1500/225 kV by the company Zeiss, and based on a single scan of the LIB. Analysis of the CT images was performed using the software myVGL 3.5. The voxel resolution of the scan was 74 μm. To ensure the comparability of the measurements, the same setup was used for the 2D X-ray imaging of the probe. The contrast settings were manually adjusted to maximise the visibility of the defects and remained unchanged during the investigation. For the LSM measurements, the LSM VK-X250 and the VK analysing module by the company Keyence were used. The LSM measurements were conducted in a glove box. For better visualisation, the height magnification of the following LSM figures was individually adjusted between ×150 and ×1500.

3. Results and Discussion

In the following chapter, the CT measurements are compared with the LSM images and a 2D X-ray image to analyse the visibility of the defects. Due to the scan resolution, it is not possible to see a difference between the anode and cathode (Figure 4).

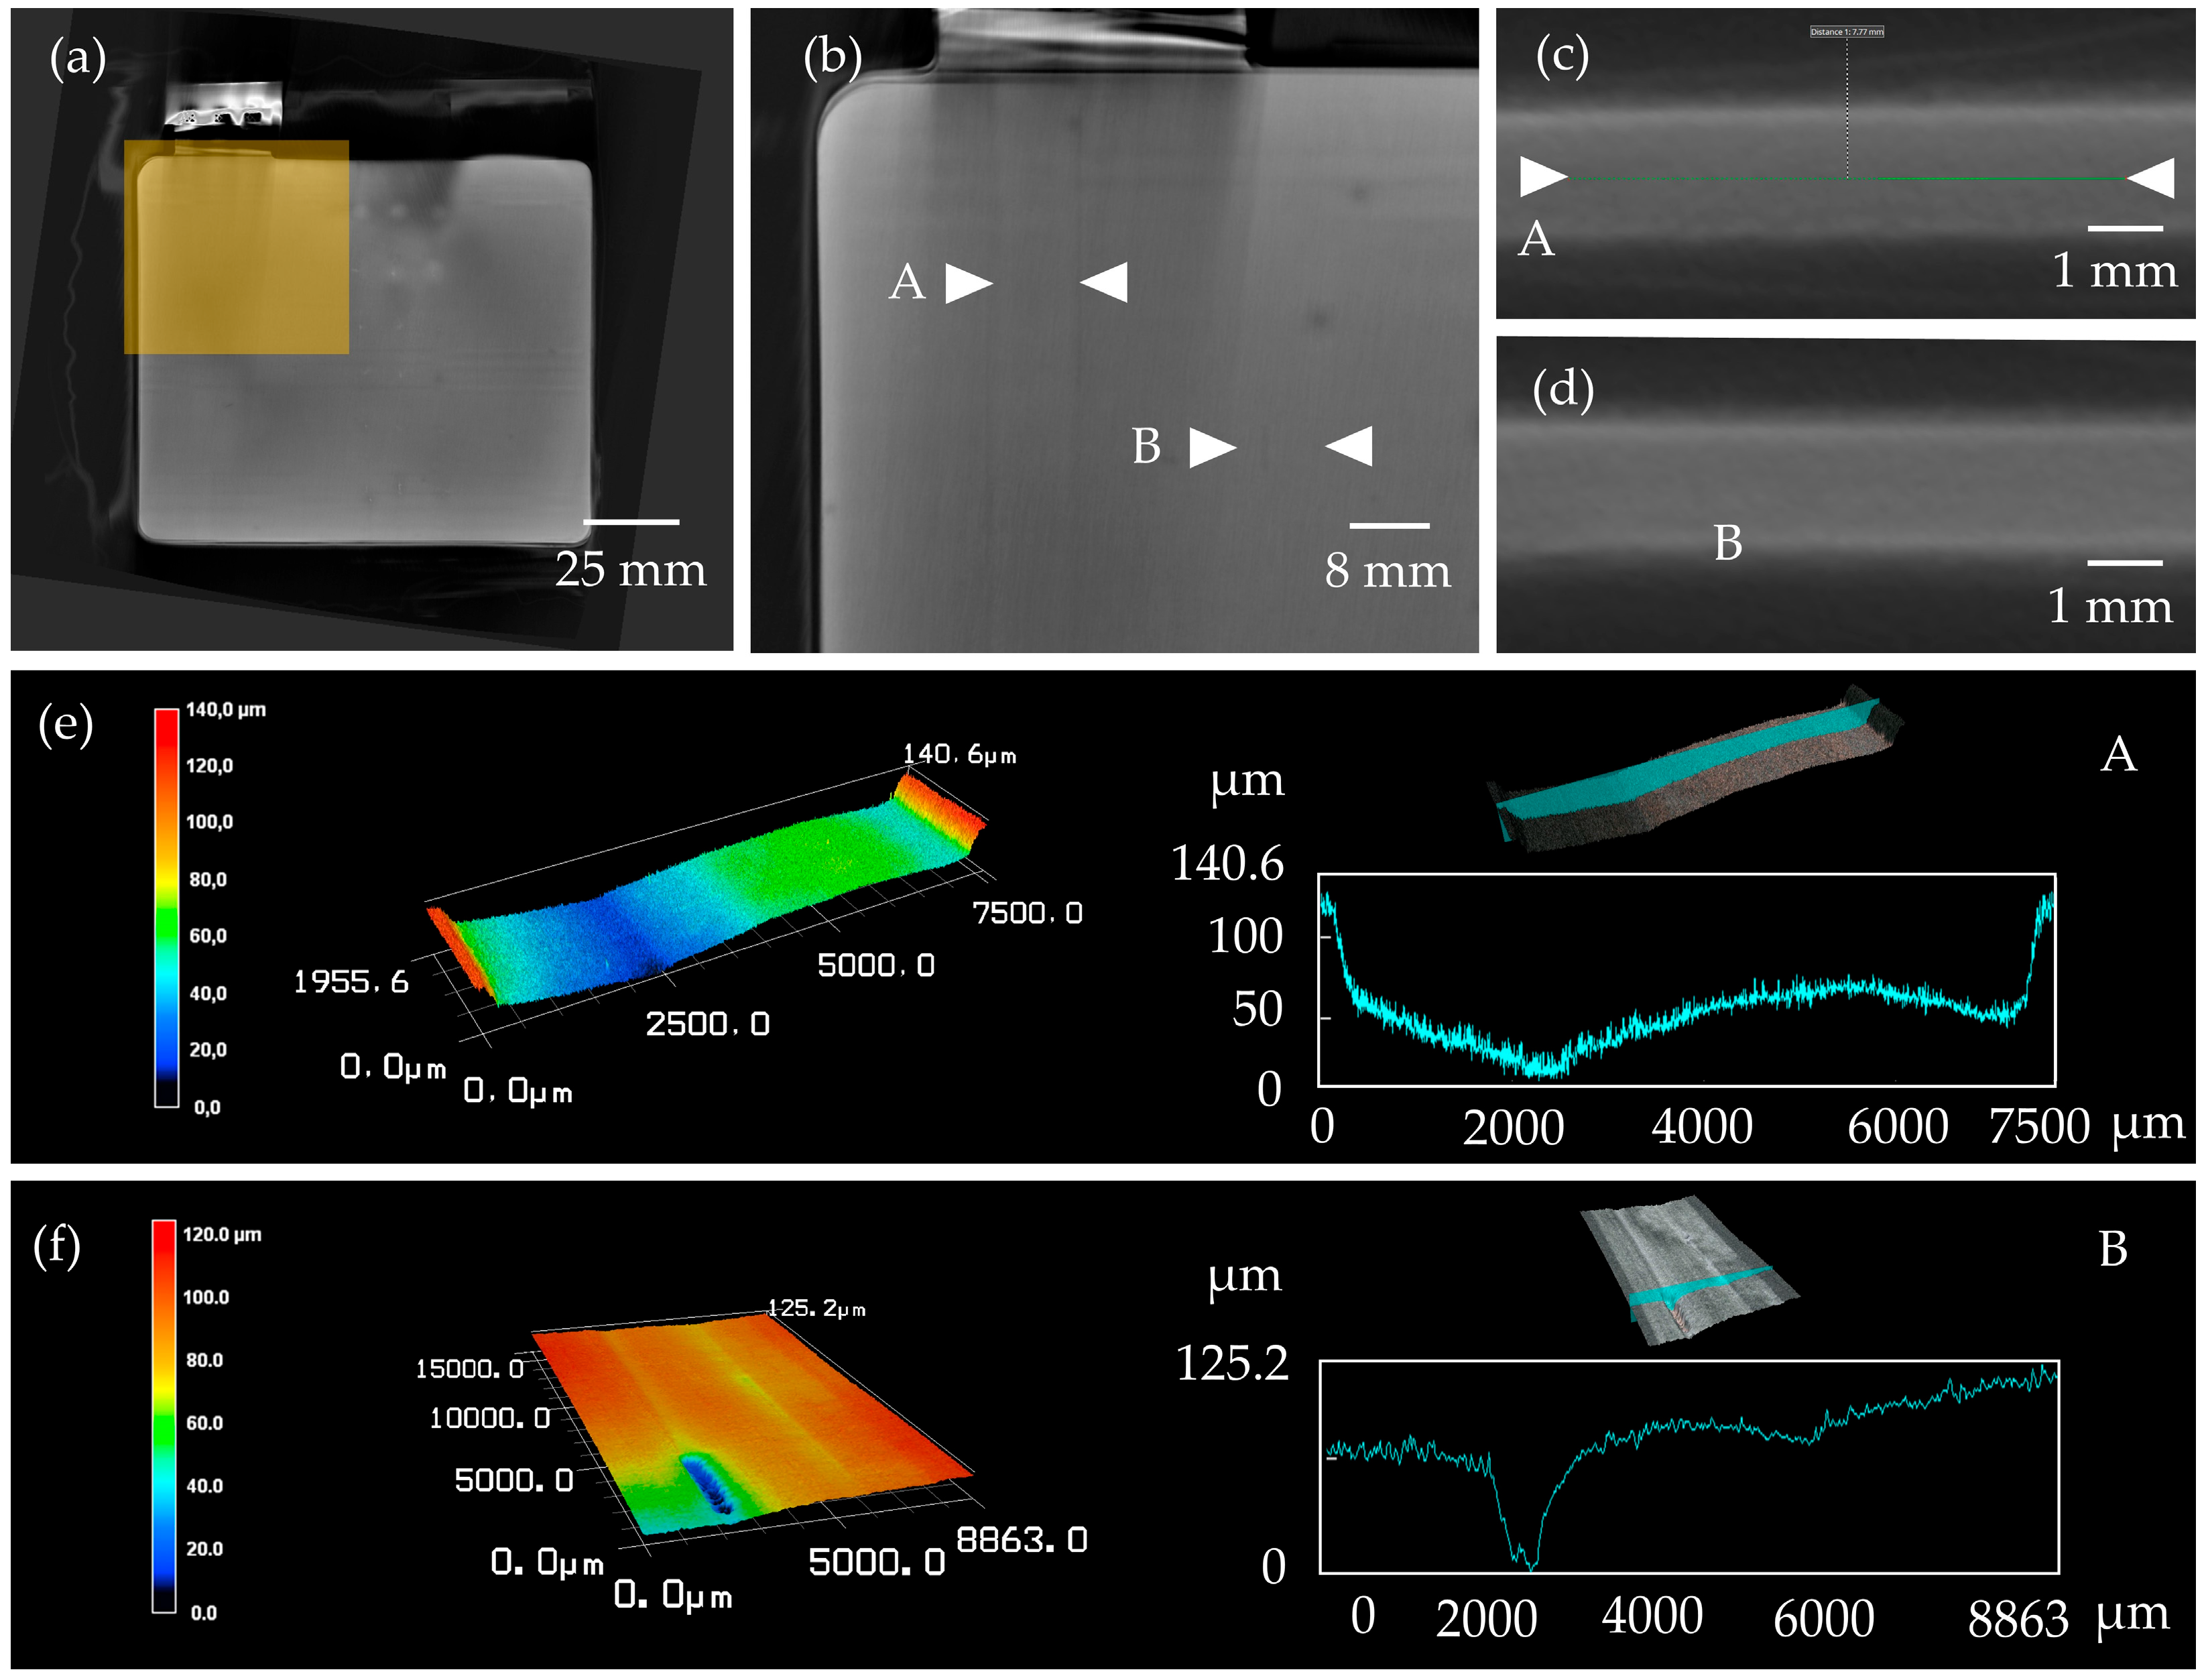
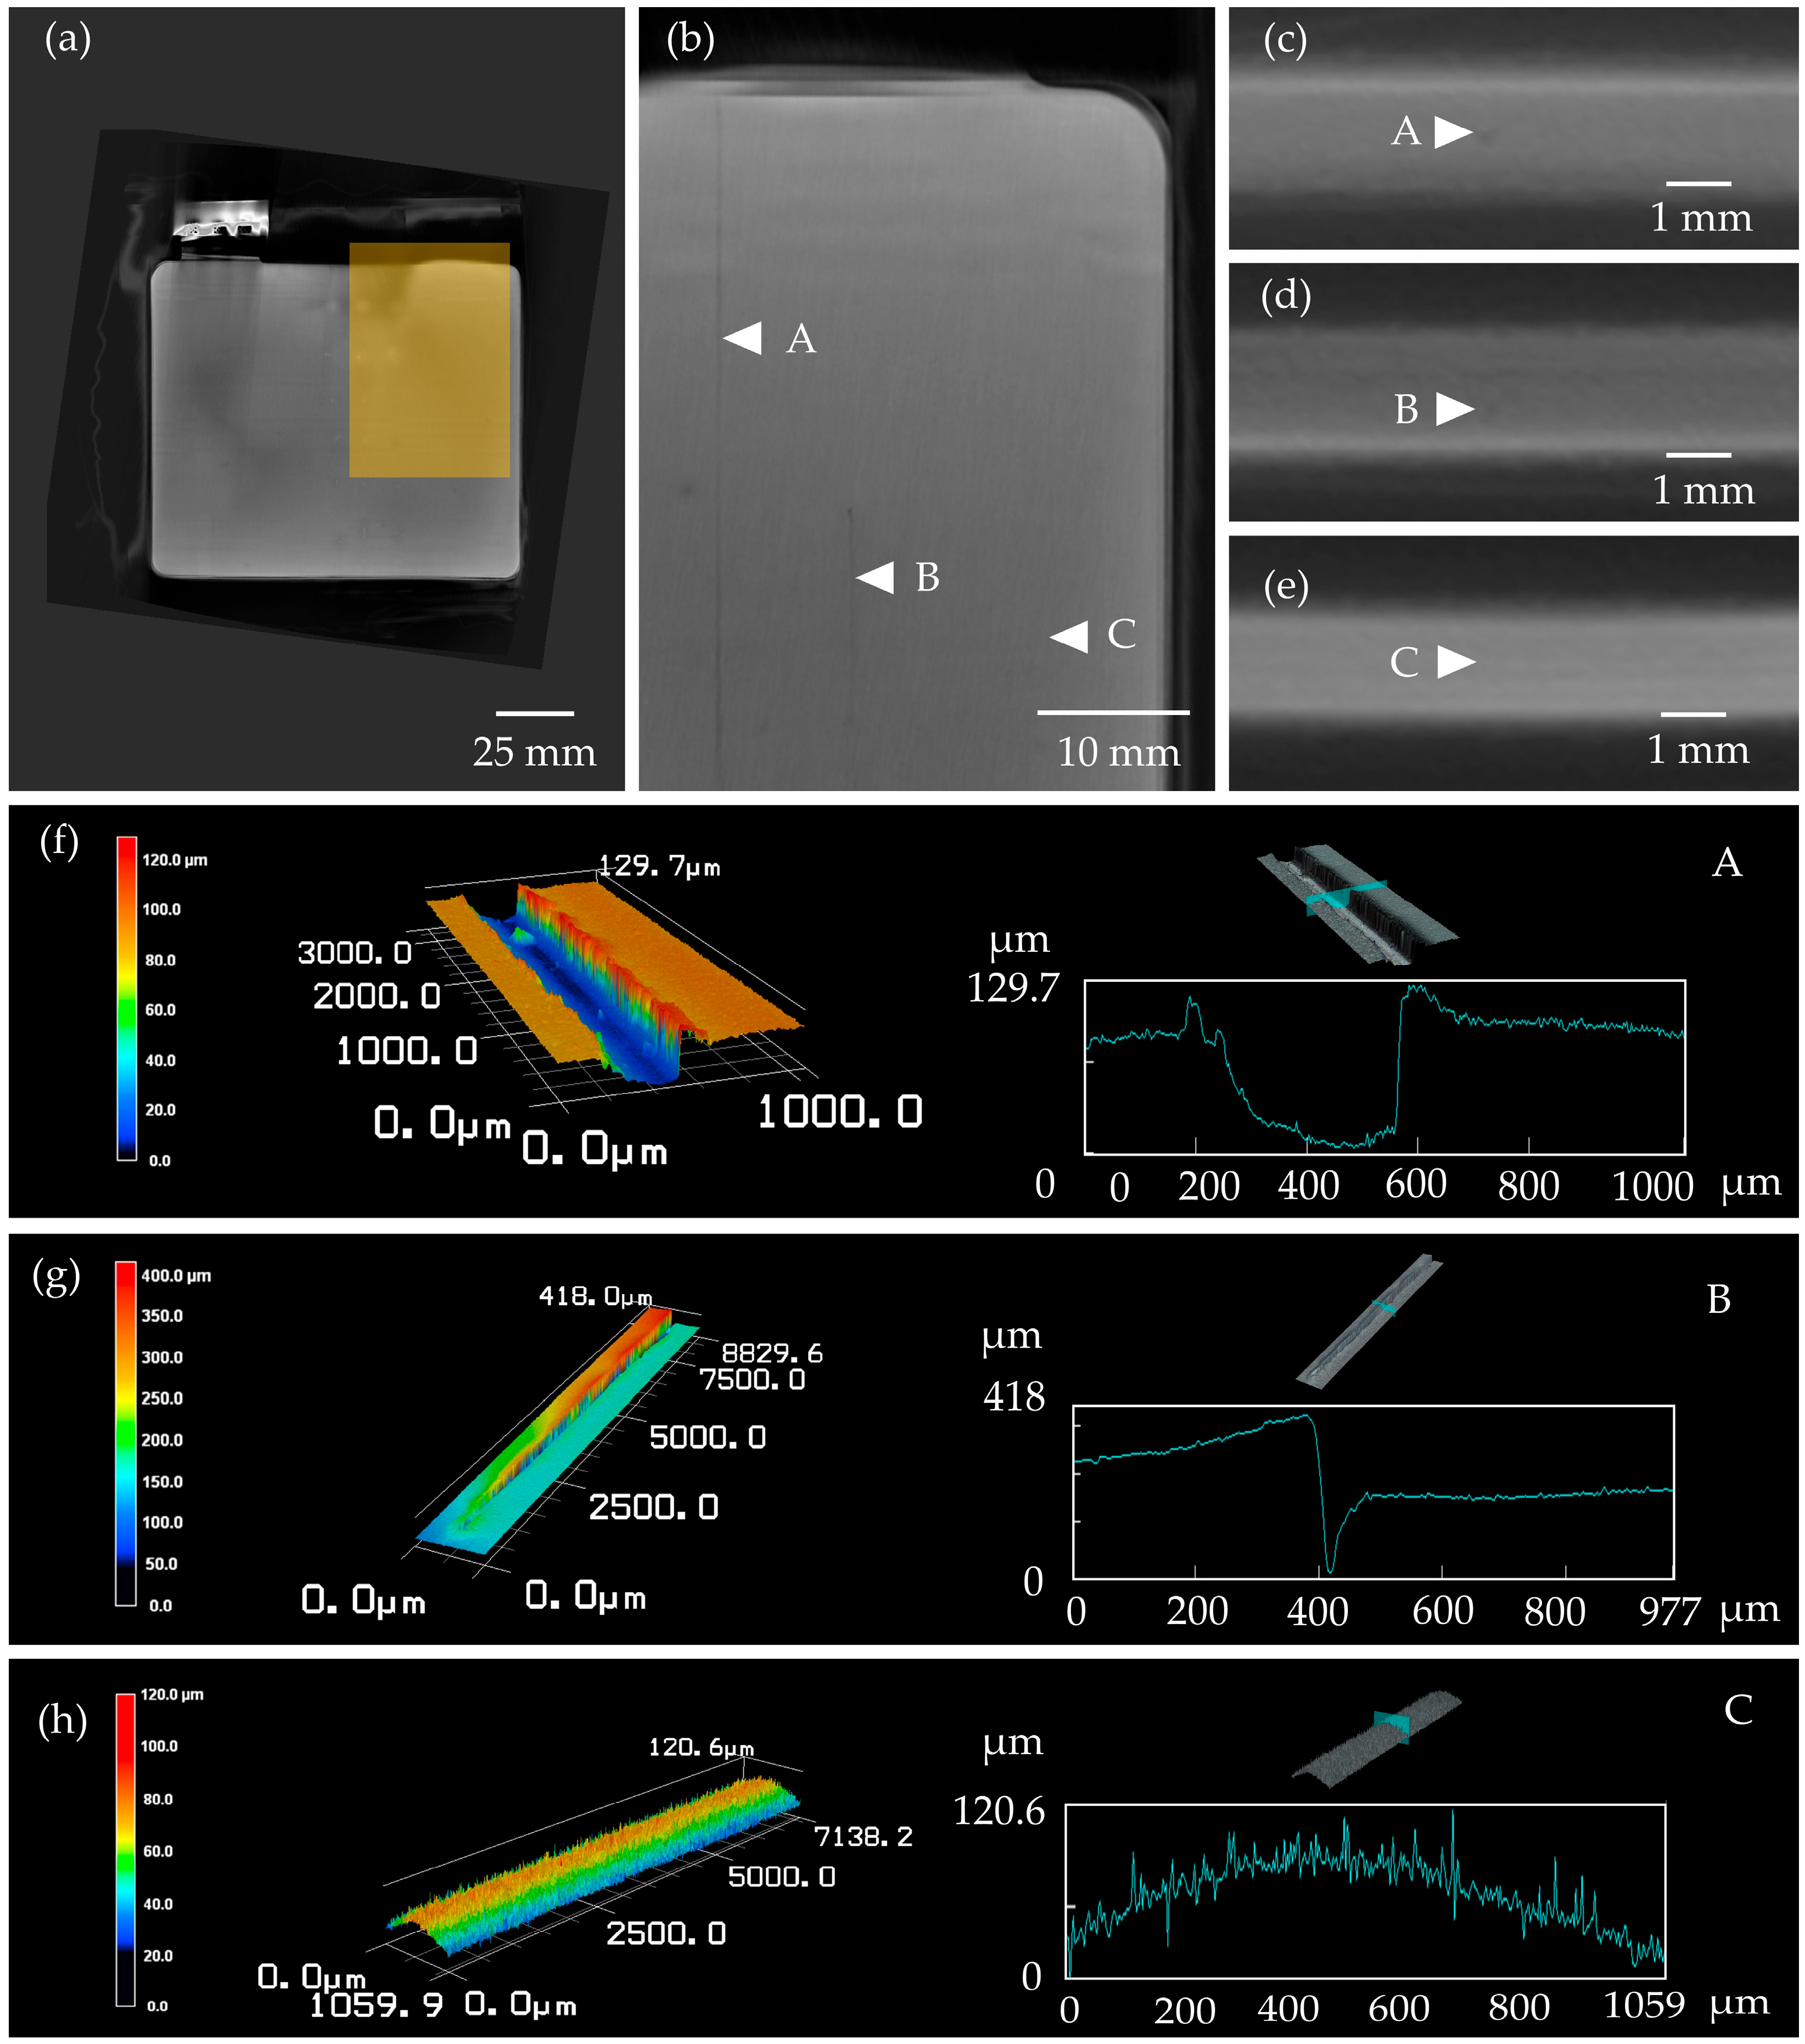
3.1. Defects on Electrode Level

A comprehensive analysis was carried out on multiple defects on the electrode level, including a fully and partially uncoated area, a scratch, a cut, a kink and metal particle contaminations.
Figure 5 shows a section of the anode that was fully decoated and a second section that was partly decoated. The edges of the uncoated stripe appear darker than the surrounding area. As a result, a contrast between the uncoated stripe and the coated area of the anode is visible. Dark edges indicate voids that result from a height difference between the coated and uncoated anode areas. The partly uncoated areas are only visible due to spallings caused by the preparation of the anode that allowed a localisation in the CT image. In the LSM image, a clear difference between the partly decoated area and the original structure of the anode is visible.
Figure 6 shows the section of the anode prepared with a scratch, a cut through both the coating and substrate, and an area subject to high bending stress resulting in a kink. While the visible defects (scratch and cut) appear darker, the bent area cannot be identified in the CT image. In the LSM measurement, the kink is visible due to its shape before being flattened out in the assembled cell. Cracks or small areas of delamination due to the bending stress are not visible with the utilised lenses (utilised lens: 50×; maximum available zoom: 250×).
In addition to defects placed on the anode as part of the study, grooves are visible during CT investigation and create a wave-like pattern (Figure 7). These are also visible during the preparation of the cell. This indicates that some minor changes in the coating (e.g., structure, thickness, homogeneity) may be detectable in the CT imaging. In contrast, other changes remain undetected (e.g., partially removed coating in areas without spallings).

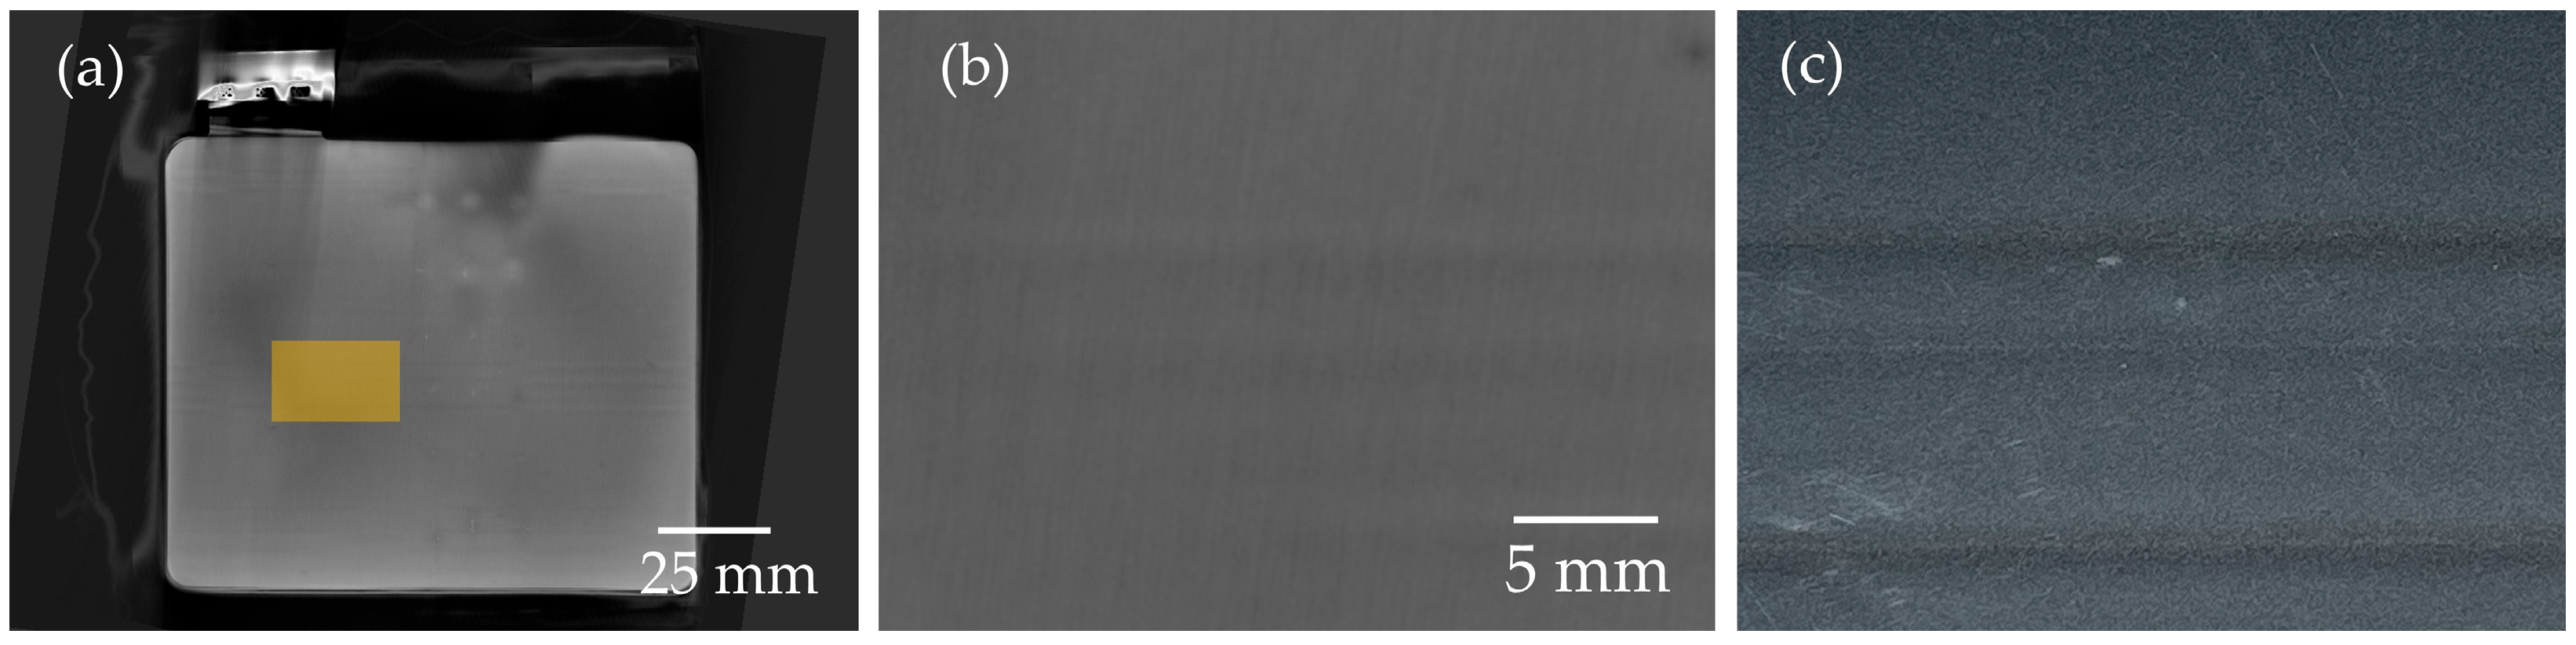
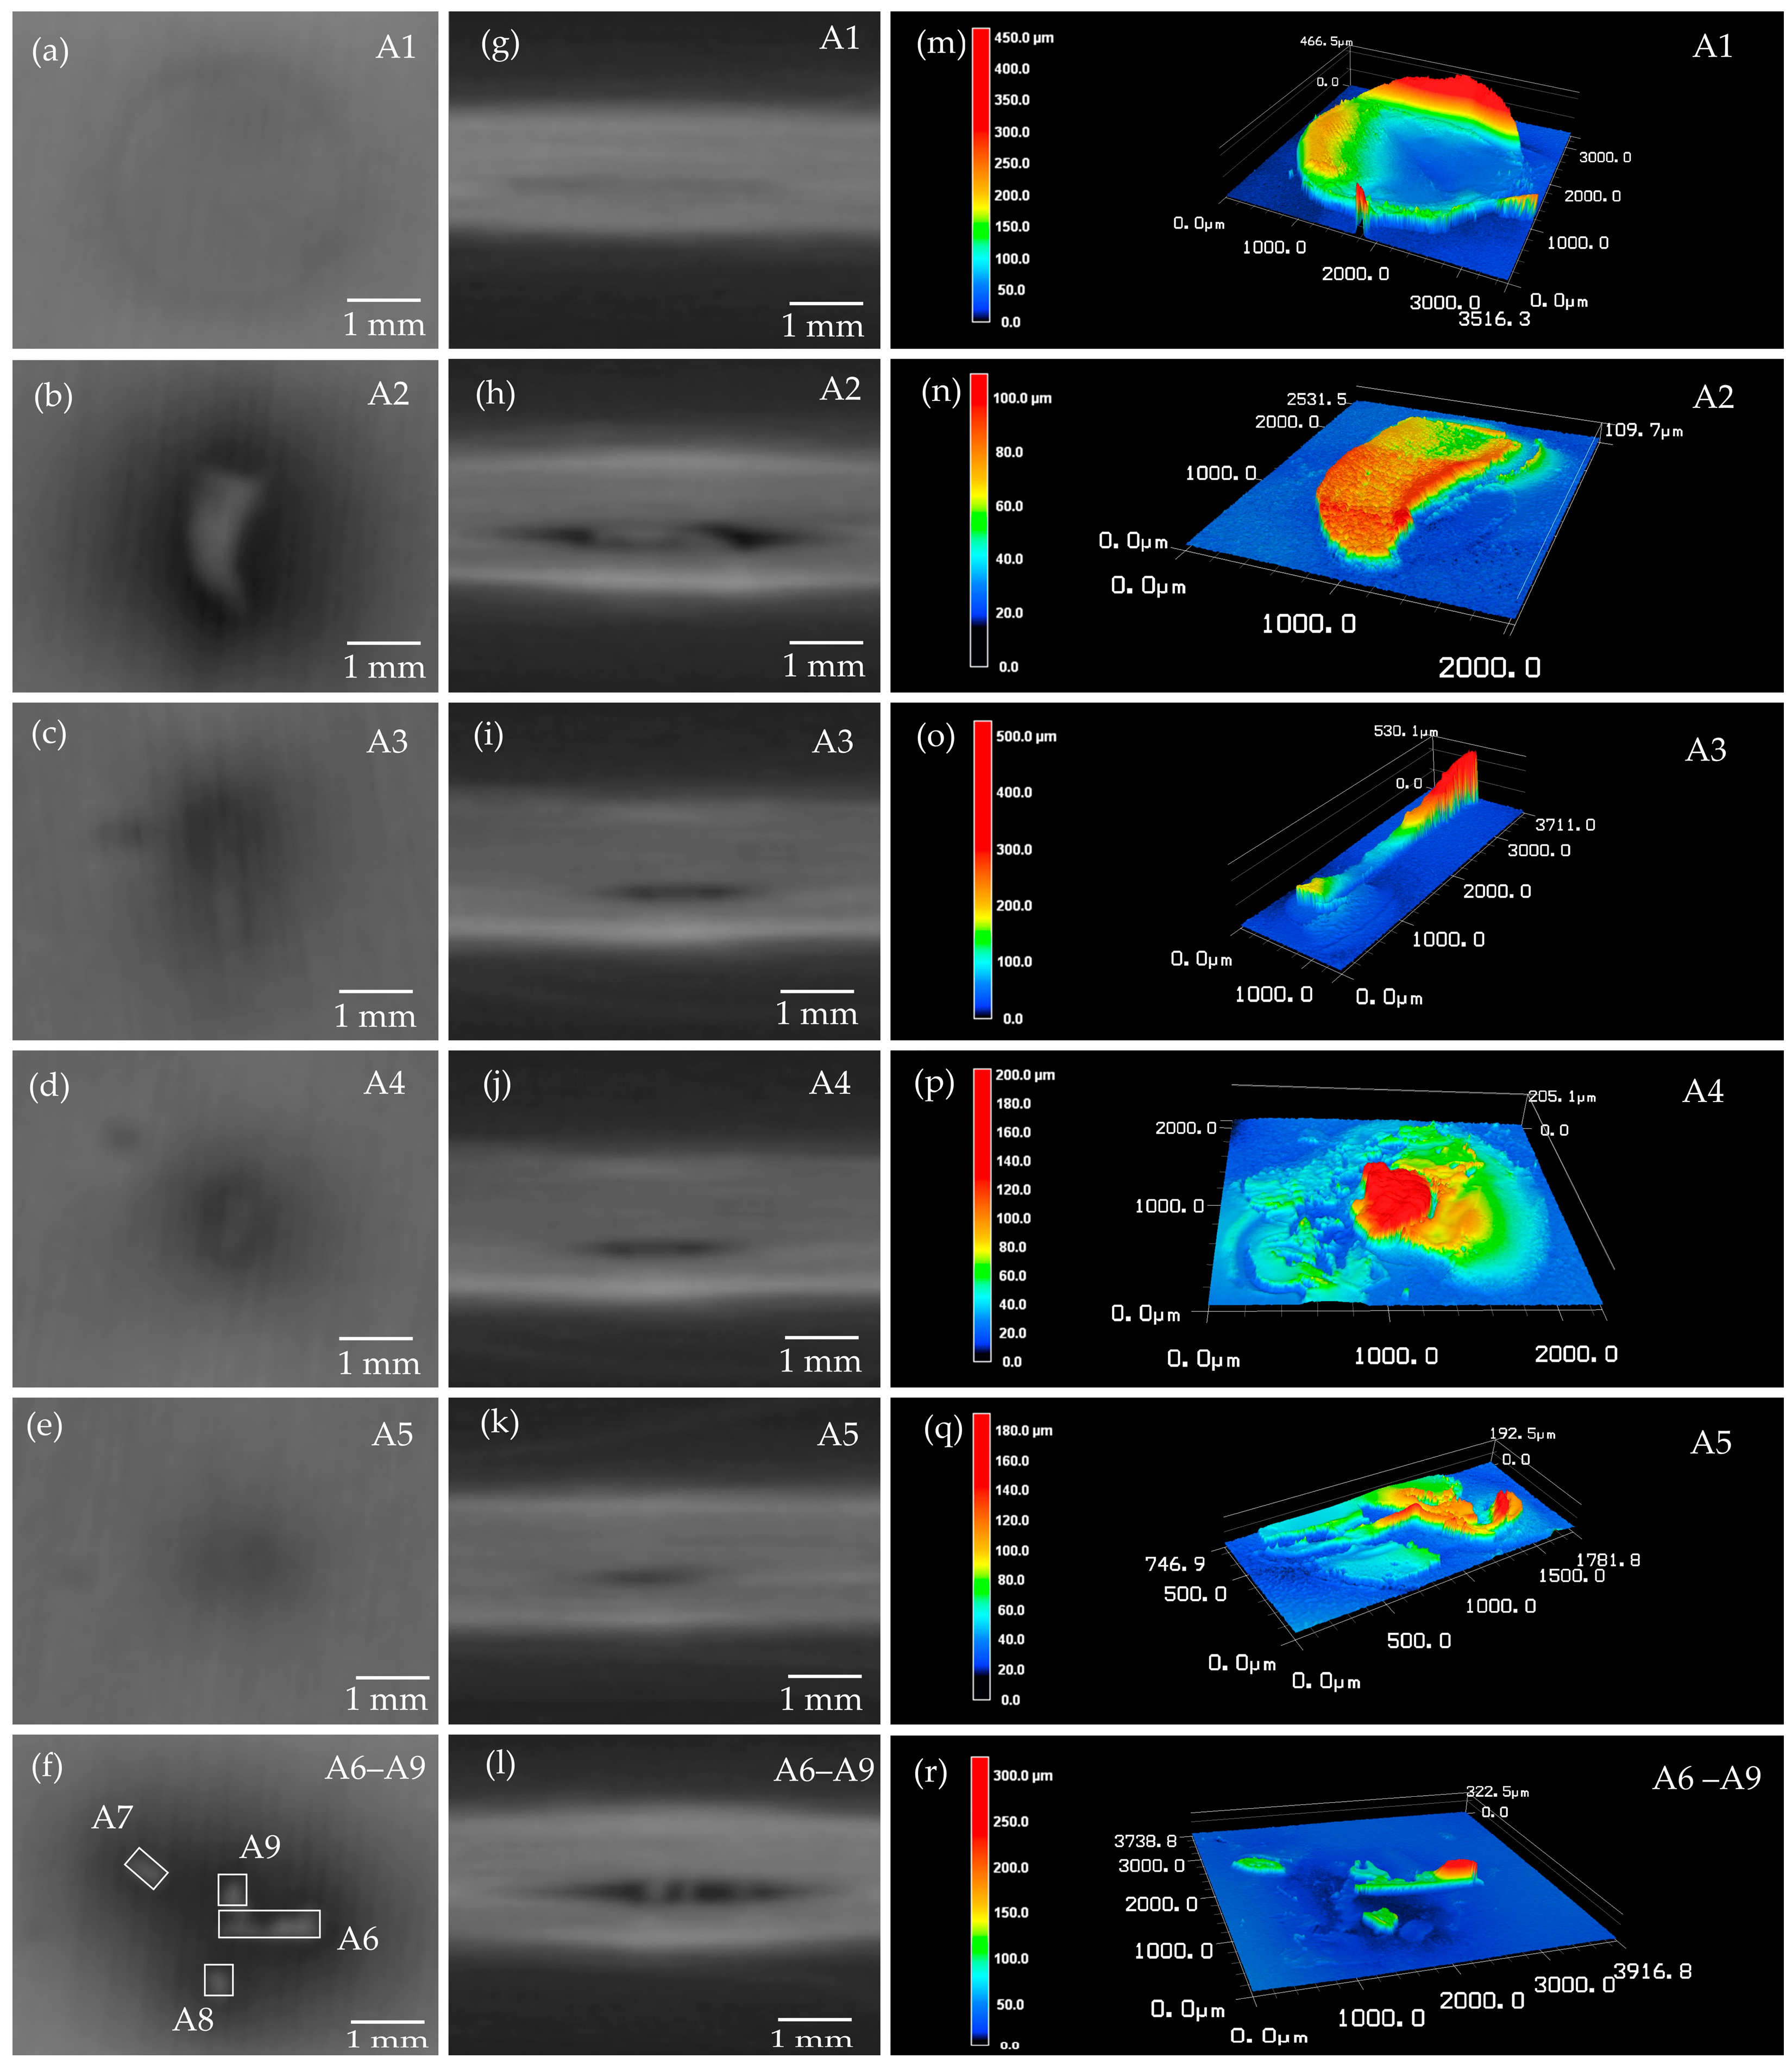
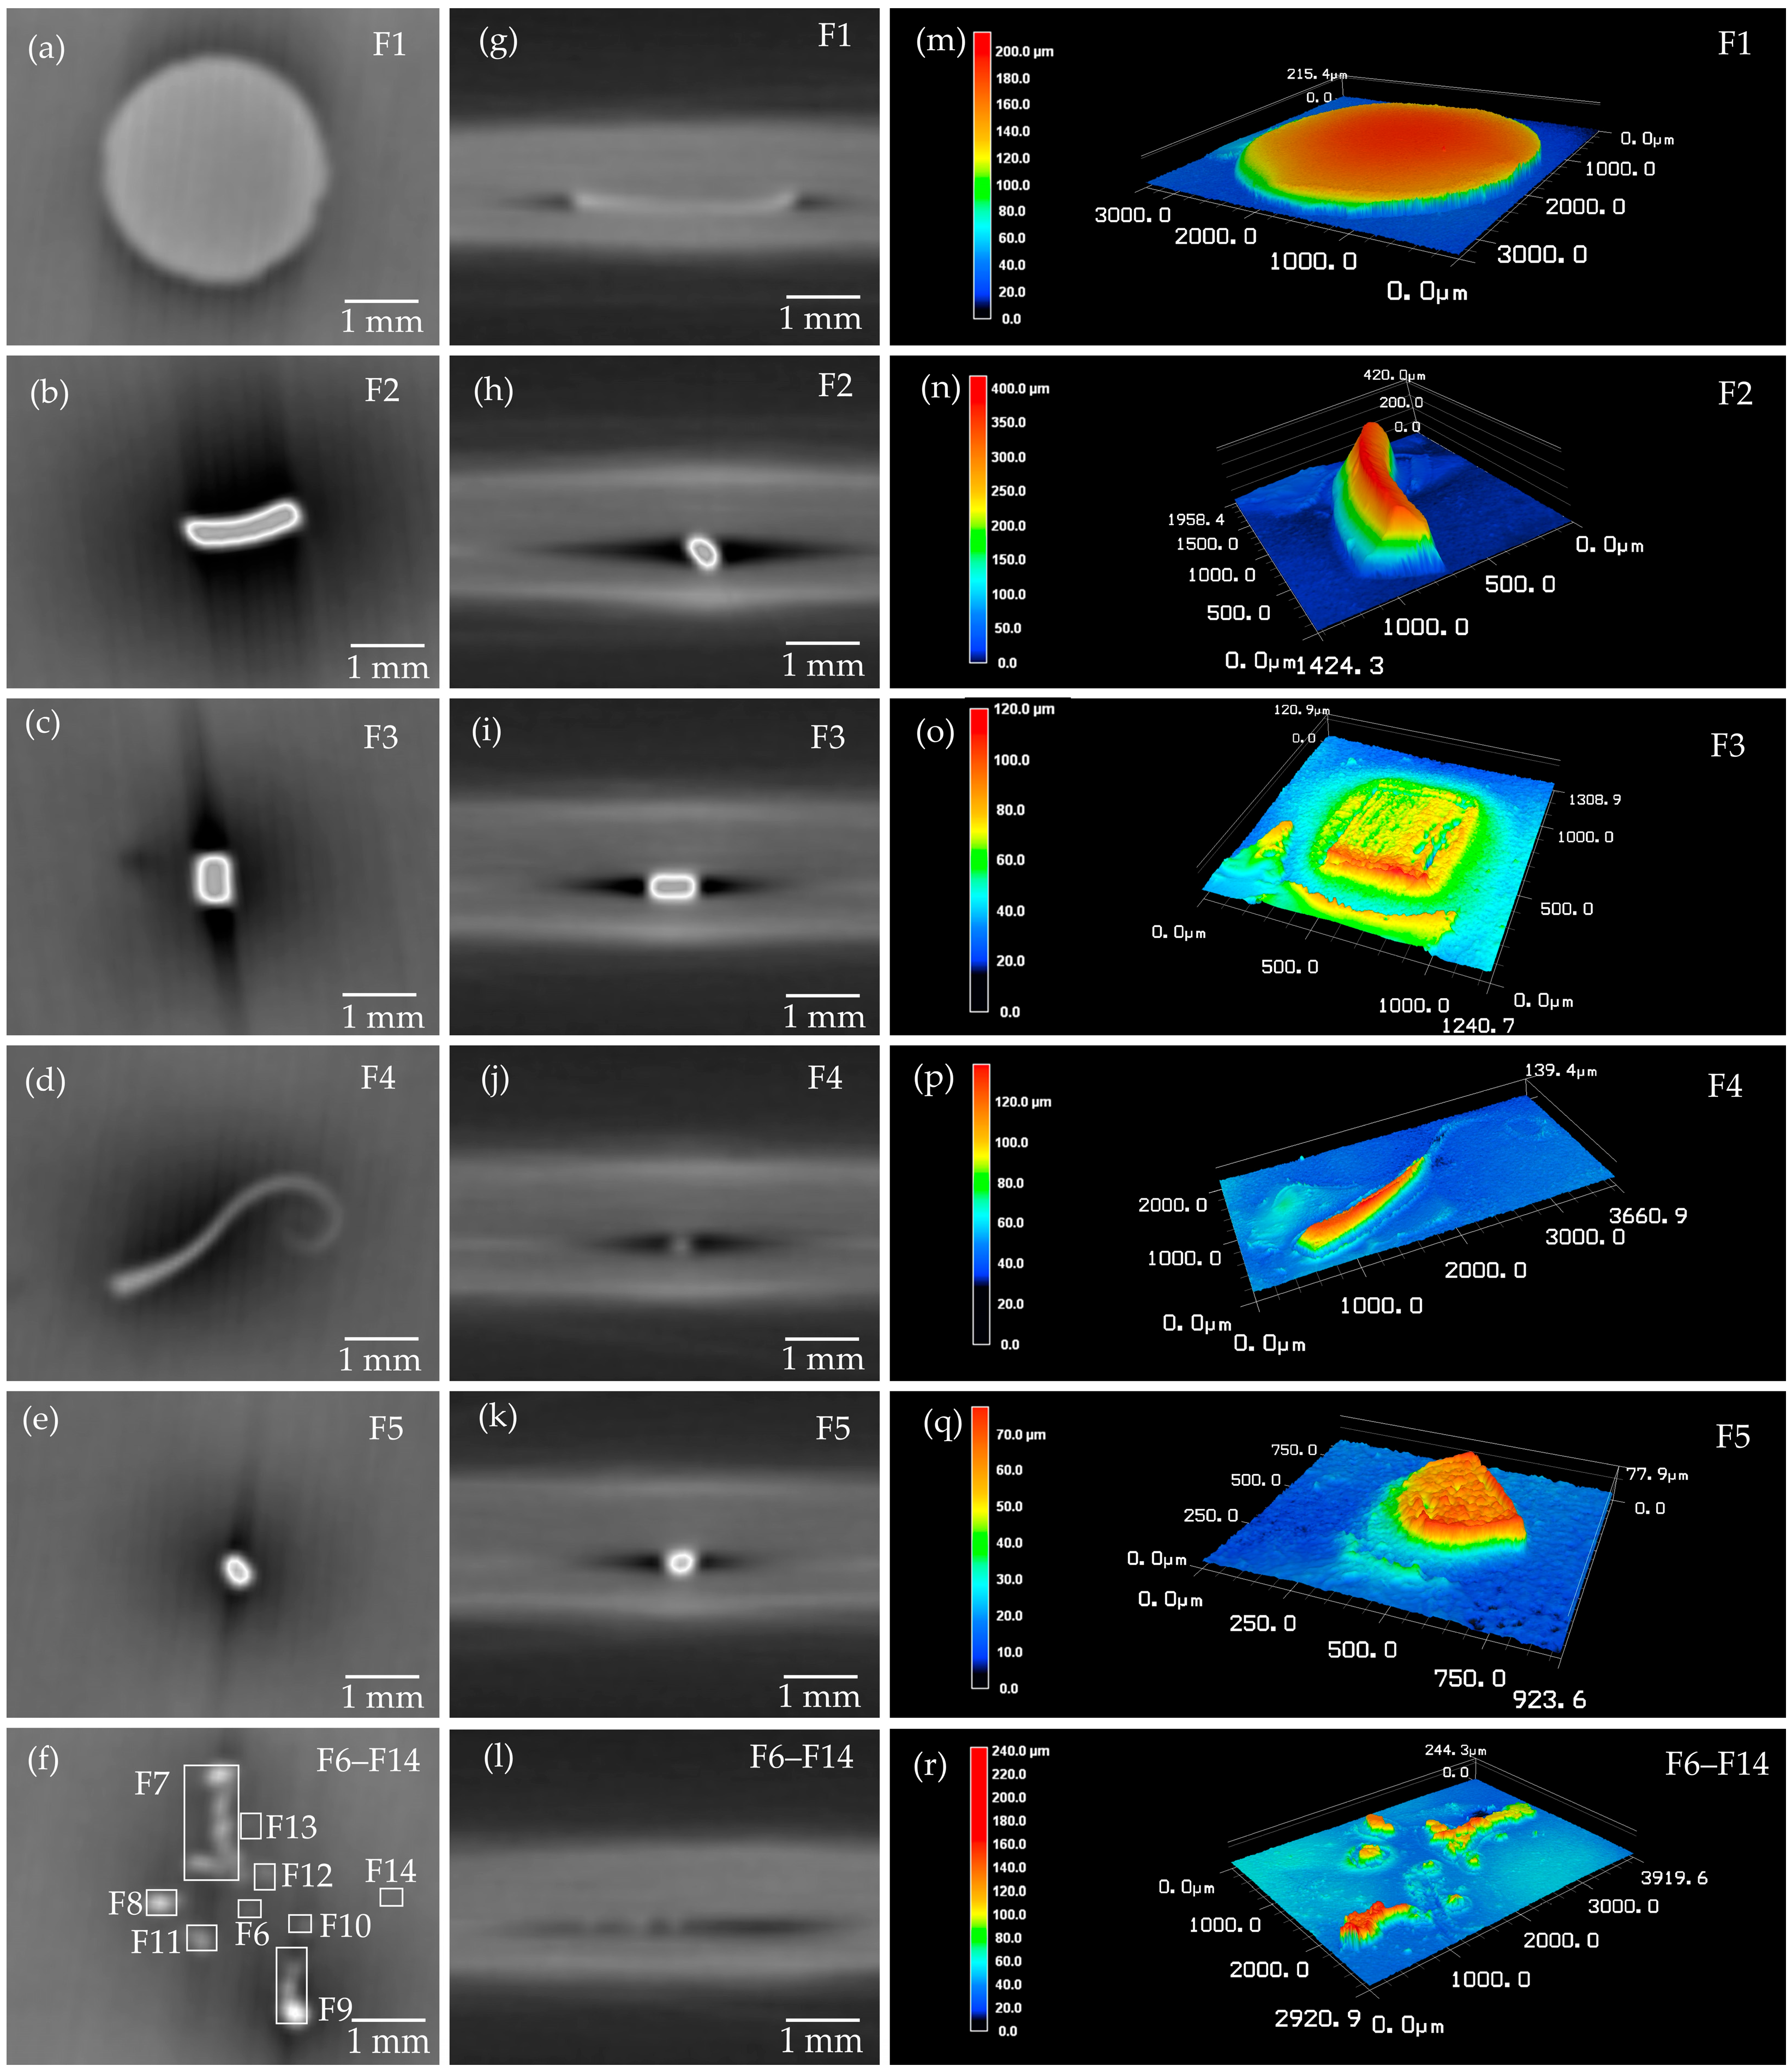
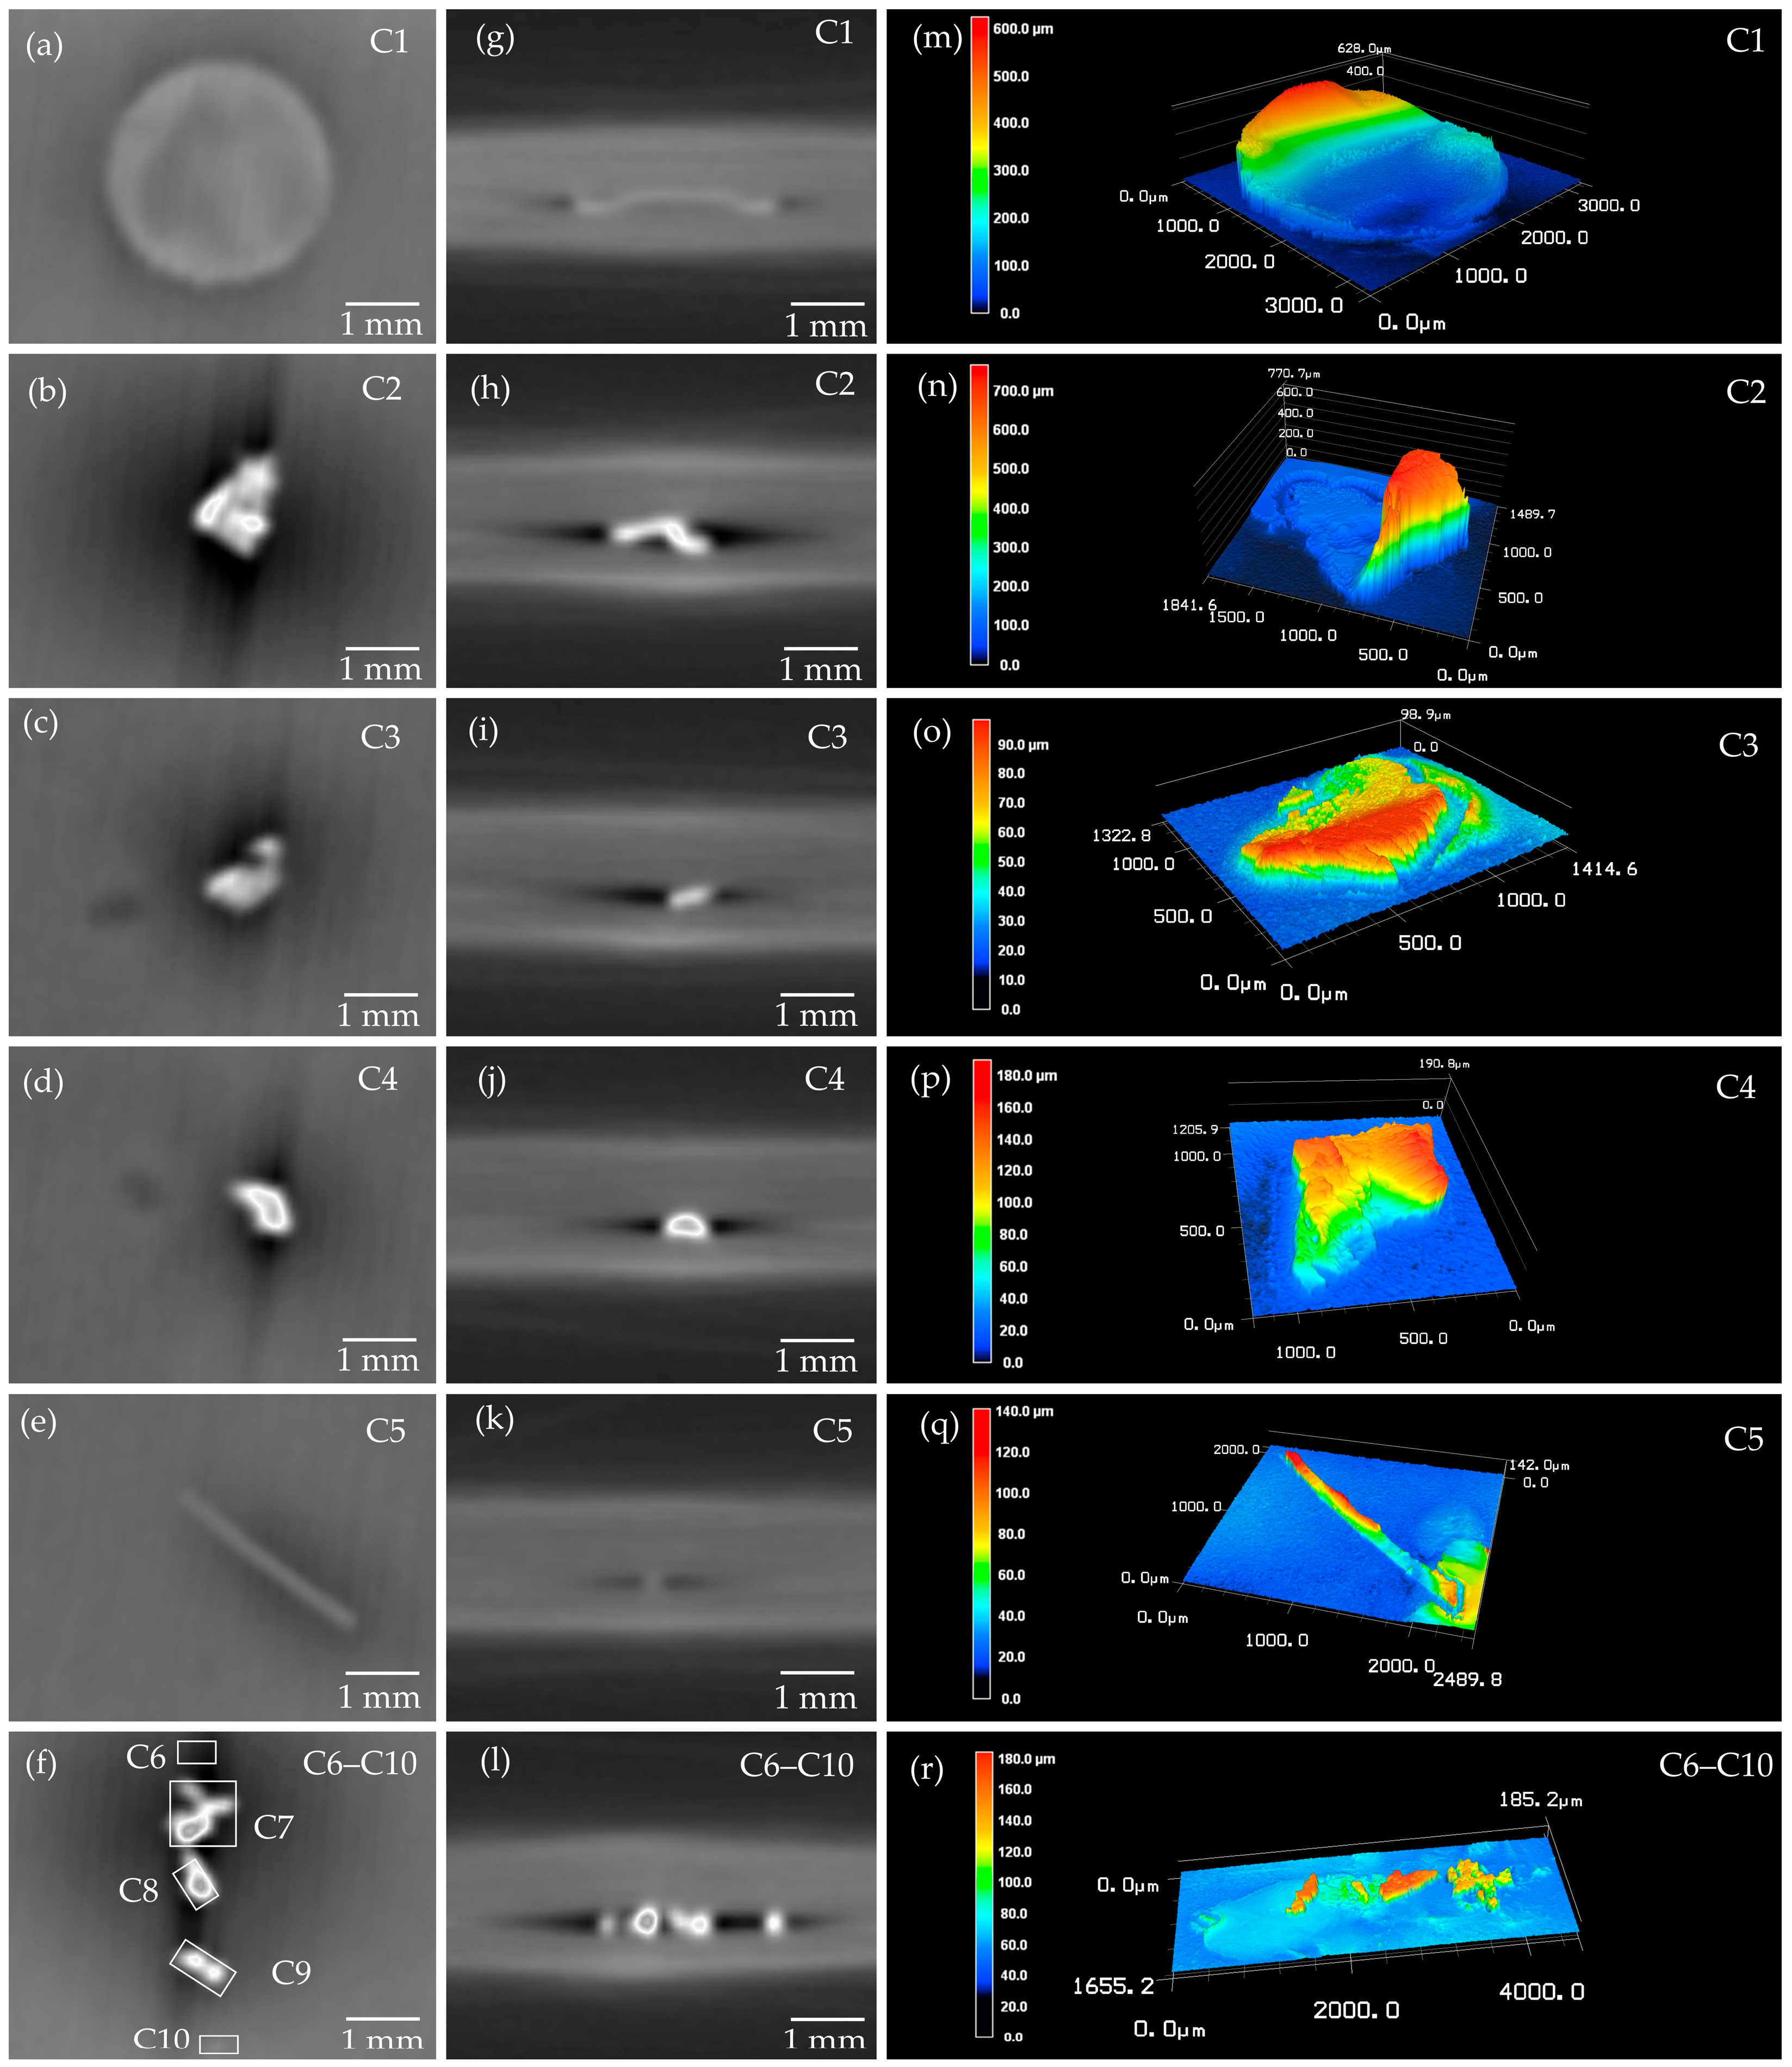
3.2. Metal-Particle Contamination on Cell Level

The cell was contaminated with aluminium, copper and iron particles of different sizes and shapes. Figure 8 shows the inserted aluminium particles.
The contrast between the particle and the cell compound is comparatively low. However, the visibility is increased by the gap between the anode and cathode created by the particle. This also contributes to the visibility of smaller particles, such as particle A8. Due to the low resolution, it is not possible to identify the exact position of the particles (layer) as a visual separation of the anode, cathode and separator is not possible.
The size of the inserted particles is listed in Table 2. To ensure comparability of the CT analysis, the contrast settings remained unchanged during the study. The iron particles are shown in Figure 9.
Compared to the aluminium particles, the visibility of iron and copper particles (Figure 10) is improved due to the higher difference in the grey value between the particle and the surrounding cell. Even if particles are small (e.g., particles F5, C8), the visibility is better compared with bigger particles made of aluminium (e.g., particle A2). Despite limitations in the resolution, copper and iron contamination are clearly visible.

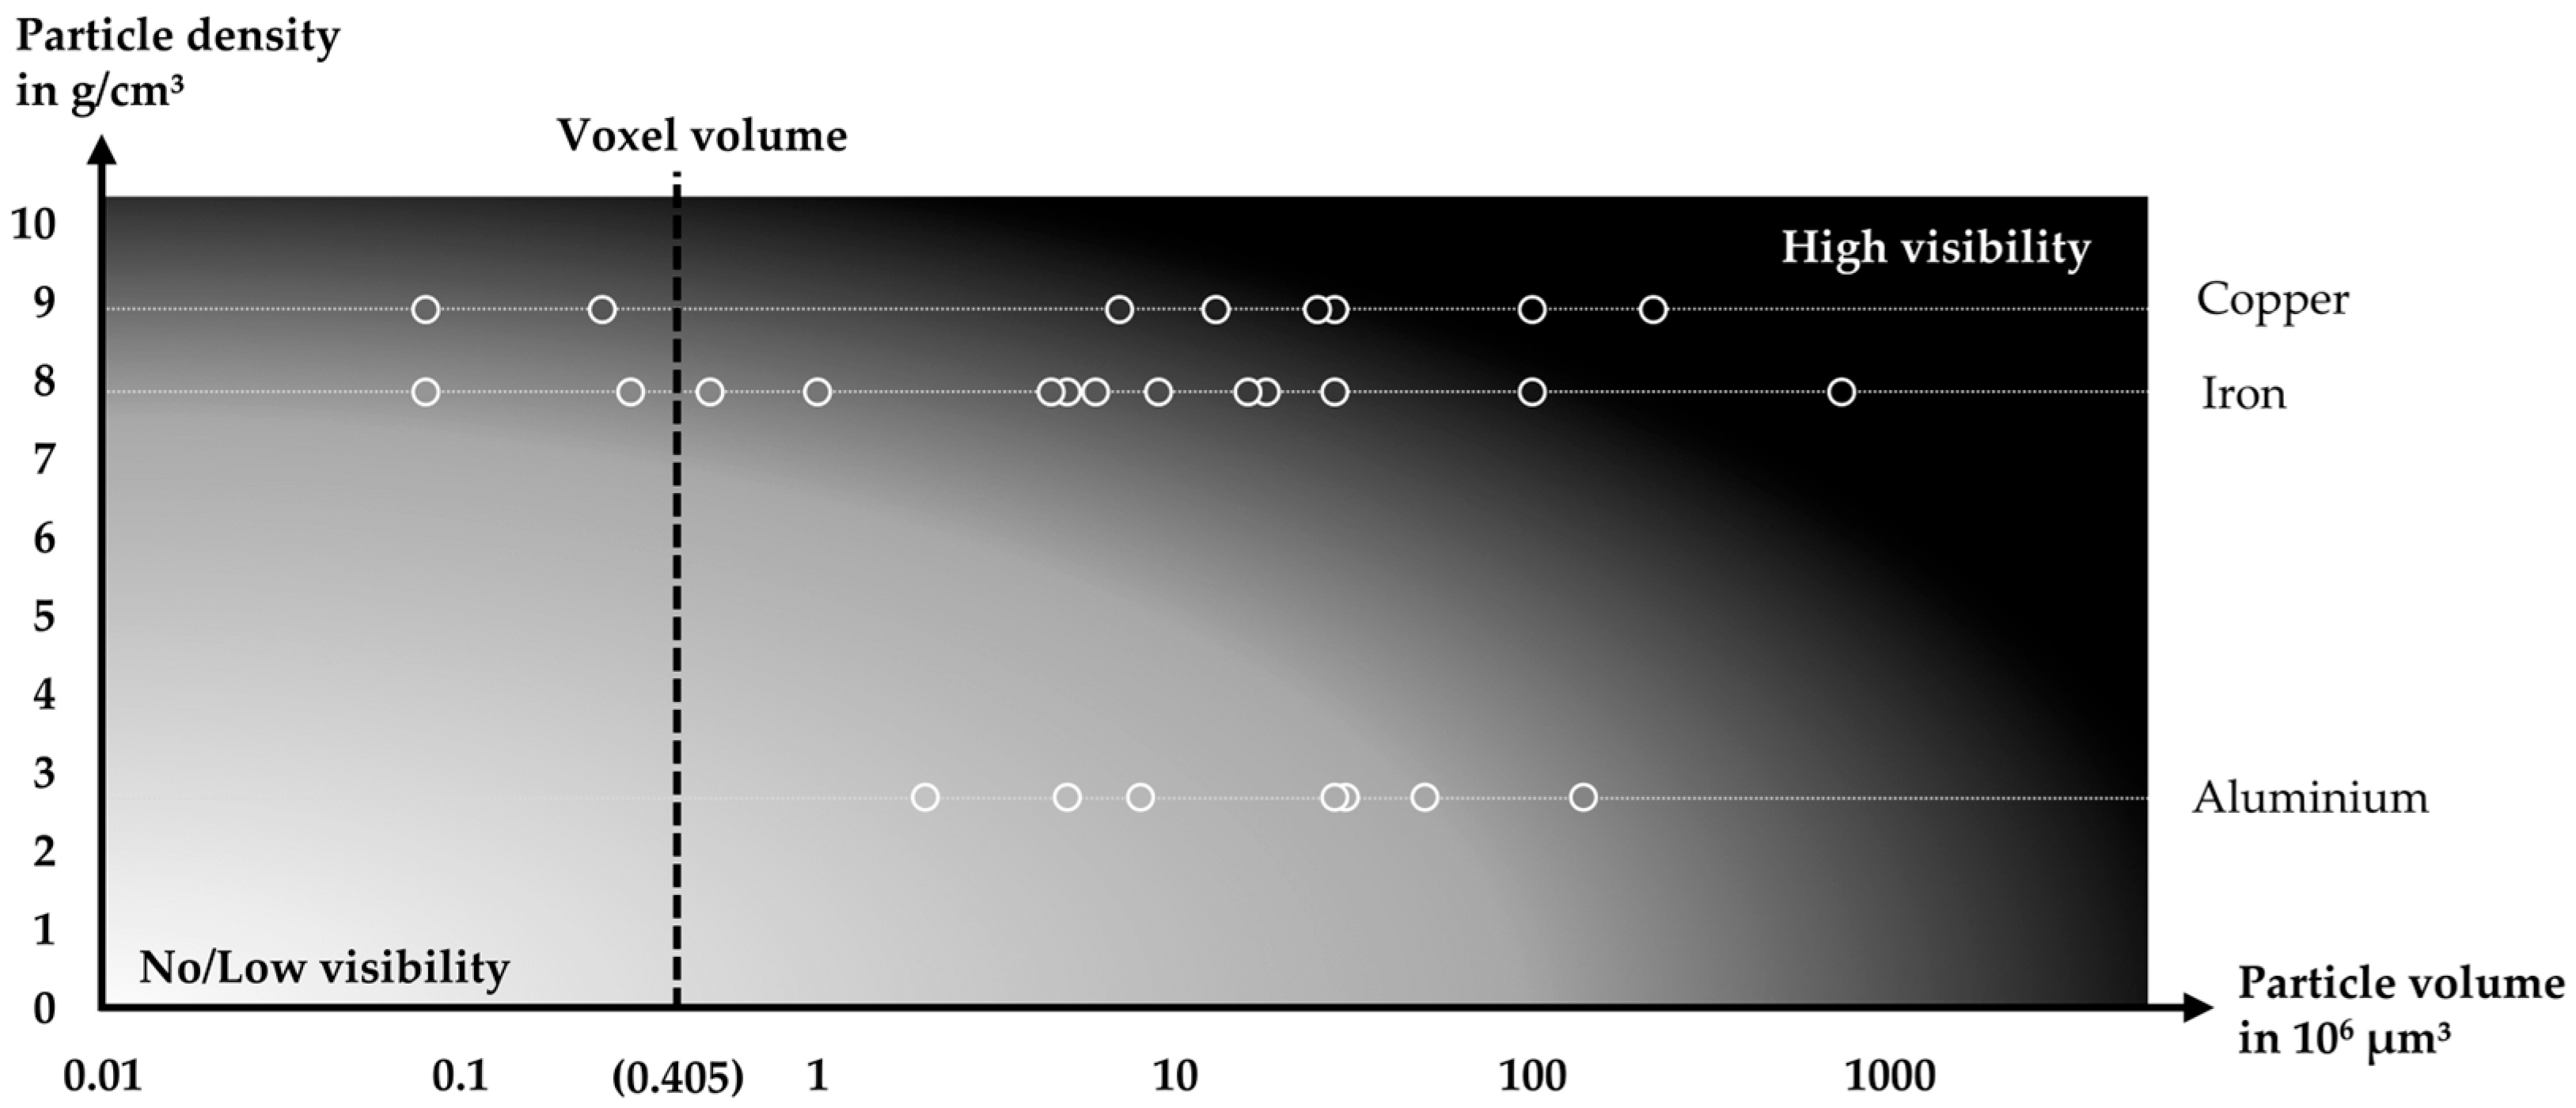
3.3. Analysis of the Potential of CT Imaging

The potential of CT imaging to aid the identification of defects depends on the defect type. Most defects can be identified and localised based on the CT images. Only the sharp-bend and partly decoated areas without spallings remained undetectable under the study conditions. An aspect that both defects had in common was that the changes regarding neither the mass and density (impact on radiation absorption) nor the geometry were high (below the CT resolution).
The impact of the resolution and density of the particles is also visible in the analysis of FMD. The visibility of iron and copper particles (Figure 11) is higher than the aluminium particles. However, even the detectability of particles with a higher density decreases if the particles are too small. In the study, this was the case if the particle volume became close to the voxel volume of the scan. The detectability of all defects was increased by the void created either by the absence of material (e.g., scratch and edges of decoated areas) or the additional material (e.g., particles). In the case of fully assembled LIBs, these voids would be filled with an electrolyte. Thus, the contrast and visibility of the analysed defects and the potential for detectability with CT imaging could be reduced. However, due to the low density of the electrolyte, the impact on the visibility was expected to be low.
The detection of defects below the resolution (74 μm) was not possible unless the defect had a very high density in comparison to the surrounding material. However, even the detection of copper and iron particles below this resolution was hardly possible (as shown in Figure 9, Figure 10 and Figure 11). If the defect had a low density, such as the aluminium particle, the detectability was further reduced and dependent on the created void. The scratch (width of 400 μm) was still visible due to the created void; therefore, the minimum detectable defect size for a scratch lay between 74 μm and 400 μm (for the used CT scanner). Defects in a range of several micrometres or in the sub-micrometre range, such as intragranular particle cracking because of a sharp bend of the anode, are far below the resolution of the CT scan used in the study.
Improvement in the resolution of a CT scan with a given CT scanning set-up requires the movement of the probe towards the X-ray source. As the movement is limited by a minimum distance to allow the rotation of the probe, detecting defects becomes even more challenging for large prismatic and pouch cells e.g., for automotive applications. These require a larger distance between the rotation centre and the X-ray source. LIBs that need less space for rotation, such as cylindrical battery cells, allow a higher CT scan resolution with comparable CT scanning devices [59]. This could enable the detection of smaller defects without damaging the LIB. Smaller defects could also potentially be detected if only sections or fractions of the LIB were analysed. This would, however, require damaging the LIB and is, therefore, out of the scope of this study.

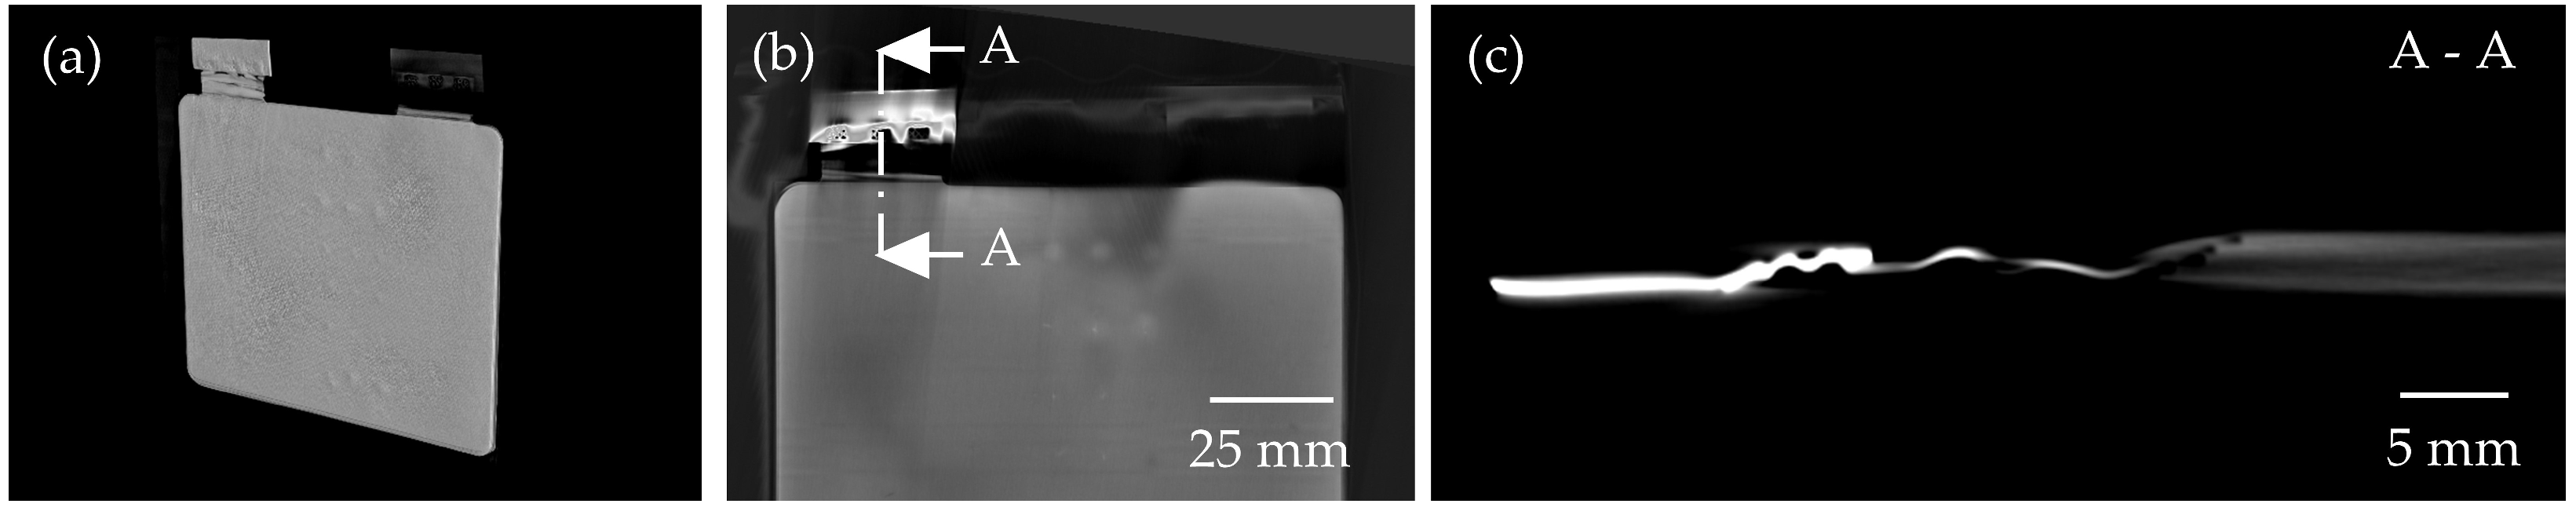
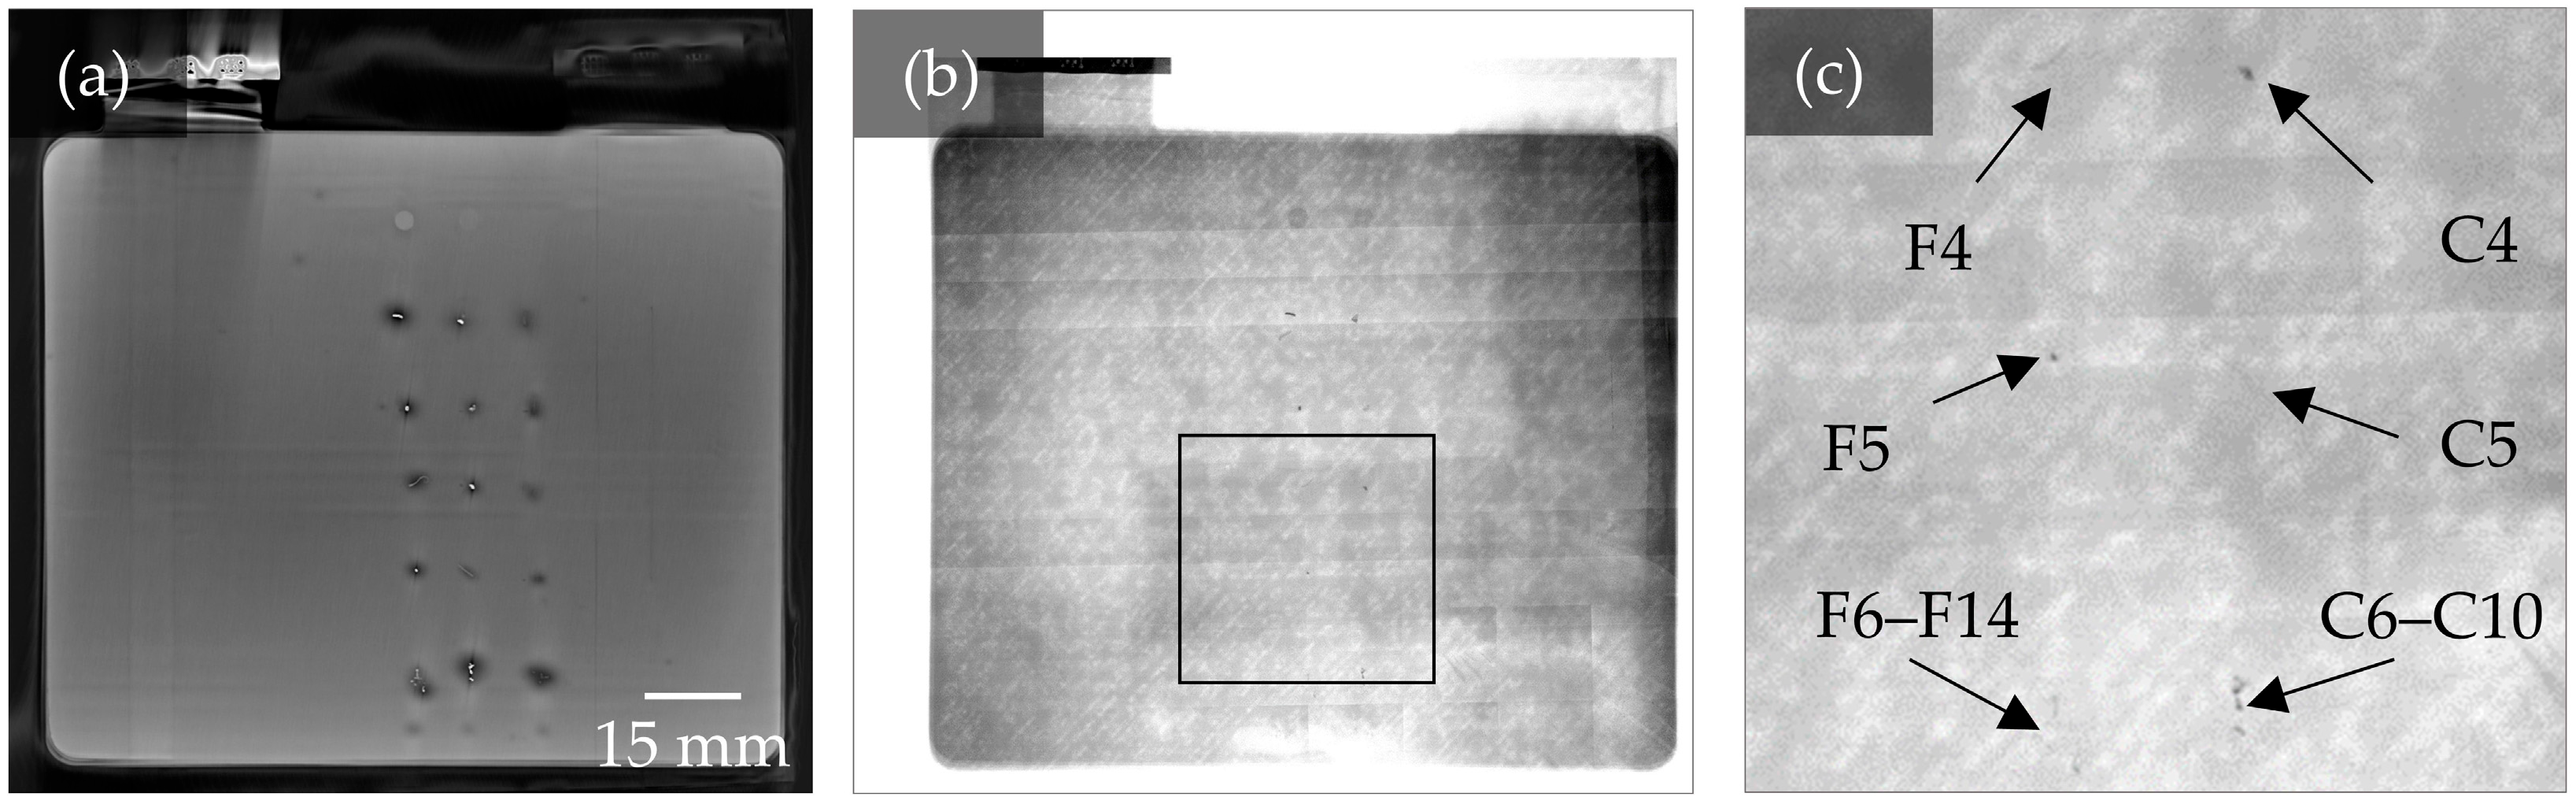
3.4. Comparison of 3D CT Imaging and 2D X-Ray Image

A CT inspection is based on multiple X-ray images. As a result, the probe inspection time usually exceeds the acceptable time for an inline inspection of the cells. Figure 12 compares a slice of the 3D CT image and a single 2D X-ray image of the cell.
The 2D X-ray image shows higher image noise than the 3D CT slice. A possible explanation is that the CT device was not optimised for single 2D X-ray imaging. Copper and iron particles remain visible in the 2D X-ray image. Other defects could not be identified within the study but could be visible in an optimised X-ray imaging setup. Also, it is not possible to localise the particles on a specific electrode, as depth information is not captured in 2D X-ray imaging. Therefore, 3D CT shows a higher potential for in-depth analysis that is not time crucial, whereas 2D X-ray shows a higher potential for specific time-crucial applications.

4. Conclusions

This work focused on possible methods to detect inhomogeneities within LIBs. Due to the literature review and the presented difficulties of state-of-the-art electrical methods to identify and localise specific inhomogeneities, X-ray-based methods were further investigated. Five defects were chosen and placed on an anode of a multilayer pouch cell without an electrolyte. CT imaging was assessed by analysing the chosen defect’s visibility, and was compared with LSM imaging. Furthermore, CT imaging results were compared with 2D X-ray images from the same CT inspection setup.
The results showed that almost all defects on the manipulated anode were visible in CT imaging. This included entirely decoated areas, a scratch through the active material, and a cut through the anode and metal particles. A partly decoated stripe was only visible in areas with spallings. An unfolded kink after a sharp bend was not visible. In addition to the defects intentionally placed on the anode by the authors, grooves were visible within the anode coating. The visibility of particles was highly dependent on the material and size of the inserted particles and the void created by the particles. The visibility of copper (theoretical density of 8.92 g/cm3) and iron (theoretical density of 7.87 g/cm3) particles was better than the aluminium particles with a theoretical density of 2.70 g/cm3. Replacing aluminium with steel parts could be considered in battery-cell production machinery if a contamination risk is given. If the shape of the particle creates a large void, visibility in CT imaging is improved. In 2D X-ray, the copper and iron particles could still be detected. Localising the particle on a specific electrode and identifying other defects with the used 2D X-ray setup was not possible. In general, the visibility of defects below the resolution of the CT scan is only possible if the defect has a very high density such as copper and iron FMD.
The authors suggest further research regarding the analysis of the inhomogeneities using imaging setups specifically designed for 2D X-ray imaging and the transferability of X-ray-based methods to other battery formats, sizes and cases, as well as fully assembled cells with an electrolyte. For an industrial implementation of CT detection, an economic analysis with other detection methods, as well as the automation of CT particle detection, is recommended.

Author Contributions

Conceptualisation, D.E. and P.-M.L.; methodology, D.E. and P.-M.L.; investigation D.E. and P.-M.L.; writing—original draft preparation, D.E. and P.-M.L.; visualisation, D.E. and P.-M.L.; writing—review and editing, D.E., P.-M.L., C.T. and J.K.; supervision, C.T. and J.K.; resources, C.T. and J.K.; funding acquisition, C.T. and J.K. All authors have read and agreed to the published version of the manuscript.

Funding

This research was funded by Deutsche Forschungsgemeinschaft (DFG, German Research Foundation)—461805740. We acknowledge support by the German Research Foundation and the Open Access Publication Fund of TU Berlin.

Data Availability Statement

Not applicable.

Acknowledgments

The authors would like to thank HELLA GmbH & Co. KGaA and all colleagues involved for their support.

Conflicts of Interest

The authors declare no conflict of interest. The funders had no role in the design of the study; in the collection, analyses, or interpretation of data; in the writing of the manuscript; or in the decision to publish the results.

References

  1. Hu, S.; Xu, J.; Lv, M.; Zhu, Z.; Jia, J.; Li, W.; Weng, W. The Application of Industrial CT Detection Technology in Defects inspection of lithium Ion Battery. J. Phys. Conf. Ser. 2021, 2083, 32075. [Google Scholar] [CrossRef]
  2. Lamb, J.; Orendorff, C.J. Evaluation of mechanical abuse techniques in lithium ion batteries. J. Power Sources 2014, 247, 189–196. [Google Scholar] [CrossRef]
  3. Waldmann, T.; Gorse, S.; Samtleben, T.; Schneider, G.; Knoblauch, V.; Wohlfahrt-Mehrens, M. A Mechanical Aging Mechanism in Lithium-Ion Batteries. J. Electrochem. Soc. 2014, 161, A1742–A1747. [Google Scholar] [CrossRef]
  4. Yufit, V.; Shearing, P.; Hamilton, R.W.; Lee, P.D.; Wu, M.; Brandon, N.P. Investigation of lithium-ion polymer battery cell failure using X-ray computed tomography. Electrochem. Commun. 2011, 13, 608–610. [Google Scholar] [CrossRef]
  5. Villarraga-Gómez, H.; Begun, D.L.; Bhattad, P.; Mo, K.; Norouzi Rad, M.; White, R.T.; Kelly, S.T. Assessing rechargeable batteries with 3D X-ray microscopy, computed tomography, and nanotomography. Nondestruct. Test. Eval. 2022, 37, 519–535. [Google Scholar] [CrossRef]
  6. De Chiffre, L.; Carmignato, S.; Kruth, J.-P.; Schmitt, R.; Weckenmann, A. Industrial applications of computed tomography. CIRP Ann. 2014, 63, 655–677. [Google Scholar] [CrossRef]
  7. Yao, X.-Y.; Pecht, M.G. Tab Design and Failures in Cylindrical Li-ion Batteries. IEEE Access 2019, 7, 24082–24095. [Google Scholar] [CrossRef]
  8. Finegan, D.P.; Scheel, M.; Robinson, J.B.; Tjaden, B.; Hunt, I.; Mason, T.J.; Millichamp, J.; Di Michiel, M.; Offer, G.J.; Hinds, G.; et al. In-operando high-speed tomography of lithium-ion batteries during thermal runaway. Nat. Commun. 2015, 6, 6924. [Google Scholar] [CrossRef]
  9. Ziesche, R.F.; Arlt, T.; Finegan, D.P.; Heenan, T.M.M.; Tengattini, A.; Baum, D.; Kardjilov, N.; Markötter, H.; Manke, I.; Kockelmann, W.; et al. 4D imaging of lithium-batteries using correlative neutron and X-ray tomography with a virtual unrolling technique. Nat. Commun. 2020, 11, 777. [Google Scholar] [CrossRef]
  10. Wu, Y.; Saxena, S.; Xing, Y.; Wang, Y.; Li, C.; Yung, W.; Pecht, M. Analysis of Manufacturing-Induced Defects and Structural Deformations in Lithium-Ion Batteries Using Computed Tomography. Energies 2018, 11, 925. [Google Scholar] [CrossRef]
  11. Kruth, J.P.; Bartscher, M.; Carmignato, S.; Schmitt, R.; de Chiffre, L.; Weckenmann, A. Computed tomography for dimensional metrology. CIRP Ann. 2011, 60, 821–842. [Google Scholar] [CrossRef]
  12. Ank, M.; Stock, S.; Wassiliadis, N.; Burger, T.; Daub, R.; Lienkamp, M. Influence analysis of production defects of lithium-ion cells using single-cell and multi-cell characterization. J. Energy Storage 2023, 62, 106938. [Google Scholar] [CrossRef]
  13. David, L.; Ruther, R.E.; Mohanty, D.; Meyer, H.M., III; Sheng, Y.; Kalnaus, S.; Daniel, C.; Wood, D.L., III. Identifying degradation mechanisms in lithium-ion batteries with coating defects at the cathode. Appl. Energy 2018, 231, 446–455. [Google Scholar] [CrossRef]
  14. Harris, S.J.; Lu, P. Effects of Inhomogeneities—Nanoscale to Mesoscale—On the Durability of Li-Ion Batteries. J. Phys. Chem. C 2013, 117, 6481–6492. [Google Scholar] [CrossRef]
  15. Qian, G.; Monaco, F.; Meng, D.; Lee, S.-J.; Zan, G.; Li, J.; Karpov, D.; Gul, S.; Vine, D.; Stripe, B.; et al. The role of structural defects in commercial lithium-ion batteries. Cell Rep. Phys. Sci. 2021, 2, 100554. [Google Scholar] [CrossRef]
  16. Kehrer, M.; Locke, M.; Offermanns, C.; Heimes, H.; Kampker, A. Analysis of Possible Reductions of Rejects in Battery Cell Production during Switch-On and Operating Processes. Energy Technol. 2021, 9, 2001113. [Google Scholar] [CrossRef]
  17. Gitis, A. Flaw Detection in the Coating Process of Lithium-Ion Battery Electrodes with Acoustic Guided Waves; RWTH Aachen University: Aachen, Germany, 2017. [Google Scholar]
  18. Mohanty, D.; Li, J.; Born, R.; Maxey, L.C.; Dinwiddie, R.B.; Daniel, C.; Wood, I.D.L. Non-destructive evaluation of slot-die-coated lithium secondary battery electrodes by in-line laser caliper and IR thermography methods. Anal. Methods 2014, 6, 674–683. [Google Scholar] [CrossRef]
  19. Han, X.; Xia, S.; Cao, J.; Wang, C.; Chen, M. Effect of Humidity on Properties of Lithium-ion Batteries. Int. J. Electrochem. Sci. 2021, 16, 210554. [Google Scholar] [CrossRef]
  20. Kok, M.D.R.; Robinson, J.B.; Weaving, J.S.; Jnawali, A.; Pham, M.; Iacoviello, F.; Brett, D.J.L.; Shearing, P.R. Virtual unrolling of spirally-wound lithium-ion cells for correlative degradation studies and predictive fault detection. Sustain. Energy Fuels 2019, 3, 2972–2976. [Google Scholar] [CrossRef]
  21. Yang, Y.; Liu, E.; Yan, X.; Ma, C.; Wen, W.; Liao, X.-Z.; Ma, Z.-F. Influence of Structural Imperfection on Electrochemical Behavior of Prussian Blue Cathode Materials for Sodium Ion Batteries. J. Electrochem. Soc. 2016, 163, A2117–A2123. [Google Scholar] [CrossRef]
  22. Du Baret de Limé, A.; Lein, T.; Maletti, S.; Schmal, K.; Reuber, S.; Heubner, C.; Michaelis, A. Impact of Electrode Defects on Battery Cell Performance: A Review. Batter. Supercaps 2022, 5, e202200239. [Google Scholar] [CrossRef]
  23. Mühlbauer, M.J.; Petz, D.; Baran, V.; Dolotko, O.; Hofmann, M.; Kostecki, R.; Senyshyn, A. Inhomogeneous distribution of lithium and electrolyte in aged Li-ion cylindrical cells. J. Power Sources 2020, 475, 228690. [Google Scholar] [CrossRef]
  24. Spiegel, S.; Heckmann, T.; Altvater, A.; Diehm, R.; Scharfer, P.; Schabel, W. Investigation of edge formation during the coating process of Li-ion battery electrodes. J. Coat. Technol. Res. 2022, 19, 121–130. [Google Scholar] [CrossRef]
  25. Dubarry, M.; Vuillaume, N.; Liaw, B.Y. Origins and accommodation of cell variations in Li-ion battery pack modeling. Int. J. Energy Res. 2010, 34, 216–231. [Google Scholar] [CrossRef]
  26. Li, X.; Wang, T.; Pei, L.; Zhu, C.; Xu, B. A comparative study of sorting methods for Lithium-ion batteries. In Proceedings of the 2014 IEEE Conference and Expo Transportation Electrification Asia-Pacific (ITEC Asia-Pacific), Beijing, China, 31 August–3 September 2014; IEEE: Piscataway, NJ, USA, 2014; pp. 1–6, ISBN 978-1-4799-4239-8. [Google Scholar]
  27. Liu, C.; Tan, J.; Shi, H.; Wang, X. Lithium-Ion Cell Screening With Convolutional Neural Networks Based on Two-Step Time-Series Clustering and Hybrid Resampling for Imbalanced Data. IEEE Access 2018, 6, 59001–59014. [Google Scholar] [CrossRef]
  28. Reynolds, C.D.; Slater, P.R.; Hare, S.D.; Simmons, M.J.; Kendrick, E. A review of metrology in lithium-ion electrode coating processes. Mater. Des. 2021, 209, 109971. [Google Scholar] [CrossRef]
  29. Ryll, K.; Hoffmann, L.; Landrath, O.; Lienesch, F.; Kurrat, M. Key Figure Based Incoming Inspection of Lithium-Ion Battery Cells. Batteries 2021, 7, 9. [Google Scholar] [CrossRef]
  30. Thomitzek, M.; Schmidt, O.; Abraham, T.; Cerdas, F.; Röder, F.; Krewer, U.; Herrmann, C. Model-based identification of production tolerances in battery production. Procedia CIRP 2021, 104, 1059–1064. [Google Scholar] [CrossRef]
  31. Moradpour, A.; Kasper, M.; Kienberger, F. Quantitative Cell Classification Based on Calibrated Impedance Spectroscopy and Metrological Uncertainty. Batter. Supercaps 2023, 6, e202200524. [Google Scholar] [CrossRef]
  32. Sun, Y.; Yuan, Y.; Lu, L.; Han, X.; Kong, X.; Wang, H.; Ouyang, M.; Gao, P.; Zheng, H.; Wang, K. A comprehensive research on internal short circuits caused by copper particle contaminants on cathode in lithium-ion batteries. eTransportation 2022, 13, 100183. [Google Scholar] [CrossRef]
  33. Grabow, J.; Klink, J.; Benger, R.; Hauer, I.; Beck, H.-P. Particle Contamination in Commercial Lithium-Ion Cells—Risk Assessment with Focus on Internal Short Circuits and Replication by Currently Discussed Trigger Methods. Batteries 2023, 9, 9. [Google Scholar] [CrossRef]
  34. Mohanty, D.; Hockaday, E.; Li, J.; Hensley, D.K.; Daniel, C.; Wood, D.L. Effect of electrode manufacturing defects on electrochemical performance of lithium-ion batteries: Cognizance of the battery failure sources. J. Power Sources 2016, 312, 70–79. [Google Scholar] [CrossRef]
  35. Yan, P.; Zheng, J.; Gu, M.; Xiao, J.; Zhang, J.-G.; Wang, C.-M. Intragranular cracking as a critical barrier for high-voltage usage of layer-structured cathode for lithium-ion batteries. Nat. Commun. 2017, 8, 14101. [Google Scholar] [CrossRef]
  36. Park, K.-J.; Hwang, J.-Y.; Ryu, H.-H.; Maglia, F.; Kim, S.-J.; Lamp, P.; Yoon, C.S.; Sun, Y.-K. Degradation Mechanism of Ni-Enriched NCA Cathode for Lithium Batteries: Are Microcracks Really Critical? ACS Energy Lett. 2019, 4, 1394–1400. [Google Scholar] [CrossRef]
  37. Liu, H.; Wolfman, M.; Karki, K.; Yu, Y.-S.; Stach, E.A.; Cabana, J.; Chapman, K.W.; Chupas, P.J. Intergranular Cracking as a Major Cause of Long-Term Capacity Fading of Layered Cathodes. Nano Lett. 2017, 17, 3452–3457. [Google Scholar] [CrossRef] [PubMed]
  38. Li, J.; Zhou, Z.; Luo, Z.; He, Z.; Zheng, J.; Li, Y.; Mao, J.; Dai, K. Microcrack generation and modification of Ni-rich cathodes for Li-ion batteries: A review. Sustain. Mater. Technol. 2021, 29, e00305. [Google Scholar] [CrossRef]
  39. Kumberg, J.; Müller, M.; Diehm, R.; Spiegel, S.; Wachsmann, C.; Bauer, W.; Scharfer, P.; Schabel, W. Drying of Lithium-Ion Battery Anodes for Use in High-Energy Cells: Influence of Electrode Thickness on Drying Time, Adhesion, and Crack Formation. Energy Technol. 2019, 7, 1900722. [Google Scholar] [CrossRef]
  40. Gao, T.; Kim, A.; Lu, W. Modeling electrode-level crack and quantifying its effect on battery performance and impedance. Electrochim. Acta 2020, 363, 137197. [Google Scholar] [CrossRef]
  41. Heenan, T.M.M.; Wade, A.; Tan, C.; Parker, J.E.; Matras, D.; Leach, A.S.; Robinson, J.B.; Llewellyn, A.; Dimitrijevic, A.; Jervis, R.; et al. Identifying the Origins of Microstructural Defects Such as Cracking within Ni-Rich NMC811 Cathode Particles for Lithium-Ion Batteries. Adv. Energy Mater. 2020, 10, 2002655. [Google Scholar] [CrossRef]
  42. Xu, J.; Liu, Y.; Xie, H.; Luo, F. Surface Quality Assurance Method for Lithium-Ion Battery Electrode Using Concentration Compensation and Partiality Decision Rules. IEEE Trans. Instrum. Meas. 2020, 69, 3157–3169. [Google Scholar] [CrossRef]
  43. Schoo, A.; Moschner, R.; Hülsmann, J.; Kwade, A. Coating Defects of Lithium-Ion Battery Electrodes and Their Inline Detection and Tracking. Batteries 2023, 9, 111. [Google Scholar] [CrossRef]
  44. Choudhary, N.; Clever, H.; Ludwigs, R.; Rath, M.; Gannouni, A.; Schmetz, A.; Hülsmann, T.; Sawodny, J.; Fischer, L.; Kampker, A.; et al. Autonomous Visual Detection of Defects from Battery Electrode Manufacturing. Adv. Intell. Syst. 2022, 4, 2200142. [Google Scholar] [CrossRef]
  45. Günther, T.; Schreiner, D.; Metkar, A.; Meyer, C.; Kwade, A.; Reinhart, G. Classification of Calendering-Induced Electrode Defects and Their Influence on Subsequent Processes of Lithium-Ion Battery Production. Energy Technol. 2020, 8, 1900026. [Google Scholar] [CrossRef]
  46. Pfrang, A.; Kersys, A.; Kriston, A.; Sauer, D.U.; Rahe, C.; Käbitz, S.; Figgemeier, E. Geometrical Inhomogeneities as Cause of Mechanical Failure in Commercial 18650 Lithium Ion Cells. J. Electrochem. Soc. 2019, 166, A3745–A3752. [Google Scholar] [CrossRef]
  47. Schilling, A.; Schmitt, J.; Dietrich, F.; Dröder, K. Analyzing Bending Stresses on Lithium-Ion Battery Cathodes induced by the Assembly Process. Energy Technol. 2016, 4, 1502–1508. [Google Scholar] [CrossRef]
  48. Beck, D.; Dechent, P.; Junker, M.; Sauer, D.U.; Dubarry, M. Inhomogeneities and Cell-to-Cell Variations in Lithium-Ion Batteries, a Review. Energies 2021, 14, 3276. [Google Scholar] [CrossRef]
  49. R-Smith, N.A.-Z.; Ragulskis, M.; Kasper, M.; Wagner, S.; Pumsleitner, J.; Zollo, B.; Groebmeyer, A.; Kienberger, F. Multiplexed 16 × 16 Li-Ion Cell Measurements Including Internal Resistance for Quality Inspection and Classification. IEEE Trans. Instrum. Meas. 2021, 70, 2006109. [Google Scholar] [CrossRef]
  50. Westerhoff, U. Klassifizierung von Lithium-Ionen-Batteriezellen Mittels Kenngrößenbasierter Methoden; Dr. Hut: München, Germany, 2019; ISBN 978-3-8439-4179-2. [Google Scholar]
  51. Pan, Y.; Kong, X.; Yuan, Y.; Sun, Y.; Han, X.; Yang, H.; Zhang, J.; Liu, X.; Gao, P.; Li, Y.; et al. Detecting the foreign matter defect in lithium-ion batteries based on battery pilot manufacturing line data analyses. Energy 2023, 262, 125502. [Google Scholar] [CrossRef]
  52. Sazhin, S.V.; Dufek, E.J.; Gering, K.L. Enhancing Li-Ion Battery Safety by Early Detection of Nascent Internal Shorts. J. Electrochem. Soc. 2016, 164, A6281–A6287. [Google Scholar] [CrossRef]
  53. Roth, T.; Streck, L.; Graule, A.; Niehoff, P.; Jossen, A. Relaxation Effects in Self-Discharge Measurements of Lithium-Ion Batteries. J. Electrochem. Soc. 2023, 170, 20502. [Google Scholar] [CrossRef]
  54. Bauermann, L.P.; Mesquita, L.V.; Bischoff, C.; Drews, M.; Fitz, O.; Heuer, A.; Biro, D. Scanning acoustic microscopy as a non-destructive imaging tool to localize defects inside battery cells. J. Power Sources Adv. 2020, 6, 100035. [Google Scholar] [CrossRef]
  55. Masuch, S.; Gümbel, P.; Kaden, N.; Dröder, K. Applications and Development of X-ray Inspection Techniques in Battery Cell Production. Processes 2023, 11, 10. [Google Scholar] [CrossRef]
  56. Cai, Z.; Mendoza, S.; Goodman, J.; McGann, J.; Han, B.; Sanchez, H.; Spray, R. The influence of cycling, temperature, and electrode gapping on the safety of prismatic lithium-ion batteries. J. Electrochem. Soc. 2020, 167, 160515. [Google Scholar] [CrossRef]
  57. Bason, M.G.; Coussens, T.; Withers, M.; Abel, C.; Kendall, G.; Krüger, P. Non-invasive current density imaging of lithium-ion batteries. J. Power Sources 2022, 533, 231312. [Google Scholar] [CrossRef]
  58. Heenan, T.M.M.; Mombrini, I.; Llewellyn, A.; Checchia, S.; Tan, C.; Johnson, M.J.; Jnawali, A.; Garbarino, G.; Jervis, R.; Brett, D.J.L.; et al. Mapping internal temperatures during high-rate battery applications. Nature 2023, 617, 507–512. [Google Scholar] [CrossRef]
  59. Ran, A.; Chen, S.; Zhang, S.; Liu, S.; Zhou, Z.; Nie, P.; Qian, K.; Fang, L.; Zhao, S.-X.; Li, B.; et al. A gradient screening approach for retired lithium-ion batteries based on X-ray computed tomography images. RSC Adv. 2020, 10, 19117–19123. [Google Scholar] [CrossRef] [PubMed]
Figure 1. Relationship between inhomogeneities, defects and cell quality.
Energies 16 06958 g001
Figure 2. Cell characterisation and testing methods and potential fields of application in the production of battery cells and battery system assembly [5,9,10,12,15,29,49,50,51,52,53,54,55,56,57].
Energies 16 06958 g002
Figure 3. (a) Overview of defects. (b) Process of insertion of fully and partly uncoated stripe. (c) Scratching the surface with the thin side of a spatula. (d) Insertion of particles.
Energies 16 06958 g003
Figure 4. (a) 3D CT representation of the analysed cell. (b) Position of section A-A. (c) Section of the cell A-A to visualise the cell thickness.
Energies 16 06958 g004
Figure 5. (a) CT image of the position of the analysed area with fully (A) and partly (B) uncoated stripe. (b) Detailed view of the area. (c) Side view of entirely decoated area. (d) Side view of partially decoated area. (ef) LSM images and profiles of the partially and fully decoated areas.
Energies 16 06958 g005
Figure 6. (a) CT images of the position of the analysed area with scratch (A), cut (B) and kink (C). (b) Detailed view of the area. (c) Side view of the scratch. (d) Side view of the cut. (e) Side view of the kink (not visible). (fh) LSM images and profiles of the scratch, cut and kink.
Energies 16 06958 g006
Figure 7. (a) CT image of the cell and position of the analysed area. (b) Detailed view of the area in CT inspection with grooves. (c) Photograph of grooves during preparation of the cell.
Energies 16 06958 g007
Figure 8. (af) CT images showing a top view of the particles A1–A9. (gl) CT images visualising a cross-section of the particles A1–A9. (mr) LSM visualisations of the particles A1–A9.
Energies 16 06958 g008
Figure 9. (af) CT images showing a top view of the particles F1–F14. (gl) CT images visualising a cross-section of the particles F1–F14. (mr) LSM visualisations of the particles F1–F14.
Energies 16 06958 g009
Figure 10. (af) CT images showing a top view of the particles C1–C10. (gl) CT images visualising a cross-section of the particles C1–C10. (mr) LSM visualisations of the particles C1–C10.
Energies 16 06958 g010
Figure 11. Qualitative assessment of visibility of particles based on CT images. Each circle represents a particle and its density and volume (3D) analysed in the study. Defect visibility increases with particle density compared with void density and average surrounding LIB density. Voxel volume (resolution) of the scan for comparison.
Energies 16 06958 g011
Figure 12. (a) 3D CT slice shows good visibility of defects. (b) The 2D X-ray image of the cell with a box indicating the position of (c) enlarged section of 2D X-ray image showing iron (F4–F14) and copper (C4–C10) particles.
Energies 16 06958 g012
Table 1. Summary of anode and cathode dimensions and specifications.
ComponentThickness
in μm
Dimensions
in mm × mm × mm
Anode (double-sided)110.0116 × 99 × 0.110
Anode substrate20.0
Anode coating45.0
Cathode (double-sided)115.0115 × 98 × 0.115
Cathode substrate30.0
Cathode coating42.5
Table 2. Inserted particles, material and size based on CT and LSM measurements.
No.MaterialArea (LSM)
(in 103 μm2)
Volume (2.5D)
(in 106 μm3)
Volume (3D)
(in 106 μm3)
Shape
A1Al6951.02738.02139.02Punched disk
A2Al1578.1375.62~50.00Unspecific (-)
A3Al687.1296.74~50.00Needle-shaped
A6Al408.8645.80~30.00Needle-shaped
A4Al304.0634.91~28.00-
A7Al107.678.25~8.00-
A8Al100.409.18~5.00-
A9Al99.325.75~5.00-
A5Al82.885.13~2.00-
F1Fe7322.46857.80732.25Punched disk
F2Fe547.94134.16~100-
F7Fe547.8731.63~28.00Swarf cluster
F4Fe392.0219.67~18.00-
F9Fe177.5618.47~16.00Needle-shaped
F3Fe311.669.30~9.00-
F8Fe90.576.63~6.00-
F5Fe139.665.82~5.00-
F11Fe93.375.03~4.50-
F10Fe25.871.28~1.00-
F6Fe12.950.55~0.50-
F13Fe12.540.35~0.30-
F14Fe5.030.09~0.08-
C1Co7260.821119.88217.82Punched disk
C2Co927.96100.69~100.00-
C4Co434.5439.59~28.00-
C3Co679.5328.49~25.00-
C5Co371.8615.04~13.00Needle-shaped
C7Co310.1516.26~13.00Swarf cluster
C8Co162.4616.36~13.00-
C9Co102.348.06~7.00-
C10Co9.720.30~0.25-
C6Co9.600.09~0.08-
Disclaimer/Publisher’s Note: The statements, opinions and data contained in all publications are solely those of the individual author(s) and contributor(s) and not of MDPI and/or the editor(s). MDPI and/or the editor(s) disclaim responsibility for any injury to people or property resulting from any ideas, methods, instructions or products referred to in the content.

