Article

Integrated Multi-Criteria Planning for Resilient Renewable Energy-Based Microgrid Considering Advanced Demand Response and Uncertainty

by
Mark Kipngetich Kiptoo
1,*,
Oludamilare Bode Adewuyi
2,*,
Masahiro Furukakoi
3,
Paras Mandal
4 and
Tomonobu Senjyu
1
1
Graduate School of Science and Engineering, University of the Ryukyus, Nishihara 903-0213, Japan
2
Faculty of Engineering, Information and Systems, University of Tsukuba, 1 Chome-1-1 Tennodai, Ibaraki 305-8577, Japan
3
National Institute of Technology, Sasebo College, Sasebo 857-1193, Japan
4
Department of Electrical and Computer Engineering, University of Texas at El Paso, El Paso, TX 79968, USA
*
Authors to whom correspondence should be addressed.
Energies 2023, 16(19), 6838; https://doi.org/10.3390/en16196838
Submission received: 26 August 2023 / Revised: 22 September 2023 / Accepted: 24 September 2023 / Published: 27 September 2023

Abstract

:
Weather-driven uncertainties and other extreme events, particularly with the increasing reliance on variable renewable energy (VRE), have made achieving a reliable microgrid operation increasingly challenging. This research proposes a comprehensive and integrated planning strategy for capacity sizing and operational planning, incorporating forecasting and demand response program (DRP) strategies to address microgrid operation under various conditions, accounting for uncertainties. The microgrid includes photovoltaic systems, wind turbines, and battery energy storage. Uncertainties in VREs and load fluctuations are modeled using Monte Carlo simulations (MCSs), while forecasting is based on the long short-term memory (LSTM) model. To determine the best techno-economic planning approach, six cases are formulated and solved using a multi-objective particle swarm optimization with multi-criteria ranking for these three objectives: total lifecycle costs (TLCC), reliability criteria, and surplus VRE curtailment. Shortage/surplus adaptive pricing combined with variable peak critical peak pricing (SSAP VP-CPP) DRP is devised and compared with a time-of-use VP-CPP DRP in mitigating the impacts of both critical and non-critical events in the system. The simulation results show that the integrated planning, which combines LSTM forecasting with DRP strategies, achieved about 7% and 5% TLCC reductions for deterministic and stochastic approaches, respectively. The approach allowed optimal sizing and operation planning, improving the utilization of VREs and effectively managing uncertainty, resulting in the most cost-effective and robust VRE-based microgrid with enhanced resilience and reliability.

1. Introduction

The global movement toward nearly complete dependence on variable renewable energy sources (VREs), precisely wind and solar, has gained significant momentum as societies seek to tackle climate change and ensure a sustainable energy future. One crucial solution that has emerged to achieve resilient energy systems is the concept of self-sufficient community microgrids [1]. These microgrids enable the decentralization of energy generation, storage, and consumption, explicitly focusing on utilizing VREs. Nevertheless, the inherent uncertainty and volatility of VREs pose significant challenges to ensuring reliable microgrid operations [2]. While energy storage systems (ESSs) such as batteries [3], flywheels, and fuel cells [4] show promise and are prove to be beneficial in enhancing energy supply management and maintaining a stable balance between electricity supply and demand in microgrids, their practicality diminishes with increasing VRE penetration.
As the adoption of VREs becomes more widespread, there arises a need for substantial energy storage capacity to meet the growing demand. However, the cost of implementing battery energy storage systems (BESSs) remains prohibitive, making it impractical to rely solely on BESSs as a cost-effective solution for VRE-based microgrids [5]. Furthermore, the non-dispatchable nature of VREs adds complexity and challenges to conventional planning techniques for microgrid operations and capacity sizing. Thus, a holistic approach is essential to successfully integrate multiple VREs and ensure operational resilience even during unfavorable events. This involves not exclusively relying on BESSs by intelligently incorporating short-term and long-term planning techniques [6]. Microgrids can guarantee reliable operations by employing these integrated planning techniques while effectively injecting a significant portion of VREs into their energy systems. These planning methods encompass various strategies, including demand-side management (DSM), resource and load forecasting, etc.
Demand-side management (DSM) programs are strategically designed to modify consumers’ electricity consumption behaviors, leveraging the flexibility of demand resources and aiming to achieve an economic load profile for utilities. DSM programs offer lower price incentives to consumers, encouraging them to adjust their electricity usage based on utility-preferred timing [7]. The integration of intelligent DSM practices has led to numerous techno-economic benefits, such as reducing the cost of electricity for consumers, maximization of the operation of VREs generation units, minimization of the overall system’s peak demand, etc. [8,9]. Advancements in cyber-communication have further revolutionized DSM operations by enabling real-time monitoring and efficient control of consumer devices, aligning with the priorities and needs of power systems, thus contributing to remarkable progress in the overall VRE-based electricity market design. The increasing intelligence of power systems, where smart consumer devices and electricity infrastructure communicate seamlessly and respond to utility needs, has resulted in significant improvements in ensuring the reliability of microgrid systems with higher levels of VRE integration. The challenge of balancing varying VRE generation with fluctuating load patterns, which once hindered the widespread adoption of VREs, is now solvable.
DSM employs various strategic approaches, with demand response programs (DRPs) playing a crucial role in balancing real-time electricity demand and supply, ensuring reliable and efficient integration of VREs into microgrid systems. DRPs serve as strategies to achieve the most suitable and economically viable operating conditions, considering information about available supply capacity, load requirements, and energy market dynamics over time. Utility companies often offer incentives through customer-friendly tariff packages, such as flexible payment options and attractive prices for adjusted load demand patterns and resulting electricity consumption, to encourage specific changes in customers’ electricity usage patterns. Implementing well-designed DRP schemes can lead to substantial cost savings in the planning and operation of electric grids or microgrids [10]. DRP models can be categorized into two main types: price-based and incentive-based demand response models, encompassing various variations, such as critical peak pricing (CPP), real-time pricing (RTP), time of use (TOU), emergency demand response, and critical demand response, among others [11].
The benefits of efficient prediction strategies for optimizing VRE-based power systems have gained notable attention in recent research due to their promise to guarantee reliability and achieve result-based sustainable energy transition planning. Through proactive predictions and responses to changes in VREs, microgrids can achieve a well-balanced and dependable power supply, lessening the over-reliance on expensive ESSs and other backups. Similarly, VREs introduce inherent variability and uncertainty. This uncertainty significantly threatens the stability and efficiency of VRE-based systems. However, with accurate forecasting providing insight into extreme events for the microgrid, DRP strategies can be harnessed in advance to muster sufficient resources to mitigate critical stress in the system, which could otherwise lead to a cascading power failure. By accurately forecasting VRE variability and responding in real time to anticipated discrepancies in system supply and demand, microgrids can effectively handle the uncertainty associated with VREs.
The significance of integrated planning, including optimal sizing and operational planning, has been underscored in various studies. The authors of [12] emphasize the critical need for integrated sizing and operational planning to maximize VRE-based systems’ efficiency, reliability, and robustness. These studies emphasize that the infrastructure may be over- or under-designed without optimal sizing, leading to resource waste or inadequate power supply. Additionally, microgrid operations could become unreliable without effective operational planning, including practical resource forecasting, leading to power fluctuations. Given the growing adoption of VREs into community mini-grids, VRE-generation variability and uncertainty have highlighted the need for integrated optimal planning to manage and mitigate these challenges. The existing literature shows that comprehensive and integrated planning studies remain insufficiently explored, underlining the need for advanced strategies to navigate the complex dynamics and uncertainties of VREs on a community microgrid’s integrated capacity and operation.
Consequently, this study proposes a comprehensive approach to community microgrid planning, integrating demand response strategies, precise forecasting, and joint sizing and operation planning under uncertainty. These elements are crucial for managing the complexities and uncertainties of VRE-based microgrids. The proposed approach offers multiple benefits, such as improved resilience and reliability, enhanced VRE utilization, and better ride-through capabilities in extreme weather events. The specific contributions of this study are highlighted below:
  • A comprehensive and integrated method for planning community microgrids based on VREs is proposed and examined. This approach incorporates DRPs strategies, precise forecasting, and combined sizing and operational planning, all under uncertain conditions.
  • The techno-economic advantages of implementing a combined DRP approach, integrating DRP strategies based on shortage/surplus adaptive pricing (SSAP) alongside variable peak critical peak pricing (VP-CPP) DRPs, have been proposed and thoroughly investigated. These are compared with a combination of time of use (TOU) and VP-CPP strategies. These two ensemble DRP approaches have been demonstrated to provide a more robust and dynamic response, significantly enhancing the resilience and reliability of microgrids under severe conditions, such as extreme weather events, compared to traditional DRP strategies.
  • To ascertain the role of accurate forecasting in conjunction with SSAP VP-CPP DRP strategies, the LSTM approach has been investigated for VRE generation and load demand forecasting to enable optimal preparation and reduce the need for load curtailment or generation curtailment, thereby bolstering the resilience of microgrids against sudden power generation fluctuations.
  • To address the inherent variability and resulting uncertainty introduced by VREs and load variation, which could potentially undermine the reliability and operability of isolated community microgrids, Monte Carlo simulations have been employed to generate uncertainty scenarios. This ensures the robustness of the system against extreme weather fluctuations.
The rest of this paper is arranged as follows: Section 2 outlines the system configuration and mathematical modeling. A thorough explanation of the proposed integrated planning framework and demand response program models is provided in Section 3. Section 4 delves into the formulation of multi-objective optimization problems and simulation setup. Section 5 includes results, analysis, and discussions, while the conclusion of the work is presented in Section 6.

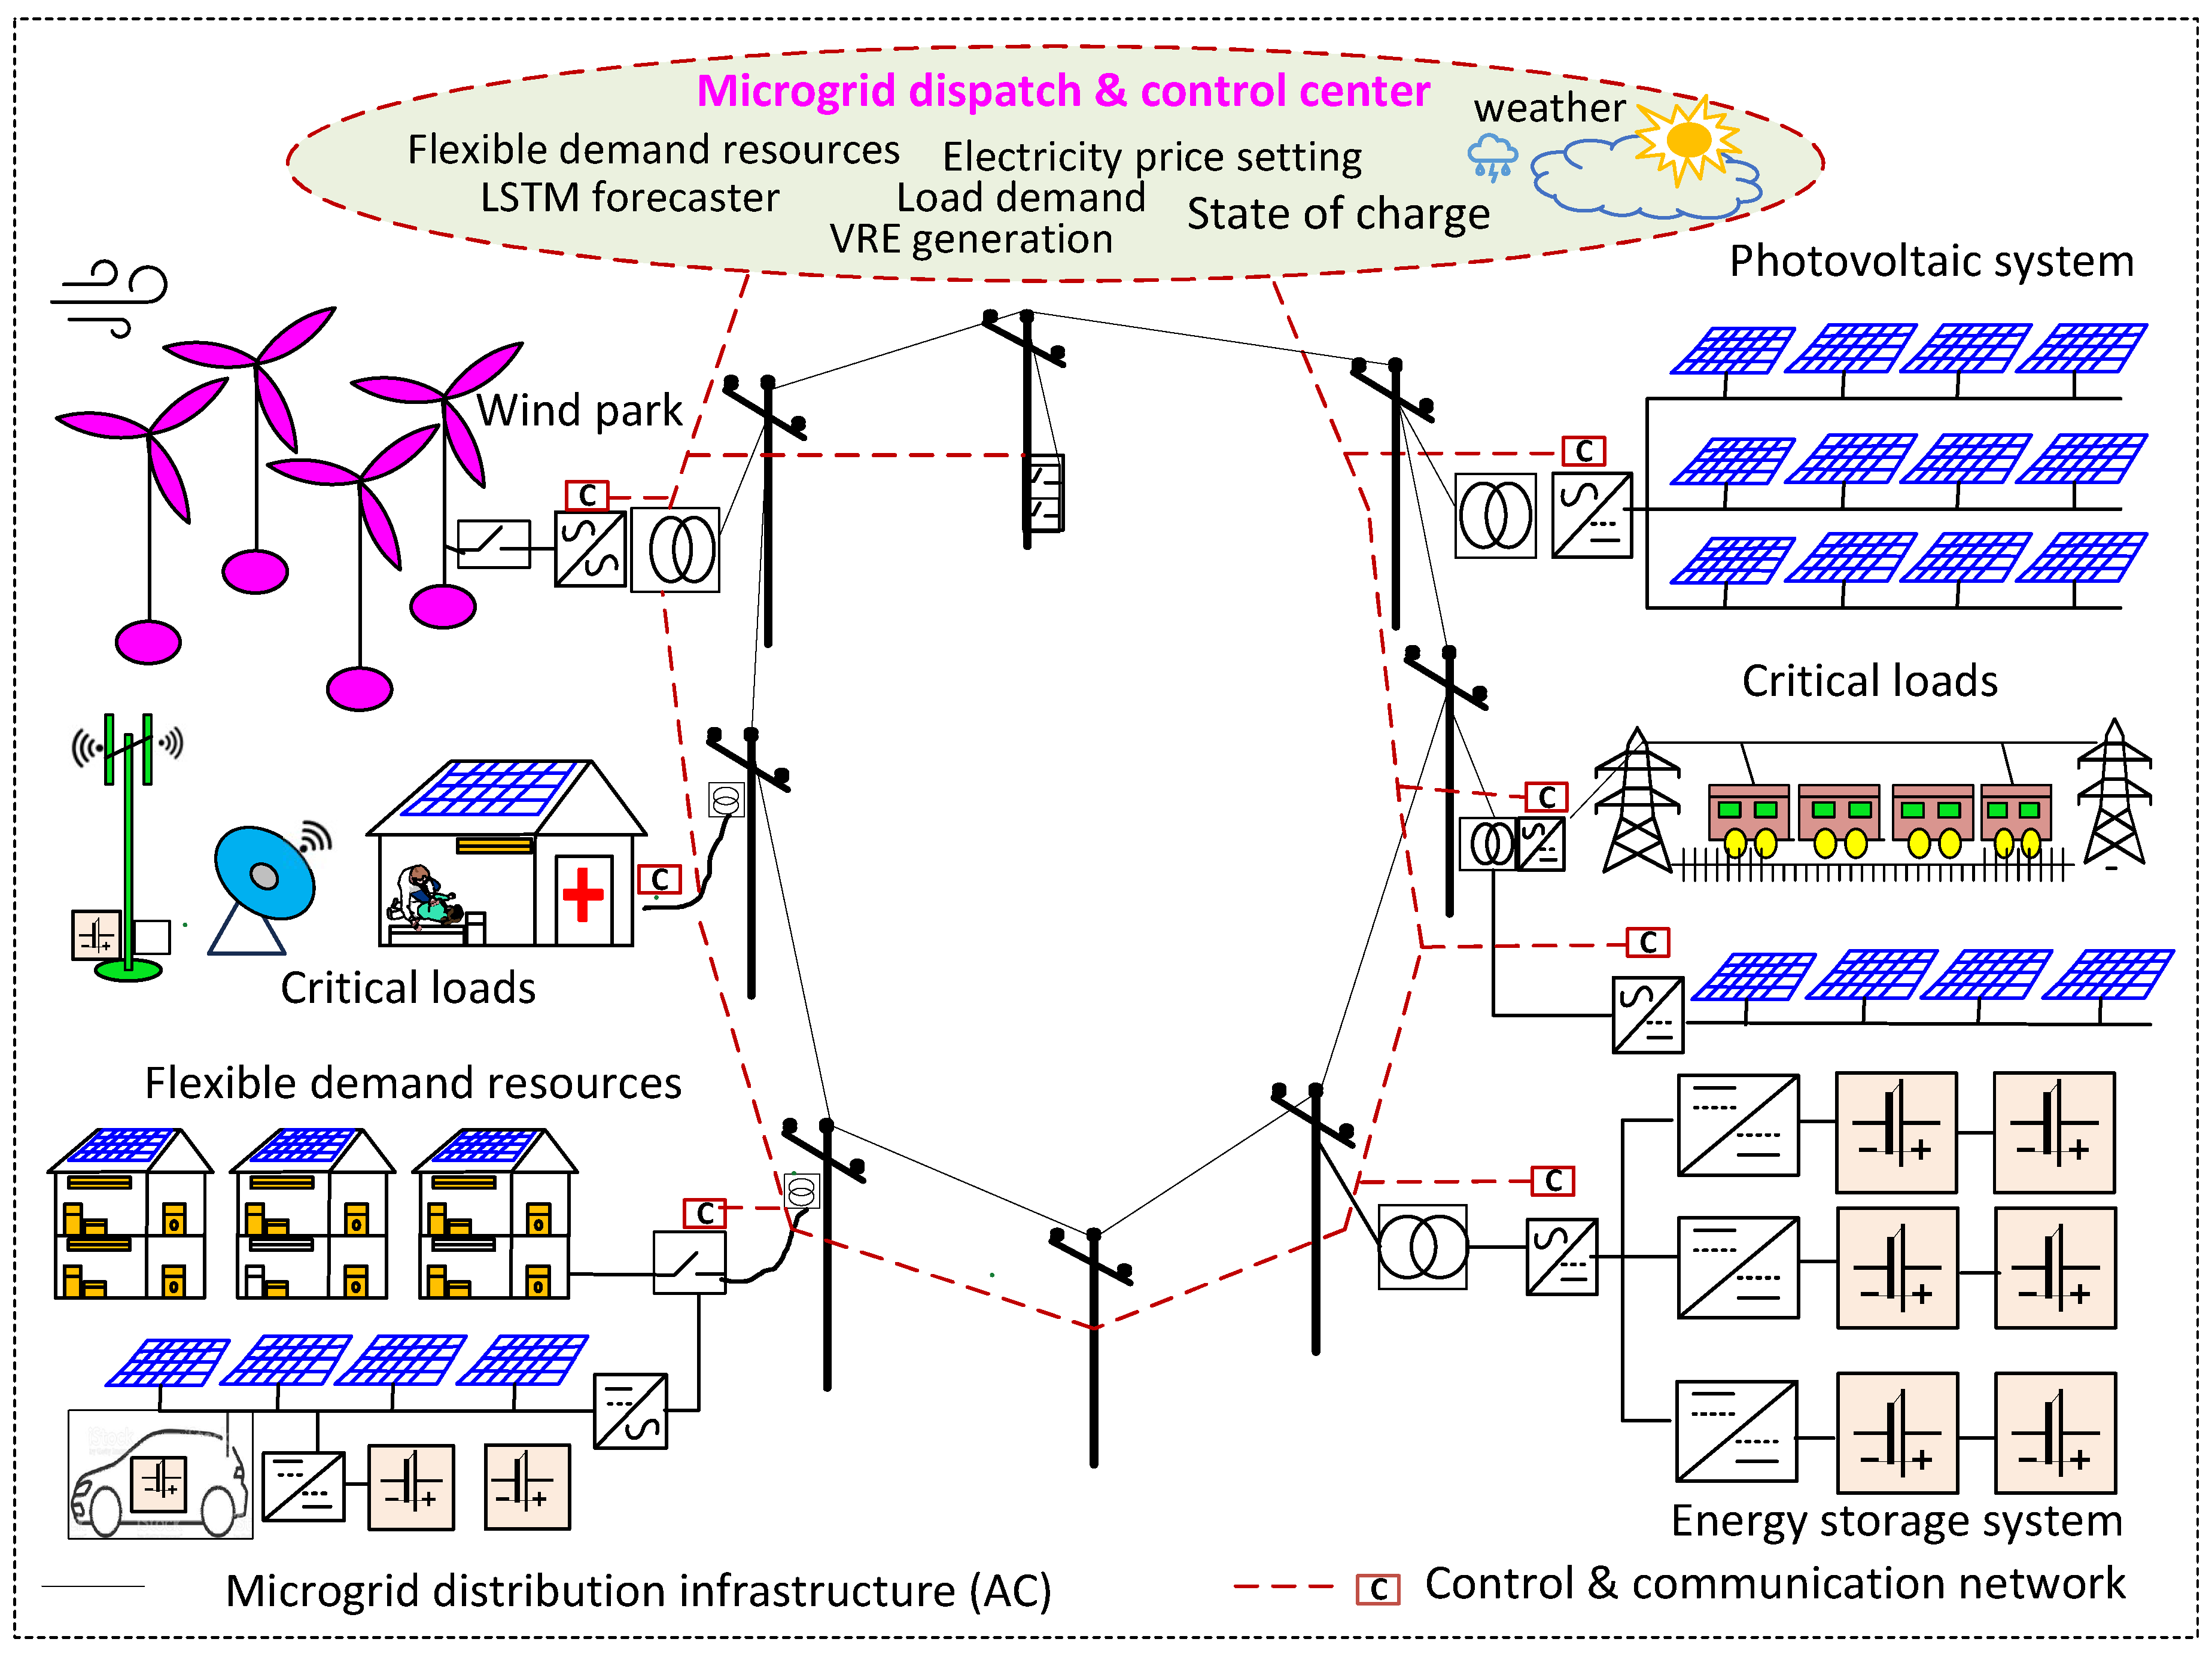
2. System Configuration and Mathematical Modelling

Figure 1 depicts the proposed system configuration for a VRE-based community microgrid system design. The proposed model incorporates WT, BESS, PV systems, and various load types.

2.1. Wind Turbine ( W T )

The power output of a WT system at a given time (t) is contingent on the instantaneous wind speed ( u ( t ) ) at the installed hub height. By using the piece-wise function outlined in Equation (2), the power generated ( S w ( t ) ) of the WT specific to a particular hub height and WT model can be computed as follows [8].
S w ( t ) = S w c p × u 3 ( t ) u c i 3 u r 3 u c o 3 u c i v u r S w c p u r < u u c o 0 u < u c i ,   u > u c o
where S w c p signifies the rated capacity of the installed WT, whereas u c o , u c i , and u r denote the cut-out, cut-in, and rated wind speeds, respectively.

2.2. Photovoltaic ( P V )

The power output ( S p v ) of a PV system is primarily influenced by factors such as solar irradiance ( I I ( t ) ), temperature ( T e m p ( t ) , and derating factor ( Λ p v ). Equation (2) illustrates the instantaneous power output of the PV system [13]
S p v ( t ) = I I ( t ) I s t c × [ 1 + α p v ( T e m p ( t ) T e m p s t c ) ] × S p v c p × Λ p v
where S p v c p denotes the installed PV’s capacity, and α p v is the temperature coefficient. I s t c , and T e m p s t c denote the solar irradiance and temperature under standard test conditions.

2.3. Battery Energy Storage System ( B E S S )

When the total power generated by the WT ( S w t ) and PV ( S p v ) surpasses the load demand ( S L ), the BESS transitions into a charging state to absorb the surplus power. Conversely, it switches to a discharging state when the demand exceeds the total power generated to balance out the power deficit in the system. The difference between the total VRE generation and the load demand primarily dictates how much power can be stored or drained from the BESS at any moment [14]. The power drawn from or sent to the BESS for discharging or charging, respectively, is contingent on the previous state of charge ( S O C ( t 1 ) ) and the constraints of the BESS system: the maximum ( S O C m a x ) and minimum ( S O C m i n ) SOC boundaries. The SOC status ( S O C ( t ) ) of the BESS at any specific time (t) and the BESS constraints are detailed in Equations (3) and (4), respectively.
S O C ( t ) = S O C ( t 1 ) 1 S D b + S b c h ( t ) × η b c S b d s ( t ) η b d
S O C m i n S O C ( t ) S O C m a x S O C m i n = 0.1 × S b c p S O C m a x = 0.9 × S b c p
where S b c p represents the BESS installed capacity, and S D b is the self-discharge of the BESS; η b c and η b d are the BESS’s discharging and charging efficiencies as percentages; and ( S b d s ( t ) ) and ( S b c h ( t ) ) represent the discharging and charging power to and from the BESS at a time (t), respectively.

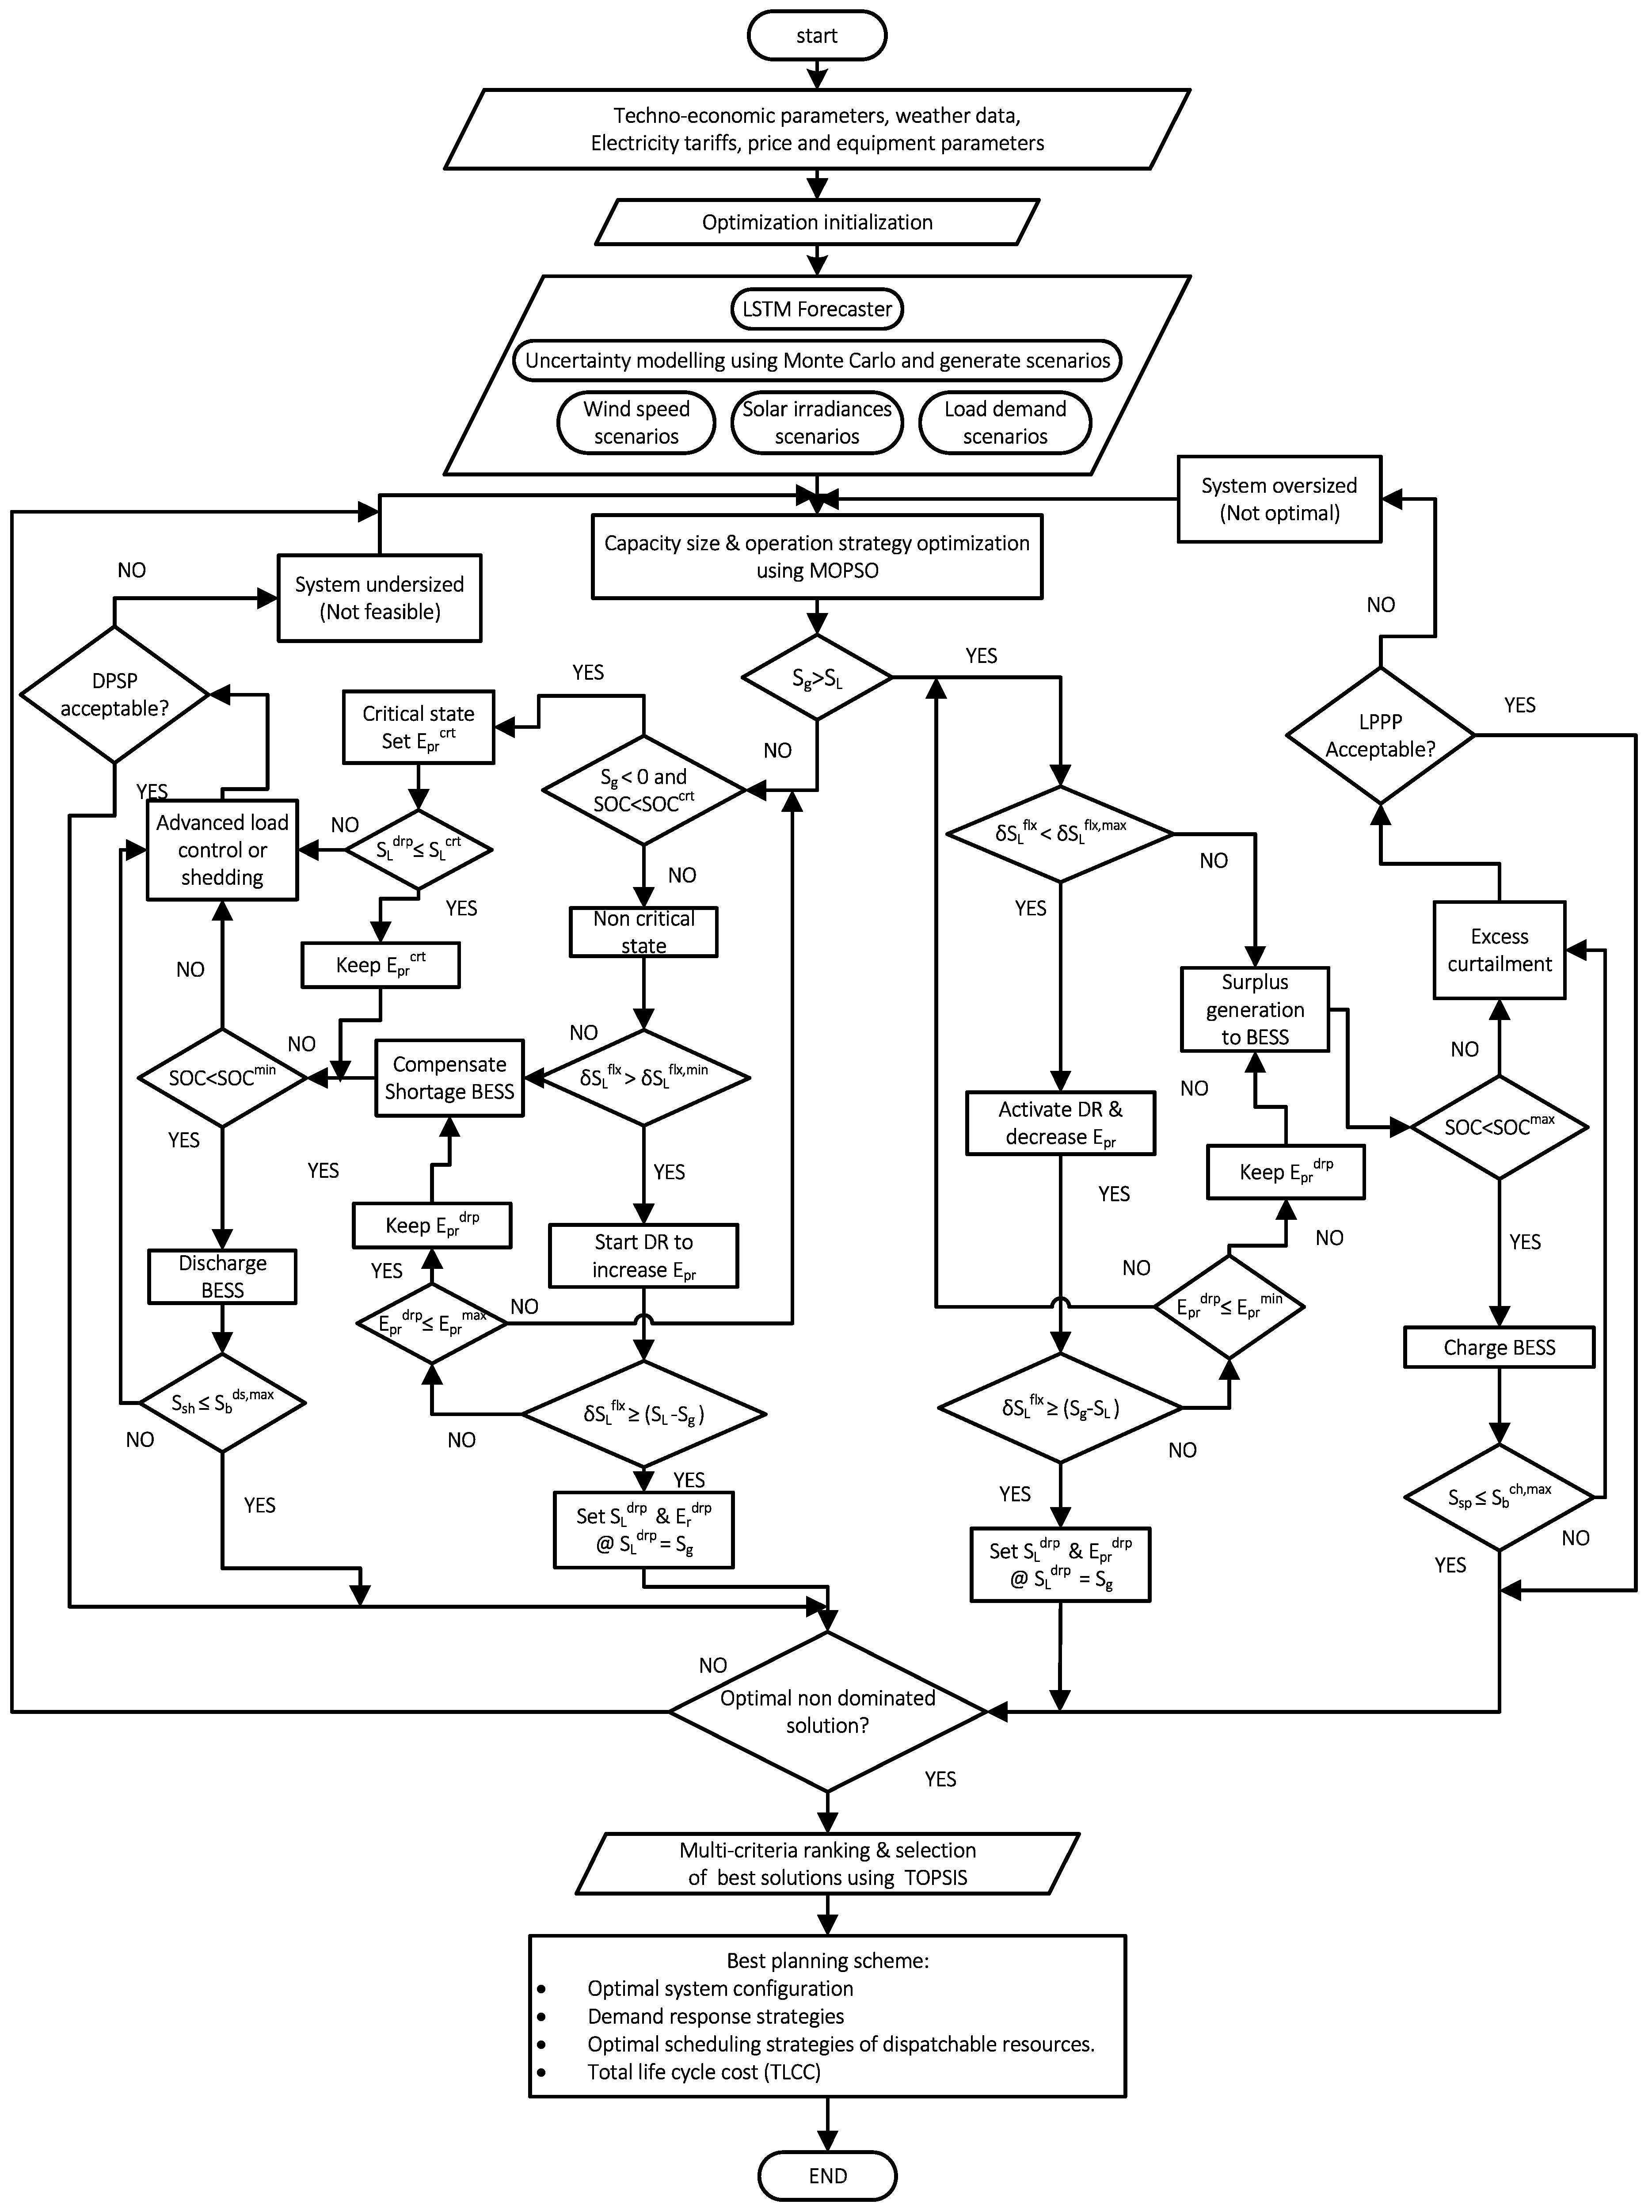
3. Proposed Integrated Planning Framework

The flowchart in Figure 2 shows the proposed planning framework for a VRE-based community microgrid considering uncertainty and various demand response mechanisms. A comprehensive planning framework is critical in capacity and operational decision-making for VRE-dependent systems to guarantee improved operational reliability and serviceability, particularly during prolonged unfavorable weather conditions.
Two operation strategies are devised to ensure the robust operational capability of the proposed system, namely normal non-critical and critical (emergency) operation modes. During non-critical periods, the operation of the BESS is well coordinated with the demand response strategies to maintain a steady power supply to the load demand by correcting power imbalances in the system during spans of acceptable levels of deficient or surplus VRE generation.
The system is considered to be in the optimal operation state when the generated power from VREs equals the power demand. The price of electricity remains constant, as determined in the preceding period, and the flexible resources (FDRs) stay unadjusted to maintain this state. Nevertheless, if the power generated by VREs exceeds the demand, or the demand exceeds generation, the utility activates a demand response program by providing incentives through price adjustments. This helps address the power mismatch by lowering or increasing electricity prices, encouraging consumers to utilize excess power, or addressing shortages in the system by rescheduling power consumption. If the surplus or the power shortage cannot be fully addressed by adjusting the DRP once the available FDRs have been exhausted, the BESS is initiated into operation. The price is optimally adjusted to keep the system within acceptable operation limits, guaranteeing optimal and normal operation.
On the other hand, during harsh weather conditions in which a VRE-generating resource capability becomes extremely low, and the reliability of the systems is entirely dependent on energy storage for which the state of charge is noted to be critical, the system transitions into an emergency state. During such a critical state, VP-CPP DRP is initiated, and an extremely high electricity price is enforced to discourage the end-user from non-essential electricity usage and alleviate the system’s stress, thereby guaranteeing a survival mechanism without collapsing into a state of total power outage. The uncertainty consideration of the VREs and the load demand guarantee that the system is designed to be robust and capable of managing variability and uncertainties of VRE resources with diverse operating characteristics. Coupling demand-side flexibility through demand price-response resources with the foreseen generation profile of VRE units using LSTM time-ahead resource forecasts guarantees improved and optimized performance for the community microgrid system overall.

3.1. Demand Response Programs, Load Modeling Concept, and Flexible Demand Resources

Demand response planning significantly impacts the allocation of resources and price-setting within a power system. Integral to this process is load modeling, a concept that classifies loads into different categories: adjustable, non-adjustable, elastic, and inelastic. By understanding the adaptability and constraints of each load type, system operators can manage resources more efficiently, set prices with a higher degree of accuracy, and, consequently, optimize the performance of the power system.

3.1.1. Flexible Demand Resource Modeling and Economic Load Model

DRPs typically segregate electrical demand into elastic ( S L e ( t ) ) and inelastic ( S L i e ( t ) ) loads. Elastic demand includes electrical loads, such as dishwashers and water pumps, where operation times can be rearranged from one period to another. Conversely, inelastic loads operate within fixed times (fixed operation and usage times). Such inelastic loads are further divided into adjustable S L a d j ( t ) and non-adjustable S L n a d j ( t ) loads [15]. Heating, ventilation, and air conditioning systems fall under adjustable inelastic loads. In contrast, hospital and other non-crucial loads are classified as critical S L c r t ( t ) and non-critical S L n c r t ( t ) non-adjustable loads, respectively [16,17]. Therefore, the overall system load S L ( t ) at any given time t can be represented as the sum of all types of electric loads as described below (5):
S L ( t ) = S L i e ( t ) + S L e ( t )
where:
S L i e ( t ) = S L a d j ( t ) + S L c r t ( t ) + S L n o n c r t ( t )
S f l x ( t ) = S L a d j ( t ) + S L e ( t )
S L c u r t ( t ) = S L a d j ( t ) + S L n o n c r t ( t )
It is essential to underscore that flexible demand resources ( S L f l x ( t ) ), as outlined in Equation (6), comprise both elastic and adjustable inelastic load demands. These FDRs are deemed responsive to price fluctuations defined by the adopted DRP, and participation is purely voluntary from the consumers’ perspective. Meanwhile, Equation (7) elucidates the types of load demand that can be curtailed when the microgrid is in a state of emergency or criticality.

3.1.2. Price Elasticity of Demand

The price elasticity of demand ( ψ p r ( x , x ) ) is a measure that reflects the connection between changes in the electricity demand and variations in the price of electricity [6,18]. As detailed in Equations (8) and (9), any adjustment in the electricity price during periods x or y will lead to a proportional change in the electricity demand ( δ S L ( x ) or δ S L ( y ) ) in the corresponding x or y period, and vice versa. This means that the overall load pattern for entire periods ( x , y T ) is impacted by hourly fluctuations in electricity prices during both the xth and the yth periods.
ψ p r ( x , x ) = E p r R ( x ) S L ( x ) . S L ( x ) E p r R ( x ) ; x , y T
ψ p r ( x , y ) = E p r R ( x ) S L ( x ) . S L ( y ) S r ( y ) ; x , y T
where ψ p r ( x , y ) and ψ p r ( x , x ) are the multi-period and single-period price elasticities of the demand, respectively. E p r R is the reference price of electricity.

3.2. Combined Time-of-Use and Variable Peak Critical Peak Pricing (DRP)

TOU DR operates on a time-based pricing scheme, offering predetermined rates for different periods of the day, such as peak rates for peak system loading and off-peak rates for low-demand periods [19,20]. The number and variations of the distinct pricing periods and tariff structure enforced are usually utility-specific based on the need for improving the overall system’s efficiency. On the contrary, variable period CPP (VP-CPP) is a variant of critical peak pricing where the specific time, duration of the interval, and days on which the critical peak rates will be enforced are not specified or fixed in advance [21,22]. Instead, critical peak pricing is determined based on the urgent need or state of the grid, such as during a loss of a generation unit, increased excess load on the system, or weather events [23,24]. Furthermore, the customers are generally informed with little advance notification about the upcoming extreme rates. The implementation of a combination of the TOU and VP-CPP as proposed, with varying electricity rates during different periods, including peak, off-peak, valley, and critical peak periods, with the specific critical peak periods subject to an extreme system state is expressed in (11). The impact of the TOU-VP-CPP pricing scheme implementation, described in Equation (10), yields a responsive load model, as expressed in Equation (11).
E p r t o u v p c p p ( t ) = E p r , p e a k t o u v p c p p ( i ) ; i T ; ( peak   period ) E p r , m i d p e a k t o u v p c p p ( j ) ; j T ; ( mid-peak   period ) E p r , o f f p e a k t o u v p c p p ( k ) ; k T ; ( off   peak   period ) E p r , c r i t i c a l t o u v p c p p ( l ) ; l T ; ( critical   peak   period )
S L t o u v p c p p ( x ) = S L ( x ) 1 + ψ p r ( x , x ) [ E p r t o u v p c p p ( x ) E p r R ( x ) + E p r p d ( x ) + E p r p s ( x ) ] E p r R ( x ) + y = 1 , y x T ψ p r ( x , y ) [ E p r t o u v p c p p ( y ) E p r R ( y ) + E p r p d ( y ) + E p r p s ( y ) ] E p r R ( y ) ; for all x , y T
E p r t o u v p c p p ( y ) and E p r t o u v p c p p ( x ) are the set TOU-VP-CPP DRP prices of electricity for the yth period and the xth period, respectively. E p r p d ( x ) and E p r p d ( y ) are the incentive payments, while E p r p s ( x ) and E p r p s ( y ) are the penalties for non-compliance with the DRP provisions by the consumers, respectively.

3.3. Shortage/Suplus-Based Adaptive Pricing and Variable Peak Critical Peak Pricing DRP

The proposed SSAP VPP-CPP is an advancement of a time-based DRP with two modes of operation: critical and non-critical. During non-critical periods, the SSAP VPP-CPP DRP aims to offer dynamic electricity prices varying according to deviations between the expected electricity demand and total variable renewable energy (VRE) generation output; mismatch power is addressed by discharging or charging the BESS while prioritizing rescheduling the available FDR in real time. Conversely, when the system is highly constrained, such as under severe weather conditions in which the capability of VREs to generate power diminishes significantly, and the system’s reliability heavily relies on energy storage with a critical state of charge, an emergency arises (critical mode). In such a critical state, the VP-CPP DRP is activated, enforcing a considerably higher electricity price to discourage non-essential electricity consumption by end-users and alleviate stress on the system. This ensures that the microgrid has a sufficient survival mechanism to ride through a critical/stressed state without collapsing to a state of complete power outage. The adaptive pricing approach of SSAP CPP-VPP, elaborated on in Equation (12), provides enhanced flexibility and responsiveness to different microgrid states (whether in standard or critical periods); this yields a new and cost-effective load profile, as expressed in Equation (13):
δ E p r s s a p v p c p p ( t ) = E p r c r t ; ( S O C ( t ) S O C c r t ) and ( S g 0 ) S g ( t ) S L ( t ) δ S L f l x , m a x × ( E p r R E p r m a x ) ; S g ( t ) S L ( t ) + S O C m a x S O C ( t ) η b d 0 S g ( t ) S L ( t ) δ S L f l x , m i n × ( E p r R E p r m i n ) ; S g ( t ) S L ( t ) + ( S O C ( t ) S O C m i n ) × η b c 0 0 ; Otherwise
S L s s a p v p c p p ( x ) = S L ( x ) 1 + ψ p r ( x , x ) [ E p r s s a p v p c p p ( x ) E p r R ( x ) + E p r p d ( x ) + E p r p s ( x ) ] E p r R ( x ) + y = 1 , y x T ψ p r ( x , y ) [ E p r s s a p v p c p p ( y ) E p r R ( y ) + E p r p d ( y ) + E p r p s ( y ) ] E p r R ( y ) ; for all x , y T
where
E p r s s a p v p c p p ( t ) = E p r R + δ E p r s s a p v p c p p ( t )

3.4. Point Forecasting Using LSTM and Uncertainty Modeling Using Monte Carlo Simulations

Uncertainty modeling of the VREs and the load demand of the system and accurately predicting their state hours in advance is crucial for efficient operation and resource capacity planning of a VRE-based community microgrid.

3.4.1. LSTM-Based Point Forecasting

This work employs the long short-term memory (LSTM) approach to predict next-hour load demand, solar irradiances, and wind speed point focus for each period for the entire scheduling horizon. LSTM is a distinct variation of RNN (recurrent neural network) with improved prediction capabilities [25]. The distinctive gate mechanism employed in LSTM makes it robust to overcome the drawbacks of vanishing gradients during backpropagation through time compared to other deep learning techniques [26]. This allows LSTM to retain long-term dependencies in sequential data, making it a powerful choice for sequence-to-sequence modeling [27]; thus, it is selected in this study based on its outstanding capability in time series forecasting.
LSTM consists of a cell state and three gates: input, forget, and output [28]. The cell state is a pathway for information modulated by the gates. The input gate (Equation (16)) determines what information is stored, the forget gate (Equation (15)) chooses what to retain or discard, and the output gate (Equation (18)) selects the data to be output based on the cell state [29,30].
f t = σ ( W f · [ h t 1 , x t ] + b f ) ; forget gate
i t = σ ( W i · [ h t 1 , x t ] + b i ) and C ˜ t = tanh ( W C · [ h t 1 , x t ] + b C ) ; input gate
C t = f t × C t 1 + i t × C ˜ t ; update of cell state
o t = σ ( W o [ h t 1 , x t ] + b o ) and h t = o t × tanh ( C t ) ; output gate
where σ is the sigmoid function, and h t 1 is the output from the previous time step. x t is the input for the current time step. b and W are the biases and weights for each gate, respectively.

3.4.2. Uncertainty Modeling with Monte Carlo

To ensure the robustness of the system designed with a guaranteed acceptable level of reliability, Monte Carlo simulations (MCSs) have been incorporated into the optimal capacity planning to account for the uncertainty of the VREs and the load demand. MCS methodology utilizes statistical sampling processes to generate random scenarios for stochastic parameters: solar irradiance [31], load demand, and wind speed that reflect their uncertainty [14]. The MCS technique models uncertainties by sampling inputs and transforming them using probability distribution functions to generate scenarios [31,32]. This strategy yields a finite number of possible scenarios for all stochastic parameters, enabling a thorough evaluation of system robustness under various conditions.

3.5. MOPSO Algorithm and TOPSIS Ranking Technique

This study employs a hybrid approach combining a MOPSO (multi-objective particle swarm optimization) and TOPSIS (technique for order preference by similarity to ideal solution) to solve and select the best optimal system configuration and operation approach for the community microgrid. Based on the non-dominated alternatives obtained from the MOPSO algorithm, TOPSIS ranks the non-dominated solutions and selects the best solution.

3.5.1. Multi-Objective Particle Swarm Optimization

A MOPSO is a technique inspired by natural swarm behaviors to solve discrete and continuous optimization problems [33]. It focuses on identifying optimal objective function values using two solution points: local best P b e s t i = ( p i 1 , p i 2 , , p i d ) and global best P b e s t g = g b e s t = ( p g 1 , p g 2 , , p g d ) . The subsequent particle positions are updated as:
V i d t + 1 = w × v i d k + c 1 × r a n d 1 × ( P b e s t i d X i d ) + c 2 × r a n d 2 × ( g b e s t d X i d )
X i d k + 1 = X i d k + V i d k + 1
w = w d a m p × i t e r m a x i t e r i t e r m a x + w i
where i t e r is the current iteration, and i t e r m a x denotes the total number of iterations.
The MOPSO approach, in this work, sorts non-dominated solutions for improved search accuracy within efficient, non-inferior, and admissible Pareto fronts; it is boosted further by a mutation operator identical to the NSGA II algorithm [34]. For a multi-objective problem with n objective functions and m decision variables, the goal is to minimize:
minimize f ( x ) = [ f 1 ( x ) , f 2 ( x ) , f n ( x ) ] for x * ε
g ( x ) 0
h ( x ) = 0
Here, g and h represent inequality and equality constraints, respectively. A point is Pareto optimal if:
i I ( f i ( x ) = f i ( x * ) )
or for at least one i I :
f i ( x ) > f i ( x * )

3.5.2. Technique for Order Preference by Similarity to Ideal Solution

The core concept of TOPSIS is that the best optimal alternative should be closest to the positive-ideal solution and farthest from the negative-ideal solution [35,36]. At both the application and theoretical levels, TOPSIS is a highly effectual technique for alternative evaluation in multi-criteria decision-making [37,38]. The TOPSIS procedure is as follows [39]:
Normalize the optimal alternative matrix ( x p , q ).
v p , q = x p , q 1 m x p , q 2
where v p , q represents the normalized attribute values.
Allocate weights ( w q ) to each of the attributes and compute the weighted normalized matrix ( E p , q ):
E p , q = v p , q × w q
Determine the positive-ideal E + and negative-ideal E solutions, respectively, as follows:
E + = m a x r p , q | q Q m i n r p , q | q Q
E = m i n r p , q | q Q m a x r p , q | q Q
Compute the Euclidean distances from both the negative-ideal B p and positive-ideal B p + solutions:
B p + = 1 m r p , q r q + 2
B p = 1 m r p , q r q 2
compute O p , which represents the relative closeness to the ideal solution.
O p = B p / B p + B p +
Finally, alternative ranking based on the preference order is performed.

4. Multi-Objective Optimization Problems Formulation and Simulation Setup

The optimization process involves three techno-economic objective functions to determine the most cost-effective and efficient capacity configuration and operation planning for a community microgrid. The three objectives encompass the economic criterion, reliability requirements, and the management or curtailment of surplus VRE generation and/or load curtailment, all while considering uncertain operating conditions.

4.1. Objective Functions

  • Objective 1—Total Life-Cycle Cost (TLCC) minimization (Economic criteria): The first objective function is formulated as a total life-cycle cost ( T L C C ) minimization problem, as elaborated in Equation (26), which aims to optimize the net present value ( N P V ) of all costs associated with the system components incurred throughout the system’s lifetime. The T L C C is composed of the investment costs ( I C z ), annual operation and maintenance costs ( O & M z ), replacement costs ( R C z ), and salvage value ( S V z ).
    min T L C C = z = 1 Z I C z + n = 1 n = N O & M z + R C z S V z ( 1 + i ) n × C z
    where in Equation (26), z is used as an index to identify each specific component within the system. The decision variables, denoted as C z , signify the most efficient capacities for the individual system components, namely PV (photovoltaic), ESS (energy storage system), and WT (wind turbine). The project lifetime and the yearly time step are denoted as N and n, respectively. The decision variables are the capacities of the WT, denoted as S w c p ; the photovoltaic panels (PV), denoted as S w c p ; and the BESS, denoted as ( S w c p ).
  • Objective 2—Deficiency of power supply probability (Reliability criteria): DPSP is the ratio of the total curtailed load demand (the unserved energy demands) ( S L c u r t ) to the total load demand over an entire operation planning period (T).
    D P S P = t = 1 T S L c u r t ( t ) t = 1 T S L ( t ) × 100 %
    This score reflects the extent to which the system relies on demand curtailment to balance power supply and demand. The lower the DPSP, the less the system relies on demand curtailment (unserved energy demands), and the more reliable the system [40,41].
  • Objective 3—Loss of Produced Power Probability (LPPP): LPPP is the proportion of total curtailed power (wasted/unused) from VREs ( S g c u r t ) to the total power that all the VRE sources could potentially generate ( S g ) during the entire operation period (T). LPPP is a metric that signifies the likelihood of non-utilization of available variable renewable energy (VRE) due to factors such as BESS restrictions, demand–supply imbalances, or operational constraints [42].
    L P P P = t = 1 T S g c u r t ( t ) t = 1 T S g ( t ) × 100 %
    A high LPPP indicates a substantial waste of potential renewable energy, signaling suboptimality in the power system’s operation and design.

4.2. Constraints

  • Demand-generation power balance constraints: At any given time (t), the combined power from VREs and the BESS should meet the load demand, regardless of the DRP or uncertainty considerations:
    S w ( t ) + S p v ( t ) + S b d s ( t ) S b c h ( t ) = S L ( t ) ; ( case 1 ) S w ( t ) + S p v ( t ) + S b d s ( t ) S b c h ( t ) = S L t o u v p c p p ( t ) ; ( case 2 ) S w ( t ) + S p v ( t ) + S b d s ( t ) S b c h ( t ) = S L s s a p v p c p p ( t ) ; ( case 3 ) S w ( t ) + S p v ( t ) + S b d s ( t ) S b c h ( t ) = S L ( t ) ; ( case 4 ) S w ( t ) + S p v ( t ) + S b d s ( t ) S b c h ( t ) = S L t o u v p c p p ( t ) ; ( case 5 ) S w ( t ) + S p v ( t ) + S b d s ( t ) S b c h ( t ) = S L s s a p v p c p p ( t ) ; ( case 6 )
    Cases 1 through 3 are deterministic, while Cases 4 through 6 incorporate load and VREs uncertainties.
  • BESS constraints:
    S b c h ( t ) S b c h , m a x S b d s ( t ) S b d s , m a x
    Equation (30) represents the upper bounds for both the discharging ( S b d , m a x ) and charging power ( S b c , m a x ) of the BESS, which are determined by the C-Rate of the BESS, which is the rate at which the BESS is being charged or discharged relative to its total capacity.
  • FDR constraint:
    δ S L f l x , m i n ( t ) δ S L f l x ( t ) δ S L f l x , m a x ( t )
    where ( δ S L f l x , m i n ) and ( δ S L f l x , m a x ) correspond to the minimum and maximum allowable capacities for an FDR, respectively, at any given time (t).
  • Set electricity price limits:
    E p r d r p , m i n δ E p r d r p ( t ) E p r d r p , m a x
    where ( E p r d r p , m a x ) and ( E p r d r p , m i n ) represent the maximum and minimum electricity price limits, respectively, at any given time (t).
  • VREs power output limits:
    0 S p v ( t ) S p v c p
    0 S w ( t ) S w c p

4.3. Optimization Parameters, Case Study, and Simulation Cases

This research explores various strategies for capacity sizing and operational planning for a VRE-based community microgrid using MOPSO-TOPSIS in a Matlab environment. Central to these strategies are forecasting, DRPs, and uncertainty considerations. Monte Carlo simulations (MCSs) are employed to model the uncertainty of VREs and load variations. Load demand uncertainty is assumed to stem from two factors: the everyday fluctuations in load demand typically experienced in a power system and the potential uncertainties related to customer response to pricing volatility, among other factors due to the implementation of DRP strategies. The mean absolute error (MAE) error metrics are initially calculated based on the results of LSTM forecasting using Scikit-learn in Python. The resulting MAE is then used as a sufficient indicator of the level of uncertainty for each data point in time to quantify the uncertainty. The MCS then generates 50 scenarios within a specified percentage range of the MAE [43,44]. This approach allows the simulation of various potential outcomes for the stochastic parameters within each period, thus facilitating a comprehensive evaluation of system robustness under various conditions.

4.3.1. Techno-Economic Parameter and Case Study

The proposed planning for a VRE-based community microgrid, aiming for a transition to 100% VREs, has been investigated and validated using a real case study of an isolated community microgrid in Kenya as a test benchmark. The existing microgrid system within the case study predominantly depends on diesel power generation. The techno-economic parameters, alongside the hourly load demand and climatic data for the Kenyan case within the geographical space of 2.3369° N, 37.9904° E are all drawn from the actual conditions of this specific area, as detailed in Table 1 [45,46,47].

4.3.2. Simulation Cases

In this paper, six distinct simulation cases are investigated, each representing a different approach for the optimal planning and capacity sizing of a community microgrid:
  • Case 1—Deterministic-based Planning (base case): This case focuses on capacity sizing and operation planning without considering DRP and forecasting. A flat reference pricing scheme is adopted in this case.
  • Case 2—Deterministic-based planning considering TOU-VP-CPP DRP: This case integrates the time-of-use (TOU) with variable peak critical pricing (TOU-VP-CPP DRP). In this case, a TOU pricing model is merged with a VP-CPP DRP overlay for exceptional events. During a normal state, the load profile is categorized into three pricing periods: peak demand from 7 p.m. to 11 p.m. at 150% of the flat rate, off-peak from 8 a.m. to 7 p.m. at the reference price, and low peak at 50% of the flat rate. During an extreme event or critical microgrid state, the pricing is set to 200% of the reference price.
  • Case 3—Deterministic-based planning considering SSAP DRP: A shortage/surplus-based adaptive pricing (SSAP) DRP is introduced. The pricing setup is dynamic, with the maximum and minimum price limits set to 150% and 50% of the reference price, respectively, during the normal microgrid state. During extreme events, the price is set to an extreme rate of 200% of the reference price.
  • Case 4—Stochastic-based planning considering uncertainty: This case accounts for the uncertainty in VREs and the load demand using MCSs without incorporating any DRPs or forecasting in the operation strategy. The pricing scheme is similar to that of Case 1.
  • Case 5—Stochastic-based planning considering uncertainty, TOU DRP, and LSTM forecasting: This case employs stochastic optimization with MCSs to account for the uncertainty in VREs and the load demand. It optimizes operation planning using time-of-use variable peak critical peak pricing (TOU-VP-CPP DRP). The pricing structure is similar to that of Case 2.
  • Case 6—Stochastic planning considering uncertainty, LSTM forecasting, and SSAP DRP: The system incorporates SSAP DRP and employs forecasting for VREs and the load demand to devise a flexible and responsive microgrid system. While the pricing scheme is similar to that of Case 3, electricity prices for the upcoming hour are announced one hour in advance based on the forecasted power imbalances in the system.
These cases primarily vary in their considerations of uncertainty, DRP structure, and incorporation of forecasting into the planning process.

4.3.3. Demand Response Structure and Flexible Demand Capacity

For all of the DRP schemes considered, the permissible FDR capacity is set to allowable values of ±10% of the overall system load at any specified time t. The electricity tariff and pricing structure are derived from the current tariffs established by the Kenyan Energy Regulatory Commission [52]. In this research, the reference electricity price E p r R is set to 15.80 US cents per kWh, which corresponds to the standard rate in the Kenyan electricity tariff setup. The elasticity of the demand, in relation to various system loadings, are detailed in Table 2.

5. Results, Analysis, and Discussions

The simulation results for the six cases were determined; each focused on optimal capacity and operation planning, with and without uncertainty, DRPs, and LSTM-based forecasting consideration. The MOPSO algorithm was employed in each case to determine optimal planning results. Several non-dominated optimal configurations for system components and their corresponding operational strategies were determined. The TOPSIS technique prioritized and determined the most favorable and techno-economic planning approach among the multiple optimal solutions (non-dominated).

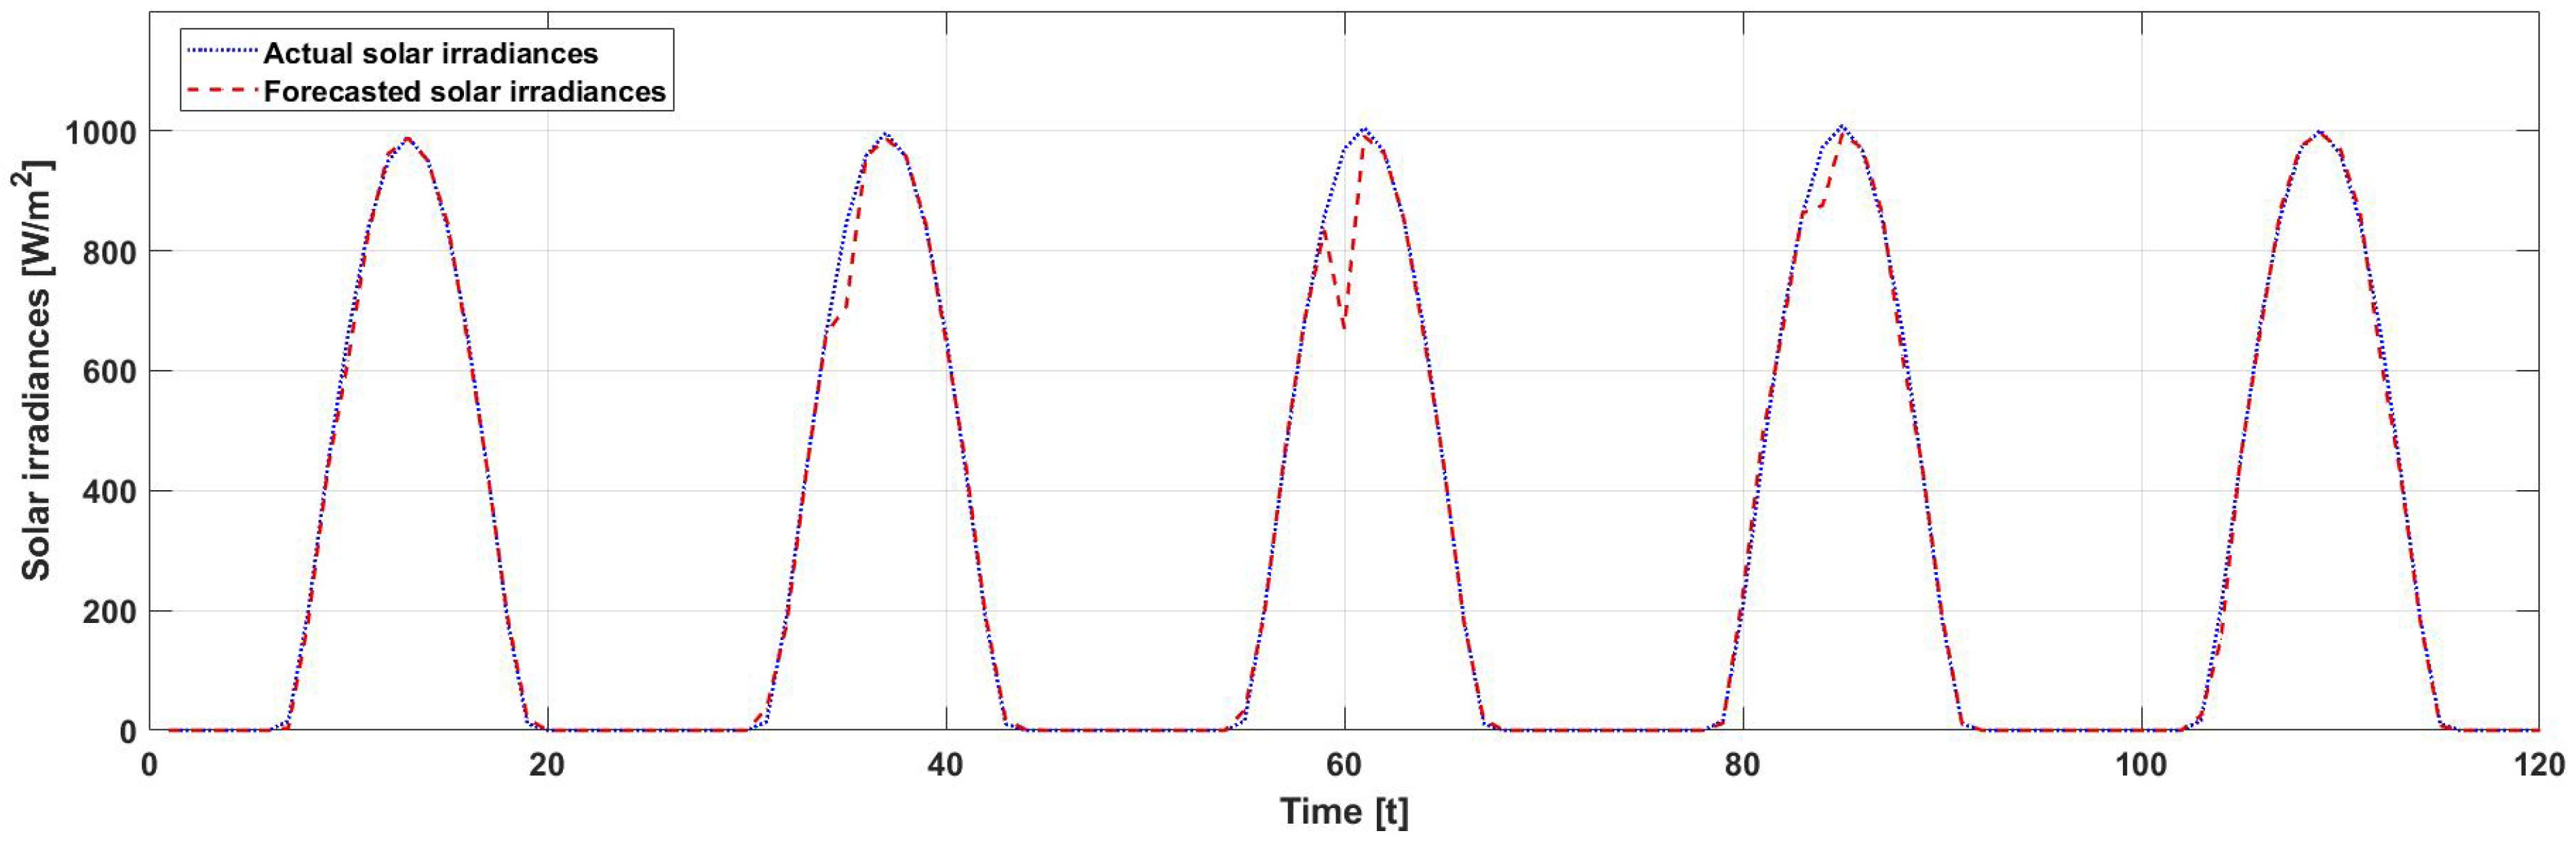
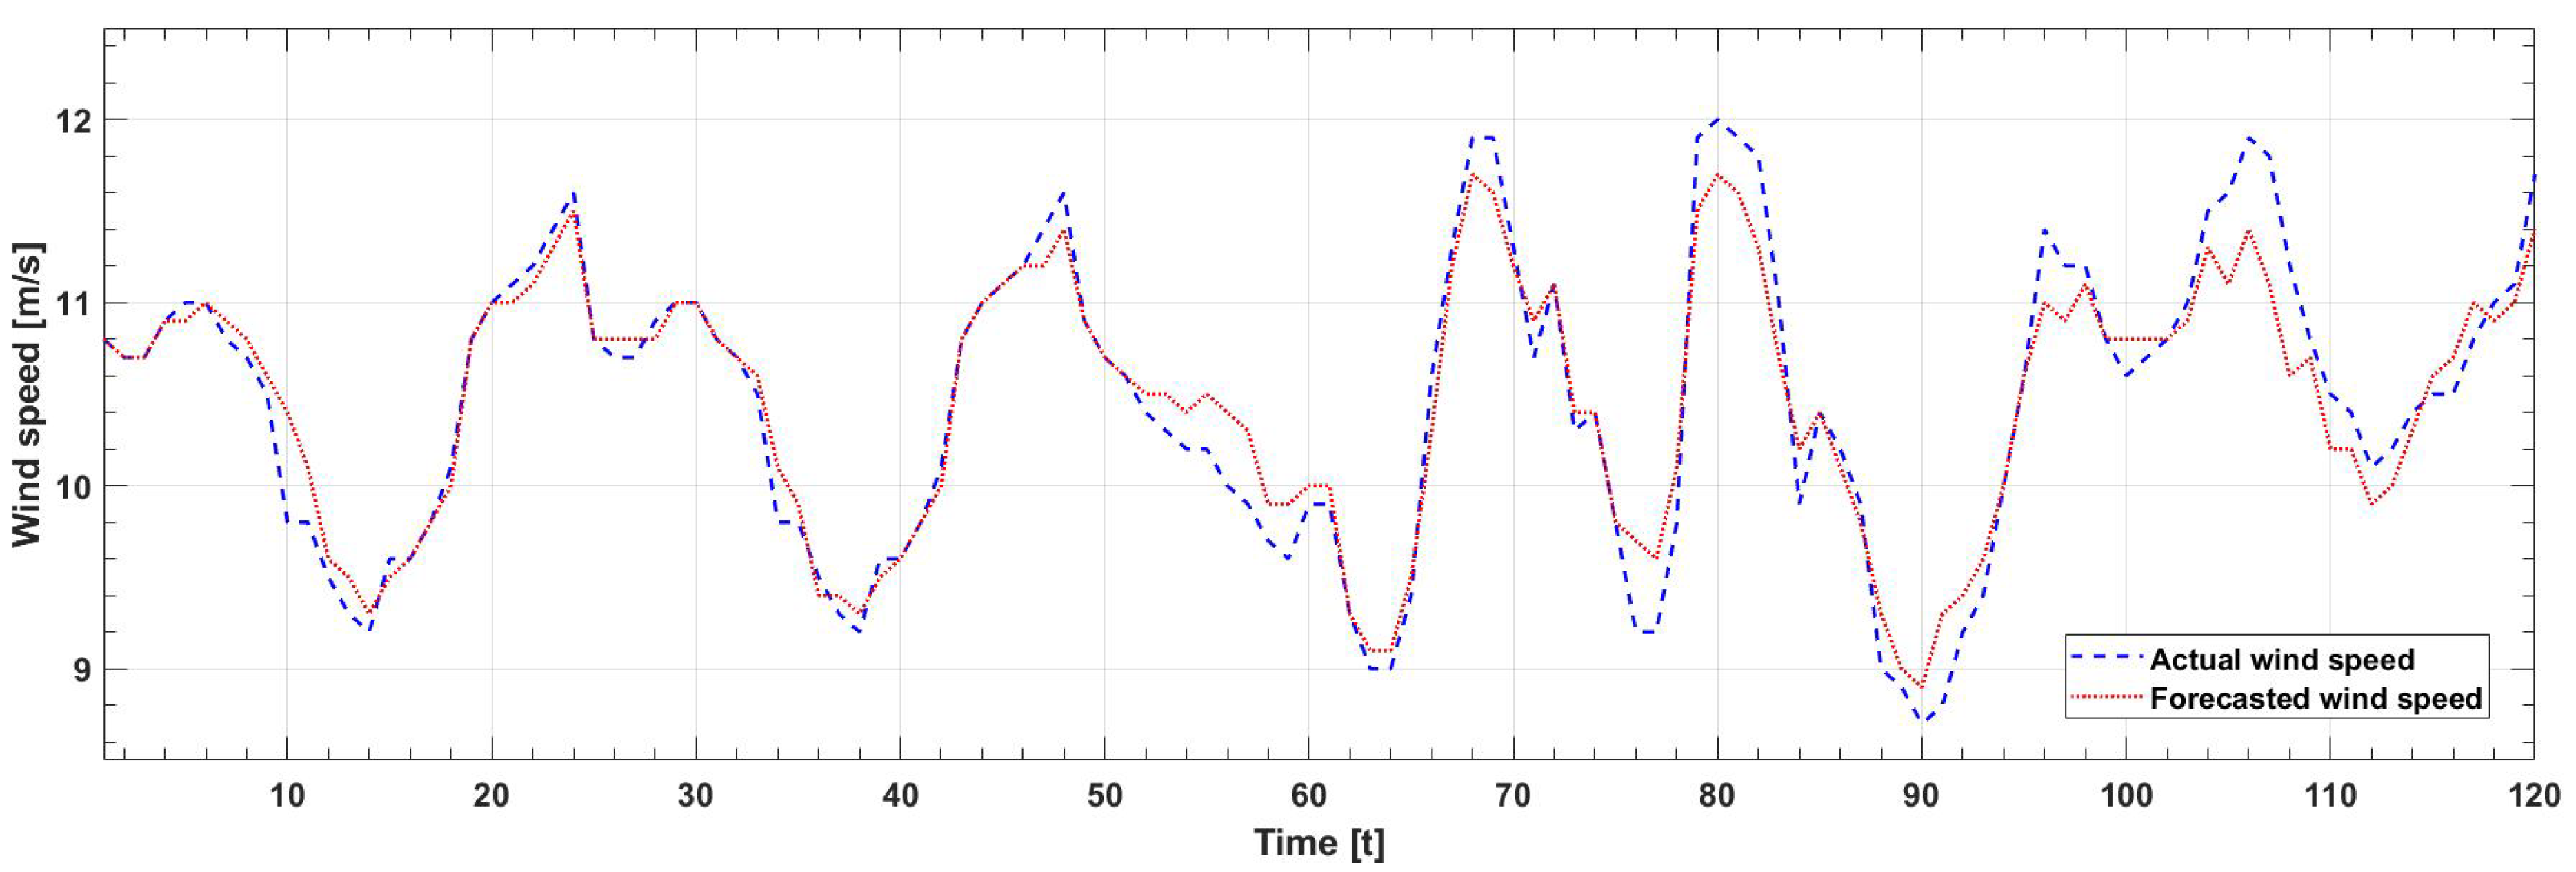
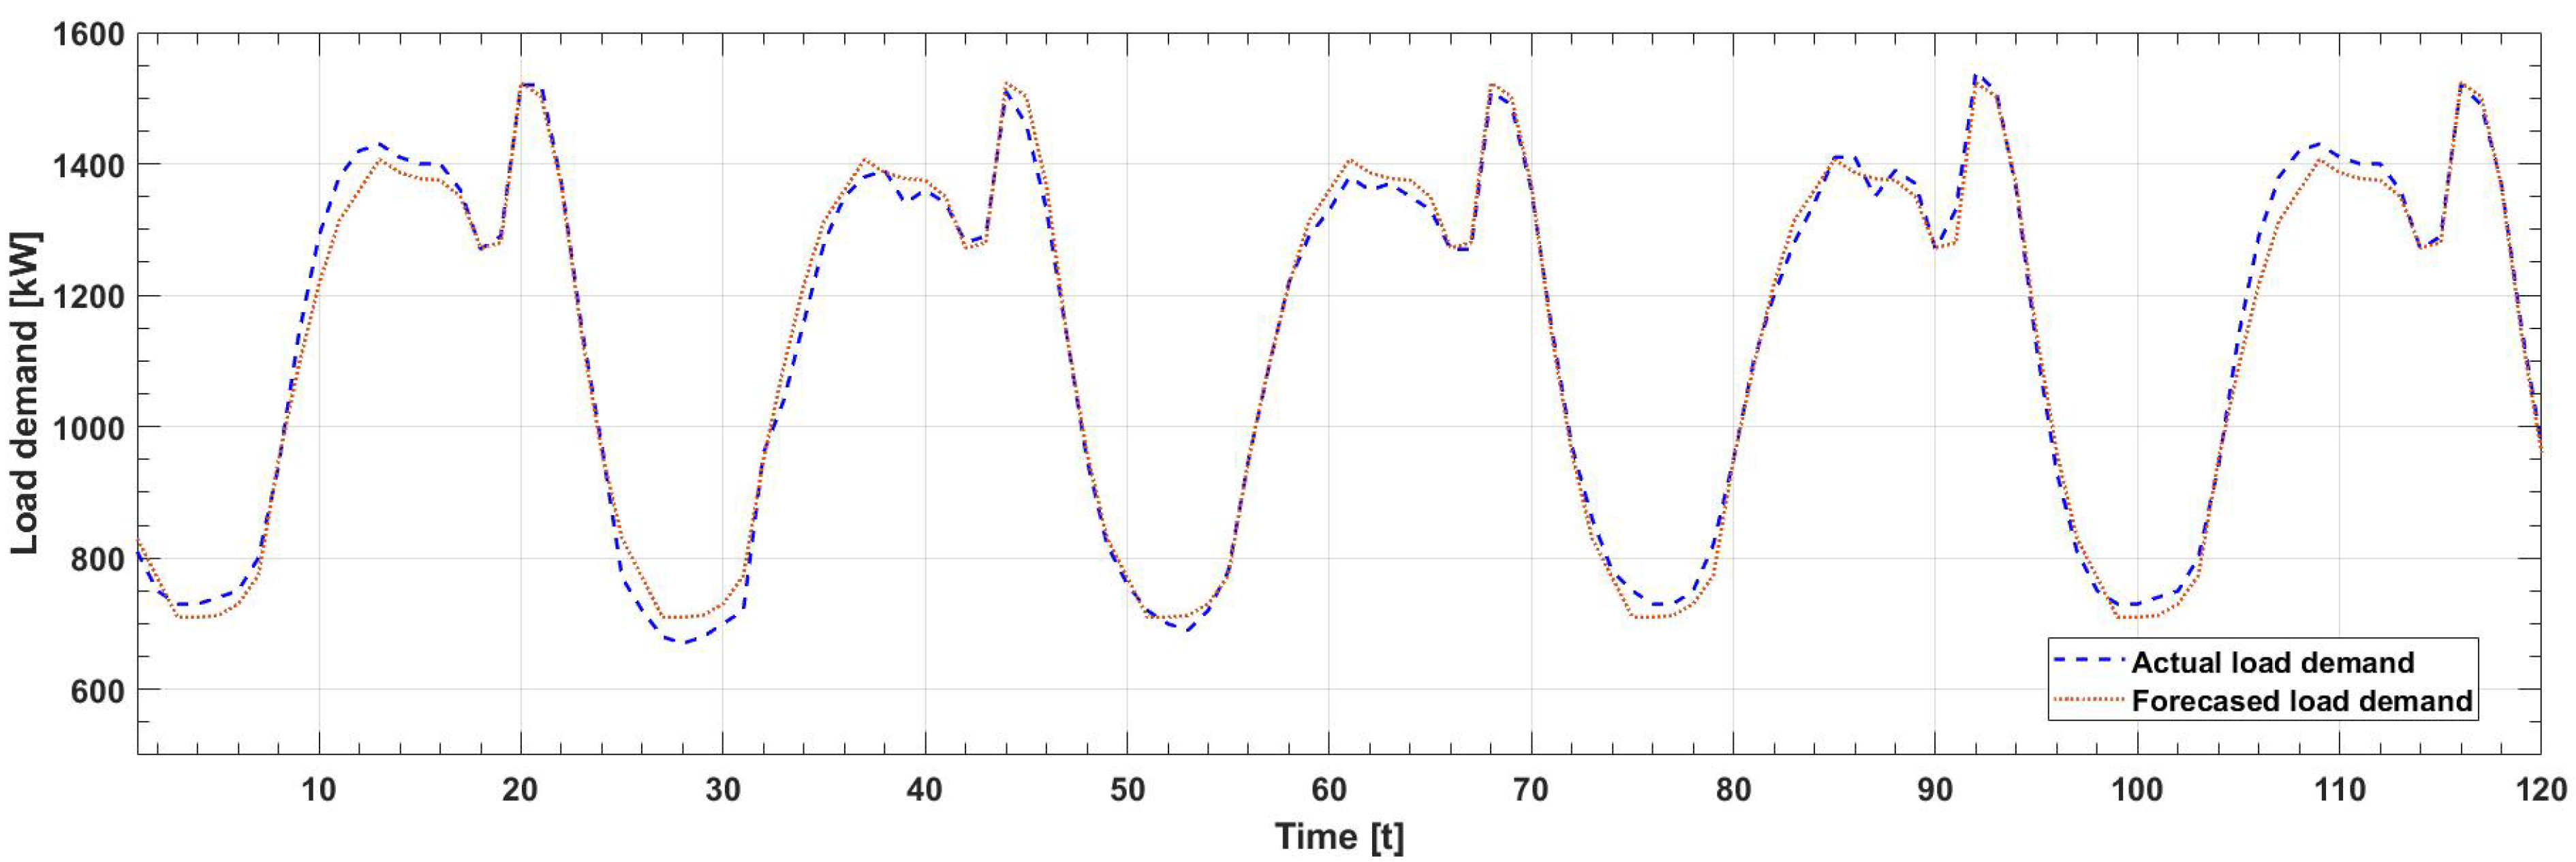
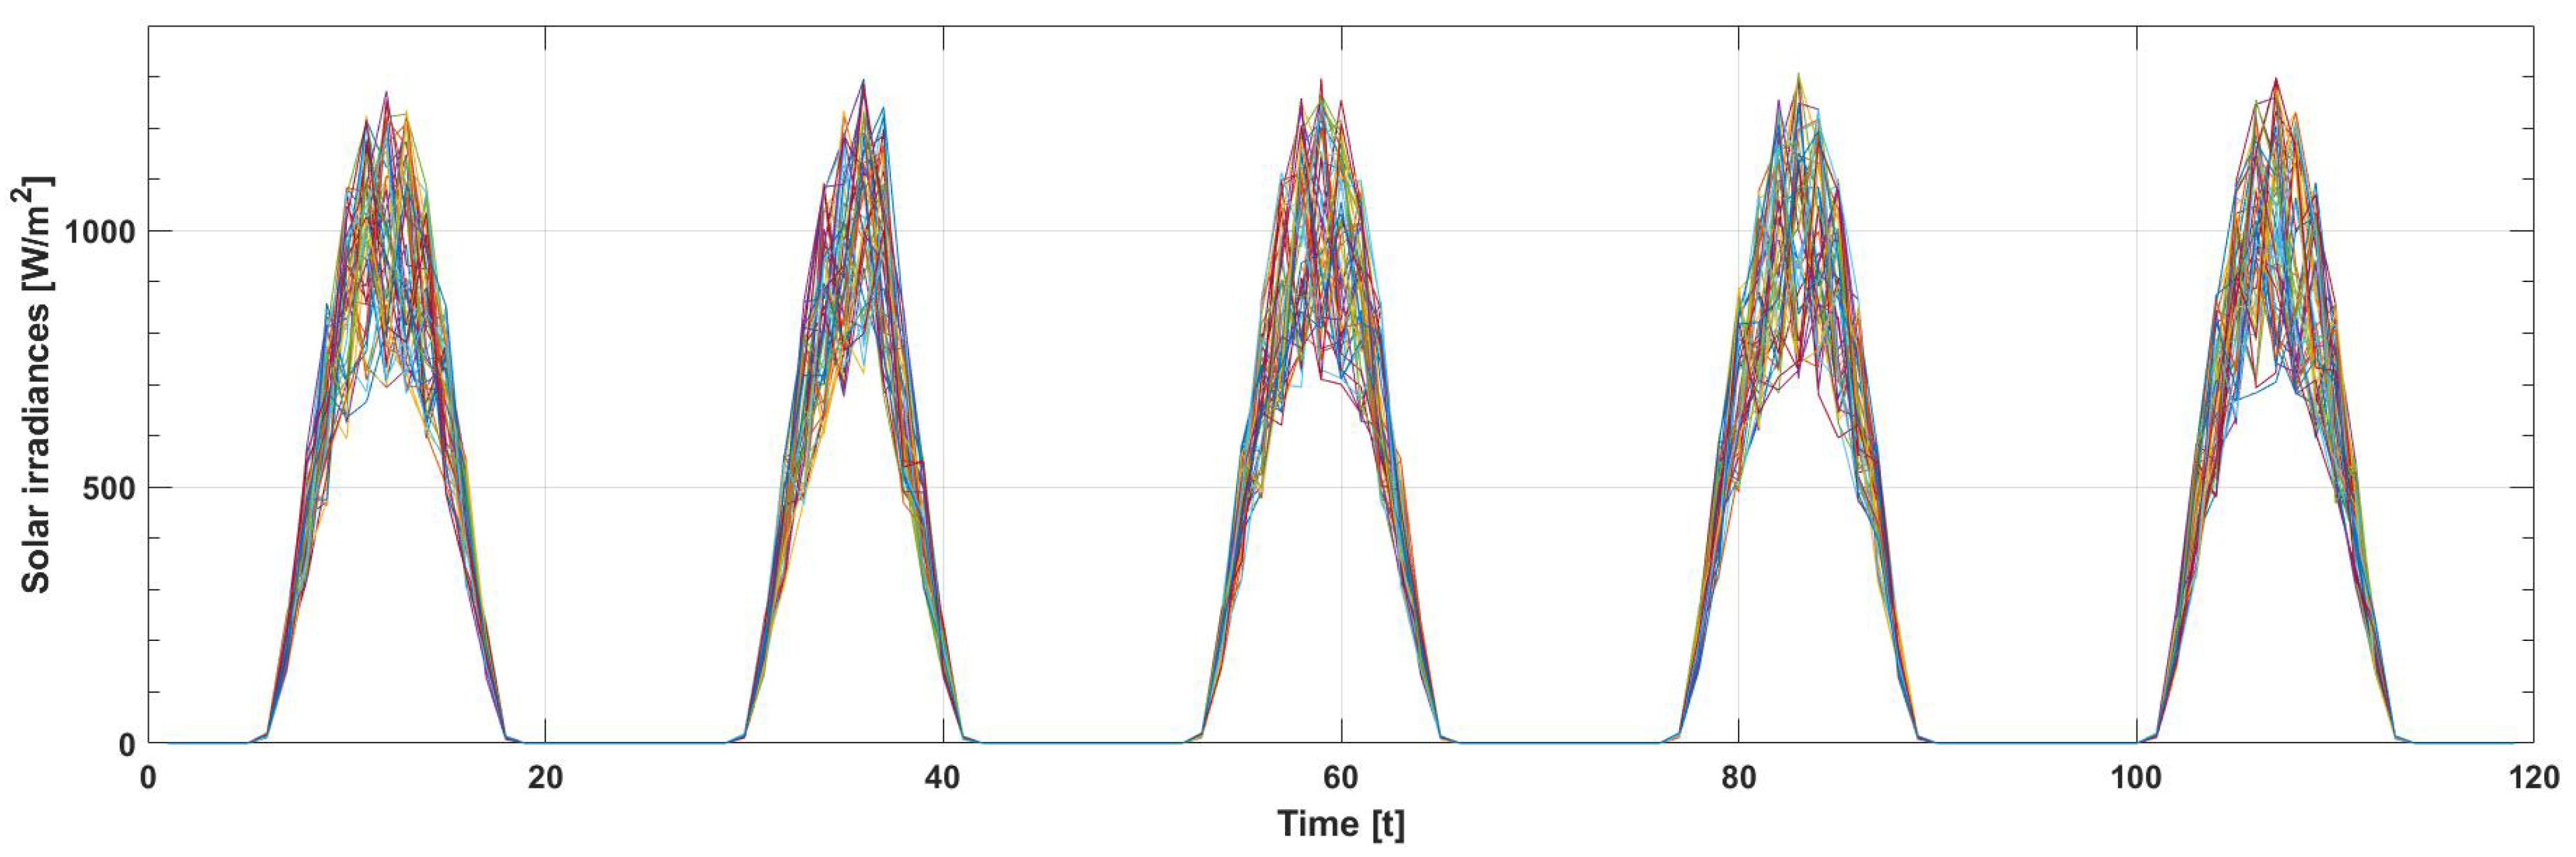
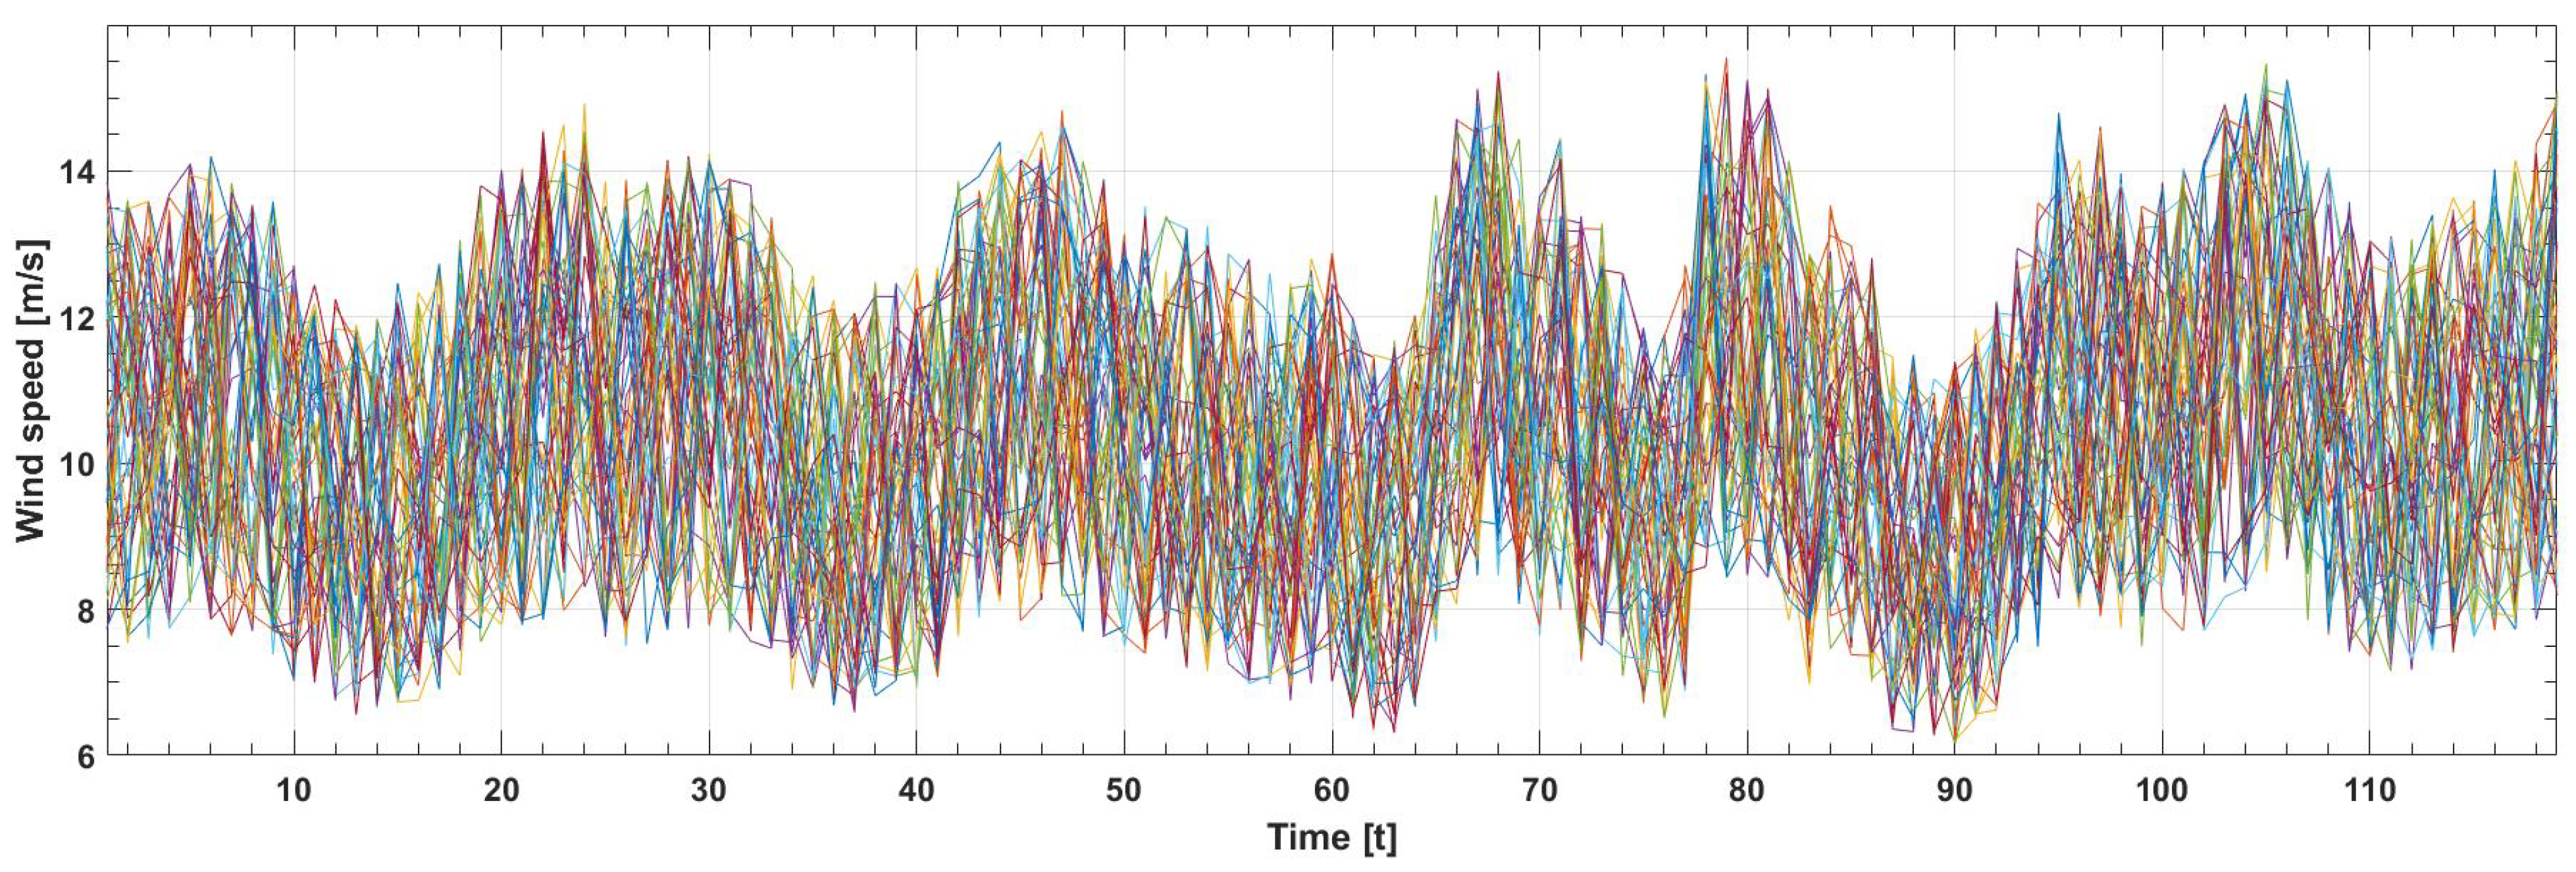
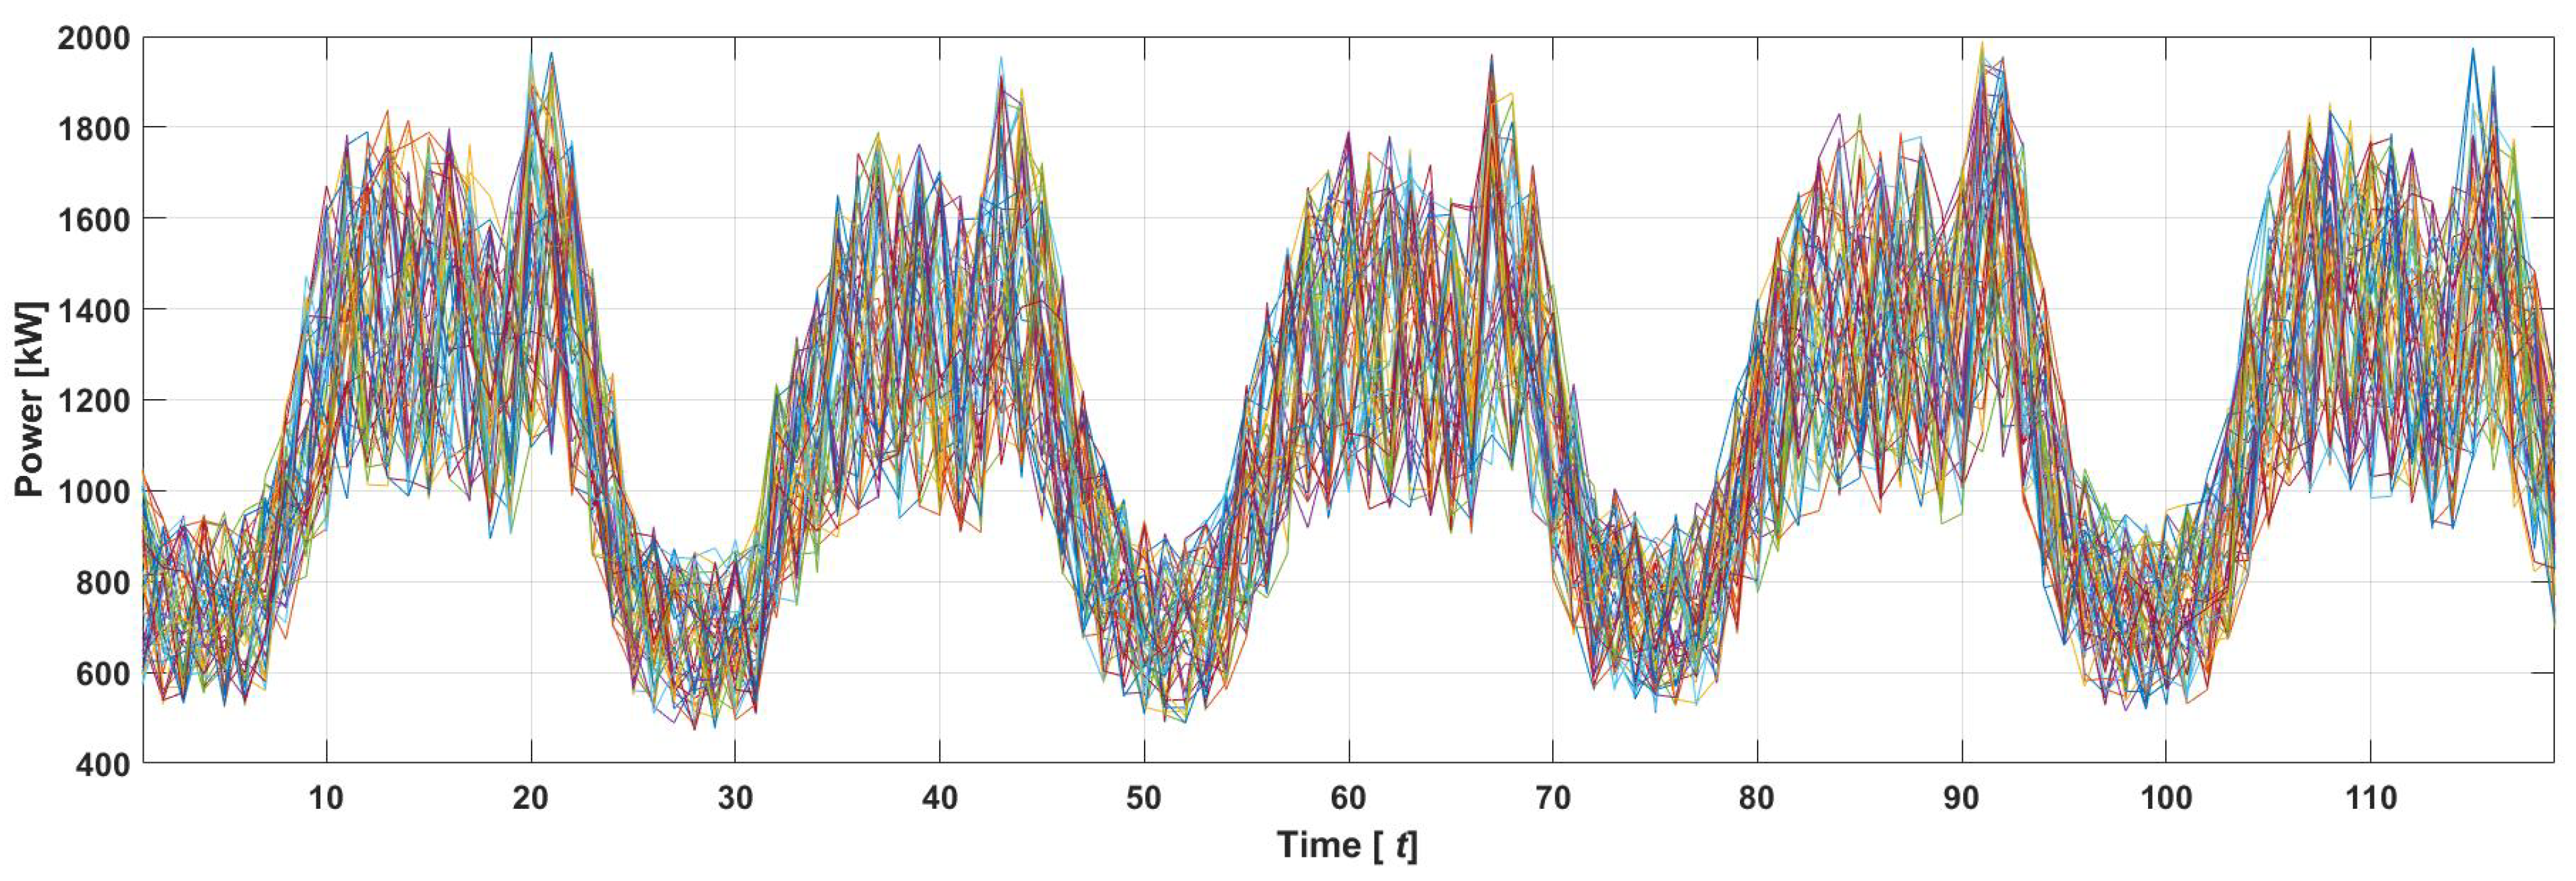
5.1. LSTM-Based Point Forecasts for Wind Speed, Solar Irradiances, and Load Demand

The LSTM forecasting model was utilized for DRP implementation and Monte Carlo-based scenario generation in Cases 4, 5, and 6. Figure 3, Figure 4 and Figure 5, contrast the actual values with the LSTM-predicted values for solar irradiances, wind speed, and load demand. The MAEs for wind speed and associated WT power were 0.14 m/s and 23.81 kW, respectively. For solar irradiances and the PV power output, the MAEs were 19.97 w/m2 and 21.07 kW, respectively, with the load demand forecast showing an MAE of 24.68 kW.
Drawing upon forecast accuracy indicators, MAE metrics were applied to generate scenarios using MCSs for wind speed, solar irradiance, and load demand in Cases 4, 5, and 6. The scenarios were generated within a 25% range, a margin determined by the highest MAE observed in the load demand forecast. To provide a concise view, only 50 generated scenarios are depicted in Figure 6, Figure 7 and Figure 8 for solar irradiances, wind speed, and load demand, respectively. The reliability of the LSTM forecasting model has proved effective for wind speed, solar irradiances, and load demand based on simulation results, as evidenced by the low MAE scores. Thus, the forecasting model was adopted in Cases 4, 5, and 6 to optimize the efficient use of VRE generation and mitigation of variability of VREs and the load demand. The LSTM model’s precision is invaluable in enhancing the operational efficiency and generating uncertainty scenarios for a stochastic optimization using the MCS technique.
A comprehensive analysis and discussion of the results for all cases considered is as follows:
Figure 6. Shows solar irradiance uncertainty scenarios based on MCSs.
Energies 16 06838 g006
Figure 7. Shows wind speed uncertainty scenarios based on MCSs.
Energies 16 06838 g007
Figure 8. Shows load demand uncertainty scenarios based on MCSs.
Energies 16 06838 g008

5.2. Case 1: Optimal System Component Capacities and Operation Planning without Considering Demand Response

Table 3 shows the optimal capacities of the microgrid’s components and the TLCC against their corresponding reliability (DPSP) and VRE curtailment (LPPP) percentages for the first four best-ranked non-dominated solutions. Figure 9a shows the non-dominated optimal Pareto front in 3D for the three objectives considered. As neither the DRP nor forecasting is considered, the microgrid is optimized and operated in its fundamental form. This solution is considered the least efficient for all cases because it neither anticipates demand fluctuations nor optimizes planning based on varying VRE generation. Thus, this case is considered a classical planning approach to capacity sizing and operational planning, providing a baseline against which to compare more advanced techniques.

5.3. Case 2: Optimal System Component Sizing and Operation Planning Considering TOU VP-CPP DRP

In case 2, incorporating TOU-VP-CPP DRP into the simulation introduced a more robust approach to planning. Figure 9b presents the non-dominated optimal Pareto front in 3D for Case 2, considering the three conflicting objectives: DPSP, TLCC, and LPPP. Compared to Case 1, Case 2 reveals a substantial cost reduction of around 5%, from $10,377,384.53 to $10,314,687.15 for the best-ranked results. This cost reduction, as shown in Table 3, is achieved without significantly impacting or compromising the system’s reliability (the DPSP is approximately 0.5% for both Cases 1 and 2). Implementation of the TOU VP-CPP DRP pricing structure largely contributes to this cost-saving. By encouraging consumers to shift loads from high-priced to low-priced periods throughout the day, energy-usage efficiency improves, potentially leading to further cost reductions. This impact is also evident in the decreased system component capacities, particularly the 12.7% reduction in BESS capacities for the best-ranked configuration, as compared to case 1. While the results based on VP-CPP application on top of TOU as a critical event mitigation strategy did not rank among the best, their role in averting total system collapse during periods of lower reliability and constrained generation is significant. However, this approach has a notable limitation. With its static pricing, the TOU VP-CPP DRP scheme lacked sensitivity to variations in VREs and demand. This lack of responsiveness and flexibility towards VREs hinders the system’s overall adaptability, affecting its techno-economic performance.

5.4. Case 3: Optimal System Component Sizing and Operation Planning Considering SSAP VP-CPP DRP

In this case, capacity and operation planning are simulated and assessed, considering the SSAP VP-CPP DRP. Figure 9c presents the non-dominated optimal Pareto front in 3D for Case 3. As evidenced in Table 3, this case outperformed all other cases in terms of costs, with the lowest TLCC of $10,278,836.96 and maximum reliability and a DPSP of 0.06% for the top-ranked result. Moreover, it demanded the minimal optimal component sizes, in particular, the BESS requirement of 3500 kWh, which is the minimum compared to Cases 1 and 2 (deterministic cases). The effectiveness of this case stems from its sensitivity to fluctuations in VREs and demand due to the superior feature of the advanced shortage/surplus-based adaptive pricing technique. This technique deploys dynamic and adaptive pricing to harness adequate FDR by adjusting electricity prices based on supply and demand balances. However, this approach is deterministic and does overlook the inherent uncertainty in load demand and VREs.

5.5. Case 4: Optimal System Component Capacities and Operation Planning Considering Uncertainty

This approach makes robust planning decisions by considering the inherent uncertainty in VRE output and the load demand based on MCS scenarios when determining optimal capacity sizing and operation planning. However, due to the introduction of these uncertainties, matching the VRE generation becomes challenging, necessitating larger component sizes for the PV, WT, and BESS.
As evident in Table 3, compared to all the planning cases, this configuration is the most expensive, with a TLCC of about $10,576,185.15 for the best-ranked system and $11,157,231.69 for the system with DPSP reliability set to the minimum. Similarly, this system has the highest VRE curtailment of about 10.31% of the total VRE-generated power compared to all cases investigated. Figure 9d presents the non-dominated optimal Pareto front in 3D for Case 4.
While this case delivers a highly robust decision framework, it does not incorporate predictive or responsive strategies. Its method for addressing uncertainties involves upscaling component capacities to increase reliability. However, this approach leads to the highest overall system cost compared to all of the scenarios.

5.6. Case 5: Optimal System Component Sizing and Operation Planning Considering LSTM-Based Forecasting, TOU VP-CPP DRP, and Uncertainty

This case closely resembles Case 2 but considers a stochastic optimization approach. Accounting for uncertainties makes planning decisions more robust, similar to Case 4. Combining TOU and VP-CPP pricing, the microgrid is designed to react proactively to unexpected power imbalances in critical and non-critical states, enhancing the overall reliability and efficiency.
Moreover, employing LSTM forecasting improves the accuracy of VREs output and load demand projections, resulting in a more cost-efficient design than Scenario 4. When comparing the best-ranked planning decisions in scenarios 1 and 4, there is an evident reduction in component sizes, which subsequently helps decrease the overall system cost. Figure 9e presents the non-dominated optimal Pareto front in 3D for Case 5.
An important point to note is that the LSTM forecasts enable the system to differentiate between overlooking critical and non-critical events. Such anticipatory capability allows for swift adjustments in pricing settings/decisions aligned with the TOU VP-CPP DRP model, further improving the power utilization strategy and overall efficiency. However, despite the aforementioned advantages of Case 5 over Case 1, 2, 3, and 4, this approach has a significant drawback. The utilization of LSTM forecasting remains under-exploited due to the predominance of non-dynamic pricing. The electricity pricing structure is still predominantly static due to the TOU VP-CPP DRP’s TOU aspect. The resultant electricity price does not mirror the instantaneous variations in VREs and demand in the system. This non-responsiveness necessitates bigger system components and increases the system’s cost compared to Case 2 as outlined in Table 3. This lack of agility and adaptability in response to VREs moderately diminishes the competitive edge of this planning approach.

5.7. Case 6: Optimal System Component Sizing and Operation Planning Considering LSTM-Based Forecasting, SSAP VP-CPP DRP, and Uncertainty

Case 6 presents a stochastic optimization approach combined with SSAP VP-CPP DRP and forecasting to devise an adaptable and resilient microgrid system that effectively addresses uncertainty. This design synergistically integrated the adaptive pricing strategy developed in Case 3 with the stochastic optimization under uncertainty inherent in Cases 4 and 5. According to the simulation results presented in Table 3, comparing the best-ranked techno-economic results, Case 6 excels over other cases in terms of costs (minimum TLCC) and optimized component sizes, especially the BESS, which stands as the most expensive component (the selected capacity of BESS in Case 6 is only 3200 kWh, while other cases have much bigger capacity sizes).
This system efficiently addresses uncertainties by coordinating precise forecasting and DRP techniques. By leveraging SSAP DRP and VRE forecasting, the microgrid swiftly responds to immediate supply-demand imbalances. The SSAP pricing strategically activates FDRs during VRE peak times and deactivates sufficient FDRs during periods of decreased VRE output. This approach reduces the reliance on the more expensive BESS solution, similar to the efficiencies observed in Case 3.
While the proactive management of uncertainties increases system robustness, evidenced by a notably low DPSP value of less than 0.04% in all the results tabulated in Table 3, indicating superior reliability, it also necessitates more significant system components (heftier investments), particularly PV and WT capacities. These increases render the system somewhat more expensive than Case 3. However, the robustness and adaptability devised in Case 6, especially during unforeseen critical states such as extreme weather conditions or power imbalances, indicates that the system performs exceptionally well, demonstrating superior reliability.
Though Case 3 may superficially seem economically advantageous, being cheaper in terms of its TLCC by approximately 4% for the best-ranked results and 1% for the scenario with the lowest DPSP (compared to Case 6), it is crucial to note that Case 3 follows a deterministic approach. In practical terms, scenario 6 offers a more realistic and robust blueprint to weather the harshest scenarios, representing a near-ideal realization of a community microgrid. Overall, scenario 6 sets a compelling precedent for future community microgrids’ capacity and operational planning under uncertainty, especially those targeting 100% VRE-based generation.

6. Conclusions

This paper proposed a comprehensive and holistic approach to microgrid planning, which incorporates DRP strategies, accurate forecasting, and integrated sizing and operation planning for managing the complexities and uncertainties in VRE-based community microgrids. This study aimed at evaluating and determining the best optimal configuration and planning approach for component sizing and operation planning with consideration for flexibility management strategies for a community microgrid with the lowest TLCC, highest reliability, and minimum VRE curtailments. Six cases with unique strategies for managing challenges posed by VREs and load demand in the optimal planning and operation of a community microgrid, consisting of BESS, PV, and WT, were investigated. From the results, Case 2, which considered the TOU VP-CPP DRP pricing, achieved a 5% TLCC without sacrificing reliability compared to Case 1, which is the base case without the DRP, primarily due to TOU VPP on the pricing. However, it lacks sensitivity to VREs and demand variations. On the other hand, Case 3 considered the proposed SSAP VP-CPP DRP, yielding optimal system planning at a higher reliability performance with a minimum TLCC (of about 7% compared to Case 1) due to its adaptive pricing based on the supply-demand power imbalances state in the system; however, the optimization mentioned above is based on a deterministic planning approach. The simulation results for Cases 4, 5, and 6 are based on stochastic planning approaches. Case 4 considered VRE and load demand uncertainties, offering higher resilience, although at a higher TLCC due to more extensive system component requirements. Case 5, an improvement upon Case 2 but based on stochastic-based planning, integrates LSTM-based forecasting for VRE output and load demand and yields better performances in reliability. However, its effectiveness is hampered by the fixed pricing inherent in TOU DRP. Overall, Case 6 amalgamates features from preceding cases, incorporating SSAP DRP based on adaptive pricing, LSTM-based forecasting, and stochastic optimization. This results in enhanced adaptability and resilience to uncertainties. Incorporating LSTM forecasting combined with SSAP VP-CPP DRP further enhances the system, providing foresight and ensuring ample time for effective mobilization of FDRs to shift demand to periods of surplus generation or curtail demand during supply shortfalls. This synergistic approach likely bolsters the microgrid’s resilience against extreme events and ensures optimal VRE power utilization. Although Case 6 is more expensive than Case 3, its robust decision-making under uncertainty provides guaranteed reliability under extreme weather events or upon the occurrences of a critical state in the microgrid system. Thus, the proposed planning approach can be considered the optimal blueprint for developing future VRE-based community microgrid systems.

Author Contributions

M.K.K.: conceptualization, modeling, investigation, and writing—original draft; O.B.A.: resource, validation, and writing; M.F.: resource and validation; P.M.: resource; T.S.: supervision. All authors have read and agreed to the published version of the manuscript.

Funding

This research received no external funding.

Data Availability Statement

Data were obtained from Rural Electrification and Renewable Energy Corporation (REREC), Republic of Kenya, and are available from the authors upon request, subject to approval by REREC.

Acknowledgments

The authors thank the REA staff in the Kenya office for providing the primary data used in this research.

Conflicts of Interest

The authors declare no conflict of interest.

Nomenclature

V R E variable renewable energy
B E S S battery energy storage system
D P S P deficiency of power supply probability (%)
P V photovoltaic system
W T wind turbine
Tplanning horizon (8760 h)
thour index (hour)
E p r p d penalty rates DRP (US cents/kWh)
E p r p s incentive rates for DRP (US cents/kWh)
S p v c wind turbine’s power capacity (kW)
S w c wind turbine’s power capacity (kW)
S g instantaneous total VREs output power (kW)
S p v instantaneous power output of PV (kW)
S w instantaneous power output of WT (kW)
S b c BESS installed capacity (kWh)
S O C m a x BESS maximum state of charge (kWh)
S O C m i n BESS minimum state of charge (kWh)
S O C c r t BESS critical state of charge (kWh)
δ S L f l x instantaneous capacity of FDR (kW)
δ S L m a x maximum allowable FDR capacity (kW)
δ S L m i n minimum allowable FDR capacity (kW)
F D R flexible demand resource
D R P demand response program
V P C P P D R P variable peak critical peak pricing DRP
T O U D R P time-of-use DRP
T O U V P C P P D R P TOU with VP-CPP DRP
S S A P D R P shortage/surplus-based adaptive pricing DRP
S S A P V P C P P D R P shortage/surplus-based adaptive pricing with VP-CPP DRP
S L load demand (kW)
E p r R reference price of electricity (US cents/kWh)
E p r T O U V P C P P D R P TOU-VP-CPP DRP electricity price (US cents/kWh)
E p r S S A P V P C P P D R P SSAP-VP-CPP DRP electricity price (US cents/kWh)
Nproject lifetime (years)
S L c u r t curtailed load demand
S g c u r t curtailed power from VREs
finflation rate (%)
iannual interest rate (%)
ddiscount rate (%)
O a n d M operation and maintenance
I I incident solar irradiance (W/m2)
T e m p temperature of the PV module
α p temperature coefficient of the PV module
Λ p v derating factor of PV (%)
D R demand response

References

  1. Salehi, N.; Martínez-García, H.; Velasco-Quesada, G.; Guerrero, J.M. A Comprehensive Review of Control Strategies and Optimization Methods for Individual and Community Microgrids. IEEE Access 2022, 10, 15935–15955. [Google Scholar] [CrossRef]
  2. Yang, J.; Su, C. Robust optimization of microgrid based on renewable distributed power generation and load demand uncertainty. Energy 2021, 223, 120043. [Google Scholar] [CrossRef]
  3. Rekioua, D. Energy Storage Systems for Photovoltaic and Wind Systems: A Review. Energies 2023, 16, 3893. [Google Scholar] [CrossRef]
  4. Sahri, Y.; Belkhier, Y.; Tamalouzt, S.; Ullah, N.; Shaw, R.N.; Chowdhury, M.S.; Techato, K. Energy management system for hybrid PV/wind/battery/fuel cell in microgrid-based hydrogen and economical hybrid battery/super capacitor energy storage. Energies 2021, 14, 5722. [Google Scholar] [CrossRef]
  5. Khalid, M. A review on the selected applications of battery-supercapacitor hybrid energy storage systems for microgrids. Energies 2019, 12, 4559. [Google Scholar] [CrossRef]
  6. Kiptoo, M.K.; Adewuyi, O.B.; Howlader, H.O.R.; Nakadomari, A.; Senjyu, T. Optimal Capacity and Operational Planning for Renewable Energy-Based Microgrid Considering Different Demand-Side Management Strategies. Energies 2023, 16, 4147. [Google Scholar] [CrossRef]
  7. Kamwa, I.; Bagherzadeh, L.; Delavari, A. Integrated Demand Response Programs in Energy Hubs: A Review of Applications, Classifications, Models and Future Directions. Energies 2023, 16, 4443. [Google Scholar] [CrossRef]
  8. Shariatzadeh, F.; Mandal, P.; Srivastava, A.K. Demand response for sustainable energy systems: A review, application and implementation strategy. Renew. Sustain. Energy Rev. 2015, 45, 343–350. [Google Scholar] [CrossRef]
  9. Adewuyi, O.B.; Folly, K.A.; Oyedokun, D.T.; Sun, Y. Artificial Intelligence Application to Flexibility Provision in Energy Management System: A Survey. In Advances in Artificial Intelligence for Renewable Energy Systems and Energy Autonomy; Springer: Berlin/Heidelberg, Germany, 2023; pp. 55–78. [Google Scholar]
  10. Kiptoo, M.K.; Adewuyi, O.B.; Lotfy, M.E.; Amara, T.; Konneh, K.V.; Senjyu, T. Assessing the techno-economic benefits of flexible demand resources scheduling for renewable energy–based smart microgrid planning. Future Internet 2019, 11, 219. [Google Scholar] [CrossRef]
  11. Conteh, A.; Lotfy, M.E.; Adewuyi, O.B.; Mandal, P.; Takahashi, H.; Senjyu, T. Demand response economic assessment with the integration of renewable energy for developing electricity markets. Sustainability 2020, 12, 2653. [Google Scholar] [CrossRef]
  12. Kaluthanthrige, R.; Rajapakse, A.D. Demand response integrated day-ahead energy management strategy for remote off-grid hybrid renewable energy systems. Int. J. Electr. Power Energy Syst. 2021, 129, 106731. [Google Scholar] [CrossRef]
  13. Kharrich, M.; Akherraz, M.; Sayouti, Y. Optimal sizing and cost of a Microgrid based in PV, WIND and BESS for a School of Engineering. In Proceedings of the 2017 International Conference on Wireless Technologies, Embedded and Intelligent Systems (WITS), Fez, Morocco, 19–20 April 2017; pp. 1–5. [Google Scholar]
  14. Gamil, M.M.; Senjyu, T.; Masrur, H.; Takahashi, H.; Lotfy, M.E. Controlled V2Gs and battery integration into residential microgrids: Economic and environmental impacts. Energy Convers. Manag. 2022, 253, 115171. [Google Scholar] [CrossRef]
  15. Cai, Q.; Xu, Q.; Qing, J.; Shi, G.; Liang, Q.M. Promoting wind and photovoltaics renewable energy integration through demand response: Dynamic pricing mechanism design and economic analysis for smart residential communities. Energy 2022, 261, 125293. [Google Scholar] [CrossRef]
  16. Luo, Z.; Peng, J.; Cao, J.; Yin, R.; Zou, B.; Tan, Y.; Yan, J. Demand flexibility of residential buildings: Definitions, flexible loads, and quantification methods. Engineering 2022, 16, 123–140. [Google Scholar] [CrossRef]
  17. Panda, S.; Mohanty, S.; Rout, P.K.; Sahu, B.K.; Bajaj, M.; Zawbaa, H.M.; Kamel, S. Residential Demand Side Management model, optimization and future perspective: A review. Energy Rep. 2022, 8, 3727–3766. [Google Scholar] [CrossRef]
  18. Yousefi, S.; Moghaddam, M.P.; Majd, V.J. Optimal real time pricing in an agent-based retail market using a comprehensive demand response model. Energy 2011, 36, 5716–5727. [Google Scholar] [CrossRef]
  19. Park, M.J.; Ham, A. Energy-aware flexible job shop scheduling under time-of-use pricing. Int. J. Prod. Econ. 2022, 248, 108507. [Google Scholar] [CrossRef]
  20. Yelisetti, S.; Saini, V.K.; Kumar, R.; Lamba, R.; Saxena, A. Optimal energy management system for residential buildings considering the time of use price with swarm intelligence algorithms. J. Build. Eng. 2022, 59, 105062. [Google Scholar] [CrossRef]
  21. Schittekatte, T.; Mallapragada, D.S.; Joskow, P.L.; Schmalensee, R. Electricity Retail Rate Design in a Decarbonized Economy: An Analysis of Time-of-Use and Critical Peak Pricing; Technical Report; National Bureau of Economic Research: Cambridge, MA, USA, 2022. [Google Scholar]
  22. Yusuf, J.; Hasan, A.S.M.J.; Ula, S. Impacts Analysis & Field Implementation of Plug-in Electric Vehicles Participation in Demand Response and Critical Peak Pricing for Commercial Buildings. In Proceedings of the 2021 IEEE Texas Power and Energy Conference (TPEC), College Station, TX, USA, 2–5 February 2021; pp. 1–6. [Google Scholar] [CrossRef]
  23. Yang, H.; Zhang, X.; Ma, Y.; Zhang, D. Critical peak rebate strategy and application to demand response. Prot. Control Mod. Power Syst. 2021, 6, 28. [Google Scholar] [CrossRef]
  24. Chen, W.; Qiu, J.; Chai, Q. Customized Critical Peak Rebate Pricing Mechanism for Virtual Power Plants. IEEE Trans. Sustain. Energy 2021, 12, 2169–2183. [Google Scholar] [CrossRef]
  25. Sagheer, A.; Kotb, M. Unsupervised pre-training of a deep LSTM-based stacked autoencoder for multivariate time series forecasting problems. Sci. Rep. 2019, 9, 19038. [Google Scholar] [CrossRef] [PubMed]
  26. Sharifi, V.; Abdollahi, A.; Rashidinejad, M.; Heydarian-Forushani, E.; Alhelou, H.H. Integrated electricity and natural gas demand response in flexibility-based generation maintenance scheduling. IEEE Access 2022, 10, 76021–76030. [Google Scholar] [CrossRef]
  27. Gu, B.; Zhang, T.; Meng, H.; Zhang, J. Short-term forecasting and uncertainty analysis of wind power based on long short-term memory, cloud model and non-parametric kernel density estimation. Renew. Energy 2021, 164, 687–708. [Google Scholar] [CrossRef]
  28. Huang, X.; Li, Q.; Tai, Y.; Chen, Z.; Liu, J.; Shi, J.; Liu, W. Time series forecasting for hourly photovoltaic power using conditional generative adversarial network and Bi-LSTM. Energy 2022, 246, 123403. [Google Scholar] [CrossRef]
  29. Abbasimehr, H.; Paki, R. Improving time series forecasting using LSTM and attention models. J. Ambient. Intell. Humaniz. Comput. 2022, 13, 673–691. [Google Scholar] [CrossRef]
  30. Kumar, G.; Singh, U.P.; Jain, S. An adaptive particle swarm optimization-based hybrid long short-term memory model for stock price time series forecasting. Soft Comput. 2022, 26, 12115–12135. [Google Scholar] [CrossRef]
  31. Tavakoli, A.; Karimi, A. Development of Monte-Carlo-based stochastic scenarios to improve uncertainty modelling for optimal energy management of a renewable energy hub. IET Renew. Power Gener. 2023, 17, 1139–1164. [Google Scholar] [CrossRef]
  32. Zhang, Y.; Zhao, Y.; Shen, X.; Zhang, J. A comprehensive wind speed prediction system based on Monte Carlo and artificial intelligence algorithms. Appl. Energy 2022, 305, 117815. [Google Scholar] [CrossRef]
  33. Vaka, S.S.K.R.; Matam, S.K. Optimal sizing of hybrid renewable energy systems for reliability enhancement and cost minimization using multiobjective technique in microgrids. Energy Storage 2022, 5, e419. [Google Scholar] [CrossRef]
  34. Konneh, D.A.; Howlader, H.O.R.; Shigenobu, R.; Senjyu, T.; Chakraborty, S.; Krishna, N. A multi-criteria decision maker for grid-connected hybrid renewable energy systems selection using multi-objective particle swarm optimization. Sustainability 2019, 11, 1188. [Google Scholar] [CrossRef]
  35. Yoon, K.P.; Kim, W.K. The behavioral TOPSIS. Expert Syst. Appl. 2017, 89, 266–272. [Google Scholar] [CrossRef]
  36. Tsou, C.S. Multi-objective inventory planning using MOPSO and TOPSIS. Expert Syst. Appl. 2008, 35, 136–142. [Google Scholar] [CrossRef]
  37. Fu, G.; Li, B.; Yang, Y.; Li, C. Re-ranking and TOPSIS-based ensemble feature selection with multi-stage aggregation for text categorization. Pattern Recognit. Lett. 2023, 168, 47–56. [Google Scholar] [CrossRef]
  38. Méndez, M.; Frutos, M.; Miguel, F.; Aguasca-Colomo, R. Topsis decision on approximate pareto fronts by using evolutionary algorithms: Application to an engineering design problem. Mathematics 2020, 8, 2072. [Google Scholar] [CrossRef]
  39. Zhang, M.; Wang, H.; Gao, Y. Security constrained economic dispatch: Considering contractual performance ability evaluating of power producers using TOPSIS method in spot market environment. Energy Rep. 2023, 9, 343–352. [Google Scholar] [CrossRef]
  40. Amara, S.; Toumi, S.; Salah, C.B. A comparison of optimal sizing methods for Microgrid applications and description of a proposed iterative algorithm. In Proceedings of the 2022 IEEE 21st international Conference on Sciences and Techniques of Automatic Control and Computer Engineering (STA), Sousse, Tunisia, 19–21 December 2022; pp. 654–659. [Google Scholar]
  41. Zhao, G.; Cao, T.; Wang, Y.; Zhou, H.; Zhang, C.; Wan, C. Optimal Sizing of Isolated Microgrid Containing Photovoltaic/Photothermal/Wind/Diesel/Battery. Int. J. Photoenergy 2021, 2021, 5566597. [Google Scholar] [CrossRef]
  42. Li, B.; Wang, H.; Tan, Z. Capacity optimization of hybrid energy storage system for flexible islanded microgrid based on real-time price-based demand response. Int. J. Electr. Power Energy Syst. 2022, 136, 107581. [Google Scholar] [CrossRef]
  43. Furukakoi, M.; Adewuyi, O.B.; Matayoshi, H.; Howlader, A.M.; Senjyu, T. Multi objective unit commitment with voltage stability and PV uncertainty. Appl. Energy 2018, 228, 618–623. [Google Scholar] [CrossRef]
  44. Mo, M.; Lotfy, M.; Ibrahimi, A.M.; Senjyu, T.; Krishnan, N. Stochastic Unit Commitment and Optimal Power Trading Incorporating PV Uncertainty. Sustainability 2019, 11, 4504. [Google Scholar] [CrossRef]
  45. Weather Mount Marsabit. 2019. Available online: https://www.meteoblue.com (accessed on 30 March 2023).
  46. Photovoltaic Geographical Information System. 2019. Available online: https://joint-research-centre.ec.europa.eu/photovoltaic-geographical-information-system-pvgis_en (accessed on 30 March 2023).
  47. The Presidency, Republic of Kenya. Power Generation and Transmission Master Plan, Kenya Medium Term Plan 2015–2020—Vol. I. 2016. Available online: https://www.epra.go.ke/download/power-generation-and-transmission-master-plan-kenya-medium-term-plan-2015-2020-3/ (accessed on 16 May 2023).
  48. Ministry of Energy and Petroleum, Republic of Kenya. Updated Least Cost Power Development Plan 2017–2037. 2018. Available online: https://www.climatepolicydatabase.org/policies/least-cost-power-development-plans-lcpdp-2017-2037 (accessed on 1 April 2023).
  49. Dhundhara, S.; Verma, Y.P.; Williams, A. Techno-economic analysis of the lithium-ion and lead-acid battery in microgrid systems. Energy Convers. Manag. 2018, 177, 122–142. [Google Scholar] [CrossRef]
  50. Perkins, G. Techno-economic comparison of the levelised cost of electricity generation from solar PV and battery storage with solar PV and combustion of bio-crude using fast pyrolysis of biomass. Energy Convers. Manag. 2018, 171, 1573–1588. [Google Scholar] [CrossRef]
  51. Singh, B.; Kumar, A. Optimal energy management and feasibility analysis of hybrid renewable energy sources with BESS and impact of electric vehicle load with demand response program. Energy 2023, 278, 127867. [Google Scholar] [CrossRef]
  52. Tarrif Setting: Electricity. 2019. Available online: https://www.epra.go.ke/services/economic-regulation/tarrif-setting/tarrif-setting-electricity/ (accessed on 1 April 2023).
  53. Nayak, A.; Maulik, A.; Das, D. An integrated optimal operating strategy for a grid-connected AC microgrid under load and renewable generation uncertainty considering demand response. Sustain. Energy Technol. Assess. 2021, 45, 101169. [Google Scholar] [CrossRef]
Figure 1. Proposed system configuration.
Energies 16 06838 g001
Figure 2. Flowchart for proposed planning framework for a VRE-based community microgrid considering LSTM forecasting, uncertainties, and advanced DRPs.
Energies 16 06838 g002
Figure 3. The actual versus one-hour-ahead LSTM-predicted values of solar irradiances.
Energies 16 06838 g003
Figure 4. The actual versus one-hour-ahead LSTM-predicted values of wind speed.
Energies 16 06838 g004
Figure 5. The actual versus one-hour-ahead LSTM-predicted values of load demand.
Energies 16 06838 g005
Figure 9. The Pareto front for the feasible and non-dominated solutions for all considered simulation cases.
Energies 16 06838 g009
Table 1. Techno-economic parameters and specifications.
Economics[47]
Inflation rate 4 (%)
Discount rate 4 (%)
System lifetime 20 (years)
Scheduling horizon 8760 (h)
PV system[48]
Investment cost 1695 ($/kW)
O and M cost 26 ($/kW/yr)
Derating factor of PV 90 (%)
Lifetime 20 (years)
WT specifications[47]
Investment cost 2030 ($/kW)
O and M cost 76 ($/kW/yr)
Lifetime 20 (years)
Cut-in wind speed 4 (m/s)
Rated wind speed 14.5 (m/s)
Cut-out speed 25 (m/s)
Survival wind speed 60 (m/s)
Wind shear coefficient 0.143
BESS[49,50,51]
Investment costs 330 ($/kWh)
Replacement cost 330 ($/kWh)
Round-trip efficiency 90 (%)
Lifetime 10 (years)
Table 2. Demand’s price elasticity [53].
PeakMid-PeakOff-Peak
Mid-peak0.0160.01−0.1
Peak−0.10.0120.016
Valley0.012−0.10.01
Table 3. The optimal component capacities, DPSP and LPP, and their corresponding TLCCs for the first four best-ranked non-dominated solutions for each of the six considered cases.
CaseDPSP
(%)
TLCC
(US $)
LPPP
(%)
PV
(kW)
WT
(kW)
BESS
(kWh)
TOPSIS
Rank
#10.4810,377,384.546.261440185048001
0.4110,494,044.603.221300199044002
0.0011,019,716.781.211230199065003
1.8110,340,568.338.351690179038004
#20.5710,314,687.164.351530183042001
0.7610,362,979.421.301050213040002
0.8310,529,262.010.601120204051003
0.0310,899,321.225.221540196046004
#30.069,649,293.001.331270184035001
0.099,814,061.641.241090192042002
0.019,893,660.451.951610167037003
0.009,952,736.652.161280179049004
#40.1210,576,185.1510.311480200049001
0.0011,157,231.694.321200226044002
1.5510,318,166.836.281290200037003
3.529,718,020.353.091150196031004
#50.3610,378,836.975.051430193036001
0.2310,400,379.643.501710168051002
0.0010,570,027.751.561310196047003
0.5810,157,349.442.861480184039004
#60.0410,066,405.652.051420192032001
0.0010,093,575.323.231390205041002
0.199,371,605.781.101580155038003
0.119,319,214.790.731210185026004
Disclaimer/Publisher’s Note: The statements, opinions and data contained in all publications are solely those of the individual author(s) and contributor(s) and not of MDPI and/or the editor(s). MDPI and/or the editor(s) disclaim responsibility for any injury to people or property resulting from any ideas, methods, instructions or products referred to in the content.

