Review

The Effect of Dust Deposition on the Performance of Photovoltaic Panels

by
Carmen Otilia Rusănescu
1,
Marin Rusănescu
2,*,
Irina Aura Istrate
1,*,
Gabriel Alexandru Constantin
1,* and
Mihaela Begea
1
1
Faculty of Biotechnical Systems Engineering, National University of Science and Technology Politehnica Bucharest, 313 Spl. Independentei, 060042 Bucharest, Romania
2
Valplast Industrie, 9 Preciziei Blv., 062202 Bucharest, Romania
*
Authors to whom correspondence should be addressed.
Energies 2023, 16(19), 6794; https://doi.org/10.3390/en16196794
Submission received: 8 August 2023 / Revised: 11 September 2023 / Accepted: 21 September 2023 / Published: 24 September 2023
(This article belongs to the Special Issue Advances in Solar Systems and Energy Efficiency)

Abstract

:
Given the energy crisis and climate change due to pollution, and given that the largest emissions of greenhouse gases are produced by the energy industry, we must turn our attention to the efficient use of solar energy, which is the cleanest and most abundant of all renewable energies. In this paper, based on an analysis of the specialized literature, we studied the effect of dust accumulation on the surface of photovoltaic modules on some performance characteristics and on the efficiency of these panels and modules compared to the efficiency of clean modules. We analyzed the cause of dust accumulation and the influence of the tilt angles of the photovoltaic panels on the dust deposition rate. We highlighted the influence of atmospheric temperature, solar radiation, wind speed, and relative humidity depending on the density of the dust deposited on the surface of the photovoltaic panel, and we found a decrease in the efficiency of the panel based on the increase in dust density for slightly high values of solar radiation, wind speed, and relative humidity. We highlighted the reduction in CO2 emissions by replacing electricity from fossil fuels with solar energy. The efficient use of solar energy is a solution for the decarbonization of the energy sector.

1. Introduction

In the current context of the energy crisis and climate change resulting from increased pollution, and taking into account the fact that approximately 77% of greenhouse gas emissions come from the energy sector [1], we must use solar energy efficiently. By the year 2050, the energy produced by photovoltaic panels is predicted to be 25% of the total energy needed worldwide, and damage to photovoltaic modules must be prevented so that they work efficiently [2]. By transforming sunlight into electricity by photovoltaic cells, environmental pollution is avoided, thus reducing global warming. The reduction in the price of photovoltaic panels and the increase in the price of electricity and petrochemical fuels have determined the increased need to use photovoltaic panels [3]. Since the photovoltaic panels are placed outside, there are variations in wind speed, radiation intensity, air temperature, and relative humidity, and they are exposed to dust pollution [4,5,6,7,8]. Of the sunlight, approximately 8–10% is reflected by the photovoltaic panels [5], and the dust deposited on the surface of the photovoltaic panels can absorb or scatter part of the sunlight. All these factors reduce the output power of photovoltaic panels [4].
In the desert, where there is high solar radiation, dust storms cover the panel surfaces with sand, gravel, and clay, reducing their performance by reducing the solar radiation incident on the panel. The reduction in electricity generation power due to the dust deposited on the surface of the photovoltaic modules depends on the properties of the dust, the size of the dust particles, the type of dust deposited, and the density [6,7,8,9,10,11,12,13,14,15,16].
According to research carried out by Darvwish et al. [2], depositing a quantity of 73 g/m2 of cement on the surface of the photovoltaic panel determined an 80% decrease in the short circuit voltage of the photovoltaic panel. The smaller the size of the dust particles, the greater the shading effect on the photovoltaic panels [13].
The objective of this paper is to analyze, based on the specialized literature from 1990 to 2023, the performance of photovoltaic panels according to the following factors: dust deposition on their surface, wind speed, solar radiation, relative humidity, precipitation, air temperature, and the angle of inclination of the photovoltaic panels. We present the influence of each factor on dust deposition that has a negative impact on the performance and operation of photovoltaic systems.

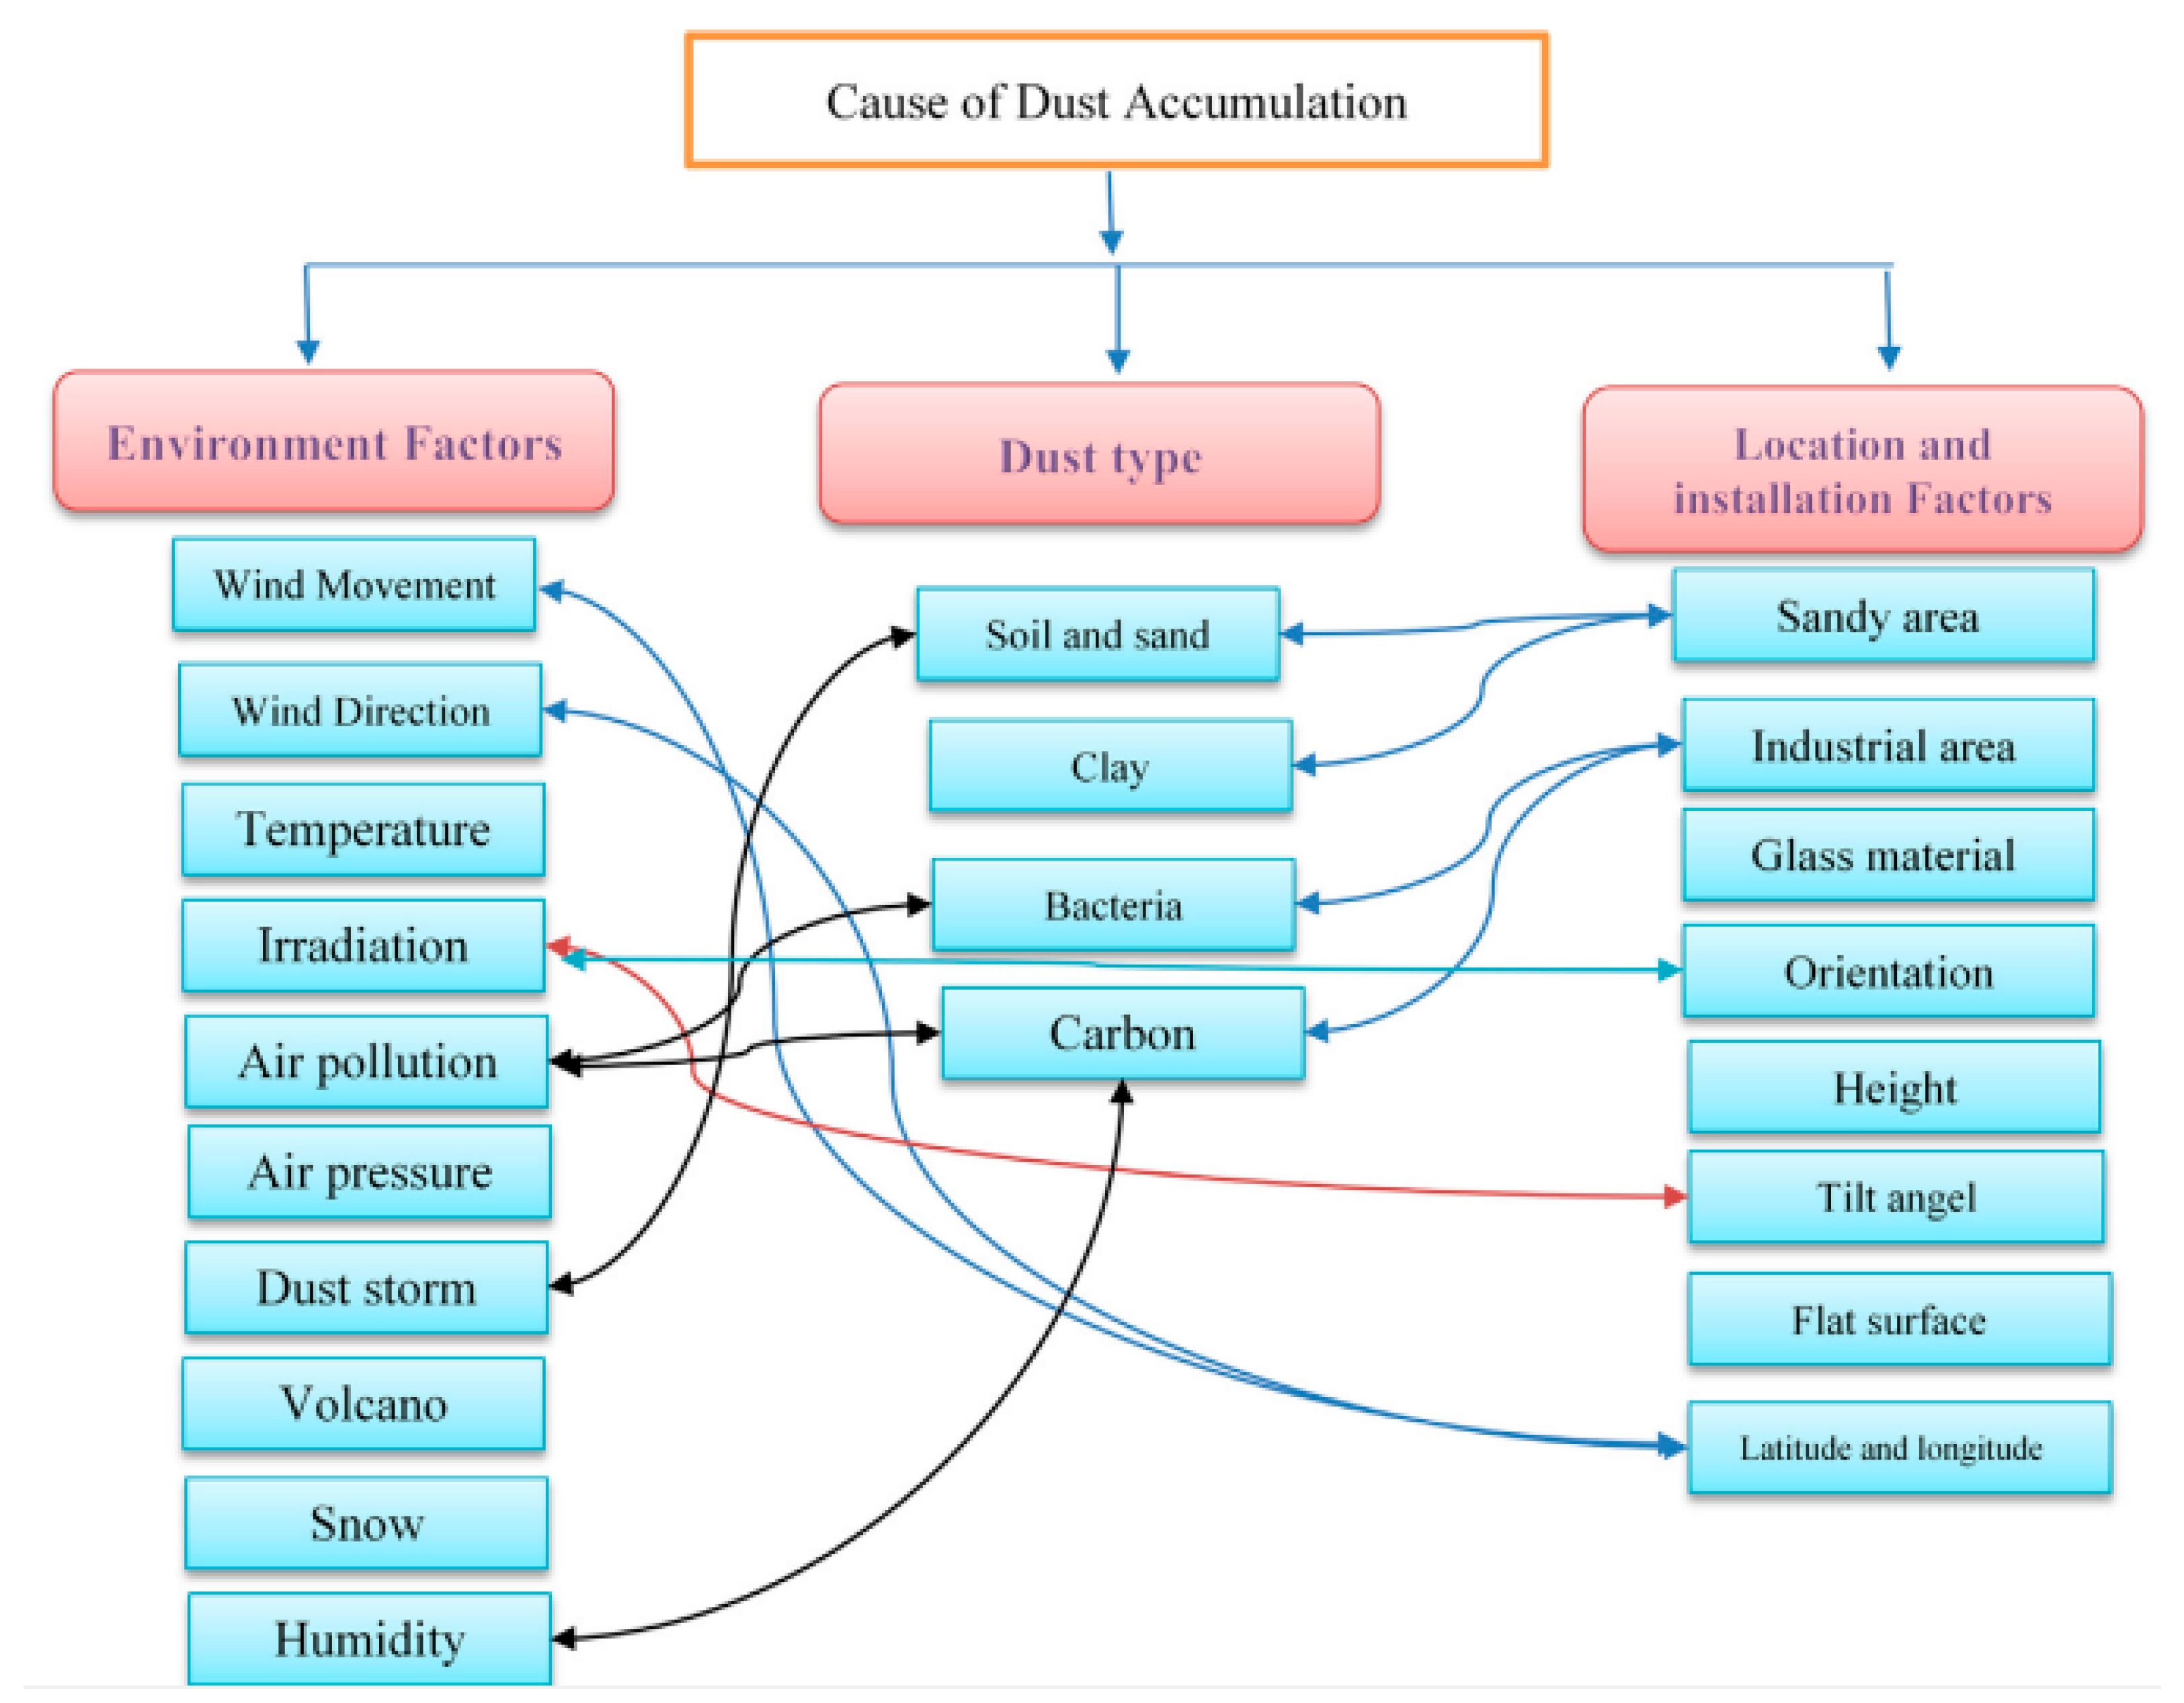
2. The Causes of Dust Accumulation on the Surface of Solar Panels

According to McTainsh et al. [17], the size of the dust grains deposited on the surface of the photovoltaic panels depends on the distance from which the wind carries the dust; these solid particles are smaller than 500 μm. The diameter of the deposited dust can be less than 5 μm when it is brought from long distances, between 20 and 40 μm when the dust is deposited from regional sources, between 50 and 70 μm when the dust deposited is from the local area, due to the movement of vehicles and the anthropogenic impact [18,19,20,21,22,23,24].
According to Beattie et al. [19], we can know the origin of the dust depending on its particle size. Thus, dust with a particle size between 60 and 2000 μm comes from sand, dust particles with a size of 4–60 μm come from alluvial soil, and dust with a particle size smaller than 4 mm comes from clay.
The largest surface of the photovoltaic panels is covered with dust of particle sizes between 20 and 40 μm [15]. Most of the particles that covered the panel were 5–35 μm [15].
As a result of the deposition of dust on the glass of the solar panels, a reduction of 0.2% in their efficiency was found in the absence of precipitation [24].
The dust that settles on solar panels can have different sources of origin, as follows: soil, ash obtained from burning coal in power plants, soot from the incomplete burning of coal or petroleum products, cement, coal, salt, sand, clay, from cars, from kitchens, smoke from factories, dust from volcanic storms, and detergents [21,22]. Dust can come from pollutants due to road traffic, or from waste incineration. Due to meteorological conditions, the highest concentration of dust is deposited in spring, followed by winter [18]. The increase in the relative humidity of the air and the high wind speed favor the increase in the number of material particles in the air. The composition of the dust deposited on the solar panels is different depending on the locality, and it may contain the following elements: organic compounds from road traffic, cadmium, sulfur, antimony from the abrasion of car brake shoes, zinc, manganese and lead, from mechanical wear and tear, from exhaust gases, organic and inorganic particles containing soluble and insoluble salts [15,18]; it may come from soil, it may contain fungal spores, soot, cement, ash, calcium, clay, sand, or it may come from burning fossil fuels [23].
The causes of dust accumulation on photovoltaic panels are described in Figure 1. They are dependent on environmental factors, the type of dust, and the place where they are placed.
In Figure 2, images of the dust samples that can be deposited on the surface of the photovoltaic cells are shown.
The deposition of dust on the surface of photovoltaic panels depends on the properties of the dust [25], namely, components, size, weight [26], and shape, and acidic dust can lead to erosion of the surface of the panels, but the deposition also depends on the local environment, weather conditions, vegetation, and location, and if the surface is horizontal [26], more dust can accumulate on it [25].
According to Maghami et al. [25], if the surface of the photovoltaic panel is not smooth, if it is horizontal, or if it is sticky, it is conducive to the accumulation of dust. The wind can cause the accumulation or scattering of dust: low wind speed is conducive to the deposition of dust, whereas high wind speed removes the dust from the photovoltaic panels [26,27]. Decreases in the output power from the photovoltaic panel between 2 and 50% were found due to the dust accumulated on their surface [28].
Chanchangi et al. [25] found a decrease in power output of 30–40% as a result of dust deposition which correlated with high moisture content and specific gravity [26].
Research on the effects of deposits of red soil, sand, ash, and calcium carbonate highlighted that the deposits of finer particles such as ash caused a greater reduction in the performance of the photovoltaic panel, about 25% of the PV voltage reduction, compared to the coarse ones [26].
An analysis by Kaldellis et al. [29] found that red soil accumulation led to a greater reduction in PV panel performance, followed by limestone and fly ash.
Depositing a quantity of 100 g/m2 of gypsum, cement, and sand on the surface of the photovoltaic panels determined 9%, 14%, and 12% reductions in the performance of the photovoltaic panels, respectively [25]. The large accumulation of dust on photovoltaic panels occurs in desert areas [30], the dust containing quartz and smectite, carbonates, gypsum, feldspar, illite, kaolinite, and iron oxides [25].
In Figure 3, images of solar panels clean and covered with dust are shown [31]. It is estimated that solar energy will provide 10% of global energy production by 2030, most of which will be produced in desert areas where the Sun shines. However, there is also a lot of dust in these areas, which reduces energy production by up to 30% per month.
Dust storms that occurred in Saudi Arabia, Oman, the United Arab Emirates, and eastern areas as far as India and Pakistan covered solar panels within days, reducing the efficiency of each panel by up to 30% [32].

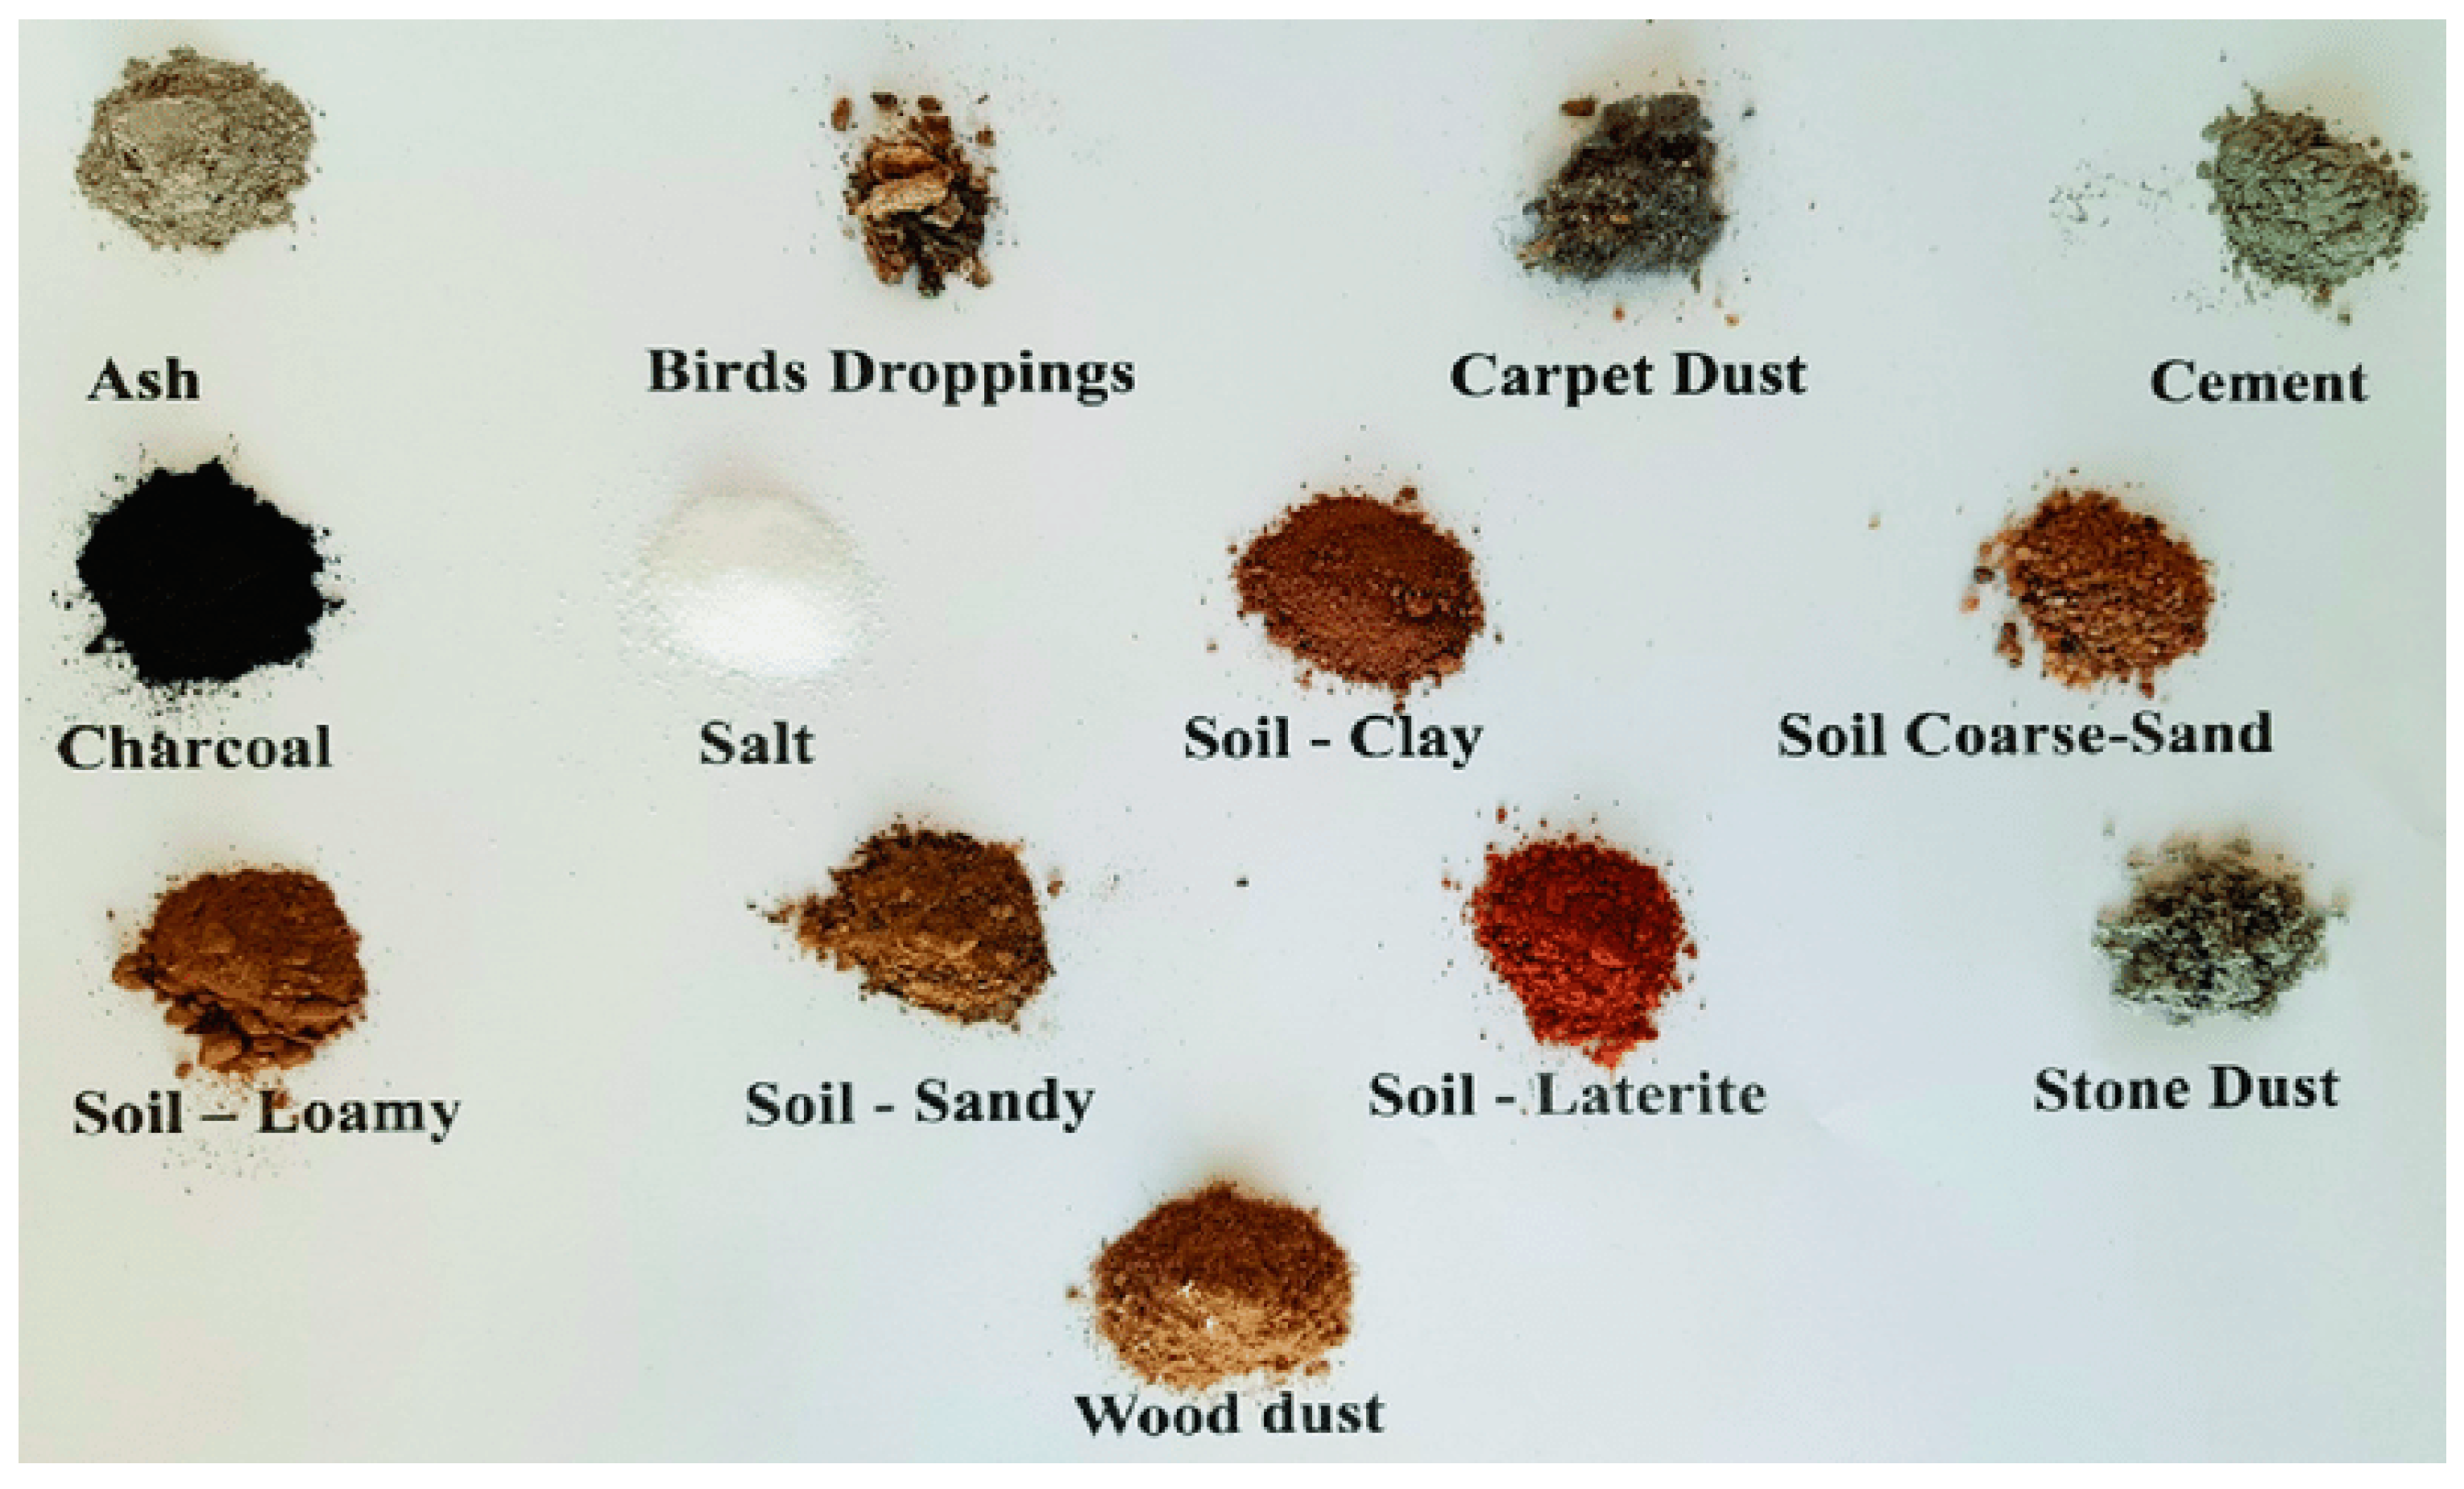
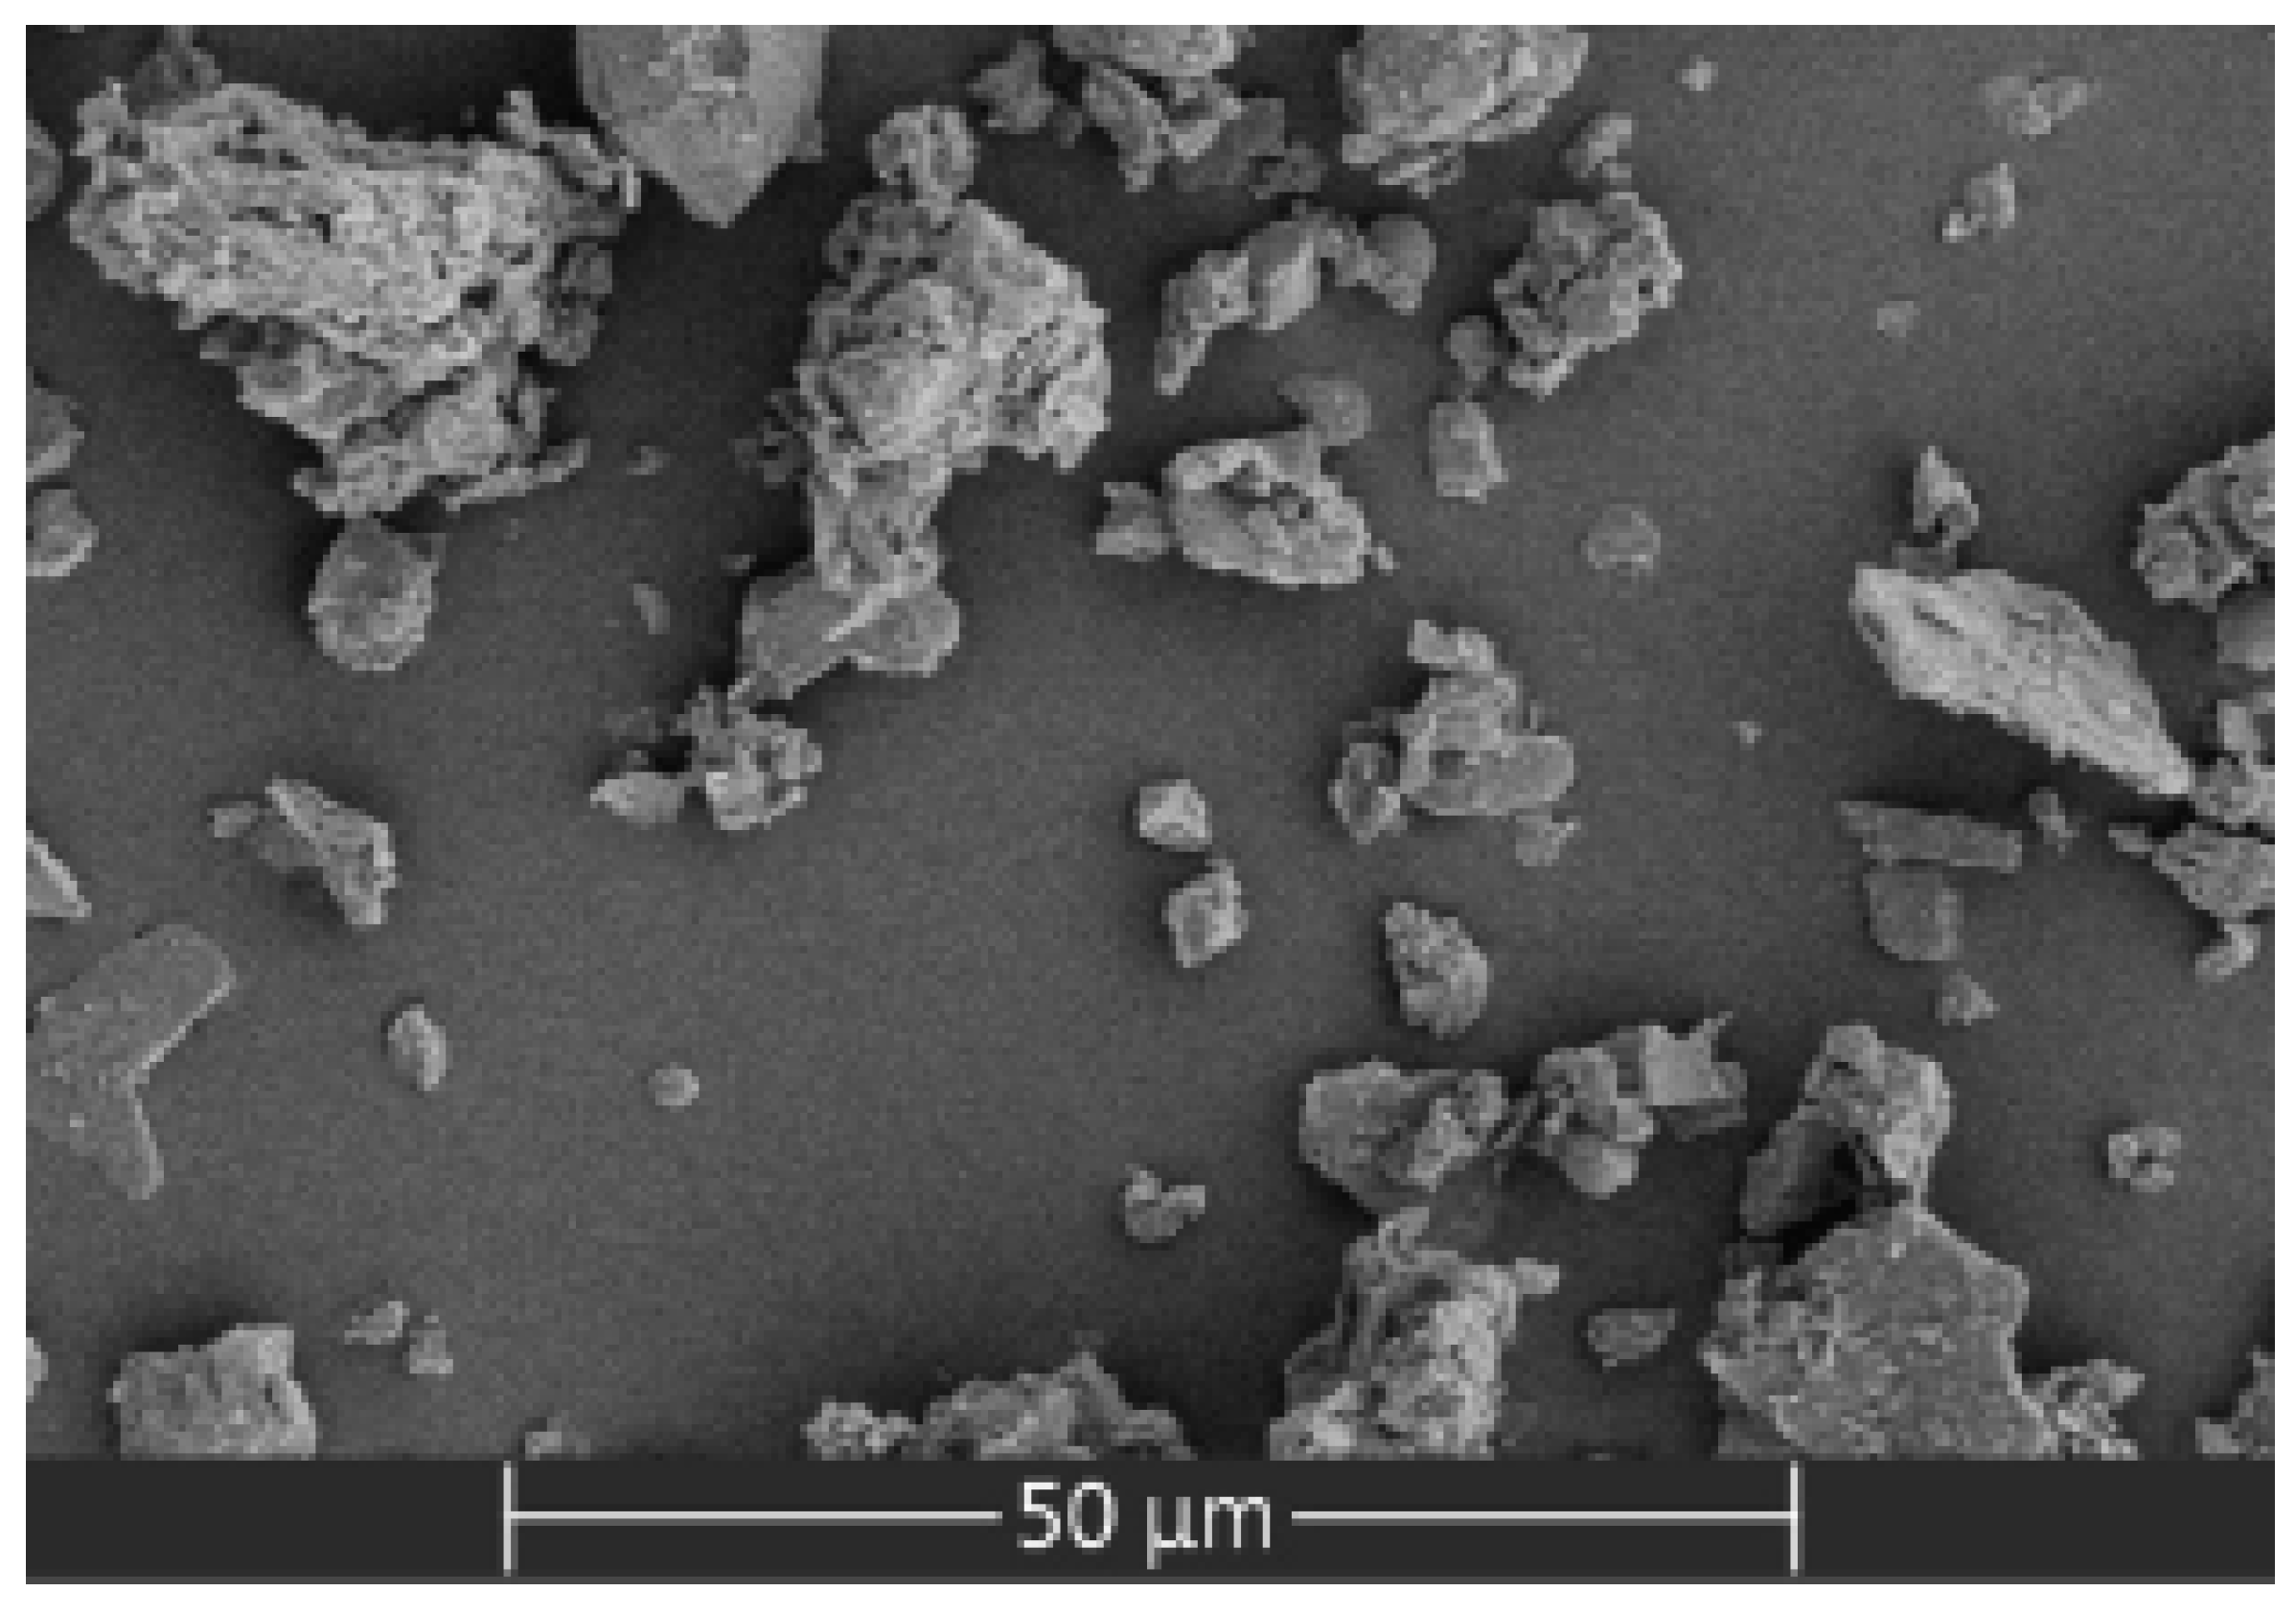
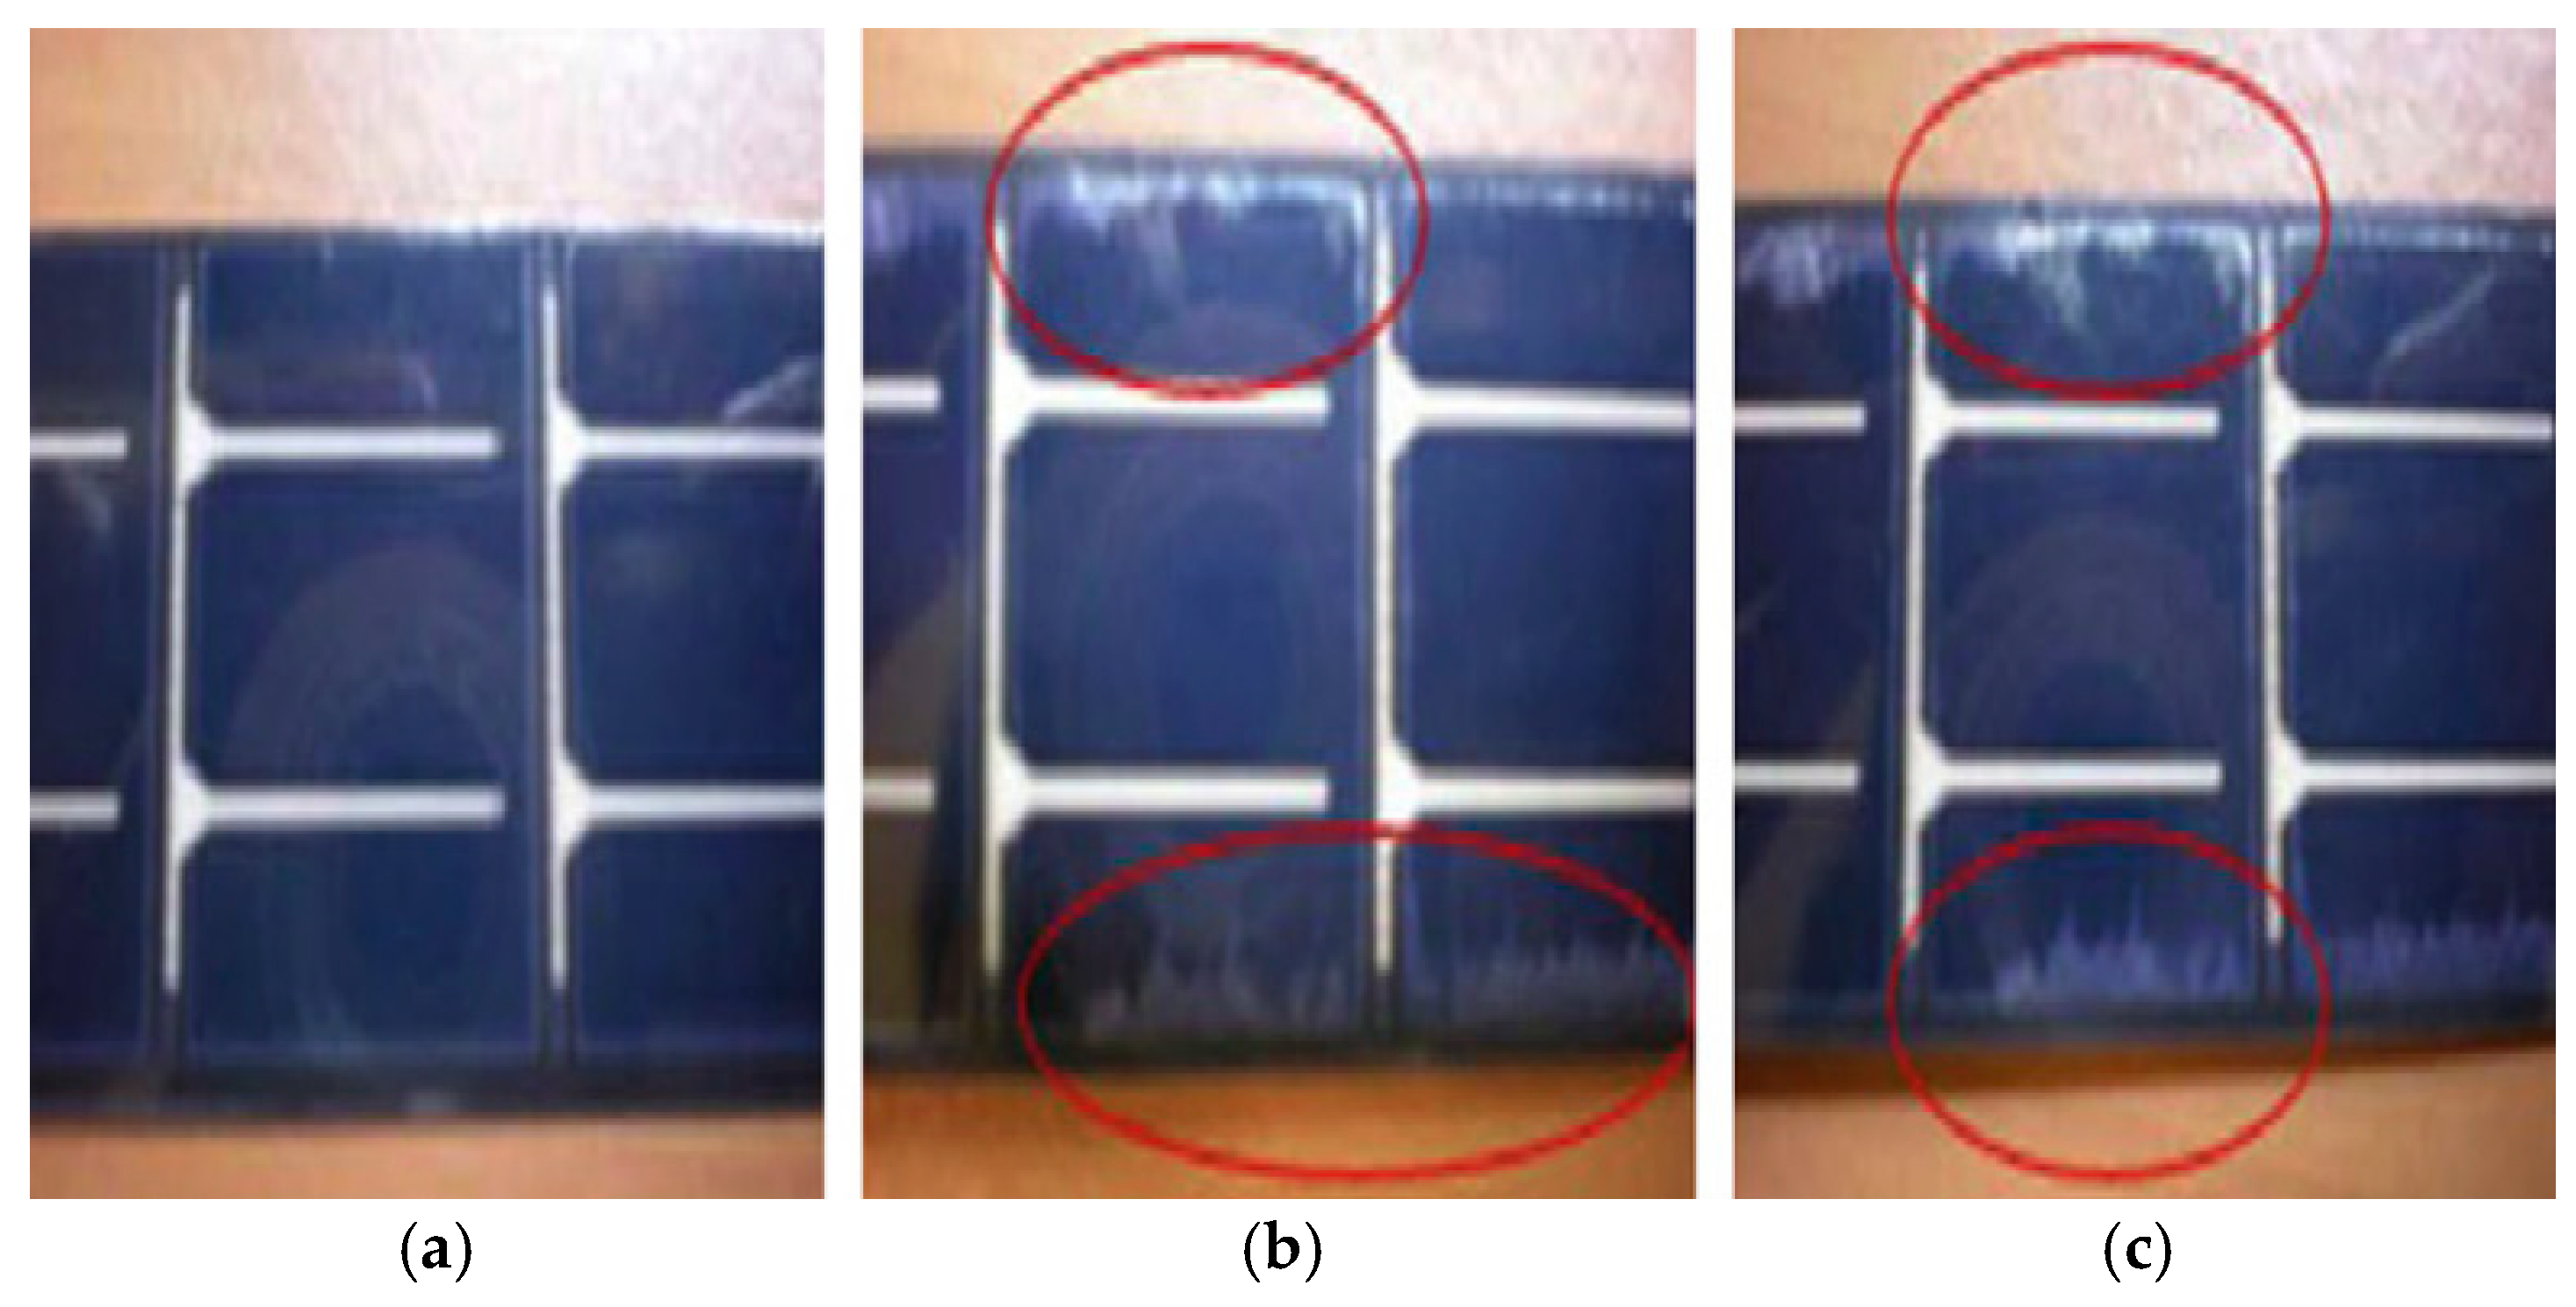
3. The Composition of the Dust Deposited on the Surface of Photovoltaic Panels

Chen et al. [33], by using X-ray fluorescence analysis, highlighted the following component elements in the dust deposited on photovoltaic panels: phosphorus (0.246%), sulfur (0.369%), titanium (0.881%), sodium (1.03%), magnesium (1.65%), potassium (2.7%), iron (8.49%), aluminum (8.69%), calcium (9.22%), silicon (20.63%), and the following oxides: MgO (2.57%), Fe2O3 (7.03%), CaO (8.55%), Al2O3 (14.84%), SiO2 (36.26%).
Darwish et al. [3], by using X-ray diffraction analysis, highlighted the following compounds of dust from the city of Sharjah in the United Arab Emirates: NiO (0.09%), SrO (0.13%), Cr2O3 (0.23%), MnO2 (0.21%), SO3 (0.24%), TiO2 (0.45%), K2O (0.87%), MgO (6.33%), Fe2O3 (10.46%), Al2O3 (10.83%), CaO (24.62%), SiO2 (45.53%).
It is observed that silicon oxide predominates, resulting from human activities, soil erosion, and sand [33]. The existence of calcium can be determined from the emissions from construction works. The presence of iron oxide is determined by the rusting of the iron frame of the photovoltaic panel. Aluminum and potassium come from rocks.
The appearance of dust particles observed by scanning electron microscopy (SEM) highlights irregular shapes [28], the most common shapes being spherical [15]; the sizes are different and are not completely opaque (Figure 4) [34].
Table 1 shows the composition of dust from different countries. It can be seen that the predominant components are quartz SiO2, Al2O3, and calcite (CaCO3).

4. The Effect of Temperature on the Output Power of the Photovoltaic Mode

The electrical performance of the output panel of the photovoltaic module decreases with the increase in the temperature of the photovoltaic cell. To produce electricity, photovoltaic systems use a small part of the solar radiation; the rest of the energy received at the surface is transformed into heat, which leads to an increase in the temperature of the component cells and a decrease in their efficiency [35]. Each degree of heating of the cell causes a loss of efficiency of the order of 0.5% [8]. Testing the effect of the cell temperature on the module performance is carried out for standard conditions under irradiation of 1000 W/m2, module temperature of 25 °C, and air mass of 1.5 according to Equation (1), where Pmax is the maximum power of the module (%) and Tc is the operating temperature of the cell (°C) [36]. At solar radiation less than 100 W/m2, the power of photovoltaic panels is close to zero. The yield of photovoltaic panels falls below the values provided in the technical data sheets, for insolation values lower than 400 W/m2. Performance can drop up to 80% when the surface of the panels is heated [4]. The maximum power of a 10 cm2 silicon cell is 1.25 W. Since the photoelectric cell is an electric generator of very low power, the photoelectric generators are made by connecting in series and/or in parallel a large number of elementary cells, called modules that form the panels. The photoelectric cell allows the direct conversion of light energy into electrical energy [37].
% C h a n g e P max = T c T s t c T e m p C o e f f P max % C 0
Irradiance G0 can be calculated according to Equation (2), where Isc represents the short-circuit current of the reference photovoltaic module (mA), Irc its calibration value at standard test conditions (mA), Tm, module temperature (°C), αrc current-temperature coefficient (%/°C):
G 0 = 1000 I s c I r c 1 α r c T m 25
According to the values presented in Table 2, a reduction in the efficiency of the panel located in the desert is observed with the increase in dust density for slightly high values of solar radiation, wind speed, atmospheric temperature, and air humidity [3].

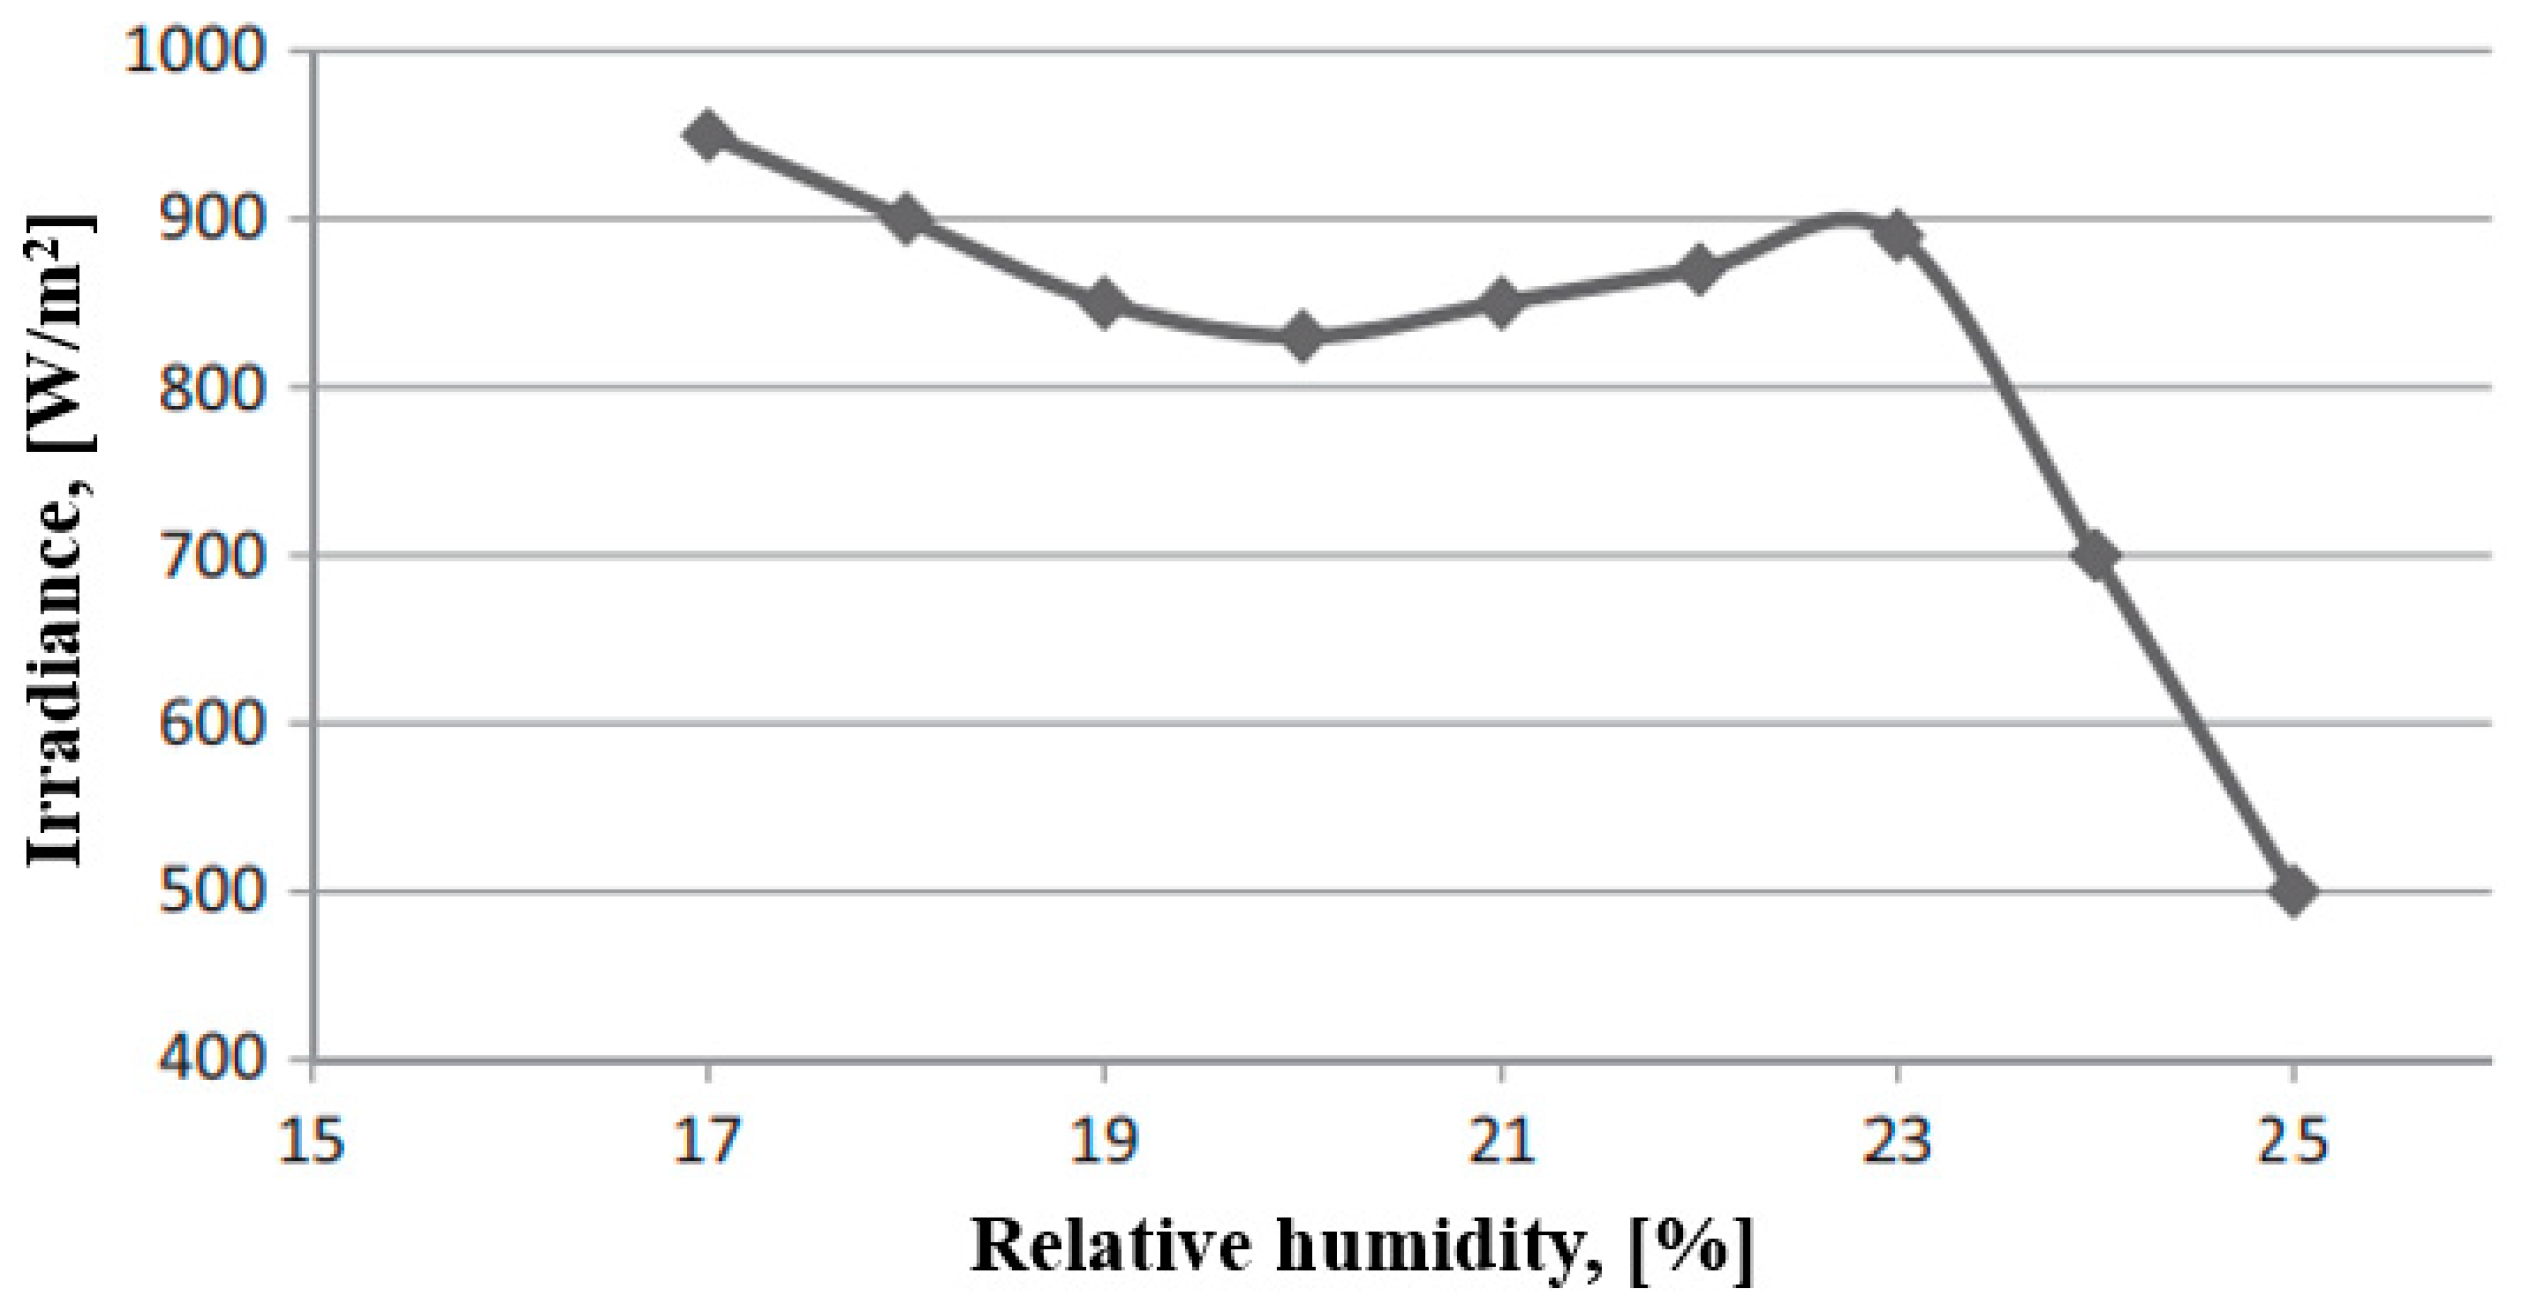
5. The Impact of Humidity on the Performance of Photovoltaic Cells

According to research carried out by Mekhilef et al. [38], at high values of relative humidity, the level of irradiation decreases. It was found that the performance of photovoltaic panels exposed to humidity in the long term decreased. Moisture in the air and hot weather can accelerate the deterioration of the panels [39].
The sunlight that falls on the raindrops on the surface of the photovoltaic panel can be diffracted, reflected, or refracted. The moisture on the panels can change the solar radiation, causing changes in the voltage in the open circuit. The moisture on the surface of the photovoltaic panels can penetrate into their cells, damaging them [40,41,42].
Figure 5a shows the solar panel without moisture, Figure 5b shows it after 24 h of exposure to moisture, Figure 5c shows the solar panel after 120 h of exposure to moisture.
As can be seen from Figure 6, the irradiation decreases with the increase in relative humidity.

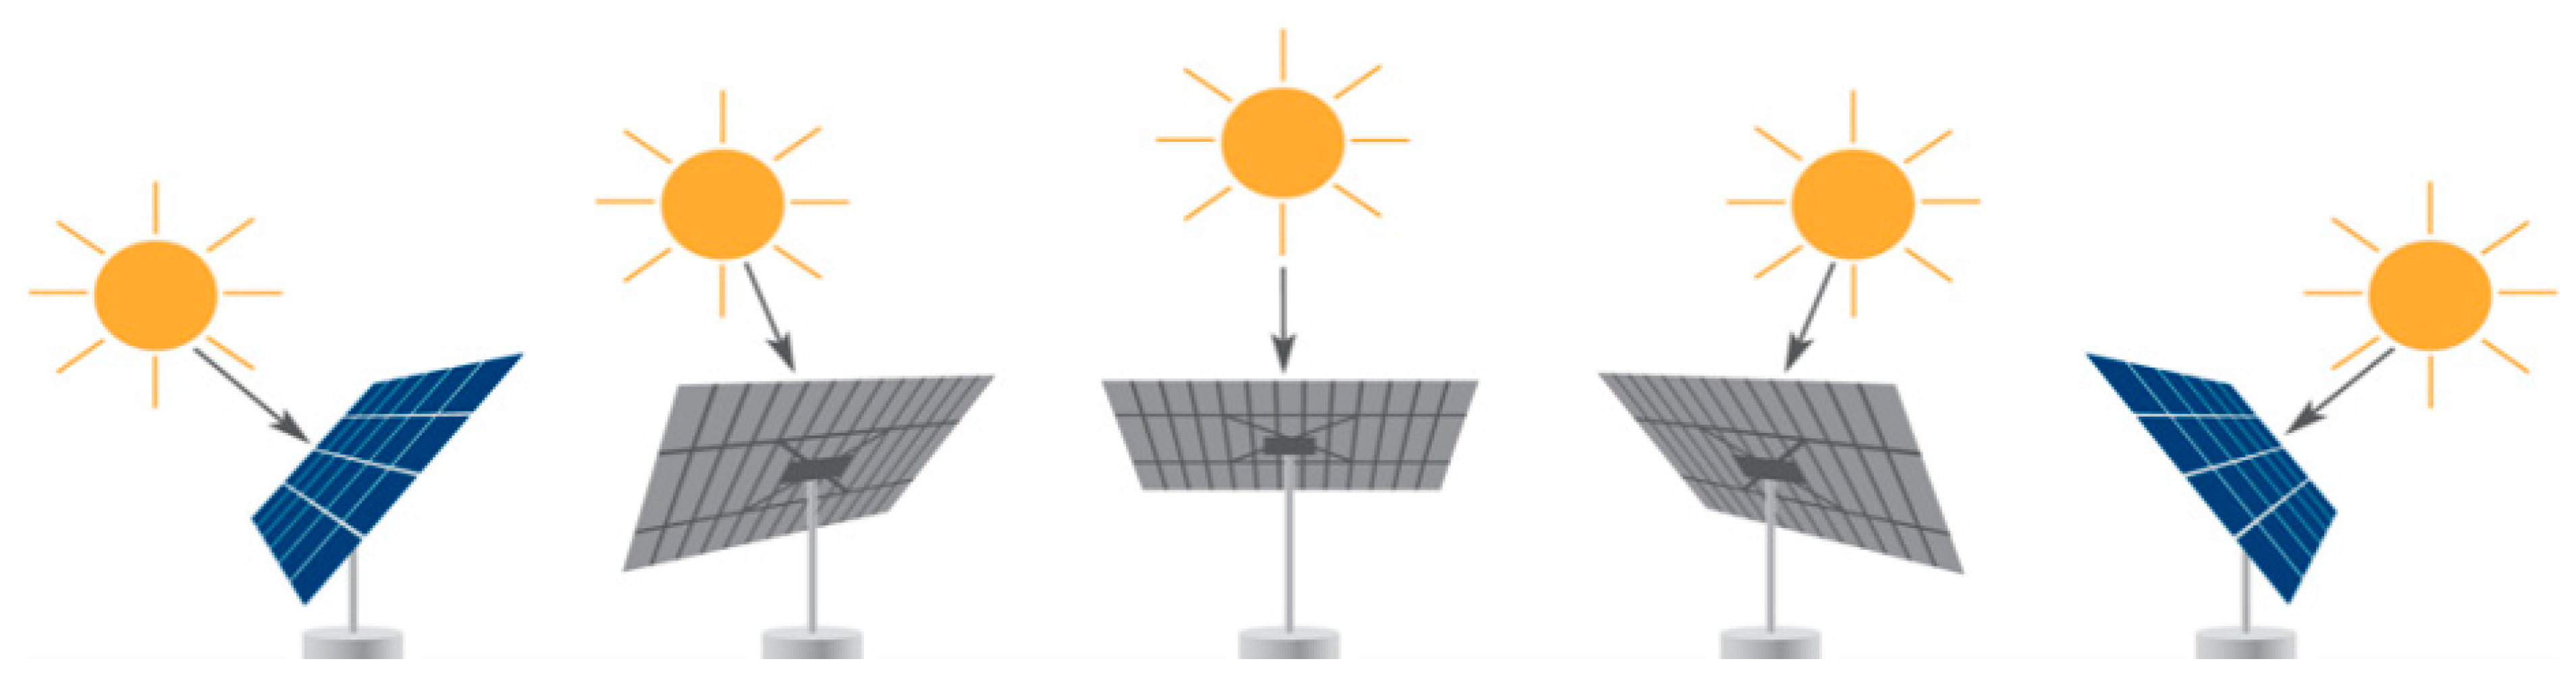
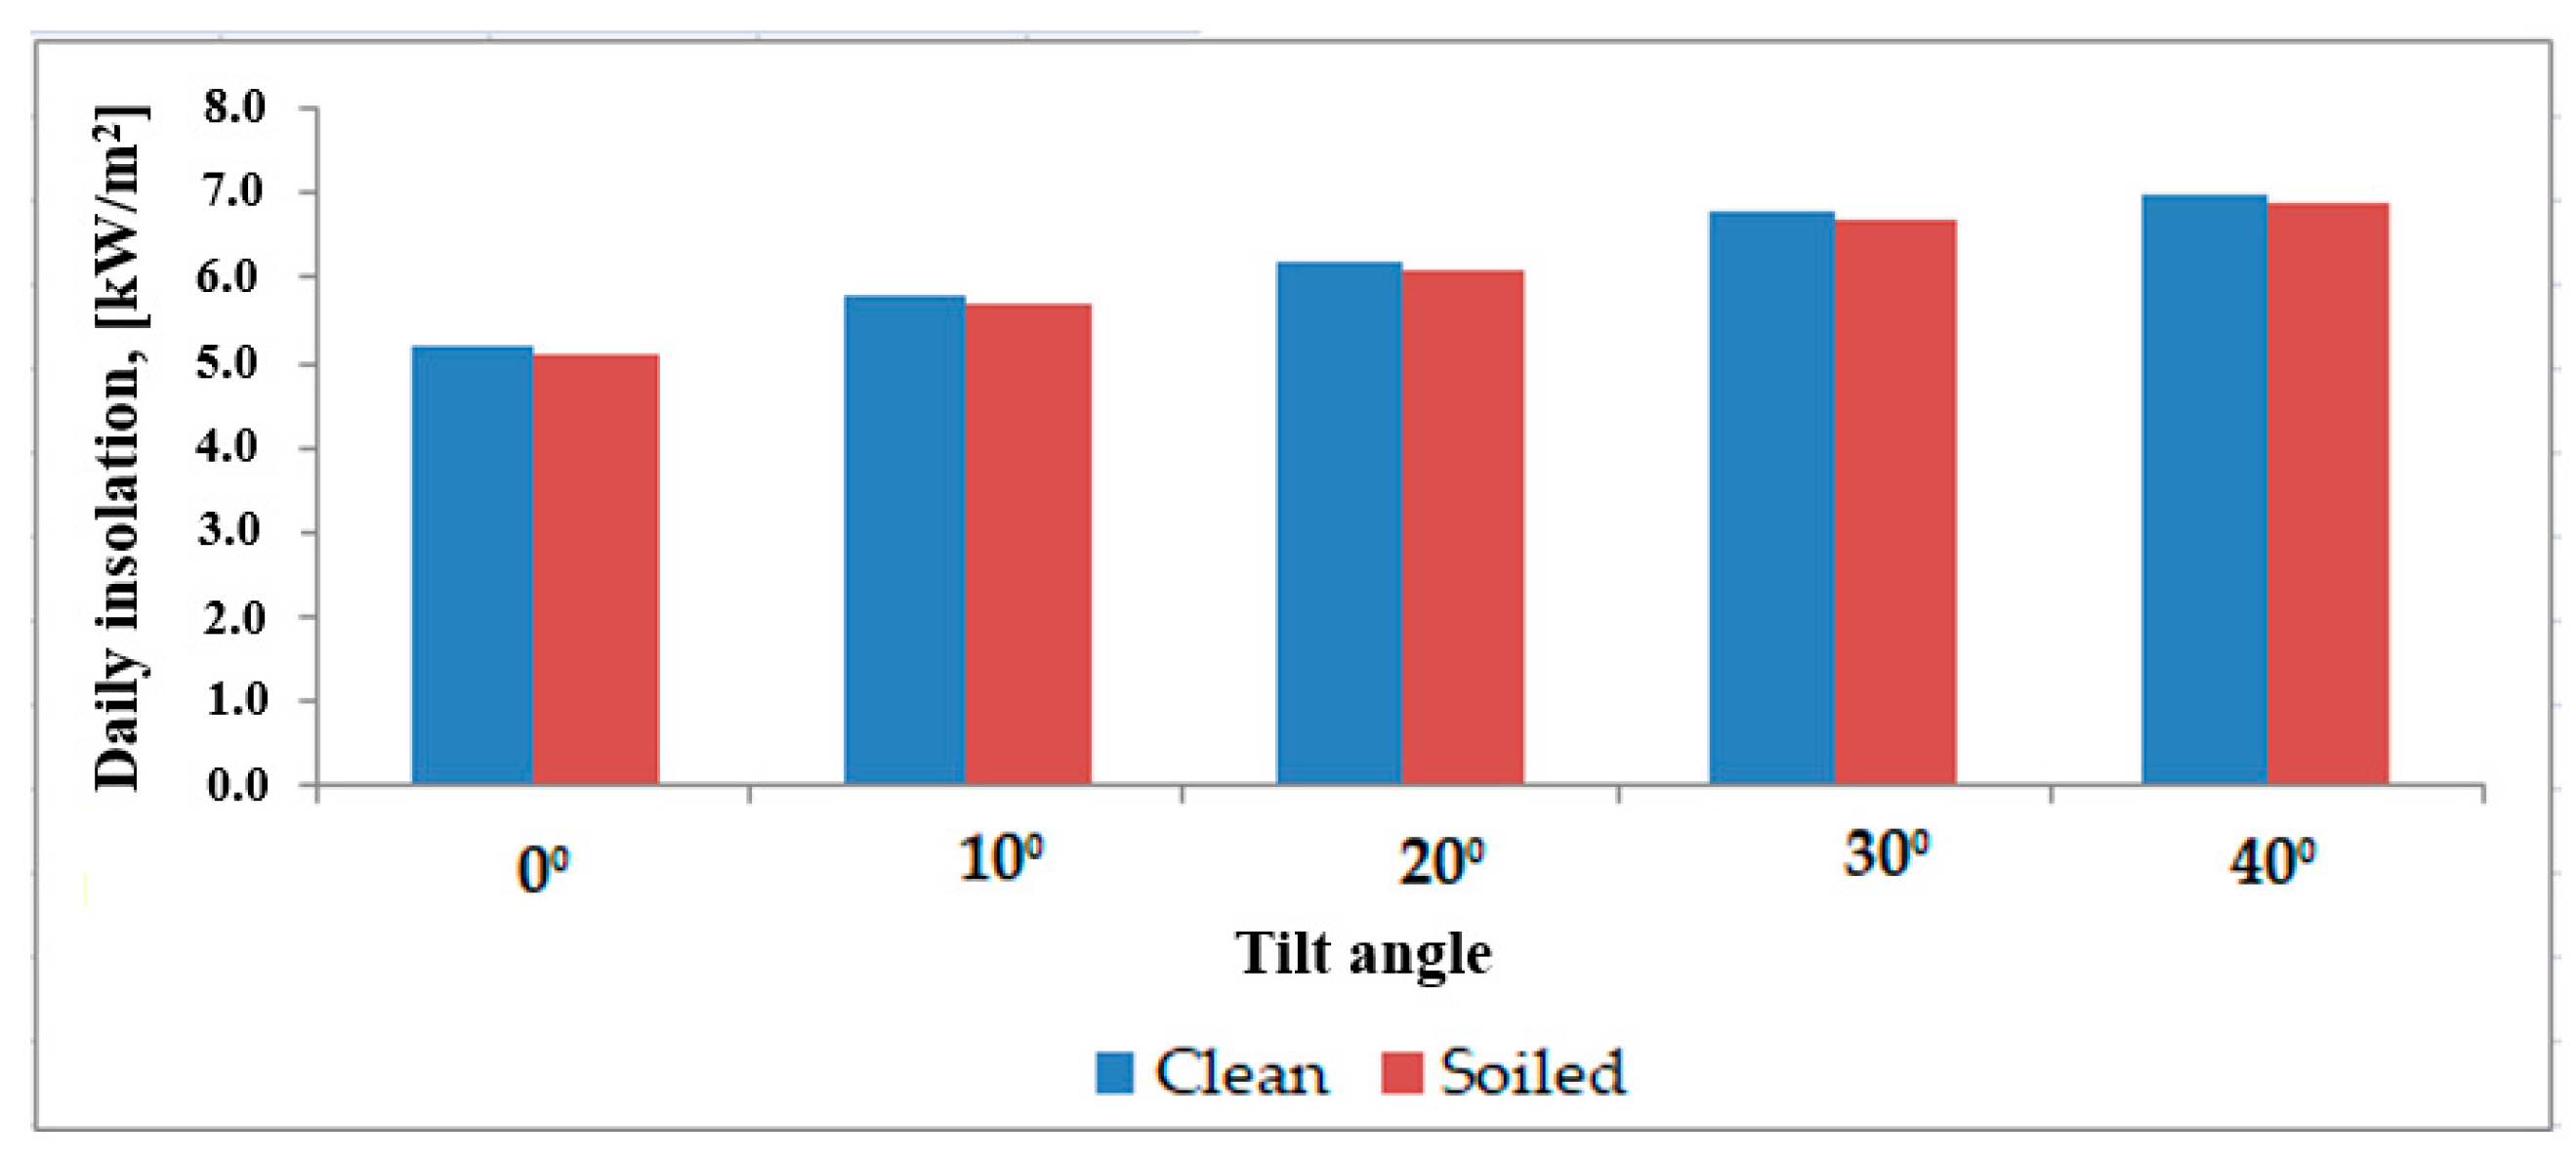
6. The Influence of the Tilt Angles of the Photovoltaic Panels on the Dust Deposition Rate

The orientation of the photovoltaic panels towards the Sun influences the conversion efficiency of a photovoltaic system (Figure 7). To be able to use the solar radiation to the maximum, during the entire period of the day, the optimal orientation of the solar panels must be towards the south. The angle of the Sun’s radiation on the solar panels changes continuously, along with the rotation of the Earth. Since most of the Sun’s rays hit the solar panel at an angle, the positioning of the solar panels is important when designing the solar power system. Following the path of the Sun, the orientation of the panels can be continuous and the orientation can be discrete, the total angle of 360° being divided into a certain number of discrete steps. The discretion of the angle must be chosen based on the considerations of minimizing the reduction in the conversion efficiency of the system and minimizing the relative costs of the orientation systems [43].
According to Lu and Zhao [41], the dust deposition rate increased with the dust diameter, then decreased; the highest depositions were for the tilt angle 25° (the dust deposition rate was 14.28%), followed by the angles of 40° (13.53%), 140° (6.79%), and 155° (9.78%). For a photovoltaic panel placed horizontally, the deposition of dust on its surface was higher [44]. The maximum dust deposition was for the diameter of 150 μm. Increasing the dust particle diameter to 300 μm and tilt angles of 25° (0.17%) and 40° (0.19%), the dust diameter of 1 μm and panel tilt angles of 140° (0%) and 155° (0%) minimum deposition values were obtained.
According to a study carried out by Cano [45], the following insolation losses before rain were found: 3.82% for an inclination angle of 0°, 2.12% for 23°, 1.84% for 33°. After rain, the energy losses were lower due to the cleaning of the panels (Table 3) [46,47]. The higher the angle of inclination, the lower the insolation loss. The energy loss due to the dust deposited on the photovoltaic panels is higher at angles of inclination below 23°.
According to research carried out by Lu and Zhao [41], for the dust diameter of 50 μm and tilt angles of 25°, 40°, 140°, and 155°, the wind facilitated the deposition of dust particles on the surface of the photovoltaic panels. For dust particle sizes of 150 μm, the effect of the wind was less; the particles being larger, the dust particles fell almost vertically on the PV panels. For tilt angles of 140° and 155°, dust deposition was caused by gravity, and greater deposition was for angles of 25° and 40° due to gravitational effects. For 250 μm size, very few dust particles reached the solar PV panel; most of them settled on the ground due to high gravity. Small dust particles were deposited on the surface of the photovoltaic panels due to turbulence, whereas large particles were deposited due to the effect of gravity. Dust deposition was reduced at larger dust sizes [35]. The wind removes the dust from the surface of the panel and cools the photovoltaic panel, thus increasing the absorbed radiation.
Dust particles with a diameter larger than 100 µm are deposited on the surface of the photovoltaic panels due to gravity; those smaller than 1 µm are deposited due to Brownian motion. For dust sizes between 1 and 100 µm, the gravitational and viscous forces are similar [5].
Figure 8 shows the insolation values depending on the angle of inclination at 0°, 23°, and 33° of the photovoltaic panels covered with dust and clean. Small variations are observed: the insolation losses are slightly higher in the case of panels covered with dust and at higher tilt angles. According to research carried out by Kumar and Sarkar [27], the energy loss due to the deposition of dust on the surface of photovoltaic modules on sunny days depends on the angle of incidence.
For panels arranged horizontally, the energy loss due to covering the surface of the panel with dust increases by between 8 and 22% [13]; for inclined panels (45°), the loss is 1–8%. Rainfall of 4–5 mm per day cleans the panels [46].

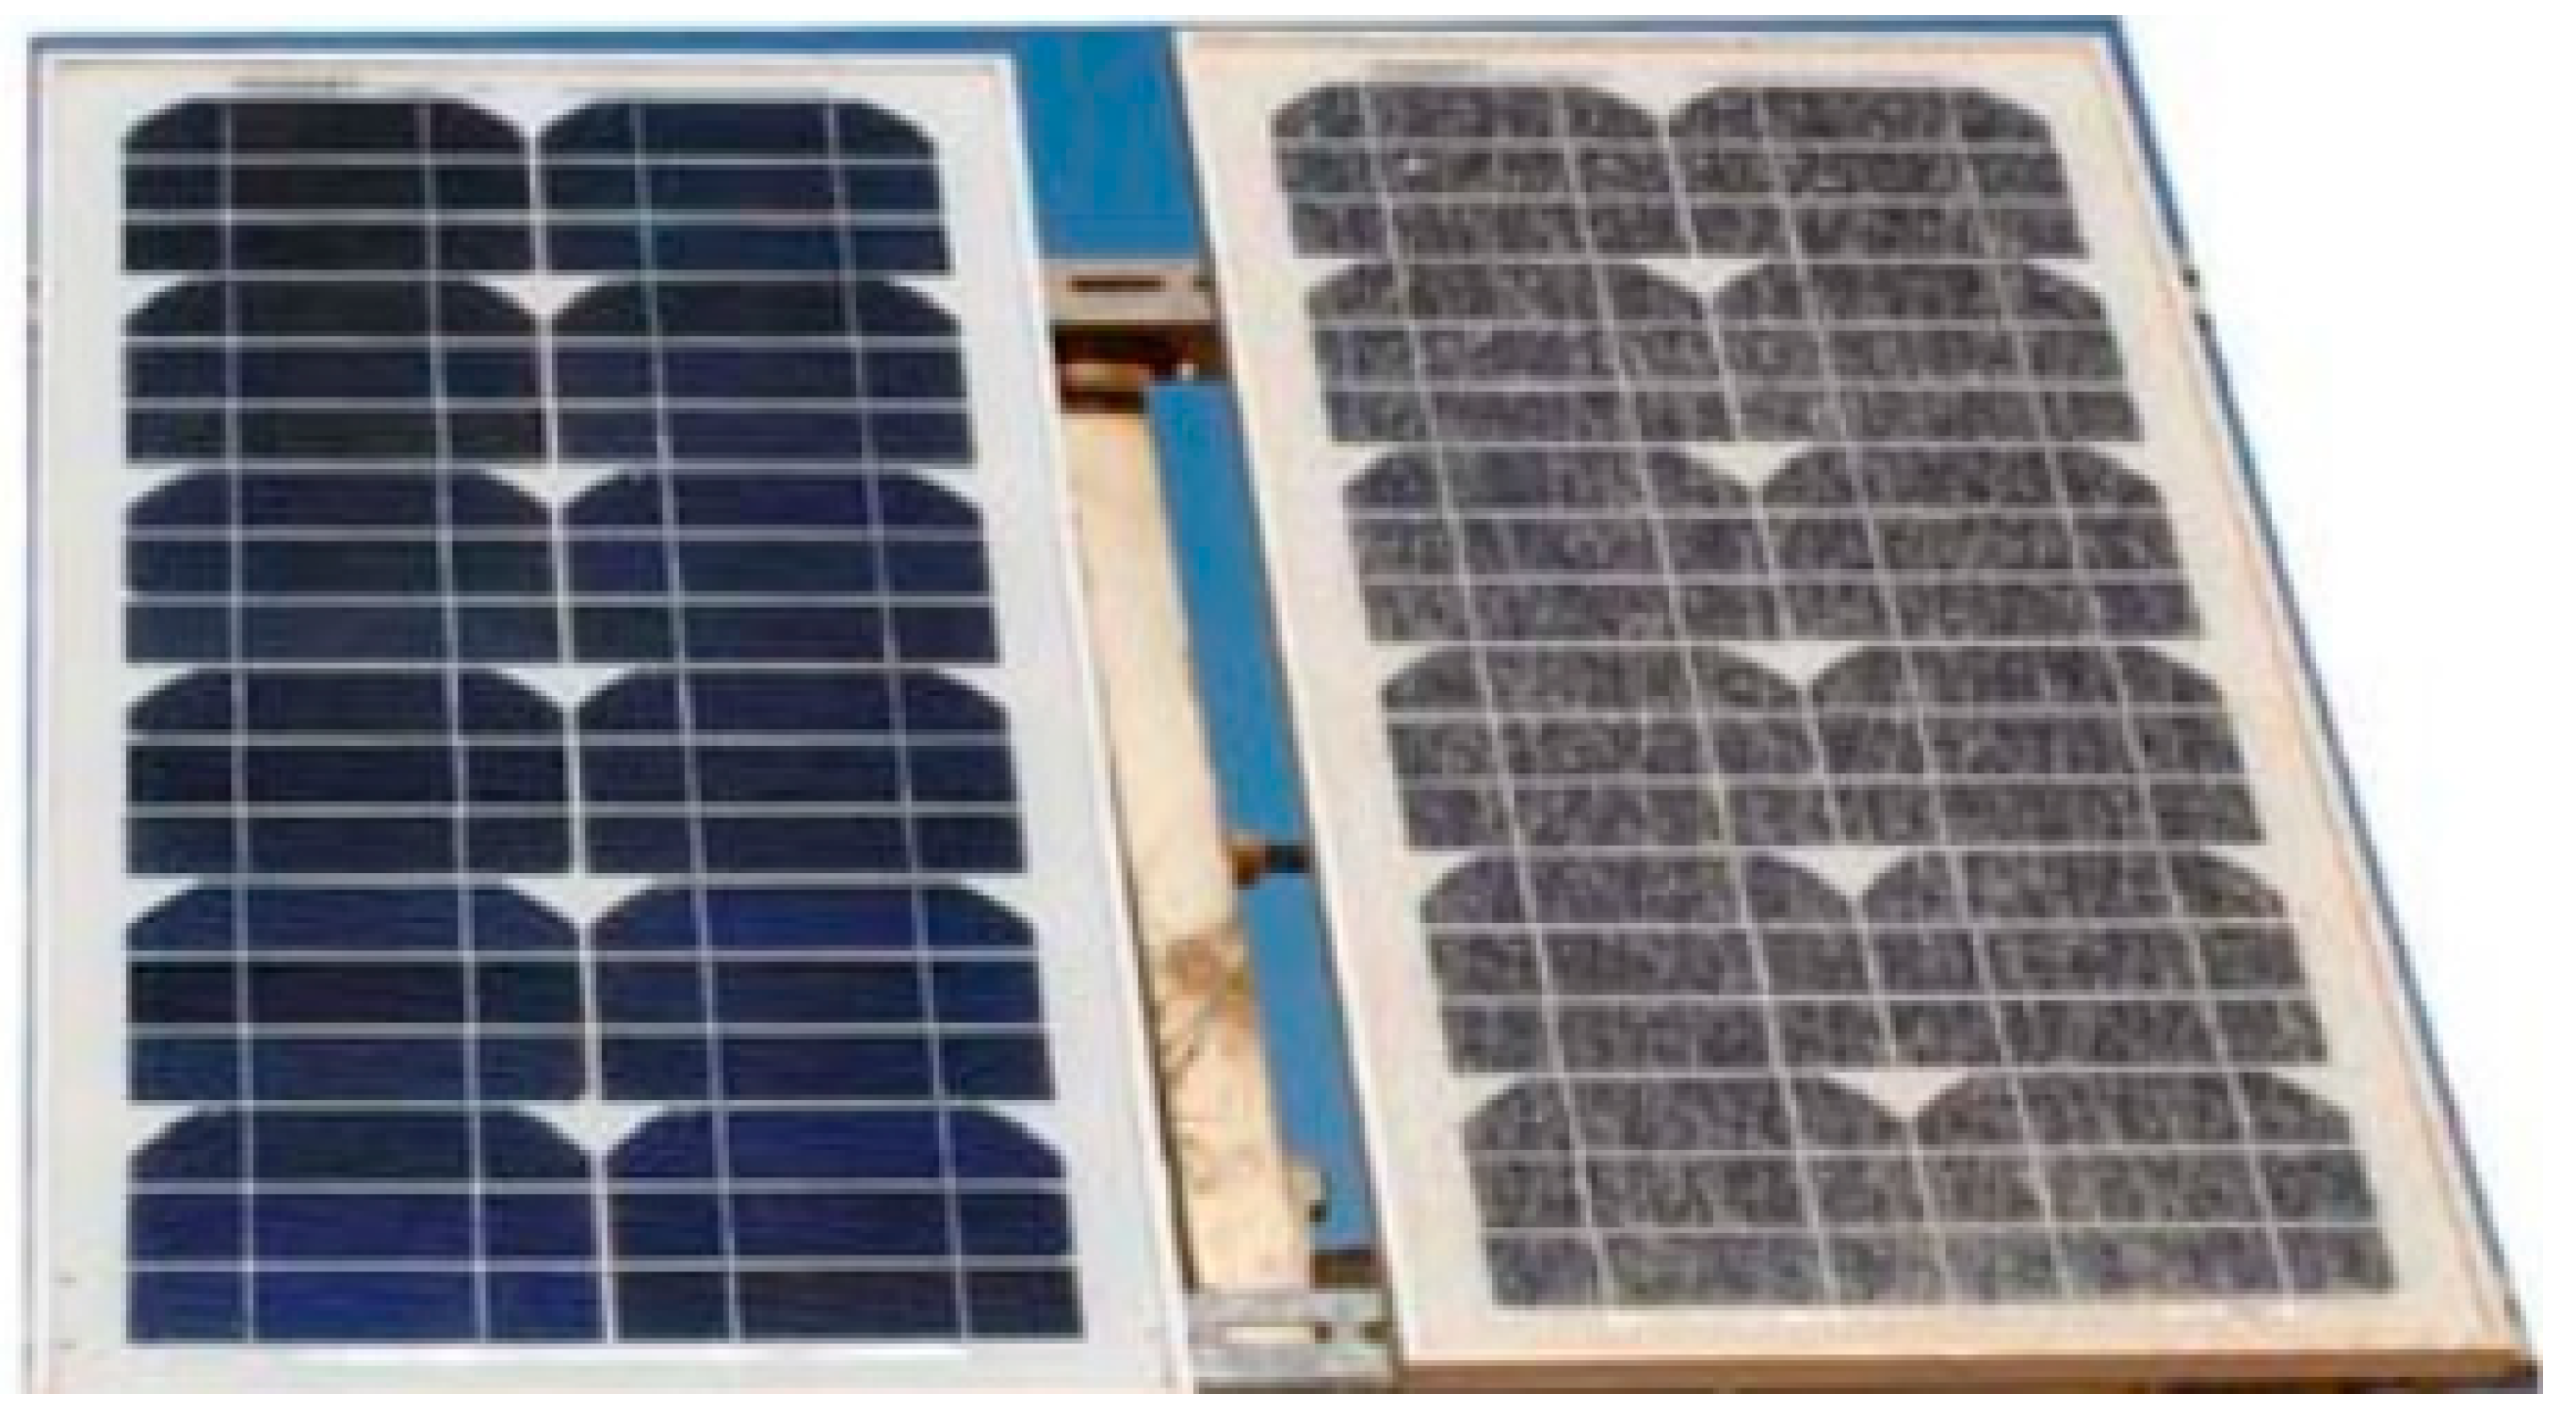
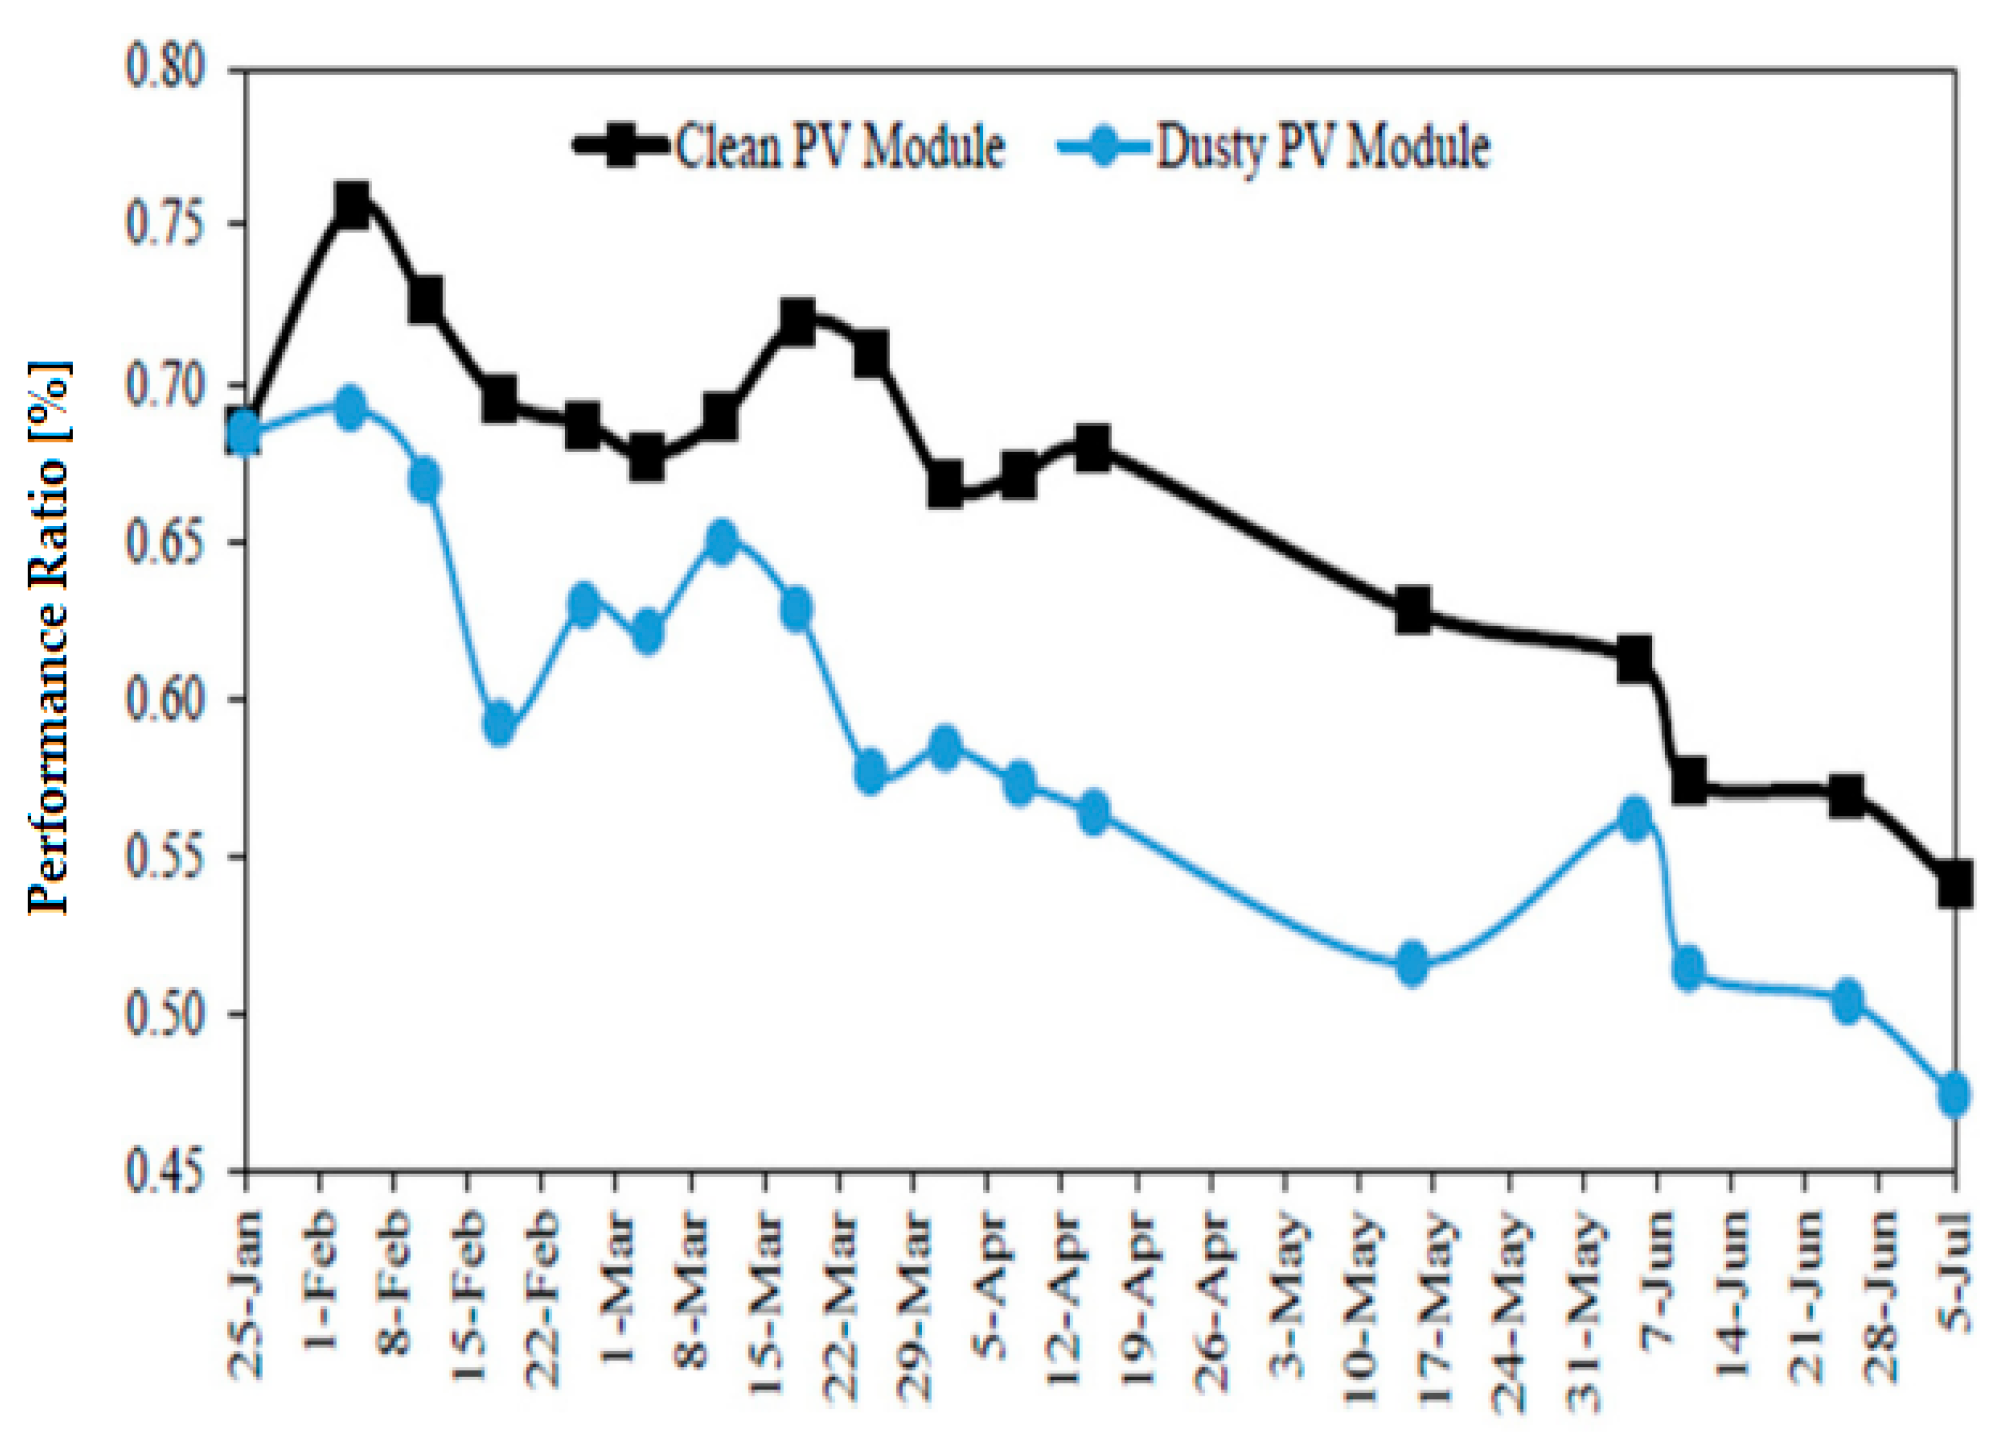
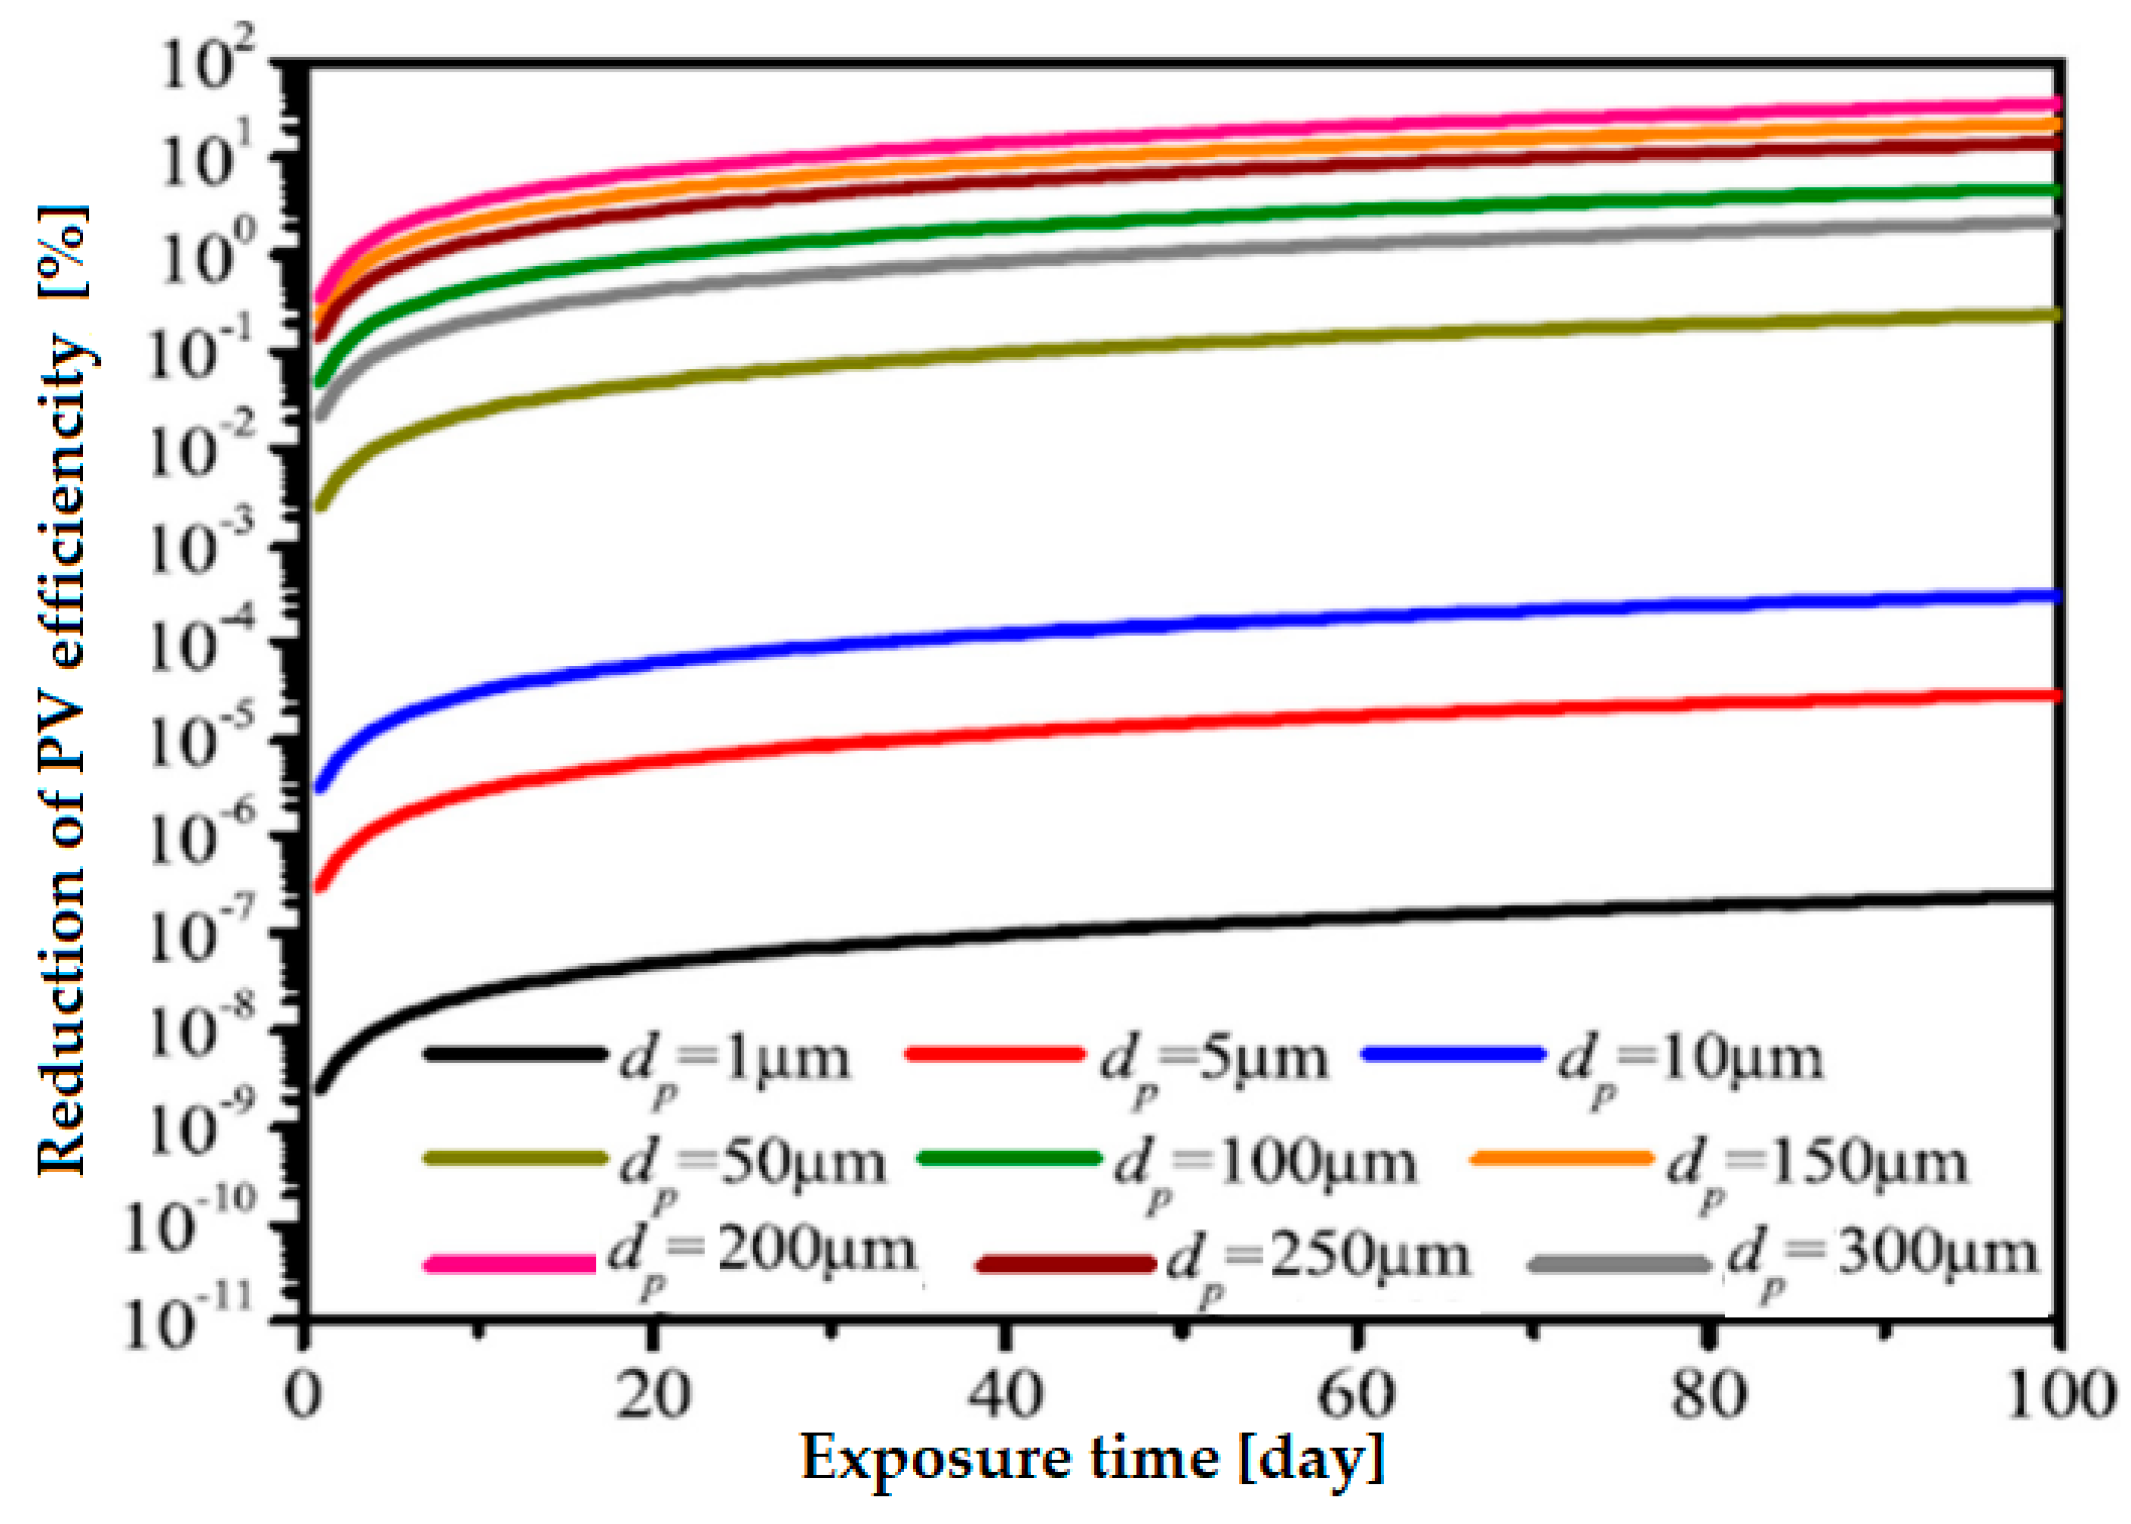
7. The Effect of Dust Accumulation on the Performance of Photovoltaic Panels

Photovoltaic (PV) cells on panels are semiconductors [41] that produce electricity from the Sun, converting sunlight into electricity [47,48]. The performance of the photovoltaic panel is measured in Wp (watt peak, or power). A 200 Wp solar panel produces between 24 and 40 kWh per month (or 800 to 1300 Wh per day) and around 100 W (or 0.1 kW) to 165 W (or 0.16 kW) per hour with a consumption of 8 h per day [49]. The standard warranty for the efficiency (performance) of a solar panel is 25 years, at 80% of the initial performance [50].
The efficiency of photovoltaic modules is influenced by the following factors: their location, longitude, latitude, angle of inclination, the material from which they are made, orientation, temperature of the solar cell, pollution, humidity, solar radiation, dust coverage [14].
According to Kazem et al. [47], dust affects photovoltaic panel performance, yield, and profitability. The maximum power of the photovoltaic panel covered with dust was reduced by 8.41% compared to that of the clean solar panel [46]. According to Chen et al. [33], covering the panel with dust reduces the power and efficiency of the panel [33,49]. According to Chaichan et al. [51], the dust deposited on the panel acts as a barrier between the solar radiation and the panel [15,18,23].
The thickness of the dust layer influences the performance of photovoltaic modules [38]. At concentrations of dust with a size of 1–100 µm, containing SiO2 and Al2O3, it was found that the short-circuit current Isc decreased, without influencing the voltage in the open-circuit Voc, increasing the thickness of the deposited dust from 0 to 22 g/m2, and the efficiency decreased by 0–26%; larger dust particles have a greater impact on reducing the efficiency of photovoltaic modules [21]. In order for the photovoltaic modules to have high efficiency in the conversion of solar energy, they must be cleaned regularly, taking into account atmospheric pollution.
We found a decrease in the efficiency of the photovoltaic panel of 0.4% for 1 g/m2 of dust deposited on the surface of the panel and 0.15% for a dust deposition of 0.1 g/m2. The efficiency of the panel decreased more in the case of ash covering, as follows: by 0.4% for 2.1 g/m2 of ash and by 0.15% for 0.6 g/m2 of ash. The device works better when it is cool and clean compared to when it is cold and dirty. It was found that the efficiency of the solar panel decreased in the warm months, from April to August. The largest decrease in solar panel efficiency was in May, by 25%, when there was a large accumulation of pollution due to low rainfall, when dust particles are removed from the air and form mud on the surface of the photovoltaic module [40]. Heavy precipitation cleans the module shell, which improves operating conditions. The relatively high wind speed determines the removal of dust deposited on inclined solar panels compared to a horizontal surface. The deposition of dust on the surface of the photovoltaic panel is also influenced by the angle of inclination of the panel; when the tilt angle is high, large particles may roll off the panel surface or move to the lower parts [15].
The amount of dust accumulated on the surface of the photovoltaic cell negatively influences the efficiency of the cell [19,52,53,54]; the increase in the amount of dust, determines the decrease in the energy generated by the photovoltaic cell [16,52,53,54,55,56,57,58,59], having a negative impact on the performance of photovoltaic cells.
According to their research on the effect of dust deposition on the surface of photovoltaic panels, Ghazi et al. [49] observed a reduction in the power of the panels by 30%, 14%, and 2% after thirty-two, thirteen, and one day without the surface of the panel being cleaned, respectively. It was found that the efficiency was reduced by 65.8% as a result of dust deposition for a period of six months and by 33.5% after one month of dust deposition [20]. Another study highlighted the reduction in the output power from the photovoltaic panel between 2 and 50% [16].
According to research by Zorrilla-Casanova et al. [60] the deposition of dust on the surface of the photovoltaic panels determined an average daily loss of energy produced by them of 4.4% during rainy periods; in periods without rain, the energy loss reached 20%. The rain cleans the panel coating, improving its performance. According to research carried out by Kumar and Sarkar [27], light rain reduces the efficiency and output power of photovoltaic panels, and high-intensity rain improves efficiency by cleaning the panels of dust. Efficiency is reduced in the absence of precipitation by 0.16% daily. Annual energy lost is between 2.5 and 6.0% [27]. It was found that by cleaning the surfaces of the photovoltaic panels, the output power increased by 23% [27].
According to research carried out by Ndiaye et al. [61] over a period of one year, with panels exposed to dust in natural conditions, there was a decrease in maximum power between 18% and 78% for polycrystalline and monocrystalline modules [60].
Tylim [62] recommends cleaning the surface of the photovoltaic panels every week to ensure the high efficiency of photovoltaic panels.
The efficiency of cleaned photovoltaic panels increased from 9% to 26% for a 150 kW system, it increased by 15% for a 260 kW system, and it increased by 26% for a 330 kW system. According to research carried out by Klugmann-Radziemska [15], the washing of the module layers is re-ordered two or three times a year. Another study showed a 40% decrease in the efficiency of photovoltaic panels in Saudi Arabia [15]. A study carried out in the state of Oregon in the United States showed a decrease in efficiency of 1.4% annually [2,15,63,64].
In Cairo, Egypt, a 17.4% decrease in monthly panel efficiency was recorded [64]. In California and the southwestern part of the United States, the daily energy loss due to dust deposition was 0.2% (during periods without rain) [34].
The efficiency of the panels is calculated according to Equation (3), where η is the efficiency of the photovoltaic panel, A is the surface of the photovoltaic module, Pmax is the maximum nominal power of the photovoltaic module (W), G is the inclined irradiation on the photovoltaic module, E is the solar radiation (W/m2), and S is the surface of the panel (m2). The efficiency reduction ηreduction of photovoltaic panels is calculated with Equation (4), where ηclean is the efficiency of the clean panel and ηdusty is the efficiency of the panel covered with dust [61].
η = P max A x G 100 %
η r e d u c t i o n = η c l e a n η d u s t y η c l e a n 100 %
The performance value of photovoltaic panels can be calculated with the following Formula (5) [4]:
P R = E G E A p l a n t η m o d u l e ( 1 P t p v )
P t p v = T c N O C T γ 100
where PR—photovoltaic panel performance; E—produced energy (kWh); GE—irradiation energy on module plane (kWh/m2); Ptpv—thermal losses factor for the photovoltaic generator; A plant—area of the modules installed (m2); γ—power temperature coefficient of module; ηmodule—module efficiency; Tc—cell temperature (°C); NOCT—nominal operating cell temperature. The deposition of dust on the optical surfaces of photovoltaic modules decreases their power by 30%. According to other studies, the power loss of photovoltaic modules due to deposited dust [64,65] varies between 10% and 70% [35].
The influence of dust on the efficiency of photovoltaic modules depends on the size, weight, shape, and components of the dust [30,66,67,68,69,70]. It was found in Malaysia that acidic dust can cause erosion of the panel surface. Another study highlighted the deterioration of the glass surface and the transmission of light through the surface of the panel due to sand erosion leading to a decrease in the efficiency of the panel [28].
If the panel surface is horizontal, rough, and sticky, slow wind [27] favors the accumulation of dust, whereas strong wind cleans the panel surface [16,66,70].
Corrosion of panel parts exposed to Arizona road dust caused a low corrosion rate, soot deposited on the panel did not cause panel corrosion, and sea-salt deposition caused glass corrosion and decreased panel performance. Corrosion of the panel parts is due to moisture entering the cells through the edges of the chips; this moisture in the cells increases the electrical conductivity of the material, causing the corrosion of the metal joints of the panel cells and a decrease in performance. As a result of the corrosion of the photovoltaic panels, the series resistance increases and their power decreases [71].
Figure 9 shows the corrosion of the edges of the photovoltaic cell and the coupling case exposed to relative humidity of 85% for 1000 h [28].
The broken glass of photovoltaic modules (Figure 10) as a result of faulty installation and maintenance can produce less energy, moisture can penetrate through the cracks. The power of the photovoltaic module can decrease between 10 and 13% due to the discoloration of the photovoltaic module [71].
In Figure 11a,b, based on the analysis of research carried out in the period 2015–2022 [15,30,34,62,63,64,65,66,67,68,69,70,71,72,73,74,75,76,77,78,79,80,81,82,83,84,85,86,87,88,89,90,91,92,93,94,95,96,97,98,99,100,101,102,103,104], we graphically represented the reduction in the efficiency of the panels as a result of the deposition of dust on the photovoltaic systems. The daily loss of panel power is between 0.05% in Oman and 1.15% in Bangladesh (Figure 11a) and the monthly decrease in panel efficiency (Figure 11b) is high, reaching 80%. Periodic cleaning of the panels is recommended for good efficiency [27].
Next, we analyze the effect of dust accumulation on the surface of photovoltaic modules on some performance characteristics of the modules.
According to Ndiaye et al. [61], the accumulation of dust on polycrystalline and monocrystalline photovoltaic modules over a period of one year without being cleaned highlighted losses of the maximum output power (Pmax) between 18 and 78%, the fill factor (FF) of recorded decreases between 2% for the polycrystalline module and 17% for the monocrystalline module, losses of the maximum output current (Imax) between 23 and 80%, and losses were also recorded for the short-circuit current (Isc), whereas the voltage in the circuit open (Voc) and the maximum output voltage (Vmax) had no changes as a result of the deposition of dust on the photovoltaic modules (Table 4).
Table 5 shows the efficiency of the photovoltaic panels according to their performance. The performance is influenced by the energy losses that may occur. The performance of the analyzed systems did not fall below 70%. The analyzed monocrystalline and polycrystalline systems are from 23.92 MW to 2.04 kW.
PC—poly-crystalline silicon, MC—mono-crystalline, PR—performance ratio partial, CF—capacity factor, ηsyst—system efficiency, R—references.
The capacity factor (CF) is the actual power of the photovoltaic system divided by the theoretical production of the photovoltaic plant for a period of time.
The transmissivity decreases with the increase in the density of the dust deposited on the surface of the panels (Figure 12).
It is observed that the performance of clean photovoltaic panels is higher compared to the performance of photovoltaic panels covered with dust (Figure 13).
Large and small-sized dust particles have a smaller deposit than medium-sized dust particles. The efficiency of the photovoltaic panels depending on the dust coverage of different particle sizes over time is shown in Figure 14.
Figure 15 shows the performance rate for several photovoltaic systems: monocrystalline, p-Si polycrystalline silicon, m-Si multi crystalline silicon, a-Si amorphous silicon, c-Si crystalline silicon, thin film, triple-junction, multi-junction. It can be seen that the photovoltaic cells with multijunction (generally with triple or quadruple junction) have the highest efficiency.

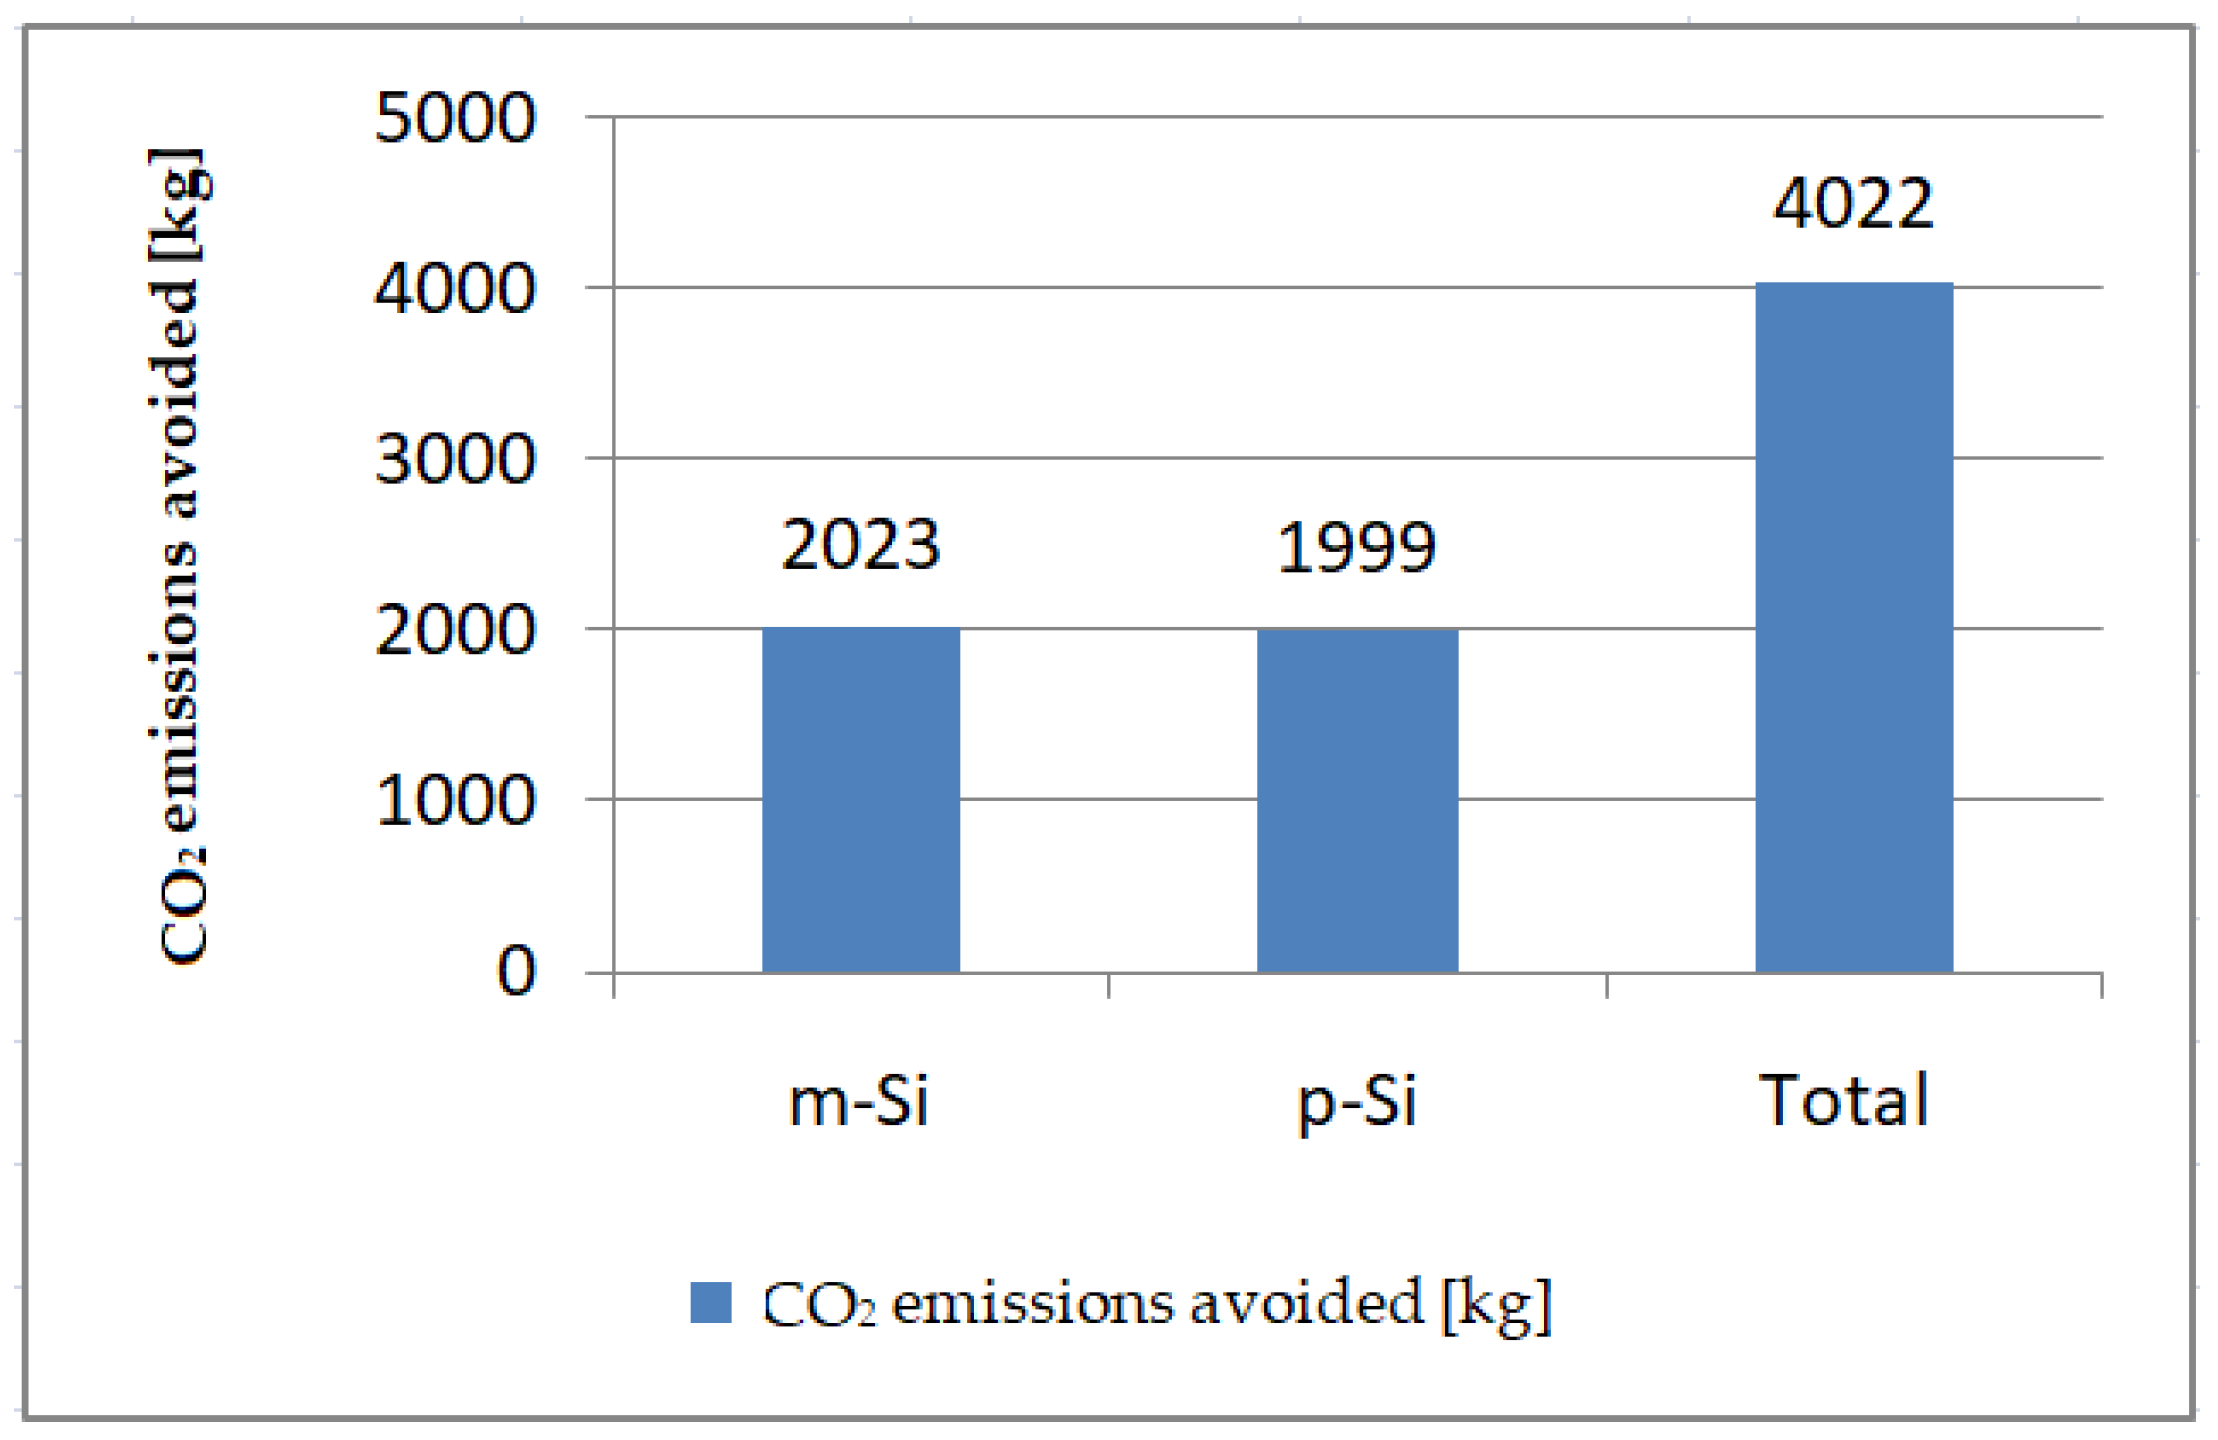
8. Reduction in CO2 Emissions

Next, we carry out an analysis of the reduction in CO2 emissions through the use of photovoltaic panels. Taking into account global warming, researchers’ attention is directed towards the use of renewable energy, i.e., solar energy, to reduce greenhouse gas emissions in the atmosphere.
The electrical energy produced in homes in Mexico by photovoltaic systems is 39.750 GWh, equivalent to a reduction in CO2 emissions of 20.27 Tg [102].
CO2 emissions resulting from the consumption of electricity generated by fossil fuels, which favor global warming, are reduced by using the energy generated by photovoltaic panels [101,102].
According to research carried out by Haibaoui et al. [94], by using photovoltaic panels for one year, a total amount of 4.022 tons of CO2 emissions is reduced (Figure 16).
According to Anang et al. [98], for a house using energy from a 7.8 kWp PV system for 21 years, the total avoided CO2 emissions calculated with Equation (7) are 136.5–156.5 tons.
E M a v = E C F C 1000

9. Conclusions

In this paper, based on the specialized literature, we analyzed the influence of dust deposits on the surface of photovoltaic panels, taking into account the effect of environmental factors of wind, precipitation, temperature, humidity, and solar radiation on the performance of the panels.
The influence of dust on the efficiency of photovoltaic modules depends on the amount of dust deposited on their surface, the size, weight, shape, and components of the dust.
The shading of photovoltaic panels as a result of the deposition of dust influenced by environmental factors reduces the efficiency of the panels.
The smaller the size of the dust particles, the greater the shading effect on the photovoltaic panels.
The efficiency of the panel decreases depending on the increase in the density of dust deposited on the surface of the photovoltaic panel, for slightly high values of solar radiation, wind speed, and atmospheric humidity.
Acidic dust can cause panel surface erosion. The thickness of the dust layer negatively influences the performance of the photovoltaic modules, and the increase in the amount of dust determines the decrease in the energy generated by the photovoltaic cell.
Wind scatters dust and dirt onto the surface of the solar panel, affecting the efficiency of the panel, reducing its transparency and preventing the Sun’s rays from reaching the surface of the panel.
Shading the surface of the photovoltaic panel by the deposition of dust attenuates the solar radiation, reducing its transmission to the surface of the panel.
We analyzed the insolation losses before and after rain and found that rain cleans the panel coating, leading to its better efficiency.
The deposition of dust on the surface of the photovoltaic panel is also influenced by the angle of inclination of the panel; when the angle of inclination is high, large particles can roll off the surface of the panel or move to the lower parts.
The largest dust deposits are found on panels with smaller tilt angles; when the photovoltaic panel is placed horizontally, it leads to energy loss due to covering the panel surface with dust.
Due to the dust deposited on the surface of the polycrystalline and monocrystalline photovoltaic modules over a period of one year, without being cleaned, there were losses of maximum output power (Pmax) between 18 and 78% of the maximum output current (Imax) and between 23 and 80% of the short-circuit current (Isc). The efficiency of the panel decreases depending on the increase in the density of dust deposited on the surface of the photovoltaic panel, for high values of solar radiation, wind speed, and atmospheric humidity. If the surface of the panel is rough or sticky, a slow wind speed favors the accumulation of dust. Moisture in the air can accelerate the deterioration of photovoltaic panel cells, reducing their efficiency.
By using photovoltaic panels, a total amount of 4.022 tons of CO2 emissions is reduced in one year.
When we install photovoltaic panels, we must take into account their angle of inclination, environmental factors in their location, and pollutant emissions, and we must keep the photovoltaic panels clean to achieve a high yield.

Author Contributions

Conceptualization: C.O.R.; methodology: C.O.R. and M.R.; investigation: C.O.R. and M.R.; formal analysis: G.A.C., I.A.I. and M.B.; visualization: G.A.C., I.A.I. and M.B.; resources: C.O.R.; writing-review and editing: C.O.R. and M.R. All authors have read and agreed to the published version of the manuscript.

Funding

This research was supported by the project, Establishment and operationalization of a Competence Center for Soil Health and Food Safety-CeSoH, Contract no.: 760005/2022, specific project no. 1, with the title, Soil health and food safety by introducing a soil remediation protocol and developing mobile remediation equipment to reduce the concentration of organic/inorganic pollutants, Code 2, financed through PNRR-III-C9-2022–I5 (PNRR-National Recovery and Resilience Plan, C9 Support for the private sector, research, development, and innovation, I5 Establishment and operationalization of Competence Centers).

Institutional Review Board Statement

Not applicable.

Informed Consent Statement

Not applicable.

Data Availability Statement

Not applicable.

Conflicts of Interest

The authors declare no conflict of interest.

References

  1. Emisii de gaze cu efect de seră pe țări și sectoare (infografic)|Actualitate|Parlamentul European. Available online: https://www.europarl.europa.eu/news/ro/headlines/society/20180301STO98928/emisii-de-gaze-cu-efect-de-sera-pe-tari-si-sectoare-infografic (accessed on 19 December 2022).
  2. Shenouda, R.; Abd-Elhady, M.S.; Kandil, H.A. A review of dust accumulation on PV panels in the MENA and the Far East regions. J. Eng. Appl. Sci. 2022, 69, 8. [Google Scholar] [CrossRef]
  3. Darwish, Z.A.; Kazem, H.A.; Sopian, K.; Alghoul, M.A.; Alawadhi, H. Experimental investigation of dust pollutants and the impact of environmental parameters on PV performance: An experimental study. Environ. Dev. Sustain. 2018, 20, 155–174. [Google Scholar] [CrossRef]
  4. Verma, A.; Singhal, S. Solar PV Performance Parameter and Recommendation for Optimization of Performance in Large Scale Grid Connected Solar PV Plant—Case Study. J. Energy Power Sources 2015, 2, 40–53. [Google Scholar]
  5. Quan, Z.; Lu, H.; Zhao, W.; Zheng, C.; Zhu, Z.; Qin, J.; Yue, M. A Review of Dust Deposition Mechanism and Self-Cleaning Methods for Solar Photovoltaic Modules. Coatings 2023, 13, 49. [Google Scholar] [CrossRef]
  6. Rao, A.; Pillai, R.; Mani, M.; Ramamurthy, P. Influence of dust deposition on photovoltaic panel performance. Energy Procedia 2014, 54, 690–700. [Google Scholar] [CrossRef]
  7. Urrejola, E.; Antonanzas, J.; Ayala, P.; Salgado, M.; Ramírez-Sagner, G.; Corte’s, C.; Escobar, R. Effect of soiling and sunlight exposure on the performance ratio of photovoltaic technologies in Santiago, Chile. Energy Convers. Manag. 2016, 114, 338–347. [Google Scholar] [CrossRef]
  8. Mihai, M.I.; Tanasiev, V.; Badea, A.; Vidu, R. The influence of climatic factors on the performance of photovoltaic panels. In Proceedings of the The 39th ARA Proceedings, Rome, Italy, 28–31 July 2015. [Google Scholar]
  9. Kaldellis, J.K.; Fragos, P.; Kapsali, M. Systematic experimental study of the pollution deposition impact on the energy yield of photovoltaic installations. Renew. Energy 2011, 36, 2717–2724. [Google Scholar] [CrossRef]
  10. Kumar, S.; Chaurasia, P. Experimental study on the effect of dust deposition on solar photovoltaic panel in Jaipur. Int. J. Sci. Res. 2014, 3, 1690–1693. [Google Scholar]
  11. Castrillón-Mendoza, R.A.; Manrique-Castillo, P.A.; Rey-Hernández, J.; Rey-Martínez, F.; González-Palomino, G. PV Energy Performance in a Sustainable Campus. Electronics 2020, 9, 1874. [Google Scholar] [CrossRef]
  12. Molki, A. Dust affects solar-cell efficiency. Phys. Educ. 2010, 45, 456–458. [Google Scholar] [CrossRef]
  13. Saravanan, V.S.; Darvekar, S.K. Solar Photovoltaic Panels Cleaning Methods A Review. Int. J. Pure Appl. Math. 2018, 118, 1–17. [Google Scholar]
  14. Khan, T.M.Y.; Soudagar, M.E.M.; Kanchan, M.; Afzal, A.; Banapurmath, N.R.; Akram, N.; Mane, S.D.; Shahapurkar, K. Optimum location and infuence of tilt angle on performance of solar PV panels. J. Therm. Anal. Calorim. 2020, 141, 511–532. [Google Scholar] [CrossRef]
  15. Klugmann-Radziemska, E. Degradation of electrical performance of a crystalline photovoltaic module due to dust deposition in northern Poland. Renew. Energy 2015, 78, 418–426. [Google Scholar] [CrossRef]
  16. Chanchangi, Y.; Ghosh, A.; Sundaram, S.; Malick, T.K. Dust and PV Performance in Nigeria: A review. Renew. Sustain. Energy Rev. 2020, 121, 109704. [Google Scholar] [CrossRef]
  17. McTainsh, G.H.; Nickling, W.G.; Lynch, A.W. Dust deposition and particle size in Mali, West Africa. Catena 1997, 29, 307. [Google Scholar] [CrossRef]
  18. Fujiwara, F.; Rebagliati, R.J.; Dawidowski, L.; Gomez, D.; Polla, G.; Pereyra, V.; Smichowski, P. Spatial and chemical patterns of size fractionated road dust collected in a megacity. Atmos. Environ. 2011, 45, 1497. [Google Scholar] [CrossRef]
  19. Beattie, N.S.; Moir, R.S.; Chacko, C.; Buffoni, G.; Roberts, S.H.; Pearsall, N.M. Understanding the effects of sand and dust accumulation on photovoltaic modules. Renew. Energy 2012, 48, 448. [Google Scholar] [CrossRef]
  20. Kaldellis, J.; Kokala, A. Quantifying the decrease of the photovoltaic panels’ energy yield due to phenomena of natural air pollution disposal. Energy 2010, 35, 4862–4869. [Google Scholar] [CrossRef]
  21. Prasad, A.A.; Nishant, N.; Kay, M. Dust cycle and soiling issues affecting solar energy reductions in Australia using multiple datasets. Appl. Energy 2022, 310, 118626. [Google Scholar] [CrossRef]
  22. Adinoyi, M.J.; Said, S.A.M. Effect of dust accumulation on the power outputs of solar photovoltaic modules. Renew. Energy 2013, 60, 633–636. [Google Scholar] [CrossRef]
  23. Cabanillas, R.E.; Munguía, H. Dust accumulation effect on efficiency of Si photovoltaic modules. J. Renew. Sustain. Energy 2011, 3, 043114. [Google Scholar] [CrossRef]
  24. Maghami, M.R.; Hizam, H.; Gomes, C.; Radzi, M.A.; Rezadad, M.I.; Hajighorbani, S. Power loss due to soiling on solar panel: A review. Renew. Sustain. Energy Rev. 2016, 59, 1307–1316. [Google Scholar] [CrossRef]
  25. Chanchangi, Y.; Ghosh, A.; Sundaram, S.; Mallick, T. An analytical indoor experimental study on the effect of soiling on PV, focusing on dust properties and PV surface material. Sol. Energy 2020, 203, 46–68. [Google Scholar] [CrossRef]
  26. Kazem, H.A.; Chaichan, M.T. Experimental analysis of the effect of dust’s physical properties on photovoltaic modules in Northern Oman. Sol. Energy 2016, 139, 68–80. [Google Scholar] [CrossRef]
  27. Kumar, E.S.; Sarkar, B.D.B. Soiling and dust impact on the efficiency and the maximum power point in the photovoltaic modules. Int. J. Eng. Res. Technol. 2013, 2, 1–8. [Google Scholar]
  28. Kazem, H.; Chaichan, M.; Al-Waeli, A.A.; Sopian, K. A review of dust accumulation and cleaning methods for solar photovoltaic systems. J. Clean. Prod. 2020, 276, 123187. [Google Scholar] [CrossRef]
  29. Kaldellis, J.K.; Kapsali, M. Simulating the dust effect on the energy performance of photovoltaic generators based on experimental measurements. Energy 2011, 36, 5154–5161. [Google Scholar] [CrossRef]
  30. Zang, J.; Li, X.; Wang, J.; Qiao, L. CFD–DEM Simulation of Dust Deposition on Solar Panels for Desert Railways. Appl. Sci. 2023, 13, 4. [Google Scholar] [CrossRef]
  31. Kasim, N.; Al-Wattar, A.; Abbas, K. New Technique for Treatment of the dust accumulation from PV solar panels surface. Iraqi J. Phys. 2010, 8, 54–59. [Google Scholar]
  32. Available online: https://www.wamda.com/memakersge/2015/06/solar-piezoclean-and-dust-problem-mena (accessed on 10 December 2022).
  33. Chen, J.; Pan, G.; Ouyang, J.; Ma, J.; Fu, L.; Zhang, L. Study on impacts of dust accumulation and rainfall on PV power reduction in East China. Energy 2020, 194, 116915. [Google Scholar] [CrossRef]
  34. Elminir, H.K.; Ghitas, A.E.; Hamid, R.; El-Hussainy, F.; Beheary, M.; Abdel-Moneim, K.M. Effect of dust on the transparent cover of solar collectors. Energy Convers. Manag. 2006, 47, 3192–3203. [Google Scholar] [CrossRef]
  35. Dulgheru, V.; Dumitrescu, C.; Cristescu, C. Sun Orientation System of the Group of Photovoltaic Panels. Available online: https://ibn.idsi.md/sites/default/files/imag_file/72_76_Sistem%20de%20orientare%20la%20soare%20a%20grupului%20de%20panouri%20fotovoltaice.pdf (accessed on 19 December 2022).
  36. Govindasamy, D.; Kumar, A. Evaluation of the impact of different composite phase change materials on reduction in temperature and enhancement of solar panel efficiency. J. Energy Storage 2023, 60, 106631. [Google Scholar] [CrossRef]
  37. Available online: http://free-energy-monitor.com/index.php/energy/fotovoltaice (accessed on 20 December 2022).
  38. Mekhilef, S.; Saidur, R.; Kamalisarvestani, M. Effect of dust, humidity and air velocity on efficiency of photovoltaic cells. Renew. Sustain. Energy Rev. 2012, 16, 2920–2925. [Google Scholar] [CrossRef]
  39. Kempe, M.D. Modeling of rates of moisture ingress into photovoltaic modules. Sol. Energy Mater. Sol. Cells 2006, 90, 2720–2738. [Google Scholar] [CrossRef]
  40. Tan, C.M.; Chen, B.K.E.; Toh, K.P. Humidity study of a-Si PV cell. Microelectron. Reliab. 2010, 50, 1871–1874. [Google Scholar] [CrossRef]
  41. Lu, H.; Zhao, W. Effects of particle sizes and tilt angles on dust deposition characteristics of a ground-mounted solar photovoltaic system. Appl. Energy 2018, 220, 514–526. [Google Scholar] [CrossRef]
  42. Meral, M.E.; Dinçer, F.A. Review of the factors affecting operation and efficiency of Photovoltaic based electricity generation systems. Renew. Sustain. Energy Rev. 2011, 15, 2176–2184. [Google Scholar] [CrossRef]
  43. Mackley, R.D.; Thomle, J.N.; Anderson, D.M.; Strickland, C.E. Technical and Economic Assessment of Solar Photovoltaic for Groundwater Extraction on the Hanford Site; Pacific Northwest National Lab (PNNL): Richland, WA, USA, 2015. [Google Scholar]
  44. Rusănescu, C.O.; Paraschiv, G.; Murad, E.; David, M.F. Monitoring solar radiation intensity in the year 2011 in the north west of Bucharest with sun-earth angle. In Proceedings of the International symposium ISB/INMA TEH 2012, Bucharest, Romania, 1–3 November 2012; pp. 159–164. [Google Scholar]
  45. Cano, J. Photovoltaic Modules: Effect of Tilt Angle on Soiling. Master’s Thesis, Arizona State University, Tempe, AZ, USA, 2011. [Google Scholar]
  46. Manolache, A.I.; Andrei, G.; Rusu, L. An Evaluation of the Efficiency of the Floating Solar Panels in the Western Black Sea and the Razim-Sinoe Lagunar System. J. Mar. Sci. Eng. 2023, 11, 203. [Google Scholar] [CrossRef]
  47. Kazem, H.A.; Chaichan, M.T.; Saif, S.A.; Dawood, A.A.; Salim, S.A.; Rashid, A.A.; Alwaeli, A.A. Experimental investigation of dust type effect on photovoltaic systems in north region, Oman. Int. J. Sci. Eng. Res. 2015, 6, 293–298. [Google Scholar]
  48. Liu, D.; Yang, X.; Gao, J.; Ran, Q.; Zhu, G.; Yuan, J.; Zheng, D.; Guo, J.; Zhao, J.; Tang, Q. Smart Solar-Panel Umbrella toward High-Efficient Hybrid Solar and Rain Energy Harvesting. Energy Tehnol. 2022, 11, 2201044. [Google Scholar] [CrossRef]
  49. Ghazi, S.; Sayigh, A.; Ip, K. Dust effect on flat surfaces—A review paper. Renew. Sustain. Energy Rev. 2014, 33, 742–751. [Google Scholar] [CrossRef]
  50. Rida, K.; Al-Waeli, A.A.; Al-Asadi, K.A. The impact of air mass on photovoltaic panel performance. Eng. Sci. Rep. 2016, 1, 1. [Google Scholar] [CrossRef]
  51. Chaichan, M.T.; Abass, K.I.; Kazem, H.A. Energy Yield Loss Caused by Dust and Pollutants Deposition on Concentrated Solar Power Plants in Iraq Weathers. Int. Res. J. Adv. Eng. Sci. 2018, 3, 160–169. [Google Scholar]
  52. Jiang, H.; Lu, L.; Sun, K. Experimental investigation of the impact of airborne dust deposition on the performance of solar photovoltaic modules. Atmos. Environ. 2011, 45, 4299–4304. [Google Scholar] [CrossRef]
  53. Hachicha, A.A.; Al-Sawafta, I.; Said, Z. Impact of dust on the performance of solar photovoltaic (PV) systems under United Arab Emirates weather conditions. Renew. Energy 2019, 141, 287–297. [Google Scholar] [CrossRef]
  54. Aïssa, B.; Isaifan, R.J.; Madhavan, V.E.; Abdallah, A.A. Structural and physical properties of the dust particles in Qatar and their influence on the PV panel performance. Sci. Rep. 2016, 6, 1–12. [Google Scholar] [CrossRef]
  55. El-Shobokshy, M.S.; Hussein, F.M. Effect of dust with different physical properties on the performance of photovoltaic cells. Sol. Energy 1993, 51, 505–511. [Google Scholar] [CrossRef]
  56. Tanesab, J.; Parlevliet, D.; Whale, J.; Urmee, T. The effect of dust with different morphologies on the performance degradation of photovoltaic modules. Sustain. Energy Technol. Assess. 2019, 31, 347–354. [Google Scholar] [CrossRef]
  57. Goossens, D.; Lundholm, R.; Goverde, H.; Govaerts, J. Effect of soiling on wind-induced cooling of photovoltaic modules and consequences for electrical performance. Sustain. Energy Technol. Assess. 2019, 34, 116–125. [Google Scholar] [CrossRef]
  58. Sadat, S.A.; Faraji, J.; Nazififard, M.; Ketabi, A. The experimental analysis of dust deposition effect on solar photovoltaic panels in Iran’s desert environment. Sustain. Energy Technol. Assess. 2021, 47, 101542. [Google Scholar]
  59. Kazem Ali, A.; Chaichan, M.T.; Kazem, H.A. Dust effect on photovoltaic utilization in Iraq: Review article. Renew. Sustain. Energy Rev. 2014, 37, 734–749. [Google Scholar] [CrossRef]
  60. Zorrilla-Casanova, J.; Piliougine, M.; Carretero, J.; Bernaola, P.; Carpena, P.; Mora -Lopez, L.; Sidrach-de-Cardona, M. Analysis of dust losses in photovoltaic modules. In Proceedings of the World Renewable Energy Congress, Linköping, Sweden, 8–13 May 2011. [Google Scholar]
  61. Ndiaye, A.; Kébé, C.M.F.; Ndiaye, P.A.; Charki, A.; Kobi, A.; Sambou, V. Impact of dust on the photovoltaic (PV) modules characteristics after an exposition year in Sahelian environment: The case of Senegal. Int. J. Phys. Sci. 2013, 8, 1166–1173. [Google Scholar] [CrossRef]
  62. Tylim, A. The importance of a PV system washing program. Renew. Energy World 2013, 11. [Google Scholar]
  63. Marion, B.; Deceglie, M.G.; Silverman, T.J. Analysis of measured photovoltaic module performance for Florida, Oregon, and Colorado locations. Solar Energy 2014, 10, 736–744. [Google Scholar] [CrossRef]
  64. McMillon-Brown, L.; Peshek, T.J.; Pal, A.M.; McNatt, J. A study of photovoltaic degradation modes due to dust interaction on Mars. Sol. Energy Mater. Sol. Cells 2021, 221, 110880. [Google Scholar] [CrossRef]
  65. Kimber, A.; Mitchell, L.; Nogradi, S.; Wenger, H. Effect of soiling on large grid-connected photovoltaic systems in California and the Southwest region of the United States. In Proceedings of the Photovoltaic Energy Conversion: Record of the IEEE 4th World Conference, Waikoloa, HI, USA, 7–12 May 2006; p. 2391. [Google Scholar]
  66. Weiß, K.A.; Klimm, E.; Kaaya, I. Accelerated aging tests vs field performance of PV modules. Prog. Energy 2022, 4, 042009. [Google Scholar] [CrossRef]
  67. Hajighorbani, S.; Radzi, M.; Ab Kadir, M.; Shafie, S.; Khanaki, R.; Maghami, M. Evaluation of Fuzzy Logic Subsets Effects on Maximum Power Point Tracking for Photovoltaic System. Int. J. Photoenergy 2014, 2014, 719126. [Google Scholar] [CrossRef]
  68. El-Nashar, A.M. The effect of dust accumulation on the performance of evacuated tube collectors. Sol. Energy 1994, 53, 105–115. [Google Scholar] [CrossRef]
  69. Hasan, K.; Yousuf, S.B.; Tushar, M.S.H.K.; Das, B.K.; Das, P.; Islam, M.S. Effects of different environmental and operational factors on the PV performance: A comprehensive review. Energy Sci. Eng. 2022, 10, 656–675. [Google Scholar] [CrossRef]
  70. Kim, J.; Rabelo, M.; Padi, S.P.; Yousuf, H.; Cho, E.C.; Yi, J. A Review of the Degradation of Photovoltaic Modules for Life Expectancy. Energies 2021, 14, 4278. [Google Scholar] [CrossRef]
  71. Keller, J.; Lamprecht, R. Road dust as an indicator for air pollution transport and deposition: An application of SPOT imagery. Remote Sens. Environ. 1995, 54, 1–12. [Google Scholar] [CrossRef]
  72. Said, S.A.M. Effects of dust accumulation on performances of thermal and photovoltaic flat-plate collectors. Appl. Energy 1990, 37, 73–84. [Google Scholar] [CrossRef]
  73. Juaidi, A.; Muhammad, H.H.; Abdallah, R.; Albatayneh, A.; Kawa, F. Experimental validation of dust impact on-grid connected PV system performance in Palestine: An energy nexus perspective. Energy Nexus 2022, 6, 100082. [Google Scholar] [CrossRef]
  74. Asl-Soleimani, E.; Farhangi, S.; Zabihi, M.S. The effect of tilt angle, air pollution on performance of photovoltaic systems in Tehran. Renew. Energy 2001, 24, 459–468. [Google Scholar] [CrossRef]
  75. Sanusi, Y.K. The performance of amorphous silicon PV system under Harmattan dust conditions in a tropical area. Pac. J. Sci. Technol. 2012, 13, 168–175. [Google Scholar]
  76. Tanesab, J.; Parlevliet, D.; Whale, J.; Urmee, T.; Pryor, T. The contribution of dust to performance degradation of PV modules in a temperate climate zone. Sol. Energy 2015, 120, 147–157. [Google Scholar] [CrossRef]
  77. O’Hara, S.L.; Clarke, M.L.; Elatrash, M.S. Field measurements of desert dust deposition in Libya. Atmos. Environ. 2006, 40, 3881–3897. [Google Scholar] [CrossRef]
  78. Kawamoto, H.; Shibata, T. Electrostatic cleaning system for removal of sand from solar panels. J. Electrost. 2015, 73, 65–70. [Google Scholar] [CrossRef]
  79. Darwish, Z.A.; Kazem, H.A.; Sopian, K.; Alghoul, M.A.; Chaichan, M.T. Impact of Some Environmental Variables with Dust on Solar Photovoltaic (PV) Performance: Review and Research Status. Int. J. Energy Environ. 2013, 7, 152–159. [Google Scholar]
  80. Costa, S.C.S.; Diniz, A.S.A.C.; Kazmerski, L.L. Dust and soiling issues and impacts relating to solar energy systems: Literature review update for 2012–2015. Renew. Sustain. Energy Rev. 2016, 63, 33–61. [Google Scholar] [CrossRef]
  81. Orioli, A.; Di Gangi, A. An improved photographic method to estimate the shading effect of obstructions. Sol. Energy 2012, 86, 3470–3488. [Google Scholar] [CrossRef]
  82. Benatiallah, A.; Mouly Ali, A.; Abidi, F.; Benatiallah, D.; Harrouz, A.; Mansouri, I. Experimental study of dust effect in mult-crystal PV solar module. Int. J. Multidiscip. Sci. Eng. 2012, 3, 3–6. [Google Scholar]
  83. Mazumder, M.; Horenstein, M.; Stark, J.; Hudelson, J.N.; Sayyah, A.; Heiling, C.; Yellowhair, J. Electrodynamic removal of dust from solar mirrors and its applications in concentrated solar power (CSP) plants. In Proceedings of the Industry Applications Society Annual Meeting, IEEE, Vancouver, BC, Canada, 5–9 October 2014; pp. 1–7. [Google Scholar] [CrossRef]
  84. Appels, R.; Muthirayan, B.; Beerten, A.; Paesen, R.; Driesen, J.; Poortmans, J. The effect of dust deposition on photovoltaic modules. In Proceedings of the Conference Record of the IEEE Photovoltaic Specialists Conference, Lake Buena Vista, FL, USA, 3–7 January 2012; pp. 1886–1889. [Google Scholar] [CrossRef]
  85. Vikrant, S.; Chandel, S.S. Performance analysis of a 190 kW p grid interactive solar photovoltaic power plant in India. Energy 2013, 55, 476–485. [Google Scholar] [CrossRef]
  86. Guo, B.; Javed, W.; Figgis, B.W.; Mirza, T. Effect of dust and weather conditions on photovoltaic performance in Doha, Qatar. In Proceedings of the 1st Work, Smart Grid Renew, Energy SGRE, Doha, Qatar, 22–23 March 2015. [Google Scholar] [CrossRef]
  87. Hassan, A.H.; Rahoma, U.A.; Elminir, H.K.; Fathy, A.M. Effect of airborne dust concentration on the performance of PV modules. J. Astron. Soc. Egypt. 2005, 13, 24–38. [Google Scholar]
  88. Al-Hasan, A.Y.; Ghoneim, A.A. A new correlation between photovoltaic panel’s efficiency and amount of sand dust accumulated on their surface. Int. J. Sustain. Energy 2005, 24, 187–197. [Google Scholar] [CrossRef]
  89. Pavan, A.M.; Mellit, A.; De Pieri, D. The effect of soiling on energy production for large-scale photovoltaic plants. Sol. Energy 2011, 85, 1128–1136. [Google Scholar] [CrossRef]
  90. Sreenath, S.; Sudhakar, K.; Yusop, A.F.; Solomin, E.; Kirpichnikova, I.M. Solar PV Energy System in Malaysian Airport: Glare Analysis, General Design and Performance Assessment. Energy Rep. 2020, 6, 698–712. [Google Scholar] [CrossRef]
  91. Shiva Kumar, B.; Sudhakar, K. Performance Evaluation of 10 MW Grid Connected Solar Photovoltaic Power Plant in India. Energy Rep. 2015, 1, 184–192. [Google Scholar] [CrossRef]
  92. Belmahdi, B.; Bouardi, A. El Solar Potential Assessment Using PVsyst Software in the Northern Zone of Morocco. Procedia Manuf. 2020, 46, 738–745. [Google Scholar] [CrossRef]
  93. Atsu, D.; Seres, I.; Farkas, I. The State of Solar PV and Performance Analysis sof Different PV Technologies Grid-Connected Installations in Hungary. Renew. Sustain. Energy Rev. 2021, 141, 110808. [Google Scholar] [CrossRef]
  94. Haibaoui, A.; Hartiti, B.; Elamim, A.; Karami, M.; Ridah, A. Performance Indicators for Grid-Connected PV Systems: A Case Study In Casablanca, Morocco. IOSR J. Electr. Electron. Eng. IOSR-JEEE 2017, 12, 55–65. [Google Scholar] [CrossRef]
  95. Kumar Saini, R.; Kumar Saini, D.; Gupta, R.; Verma, P.; Dwivedi4, R.P.; Kumar, A.; Chauhan, D.; Kumar, S. Effects of dust on the performance of solar panels—A review update from 2015–2020. Energy Environ. 2022, 34, 1–53. [Google Scholar]
  96. Emziane, M.; Ali, M.A. Performance assessment of rooftop PV systems in Abu Dhabi. Energy Build. 2015, 108, 101–105. [Google Scholar] [CrossRef]
  97. Omar, M.A.; Mahmoud, M.M. Grid connected PV- home systems in Palestine: A review on technical performance, effects and economic feasibility. Renew. Sustain. Energy Rev. 2018, 82, 2490–2497. [Google Scholar] [CrossRef]
  98. Anang, N.; Syd Nur Azman, S.N.A.; Muda, W.M.W.; Dagang, A.N.; Daud, M.Z. Performance analysis of a grid-connected rooftop solar PV system in Kuala Terengganu, Malaysia. Energy Build. 2021, 248, 111182. [Google Scholar] [CrossRef]
  99. Aslam, A.; Ahmed, N.; Qureshi, S.A.; Assadi, M.; Ahmed, N. Advances in Solar PV Systems; A Comprehensive Review of PV Performance, Influencing Factors, and Mitigation Techniques. Energies 2022, 15, 7595. [Google Scholar] [CrossRef]
  100. Lee, J.F.; Rahim, N.A.; Al-Turki, Y.A. Performance of Dual-Axis Solar Tracker versus Static Solar System by Segmented Clearness Index in Malaysia. Int. J. Photoenergy 2013, 2013, 820714. [Google Scholar] [CrossRef]
  101. Hosenuzzaman, M.; Rahim, N.A.; Selvaraj, J.; Hasanuzzaman, M.; Malek, A.B.M.A.; Nahar, A. Global prospects, progress, policies, and environmental impact of solar photovoltaic power generation. Renew. Sustain. Energy Rev. 2015, 41, 284–297. [Google Scholar] [CrossRef]
  102. Ghadikolaei, S.S.C. An enviroeconomic review of the solar PV cells cooling technology effect on the CO2 emission reduction. Sol. Energy 2021, 216, 468–492. [Google Scholar] [CrossRef]
  103. Mensah, L.D.; Yamoah, J.O.; Adaramola, M.S. Performance Evaluation of a Utility-Scale Grid-Tied Solar Photovoltaic (PV) Installation in Ghana. Energy Sustain. Dev. 2019, 48, 82–87. [Google Scholar] [CrossRef]
  104. Phap, V.M.; Nga, N.T. Feasibility study of rooftop photovoltaic power system for a research institute towards green building in Vietnam. EAI Endorsed Trans. Energy 2020, 7, 162825. [Google Scholar] [CrossRef]
Figure 1. The causes of dust accumulation on the surface of solar panels (adapted from [24]).
Energies 16 06794 g001
Figure 2. Dust samples that can be deposited on the surface of solar cells (adapted from [25]).
Energies 16 06794 g002
Figure 3. Solar panels covered in dust (adapted from [31]).
Energies 16 06794 g003
Figure 4. Structural SEM appearance of dust (adapted from [28]).
Energies 16 06794 g004
Figure 5. (ac) Solar cells that received water (adapted from [38]).
Energies 16 06794 g005
Figure 6. The influence of relative humidity on irradiation (adapted from [38]).
Energies 16 06794 g006
Figure 7. Orientation of photovoltaic panels towards the Sun (adapted from [42]).
Energies 16 06794 g007
Figure 8. Average daily insolation values for dust-covered and clean PV panels as a function of tilt angles (adapted from [45]).
Energies 16 06794 g008
Figure 9. Corrosion effects on PV module at (a) edge and (b) junction box (adapted from [28]).
Energies 16 06794 g009
Figure 10. PV module with broken glass (adapted from [70]).
Energies 16 06794 g010
Figure 11. (a) Daily energy losses of photovoltaic panels (adapted from [28]); (b) The monthly decrease in the efficiency of photovoltaic panels due to dust coverage (adapted from [28]).
Energies 16 06794 g011
Figure 12. The variation of transmittance depending on the density of deposited dust (adapted from [5]).
Energies 16 06794 g012
Figure 13. The ratio performance of clean and dust-covered photovoltaic panels (adapted from [95]).
Energies 16 06794 g013
Figure 14. Effect of dust size on the efficiency of PV modules (adapted from [95]).
Energies 16 06794 g014
Figure 15. Performance ratio of photovoltaic panels (adapted from [99]).
Energies 16 06794 g015
Figure 16. The performance of clean and dust-covered photovoltaic panels (adapted from [94]).
Energies 16 06794 g016
Table 1. The composition of dust samples in different places (data from [33,34]).
LocationMajor OxidesMajor Elements
(Except O)
Origin
[33]Hangzhou, ChinaSiO2, Al2O3, CaO, Fe2O3, etc.Si, Ca, Al, Fe, K, Mg, NaSand, potash feldspar, mechanical wear, straw burning
[33]Doha, Qatar Calcite (CaCO3), Dolomite (CaMg(CO3)2), Quartz (SiO2), etc.Ca, Si, Fe, Mg, AlDolomite, Calcite, local soil, and buildings
[33]Northern Poland SiO2, Al2O3, MgO, etc.Si, Al, Mg, Fe, K. Ca, P, SSand, the wear of frictional elements of mechanical components
[34]Cairo, Egypt Quartz (SiO2), Calcite (CaCO3), etc.Si, Ca, Al, Fe, Mg, K, NaDeserts, cement industry emissions, fossil fuel combustion
[34]Perth, Australia Quartz (SiO2), Calcium oxide (CaO), Orthoclase (KAlSi3O8), etc. Si, Ca, Al, Fe, KDominated by acid and sandy soils that might be caused by deserts
Table 2. The impact of dust density and meteorological parameters on the efficiency of the photovoltaic panel (data from [3]).
Density (Mass/Area) g/m2Solar
Radiation (W/m2)
Temperature (°C)Wind
Velocity (m/s)
Humidity (%)Efficiency (%)
069731.82.579.911.1
11.1169832.05.080.610.1
22.2270231.92.579.89.9
33.3370431.95.079.99.8
44.4470931.95.079.49.6
55.5571031.92.579.89.6
66.6671032.02.580.39.6
77.7771032.05.080.89.5
88.8871032.02.581.59.4
10071331.85.081.79.3
111.1171331.75.082.49.1
Table 3. Average daily insolation losses before and after rain (data from [45]).
Daily Average Insolation (kWh/m2)
23°33°23°33°
Before RainAfter Rain
Clean4.977.097.593.744.754.95
Unclean4.786.947.453.694.714.90
Insolation
Loss3.82%2.12%1.84%1.34%0.84%1.01%
Table 4. The effect of dust accumulation on photovoltaic modules on performance characteristics (data from [61]).
ModulesParameterInitial ValueClean Module after One Exposition YearDusty Module after One Exposition Year
Monocrystalline PV modulePmax (W)145144.5932.17
Vmax (V)17.917.8320.79
Imax (A)8.18.061.57
Voc (V)22.722.722.7
Isc (A)8.58.472.09
FF (%)75.1473.6460.4
Polycrystalline PV modulePmax (W)230217.37178.19
Vmax (V)29.228.0430.09
Imax (A)7.887.755.93
Voc (V)36.636.1636.16
Isc (A)8.448.336.61
FF (%)74.4872.0970.64
Table 5. Performance of photovoltaic panels (data from [91,93,94,99,103,104]).
PV TypeRated
Capacity
Energy Generation (kWh/year)Final Yield
(kW h/kWp-day)
PR (%)CF (%)ηsystTilt Angle (°)R
MC20 MW26,304,0004.1976.815.2211.5415[99]
PC23.92 MW43,261,4004.9582.020.64-15[99]
MC28 kW45,1194.471.8918.5810.9927[99]
PC10 MW15,798,1924.078517.6810.1233.7[91]
PC2.5 MW3,547,8004.4970.616.211.5612.5[103]
MC56.7 kW68,6253.3282.4-14.4518[104]
PC9.6 kW88393.0777.22-9.830[93]
MC2.04 kW3370.894.9676.718.8611.730[94]
Disclaimer/Publisher’s Note: The statements, opinions and data contained in all publications are solely those of the individual author(s) and contributor(s) and not of MDPI and/or the editor(s). MDPI and/or the editor(s) disclaim responsibility for any injury to people or property resulting from any ideas, methods, instructions or products referred to in the content.

