Article

Comparative Analysis of Indoor Environmental Quality and Self-Reported Productivity in Intelligent and Traditional Buildings

1
Faculty of Environmental Engineering, Geodesy and Renewable Energy, Kielce University of Technology, Al. Tysiaclecia P.P. 7, 25-314 Kielce, Poland
2
Faculty of Mechatronics and Mechanical Engineering, Kielce University of Technology, Al. Tysiaclecia P.P. 7, 25-314 Kielce, Poland
3
Faculty of Mechanical Engineering, VSB-Technical University of Ostrava, 17. Listopadu 2172/15, 708 00 Ostrava, Czech Republic
4
Faculty of Mechanical Engineering, Cracow University of Technology, Al. Jana Pawła II 37, 31-864 Cracow, Poland
5
Faculty of Production Engineering and Materials Technology, Czestochowa University of Technology, Al. Armii Krajowej 19, 42-200 Częstochowa, Poland
*
Author to whom correspondence should be addressed.
Energies 2023, 16(18), 6663; https://doi.org/10.3390/en16186663
Submission received: 1 August 2023 / Revised: 3 September 2023 / Accepted: 14 September 2023 / Published: 17 September 2023

Abstract

:
People tend to spend considerable amounts of time in buildings; thus the issue of providing proper indoor environmental quality is of significant importance. This paper experimentally analyses the subjective sensations of the occupants of intelligent and traditional buildings with the focus on possible differences between these two types of buildings. The study is based on a large database of 1302 questionnaires collected in 92 rooms where simultaneous measurements of the indoor environment physical parameters (air and globe temperature, relative humidity, carbon dioxide concentration, and illuminance) were carried out. Their impact on the subjective assessment of the indoor environment has been presented and analysed. The results show that the occupants seemed to be more favourable towards the indoor conditions in the intelligent building; however, the differences in comparison to the traditional buildings were not considerable. Similarly, self-reported productivity proved to be higher in the intelligent building, while the optimal range of air temperature, which ensured highest productivity, was 22–25 °C. Moreover, a strong correlation between the occupants’ overall comfort and their perception of the air quality has been found.

1. Introduction

Nowadays, people spend more and more time within buildings—mostly in homes, work places, or educational facilities. According to [1,2], adults can spend up to ca. 90% of their time indoors. Consequently, it is crucial to provide the building occupants with high-quality indoor environment in order to create healthy conditions and ensure their satisfaction, high productivity, and learning performance. However, creating such favourable conditions (of optimal air temperature and relative humidity, low carbon dioxide concentration, etc.) would typically involve increased energy costs for building operation—mainly related to the energy consumption by heating, ventilation, and air conditioning systems. Thus, scientific effort is currently applied to find the optimal solution between proper indoor environmental quality and energy consumption.
A general term used to describe conditions inside buildings is the ‘indoor environmental quality’, which encompasses temperature, sound, and lighting conditions, together with indoor air quality [3]. A subjective assessment of the indoor environmental quality experienced by each person is typically studied using questionnaires. According to Sekellaris et al. [4] the relationships between self-perceived indoor environmental conditions and room users’ comfort are dependent on the socio-cultural background, together with personal and building features. The workers proved to be generally satisfied with their overall comfort. On the other hand, Geng et al. [5] conducted tests in the 35 m2 office room at Tsinghua University in Beijing (China) on the controlled indoor atmosphere, in which 21 participants took part. It was reported that the largest overall dissatisfaction occurred for the air temperature of 16.2 °C (ca. 70% of the respondents were dissatisfied), while the air temperature of 24 °C proved to be most favourable, with nobody being dissatisfied and over half of the people feeling satisfied and very satisfied. Kim et al. [6] conducted field tests in the educational building of the United Arab Emirates University campus. About 60% of the participants felt uncomfortable regarding the overall indoor environmental quality, while the remaining 40% felt neutral. Such unfavourable results were caused by many factors (indicated by the respondents in the questionnaires), which included cold and stuffy air, as well as draught in the air. Despite much research in this area—as indicated by Altomonte et al. [7]—there are still many questions to be dealt with on how to properly design well-being in the indoor environment, but the key physical factors can be given as lighting conditions, temperature, sound, and air quality. However, overall comfort does not depend only on the indoor air parameters, but also on other factors. Göçer et al. [8] found out that noise coming from indoors and outdoors (including ventilation and air conditioning systems) limited access to daylight, as well as the view to the outside; building and work aesthetics, as well as personal control over building systems, can influence occupants’ satisfaction.
Indoor air quality is a crucial part of indoor environmental quality, and its physical measure is usually associated with the carbon dioxide concentration. Building standards and guidelines throughout the world set certain CO2 limits; for example, according to the European standard [9], the limiting value is 800 ppm beyond the background level for a building of category II (such as the public utility educational buildings investigated in the present study). On the other hand, Borowski et al. [10] proposed an air quality scale based on the large literature data and stated that, for a CO2 level below 1000 ppm, the air quality is “good” or “very good”, while the range 1000–1400 ppm indicated “moderate” air quality, and the level 1400–2000 ppm was still acceptable. Higher values should be avoided. Vilcekova et al. [11] carried out testing of the indoor air quality within five classrooms located in a traditional building in the Slovak Republic. The tested group consisted of 34 students of up to 15 years old and 5 teachers. The CO2 levels were relatively high and ranged from 577 to 1787 ppm (despite open windows). The subjective assessment of the air quality revealed that ca. 53% of the students rated it as acceptable and almost 73% rated it as stuffy. Additionally, they considered poor air quality as the largest problem. Aguilar et al. [12] performed tests in a naturally ventilated Spanish polytechnic building. The CO2 levels ranged from 400 to 1676 ppm, which exceeded the allowable limit of 900 ppm. The experimental study of Kim et al. [6] revealed that, despite a low CO2 concentration (mean value of 465 ppm), the subjective assessment of indoor air quality was low, with 63% of the respondents feeling uncomfortable and the rest (37%) feeling neutral. The respondents complained about poor ventilation performance because of the lack of operable windows. The problem of inadequate ventilation has also been addressed in [13,14]. On the other hand, Aflaki et al. [15] performed tests in a library building in the tropics and found that the average carbon dioxide concentration was ca. 480 ppm (while at some points up to 588 ppm), which was quite low and acceptable. One of a very few studies on indoor air quality in intelligent buildings was presented by Rolando et al. [16], who performed the long-term monitoring of indoor air quality in 305 apartments of the residential intelligent buildings at the KTH University in Sweden. The median monthly CO2 concentration values were between 400 and 600 ppm. However, the authors pointed out that the study contained measurement errors caused by possible malfunctions of the sensors.
Although air quality is typically related to the CO2 concentration, Geng et al. [5] assessed air quality satisfaction as a function of air temperature (in the range from 16.2 °C to 27.7 °C). The authors reported the highest satisfaction for the lowest temperature of 16.2 °C, while the largest dissatisfaction was observed for the air temperature values of 22 °C and 24 °C. The results indicate that the level of CO2 alone ought not to be regarded as the only factor affecting subjective user-reported indoor air quality. This claim is backed by Clements et al. [17], who conducted experiments in a research living lab facility. The authors claimed that the CO2 concentration was maintained at acceptable levels and hardly ever exceeded 800 ppm; however, the study participants reported poor satisfaction with the air quality at certain times. It was stated that this poor perception might have been a result of getting rid of the natural light while introducing noise, rather than being a result of air quality degradation. Similarly, in [18], it was reported that people tested at an elevated temperature of 30 °C assessed the air quality as worse in comparison to a thermal environment of 22 °C. Thus, it is important to consider air quality in a broader sense rather than limiting it to the CO2 level. It is especially crucial, because indoor environment quality can influence the overall satisfaction of room residents and their productivity, as reported by Lee et al. [19], who also indicated a difference in the indoor air quality perception between different occupations of the same building. The influence of the indoor air quality on occupants’ productivity was addressed by Lee et al. [20]. The economic loss caused by a reduction in the work performance of the employees caused by high levels of CO2 was also calculated.
As mentioned above, productivity seems to be influenced by indoor environmental quality. Although productivity can be assessed from different points of view, it is usually associated with the ability to perform certain tasks and/or absorb new knowledge. This issue is especially important in office/factory workplaces, as well as in educational buildings. Kaushik et al. [21] analysed an interconnection between the quality of the indoor environment and the productivity of office room users in Qatar. The carbon dioxide concentration proved to have an impact on productivity, with its optimum level of up to 650 ppm, as well as relative humidity (up to 60%) and indoor air temperature (in the optimal range 22–25 °C). Geng et al. [5] studied the indoor air quality perception and productivity in office rooms. A relation was observed between thermal environment and productivity. In [22], the influence of the indoor environmental quality on self-estimated performance in the tropical climate of Cameroon was presented. It was reported that air parameters affected productivity, which increased at the temperature within the range of 17.5 °C–23.4 °C, while the optimal performance could be observed at the neutral level of thermal sensation. On the other hand, total thermal discomfort was observed above 28 °C, which highly reduced the worker’s performance. Lan et al. [18] analysed twelve people performing neuro-behavioural and office tests at the neutral temperature of 22 °C and the elevated temperature of 30 °C. When the subjects felt warm, their task performance decreased. It was suggested that productivity problems can occur independently of discomfort. Similar results, but extended to the lower temperatures, were obtained by Li et al. [23], who analysed students’ performance (in a testing climate chamber). It was concluded that a temperature considered as relatively warm or cold caused a larger time of response, as well as a lower accuracy, thereby leading to decreased performance. Wu et al. [24] presented experiments on 18 subjects. Physiological and psychological test results proved that the performance of the volunteers was more influenced by humidity at high temperatures (4–10% greater than at low temperatures). The authors found no consistent relation between the performance and the inflow of fresh air at temperatures lower than 25 °C. Liu et al. [25] experimentally analysed the impact of air temperature and relative humidity on the performance of 36 students. The learning performance variations proved to be consistent with their environmental comfort; however, relative humidity had a more profound effect than air temperature in such a way that, in low humidity environments, the performance was reduced because of eye dryness and the airway mucosa.
Providing proper indoor conditions for maximal occupants’ performance and productivity might require energy input. Kürker and Eskin [26] reported that a significant productivity increase (of 46%) can be obtained, but this comes at the cost of elevated energy consumption. On the other hand, productivity can also be improved by the use of fans (which reduce the need for expensive air conditioning operation), as was claimed in [27].
Despite the overwhelming evidence of the impact of the indoor environmental quality on productivity, some reports seem to contradict these claims. Porras-Salazar et al. [28] analysed models and literature data on the relation between temperature and work performance. The authors normalised the data reported by others and tried to develop a correlation using various techniques (including regression models, models using the maximal adaptability framework, as well as machine learning). However, they were unable to find any link between air temperature and work performance. Besides, the effects of task complexity, accuracy, or climate were not significant. It proves that the problem of the interaction between productivity and indoor air parameters needs to be studied more thoroughly, which is further confirmed by the review paper about a link between thermal comfort and productivity [29], which covered almost 130 papers. The authors noticed that the vast majority of the papers were based on hypotheses, while studies conducted with the use of an experimental apparatus are quite limited because of involving only a few samples or due to certain environmental factors, as well as insufficient representation by the participants. It was concluded that the relationships between productivity and thermal comfort have not been broadly studied. Consequently, questions to be answered still exist.
Equally important and not fully understood is the impact of indoor light conditions on occupants’ subjective sensations. Moreover, as indicated by Ghita et al. [30], the proper management of the existing lighting systems can lead to a 20% reduction in energy costs if mixed light sources are correctly optimised. Consequently, the methods of building lighting performance improvement have been currently investigated, which integrate building simulation and architectural design tools (e.g., [31]). However, the photometric measurement of illuminance within rooms does not fully capture the subjective personal component of lighting quality. Thus, questionnaire surveys are necessary. In the study [11], over 60% of the students considered classroom lighting to be very good or good, while 30% rated it as acceptable, but the respondents claimed that very strong light from the lamp was the biggest problem. On the other hand, three quarters of teachers considered lighting in the classroom as good and voiced concerns about too much daylight, as well as poor artificial light. It can be seen that the opinions of the pupils and staff were different, which indicates that lighting is highly subjective. Ricciardi and Buratti [32] investigated the lighting conditions in seven Italian classrooms. The mean values of illuminance were quite low and ranged from 74 to 453 lux; however, no data or correlations were presented between the perceived lighting conditions and illuminance. Aguilar et al. [12] performed tests in the Spanish educational building and collected 908 questionnaires. The lighting ranged from 110 to 594 lux, and high numbers of the dissatisfied were observed. The satisfaction level with the lighting conditions of home offices was investigated in [33] as an online survey. The authors observed some differences in the satisfaction level due to participants’ gender, occupation, and geographical location. Moreover, students proved to be less satisfied than professionals with the lighting conditions. A confirmation of the subjective nature of light assessment can be found in [34], where the results of an experimental study on customers in cafes were presented.
Despite the fact that the minimal value of illuminance is set in standards and guidelines (e.g., [35,36]) public utility buildings might not be able to offer proper lighting conditions to their users. Aflaki et al. [15] assessed the indoor environment in a traditional library building and indicated poor lighting conditions—with the light intensity in the reading zone found to be below 300 lux. Idkhan and Baharuddin [37] conducted a study on sixty students in the laboratory of a traditional university building in Indonesia. The average light intensity amounted to 422.14 lux, which was below the national standard requirement. Similar results of poor lighting were recorded in nursing offices in New Zealend [38], where an average value of 254 lux was obtained. This indicates a worldwide problem of lighting conditions indoors. It is especially vital due to the fact that the light intensity can affect the subjective thermal sensations of room users [39], as well as productivity [40].
Despite the relatively numerous studies available in the literature on indoor environmental quality and productivity, very few were conducted in intelligent buildings. This could be related to the fact that such buildings are still not very common. According to a definition of an “intelligent building” given in [41], the fundamental constituents of such a building are mainly the following: building management and automation systems, together with information communication networks. Such buildings—according to [42]—should keep the occupants comfortable, as well as environmentally satisfied. What is more, an intelligent building should maximise their users’ performance and efficiently manage the available resources while—at the same time—maintaining operational costs at minimal levels [43]. As pointed out by Omar [44], there exists no commonly acknowledged definition of an intelligent building; however, the most characteristic features are the following: the presence of building management and automation systems, as well as sensors, the usage of smart materials and intelligent skins (including interactive façades), passive design (considering the window-to-wall-ratio and orientations towards the sun), and the application of renewable resources. Moreover, intelligent buildings should be characterised by environmental friendliness, space utilisation, cost-effectiveness, human comfort, work efficiency, etc. [44]. In practice, buildings are typically considered “intelligent” when they are operated by a BMS (building management system) and all the building services (HVAC systems, lights, fire protection systems, etc.) have been interconnected with one another [45]. Consequently, a building where a study was conducted (bearing the name “Energis”) has been considered as an archetype for “intelligent building”—due to the presence of the BMS and the automatic control of the systems/services installed there (including renewable energy systems).
It needs to be noted that comparative analyses of indoor environmental quality have been carried out in green buildings vs. conventional buildings, with the majority of studies being in favour of the green buildings (e.g., ref. [46]), though some indicating mixed results (e.g., ref. [47]). However, green buildings are not the same as intelligent/smart buildings. According to [48], a green building is about life cycle effects, the efficient use of the resources, as well as the performance of the buildings, while the core of smart buildings is the integration of building technology systems—they are about the efficiency of construction and augmented management tools, as well as occupant functions.
It might be anticipated that human sensations will be different in intelligent buildings in comparison to the traditional ones for two reasons. First, the high level of technical sophistication of intelligent buildings, combined with air treatment and its filtration, can have an impact on the indoor air parameters, including the air quality (as well as indirectly affecting thermal sensations, as was pointed out in [49]). However, it can also affect subjective sensations of safety, lighting, as well as outdoor noise reduction (because of closed windows). Secondly, the possibility of the occupants to be able to adjust the indoor environmental parameters in order to suit individual needs, the feeling of “being more in control” of the indoor conditions, can indirectly affect the subjective sensations of people.
Subjective human sensations seem to be different in various locations around the world depending on the climate, cultural factors, the accommodation potential of people, habitual actions, etc., and comparative studies on indoor environment presented in the literature are mostly performed in buildings located outside Eastern Europe, probably due to there still being a marginal number of intelligent/sustainable buildings in this region. Thus, no study has been found in the literature that thoroughly addresses the issue of the differences between occupants’ perceptions of the indoor environment and productivity in traditional and intelligent buildings based on a large database collected throughout all four seasons in Eastern Europe. Moreover, the literature (e.g., [28,29]) suggests that the interaction between productivity and the indoor air parameters needs to be studied more thoroughly. Experimental reports might even contradict one another and/or have been conducted on a small number of participants. The present study aims to clarify the discrepancies found in the literature regarding the impact of indoor environmental quality on productivity. Consequently, the paper aims to bridge these two research gaps.
In addition, the indoor environment control strategies in modern high-tech buildings can utilise artificial intelligence tools. As indicated in the review paper by Halhoul-Merabet et al. [50], the performance of AI-based control systems for shaping the proper indoor environment is not yet fully satisfactory—mainly because of the fact that these algorithms need large amounts of real-world data—which, according to the authors, is currently lacking. Thus, the comparative analysis presented in the paper regarding traditional and intelligent buildings can provide valuable new data that can also be used in AI control algorithms’ development.

2. Materials and Methods

In order to conduct a study in the same climatic and cultural conditions, five educational buildings located in the same city (Kielce, Poland) were selected for the investigation. Among them, the newest one (completed in 2012) is the “Energis” building. It has been considered “intelligent” according to the definition [41] and due to the fact that it is equipped with a BMS system that controls the operation of all building services (heating, ventilation, air conditioning, lighting, etc.). The traditional buildings originate from the 1970s. They have recently undergone renovation, which improved the thermal performance of the buildings (with improved thermal insulation and new heating systems) but have not changed the operation of the buildings. The largest difference between the intelligent and traditional buildings lies in the ventilation system operation: in the “Energis” mechanical ventilation, heat recovery is used, as well as air conditioning (provided with cassette indoor units connected to rooftop chillers), which is turned on/off using control panels in each room, while in the traditional buildings utilising natural ventilation are mostly used with no air conditioning systems installed. Thus, opening windows occurs frequently during warm and hot days. Moreover, the additional difference is the sensation of larger level of control over the indoor air parameters in the intelligent building (both during the summer and winter time), as opposed to the conditions in the traditional buildings, where the influence of the outside air conditions is more pronounced. Figure 1 and Figure 2 present “Energis” and one of the traditional buildings (called “A”), respectively. Table S1 of the Supplementary Material presents the main technical data of the analysed buildings.
The experimental procedure consisted of performing measurements of the physical parameters within each room (air, globe temperature, air flow velocity, relative humidity, carbon dioxide concentration, and illumination) with a micro-climate meter as well, as using the anonymous questionnaires filled out by the room occupants. Table 1 presents the technical data of the testing system used.
The measuring unit was situated where the respondents were seated in order to ensure that the most accurate indoor parameters were collected. In most cases, that was the very centre of the room, though it could have been different when tests took place in large lecture rooms if attendance during the classes was relatively low. Figure 3 shows the micro-climate meter located in a lecture room of the intelligent building (left-hand side) and in a classroom of the traditional building (right-hand side).
Obviously, values of the physical parameters registered in the rooms showed variations throughout the experimental sessions. Figure 4a,b present example variations in air temperature, relative humidity, and CO2 concentration in rooms of the traditional building (a) and intelligent building (b) (data recorded for the winter conditions). As can be seen, changes of the indoor parameters due to the presence of people were more pronounced for the traditional building, while in the case of the intelligent building, they seem to be more stable (probably due to the operation of mechanical ventilation and more intense air exchange).
Experimental procedure involved simultaneous measurements of the values of physical indoor parameters and the anonymous questionnaire surveys conducted in every room. In total, 890 questionnaire forms were collected in the intelligent building “Energis” and 412 were collected in the traditional buildings. The number of datasets (where a set is related to data collected in one room covering environmental parameters, as well as questionnaire answers) amounted to 67 in “Energis” and 25 in the traditional buildings, while the number of people in each room (each set) ranged from 10 to 56 (the details of the rooms are presented in the Supplementary Material—Table S2). The discrepancy between the number of participants (and rooms) in the intelligent and traditional buildings results from the fact that access to the intelligent building was easier. Despite this discrepancy, the sample size of the traditional buildings is large enough to draw proper conclusions.
The participants were both full-time and part-time students. Table 2 presents the basic data of the volunteers who took part in the anonymous surveys: parameters included age, height, weight, BMI index, and thermal resistance of their clothes according to the information provided in the questionnaires.
The respondents were asked to give answers regarding subjective sensations regarding air quality, lighting conditions, productivity, and general feelings by marking the appropriate response in the questionnaire. The design of the questionnaire was influenced by the standards [52,53] and journal papers [54,55,56]. Productivity of the respondents was assessed by themselves as a subjective evaluation (as in other studies such as [8,19,21,22,57]). The room users filled the questionnaires ca. 15–20 min after entering the room to allow for the accommodation to the indoor environmental conditions. The measurements took place from March 2021 till June 2022.
Test results provided in the following section will be the basis for discussion regarding the comparison of the subjective sensations experienced in traditional and intelligent educational buildings.

3. Test Results

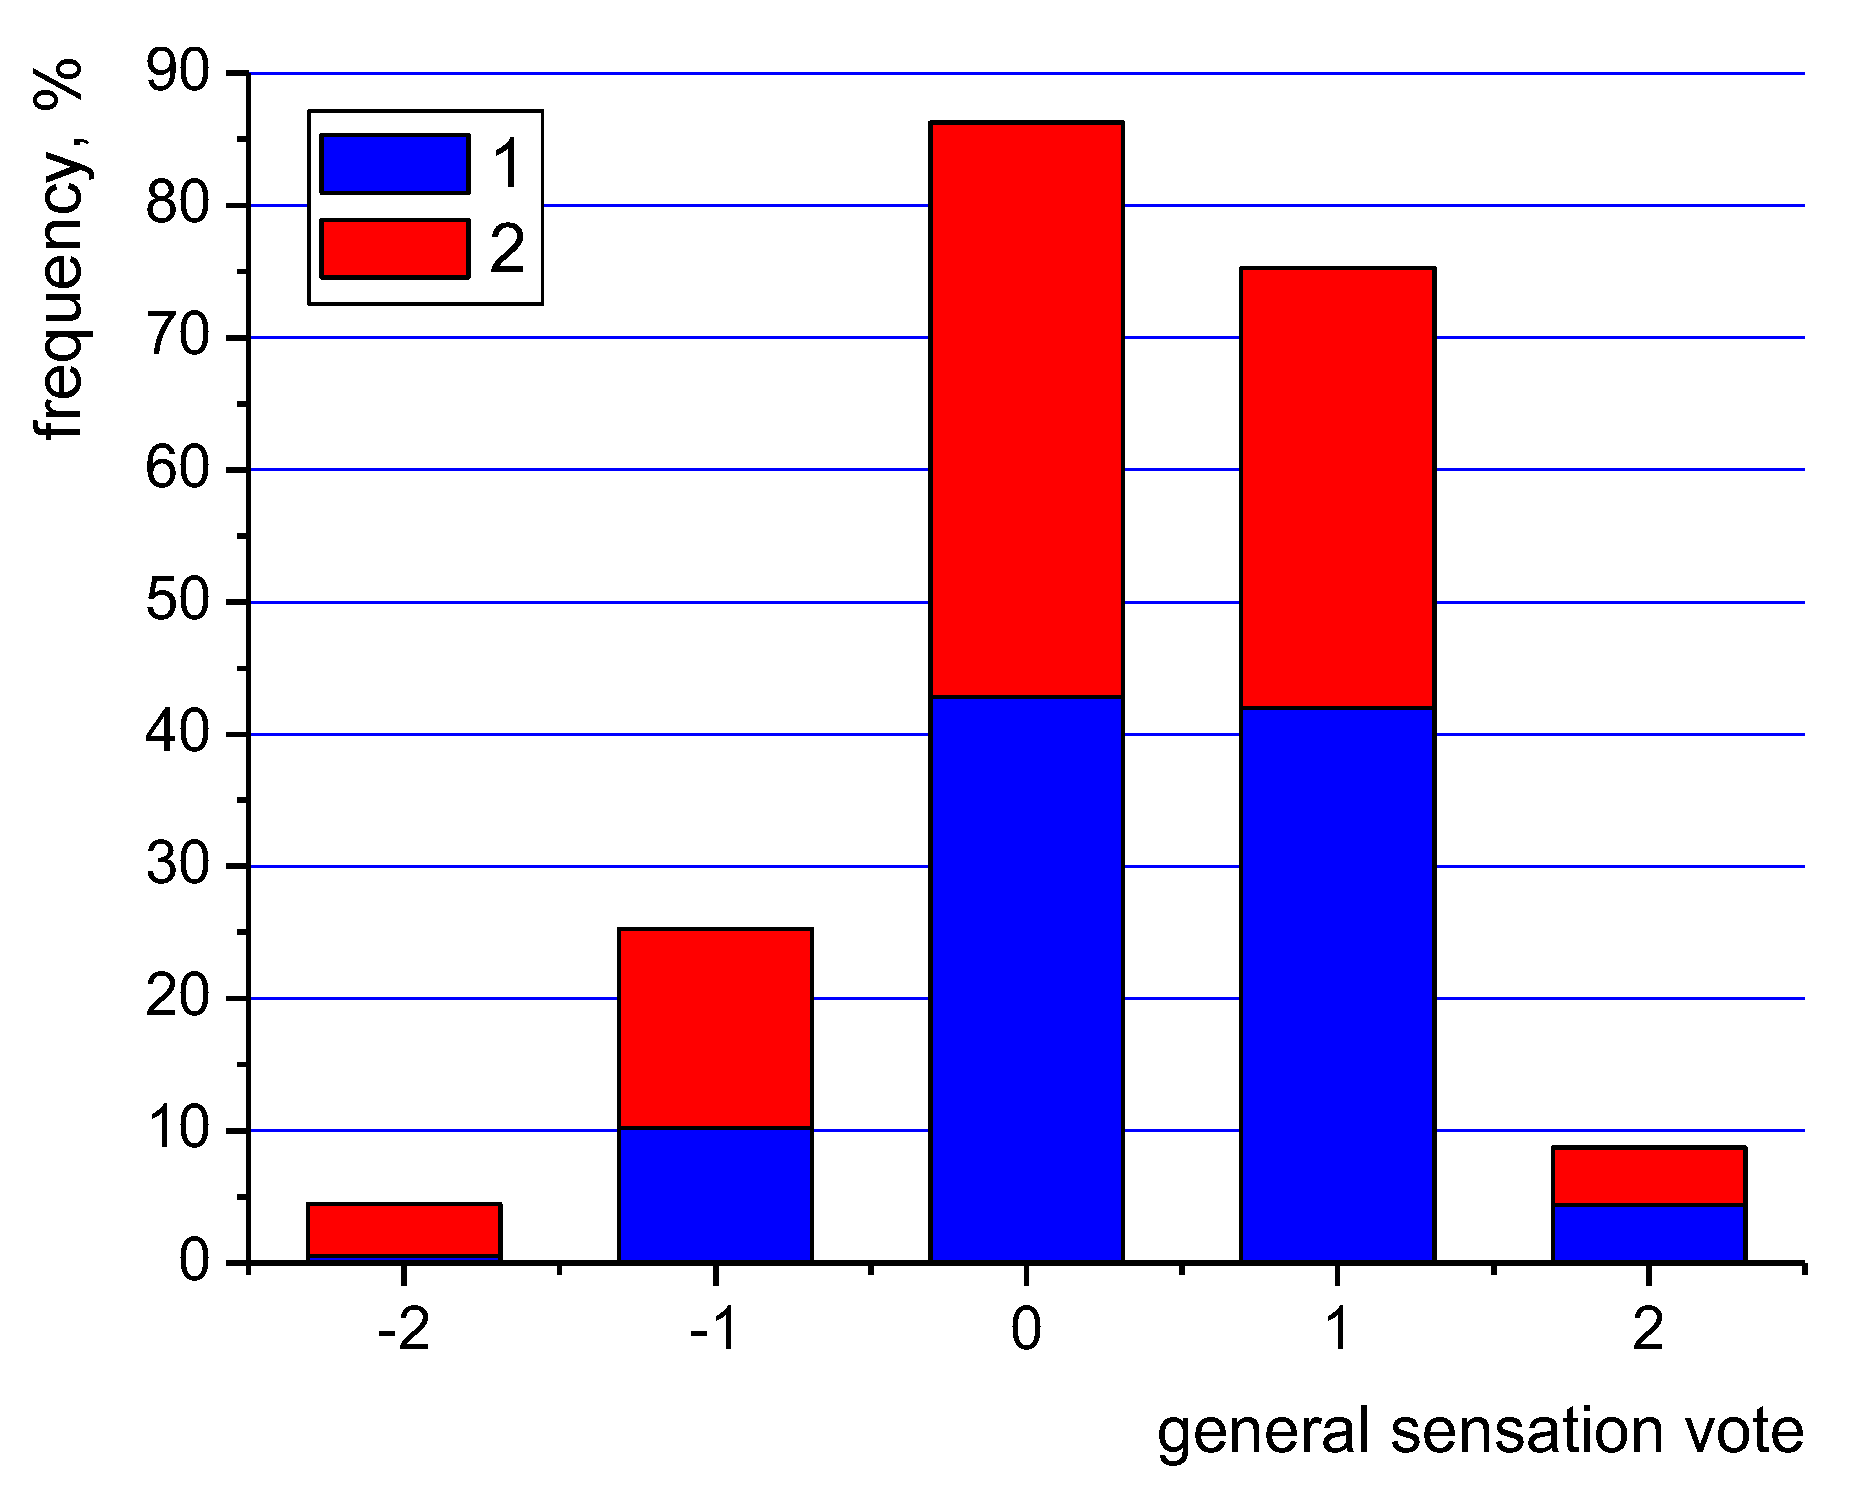
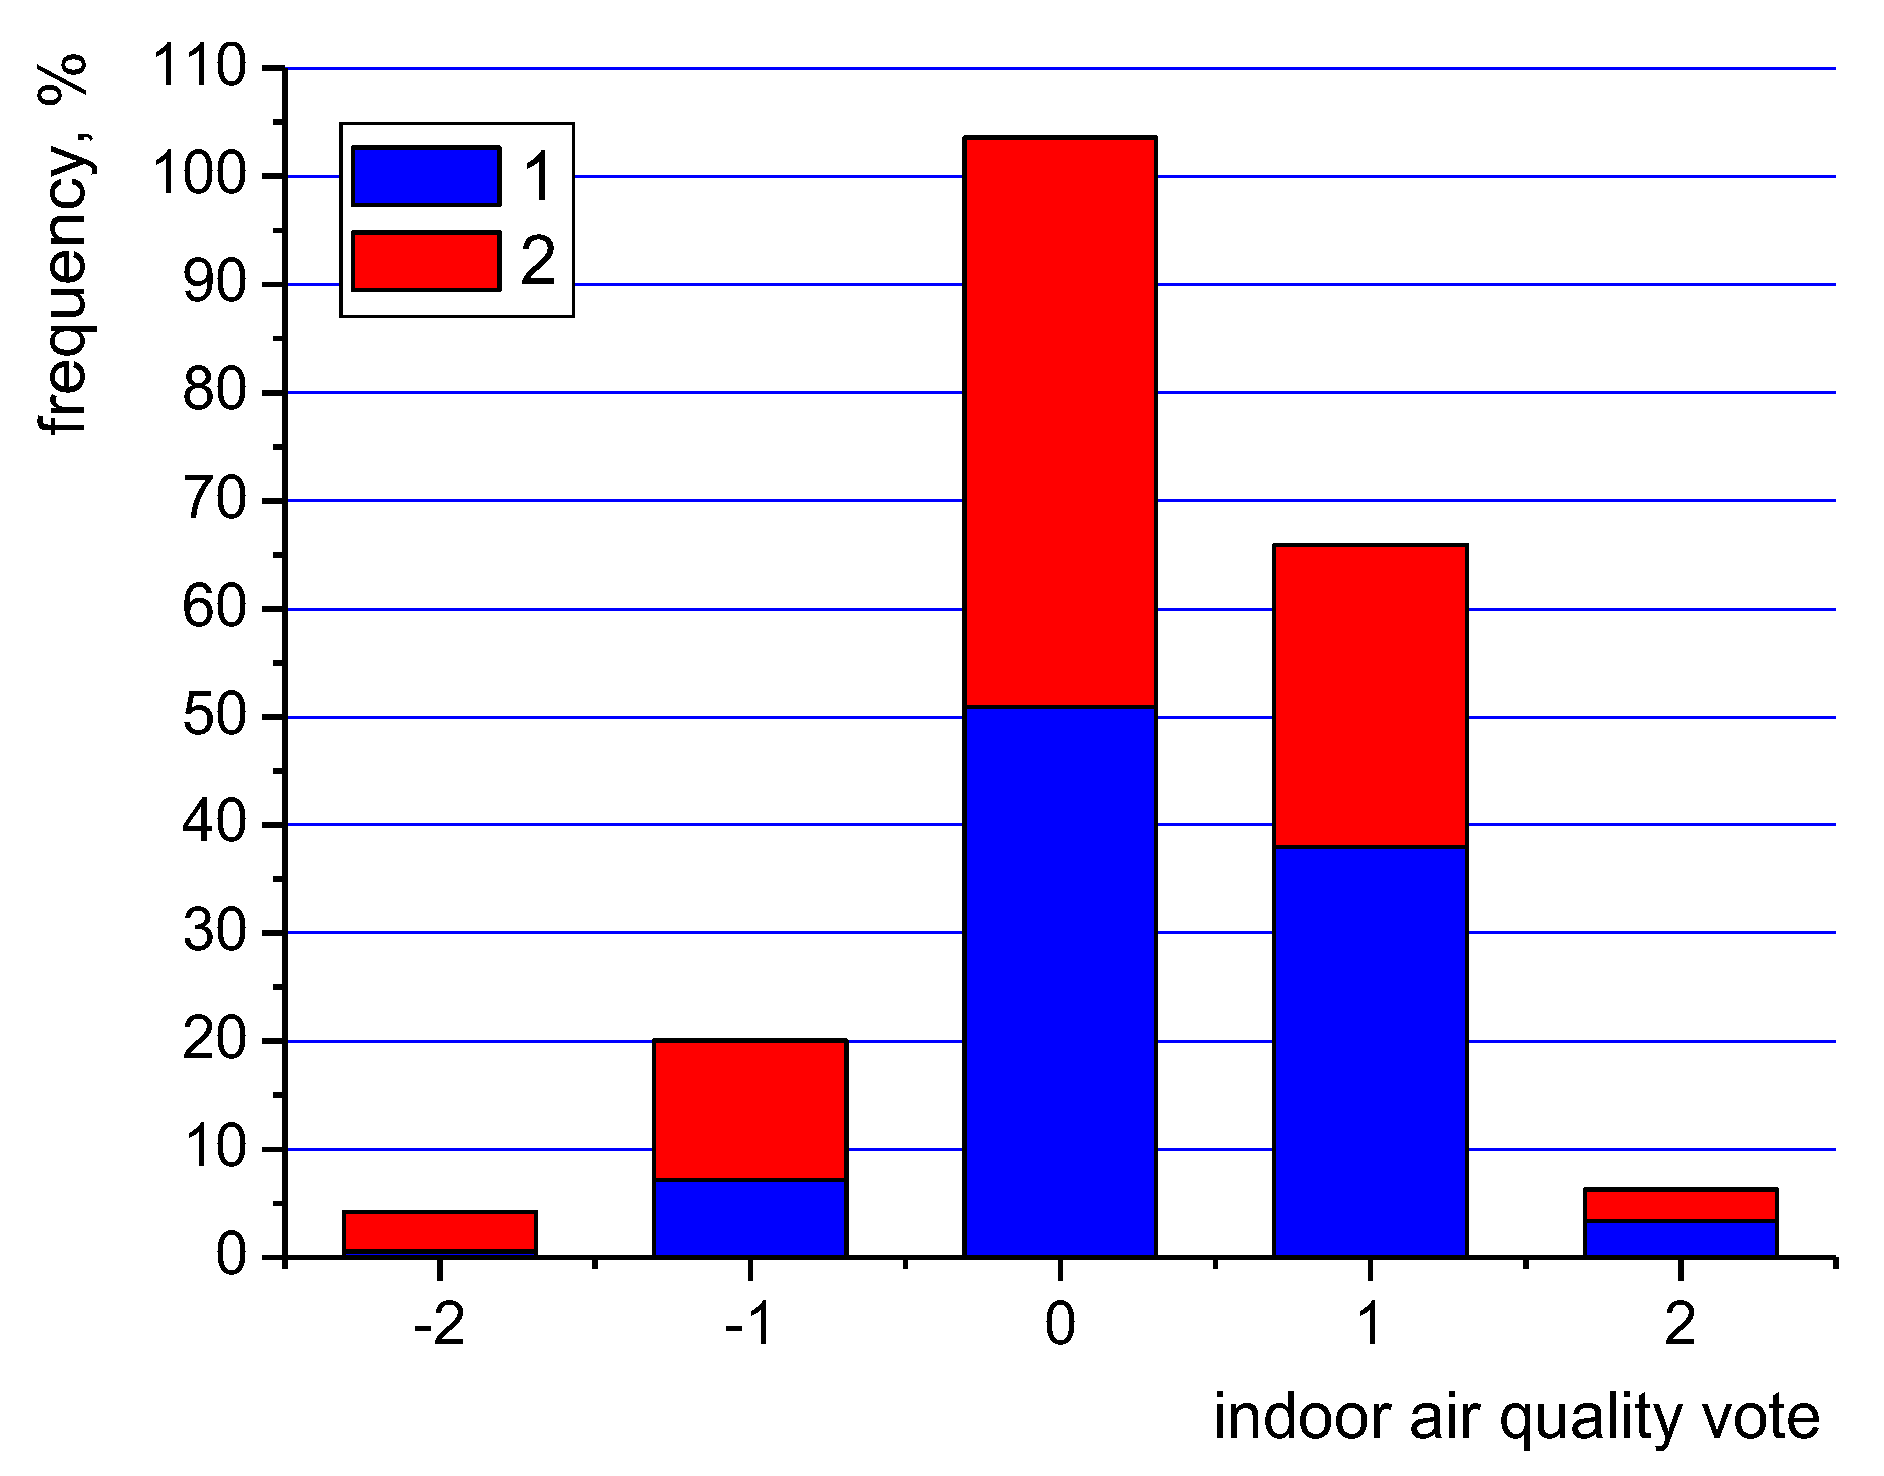
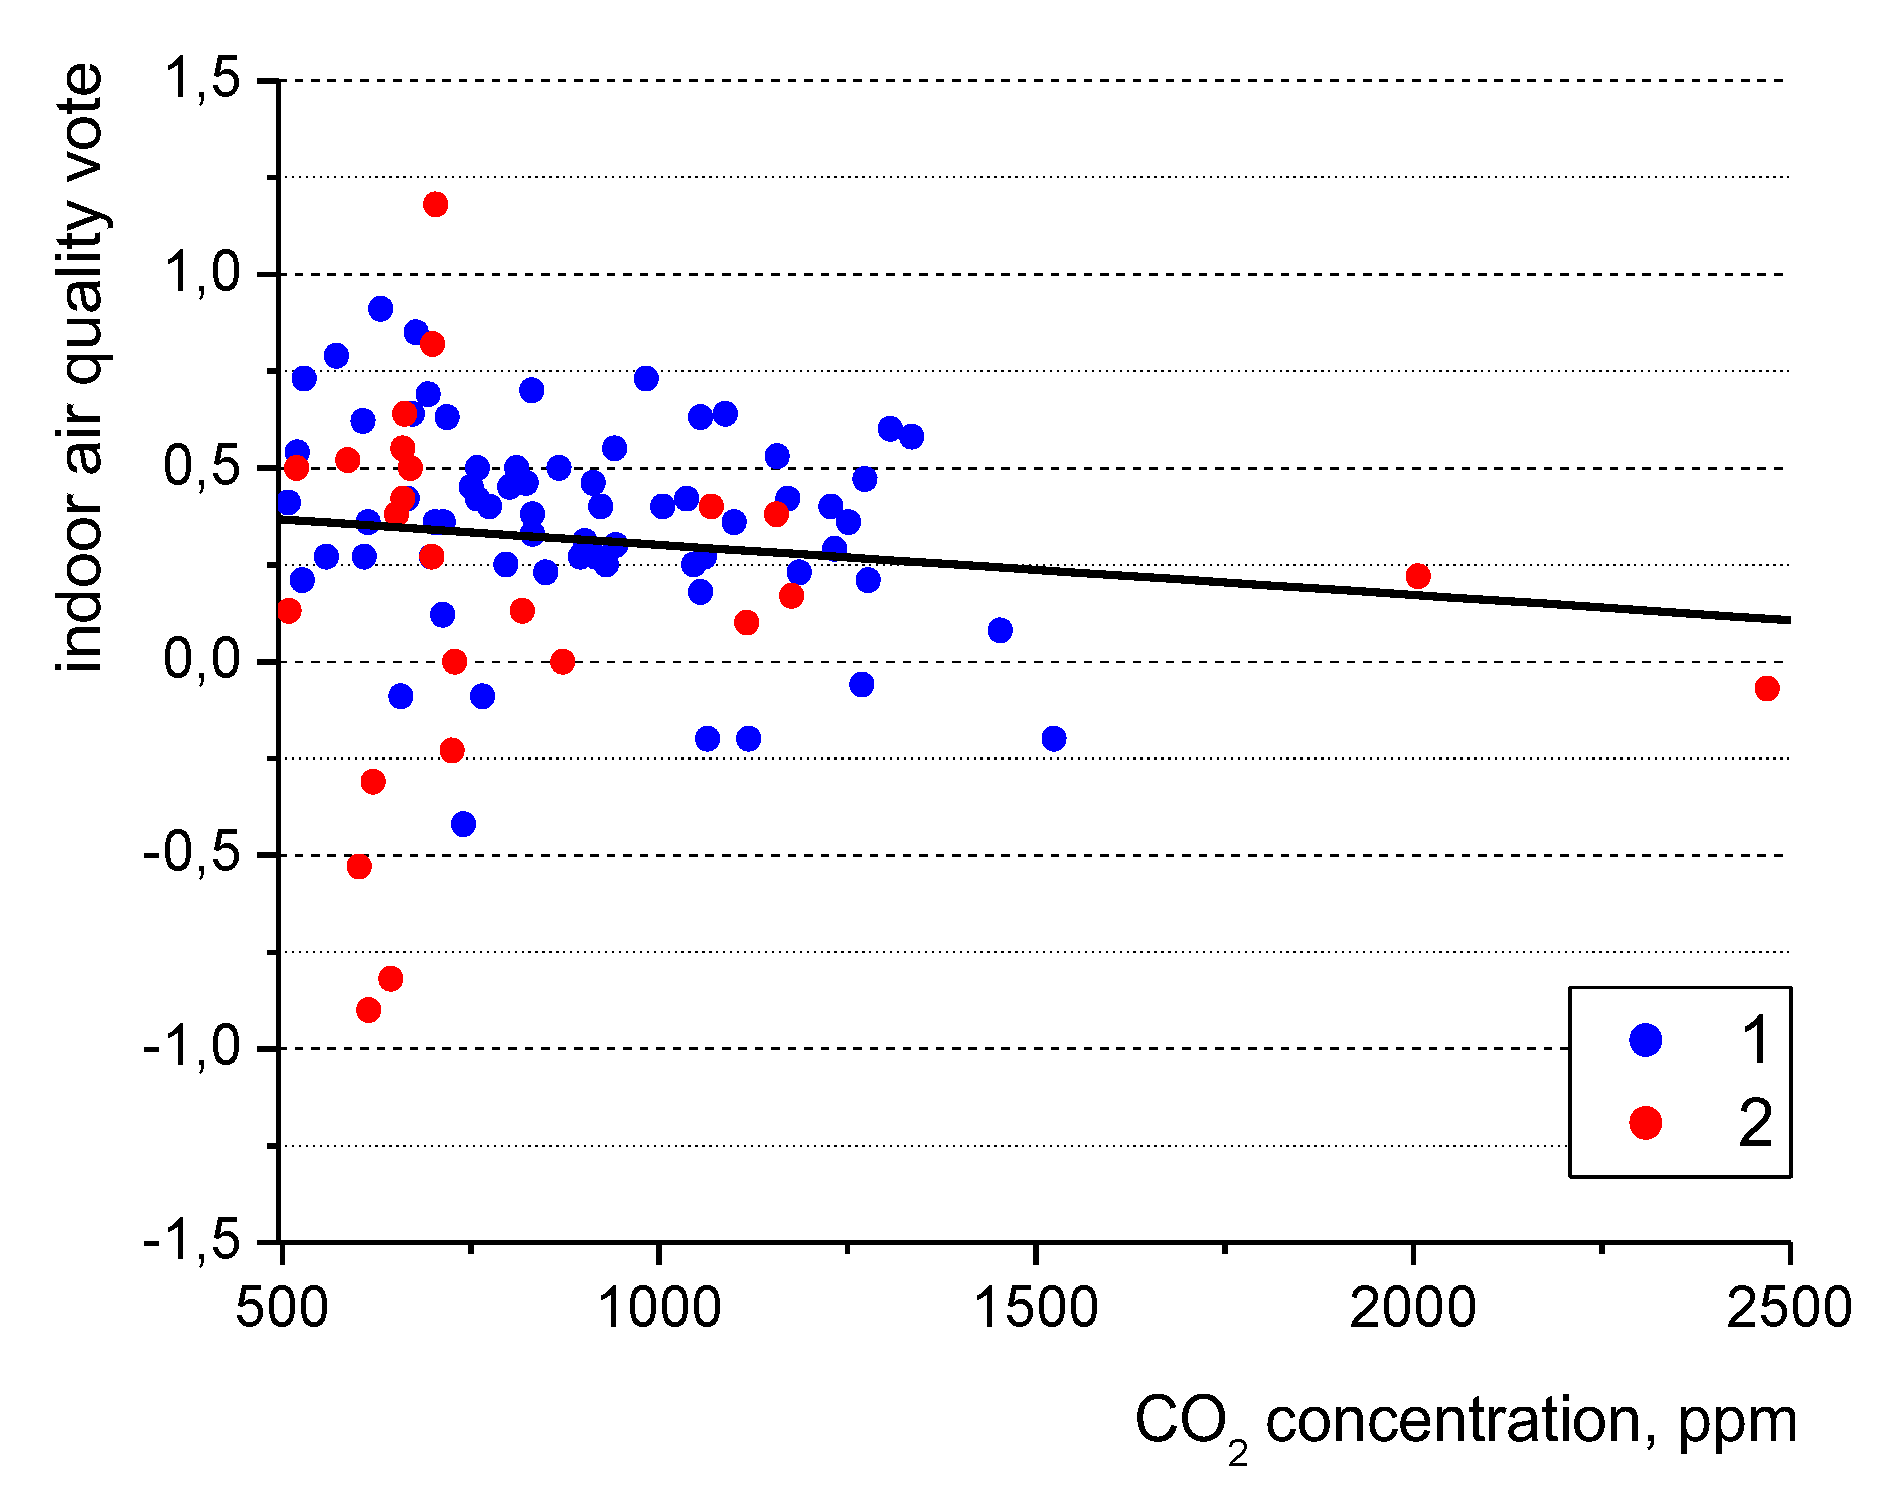
3.1. Overal Comfort and Air Quality

The tests were performed in 92 rooms, where 67 of them were located in the intelligent building “Energis”, while 25 were located in traditional buildings situated on the university campuses (all the buildings were situated within a short distance from each other). During the study of the indoor air temperature in "Energis”, it ranged from 20.4 to 26.8 °C, the relative humidity ranged from 19.7 to 58.9%, and the carbon dioxide level ranged from 508 to 1524 ppm. These same parameters in the traditional buildings were the following: 20.0–29.7 °C, 25.9–65.8%, and 509–2470 ppm, respectively. The data regarding these fundamental indoor air parameters have been shown in Figure 5.
As can be seen, the intelligent building provided more comfortable conditions, as was evidenced by lower maximal temperatures and a much lower carbon dioxide level, which in the traditional buildings reached almost 2500 ppm. Apart from the measured values, it is, however, crucial to verify if the differences in the indoor air parameters influenced the subjective assessment of the human sensations of well-being (overall comfort) in the analysed buildings.
Figure 6 (and Table S3 of the Supplementary Material) presents the results of the questionnaire study for the parameter “General Sensation Vote” (GSV), which describes the occupants’ overall satisfaction/dissatisfaction. The volunteers were asked the question regarding how they generally felt in the room at the moment of competing the questionnaire form. Possible answers to choose from were the following: “very good” (+2), “good” (+1), “neutral” (0), “bad” (−1), or “very bad” (−2).
The largest number of people in all the buildings felt “neutral” (0). However, in the intelligent building, 42% of the participants indicated that they felt “good”—as opposed to 33% in the traditional buildings. The share of the “very good” responses was about 4.4% for all the buildings. The occupants seemed to be more favourable towards the conditions in “Energis”, though the differences in their sensations were not as significant as might have been anticipated based on the indoor air parameters alone. Probably, the students, after months and/or years of studying in the traditional buildings, were accommodated and became accustomed to the general conditions prevailing there. This result does not support the claim by Kaushik et al. [21], who pointed out that maintaining proper values of indoor environmental quality parameters could require larger energy consumption. As can be seen in Figure 6, a comparable level of satisfaction was provided by traditional buildings (equipped only with natural ventilation) in comparison to the intelligent building equipped with HVAC systems.
On the other hand, high levels of carbon dioxide—as observed in Figure 5—might have influenced the perception of the indoor air quality. In the questionnaire, the volunteers assessed the air quality by marking the answers: “very good” (+2), “good” (+1), “neither good nor bad” (0), “bad” (−1), or “very bad” (−2). The results have been shown in Figure 7 (and Table S4 of the Supplementary Material).
The largest number of the respondents (slightly over half) considered the air quality as “neither good nor bad” and ticked “(0)”. However, in the traditional buildings, 16.5% of the students assessed the air quality as “bad” or “very bad”, as opposed to 7.8% in the intelligent building. This confirms the more favourable conditions present in “Energis” and might be related (possibly among other factors) to the lower levels of carbon dioxide there. Figure 8 presents a relation between the mean Indoor Air Quality Vote (IAQV) in each room (calculated as the average value of individual answers to this question collected in one room) and the CO2 concentration in this room, together with the linear fit (black line).
At the highest CO2 levels, the vote was about “neutral”, despite the trend indicating that, as the carbon dioxide concentration increased, the respondents considered the air quality as poorer.
However, the regression coefficient R2 of the trend line was only 0.02. Thus, no major conclusions regarding the impact of carbon dioxide can be drawn. However, it seems that the perception of the respondents might have been shaped by other factors such as the presence of odours in the rooms, as well as the air temperature, as has been indicated in [5].
It seems that the perceived indoor air quality can influence the general well-being of room users. In order to verify this assumption, a graph has been prepared (Figure 9), which relates the General Sensation Vote and Indoor Air Quality Vote for 92 rooms (as mean values of these parameters based on the questionnaire answers for individual rooms).
The analysis of the above figure reveals a strong correlation between the occupants’ well-being (overall comfort) and their perception of the air quality. As the subjective assessment of air quality became more positive, the General Sensation Vote also increased. The coefficient of determination R2 was quite high and equaled 0.69, while the actual equation takes the form of the following:
GSV = 0.9359   IAQ + 0.0709 ,
The data collected in 92 rooms, covering 1302 questionnaire responses, show that the well-being of the room users depends not only on thermal sensations (as commonly considered), but also on the perception of the air quality. Thus, building managers should pay much attention to the problem of proper ventilation and air purity due to its influence on residents’ satisfaction, which might be of significant importance in commercial and educational buildings (leading to consumer satisfaction and students’ learning performance, respectively).

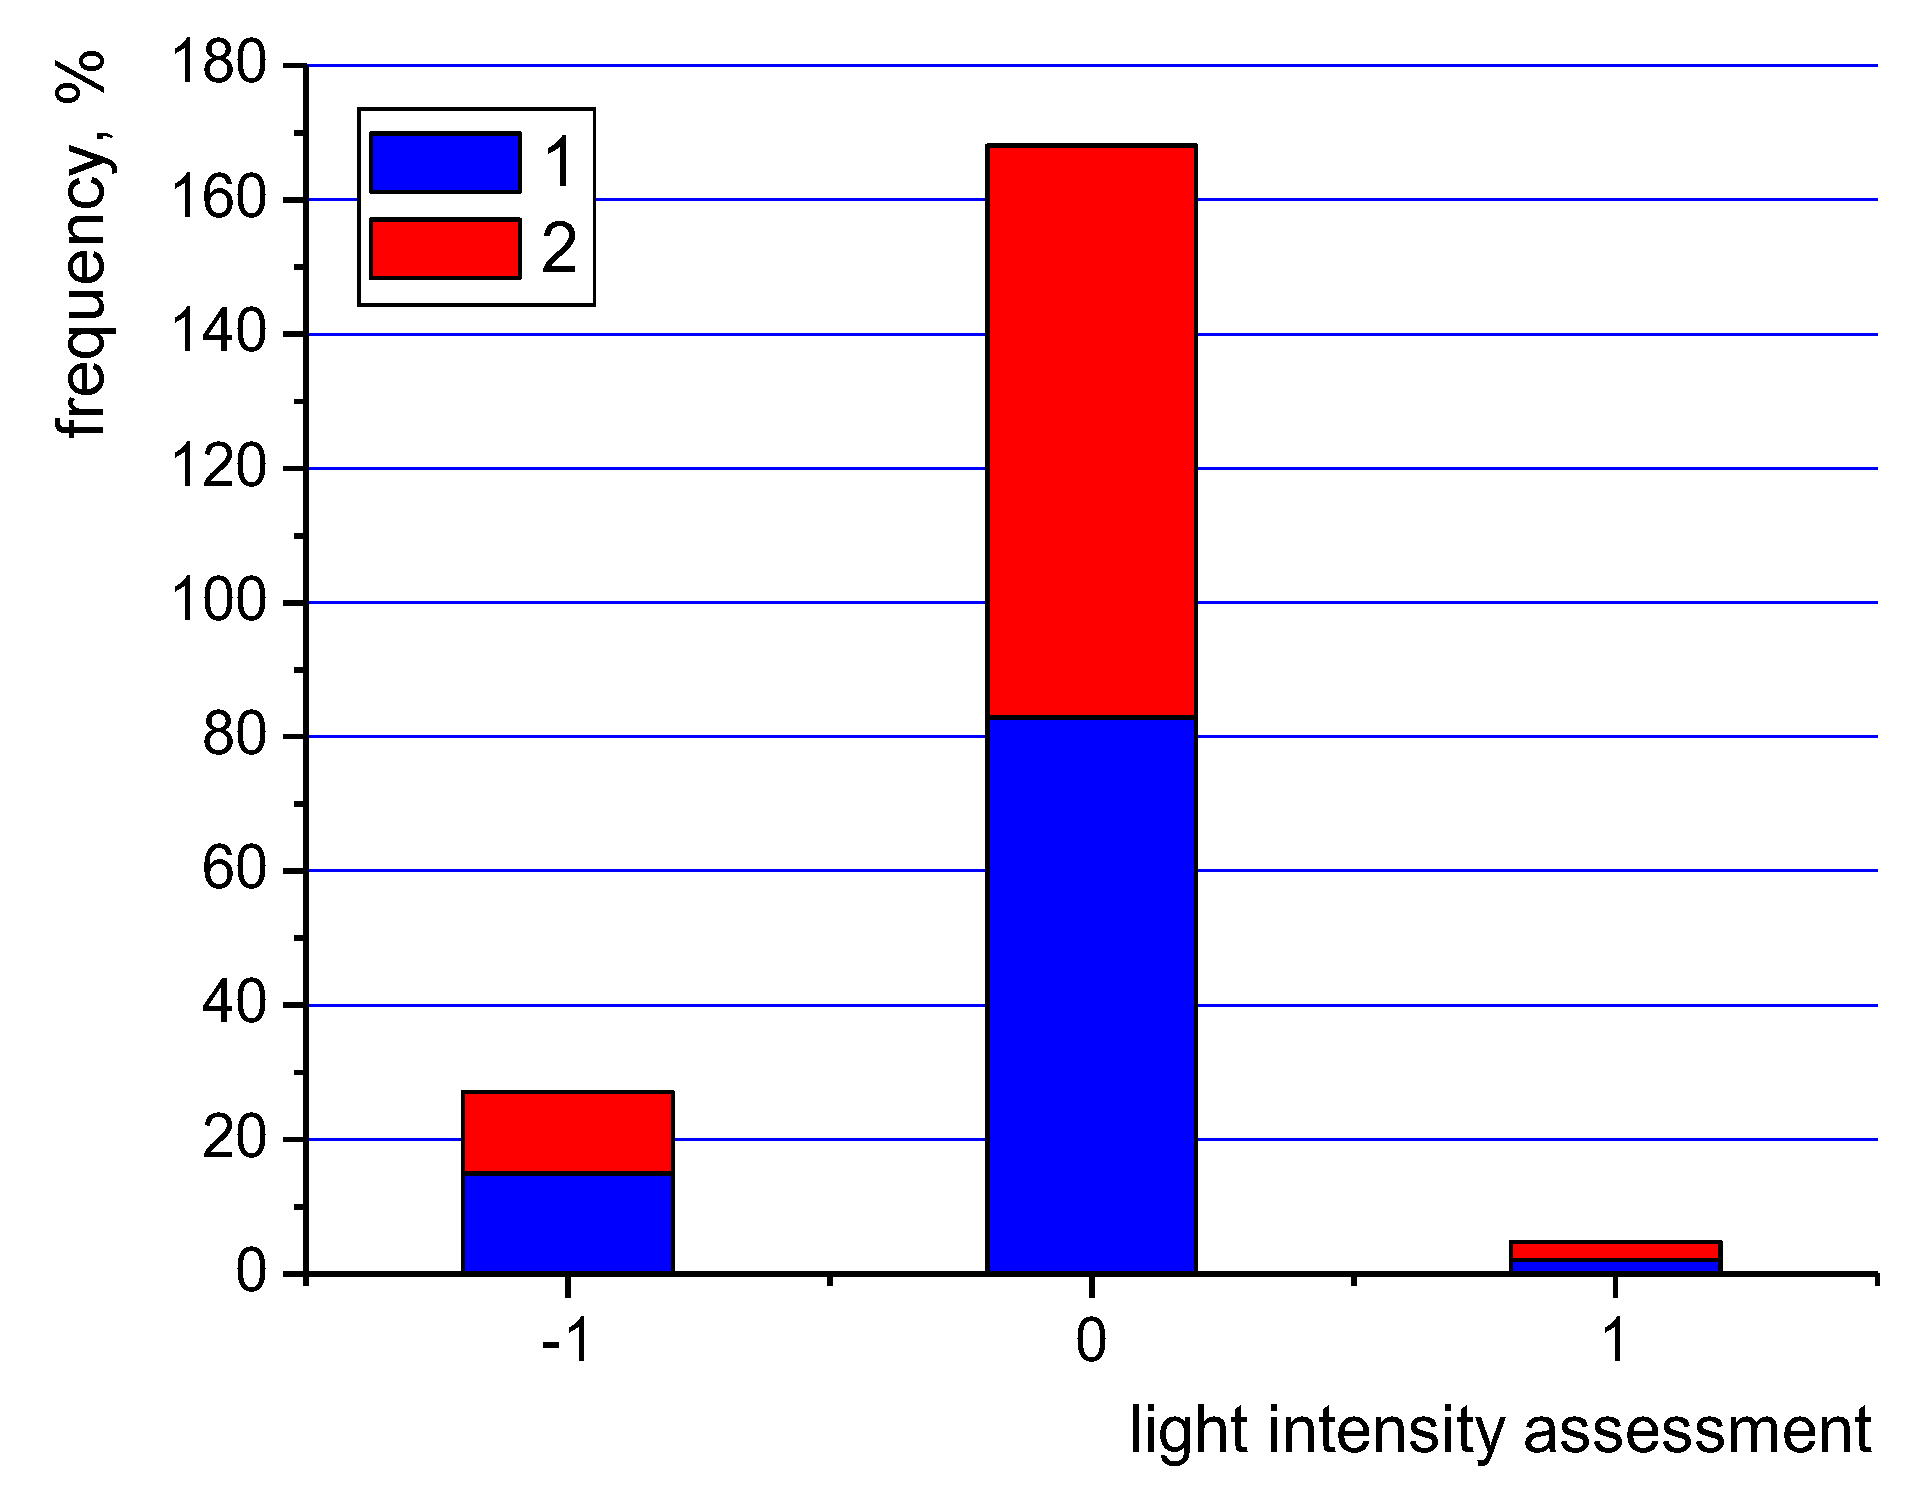
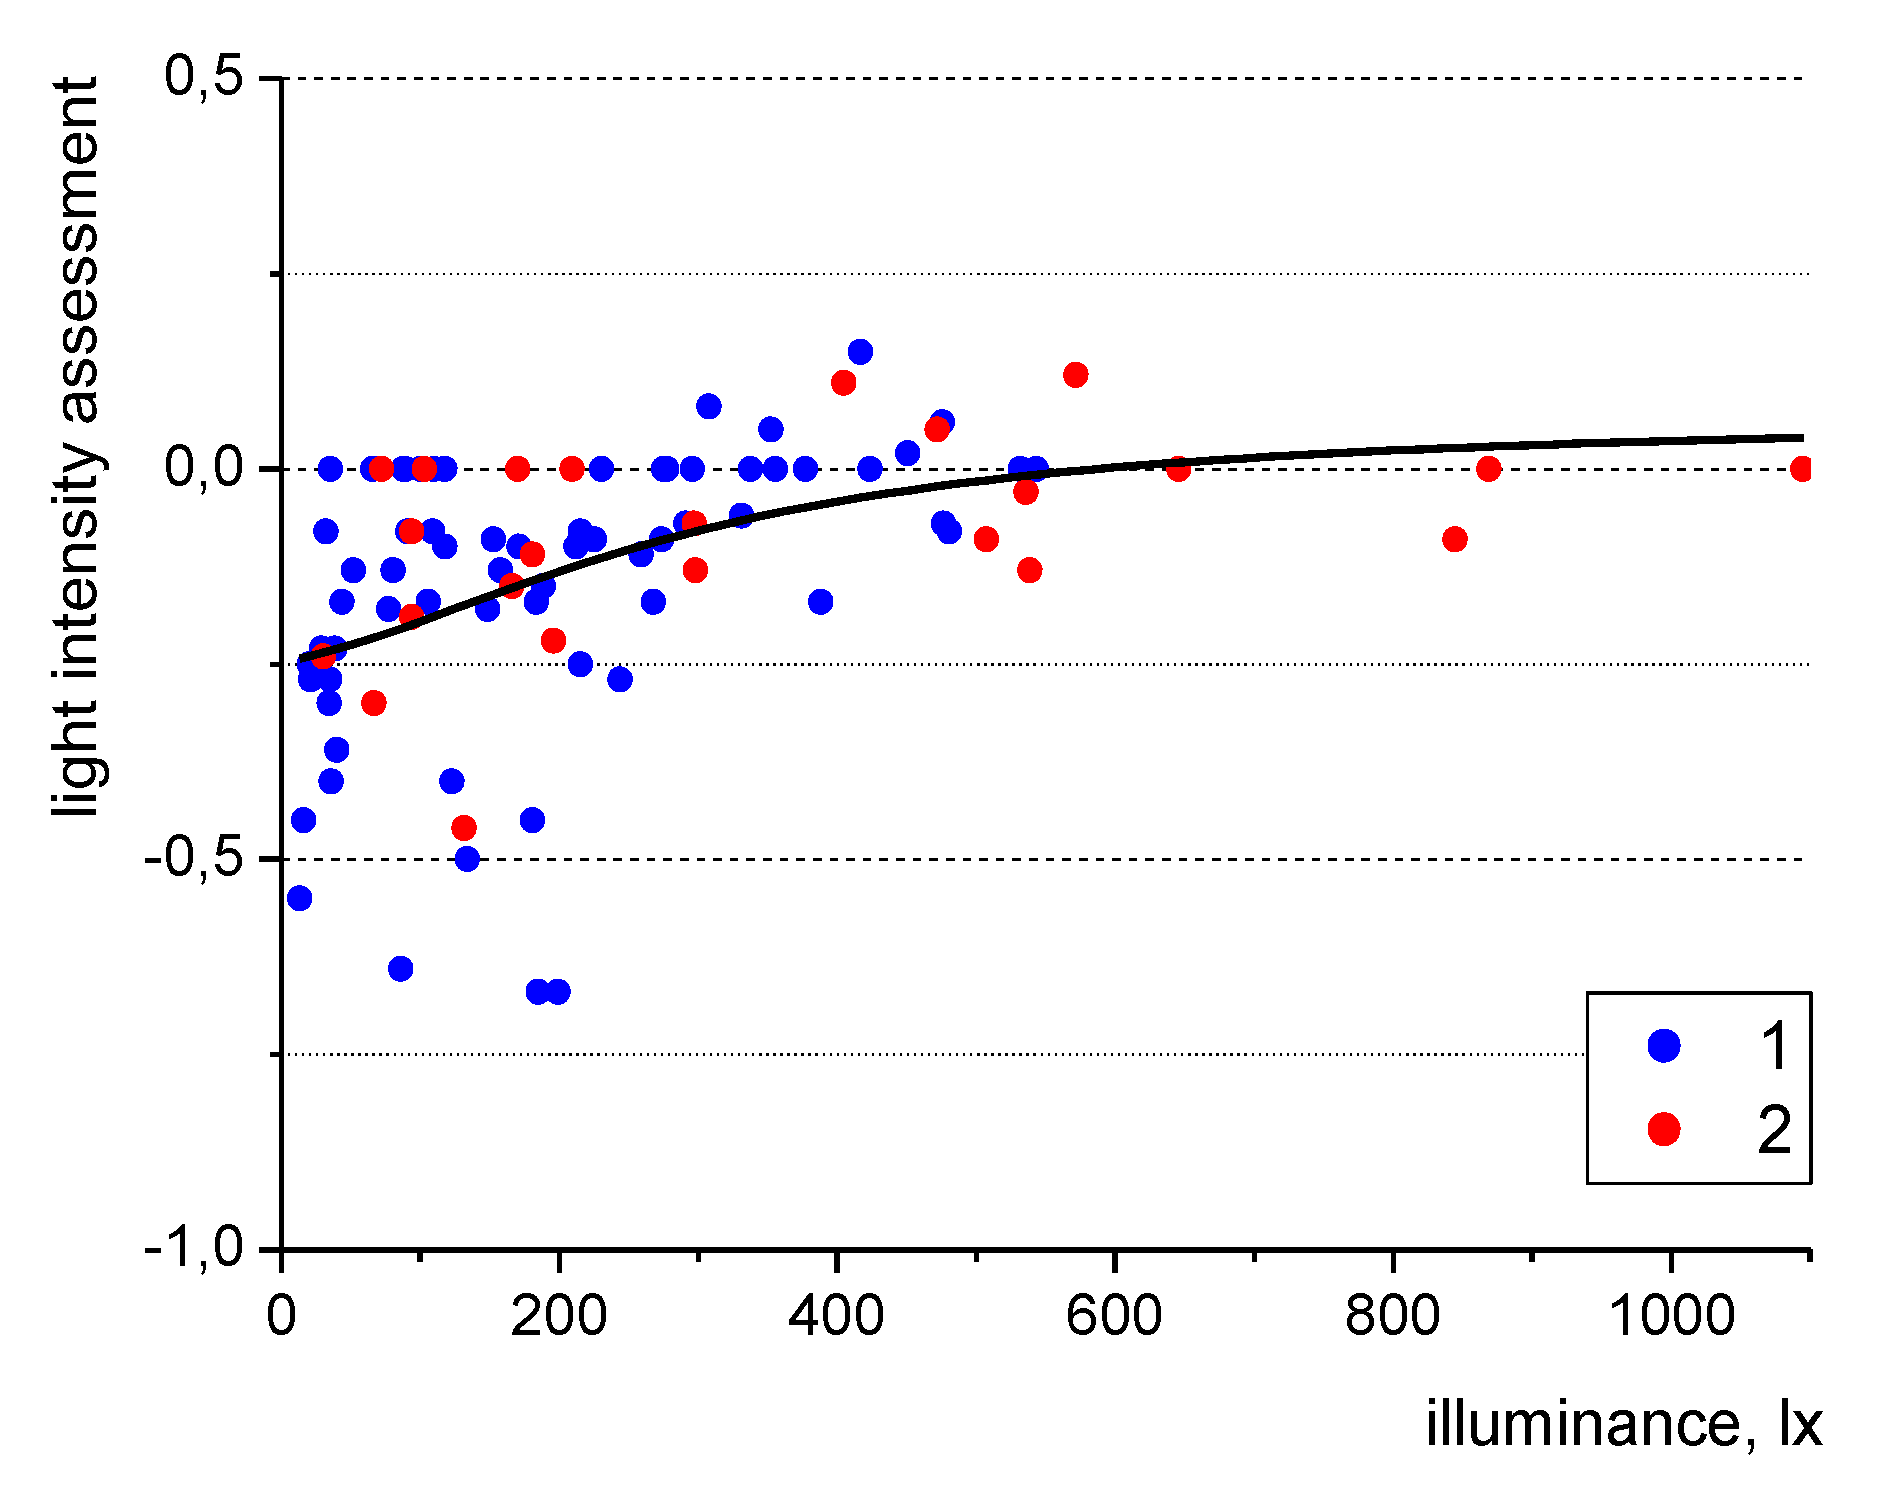
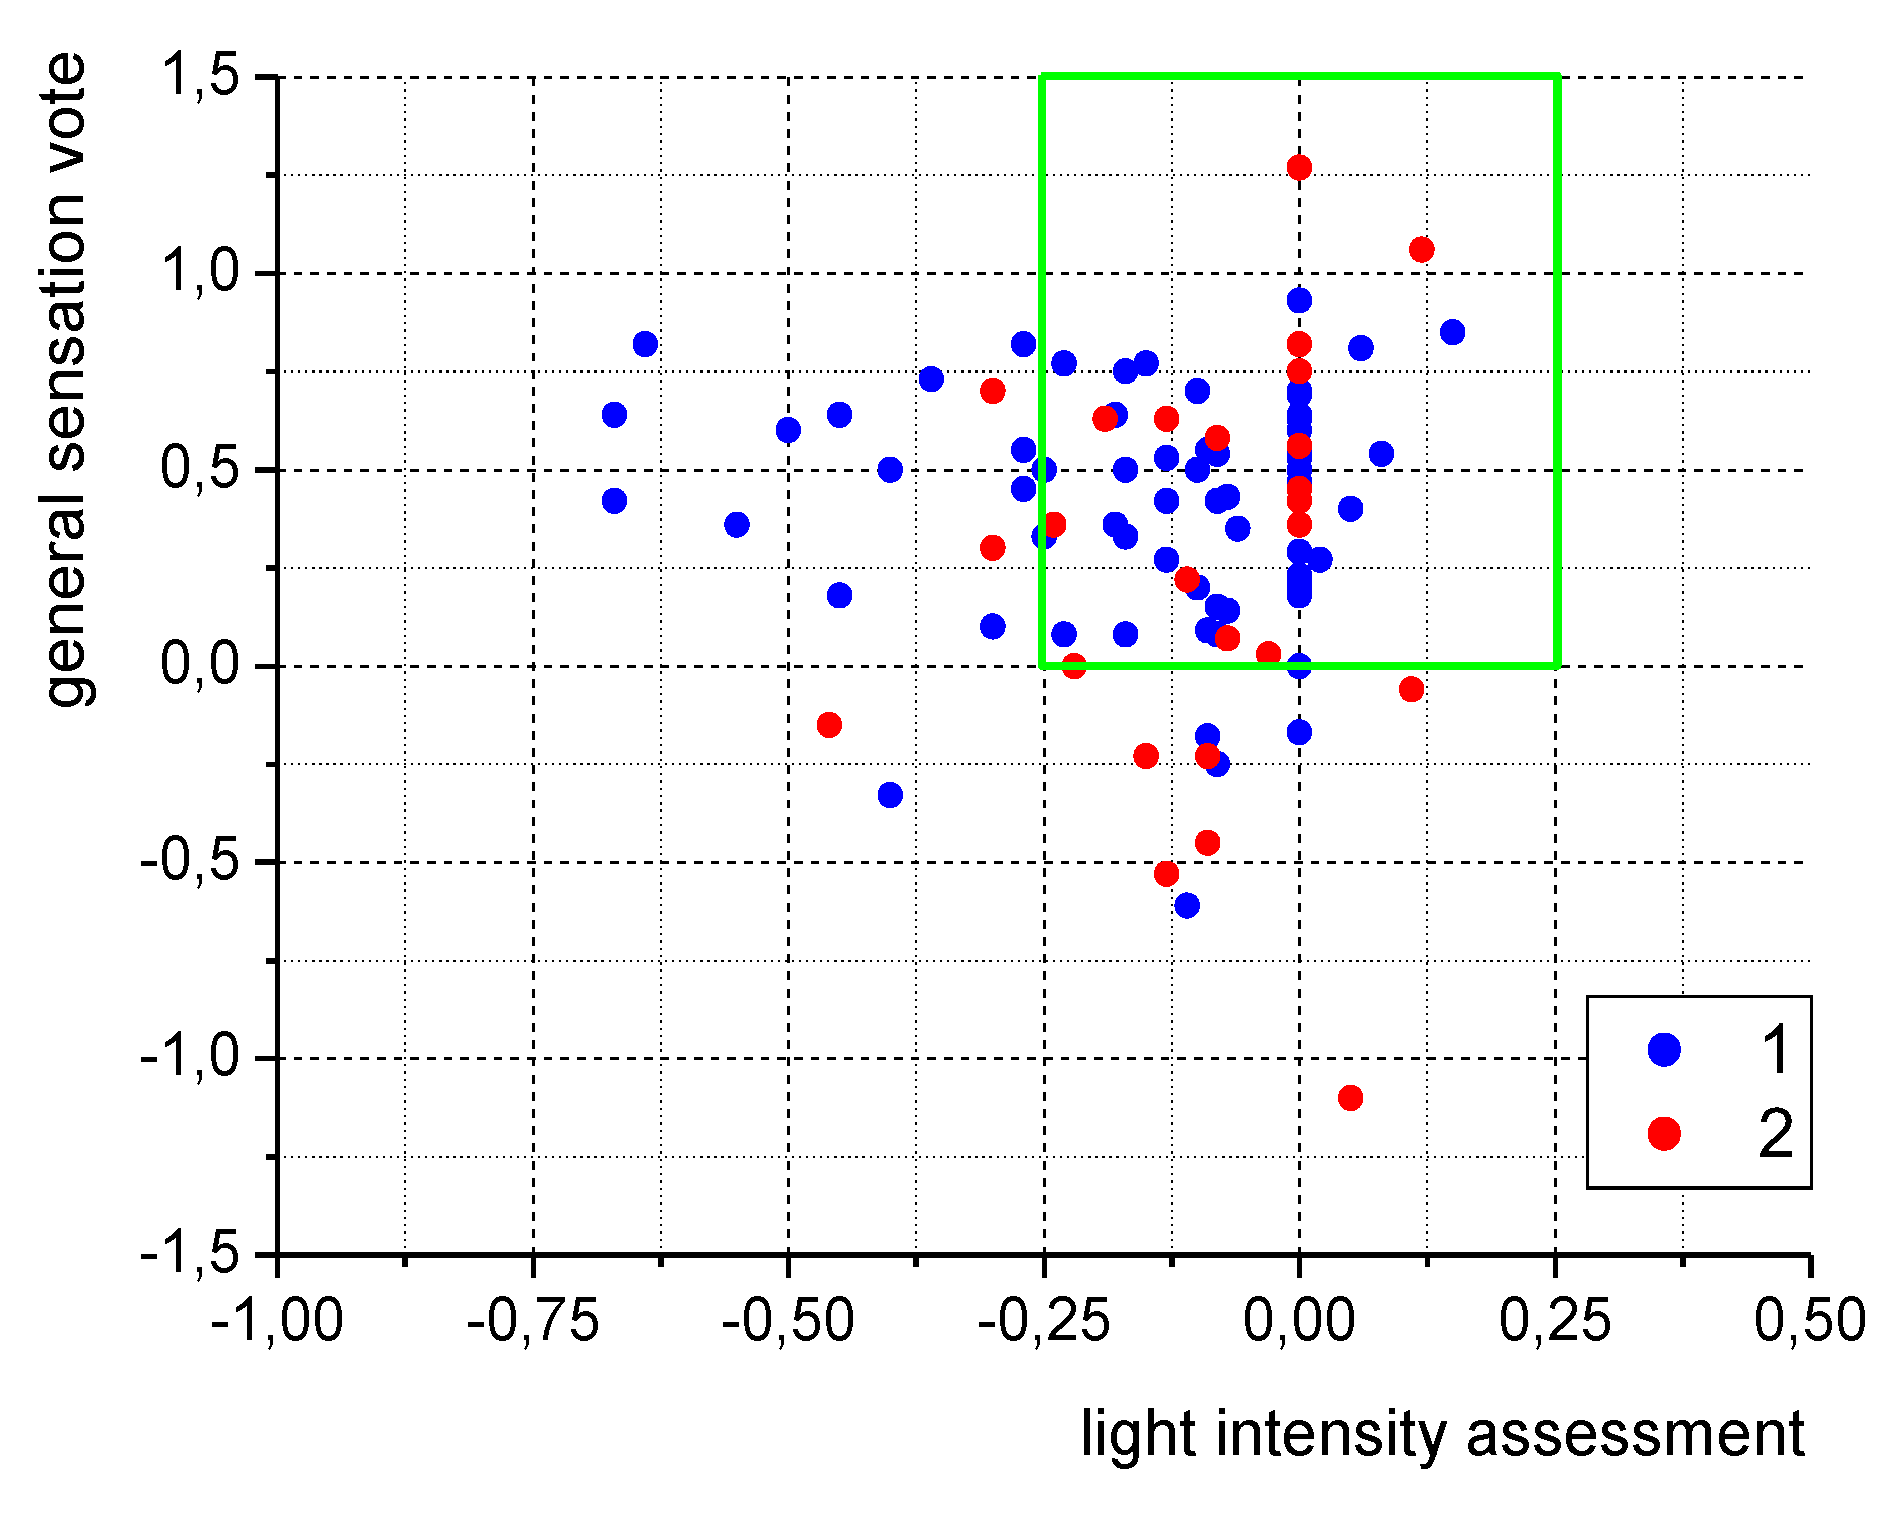
3.2. Lighting Conditions
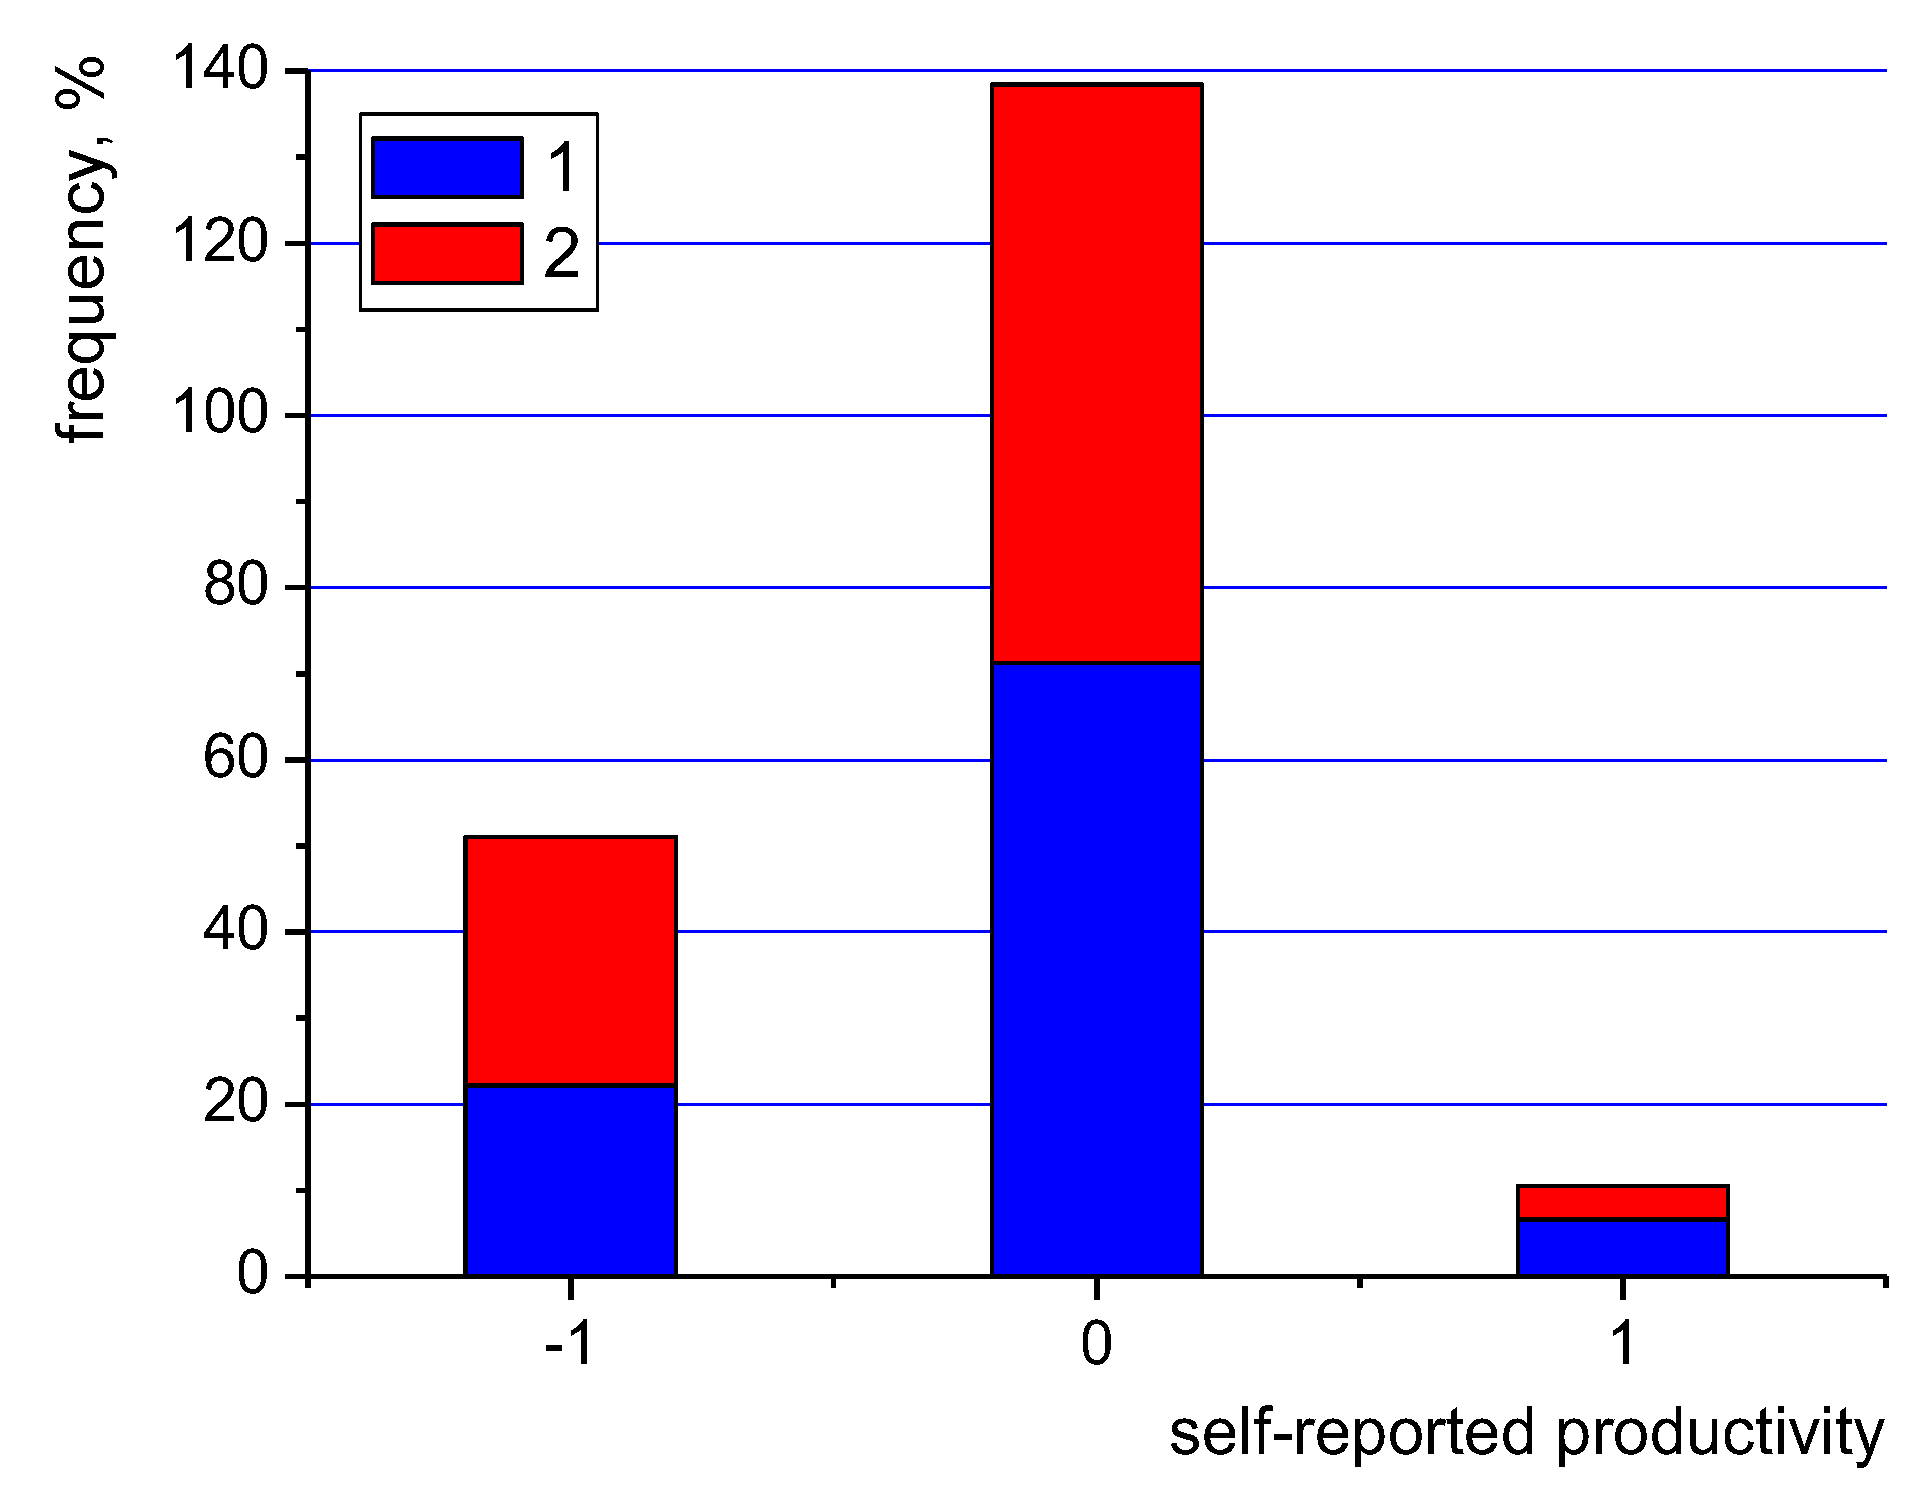
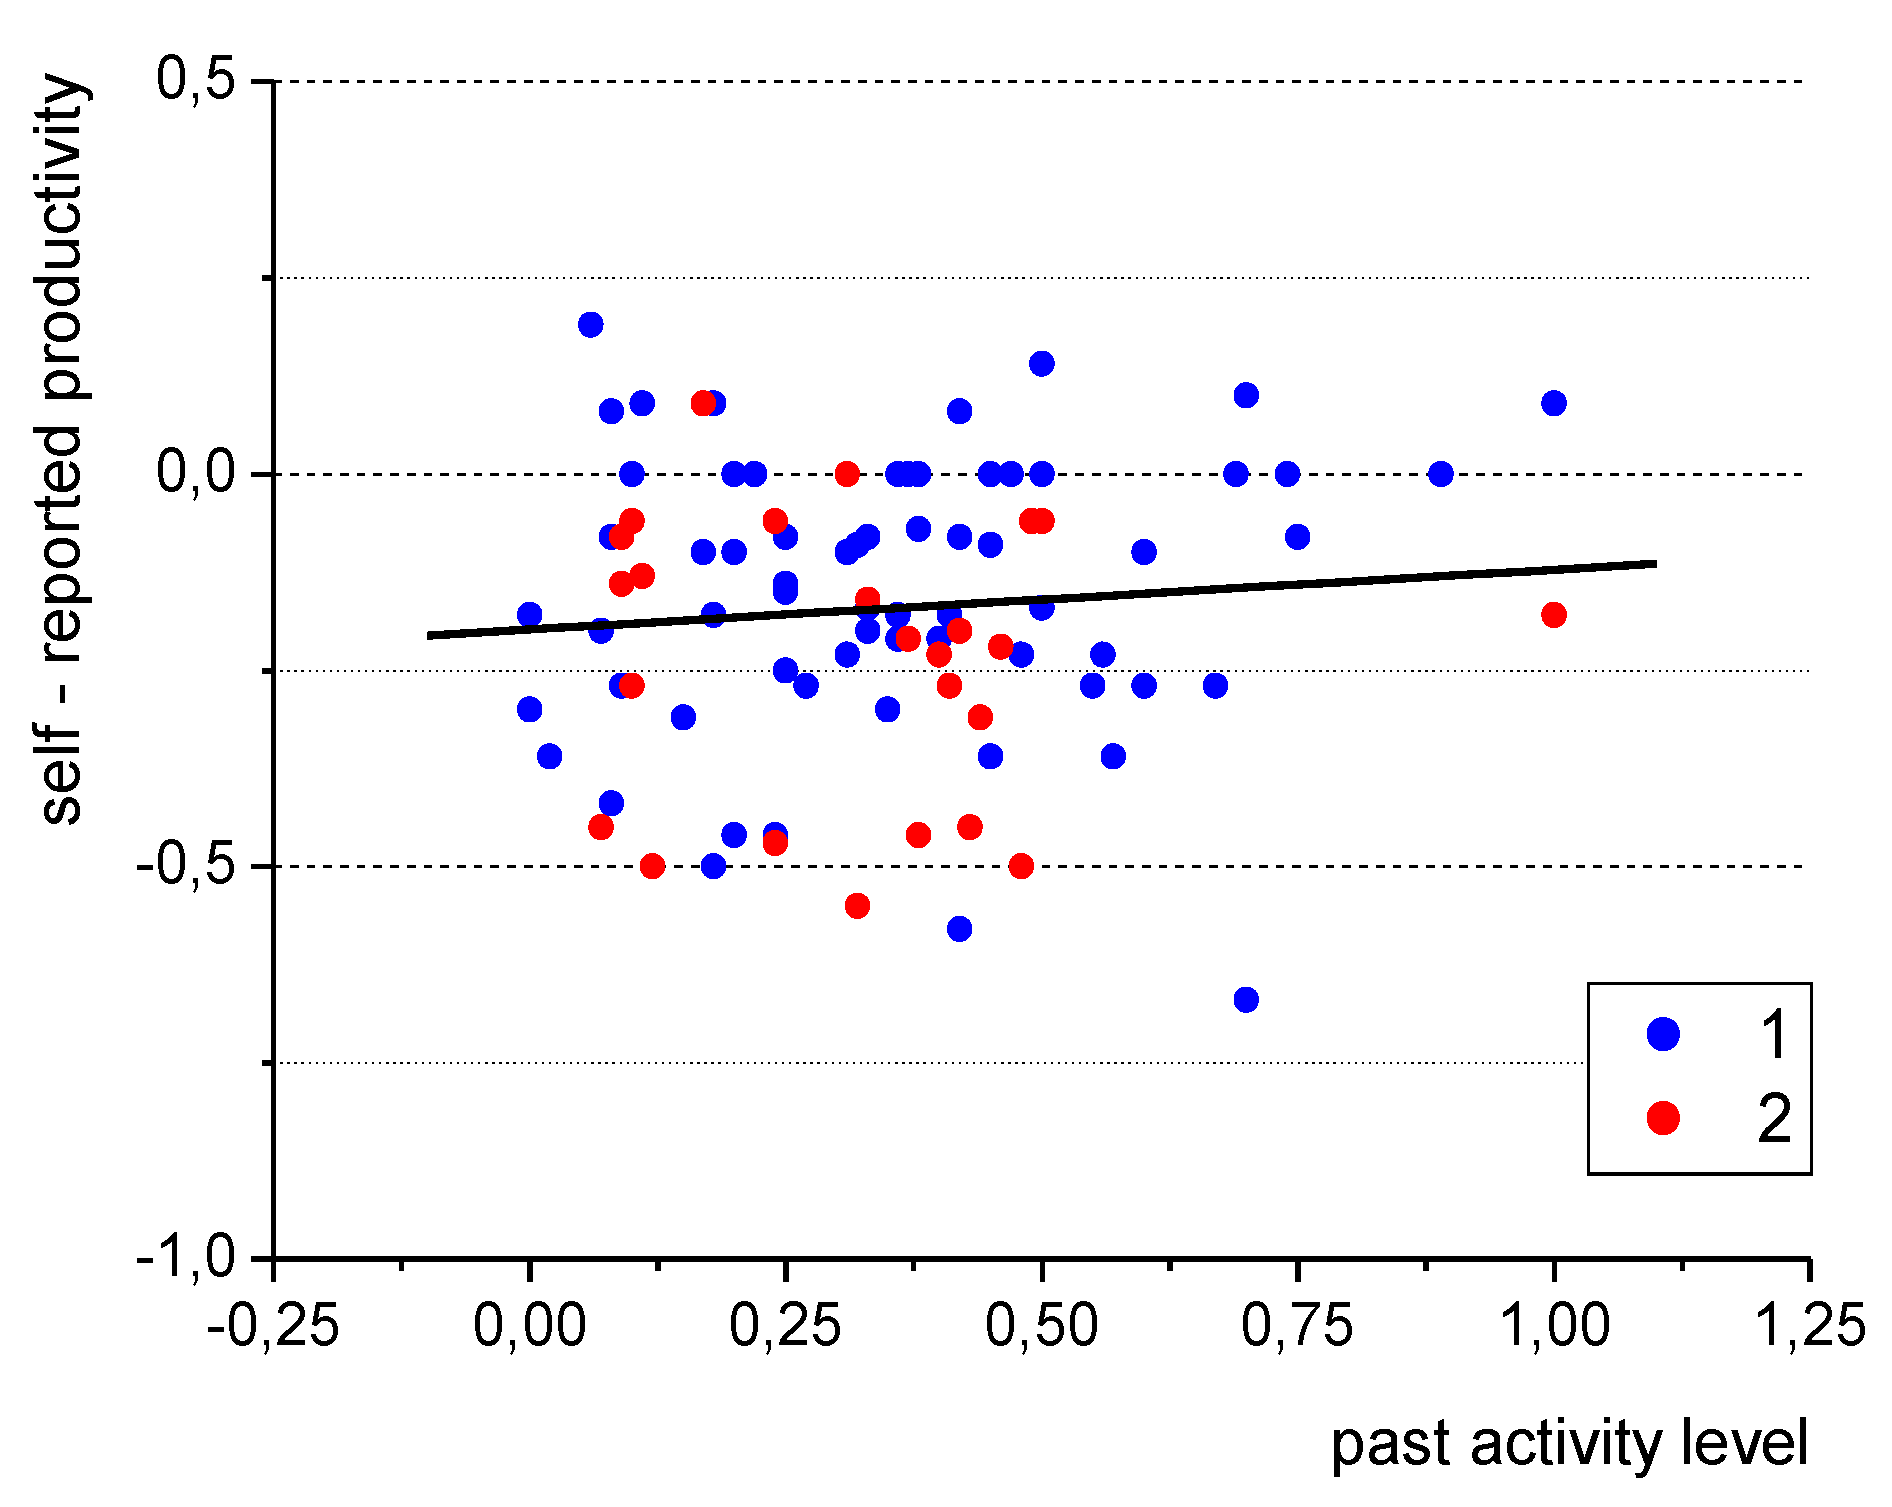
Intelligent buildings are typically equipped with computer-controlled systems and efficient lighting devices. Thus, the lighting conditions for people residing in individual rooms (doing office work, studying, etc.) are expected to be high. The questionnaire contained a question regarding this issue. The students were asked about their assessment of the lighting conditions in a room, where they were situated, and could choose from the following answers: “too strong” (+1), “appropriate” (0), or “too weak” (−1). Figure 10 (and Table S5 of the Supplementary Material) presents the results for the intelligent and traditional buildings separately.
The results indicate that all the buildings provided adequate lighting conditions for 83% and 85% of the respondents in the “Energis” and traditional buildings, respectively. The percentage shares of the votes “too strong” and “too weak” were also comparable. Thus, the use of traditional (even simple) lighting systems might be equally efficient—at least in educational buildings.
The light intensity experienced by the room users might not be influenced only by the illuminance generated by the lighting systems, but also by other factors such as the proper distribution of light sources in the ceiling, the reflective properties of the walls, etc. In order to verify this assumption, a relation between the mean Light Intensity Assessment (LIA) in each room (calculated as the average of the individual answers) and the value of illuminance (I) recorded in that room has been considered and presented in Figure 11, together with the polynomial fit (black line).
Naturally, as illuminance in the room increased, the respondents assessed the light intensity as stronger. However, the relation was not straightforward. The values of illuminance below 200 lux were considered as inadequate (LIA < −0.5) for a few rooms, but the same light intensity was regarded as fine (LIA close or equal to 0) in many rooms. The differences might be related to the design and location of the light sources in the ceiling and the reflective properties of the walls. Typically, higher values of illuminance were recorded in the traditional buildings; however, these values did not improve the perception of the respondents. Thus, it can be concluded that the same light conditions might be obtained at lower illuminance. Consequently, the energy consumption for lighting could be reduced, which is crucial for proper energy management in buildings and possible financial savings, as well as environmental protection due to reduction in the CO2 generation for energy production.
It needs to be noted that the standard [35] stipulates that the required illuminance for classrooms be 300 lux and 500 lux for meeting, conference, and reading rooms, while Balocco and Calzolari [58] claim that visual tasks such as reading and writing need illuminance within the range of 300–750 lux. Consequently, the recorded values in the present study were often too low to provide proper lighting conditions for the occupants. Inadequate lighting in educational buildings was also reported in [17,37].
Based on Figure 11, it can be stated that the increase in illuminance up to 600 lux typically led to elevated light intensity assessment. However, further rises, e.g., above 600 lux, did not result in higher LIA values. This might further support the statement that there might be no necessity to use excessive light intensity values in buildings. The weak relation observed in Figure 11 might be explained by the fact that the perception of lighting conditions can be shaped by other factors such as the presence of glows, reflections, or even air temperature (as indicated in [5]).
Considering further the perception of the lighting conditions, it might be anticipated that this issue would also influence human well-being. Namely, the highest General Sensation Vote responses would be observed when the lighting conditions are assessed as adequate (when the mean LIA for the room is around 0). The data from 1302 questionnaires (Figure 12) did not support this claim; however, in the area of positive Light Assessment Vote responses (−0.25 < LIA < +0.25)—marked in the figure with the green box—the great majority (ca. 84%) of mean the General Sensation Vote responses were positive (GSV > 0). This might suggest a weak interconnection between these two parameters.
It has to be noted that Kim et al. [6] claimed that their respondents felt uncomfortable due to the glare of daylight and reflection coming from large windows, as well as due to having no control over it. Thus, increased light intensity would be experienced, which might be assessed in the negative way.

3.3. Productivity

The indoor environment influences human well-being and might have an impact on productivity (considered as ‘learning potential’ in the present study). The tests performed in the educational buildings were focused on the assessment of self-reported productivity (P). The respondents answered the following question: “How do you rate your current productivity (your potential to absorb knowledge)?”. The students chose from the following: “strong (better than usual)” (+1), “normal (as usual)” (0), or “weak (worse than usual)” (−1). The results for all the buildings have been presented in Figure 13 (and Table S6 of the Supplementary Material).
The respondents considered themselves to be more productive in the intelligent building: this resulted in 6.6% of the share of the answers (1) as opposed to 3.9% in the traditional buildings. Moreover, the share of the answer “weak” (−1) (indicating worse than usual productivity) was higher in the traditional buildings (28.9%) as opposed to 22.1% in “Energis”. The differences might not be significant, but it is quite clear that the additional cost of maintenance and the technological sophistication of heating, ventilation, air conditioning, or lighting systems in the smart “Energis” building might be justified if it contributes to improved productivity, especially in educational or office buildings.
Ensuring the well-being of room users is important—as was considered earlier in the paper and referred to as the General Sensation Vote in the questionnaire. It seems, however, that the subjective assessment of well-being and productivity might be interconnected. People tend to work more efficiently when they feel satisfied and happy. Figure 14 typically confirms this assumption. The data of the 1302 questionnaire responses clearly shows that, as the subjective assessment of well-being (GSV) increased (as the average value calculated for a group situated in a considered room), their productivity (learning potential), also expressed as the mean values for 92 rooms, rose linearly.
The obtained mathematical formula for the dependence takes the form of the following:
P = 0.2994GSV − 0.281
and the outcome was quite clear (R2 = 0.40), considering the fact that it covered all the buildings, various groups of students, and broad ranges of indoor air parameters and lighting conditions, and as well as the fact that both the analysed parameters (productivity and general sensation) are highly subjective. A similar distribution of data points and an almost identical linear fitting equation could have been obtained if the General Sensation Vote responses in Figure 14 were replaced with Indoor Air Quality Vote responses. It might have been anticipated due to a strong relation between air quality and well-being (as was observed in Figure 9).
The impact of well-being on productivity is quite subjective and should be accompanied by a discussion on the influence of indoor air parameters on the learning potential of the respondents. Figure 15 presents the relation between the air temperature (T) in 92 rooms and the mean values of productivity reported in the questionnaire responses.
Although the coefficient of determination of R2 = 0.21 was low, a trend in the changes can be clearly noticed, with the maximum learning potential occurring at the air temperature of about 22 °C–23 °C. However, the highest productivity of the room users was observed in a wider range of temperature values: from 22 °C to 25 °C, as is indicated by the green box on the graph. These values are quite high, and, thus, the energy demand for heating in the winter season might need to be higher. Naturally, this can be a phenomenon observed only in climates where the winter conditions might be harsh, while the summer conditions are quite mild and people tend to prefer warmer environments (e.g., in Central and Eastern Europe, as indicated by Dębska et al. [59] and Majewski et al. [60]). It should be emphasized that the traditional buildings provided the largest air temperature values (about and over 29 °C), and the self–reported productivity reported for these four high-temperature data points (Figure 15) amounted to ca. −0.5, which indicates a low learning potential of the respondents. The spread of the data points in Figure 15 is quite significant due to the fact that productivity is highly subjective and might be influenced by individual preferences and the mood of a certain volunteer, as well as current health condition, hunger, etc. However, in educational and office buildings, the lighting conditions might also be of significant importance due to the fact that the working activities there are mostly focused on writing and reading. The optimal values observed in the present European study (22–25 °C) are in agreement with the data from other climate conditions (for example, Geng et al. [5] reported the air temperature of 22 °C as most favourable following the research tests conducted in China), while Kaushik et al. [21] presented the optimal temperature range of 22–25 °C for an office located in the hot climate of Qatar.
According to [25], relative humidity proved to have more profound effect on productivity than air temperature. Thus, a relation between relative humidity (RH), together with air temperature and self–reported productivity, has been given in Figure 16.
It seems that the highest values of productivity were reported in the wide range of relative humidity values (from ca. 20% to 46%). As opposed to the data presented in [25], dry environments did not cause a decrease in productivity; however, a humid micro-climate indeed seemed to worsen the self-reported productivity readings. It can be related to the fact that productivity was influenced by other factors (mostly air temperature) as well, which could have had a stronger impact—especially given that (as evidenced in Figure 16) typically high-humidity environments of lower productivity occurred in the traditional buildings, where the influence of other factors adversely affecting productivity (such as traffic noise due to open windows and high indoor air temperature) could be more pronounced.
It needs to be added that Kaushik et al. [21] reported an optimal relative humidity value of up to 60% in their study conducted in Qatar.
Due to the fact that, in educational buildings, reading and writing are the most common tasks, another possible factor that can potentially have an influence on productivity is the level of illuminance. Figure 17 shows a relation between the mean value of self-reported productivity (calculated in each room) and the light intensity measured in those rooms.
As can be seen, the most optimal level of illuminance with regard to productivity was answered in the question in the questionnaire on participants’ past activity, with the possible 200–400 lux. Such lighting condition seemed to enable proper working conditions at the desks of the individual respondents. It needs to be mentioned that there was a large discrepancy between the results for individual rooms due to the impact of other factors on productivity. However, lighting conditions should be considered and acknowledged by building managers so that the most optimal indoor environment can be maintained in buildings. Apart from providing more adequate indoor environment parameters, a method of improving productivity might be the introduction of breaks during the classes (or at work), which would be long enough to ensure that people are able to perform a physical activity such as walking. The influence of the past activity (before coming to the classroom and completing the questionnaire) on productivity has been presented in Figure 18. The activity level was taken as the mean value for a given group in the room. The answers to choose from were the following: “sitting” (0), “walking of at least 10 min” (1), “moderate physical activity” (2), or “intense physical activity” (3).
Due to a low value of the coefficient of determination, no relation should be considered here, but it needs to be noted that the vales of the activity level in the current study were typically (0) or (1) due to the fact that the tests were performed in the educational buildings, and the students either sat or walked before lectures. Only a few out of the 1302 volunteers indicated that they partook in moderate or intense physical activity. This might be quite understandable when performing tests in educational or office buildings; however, it undoubtedly influenced the relation between the activity level and productivity. Nevertheless, physical activity might have a favourable impact on learning potential.
It also needs to be noted that—as indicated by [8]—apart from the indoor environment physical parameters, productivity can depend on other factors such as individual space and personal control. This could explain the relatively weak correlations observed in some cases presented above. However, the indoor environmental quality is an important factor and should be maintained at high levels in order to contribute to high productivity.
Kaushik et al. [21] pointed out that maintaining the proper levels of indoor environmental quality parameters could require larger energy consumption, but the profits obtained from the fact that the occupants are more productive and healthier could be larger than an increase in the energy cost for the building operation. In a simulation study [26], a 46% productivity increase was reported due to indoor environment improvement, which required an increase in annual energy consumption of 11.7%. However, the large dataset from the 1302 questionnaire responses presented in the paper suggest that the difference between intelligent and traditional buildings regarding human sensations might not be that significant. Naturally, the intelligent building (equipped with HVAC systems) typically provided better performance, but the difference could not be considered as considerable, probably due to the adaptation of the occupants.

4. Conclusions

The experimental study was conducted in Polish intelligent and traditional buildings. Based on the analysis of the 1302 questionnaire responses completed by the volunteers, as well as micro-climate metre data analysis, the following conclusions can be drawn:
  • The occupants seemed to be more favourable towards the conditions in “Energis”, though the differences in their sensations were not so significant as might have been anticipated based on the indoor air parameters alone. Despite less favourable indoor air conditions (higher indoor air temperature and carbon dioxide concentration), the overall comfort of the occupants in the intelligent and traditional buildings were comparable.
  • A subjective assessment of the indoor air quality indicated that more favourable conditions were present in the intelligent building, which might be related to the lower levels of carbon dioxide and possibly other factors such as a higher level of user control.
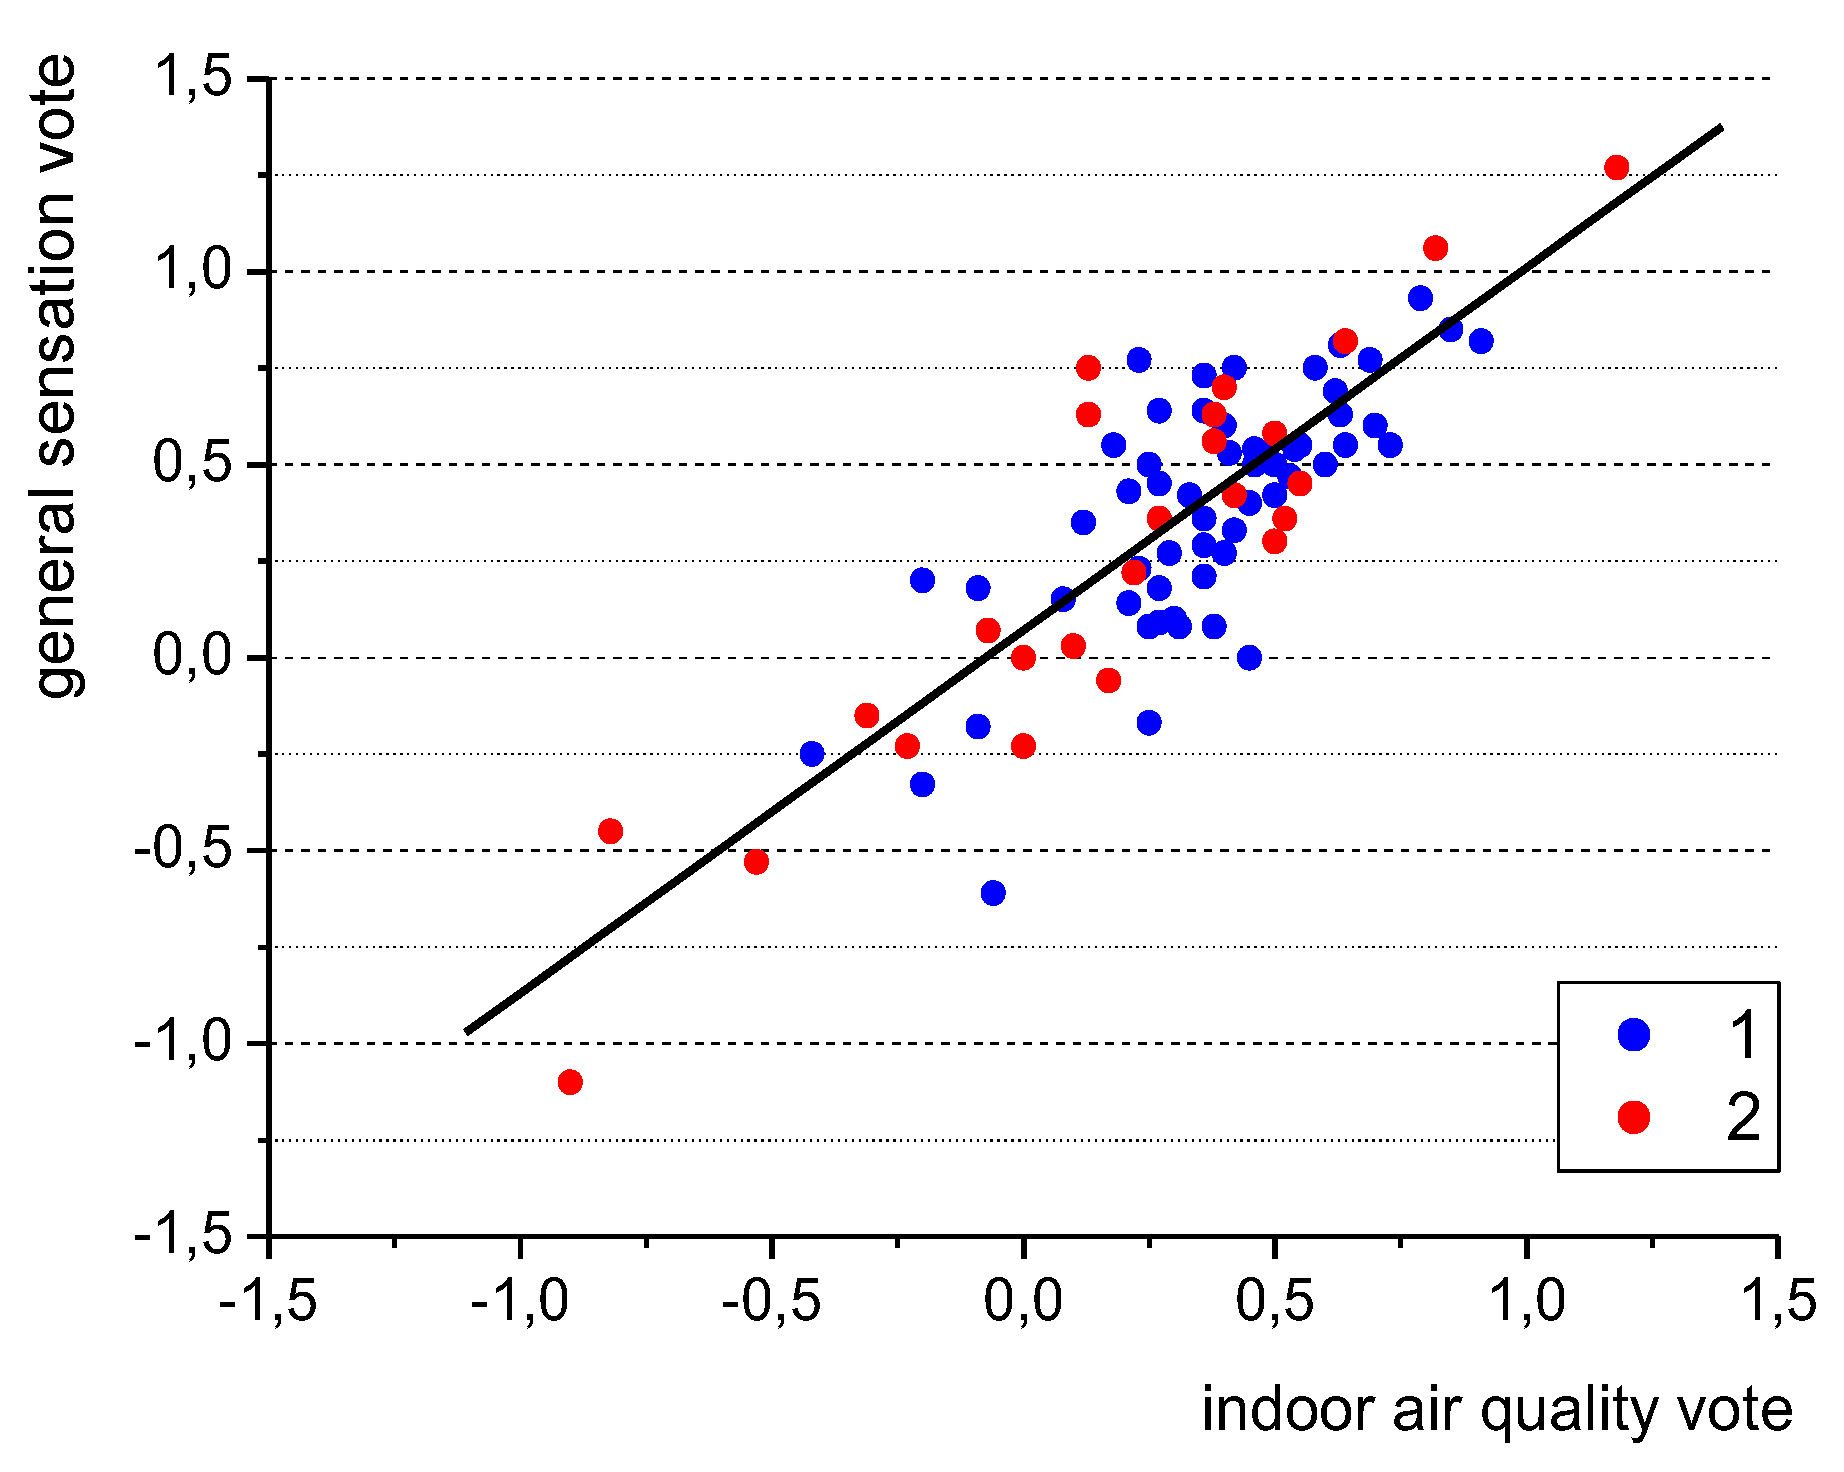
  • A strong correlation between the occupants’ well-being (overall comfort) and their perception of the air quality has been found.
  • The occupants’ subjective assessment of the lighting conditions in both intelligent and traditional buildings was comparable, despite clear differences in the lighting systems’ design and operation. It might be related to the adaptation of the room users to the existing conditions over a long period of time, which the students had spent in the buildings in the course of their study periods (months or even years in the same educational building).
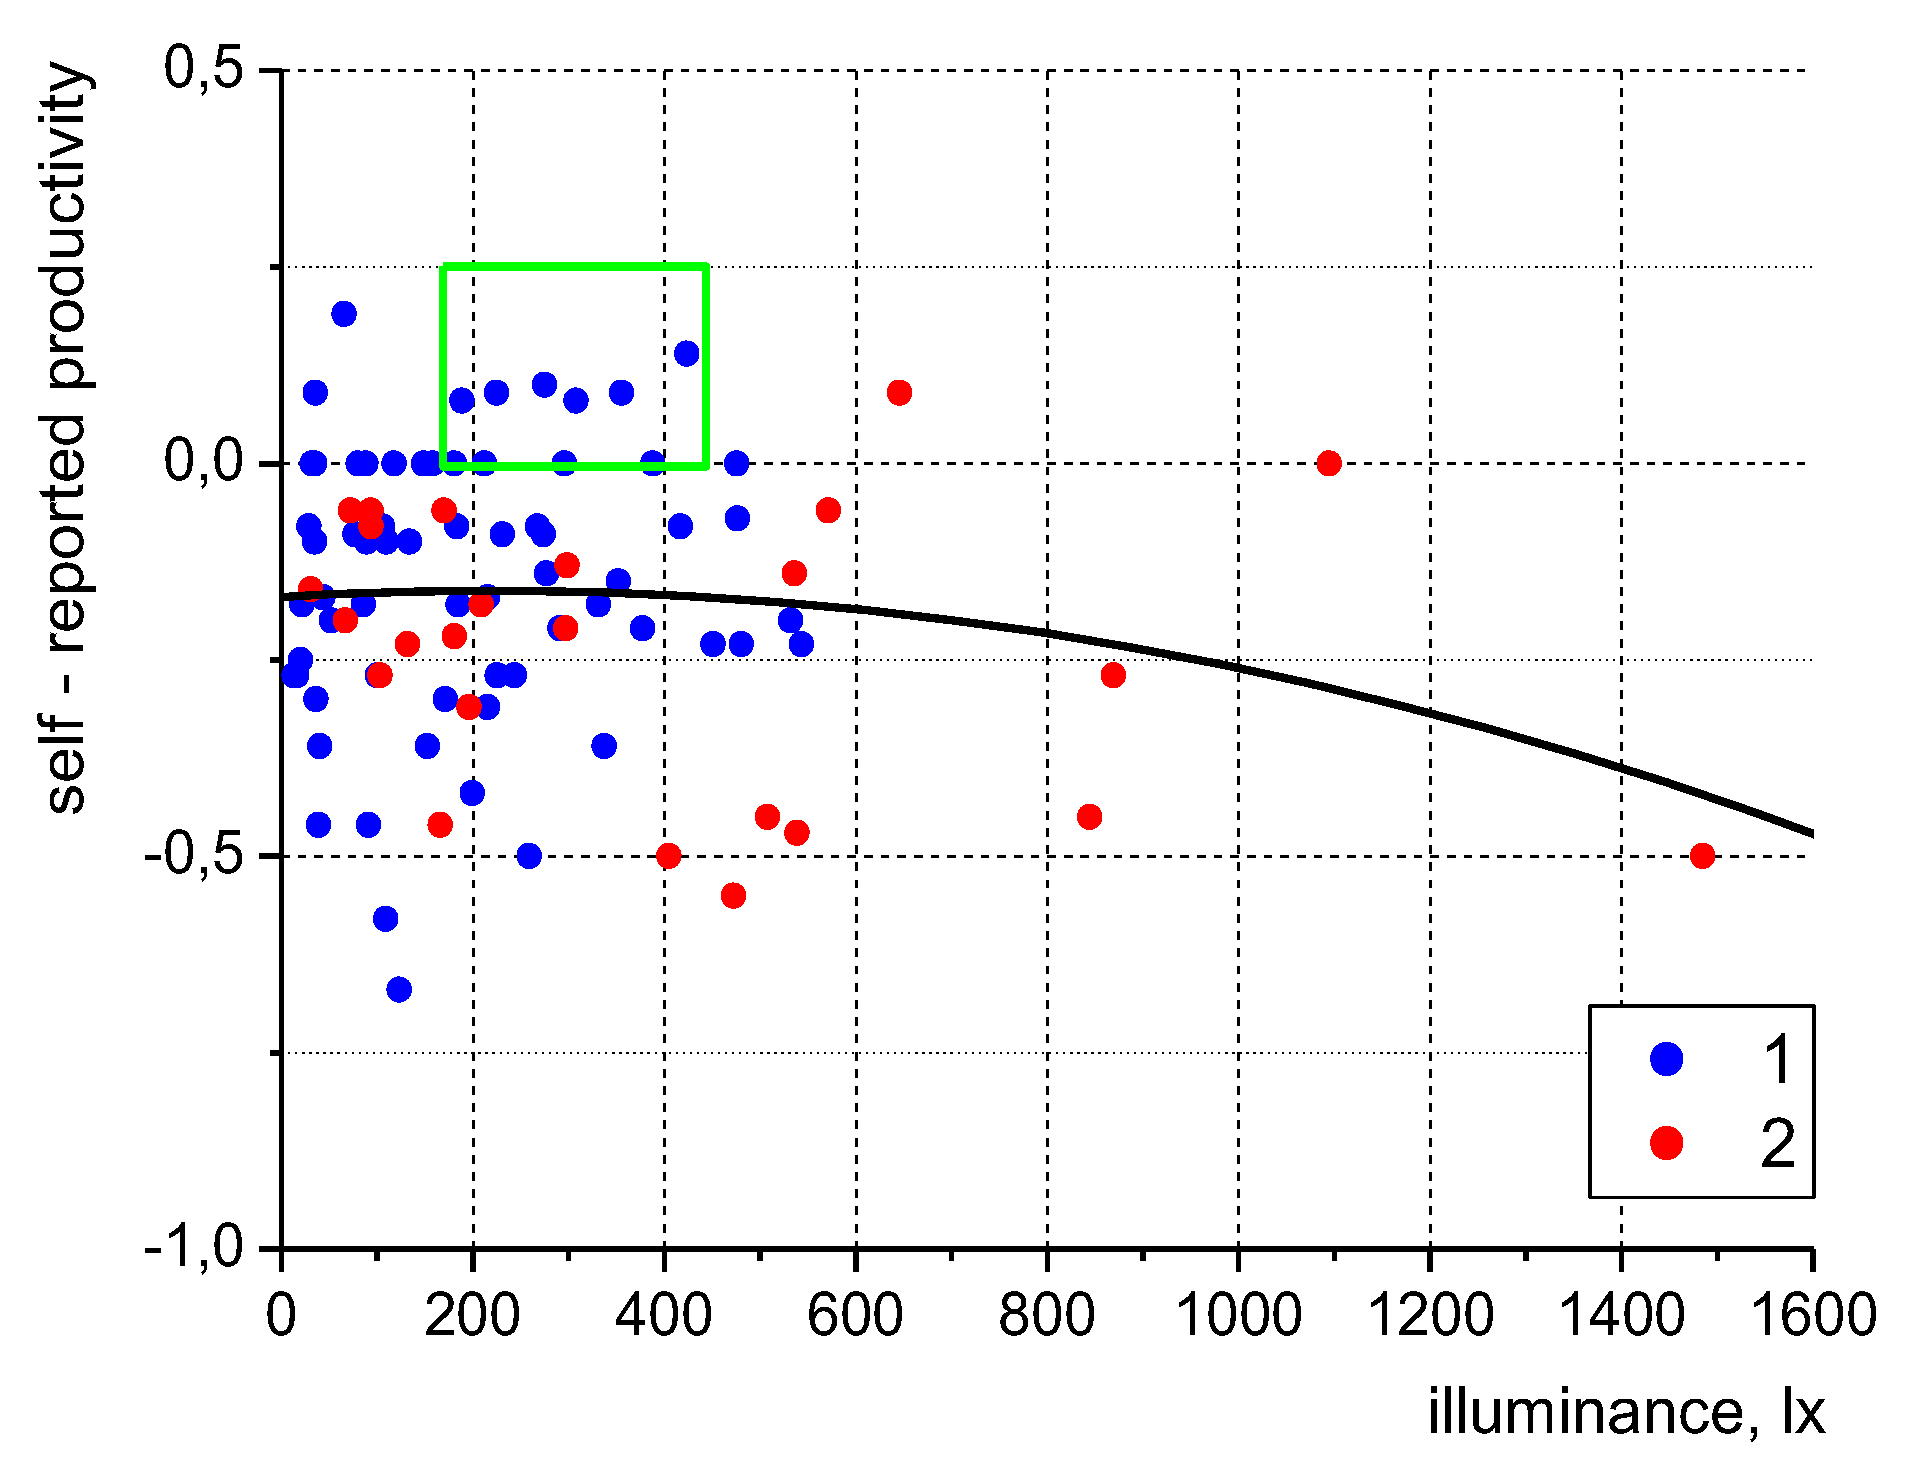
  • The increase in illuminance by up to 600 lux typically led to an elevated light intensity assessment. However, exceeding the threshold of 600 lux did not increase the subjective assessment. Thus, there might be no need to use excessive light intensity values in buildings, which can reduce the energy costs.
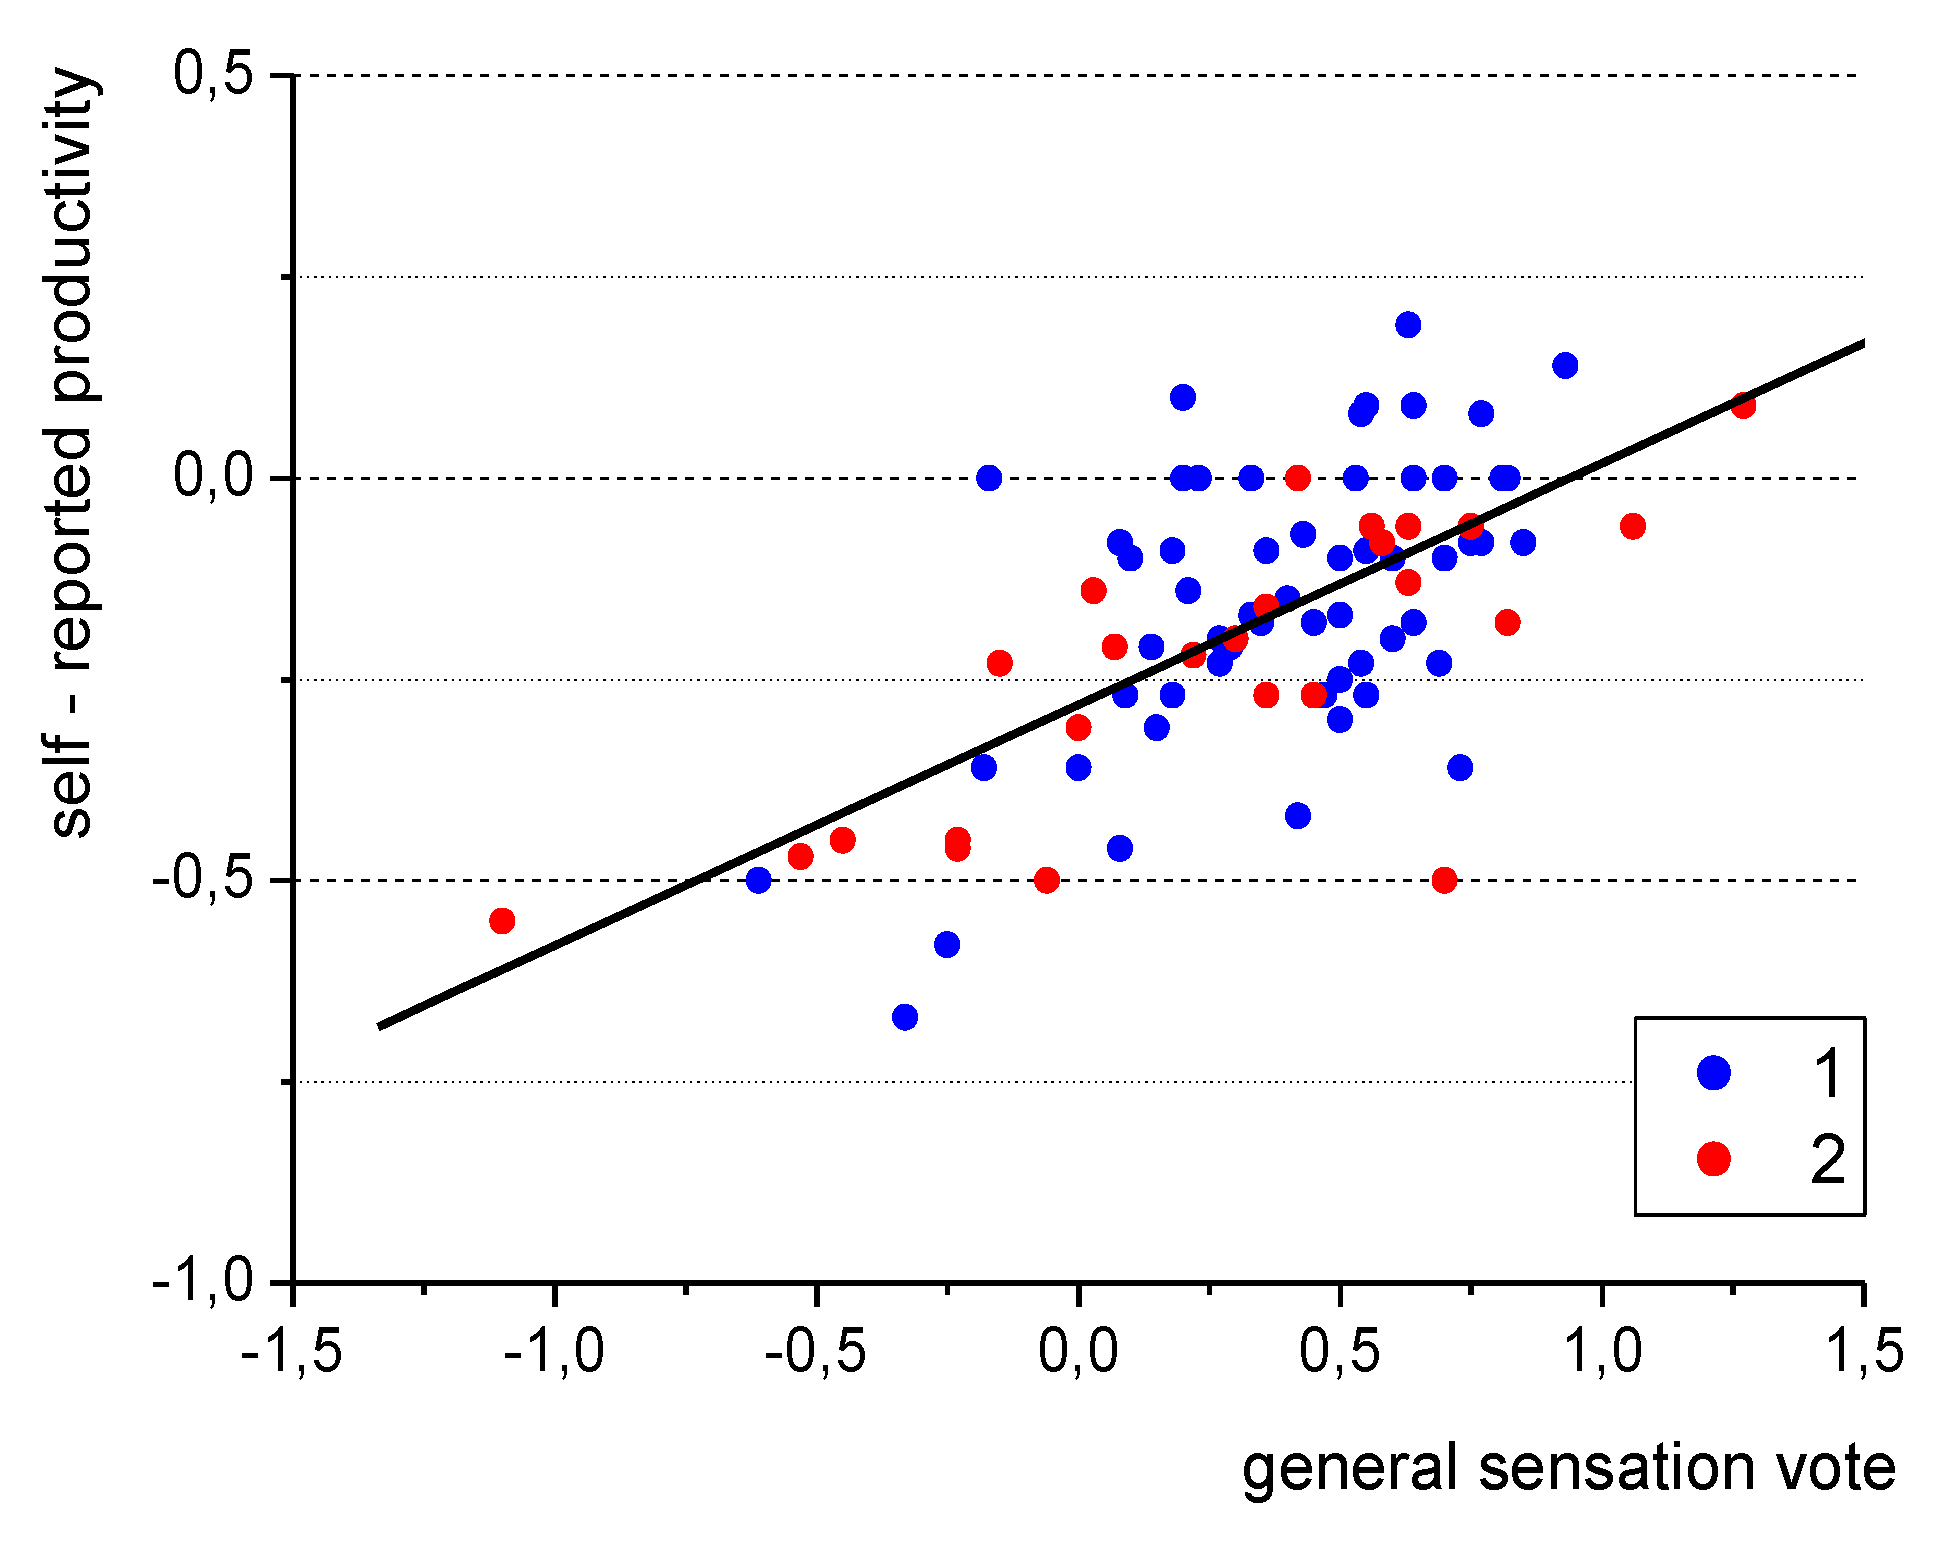
  • Self-reported productivity proved to be higher in the intelligent building and seemed to be influenced by the overall comfort of the occupants. As the subjective assessment of the respondents’ well-being increased, so did the self-reported productivity.
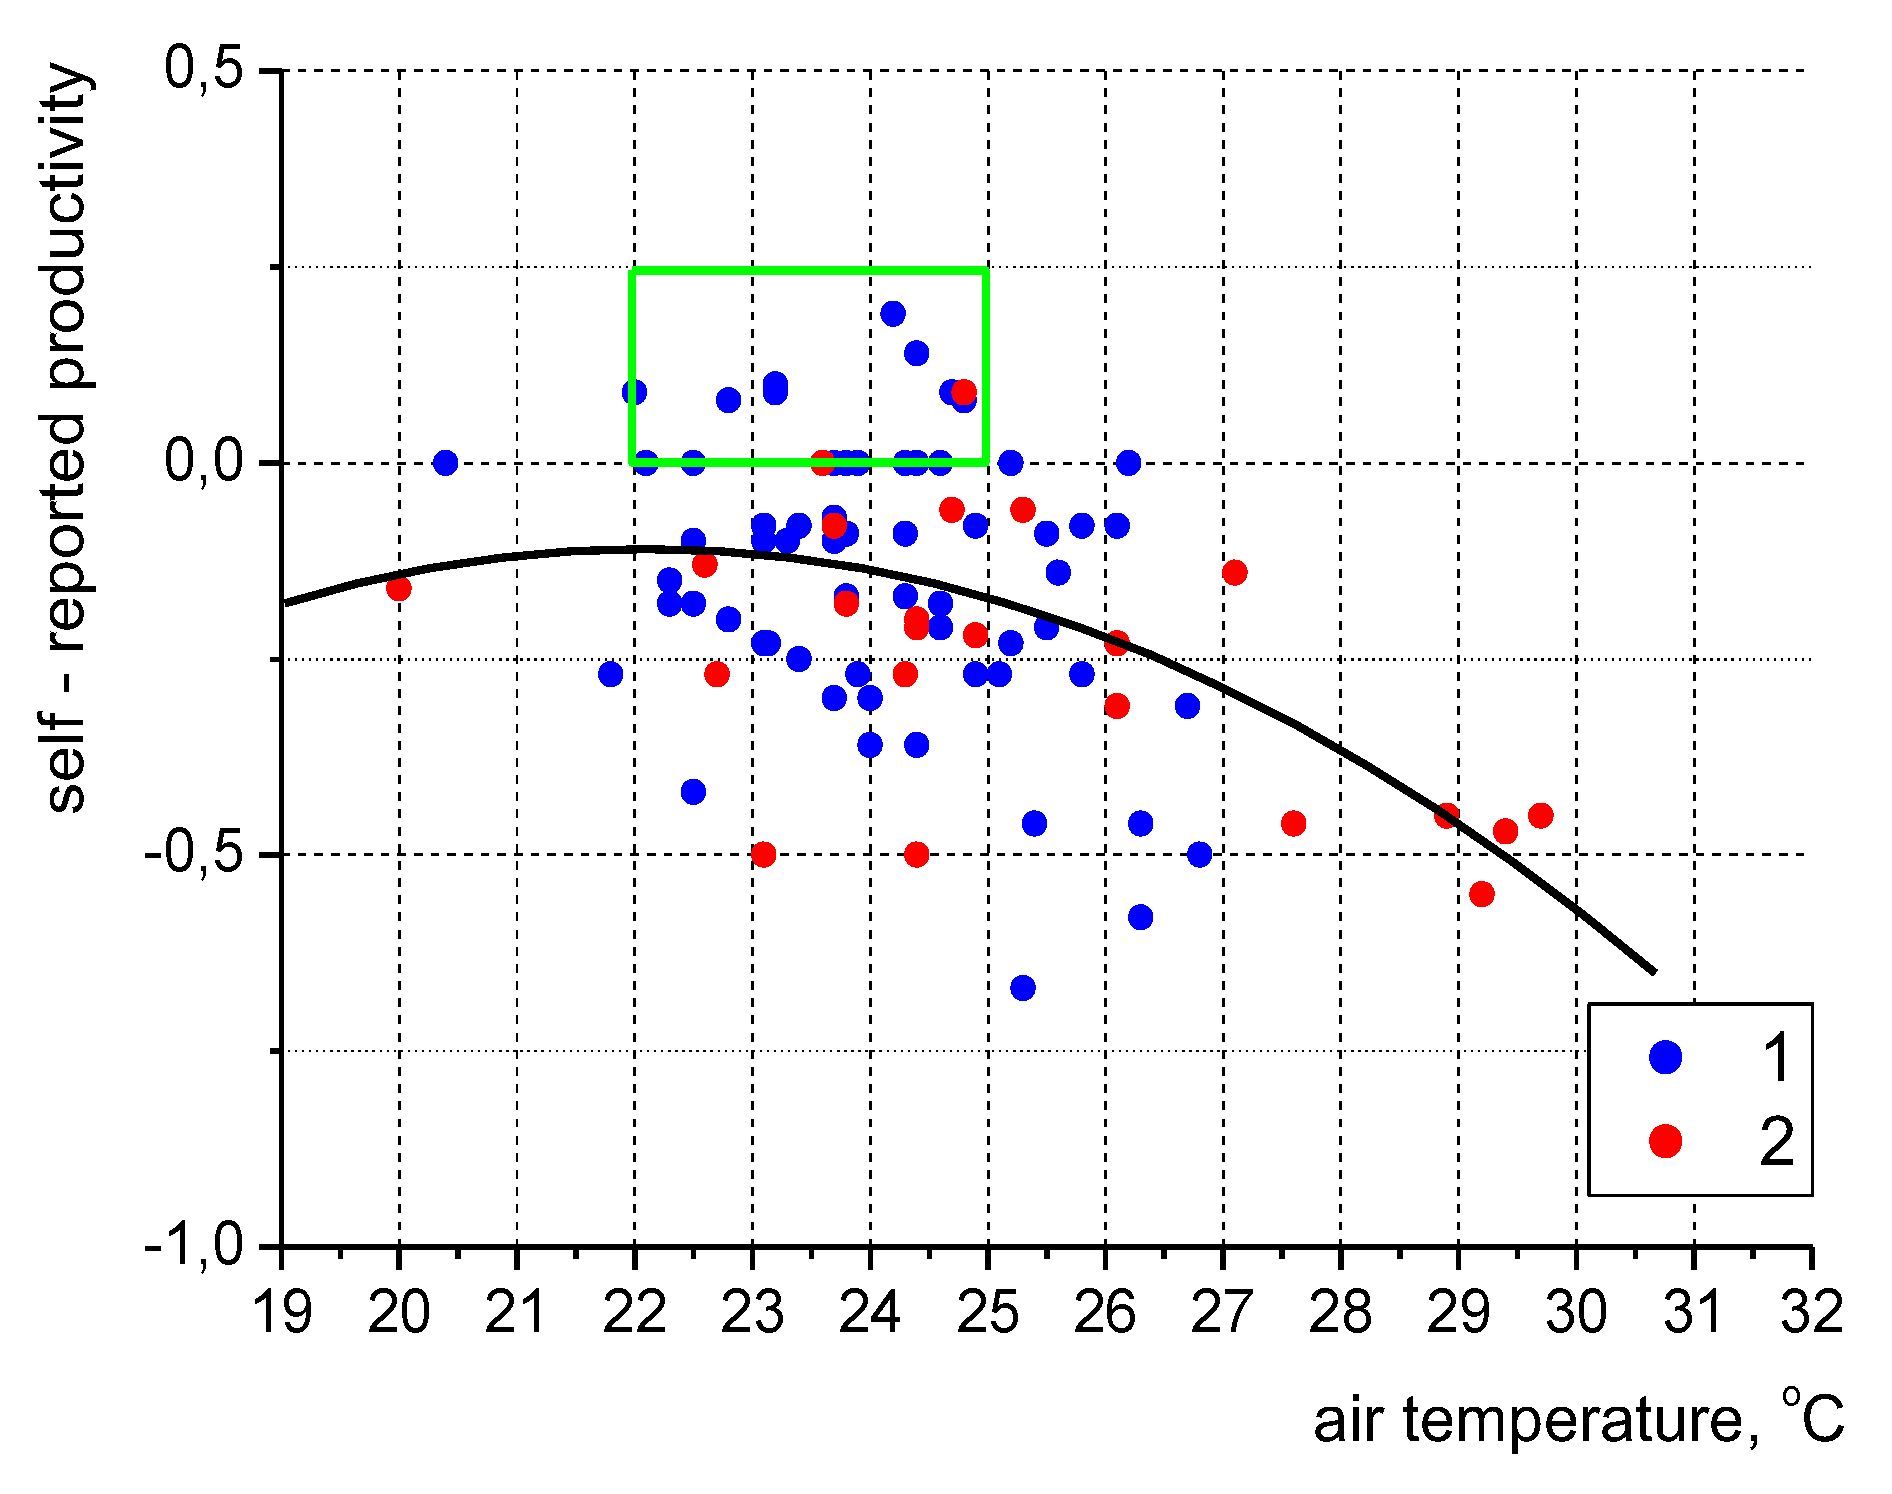
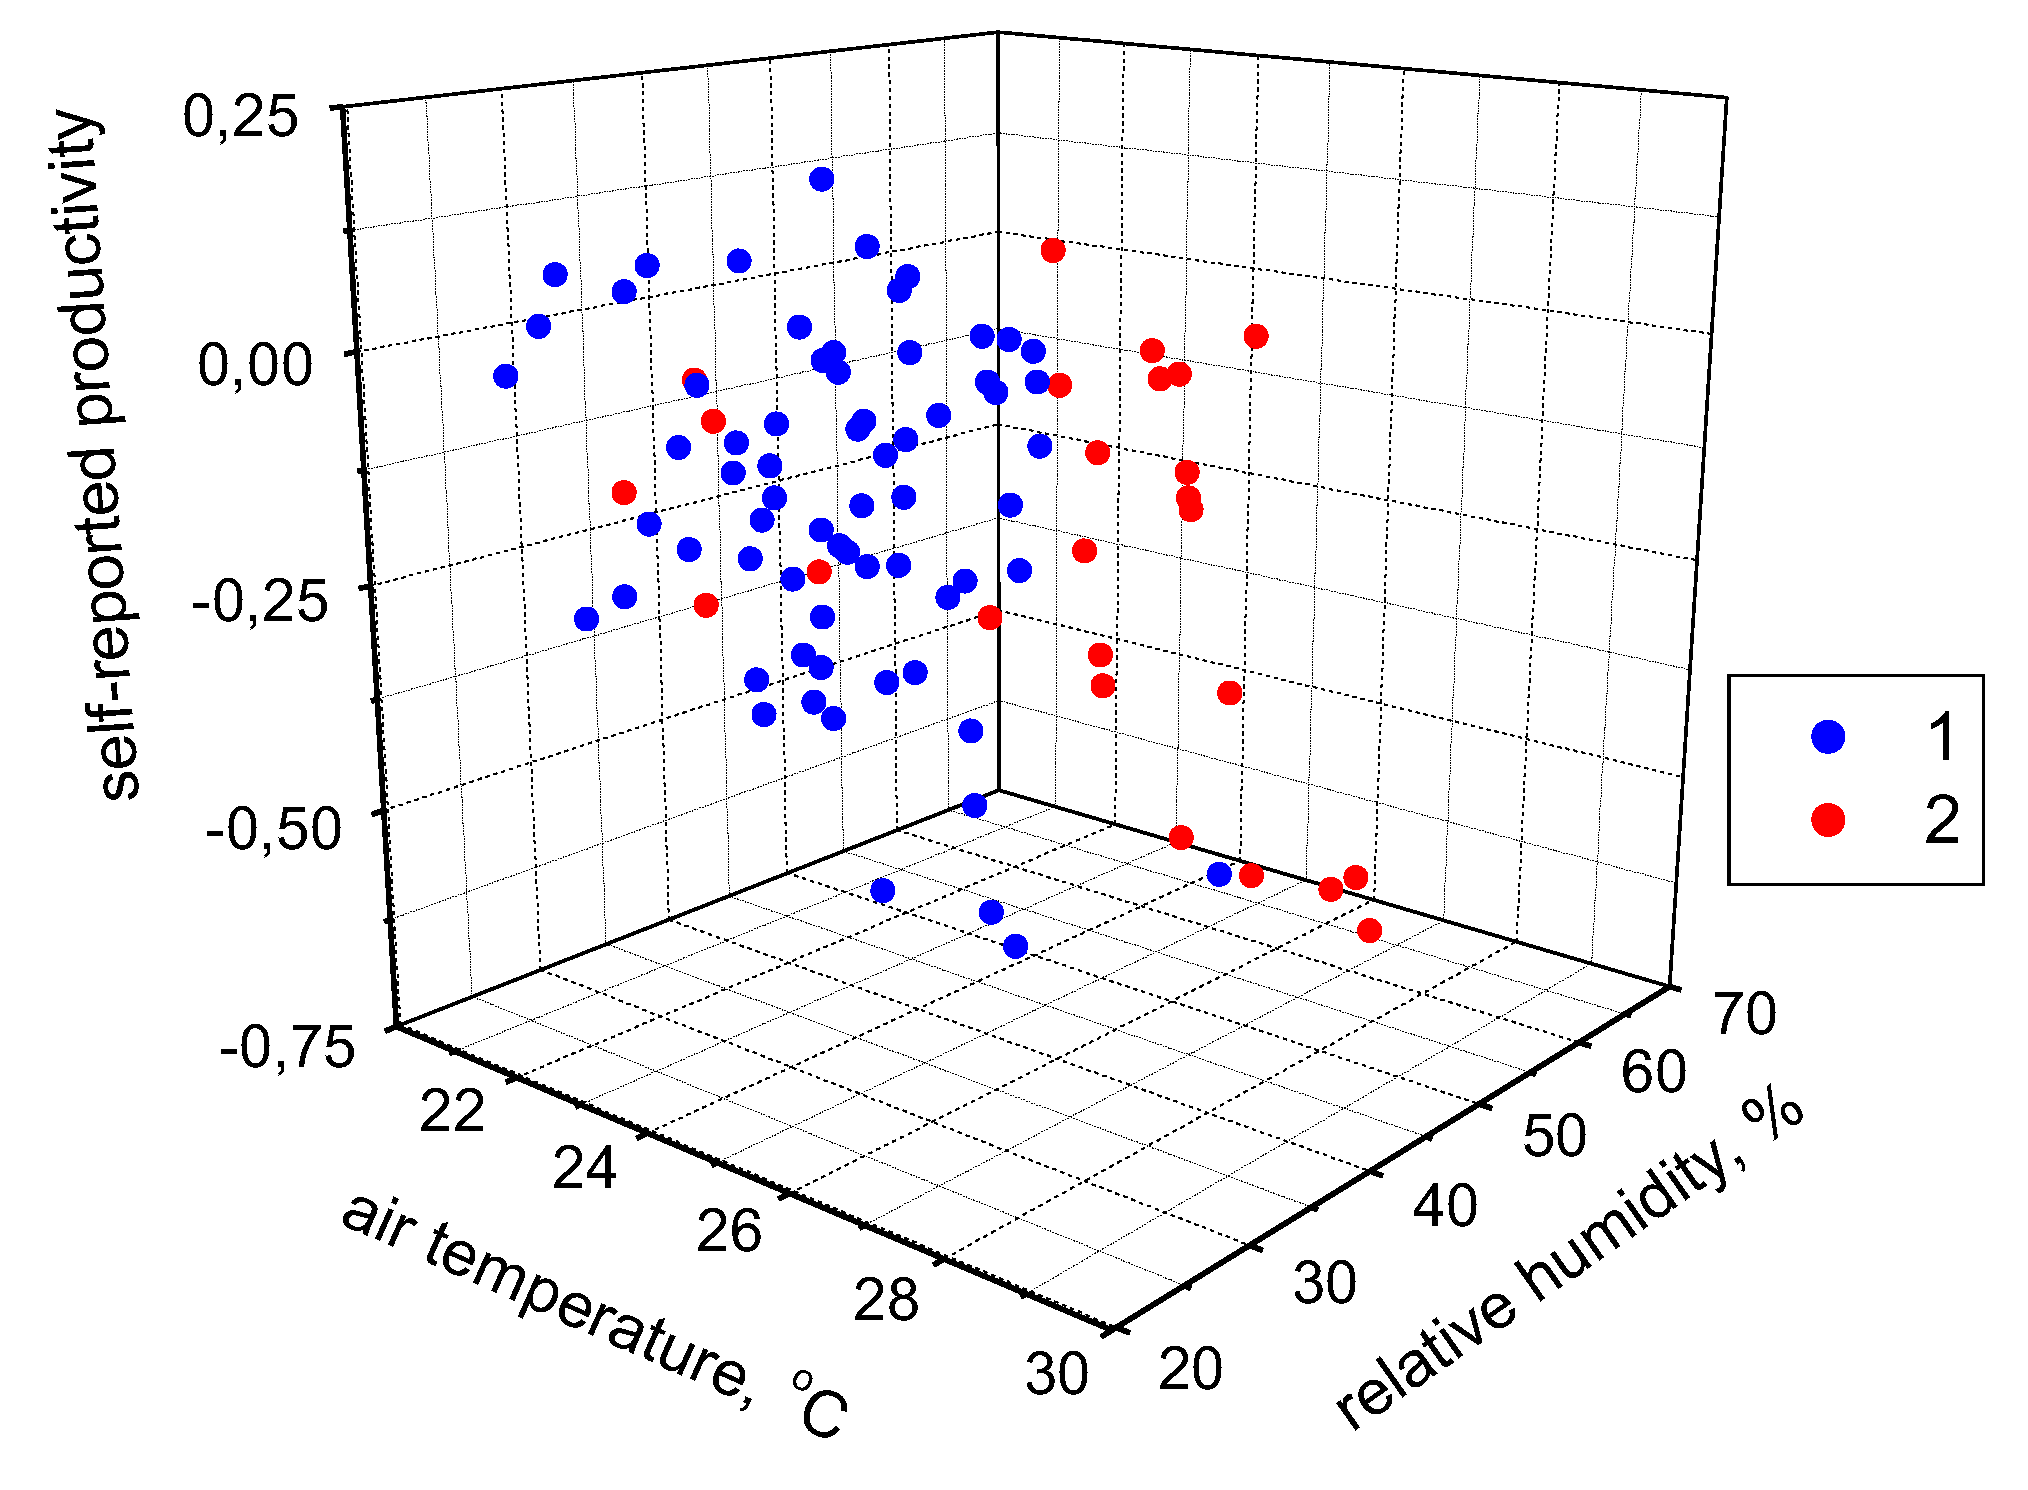
  • The highest productivity of the respondents was observed at the indoor air temperature of 22 °C–25 °C. Similar values were reported by studies conducted in other parts of the world.

Supplementary Materials

The following supporting information can be downloaded at: https://www.mdpi.com/article/10.3390/en16186663/s1, Table S1. The main technical data of the analysed buildings. Table S2. Data of the rooms where the tests took place (1–67: intelligent building, 68–92 traditional buildings with no fans in-stalled). Table S3. General sensation vote—frequency count, %. Table S4. Indoor air quality vote—frequency count, %. Table S5. Light intensity assessment—frequency count, %. Table S6. Self-reported productivity—frequency count, %.

Author Contributions

Conceptualization, Ł.J.O.; methodology, Ł.J.O. and N.K.; software, N.R., S.H. and J.P.; investigation, N.K.; resources, Ł.J.O. and N.R.; data curation, N.K., N.R., S.H., J.P., L.D., A.D. and A.K.; writing—original draft preparation, Ł.J.O., N.K., N.R. and S.H.; writing—review and editing, Ł.J.O., N.K., N.R., S.H., J.P., L.D., A.D. and A.K.; funding acquisition, N.R., S.H. and J.P. All authors have read and agreed to the published version of the manuscript.

Funding

The work in this paper was supported by the project: “SP2023/094 Specific research in selected areas of energy processes” and “REFRESH—Research Excellence For REgion Sustainability and High-tech Industries, (VP2), (Reg. No.: CZ.10.03.01/00/22_003/0000048) co-funded by the European Union”.

Data Availability Statement

The data are available upon request.

Conflicts of Interest

The authors declare no conflict of interest.

References

  1. Brasche, S.; Bischof, W. Daily time spent indoors in German homes–Baseline data for the assessment of indoor exposure of German occupants. Int. J. Hyg. Environ. Health 2005, 208, 247–253. [Google Scholar] [CrossRef]
  2. Klepeis, N.E.; Nelson, W.C.; Ott, W.R.; Robinson, J.P.; Tsang, A.M.; Switzer, P.; Behar, J.V.; Hern, S.C.; Engelmann, W.H. The National Human Activity PAttern Survey (NHAPS): A resource for assessing exposure to environmental pollutants. J. Expo. Anal. Environ. Epidemiol. 2001, 11, 231–252. [Google Scholar] [CrossRef]
  3. Bluyssen, P.M. The Indoor Environment Handbook: How to Make Buildings Healthy and Comfortable; Taylor & Francis: London, UK, 2009. [Google Scholar]
  4. Sakellaris, I.A.; Saraga, D.E.; Mandin, C.; Roda, C.; Fossati, S.; De Kluizenaar, Y.; Carrer, P.; Dimitroulopoulou, S.; Mihucz, V.G.; Szigeti, T.; et al. Perceived Indoor Environment and Occupants’ Comfort in European “Modern” Office Buildings: The OFFICAIR Study. Int. J. Environ. Res. Public Health 2016, 13, 444. [Google Scholar] [CrossRef]
  5. Geng, Y.; Ji, W.; Lin, B.; Zhu, Y. The impact of thermal environment on occupant IEQ perception and productivity. Build. Environ. 2017, 121, 158–167. [Google Scholar] [CrossRef]
  6. Kim, Y.K.; Abdou, Y.; Abdou, A.; Altan, H. Indoor Environmental Quality Assessment and Occupant Satisfaction: A Post-Occupancy Evaluation of a UAE University Office Building. Buildings 2022, 12, 986. [Google Scholar] [CrossRef]
  7. Altomonte, S.; Allen, J.; Bluyssen, P.M.; Brager, G.; Heschong, L.; Loder, A.; Schiavon, S.; Veitch, J.A.; Wang, L.; Wargocki, P. Ten questions concerning well-being in the built environment. Build. Environ. 2020, 180, 106949. [Google Scholar] [CrossRef]
  8. Göçer, Ö.; Candido, C.; Thomas, L.; Göçer, K. Differences in Occupants’ Satisfaction and Perceived Productivity in High- and Low-Performance Offices. Buildings 2019, 9, 199. [Google Scholar] [CrossRef]
  9. EN 16798-1: 2019; Energy Performance of Buildings—Ventilation for Buildings—Part 1: Indoor Environmental Input Parameters for Design and Assessment of Energy Performance of Buildings Addressing Indoor Air Quality, Thermal Environment, Lighting and Acoustics—Module M1-6. CEN: Brussels, Belgium, 2019.
  10. Borowski, M.; Zwolińska, K.; Czerwiński, M. An Experimental Study of Thermal Comfort and Indoor Air Quality—A Case Study of a Hotel Building. Energies 2022, 15, 2026. [Google Scholar] [CrossRef]
  11. Vilcekova, S.; Meciarova, L.; Burdova, E.K.; Katunska, J.; Kosicanova, D.; Doroudiani, S. Indoor environmental quality of classrooms and occupants’ comfort in a special education school in Slovak Republic. Build. Environ. 2017, 120, 29–40. [Google Scholar] [CrossRef]
  12. Aguilar, A.J.; de la Hoz-Torres, M.L.; Ruiz, D.P.; Martínez-Aires, M.D. Monitoring and Assessment of Indoor Environmental Conditions in Educational Building Using Building Information Modelling Methodology. Int. J. Environ. Res. Public Health 2022, 19, 13756. [Google Scholar] [CrossRef] [PubMed]
  13. Zender-Swiercz, E. Analysis of the impact of the parameters of outside air on the condition of indoor air. Int. J. Environ. Sci. Technol. 2017, 14, 1583–1590. [Google Scholar] [CrossRef]
  14. Zender-Swiercz, E. Improving the indoor air quality using the individual air supply system. Int. J. Environ. Sci. Technol. 2018, 15, 689–696. [Google Scholar] [CrossRef]
  15. Aflaki, A.; Esfandiari, M.; Jarrahi, A. Multi-Criteria Evaluation of a Library’s Indoor Environmental Quality in the Tropics. Buildings 2023, 13, 1233. [Google Scholar] [CrossRef]
  16. Rolando, D.; Mazzotti Pallard, W.; Molinari, M. Long-Term Evaluation of Comfort, Indoor Air Quality and Energy Performance in Buildings: The Case of the KTH Live-In Lab Testbeds. Energies 2022, 15, 4955. [Google Scholar] [CrossRef]
  17. Clements, N.; Zhang, R.; Jamrozik, A.; Campanella, C.; Bauer, B. The Spatial and Temporal Variability of the Indoor Environmental Quality during Three Simulated Office Studies at a Living Lab. Buildings 2019, 9, 62. [Google Scholar] [CrossRef]
  18. Lan, L.; Wargocki, P.; Wyon, D.P.; Lian, Z. Effects of thermal discomfort in an office on perceived air quality, SBS symptoms, physiological responses, and human performance. Indoor Air 2011, 21, 376–390. [Google Scholar] [CrossRef] [PubMed]
  19. Lee, G.-B.; Lee, S.-M.; Lee, S.-E.; Jeong, J.-W.; Lee, J.-W. A Comparative Field Study of Indoor Environment Quality andWork Productivity between Job Types in a Research Institute in Korea. Int. J. Environ. Res. Public Health 2022, 19, 14332. [Google Scholar] [CrossRef] [PubMed]
  20. Lee, Y.-K.; Kim, Y.I.; Lee, W.-S. Development of CO2 Concentration Prediction Tool for Improving Office Indoor Air Quality Considering Economic Cost. Energies 2022, 15, 3232. [Google Scholar] [CrossRef]
  21. Kaushik, A.; Arif, M.; Tumula, P.; Ebohon, O.J. Effect of thermal comfort on occupant productivity in office buildings: Response surface analysis. Build. Environ. 2020, 180, 107021. [Google Scholar] [CrossRef]
  22. Nematchoua, M.K.; Ricciardi, P.; Orosa, J.A.; Asadi, S.; Choudhary, R. Influence of indoor environmental quality on the self-estimated performance of office workers in the tropical wet and hot climate of Cameroon. J. Build. Eng. 2019, 21, 141148. [Google Scholar] [CrossRef]
  23. Li, Y.; Li, S.; Gao, W.; Xu, W.; Xu, Y.; Wang, J. Exploring the effects of indoor temperature on college students’ physiological responses, cognitive performance and a concentration index derived from EEG signals. Dev. Built Environ. 2022, 12, 100095. [Google Scholar] [CrossRef]
  24. Wu, J.; Hou, Z.; Shen, J.; Lian, Z. Quantitative effect on work performance considering interactions among multiple indoor environmental factors. Build. Environ. 2020, 185, 107286. [Google Scholar] [CrossRef]
  25. Liu, C.; Zhang, Y.; Sun, L.; Gao, W.; Jing, W.; Ye, W. Influence of indoor air temperature and relative humidity on learning performance of undergraduates. Case Stud. Therm. Eng. 2021, 28, 101458. [Google Scholar] [CrossRef]
  26. Kükrer, E.; Eskin, N. Effect of design and operational strategies on thermal comfort and productivity in a multipurpose school building. J. Build. Eng. 2021, 44, 102697. [Google Scholar] [CrossRef]
  27. He, Y.; Chen, W.; Wang, Z.; Zhang, H. Review of fan-use rates in field studies and their effects on thermal comfort, energy conservation, and human productivity. Energy Build. 2019, 194, 140–162. [Google Scholar] [CrossRef]
  28. Porras-Salazar, J.A.; Schiavon, S.; Wargocki, P.; Cheung, T.; Wai Tham, K. Meta-analysis of 35 studies examining the effect of indoor temperature on office work performance. Build. Environ. 2021, 203, 108037. [Google Scholar] [CrossRef]
  29. Bueno, A.M.; de Paula Xavier, A.A.; Broday, E.E. Evaluating the Connection between Thermal Comfort and Productivity in Buildings: A Systematic Literature Review. Buildings 2021, 11, 244. [Google Scholar] [CrossRef]
  30. Ghita, M.; Cajo Diaz, R.A.; Birs, I.R.; Copot, D.; Ionescu, C.M. Ergonomic and Economic Office Light Level Control. Energies 2022, 15, 734. [Google Scholar] [CrossRef]
  31. Liu, Q.; Han, X.; Yan, Y.; Ren, J. A Parametric Design Method for the Lighting Environment of a Library Building Based on Building Performance Evaluation. Energies 2023, 16, 832. [Google Scholar] [CrossRef]
  32. Ricciardi, P.; Buratti, C. Environmental quality of university classrooms: Subjective and objective evaluation of the thermal, acoustic, and lighting comfort conditions. Build. Environ. 2018, 127, 23–36. [Google Scholar] [CrossRef]
  33. Vasquez, N.G.; Amorim, C.N.D.; Matusiak, B.; Kanno, J.; Sokol, N.; Martyniuk-Peczek, J.; Sibilio, S.; Scorpio, M.; Koga, Y. Lighting conditions in home office and occupant’s perception: Exploring drivers of satisfaction. Energy Build. 2022, 261, 111977. [Google Scholar] [CrossRef]
  34. Hyun Kim, D.; Mansfield, K.P. A cross-cultural study on perceived lighting quality and occupants’ well-being between UK and South Korea. Energy Build. 2016, 119, 211–217. [Google Scholar] [CrossRef]
  35. EN 12464-1:2012; Light and Lighting—Lighting of Workplaces—Part 1: Indoor Workplace. CEN: Brussels, Belgium, 2012.
  36. ANS A11.1-1965, R1970; Practice for Industrial Lighting, for Recommended Values of Illumination. Occupational Safety and Health Administration: Washington, DC, USA, 1965.
  37. Idkhan, A.M.; Baharuddin, F.R. Comfort Temperature and Lighting Intensity: Ergonomics of Laboratory Room Machine Tools. Int. J. Environ. Eng. Educ. 2019, 1, 53–58. [Google Scholar] [CrossRef]
  38. Kussmaul, J.; Peri, K.; Boyd, M. Workplace environment for nurses and healthcare assistants in residential aged care facilities in New Zealand. Aust. J. Adv. Nurs. 2019, 36, 6–17. [Google Scholar]
  39. Jazizadeh, F.; Marin, F.M.; Becerik-Gerber, B. A thermal preference scale for personalized comfort profile identification via participatory sensing. Build. Environ. 2013, 68, 140–149. [Google Scholar] [CrossRef]
  40. Dianat, I.; Vahedi, A.; Dehnavi, S. Association between objective and subjective assessments of environmental ergonomic factors in manufacturing plants. Int. J. Ind. Ergon. 2016, 54, 26–31. [Google Scholar] [CrossRef]
  41. Leifer, D. Intelligent Buildings: A Definition. Arch. Aust. 1988, 77, 200–202. [Google Scholar]
  42. Kubba, S. Handbook of Green Building Design, and Construction; Elsevier Inc.: Amsterdam, The Netherlands, 2012. [Google Scholar]
  43. Robathan, P. Intelligent Building Guide; L.B. Group: Stockton-on-Tees, UK, 1989. [Google Scholar]
  44. Omar, O. Intelligent building, definitions, factors and evaluation criteria of selection. Alex. Eng. J. 2018, 57, 2903–2910. [Google Scholar] [CrossRef]
  45. Niezabitowska, E. (Ed.) Budynek Inteligentny, Potrzeby Użytkownika, a Standard Budynku Inteligentnego; Wydawnictwo Politechniki Śląskiej: Gliwice, Poland, 2005; Volume 1. [Google Scholar]
  46. Colton, M.D.; MacNaughton, P.; Vallarino, J.; Kane, J.; Bennett-Fripp, M.; Spengler, J.D.; Adamkiewicz, G. Indoor Air Quality in Green vs Conventional Multifamily Low-Income Housing. Environ. Sci. Technol. 2014, 48, 7833–7841. [Google Scholar] [CrossRef] [PubMed]
  47. Gou, Z.; Siu-Yu Lau, S.; Zhang, Z. A comparison of indoor environmental satisfaction between two green buildings and a conventional building in China. J. Green Build. 2012, 7, 89–104. [Google Scholar] [CrossRef]
  48. Sinopoli, J. How Do Smart Buildings Make a Building Green? 2007. Available online: https://www.cisco.com/c/dam/global/en_ph/assets/pdf/smart_buildings_green.pdf (accessed on 2 September 2023).
  49. Bourikas, L.; Gauthier, S.; En, N.K.S.; Xiong, P. Effect of thermal, acoustic and air quality perception interactions on the comfort and satisfaction of people in office buildings. Energies 2021, 14, 333. [Google Scholar] [CrossRef]
  50. Halhoul Merabet, G.; Essaaidi, M.; Ben Haddou, M.; Qolomany, B.; Qadir, J.; Anan, M.; Al-Fuqaha, A.; Abid, M.R.; Benhaddou, D. Intelligent building control systems for thermal comfort and energy-efficiency: A systematic review of artificial intelligence-assisted techniques. Renew. Sustain. Energy Rev. 2021, 144, 110969. [Google Scholar] [CrossRef]
  51. Available online: www.testo.com (accessed on 10 July 2023).
  52. EN 15251; Indoor Environmental Input Parameters for Design and Assessment of Energy Performance of Buildings Addressing Indoor Air Quality, Thermal Environment, Lighting and Acoustics. CEN: Brussels, Belgium, 2007.
  53. ISO 28802:2012; Ergonomics of the Physical Environment—Assessment of Environments by Means of an Environmental Survey Involving Physical Measurements of the Environment and Subjective Responses of People. European Committee for Standardization: Brussels, Belgium, 2012.
  54. Singh, M.K.; Kumar, S.; Ooka, R.; Rijal, H.B.; Gupta, G.; Kumar, A. Status of thermal comfort in naturally ventilated classrooms during the summer season in the composite climate of India. Build. Environ. 2018, 128, 287–304. [Google Scholar] [CrossRef]
  55. Nematchoua, M.K.; Tchinda, R.; Orosa, J.A. Thermal comfort and energy consumption in modern versus traditional buildings in Cameroon: A questionnaire-based statistical study. Appl. Energy 2014, 114, 687–699. [Google Scholar] [CrossRef]
  56. Indraganti, M.; Ooka, R.; Rijal, H.B. Thermal comfort in offices in India: Behavioral adaptation and the effect of age and gender. Energy Build. 2015, 103, 284–295. [Google Scholar] [CrossRef]
  57. Soto Munoz, J.; Trebilcock Kelly, M.; Flores-Ales, V.; Caamano-Carrillo, C. Recognizing the effect of the thermal environment on self-perceived productivity in offices: A structural equation modeling perspective. Build. Environ. 2022, 210, 108696. [Google Scholar] [CrossRef]
  58. Balocco, C.; Calzolari, R. Natural light design for an ancient building: A case study. J. Cult. Herit. 2008, 9, 172–178. [Google Scholar] [CrossRef]
  59. Dębska, L.; Honus, S.; Krawczyk, N.; Orman, Ł.J.; Piotrowski, J.Z. Thermal Comfort Analysis in the Smart Sustainable Building with Correlation Development. Rocz. Ochr. Sr. 2023, 25, 116–127. [Google Scholar] [CrossRef]
  60. Majewski, G.; Orman, Ł.J.; Telejko, M.; Radek, N.; Pietraszek, J.; Dudek, A. Assessment of Thermal Comfort in the Intelligent Buildings in View of Providing High Quality Indoor Environment. Energies 2020, 13, 1973. [Google Scholar] [CrossRef]
Figure 1. Intelligent building “Energis”—Western façade.
Energies 16 06663 g001
Figure 2. Traditional building “A”—Western façade.
Energies 16 06663 g002
Figure 3. The micro-climate meter with the probes: (a) in the intelligent building; (b) in the traditional building.
Energies 16 06663 g003
Figure 4. Example variations in the values of air temperature, relative humidity, and CO2 concentration (winter conditions), together with measurement error bands: (a) traditional building; (b) intelligent building.
Energies 16 06663 g004
Figure 5. Air temperature, relative humidity, and CO2 level in the “Energis” (1) and traditional buildings (2).
Energies 16 06663 g005
Figure 6. Distribution of General Sensation Votes in the “Energis” (1) and traditional buildings (2).
Energies 16 06663 g006
Figure 7. Air quality assessment in the “Energis” (1) and traditional buildings (2).
Energies 16 06663 g007
Figure 8. Relation between mean Indoor Air Quality Vote responses in room and CO2 concentration—data for 67 rooms in “Energis” (1) and for 25 rooms in the traditional buildings (2); black line: linear fit.
Energies 16 06663 g008
Figure 9. Relation between mean General Sensation Vote responses and mean Indoor Air Quality Vote responses for each room—data for 67 rooms in “Energis” (1) and for 25 rooms in the traditional buildings (2); the black line: linear fit.
Energies 16 06663 g009
Figure 10. Assessment of light intensity conditions in the “Energis” (1) and traditional buildings (2).
Energies 16 06663 g010
Figure 11. Relation between mean Light Intensity Assessment in each room and illuminance—data for “Energis” (1) and the traditional buildings (2)—limited to 1100 lux; black line: Lorentz fit.
Energies 16 06663 g011
Figure 12. Mean General Sensation Vote vs. mean Light Intensity Assessment for each room—data for 67 rooms in “Energis” (1) and for 25 rooms in the traditional buildings (2); green box: the area of GSV > 0 and −0.25 < LIA < +0.25.
Energies 16 06663 g012
Figure 13. Self-reported productivity in the “Energis” (1) and traditional buildings (2).
Energies 16 06663 g013
Figure 14. Mean self-reported productivity vs. mean General Sensation Vote for each room—data for 67 rooms in “Energis” (1) and for 25 rooms in the traditional buildings (2); black line: linear fit.
Energies 16 06663 g014
Figure 15. Mean self-reported productivity vs. air temperature for each room—data for 67 rooms in “Energis” (1) and for 25 rooms in the traditional buildings (2); black line: polynomial fit, green box: area of highest productivity values.
Energies 16 06663 g015
Figure 16. Mean self-reported productivity vs. relative humidity and air temperature for each room—data for 67 rooms in “Energis” (1) and for 25 rooms in the traditional buildings (2).
Energies 16 06663 g016
Figure 17. Mean self-reported productivity vs. illuminance for each room—data for 67 rooms in “Energis” (1) and for 25 rooms in the traditional buildings (2); black line: polynomial fit, green box: area of highest productivity values; illuminance range up to 1600 lux.
Energies 16 06663 g017
Figure 18. Mean self-reported productivity vs. past activity level (PAL)—data for 67 rooms in “Energis” (1) and for 25 rooms in the traditional buildings (2); black line: linear fit.
Energies 16 06663 g018
Table 1. Details of the microclimate meter (according to the manufacturer’s data [51]).
NoParameterMeasuring RangeMeasuring Accuracy
1Air temperature−20–70 °C±0.3 °C
2Relative humidity0–100%±0.6+0.7% of the value
3Globe temperature0–120 °C±1.5 °C
4CO2 level0–10,000 ppm±50 ppm+3% of the value
5Illuminance 0–100,000 lux6%
6Ambient pressure700–1100 hPa±3 hPa
Table 2. Data of the respondents.
ParameterIntelligent
Building
Traditional
Buildings
Number of women/men, -399/491241/171
Age, y.o.
(range, mean value/standard deviat.)
18–58
21.8/2.57
19–65
23.5/5.4
Height, m
(range, mean value/standard deviat.)
150–198
174.3/10.3
150–200
172.3/9.4
Weight, kg
(range, mean value/standard deviat.)
42–115
71.4/14.9
41–121
69.8/15.6
BMI, kg/m2
(range, mean value/standard deviat.)
15.1–37.6
23.3/3.5
16.2–39.3
23.4/3.8
Clothes’ thermal resistance, clo
(range, mean value/standard deviat.)
0.31–1.36
0.61/0.16
0.30–1.40
0.53/0.17
Disclaimer/Publisher’s Note: The statements, opinions and data contained in all publications are solely those of the individual author(s) and contributor(s) and not of MDPI and/or the editor(s). MDPI and/or the editor(s) disclaim responsibility for any injury to people or property resulting from any ideas, methods, instructions or products referred to in the content.

