
Derating of Squirrel-Cage Induction Motors Due to High Harmonics in Supply Voltage


Faculty of Electrical Engineering, Automatics, Computer Science and Biomedical Engineering, AGH University of Krakow, 30-059 Kraków, Poland
Energies 2023, 16(18), 6604; https://doi.org/10.3390/en16186604
Submission received: 12 July 2023
/
Revised: 17 August 2023
/
Accepted: 11 September 2023
/
Published: 13 September 2023
(This article belongs to the Special Issue Advances in Electrical Machines Design and Control)
Abstract
:This paper presents the results of load capacity calculations for three-phase squirrel-cage induction motors supplied with distorted voltage with rotating harmonics. The calculations were made on the basis of a commonly used model of an induction machine. The difference from many papers is that the parameters of the equivalent circuit of each motor were precisely determined in terms of power losses in the motor. The load capacity of the motors was made dependent on the load power losses in the rotor cage. These losses were determined on the basis of short-circuit measurements of motors, made for frequencies equal to harmonic frequencies. Measurements and calculations were made for low-voltage squirrel-cage motors with rated powers of 4–65 kW and various efficiency classes. Calculations have shown that the calculated derating curves do not match the curves given in IEC 60034-17 and NEMA MG1. The differences are up to 15% for IE1 and IE2 motors and more than 50% for IE3 motors.
1. Introduction
Feeding a three-phase induction squirrel-cage motor with non-sinusoidal voltage causes many disturbances in its operation. The most important of them is an increase in power losses in the motor, both stator and rotor, and generating alternating torques. Alternating torques can cause oscillations in the motor speed, causing additional frequencies in the stator currents and additional losses. Speed oscillations appear when the motor is supplied with a voltage containing sub-harmonics or inter-harmonics [1,2], which is not the subject of this paper. This paper concerns powering the motor with voltage containing only rotating harmonics, i.e., harmonics No. h = 1, 5, 7, 11, 13, 17, 19… This makes it necessary to reduce the motor load capacity.
The fundamental paper on powering the motor with distorted voltage is paper [3]. It probably became the basis for determining the load curves in [4,5]. They are very similar to the curve resulting from the calculations in the paper [3]. The paper presents considerations leading to determining the thermally admissible load power of the squirrel-cage induction motor supplied with non-sinusoidal voltage. This non-sinusoidality is such that the voltage contains only rotating harmonics, i.e., harmonics No. h = 1, 5, 7, 11, 13, …. Motor load power losses from higher rotating harmonics (h ≥ 5) were expressed as a function of a defined Harmonic Voltage Factor (HVF). Based on this expression, the expression for the thermally admissible load power as a function of HVF was derived (as in Appendix A [2]). Based on multiple motor measurements, the powers equal to 0.6 and 0.8 of the rising short-circuit resistance and short-circuit reactance of the motor with the voltage supply frequency were determined. A final form of HVF expression was determined by these powers. The expression for the HVF is present in the standards [4,5] and is the basis for determining the curve of the Derating Factor (DF) as a function of HVF.
This topic is often associated with the problem of the operation of a squirrel-cage motor supplied with unbalanced voltage [6,7,8]. In general, authors have based their work on the classical model of the induction machine, and their studies concern the steady state of the motor. This enables the use of a model in the form of equivalent circuits for individual rotating harmonics of the motor voltage supply [9]. Most of the papers used the HVF coefficient to evaluate the load capacity of motors, but some other coefficients were proposed [10,11]. In some papers, the electromagnetic motor model was combined with its thermal model [12]. Very accurate measurements of temperatures and heat dissipation of the motor powered by distorted voltage were also made [11], even with the use of a calorimetric chamber [13,14]. The authors of some papers [8] drew attention to the reduced load capacity of premium-efficiency and super-premium-efficiency motors (IE3, IE4), compared to standards [4,5]. The authors of [8] wrote that “This article suggests that (1) IM losses due to voltage unbalance and harmonic distortion are greater in higher efficiency class IMs, and (2) that derating factors defined in standards are not enough to avoid overload on higher efficiency class IMs.” The disadvantage of many papers [8,11,13,15,16] is based on the results of measurements of small squirrel-cage motors, i.e., with a rated power of a few kW. Such motors have unusual values of model parameters, mainly high stator phase resistance and high short-circuit reactance. Their thermal overloads do not have much practical significance as high-power motors, due to better heat dissipation conditions. In almost all papers, the additivity of power losses in the motor from individual power supply harmonics was assumed. Some papers negated this assumption, pointing to the global and local saturation of the magnetic circuit of the machine as the reason for the non-additivity of power losses in the motor [15]. The literature gives many formulas for determining the variation in the short-circuit resistance and inductance of an induction motor with the frequency of its voltage supply. In particular, many formulas and methods in [17] were collected. They are from IEEE Harmonics Task Force Model 2003, IEEE Std. 399 Generic Method, IEEE Std. 399 Induction Motor Equivalent Circuit Method, and the papers [3,18]. Unfortunately, the differences between the short-circuit resistance and reactance values from these formulas are significant. It follows that the correct calculation of the variation in the short-circuit active and reactive power of the motor with the frequency of its currents is a serious problem. In [16], the authors observed an increase in the first harmonic active power when the motor was supplied by non-sinusoidal voltage. This interesting effect is not discussed further in this paper. The paper concerns the problems of accurate measurement of the power and efficiency of motors with non-sinusoidal power supply.
As this review shows, the standard [4,5] DF(HVF) curves are questioned [8,12,17]. The HVF formula is also questioned [12]. From this it follows that only one curve DF(HVF) for all induction motors all over the world may not exist at all, due to the different designs, number of poles, size, cooling, efficiency class, and operating duty of the motors. It should be noted that there is no worldwide consensus on which electromagnetic model with lumped parameters of an induction machine is appropriate for a non-sinusoidal supply. The assumption about the additivity of power losses in the machine, from individual harmonics of the distorted supply voltage, may raise doubts, too.
In the paper [2], a new method of determining the load capacity of three-phase squirrel-cage induction motors supplied by a voltage containing higher rotating harmonics was applied. The thermally permissible load capacity of the motor was made dependent on the power losses in the rotor cage. These losses were determined on the basis of short-circuit measurements of the motor, performed for frequencies equal to harmonic frequencies. The calculations were made using a commonly used induction machine model. These calculations concerned a low-voltage IE3 squirrel-cage motor with a rated power of 22 kW and a synchronous speed of 1500 rpm. The calculations yielded power derating curves significantly different from those given in the IEC 60034-17 [4] and NEMA MG1 [5] standards.
This paper contains a continuation of the calculations presented in the paper [2]. The analyses presented in this paper aim to determine the theoretical curves of the power load capacity of squirrel-cage motors supplied with distorted voltage, based on the most commonly used model of an induction machine. This is to be the starting point for the subsequent verification of both the load capacity curves given in the standards [4,5] and the suitability of the commonly used induction machine model for determining such curves. The need to verify the standard curves primarily results from the emergence of various efficiency classes of S1 squirrel-cage motors, which did not exist at the time of the creation of the curves present in the standards. However, the differences between the theoretical curves and the curves given in the standards may indicate both the inaccuracy of the standards and the inaccuracy of the induction machine model used for the calculations. This model is very old [19]. When it was created, the supply of the motor with distorted voltage was not taken into account. This model is based on simplifying assumptions. The model assumes the linearity of the magnetization of the magnetic circuits of the machine, the absence of eddy currents in the core, the smoothness of the air gap, the sinusoidal variation in the mutual inductances between the stator phases and the rotor phases with the position of the rotor, and the constancy of the self-inductances of the stator and rotor phases. Therefore, the question arises whether this model is appropriate for the calculations of the motor supplied with distorted voltage. In this sense, it can be said that the calculations presented in the paper are an introduction to the verification of the suitability of the commonly used induction machine model for determining the thermally admissible load capacity of squirrel-cage motors supplied with distorted voltage with rotating harmonics. Measurement verification of the calculated load curves will be the subject of further work.
2. Materials and Methods
The research of the thermally admissible mechanical power load capacity of squirrel-cage motors supplied with distorted voltage was carried out for five squirrel-cage motors, and the data are given in Table 1. The calculation research was carried out for each motor supplied with balanced distorted voltage, containing only the 5th harmonic, with the phase RMS value varying in the range from us5 = 0 to us5 = 0.25 of the motor-rated phase voltage UsN. The calculations were limited to the presence of only the 5th harmonic in the voltage for two reasons. First, it is the lowest-numbered rotating harmonic, and therefore the one with the greatest effect on the motor. Secondly, motor load curves are presented as HVF or HLF [2] functions and the values of these factors do not depend on the harmonic number. The RMS value of the fundamental harmonic was equal to the rated voltage of the motor (Us1 = UsN). The obtained curves DF(us5) were confronted with the standard curves [4,5]. These standards contain DF(HVF) curves, and therefore, the value of the HVF was converted into the values of the 5th harmonic.
2.1. Model of the Motor and Its Power Losses
A classical model of a three-phase induction machine in steady states was used for the calculations (Figure 1). The skin effect in the rotor cage bars was modeled in this circuit by changing the rotor resistance and rotor leakage inductance with the frequency of the rotor current. The skin effect in the stator winding was modeled by changing the stator resistance and stator leakage inductance with the frequency of the voltage supply. As in [3,9,12] and according to the conclusions presented in [20], it was assumed that the increase in the temperature of the motor windings is caused by the currents of these windings only, i.e., load power losses in the motor, both basic and additional. It was assumed that the mean electromagnetic torque of the motor comes from the fundamental harmonic of the motor supply voltage only. This is due to the very high speeds of the rotating magnetic fields from the higher rotating harmonics of the motor power supply.
The identification of motor equivalent circuit parameters for the fundamental harmonic (h = 1) was performed as in paper [2], based on Formulas (8)–(16) and (18)–(20). Identification is based on the motor ratings, its no-load characteristics, and the measured short-circuit impedance of the motor for the rated frequency. The identification did not use well-known simplifications, e.g., the assumption that 100% of the voltage supplying the equivalent circuit is on the transverse branch of the equivalent circuit, or that the total no-load current of the motor is the magnetizing current, or that the mechanical losses of the motor can be neglected in its power balance. Only one simplification was used: stator leakage reactance was assumed to be half of the measured short-circuit reactance of the motor. The identification results were verified by calculating the rated values of the motor based on the equivalent circuit: total motor power losses, stator current, and power factor (Table 2). Stator resistance DC values are given for comparison purposes. They are not identical to the resistance values derived from the identification process. These differences result from the uncertainty of the machine model. If the steady-state model perfectly represented the machine, then these differences should be much lower. They would only result from the difference in frequency (AC 50 Hz in rated state vs. DC for measuring resistance).
The admissible mechanical power of each motor was determined based on the expressions [2]:
where us1 = Us1/UsN, Us1—RMS value of the first harmonic of phase voltage of the motor, TN—rated torque of the motor, ω1—pulsation of the first harmonic of the motor supply, ΔPCur1der—thermally admissible load power losses in the rotor cage for the first harmonic of the motor voltage supply, ΔPCurN—rated power losses in the rotor cage, ΔPCurh—power losses in the rotor cage from h harmonic.
Expression (1) was derived in [2] with the assumption that the thermally admissible electromagnetic torque of the motor depends on the thermally admissible power losses in the rotor cage from the fundamental harmonic of the motor supply ΔPCur1der. According to (2), these losses are equal to the rated power losses in the rotor cage, reduced by the sum of losses in the rotor cage from all higher rotating harmonics of the motor power supply (h = 5, 7, 11, 13, …). It was therefore assumed that the load power losses in the rotor cage could not exceed their rated value. This assumption can be considered debatable. Rotor cage bars typically do not have insulation, which may lead to the conclusion that the rotor may be overloaded with currents or with temperature (in relation to the rated state values). There is no risk of thermal damage to the insulation. This conclusion was not accepted in the calculations for three reasons. First, however, some motors have rotor bar insulation [21]. Secondly, an overheated rotor (compared to its rated heating) can additionally heat the stator winding through an air gap that is very small in induction motors. Thirdly, heat dissipation from an overheated rotor is difficult because it is surrounded by a heated stator and does not have its own active cooling. The motor fan typically cools the stator only. It should be noted that with a deformed voltage, the total power losses in the rotor will be increased in relation to the losses of the rated state by the power losses in the rotor core, from higher harmonics of the stator supply voltage. If a constant volume of load losses in the rotor is maintained, the RMS value of the stator current will be lower than that resulting from the admissible temperature of the stator winding. However, the general assumption was made that no part of the motor could overheat. This assumption may be considered too conservative, but such a conservative approach makes engineering sense.
It was assumed that all power losses in the rotor from higher rotating harmonics are converted into heat in the rotor cage, heating it directly. This is not true because some of these losses are converted to heat in the rotor core by eddy currents. As estimated in [2], this assumption is the source of errors in determining the power dissipated in the rotor cage, not exceeding 10%. This assumption underestimates the admissible load power of the motor Pemder, which, from an engineering point of view, is a safer procedure than overestimating the admissible power.
It was also assumed that the power losses from individual harmonics of the motor supply, both in the stator and in the rotor, were additive. This is an assumption resulting from the machine model. The total power losses in the motor from higher rotating harmonics were determined experimentally, by measuring the short-circuit power of the stopped motor for supply frequencies equal to harmonic frequencies (250, 350, 550, 650 Hz, …). The short-circuit measurements also provided information on the variability of the short-circuit reactance of the motor with the frequency of the stator current. It has been assumed that the rotor resistance at the steady state of the motor (s ≈ sN) for each supply harmonic is the same as the resistance measured in the short-circuit state of the machine, with the stator current at the frequency of the rotor current at the steady state of the motor (h·f1 +/− (1 − s)·f1) and with an RMS value equal to the rated stator current. This assumption results from the machine model. According to this model, for higher rotating harmonics of the supply voltage (h ≥ 5), the machine rotating at the sub-synchronous speed is in a short-circuit state. In other words, the rotor resistance was assumed to be a function of the frequency of the cage currents only. It does not depend on whether the rotor rotates or not. On the basis of this assumption, it is possible to calculate the power losses in the rotor, coming from higher harmonics of the motor power supply, using the short-circuit measurement values of the rotor resistance.
Unfortunately, it is not possible to divide the measured short-circuit powers into the power losses in the stator and the power losses in the rotor. This is due to the different variations in these losses with the frequency in the stator and in the rotor—the resistance of the stator phases and the equivalent resistance of the rotor change with the frequency of the stator currents in different ways. Therefore, this division, necessary to determine the power losses in the rotor and its resistance for each harmonic, was made according to three alternative models of the dependence of these losses on the frequency of the stator current. These models cover the full range of possible variants of the stator resistance Rsh and equivalent rotor resistance Rrh′ with the stator supply frequency: from the assumption that the stator resistance is constant for all harmonics (Rsh = Rs1), to the assumption that the stator resistance and rotor resistance vary with the frequency in the same way. In many papers, it is assumed that Rsh = Rs1 [3,9,22], although it is not a rule [8,10]. This assumption seems to be close to reality because the skin effect is much stronger in the cage bars than in the typical stator winding. However, three different models of variability in the stator and rotor resistance with frequency were examined in the paper in order to check how the models affect the calculation curves of motor load capacity. In addition to the model assuming constant stator resistance, two others were investigated. In the first one, it was assumed that the variation in the rotor resistance with frequency is determined by its two values: for the frequency f1 (Rr1′ from short-circuit measurements) and for the frequency sN·f1 (RrN′ from the identification of the machine model parameters). This assumption determines the variation in stator resistance with frequency. This model directly follows the induction machine model. In the second model, it was assumed that the stator resistance varies with frequency the same as it does with the rotor resistance. This model was taken into account as an extreme situation, practically non-existent. Hypothetically, this could be the case in a round-bar cage rotor.
Based on the results of the short-circuit measurements of the tested motors for harmonic frequencies of the supply voltage [23], it was assumed that the variability of the short-circuit resistance and reactance of a motor with the frequency short-circuit current can be approximated as follows [2,23]:
where Rk1—motor short-circuit resistance measured at frequency f1 = fN; Rkh—motor short-circuit resistance measured at frequency fh = h·f1; Xk1—motor short-circuit reactance measured at frequency f1; Xkh—motor short-circuit reactance measured at frequency fh = h·f1; a, x, y—coefficient and exponents determined during approximation.
The variation in stator phase resistance and the variation in the resistance of the equivalent rotor phase with a frequency of voltage supply of the motor were determined in three alternative models [2]:
- In model 1, it was assumed that the stator and rotor resistance change with frequency as in the expression (3) and with the same power of x, but with different coefficients:
The power of x is obtained from the approximation (3). The value of Rr1′ is obtained from short-circuit measurement: Rr1′ = Rk1 − Rs1. The values of rated stator and rotor resistance Rs1 and RrN′ are obtained from identification. The value of the rotor resistance RrN′ is its value at the nominal slip of the motor, i.e., for the frequency of the rotor currents equal to sN·f1. Obtaining the rotor resistance value for this frequency from the short-circuit measurements of the motor would require supplying the stopped motor with the voltage of the frequency sN·f1. Therefore, for this stator supply frequency, the number h < 1 is informally used: h = sN. This allowed us to determine the values of coefficients as (for stator) and ar (for rotor):
- 2.
- In model 2, it was assumed that the stator and rotor resistance change with frequency as in the expression (3) and with the same power of x and coefficient a:
Model 2 is “optimistic”, i.e., it underestimates the load power losses in the rotor cage. These losses can be considered underestimated because it is unlikely for the stator resistance value to increase with frequency as fast as the rotor resistance value. The skin effect in the cage bars is much more intense than in the stator winding wires. Model 2 overestimates the value of the rotor resistance in the rated state RrN’. However, this does not affect its practical usefulness, because it is used to represent the stator and rotor resistance values for higher frequencies—harmonics 5, 7, 11, 13, …
- 3.
- In model 3, it was assumed that the stator resistance is constant, and the rotor resistance changes with frequency as in the expression (3) and with the same power of x:
This allowed us to determine the value of coefficient ar′ for the rotor:
Model 3 is “pessimistic”, i.e., it overestimates the load power losses in the rotor cage. These losses can be considered overestimated because it is unlikely for the stator resistance value not to increase with frequency. Model 3 underestimates the value of the rotor resistance in the rated state RrN′. However, this does not affect its practical usefulness, because it is used to represent the stator and rotor resistance values for higher frequencies—harmonics 5, 7, 11, 13, …
2.2. Measurements
Short-circuit measurements of the stopped motor were made for the frequencies of the three-phase sinusoidal voltage equal to harmonic frequencies, i.e., 50, 250, 350, 550, 650, 850, 950, 1150, 1250, 1450 Hz (h = 1, 5, 7, 11, 13, 17, 19, 23, 25, 29) [23]. The RMS value of the short-circuit current was equal to the rated current of the motor. Short-circuit measurements were carried out at the rated current for different supply frequencies to ensure the same saturation level of the magnetic paths for the stator winding and rotor cage leakage fluxes. This ensures that the short-circuit reactance variation is determined by frequency only (not by RMS current). To power the motor and to measure its voltages, currents, and powers, the Chroma 61512 programmable inverter was used. It is a special inverter for experimental and scientific purposes, whose output voltages are purely sinusoidal, i.e., without PWM effects. It is not an inverter commercially designed to power induction motors. The inverter measures the RMS voltage, RMS current, and active power of the motor by recording waveforms of phase voltages and currents. On this basis, it determines the RMS values of phase voltages and currents as well as the value of the active power.
Unfortunately, for the highest frequencies, the inverter was not able to give the voltage RMS value required to obtain the rated motor current. For the 65 kW motor, it was not possible to obtain its rated current of 132 A at all. The limit of the output phase voltage of the inverter is 300 V RMS (in wye connection), and the limit of the output phase current is 48 A RMS. In cases where it was not possible to obtain the rated motor current, the measurement results for lower currents were converted to the level of rated current. Short-circuit powers were converted with the square of the ratio of rated current to the measurement current, and the short-circuit voltages linearly with this ratio. The linearity of the conversion results from keeping the RMS value of the measuring currents limited to the value of the rated stator current. This guarantees the rated level of saturation of the magnetic circuits of the leakage fluxes. The unchanged saturation level of these magnetic circuits allows for a linear conversion of the RMS value of the voltage with the RMS value of the current.
The value of power losses in the rotor cage from higher harmonics, needed for the calculation of the admissible motor power according to (1) and (2), was calculated according to the expression [2]:
where Rrh′—rotor cage resistance for harmonic h ≥ 5, calculated by estimation expressions (5) or (8) or (9), for rotor current frequency at sub-synchronous motor speed (Rrh′ is for frequency: h·f1 +/− (1 − s)·f1), Rkh—measured short-circuit resistance of the motor for the stator frequency h·f1, Ukh—RMS value of the measuring short-circuit phase voltage of the stator with a frequency h·f1, Pkh—measured motor short-circuit power at a stator frequency h·f1, Ush—RMS value of the harmonic h of the phase stator supply voltage.
3. Results
3.1. Approximations of Motor Resistance and Reactance Changes with Harmonic Number
3.2. Derating Power under Non-Sinusoidal Fed Conditions
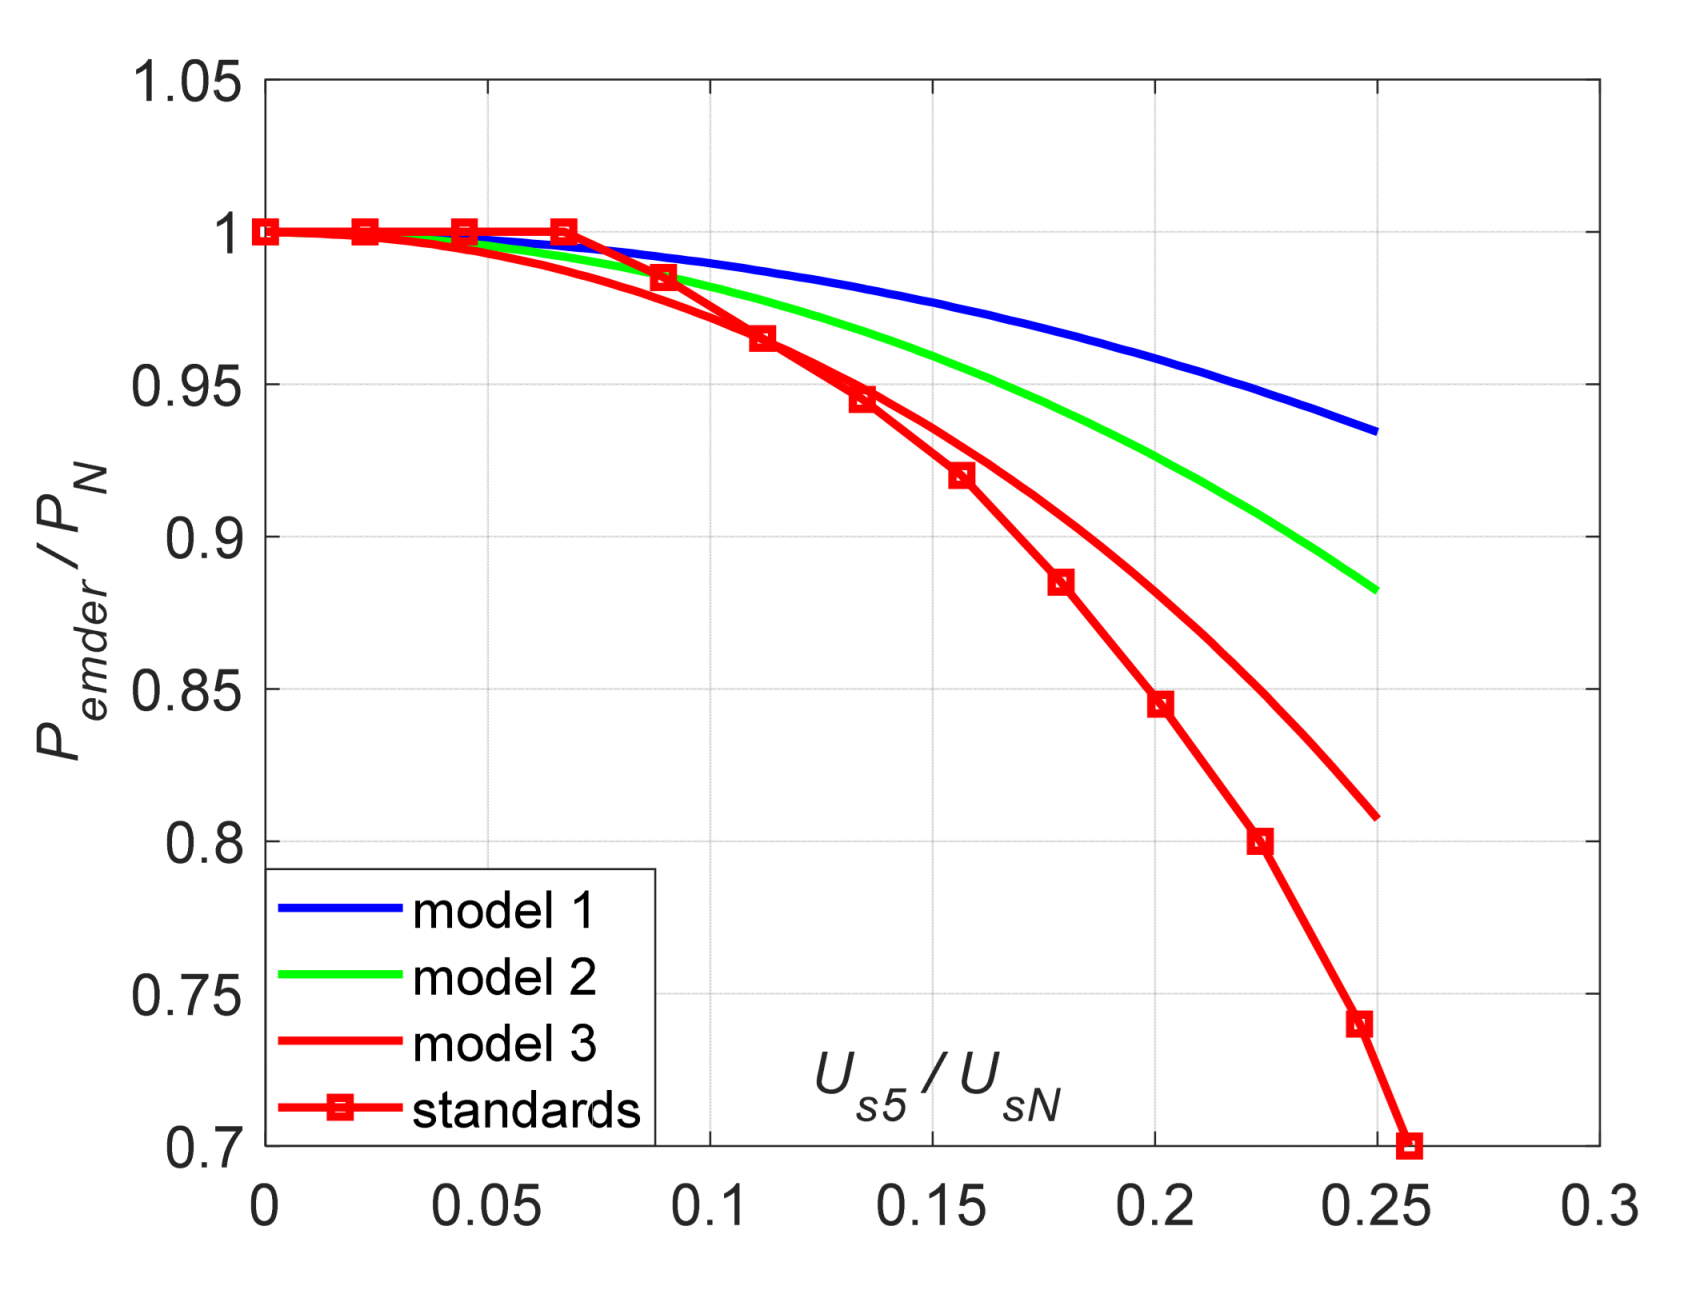
The results of derating factor calculations by expressions (1), (2), and (11) with estimated values of equivalent rotor cage resistance by expressions (5), (8), or (9) are presented in Figure 7, Figure 8, Figure 9, Figure 10 and Figure 11. These results apply to the supply of the motor with the voltage containing the fundamental harmonic (h = 1) with an RMS value equal to the motor’s rated voltage and harmonic No. 5 with an RMS value varying in the range from 0 to 25% of the motor’s rated voltage. The values considered characteristic of motors when they are supplied with a voltage containing 25% of the fifth harmonic are presented in Table 4.
4. Discussion
- In Table 2, the greatest differences are between the identified stator resistance values for the fundamental harmonic of the stator current (Rs1) and their values measured with the direct current (Rs1DC). These differences result from the identification procedure, in which the stator resistance is selected so that the calculated rated motor losses are equal to their catalog value. Therefore, the values of these approximated losses (ΔPNaprox) are identical to the catalog values (ΔPN). Except for the 65 kW motor, the identified stator resistance values are lower than values measured with the direct current and converted to a temperature of 75 °C, considered as a typically rated temperature of the stator windings. The impossibility of obtaining from the identification the resistance values equal to the measurement values seems to be a deficiency of the model of the induction machine and not the method of identifying the model parameters. The calculated RMS values of the rated current (INaprox) do not differ from the declared ones (IN) by more than 1.5%. The calculated rated power factors (cosϕNaprox) differ from the declared ones (cosϕN) to a greater extent, by a maximum of 2.3%. The highest errors in reproducing these two values are for the 22 kW motor. The parameters of the motor equivalent circuit obtained from the identification procedure are relatively strongly dependent on the rated speed of the motor. For example, if the catalog-rated speed of the motor is 1450 rpm (sN = 0.0333), and the actual rated speed (speed for rated torque load of the motor supplied with rated voltage) is 1440 rpm (sN = 0.04), then the error in determining the rated power losses in the rotor cage is 20%. This is also the error in determining the RrN’ parameter. This problem is especially true for older motors. In other words, the curves in Figure 7, Figure 8, Figure 9, Figure 10, Figure 11 and Figure 12 strongly depend on the rated speeds of the motors.
- 2.
- Table 3 presents the approximation coefficients of changes in the motor resistance and reactance values with the frequency (harmonic number h) of the motor supply voltage. For the two largest motors (22 kW, 65 kW), it can be seen that (a) the power x of the motor short-circuit resistance increase with frequency is practically equal to the value of 0.6, as assumed in [3], and (b) the values of the coefficients a, ar, ar′ are close. The assumption adopted in [3] about the invariance of the stator phase resistance as a function of frequency (as = 1) was confirmed for the 65 kW motor only. Negative values of as (model 1) and ar’ (model 3) for the 5.5 kW A motor result in the negative stator and rotor DC resistance. This does not affect the calculations based on the approximate variations in these resistances with frequency. However, this raises concerns about the accuracy of approximation Formulas (3), (5), (8), and (9). They were assumed not only in the power form, as for short-circuit reactance (4), to avoid the passus of zero approximated winding resistance for direct current. A significant weakness of these formulas is the arbitrary assumption that the stator resistance and the rotor resistance increase with the frequency with the same power of x.
- 3.
- There is no right mechanism to determine the variation in the stator and rotor resistance with frequency, based only on the results of short-circuit measurements of the motor. From an engineering point of view, model 1 cannot be considered reliable, because it determines the variation in the rotor resistance based on only two of its values: RrN′ and Rr1′, that is, for two relatively close rotor current frequencies: sN·fN and fN. An indirect confirmation of the limited reliability of the identification of model 1 parameters is the incorrect order of the calculation curves by models 1 and 2 in Figure 7, Figure 8 and Figure 9. This is the result of the values of the coefficient ar > a, which theoretically should not be the case. Model 2 is for illustrative purposes only—the assumption of the same variability of the stator and rotor resistances is speculative. Therefore, to calculate the DF value, model 3 should be taken, assuming that the variation in the short-circuit resistance with frequency is the effect of the variation in the rotor resistance only, with the stator resistance constant.
- 4.
- Table 3 shows that the power y of the motor short-circuit reactance increases with a frequency of 0.9–1.1 and decreases with increasing motor rated power. Thus, it is greater than the power of 0.8 given in [3], which was used to derive the expression for the HVF (the expression for HVF depends on the values of x and y). For the two largest motors, the y value is 0.92 and 0.933, and for others, it is greater. This suggests that the y value approaches 0.9 with the increasing rated power of the motor.
- 5.
- Table 4 shows that a 65 kW motor (IE1, 1957) compared to a 22 kW motor (IE3, 2021) has ~2 times the relative impedance for the fifth harmonic. Therefore, it has ~2 times less relative current of this harmonic, which would mean ~4 times fewer power losses in the rotor, if not for the fact that the relative resistance of the rotor for the fifth harmonic is ~2 times higher than that of the rotor of a 22 kW motor. Therefore, the relative losses from the fifth harmonic are only ~2 times lower in the 65 kW motor than in the 22 kW motor. They are one-third of the rated power losses in the rotor, but the power losses from the fifth harmonic in the rotor of a 22 kW motor exceed their rated value. The 22 kW motor, as a premium-efficiency motor, has relative rated power losses in the rotor 2 times lower than the 65 kW motor. In both motors, the estimated rotor resistance increases approximately 4 times for the fifth harmonic, in relation to its rated value.
- 6.
- The 22 kW motor as an IE3 motor has exceptionally low relative rated power losses in the rotor. Compared to all other motors, they are about 2 times lower (Table 4). Because it has a low short-circuit impedance for the fifth harmonic (also about 2 times lower than in other motors), it is particularly susceptible to the current flow of this harmonic. This current is about 2 times higher than in each of the other motors. Despite the smallest estimated relative resistance of the rotor for the fifth harmonic (1.5–1.75 times lower in relation to other motors), it causes such high power losses in the rotor from the fifth harmonic that they are greater than their rated value. For these reasons, the limitation of the load capacity of this motor in the case of a distorted power supply is the largest among all the tested motors (Figure 12). It is higher than the results from the standard curve, regardless of the adopted loss model (Figure 10). Low short-circuit reactance is typical for motors with high maximum torque (Tmax/TN > 3), i.e., premium-efficiency motors [24]. In the tested motor, the maximum torque is 3.4 of the rated torque.
- 7.
- The relative parameters of the 4 kW motor in Table 4 are close to the parameters of both 5.5 kW motors, especially motor B. Compared to it, the 4 kW motor has a 34% higher relative rotor resistance for the fifth harmonic. This results in higher power losses in the rotor from the fifth harmonic, by 12.7%. Nevertheless, the calculation load capacity of the 4 kW motor is also higher than the results from the standard curve.
- 8.
- The curves in Figure 7, Figure 8, Figure 9, Figure 10, Figure 11 and Figure 12 are presented as a function of the RMS value of the fifth harmonic of the motor supply voltage, related to the rated voltage of the motor. In the case of many harmonics in the supply voltage, the relative value of the sum of the rotor power losses from all higher harmonics should be used as the argument of the DF function. This relative value is the sum of the losses related to the rated motor power or related to the rated power losses in the rotor. This results from Formula (1):
According to the induction machine model, the sum of power losses in the rotor due to higher harmonics can be determined based on short-circuit measurements of the motor for different frequencies of its supply—Formula (11). Unknown rotor resistances for individual harmonics Rrh′ can be calculated according to model 3. Contrary to the HVF, the relative sum of rotor power losses due to higher harmonics depends not only on the harmonics of the supply voltage but also on the values characteristic of the specific motor: resistance and short-circuit reactance Rkh and Xkh, stator phase resistance for rated frequency Rs1, and coefficient ar′ from model 3. With the same content of higher harmonics in the motor supply voltage, the relative sum of the rotor power losses from these harmonics will be different for different motors. The curve according to Formula (12) is a function not only of this sum as an argument because it also depends on the parameters sN and us1. This is a different situation than for standard curves [4,5], which have no parameters, and with the same content of higher harmonics in the supply voltage, their argument (HVF) has the same value for all motors.
5. Conclusions
- The values of load power losses in the rotor due to higher rotating harmonics of the motor supply depend on the square of the RMS values of these harmonic currents. According to the model of the induction machine, RMS values of harmonic currents depend on the short-circuit impedances of the motor for these harmonics. These impedances mainly consist of short-circuit reactances. Short-circuit inductances are low in premium-efficiency motors (IE3), which is confirmed by high values of maximum torque of such motors. Therefore, premium-efficiency motors are especially exposed to currents of higher harmonics. For this reason, it can be expected that their DF curves will be below the standard curves [4,5].
- IE1 class motors show higher short-circuit reactances for higher motor supply harmonics than IE3 class motors. Lower values of the maximum torque of such motors confirm this thesis. Therefore, their higher harmonic currents are relatively lower than in premium-efficiency motors, so their relative power losses in the rotor from higher harmonics are lower than in premium-efficiency motors. For this reason, it can be expected that their DF curves will be above the standard curves.
- Based on conclusions 1 and 2, the suspicion arises that one curve cannot be drawn for all S1 squirrel-cage induction motors, regardless of their efficiency class. Perhaps it is possible to draw such curves for S1 motors of particular classes.
- The paper shows the non-compliance of the theoretical load capacity curves with the curves given in the standards. The reason for this inconsistency may be both on the side of the machine model and on the side of the standard curves. Solving this problem requires measurement studies of cage motors. It is absolutely necessary to measure the temperatures of the stator and rotor (in different places, according to the standard requirements), in order to verify the curves shown in Figure 7, Figure 8, Figure 9, Figure 10, Figure 11 and Figure 12. This will verify the correctness of the calculations using the model of the induction machine when the machine is supplied with voltage containing higher rotating harmonics. It is also necessary to determine the actual rated speed of the motor by measurement, i.e., the speed when the motor is loaded with the rated torque, when it is supplied with the rated voltage, in a thermally steady state.
Funding
This research was funded by AGH University of Krakow.
Conflicts of Interest
The author declares no conflict of interest.
References
- Drabek, T. Operation of an induction motor supplied by voltage containing subharmonics. Sci. Technol. Innov. 2017, 1, 27–34. [Google Scholar] [CrossRef]
- Drabek, T. Derating of squirrel-cage induction motor due to rotating harmonics in power voltage supply. Energies 2023, 16, 735. Available online: https://www.mdpi.com/1996-1073/16/2/735/pdf?version=1673172579 (accessed on 10 September 2023). [CrossRef]
- Cummings, P.G. Estimating the effect of system harmonics on losses and temperature rise of squirrel-cage motors. IEEE Trans. Ind. Appl. 1986, 6, 1121–1126. [Google Scholar] [CrossRef]
- IEC 60034-17; Rotating Electrical Machines—Part 17: Cage Induction Motors when Fed from Converters—Application Guide. International Electrotechnical Commission: London, UK, 2022.
- NEMA MG1; Motors and Generators. National Electrical Manufacturers Association: Rosslyn, VA, USA, 2019.
- Ferreira, F.J.T.E.; De Almeida, A.T.; Deprez, W.; Belmans, R.; Baoming, G. Impact of Steady-State Voltage Supply Anomalies onThree-Phase Squirrel-Cage Induction Motors. In Proceedings of the 2007 International Aegean Conference on Electrical Machines and Power Electronics, Bodrum, Turkey, 10–12 September 2007; pp. 1–9. [Google Scholar]
- De Lima, E.C.; De Carvalho Filho, J.M. Diagnosis of Induction Motors Operating UnderDistorted and Unbalanced Voltages. In Proceedings of the 17th International Conference on Harmonics and Quality of Power, Belo Horizonte, Brazil, 16–19 October 2016; pp. 786–791. [Google Scholar]
- Donolo, P.D.; Pezzani, C.M.; Bossio, G.R.; De Angelo, C.H.; Donolo, M.A. Derating of Induction Motors Due to Power Quality Issues Considering the Motor Efficiency Class. IEEE Trans. Ind. Appl. 2020, 56, 961–968. [Google Scholar] [CrossRef]
- Sen, P.K.; Landa, H.A. Derating of Induction Motors Due to Waveform Distortion. IEEE Trans. Ind. Appl. 1990, 26, 1102–1107. [Google Scholar] [CrossRef]
- Fuchs, E.F.; Roesler, D.J.; Kovacs, K.P. Aging of Electrical Appliances due to Harmonics of the Power System’s Voltage. IEEE Trans. Power Deliv. 1986, 3, 301–307. [Google Scholar] [CrossRef]
- Lee, C.-Y.; Lee, W.-J. Effects of Nonsinusoidal Voltage on the Operation Performance of a Three-phase Induction Motor. IEEE Trans. Energy Convers. 1999, 14, 193–201. [Google Scholar]
- De Abreu, J.P.G.; Emanuel, A.E. Induction motors loss of life due to voltage imbalance and harmonics: A preliminary study. In Proceedings of the Ninth International Conference on Harmonics and Quality of Power, Orlando, FL, USA, 1–4 October 2000; pp. 75–80. [Google Scholar]
- Jalilian, A.; Gosbell, V.J.; Perera, B.S.P. Performance of a 7.5 kW induction motor under harmonically distorted supply condition. In Proceedings of the Canadian Conference on Electrical and Computer Engineering, Halifax, NS, Canada, 7–9 May 2000; pp. 355–359. [Google Scholar]
- Bradley, K.J.; Cao, W.; Arellano-Padilla, J. Evaluation of Stray Load Loss in Induction Motors with a Comparison of Input–Output and Calorimetric Methods. IEEE Trans. Energy Convers. 2006, 21, 682–689. [Google Scholar] [CrossRef]
- Debruyne, C.; Desmet, J.; Derammelaere, S.; Vandevelde, L. Derating Factors for Direct Online Induction Machines when supplied with voltage harmonics: Acritical view. In Proceedings of the IEEE International Electric Machines & Drives Conference, Niagara Falls, ON, Canada, 15–18 May 2011; pp. 1048–1052. [Google Scholar]
- Debruyne, C.; Corne, B.; Sergeant, P.; Desmet, J.; Vandevelde, L. Evaluation of the Additional Loss due to Supply Voltage Distortion in relation to Induction Motor Efficiency Rating. In Proceedings of the IEEE International Electric Machines & Drives Conference, Coeur d’Alene, ID, USA, 10–13 May 2015; pp. 1881–1887. [Google Scholar]
- Frank, S.; Lee, K.; Sen, P.K.; Polese, L.G.; Alahmad, M.; Waters, C. Reevaluation of Induction Motor Loss Models for Conventional and Harmonic Power Flow. In Proceedings of the North American Power Symposium, Champaign, IL, USA, 9–11 September 2012. [Google Scholar]
- De Buck, F.G.G.; Giustelinck, P.; De Backer, D. A simple but reliableloss model for inverter-supplied induction motors. IEEE Trans. Ind. Appl. 1984, IA-20, 190–202. [Google Scholar] [CrossRef]
- Specht, H.C. Electric Braking of Induction Motors. In Proceedings of the American Institute of Electrical Engineers, Pittsburgh, PA, USA, 25–27 April 1912. [Google Scholar]
- Lerch, T.; Rad, M. Influence of higher harmonics on losses in induction machines. Tech. Trans. Electr. Eng. 2016, 113, 13–24. [Google Scholar]
- Hirahara, H.; Tanaka, A.; Yamamoto, S. Experimental Verification on the Effects of Insulation-Processing of Copper Die-Cast Squirrel-Cage Rotor on Motor Efficiencyin high-speed operation over 10,000 r/min. In Proceedings of the 2018 International Power Electronics Conference, Niigata, Japan, 20–24 May 2018; pp. 1960–1965. [Google Scholar]
- Karolewski, B.; Radzik, P. Determining the parameters of induction motors circuit models. Przegląd Elektrotech. 2019, 95, 223–230. [Google Scholar]
- Krzyściak, K. Determination of the Load Capacity of a Squirrel-Cage Induction Motor Supplied with Distorted Voltage. Master’s Thesis, AGH University of Krakow, Kraków, Polska, 2022. [Google Scholar]
- Low Voltage. General Performance Cast Iron Motors 400 V 50 Hz. ABB Catalog February 2021, no. 9AKK108196. Available online: https://library.e.abb.com/public/2d2af5109a114ac9beba9be5ba3ac836/General%20performance%20motors%209AKK108196%20EN%2002-2021%20LR.pdf?x-sign=5lKoTWvnhR0h0BFOClqzfRZ/hPl5YK/YbdThYfjG8JCxXxY+Z1U2EsZ6PoUVL54w (accessed on 10 September 2023).
Figure 1.
Equivalent circuit of squirrel-cage motor for harmonic h: sh = (+/−h·ω1 − ω)/(+/−h·ω1) ≈ 1; because values of the slips s5, s7, s11, s13, … are close to 1, it was assumed that sh is equal to 1.
Figure 1.
Equivalent circuit of squirrel-cage motor for harmonic h: sh = (+/−h·ω1 − ω)/(+/−h·ω1) ≈ 1; because values of the slips s5, s7, s11, s13, … are close to 1, it was assumed that sh is equal to 1.

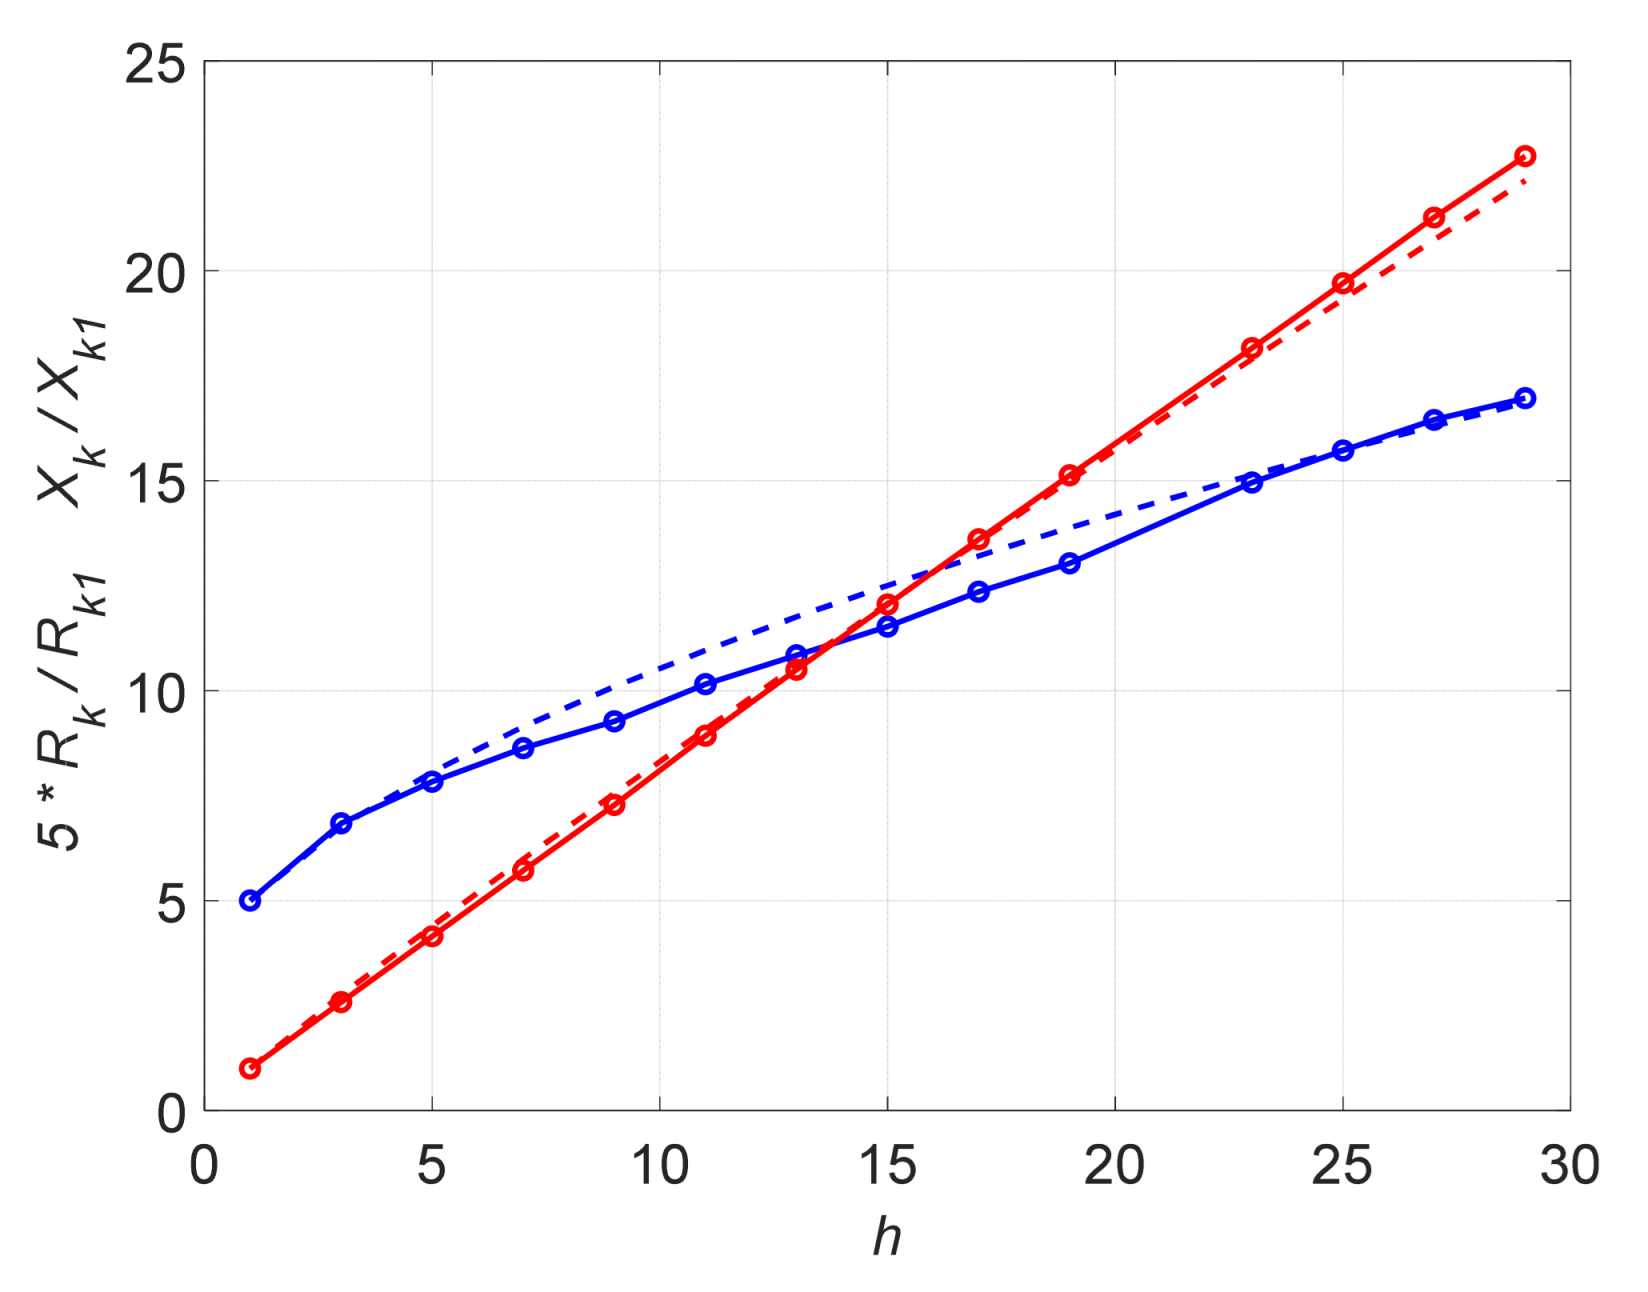
Figure 2.
Values of short-circuit reactance (red line) and short-circuit resistance (×5, blue line) as a function of the harmonic number h and their approximations (dashed lines) for a 4 kW motor.
Figure 2.
Values of short-circuit reactance (red line) and short-circuit resistance (×5, blue line) as a function of the harmonic number h and their approximations (dashed lines) for a 4 kW motor.

Figure 3.
Values of short-circuit reactance (red line) and short-circuit resistance (×5, blue line) as a function of the harmonic number h and their approximations (dashed lines) for a 5.5 kW A motor.
Figure 3.
Values of short-circuit reactance (red line) and short-circuit resistance (×5, blue line) as a function of the harmonic number h and their approximations (dashed lines) for a 5.5 kW A motor.

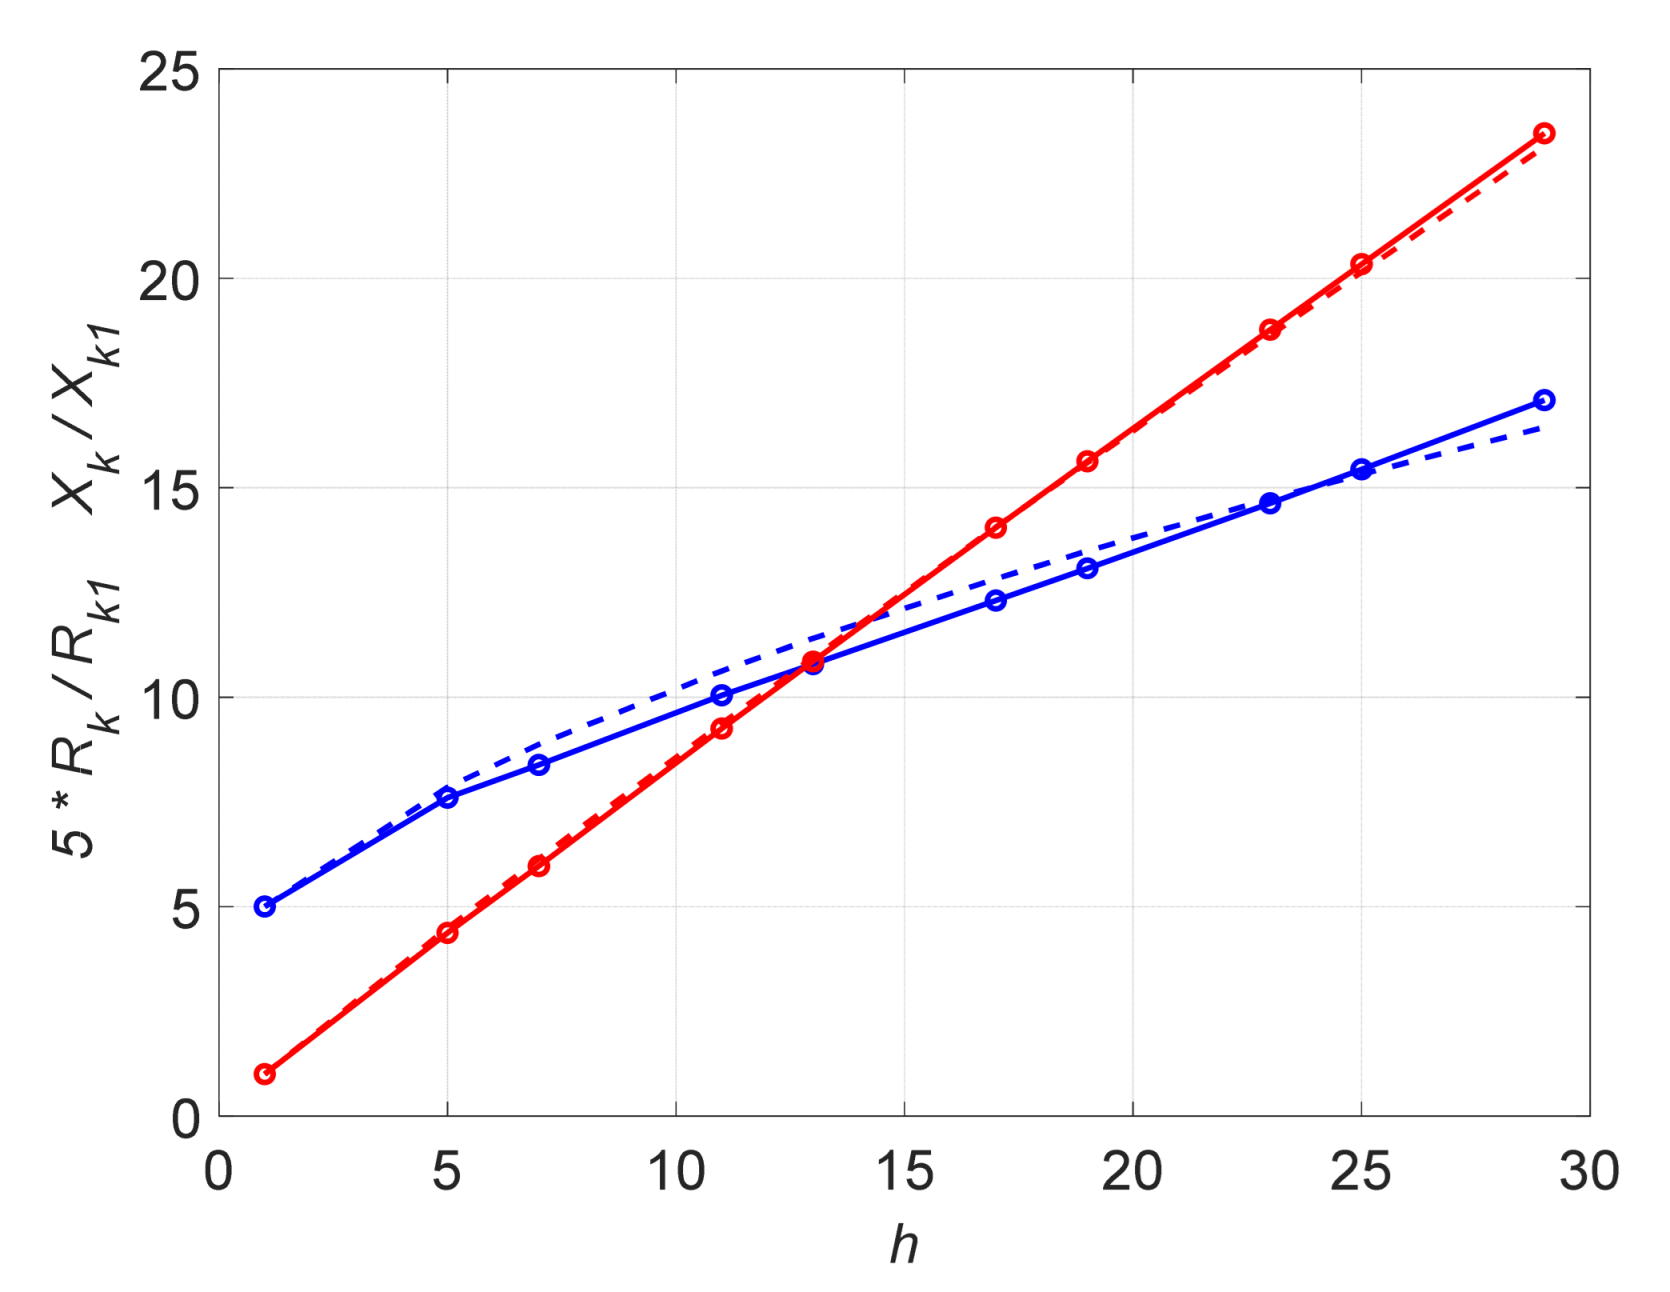
Figure 4.
Values of short-circuit reactance (red line) and short-circuit resistance (×5, blue line) as a function of the harmonic number h and their approximations (dashed lines) for a 5.5 kW B motor.
Figure 4.
Values of short-circuit reactance (red line) and short-circuit resistance (×5, blue line) as a function of the harmonic number h and their approximations (dashed lines) for a 5.5 kW B motor.

Figure 5.
Values of short-circuit reactance (red line) and short-circuit resistance (×5, blue line) as a function of the harmonic number h and their approximations (dashed lines) for a 22 kW motor.
Figure 5.
Values of short-circuit reactance (red line) and short-circuit resistance (×5, blue line) as a function of the harmonic number h and their approximations (dashed lines) for a 22 kW motor.

Figure 6.
Values of short-circuit reactance (red line) and short-circuit resistance (×5, blue line) as a function of the harmonic number h and their approximations (dashed lines) for a 65 kW motor.
Figure 6.
Values of short-circuit reactance (red line) and short-circuit resistance (×5, blue line) as a function of the harmonic number h and their approximations (dashed lines) for a 65 kW motor.

Figure 7.
Derating power of the 4 kW motor as a function of the us5 = Us5/UsN ratio.

Figure 8.
Derating power of the 5.5 kW A motor as a function of the us5 = Us5/UsN ratio.

Figure 9.
Derating power of the 5.5 kW B motor as a function of the us5 = Us5/UsN ratio.

Figure 10.
Derating power of the 22 kW motor as a function of the us5 = Us5/UsN ratio.

Figure 11.
Derating power of the 65 kW motor as a function of the us5 = Us5/UsN ratio.

Figure 12.
Derating power for all tested motors for the third power losses model as a function of the us5 = Us5/UsN ratio.
Figure 12.
Derating power for all tested motors for the third power losses model as a function of the us5 = Us5/UsN ratio.


Table 1.
Rated and cataloged data of the tested squirrel-cage motors. All motors with operating duty S1 and fN = 50 Hz; ηN—rated efficiency, IsN—rated phase current, ZsN—rated phase input impedance, cosφN—rated power factor, sN—rated slip, p—number of pole pairs, I0—no-load current at rated voltage UsN, Year—year of manufacture of the motor.
| Motor | ηN | UsN [V] (Phase) | IsN [A] (Phase) | ZsN = UsN/IsN [Ω] | cosφN | sN | p | I0/IN | Year |
|---|---|---|---|---|---|---|---|---|---|
| 4.0 kW Δ | 0.829 | 400 | 4.70 | 85.1 | 0.86 | 0.0317 | 1 | 0.40 | 2016 |
| 5.5 kW Δ A | 0.859 | 400 | 6.35 | 63.0 | 0.84 | 0.0333 | 2 | 0.49 | 2008 |
| 5.5 kW Y B | 0.883 | 220 | 11.0 | 20.0 | 0.86 | 0.0333 | 2 | 0.41 | 1971 |
| 22 kW Δ IE3 | 0.931 | 400 | 23.7 | 16.8 | 0.83 | 0.0167 | 2 | 0.53 | 2021 |
| 65 kW Y | 0.877 | 220 | 132 | 1.67 | 0.85 | 0.0333 | 5 | 0.41 | 1957 |
Table 2.
Verification of the results of identification of motor equivalent circuit parameters for the rated state (Us = UsN, s = sN); Rs1DC—stator phase resistance measured with DC current, Rs1—stator phase resistance determined during identification and used for further calculations, ΔPN—the total rated power losses of the motor.
| Motor | Rs1DC/ZsN for 20 °C | Rs1DC/ZsN for 75 °C | Rs1/ZsN | ΔPNaprox/ΔPN | INaprox/IN | cosϕNaprox | cosϕN |
|---|---|---|---|---|---|---|---|
| 4.0 kW | 0.0443 | 0.0536 | 0.0481 | 1.0000 | 1.0003 | 0.8611 | 0.86 |
| 5.5 kW A | 0.0442 | 0.0535 | 0.0489 | 1.0000 | 1.0132 | 0.8221 | 0.84 |
| 5.5 kW B | 0.0382 | 0.0463 | 0.0378 | 1.0000 | 1.0087 | 0.8463 | 0.86 |
| 22 kW | 0.0156 | 0.0189 | 0.0159 | 1.0000 | 1.0142 | 0.8111 | 0.83 |
| 65 kW | 0.0307 | 0.0372 | 0.0543 | 0.9999 | 1.0015 | 0.8495 | 0.85 |
Table 3.
Approximation coefficients for the tested motors.
| Motor | a | x | y | as | ar | ar′ |
|---|---|---|---|---|---|---|
| 4.0 kW | 0.780 | 1.10 | 1.090 | 0.618 | 1.000 | 0.481 |
| 5.5 kW A | 0 | 0.34 | 0.965 | –0.756 | 0.973 | –1.287 |
| 5.5 kW B | 0.875 | 1.25 | 1.060 | 0.748 | 1.000 | 0.739 |
| 22 kW | 0.592 | 0.57 | 0.920 | 0.780 | 0.477 | 0.343 |
| 65 kW | 0.650 | 0.60 | 0.933 | 1.000 | 0.389 | 0.389 |
Table 4.
Relative impedances, currents, and power losses of the motors for harmonic No. 5 voltage Us5 = 0.25 UsN; Zk1, Zk5—measured short-circuit impedances of the motor for the frequencies f1 (h = 1) and f5 (h = 5), Xk5—measured short-circuit reactance of the motor for the frequency f5, Rr5′—rotor resistance value for frequency f5, determined by model 3, Ik5—measured short-circuit current for frequency f5, converted to supply voltage level Us5 = 0.25 UsN, ΔPCur5—power losses in the rotor cage for resistance Rr5′ determined by model 3 and for current of the rotor Ir5′ = Ik5.
| Motor | Zk1/ZsN = uk1 (Measure’s) | Zk5/ZsN (Measure’s) | Xk5/ZsN (Measure’s) | RrN′/ZsN (Ident.) | Rr5′/ZsN (Model 3) | Ik5/IsN (Measure’s) | ΔPCurN/PN (Ident.) | ΔPCur5/PN (Model 3) |
|---|---|---|---|---|---|---|---|---|
| 4.0 kW | 0.227 | 1.090 | 1.077 | 0.0354 | 0.1248 | 0.229 | 0.0336 | 0.00925 |
| 5.5 kW A | 0.202 | 0.826 | 0.813 | 0.0373 | 0.1012 | 0.302 | 0.0355 | 0.01280 |
| 5.5 kW B | 0.217 | 0.968 | 0.958 | 0.0350 | 0.0932 | 0.258 | 0.0351 | 0.00821 |
| 22 kW | 0.129 | 0.486 | 0.477 | 0.0203 | 0.0786 | 0.514 | 0.0170 | 0.02691 |
| 65 kW | 0.257 | 0.998 | 0.979 | 0.0343 | 0.1453 | 0.250 | 0.0346 | 0.01163 |
Disclaimer/Publisher’s Note: The statements, opinions and data contained in all publications are solely those of the individual author(s) and contributor(s) and not of MDPI and/or the editor(s). MDPI and/or the editor(s) disclaim responsibility for any injury to people or property resulting from any ideas, methods, instructions or products referred to in the content. |
© 2023 by the author. Licensee MDPI, Basel, Switzerland. This article is an open access article distributed under the terms and conditions of the Creative Commons Attribution (CC BY) license (https://creativecommons.org/licenses/by/4.0/).
Share and Cite
MDPI and ACS Style
Drabek, T. Derating of Squirrel-Cage Induction Motors Due to High Harmonics in Supply Voltage. Energies 2023, 16, 6604. https://doi.org/10.3390/en16186604
AMA Style
Drabek T. Derating of Squirrel-Cage Induction Motors Due to High Harmonics in Supply Voltage. Energies. 2023; 16(18):6604. https://doi.org/10.3390/en16186604
Chicago/Turabian StyleDrabek, Tomasz. 2023. "Derating of Squirrel-Cage Induction Motors Due to High Harmonics in Supply Voltage" Energies 16, no. 18: 6604. https://doi.org/10.3390/en16186604
Note that from the first issue of 2016, this journal uses article numbers instead of page numbers. See further details here.