Article

Experimental Tests of Conduction/Convection Heat Transfer in Very High Porosity Foams with Lattice Structures, Immersed in Different Fluids

1
Department of Enterprise Engineering, University of Rome “Tor Vergata”, Via del Politecnico 1, 00133 Rome, Italy
2
Department of Industrial Engineering, University of Rome “Tor Vergata”, Via del Politecnico 1, 00133 Rome, Italy
*
Author to whom correspondence should be addressed.
Energies 2023, 16(16), 5959; https://doi.org/10.3390/en16165959
Submission received: 22 June 2023 / Revised: 31 July 2023 / Accepted: 9 August 2023 / Published: 12 August 2023
(This article belongs to the Special Issue New Challenges in Heat Transfer Enhancement)

Abstract

:
This experimental work presents the results of measurements of thermal conductivity λ and convection heat transfer coefficient h on regular structure PLA and aluminium foams with low density ratio (~0.15), carried out with a TCP (thermal conductivity probe), built by the authors’ laboratory. Measurements were performed with two fluids, water and air: pure fluids, and samples with the PLA and aluminium foams immersed in both fluids have been tested. Four temperatures (10, 20, 30, 40 °C) and various temperature differences during the tests ΔT (between 0.35 and 9 °C) were applied. Also, tests in water mixed with 0.5% of a gel (agar agar) have been run in order to increase the water viscosity and to avoid convection starting. For these tests, at the end of the heating, the temperature of the probe reaches steady-state values, when all the thermal power supplied by the probe is transferred to the cooled cell wall; thermal conductivity was also evaluated through the guarded hot ring (GHR) method. A difference was found between the results of λ in steady-state and transient regimes, likely due to the difference of the sample volume interested by heating during the tests. Also, the effect of the temperature difference ΔT on the behaviour of the pure fluid and foams was outlined. The mutual effect of thermal conductivity and free convection heat transfer results in being extremely important to describe the behaviour of such kinds of composites when they are used to increase or to reduce the heat transfer, as heat conductors or insulators. Very few works are present in the literature about this subject, above all, ones regarding low-density regular structures.

1. Introduction

Metallic, polymeric and ceramic foams have recently received the attention of the scientific community due to their peculiar mechanical, thermal and fluid dynamic properties [1,2]. These properties are mainly due to the reduced presence of the base material (the matrix) and the large amount of interstitial fluid. Thus, these characteristics result in a very low density of the composite and the consequent lightness of the manufactured goods. Furthermore, when the solid structure is made of high-cost material, the sparing of said material can contribute to reducing the cost of components.
Even if thermal and fluid dynamic properties could be lower than the analogous ones of the full materials, a comparison at equal density and weight necessarily privileges the porous composites. Thus, these structures are very well suited to build heat exchangers and to substitute finned surfaces.
Considering that composites can be used either as thermal insulators or conductors, it becomes extremely important to evaluate the thermal properties and the temperature dependence of these structures on one side, and how heat transfer is modified by the starting of natural convection in them on the other side. In fact, when regular structure composites are used as insulators, free convection can reduce the heat transfer, while heat conduction can receive a meaningful contribution when these structures are used as fins. Furthermore, up today regular structures are easily obtained by 3D printing.
Among the mechanical properties of the composites, the following are noteworthy: tensile and compression strength, elastic modulus, elastic limit, plastic deformation. Among the thermal ones, thermal conductivity (for obtaining both highly insulating and highly conductive materials), specific heat, radiation transparency. Fluid dynamic properties are mainly due to the resulting permeability, when high open porosity is obtained, and the consequent ease of fluid movement and effectiveness of convection heat transfer.
The subject of the present work is the result of a series of measurements of thermal conductivity λ and convection heat transfer coefficient h of different types of metallic (aluminium) and polymeric (PLA) foams, with a regular periodic structure and very high porosity (see Section 2), in order to evaluate the effect of the foam on the heat transfer behaviour of devices using these structures, and to establish how convection can alter this behaviour. Air and water were used as interstitial fluids due to their availability and the easiness to obtain them very pure. Tests have been carried out with different applied thermal fluxes, at different near-ambient temperatures, between 10 °C and 40 °C, with 10 °C steps. Test were limited to these temperatures in order to avoid convection starting too soon at higher temperatures, and possible freezing at lower.
Thus, the main goals of the present work have been:
-
Assessing the possibility of measuring the thermal conductivity with the probe method [3] of the above-described structures;
-
Identifying which heat transfer mechanism was present in the structures during the tests, if pure conduction, pure convection or mixed conduction and convection, and also identifying the difference in steady and transient state (for thermal conductivity);
-
Finding empirical relations to interpolate the experimental results to foresee the thermophysical properties in the examined temperature ranges and for the tested structures.
Most of the papers found in the literature concern theoretical modelling [2,4,5,6,7,8,9], experimental measurements [1,10,11,12,13,14], or both [15,16,17,18,19,20,21] on metallic or polymeric foams, used to enhance or reduce heat transfer in heat exchangers. Some of them are reviews of this subject [2,22,23,24,25,26]. Most works measure or calculate the pressure drop in the tested devices, as well as the effective thermal conductivity from the device performance. Very few examine ordered structures as regular lattices [2,17], even if up today it is quite easy to obtain these structures by means of 3D printing and additive manufacturing. Also, these [2,17] use round surfaces (e.g., gyroid) to simulate what happens in irregular shaped foams.
Calmidi et Mahajan [10] measured the thermal conductivity of aluminium-based composites with a method similar to the guarded hot plate, both in water and air. Thus, only steady-state measurements were carried out. Results were compared with a series/parallel empirical model and arranged in empirical correlations. The same authors [11] measured the forced convection heat transfer coefficient in aluminium foams crossed by air and found the empirical parameters of a series/parallel model describing the phenomenon. Potenza et al. [4] numerically evaluated the effect of porosity in thermal diffusivity measurements with the flash method, when transient or steady-state procedure is applied. Shih et al. [12] studied how heat transfer in aluminium foams is affected by pore density, sample length and air velocity, and flow cross-section. The latter resulted in being the most important factor. Kuang et al. [13] measured the heat transfer convection coefficient in different flow regimes and concluded that a characteristic length is the major factor influencing it. Hong et al. [5] analytically evaluated the border effects in the free convection of a heated vertical wall covered by metallic foam: these effects are meaningful only for high porosity foams. Zhao et al. [15] measured and calculated the equivalent thermal conductivity of open-cell metal foams with the hot plate method, showing the effect of the free convection. Mancin at al. [20] evaluated both experimentally and theoretically the performance of aluminium and copper metal foams with a change in geometrical (pores per inch, porosity, sample height) and process (mass flow rate of air, thermal flux) parameters. Duarte et al. [21] evaluated the fire resistance of polymeric foams (polyurethane and PET) used as building materials. Dukhan et al. [14] carried out experimental tests on open-cell aluminium foam in the shape of a compact block. A connect analytical model was developed, based on the hypothesis of thermal equilibrium between fluid and solid. In order to study the metallic foam contribution to condensers, Abdul-Sahib et al. measured mass flow rates, temperatures, and pressure drops of the condensing fluid, in order to correlate condensation pressure, thermophysical properties, pore density and number to the heat transfer. Pulvirenti et al. [2] carried out the evaluation of the fluid dynamic behaviour, in order to establish the non-validity of the Darcy–Forchheimer law. Singh et al. [16] both calculated and experimentally verified the best configuration of an air jet impinging on a thin metal foam, in terms of ratio between jet diameter and foam thickness. Andreozzi et al. [6] and Piller at al. [8] numerically studied the effect of the inclination of a foam-covered cylinder during free convection heat transfer. Ranut et al. [7] CFD calculated the performance of aluminium foam, detecting the foam structure through an X-ray tomography. Buonomo et al. [19] evaluated both experimentally and numerically the heat transfer in horizontal cylinders covered or filled with aluminium foam subjected to free convection. Corasaniti et al. [9] theoretically evaluated the effective thermal conductivity of an open foam with cubic cell structure, in steady-state regime, verified through the comparison with literature reference data. Among the reviews, ref. [2] give support to theoretical modelling when the Darcy–Forchheimer law is not respected; ref. [22] gives an outlook on aluminium foams in water subjected to forced convection; ref. [23] deals with non-equilibrium thermal transport associated with phase change in metal foams filled with phase change materials (PCM); ref. [24] presents a comparison between the traditional and metallic foam covered heat exchangers; in [25], a wide review is undertaken of theoretical calculations of convective heat transfer coefficient and effective thermal conductivity in metal foams containing PCM; ref. [26] presents the experimental and analytical methods to evaluate the effective thermal conductivity, and the resulting empirical correlations.
Summarizing, the general tendency of the study of low-density composites is to numerically simulate, experimentally measure, or both, the thermal properties of these materials and devices made with them. To carry on this goal, sample shapes are changed, as well as porosity, fluid, fluid dynamic parameters and the heat transfer mechanism.
The present work is a part of the international tendency to develop new materials especially suited to the following applications: energy saving through the reduction or increase of heat transfer in devices devoted to it; ambient impact reduction through the sparing of valuable materials; an increase in the efficiency of devices, as heat exchangers or thermal insulators, whose performances are strictly connected with energy efficiency. Even if the measurement of thermophysical properties can be regarded as a basic subject, its importance is fundamental for the cited applications.

2. Materials and Sample Preparations

Regular structure foams with very high porosity and low solid material content have been produced through the method described in [27,28]. Based on fused deposition modelling (FDM) 3D printing from an Autocad® 2023 model (Autodesk, San Francisco, CA, USA), shown in Figure 1, first the sample in PLA (polylactic acid) was realized, and from it, through a metal replacement procedure, the aluminium sample. The complete step sequence of the procedure is described in Table 1. The relative density, that is the ratio of the density of the foam to the density of the solid, resulted in 0.95. Both samples are shown in Figure 2.
The sizes of the samples were chosen so that they fit within the internal volume of the measuring cell of the apparatus for thermal conductivity tests (Figure 3); that is, they are cylinders of 60 mm height and with a diameter of 50 mm (reported in Figure 2).

3. Experimental Section

This section may be divided by subheadings. It should provide a concise and precise description of the experimental results, their interpretation, as well as the experimental conclusions that can be drawn.

3.1. Thermal Conductivity Probe (TCP)

Thermal conductivity of the two samples of Figure 1 and Figure 2 were measured with the probe method [29,30,31], with a special probe realized by the authors’ laboratory [3] reported in Figure 4. Due to its very fine sizes (60 mm in length and 0.6 mm in diameter), the probe presents a very high length-to-diameter ratio (~100), so particularly suited to apply the hot wire theory [30,31]: in fact, the linear portion of the ΔT vs. ln t curve starts a few seconds after the beginning of the sample heating (e.g., see Section 3.3). The probe can be easily inserted into the large voids of the foam structure, without touching it.

3.2. Experimental Apparatus

A sketch of the experimental apparatus with a short description of its components is reported in Figure 5. Both the apparatus and the test procedure have already been described in [3].

3.3. Test Procedure

After mounting one of the two samples and the TCP in the measuring cell, the thermostat is switched on and the thermosetting fluid is flowed through the cell and cover walls. After temperatures of the TCP and the wall are stabilized at the desired values, the PS is switched on to supply the desired electric current value, depending on the fluid (water requires a higher value than air to meaningfully increase the probe temperature) and the power to be given to the TCP.
During all the measurement phases, the four signals (probe TC, wall TC, Shunt voltage drop, and probe platinum heater voltage drop) are continuously recorded by the DAS. Data are then processed according to the TCP theory: first the trend of the probe temperature rise is plotted versus time, then the linear portion of this trend is identified; afterwards, the slope of this trend is evaluated and connected to the thermal conductivity of the medium (a typical trend of the temperature increase vs. logarithm of time is reported in Figure 6). Unfortunately, with the medium being totally or mainly liquid, free convection starts easily. In this case, the curve deviates from the linear trend till it becomes flat (constant temperature). From this time, heat produced by the current flowing in the probe platinum Pt wire is transferred to the wall (cooled by the thermostatic fluid flow) and only free convection from the probe (vertical small diameter cylinder, i.e., a wire) and the cell wall are present. Convection heat transfer coefficient is evaluated from the temperature difference between the probe and the wall, in the cylindrical reference system. Figure 6 presents a typical trend of the temperature increase vs. the logarithm of time for the Al foam in air, where the linear portion is clearly recognizable, and the constant ΔT zone where only free convection is present.
The free convection heat transfer coefficient h is calculated from the well-known Newton convection law:
Q ˙ = h A Δ T
where Q ˙ = R · I 2 is the thermal power supplied by the wire inside the probe, derived by the steady-state thermal balance with the power dissipated through free convection. ΔT is the temperature difference between the probe (assumed uniform due to its very small diameter) and the average temperature inside the measurement cell, assumed as undisturbed.
Unfortunately, during pure water and pure air tests (without the foam), convection starts almost at the beginning of heating, so it is very difficult to identify a linear portion of the trend; so λ values result in being affected by high uncertainties. At least for water it is possible to overcome this problem by adding a small percentage (~0.5% in weight) of a gel (agar agar) which highly increases the water viscosity, leaving the nature of the liquid practically the same. In this case, the linear zone results in being much wider (e.g., in Figure 7, see the results of a test of the Al foam and water + agar agar). In this last case, the linear zone, used to calculate thermal conductivity, spans from ln t = 1.5 (t = 4.5 s) to ln t = 6 (t = 600 s).
Also, at the end of these tests the temperature difference reaches constant values. In this case, the reason is not the start of convection, but reaching the steady state, where the whole heat supplied by the probe heater is transferred to the cell wall. This corresponds to measuring thermal conductivity with a steady-state method: the guarded hot ring (GHR) method, where the conditioning fluid circulating in the interlayer of the cell behaves as a control ring. A comparison can be caried out between the transient (TCP) and steady-state (GHR) results (see the Results paragraph).

3.4. Tests

The following tests have been carried out:
-
Pure air tests;
-
Pure water tests;
-
Tests on pure water mixed with agar agar;
-
Tests on Al structures with water and agar agar;
-
PLA test in water;
-
PLA test in water +agar agar;
-
Al tests in air;
-
PLA tests in air.

4. Results

Figure 8, Figure 9, Figure 10 and Figure 11 report all the results of tests in air and water, for thermal conductivity λ and convection heat transfer coefficient h, respectively. The figures show all of the repetitions of the tests carried out. Averages and standard deviations can be easily calculated from the data. Blue interpolating lines are the trends of experimental data (constant, linear, or with some specific behaviour). Orange data or lines are values derived from the literature (LeFevre and Ede [32] and Haar et al. [33], Incropera et al. [34]), and are clearly present only for pure water and air. In some cases, the other colours represent a comparison between different data, as indicated.
Empirical correlations of h as a function of test temperature T in the case of foams inserted in air and water, obtained from the trendlines, are reported in the graphs.

5. Discussion of Results

Looking at the reported graphs (Figure 8, Figure 9, Figure 10 and Figure 11), the following conclusions can be drawn.

5.1. Thermal Conductivity

(1)
ΔT vs. ln t trends (see, for instance, Figure 6) often present different slopes: only the first is generally connected to the true λ value, and the others are due to mixed convection/conduction, or steady-state convection when this trend is horizontal.
(2)
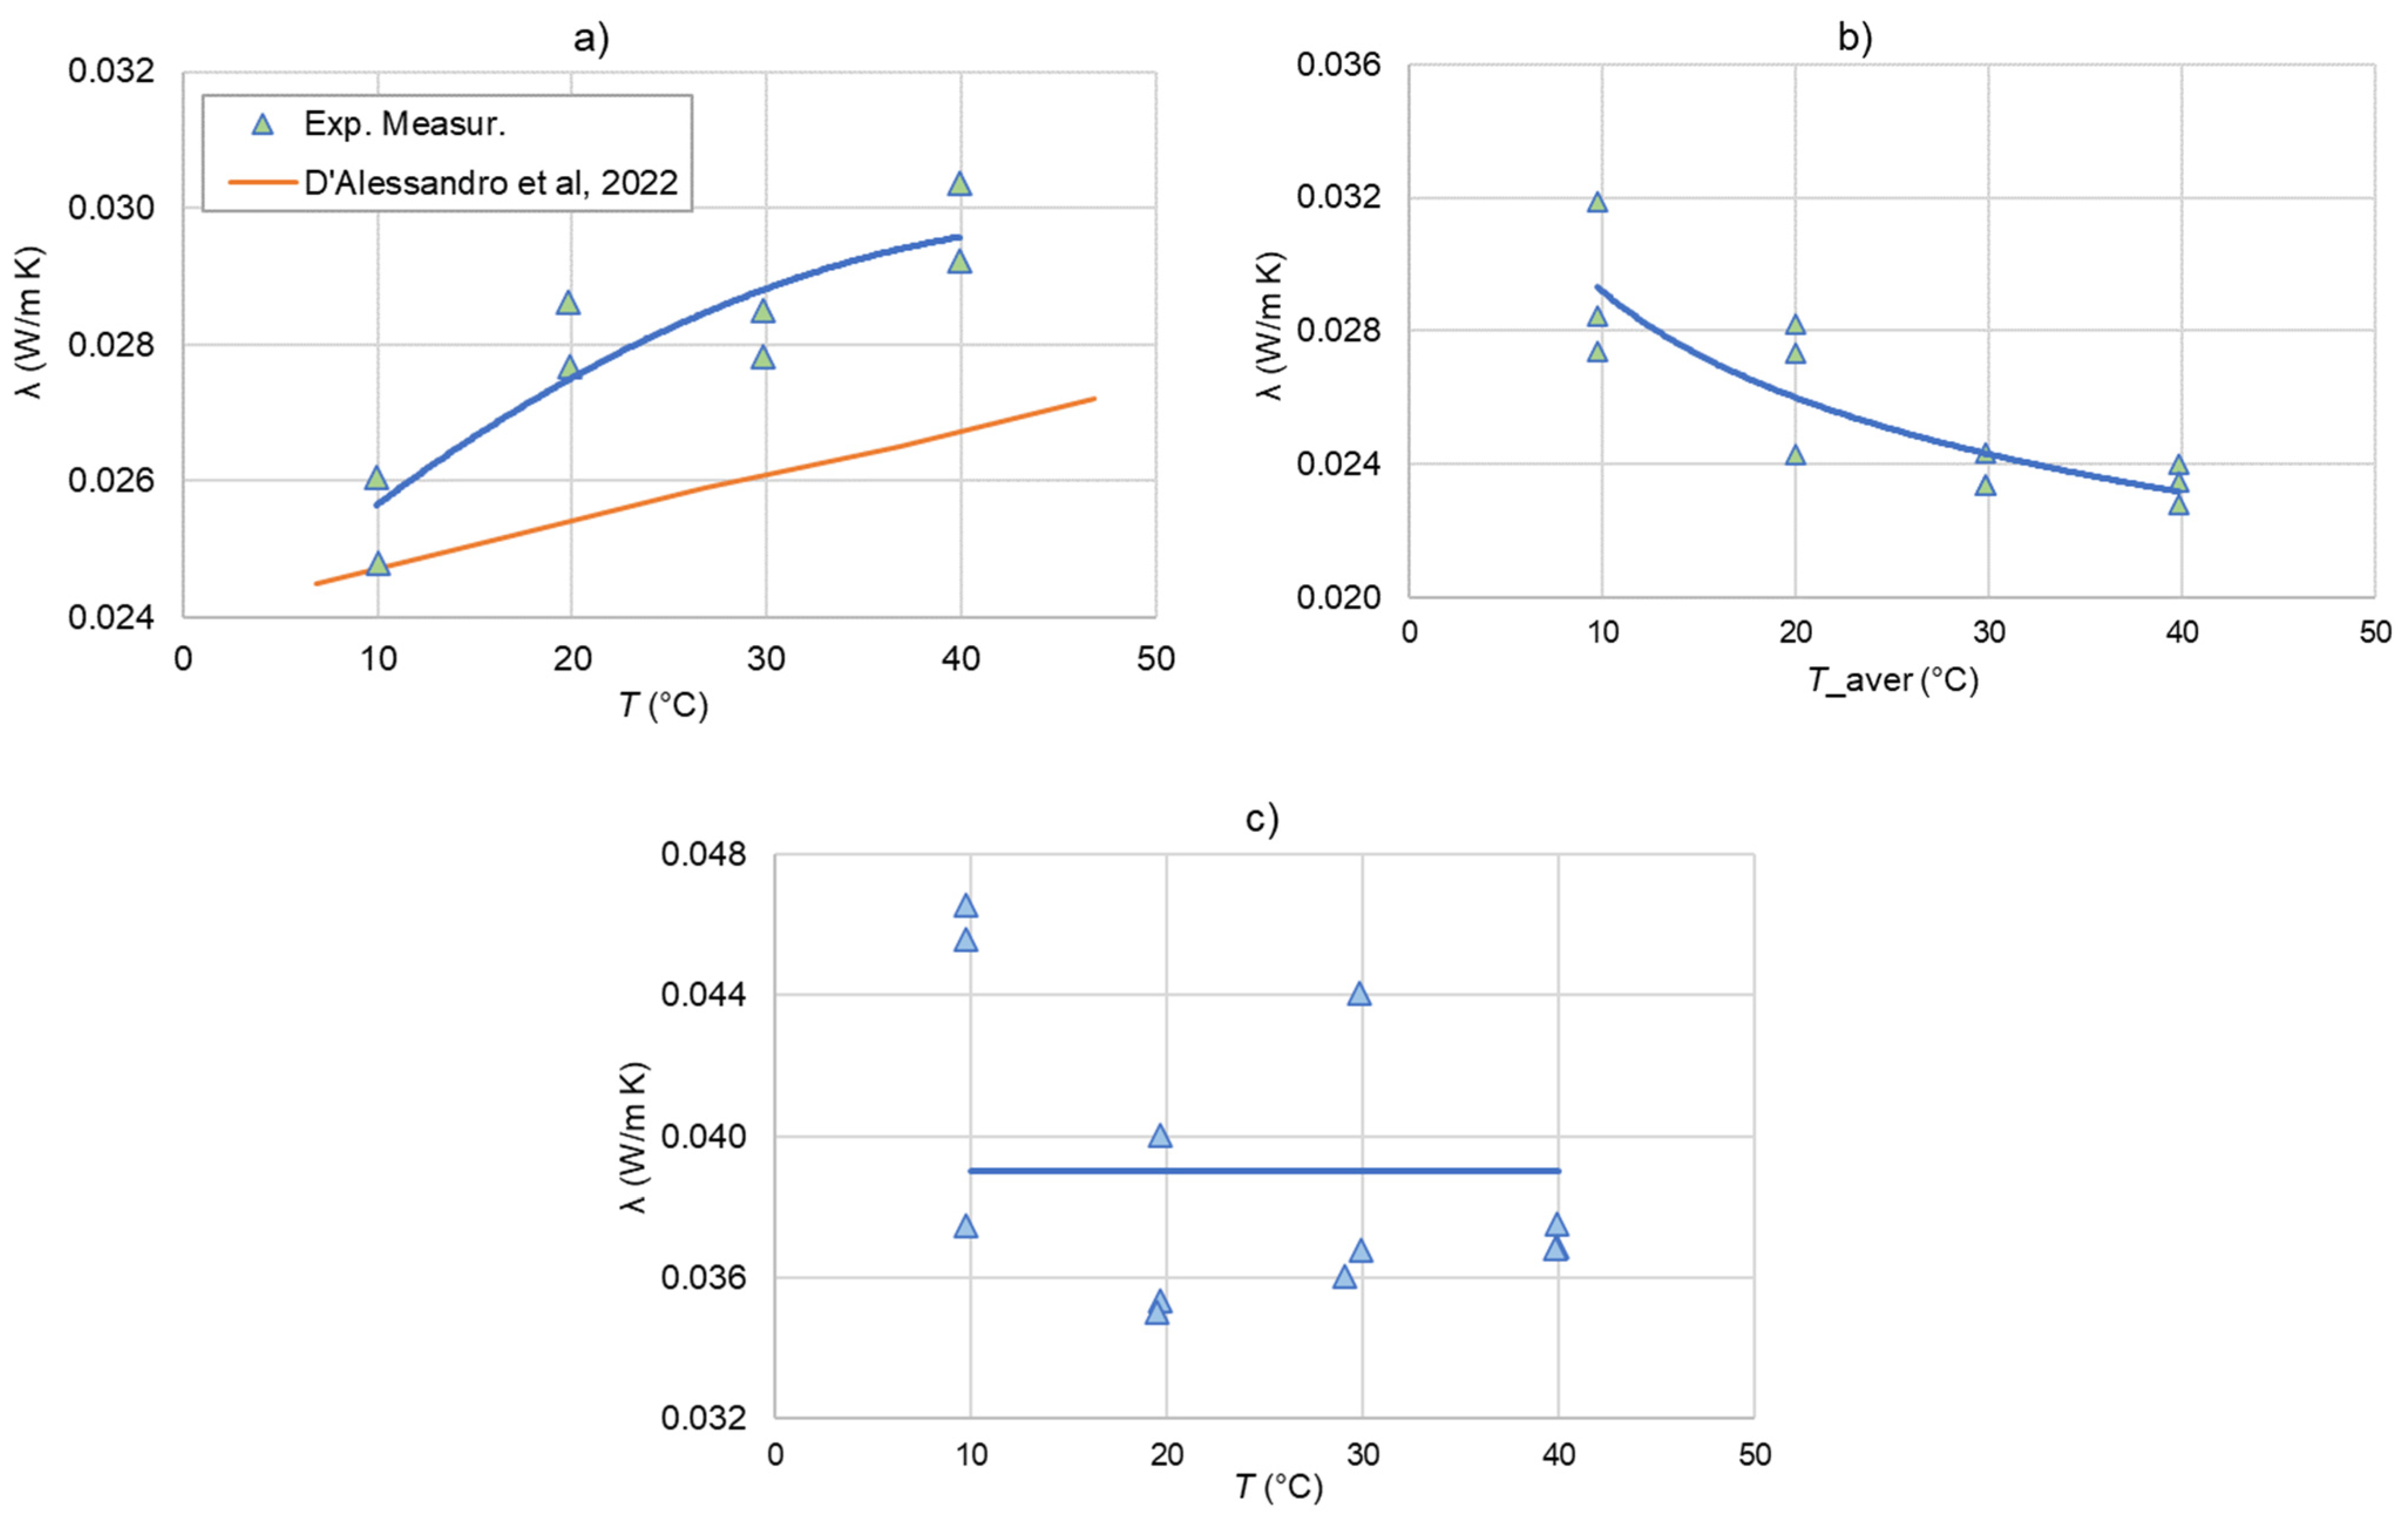
Only water and only air (above all, this latter) tests give values affected by high uncertainties, due to the difficulty in identifying the linear zone in the ΔT vs. ln t trends: see, for instance, Figure 8a–c and Figure 9a,b, which show a relevant data spread (till 30%) and difference with respect to references. This is the reason why, at least for water, adding agar agar highly reduces the uncertainty (see in Figure 9a this reduction for water, from 9% to 2.3‰). Moreover, the obtained values of water fall within 1.7% from tables of ref. [33].
(3)
Comparing λ values of the PLA foam in water + agar agar, obtained from the TCP theory (from the slope of the ΔT vs. ln t) and in steady state (GHP), different trends appear, as seen in Figure 9c. This is likely due to the different volume interested by the two procedures: the whole composite volume for the GHP, and only a layer around the probe in the TCP, which increases during the measurement. Furthermore, the presence of a pure liquid layer around the probe needle results in an effect similar to the so-called wall effect. Water + agar agar viscosity lowers with temperature, producing an apparent thermal conductivity which increases with temperature. When the same comparison is made on the Al foam in water, this shift appears also at lower temperatures (Figure 9d), probably due to the high conductivity of aluminium, which produces this effect (apparent thermal conductivity) at lower temperatures as well.
(4)
PLA λ values (0.16 W/m K, [35]) lower than pure water (0.6 W/m K) explain why the PLA foam + water composite decreases its λ from 0.6 to 0.41 ÷ 0.46 W/m K (Figure 9c).
(5)
In Figure 9d, while the aluminium foam in water+agar agar presents the same λ steady-state value of pure water, in the TCP tests, λ results in being increased about 3.6 times, from 0.6 to 2 ÷ 2.25 W/m K: this demonstrates the effect of the solid material λ, at least in the neighbourhood of the heat source.
(6)
In Figure 9d, Al foam samples in water, measured with TCP and with a temperature increase during the test of about 2.5 °C, show λ values of about 2 W/m K, while in Figure 9b with only ΔT = 0.3 °C, λ assumes 1.25 ± 0.13 W/m K. This indicates the importance of high-enough values of the temperature increase during the TCP test in order to avoid uncertainties and biases during the measurements that are too high.
(7)
Al foam in air presents a λ value of about 0.04 W/m K, 50% higher than the pure air (0.026 W/m K), as seen in Figure 8c. PLA foam in air does not meaningfully change the air λ value, as shown in Figure 8b, due to the low value of PLA λ.

5.2. Convection Heat Transfer Coefficient

(1)
Figure 10a shows the comparison of h values measured with the TCP immersed in air and computed with the empirical correlation of LeFevre & Ede [32]: both trends present the same slope but different absolute values. However, the difference lay within 20%, as usually occurs when dealing with a comparison between empirical correlations and experimental data.
(2)
The same comparison for pure water (Figure 11a) shows an analogue agreement, again within 20%, but only if enough high ΔT (~3 °C) is supplied.
(3)
For Al foam in water, Figure 11c shows how ΔT during tests influences h: the contribution of this temperature increases relevant results, even higher with respect to what was predicted by LeFevre & Ede [32].
(4)
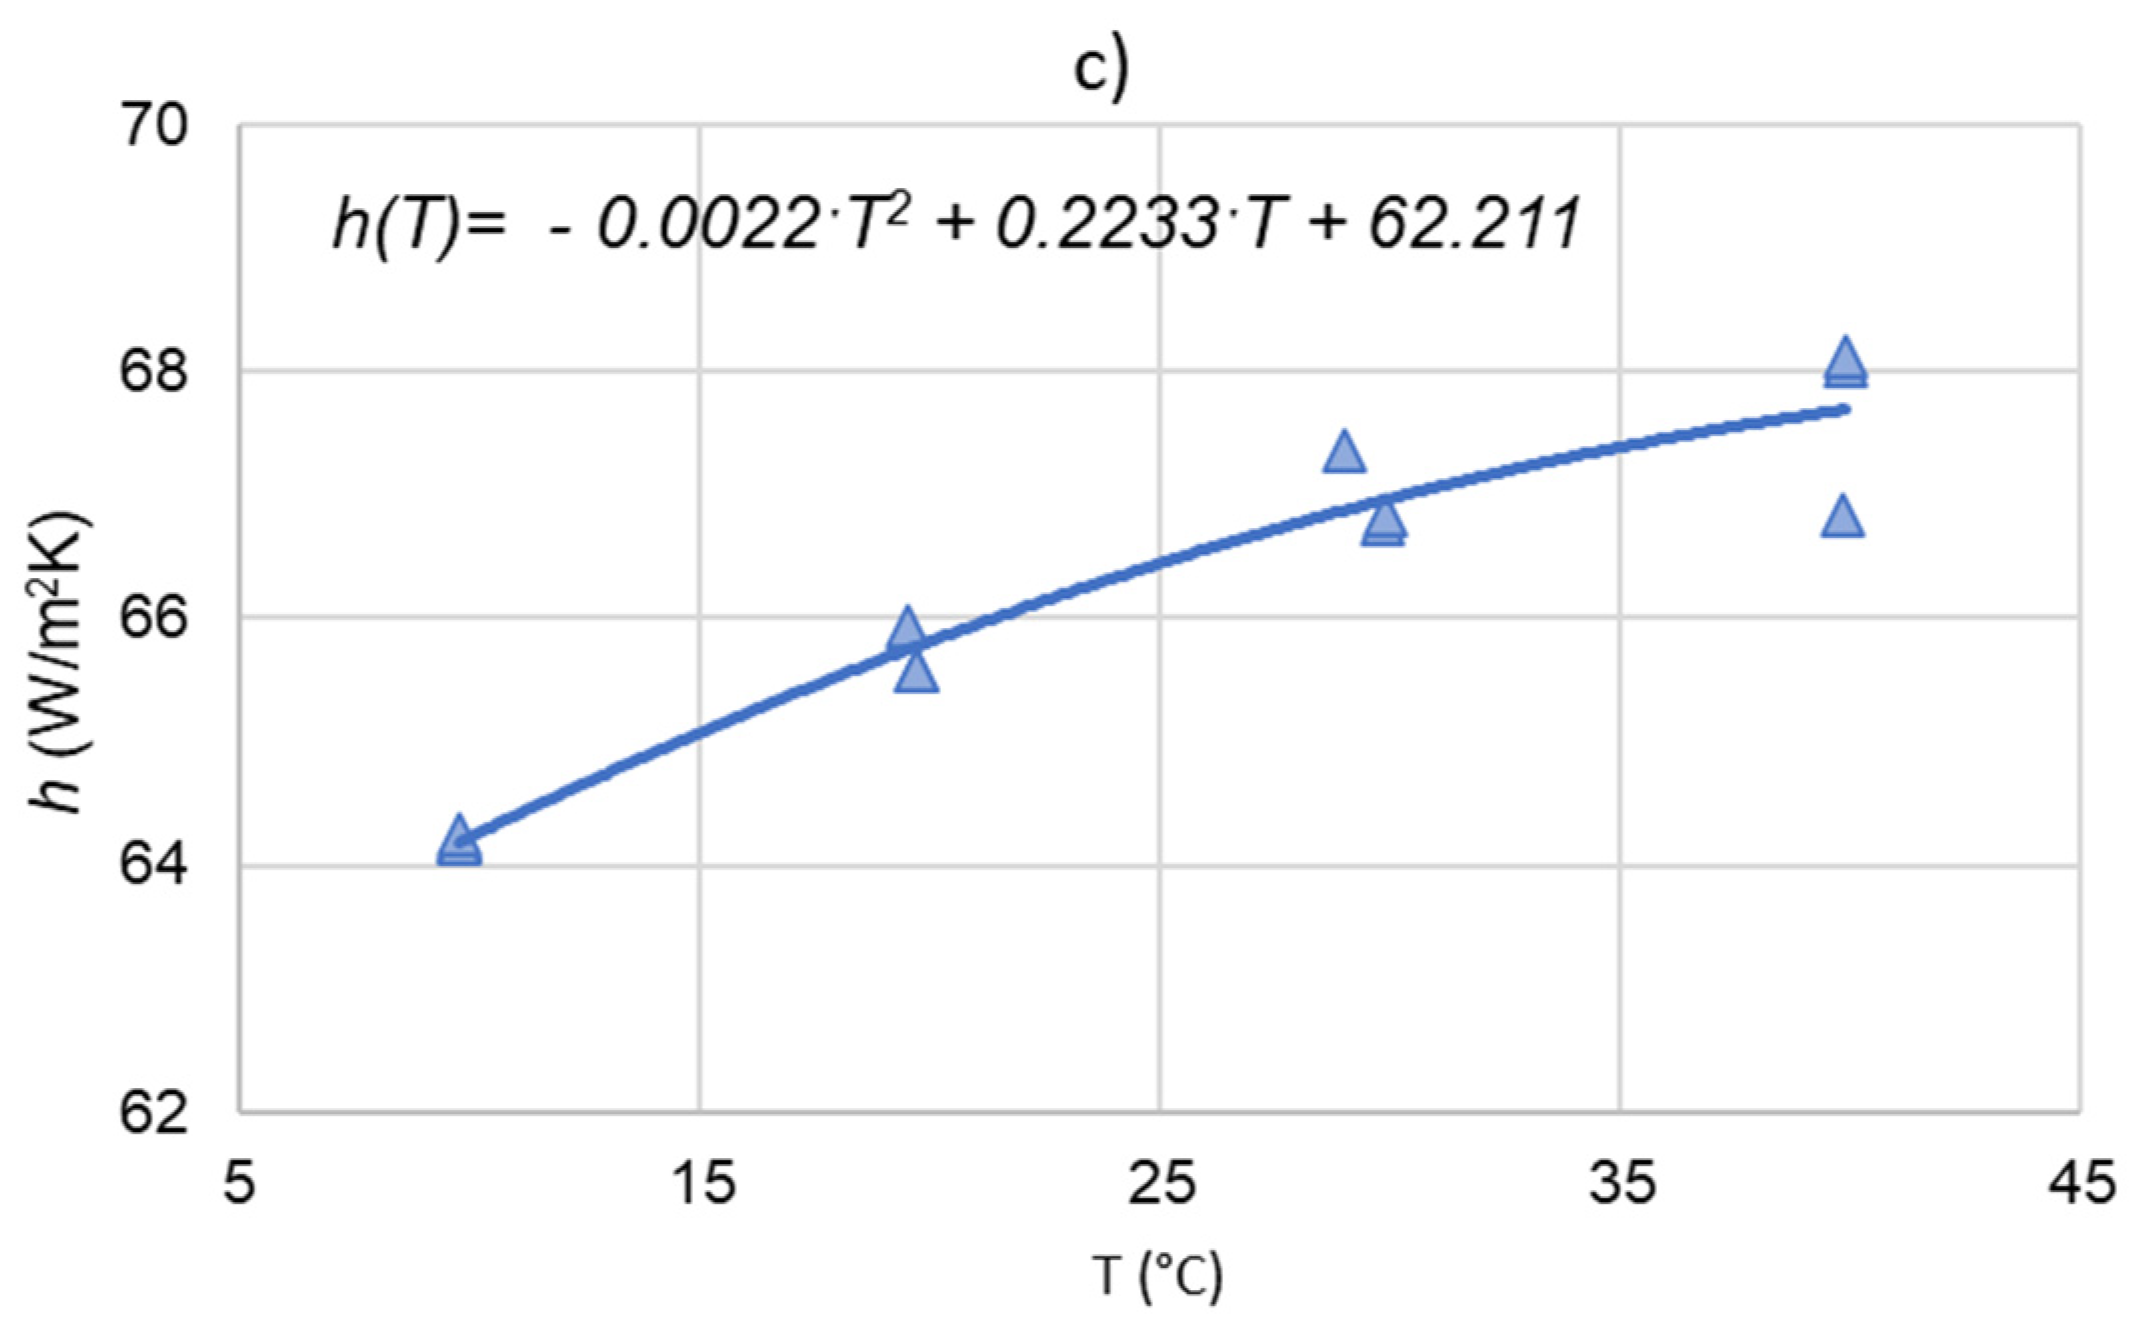
Figure 10c and Figure 11c show a meaningful increase of h vs. average test temperature T for the Al foam both in air and water: from 10 to 40 °C, h increases by 5.5% in air and by 2.5% in water. On the contrary, with pure fluids, h increases by 4.5% in air (from 31.5 to 33 W/m K, Figure 10a) and 25% in water (from 300 to 400 W/m K, Figure 11a).
(5)
At low ΔT (0.4 °C), h of Al foam in water (Figure 11d) increases with respect to pure water (Figure 11a), from 300 ÷ 400 W/m2K to 400 ÷ 410 W/m2K. At higher ΔT (3 °C), the two h remain about the same (480 and 490 W/m2K). This can indicate a higher effect of the heat conduction in aluminium for low ΔT. The PLA foam shows an even higher h: this could be possibly due to the higher temperature of the probe when inserted into the PLA lattice, which presents a much lower λ with respect to Al. Thus, the higher temperature difference produces a higher h.
(6)
h in PLA foam in air spans between 32 and 36 W/m2K (Figure 9b), while in pure air (Figure 9a) it increases from 31 to 33 W/m2K. Again, there is an effect of convective cell breaking due to the high porosity of the foam, which more relevant at higher temperatures than lower (see Section 7).
In conclusion, the test temperature from 10 to 40 °C increases h by 12% in air in PLA foam, and 7% in Al foam, while the same foams give a fairly constant h in water. No or little effect of ΔT in air was found, while ΔT increasing from 0.4 to 3 °C makes h of Al foam in water 20% higher.
Thus, using Al foams as heat exchangers at higher temperatures in air increases their performances, while the same cannot be said for water. When PLA foams are used, the heat exchanger performances also increase, but care must be taken to avoid temperatures that are too high, which can damage the material.

6. Uncertainty Analysis

Following the ISO GUM rule [36], both of the two components of uncertainty (type A and type B) were evaluated.

6.1. Thermal Conductivity

6.1.1. Type A Uncertainty

This is the uncertainty source evaluated with statistical methods. Repetitions of tests (see multiple data in the graphs of Figure 8, Figure 9, Figure 10 and Figure 11) belong to this uncertainty, as well as the prevision uncertainty obtained from least square regression procedure, e.g., in evaluating the slope of the linear portion of the ΔT vs. ln t trends. This last uncertainty is obtained from the diagonal elements of the covariance matrix of the unknown [37]. In any case, it results in being much lower than dispersion due to the repetitions of tests and the other type B sources, so it has been neglected in the sum in quadrature of the components [36].

6.1.2. Type B Uncertainty

The following uncertainty causes belong to this category:
-
Calibration uncertainty of thermocouple and TCP: when comparing the results obtained on a reference material (glycerol), an uncertainty of 4% was obtained [3];
-
Uncertainty due to uncalibrated thermocouples: generally, a 0.3 °C is attributed to this source, but considering the high number of TC measurements carried out during each test, this cause is negligible, and furthermore, calibration uncertainty already takes it into account; the same can be said about the uncertainty available in manuals and books, and the one due to the experience of the experimenter and previous tests.
Finally, a ±5% (one standard deviation) can be attributed to λ carried out measurements.

6.2. Convection Heat Transfer Coefficient

For what concerns the free convection heat transfer coefficient, its uncertainty is calculated by the defining equation:
h = Q ˙ A Δ T = R · I 2 2 π r L Δ T
Its relative standard deviation σh/h results in:
σ h h = σ R ¯ R ¯ 2 + 2 σ I ¯ I ¯ 2 + σ A A 2 + σ Δ T ¯ Δ T ¯ 2
(the bar over different quantities mean the average value over the whole considered period, e.g., in Figure 12 from 1000 to 2500 s). Among the terms in Equation (3), the greatest is the last, σ Δ T ¯ / Δ T ¯ . For instance, Figure 12 reports the temperature difference ΔT trend of a typical test (Al foam in water at 10 °C mean temperature and with a specific thermal power supplied of 139 W/m2). For this test, σ Δ T ¯ / Δ T ¯ results in 0.04%. Adding in quadrature to the other terms of Equation (3) does not meaningfully increase this value.
This procedure, however, highly underestimates the uncertainty, because it does not take into account the intrinsic variability of the free convection phenomenon. In fact, an uncertainty of at least 15 ÷ 20% is generally attributed to this quantity.
In conclusion, the random causes that influence the uncertainty associated with the phenomenon are:
-
The convective cell generation, and the secondary and third order cells;
-
The influence of the ambient conditions: temperature, humidity, pressure, etc.;
-
The statistical nature of the phenomenon: even in the same experimental conditions, the exact repetition of the results is very difficult to obtain;
-
The presence of obstacles in the fluid movement, as the foam can be considered, which leads to the declared uncertainty (20%).

7. Conclusions

A difference was found between the thermal conductivity measured with the probe method in transient state and with the guarded hot ring in steady state, and this difference is more evident in aluminium (Figure 9d) than in PLA foams (Figure 9c): this is due to the high λ of the metal which moves the heat source far from the probe at the beginning of tests. Also, the wall effect (measuring λ of a layer of pure fluid surrounding the TCP at the beginning of the test) can influence the difference between the TCP and the GHR tests.
The presence of the solid foam can have a double effect on h: generally, the very low percentage of solid in the foam makes the h values in free fluid comparable with that of the fluid–solid composite. But the presence of the solid structure can increase the conduction heat transfer (at least for aluminium), decreasing the h value. This could be the reason for the higher values of h for PLA foam in water (Figure 11b) compared with aluminium foam (Figure 11c).

Author Contributions

Methodology, P.C. and M.P.; Validation, P.C., S.C., G.C. and M.E.T.; Formal analysis, S.C. and M.P.; Investigation, G.B., P.C. and M.E.T.; Resources, G.C.; Data curation, G.B., P.C. and S.C.; Writing—original draft, P.C. and S.C. All authors have read and agreed to the published version of the manuscript.

Funding

This research received no external funding.

Data Availability Statement

The data presented in this study are available on request from the corresponding author.

Conflicts of Interest

The authors declare no conflict of interest.

Nomenclature

Acronyms
TCPThermal Conductivity Probe
PSPower Supply
TCThermocouple
DASData Acquisition System
GHRGuarded Hot Ring
PLAPoly Lactic Acid
Latin
AArea (m2)
Q ˙ Thermal power (W)
ddiameter (m)
Zheight (m)
hconvection heat transfer coefficient (W/m2K)
TTemperature
IElectric current (A)
RElectric resistance (Ω)
Llength (m)
ttime (s)
Greek
λthermal conductivity (W/m K)
Δdifference

References

  1. Abdul-Sahib, A.A.; Muneer, A. Experimental Steam Condensation Enhancement on Metal Foam Filled Heat Exchanger. J. Mech. Eng. Res. Dev. 2021, 44, 145–167. [Google Scholar]
  2. Pulvirenti, B.; Celli, M.; Barletta, A. Flow and Convection in Metal Foams: A Survey and New CFD Results. Fluids 2020, 5, 155. [Google Scholar] [CrossRef]
  3. Bovesecchi, G.; Coppa, P.; Pistacchio, S. A new thermal conductivity probe for high temperature tests for the characterization of molten salts. Rev. Sci. Instrum. 2018, 89, 055107. [Google Scholar] [CrossRef]
  4. Potenza, M.; Coppa, P.; Corasaniti, S.; Bovesecchi, G. Numerical Simulation of Thermal Diffusivity Measurements with the Laser-Flash Method to Evaluate the Effective Property of Composite Materials. J. Heat Transf. 2021, 143, 072102. [Google Scholar] [CrossRef]
  5. Hong, J.T.; Tien, C.L.; Kaviany, M. Non-Darcian effects on vertical-plate natural convection in porous media with high porosities. Int. J. Heat Mass Transf. 1985, 28, 2149–2157. [Google Scholar] [CrossRef]
  6. Andreozzi, A.; Buonomo, B.; Jaluria, Y.; Manca, O. Numerical Investigation on Natural Convection in Inclined Channels Partially Filled with Asymmetrically Heated Metal Foam. J. Heat Mass Transf. 2022, 145, 042602. [Google Scholar] [CrossRef]
  7. Ranut, P.; Nobile, E.; Mancini, L. High resolution microtomography-based CFD simulation of flow and heat transfer in aluminum metal foams. Appl. Therm. Eng. 2014, 69, 230–240. [Google Scholar] [CrossRef]
  8. Piller, M.; Stalio, E. Numerical Investigation of Natural Convection in Inclined Parallel-Plate Channels Partly Filled with Metal Foams. Int. J. Heat Mass Transf. 2012, 55, 6506–6513. [Google Scholar] [CrossRef]
  9. Corasaniti, S.; De Luca, E.; Gori, F. Effect of structure, porosity, saturating fluid and solid material on the effective thermal conductivity of open-cells foams. Int. J. Heat Mass Transf. 2019, 138, 41–48. [Google Scholar] [CrossRef]
  10. Calmidi, V.V.; Mahajan, R.L. The Effective Conductivity of High Porosity Fibrous Metal Foams. ASME J. Heat Transf. 1999, 121, 466–471. [Google Scholar] [CrossRef]
  11. Calmidi, V.V.; Mahajan, R.L. Forced Convection in High Porosity Metal Foams. J. Heat Transf. 2000, 122, 557–565. [Google Scholar] [CrossRef]
  12. Shih, W.H.; Chou, F.C.; Hsieh, W.H. Experimental Investigation of the Heat Transfer Characteristics of Aluminum-Foam Heat Sinks with Restricted Flow Outlet. J. Heat Transf. 2007, 129, 1554–1563. [Google Scholar] [CrossRef]
  13. Kuang, J.J.; Wang, X.L.; Lu, T.J.; Kim, T. Role of Laminar Length of Round Jet Impinging on Metal Foams. J. Thermophys. Heat Transf. 2015, 30, 103–110. [Google Scholar] [CrossRef]
  14. Dukhan, N.; Chen, K.C. Heat transfer measurements in metal foam subjected to constant heat flux. Exp. Therm. Fluid Sci. 2007, 32, 624–631. [Google Scholar] [CrossRef]
  15. Zhao, C.Y.; Lu, T.J.; Hodson, H.P. Natural convection in metal foams with open cells. Int. J. Heat Mass Transf. 2005, 48, 2452–2463. [Google Scholar] [CrossRef]
  16. Singh, P.; Nithyanandam, K.; Zhang, M.; Mahajan, R.L. The Effect of Metal Foam Thickness on Jet Array Impingement Heat Transfer in High-Porosity Aluminum Foams. J. Heat Transf. 2020, 142, 052301. [Google Scholar] [CrossRef]
  17. Maskery, I.; Sturm, L.; Aremu, A.O.; Panesar, A.; Williams, C.B.; Tuck, C.J.; Wildman, R.D.; Ashcroft, I.A.; Hague, R.J. Insights into the mechanical properties of several triply periodic minimal surface lattice structures made by polymer additive manufacturing. Polymer 2018, 152, 62–71. [Google Scholar] [CrossRef]
  18. Hwang, J.J.; Hwang, G.J.; Yeh, R.H.; Chao, C.H. Measurement of Interstitial Convective Heat Transfer and Frictional Drag for Flow Across Metal Foams. ASME J. Heat Transf. 2002, 124, 120–129. [Google Scholar] [CrossRef]
  19. Buonomo, B.; Manca, O.; Nardini, S.; Diana, A. Experimental and Numerical Investigation on Natural Convection in Horizontal Channels Partially Filled with Aluminium Foam and Heated from Below. In Proceedings of the ASME 2016 Heat Transfer Summer Conference collocated with the ASME 2016 Fluids Engineering Division Summer Meeting and the ASME 2016 14th International Conference on Nanochannels, Microchannels, and Minichannels, Washington, DC, USA, 10–14 July 2016. ASME Paper No: HT2016-7257. [Google Scholar] [CrossRef]
  20. Mancin, S.; Zilio, C.; Diani, A.; Rossetto, L. Air forced convection through metal foams: Experimental results and modeling. Int. J. Heat Mass Transf. 2013, 62, 112–123. [Google Scholar] [CrossRef]
  21. Duarte, A.P.C.; Mazzuca, P.; de Carvalho, J.L.; Tiago, C.; Firmo, J.P.; Correia, J.R. Determination of the temperature-dependent thermophysical properties of polymeric foams using numerical inverse analysis. Constr. Build. Mater. 2023, 394, 131980. [Google Scholar] [CrossRef]
  22. Boomsma, K.; Poulikakos, D.; Zwick, F. Metal foams as compact high performance heat exchangers. Mech. Mater. 2003, 35, 1161–1176. [Google Scholar] [CrossRef]
  23. Krishnan, S.; Murthy, J.Y.; Garimella, S.V. Metal foams as passive thermal control systems. In Emerging Topics in Heat and Mass Transfer in Porous Media; Vadász, P., Ed.; Springer: Berlin/Heidelberg, Germany, 2008; pp. 261–282. [Google Scholar]
  24. Mahjoob, S.; Vafai, K. A synthesis of fluid and thermal transport models for metal foam heat exchangers. Int. J. Heat Mass Transf. 2008, 51, 3701–3711. [Google Scholar] [CrossRef]
  25. Zhao, C.Y. Review on thermal transport in high porosity cellular metal foams with open cells. Int. J. Heat Mass Transf. 2012, 55, 3618–3632. [Google Scholar] [CrossRef]
  26. Ranut, P. On the effective thermal conductivity of aluminum metal foams: Review and improvement of the available empirical and analytical models. Appl. Therm. Eng. 2016, 101, 496–524. [Google Scholar] [CrossRef]
  27. Costanza, G.; Tata, M.E.; Trillicoso, G. Al foams manufactured by PLA replication and sacrifice. Int. J. Lightweight Mater. Manuf. 2021, 4, 62–66. [Google Scholar] [CrossRef]
  28. Costanza, G.; Del Ferraro, A.; Tata, M.E. Experimental set-up of the production process and mechanical characterization of metal foams manufactured by lost-PLA technique with different cell morphology. Metals 2022, 12, 1385. [Google Scholar] [CrossRef]
  29. Wechsler, A.E. The Probe Method for Measuring Thermal Conductivity. In Compendium of Thermophysical Property Measurement Methods; Recommended Measuring Techniques and Practices; Maglić, K.D., Cezairliyan, A., Peletsky, V.E., Eds.; Plenum Press: London, UK, 1992; Volume 2. [Google Scholar]
  30. D’Alessandro, G.; Potenza, M.; Corasaniti, S.; Sfarra, S.; Coppa, P.; Bovesecchi, G.; de Monte, F. Modeling and Measuring Thermodynamic and Transport Thermophysical Properties: A Review. Energies 2022, 15, 8807. [Google Scholar] [CrossRef]
  31. ASTM D5334-14; Standard Test Method for Determination of Thermal Conductivity of Soil and Soft Rock by Thermal Needle Probe Procedure. ASTM International: West Conshohocken, PA, USA, 2014.
  32. Le Fevre, E.J.; Ede, A.J. Laminar free convection from the outer surface of a vertical circular cylinder. In Proceedings of the 9th International Congress on Applied Mechanics, Brussels, Belgium, 5–13 September 1956; Volume 4, pp. 175–183. [Google Scholar]
  33. Haar, L.; Gallagher, J.S.; Kell, G.S. Thermodynamic and Transport Properties and Computer Programs for Vapor and Liquid State of Water; NBS/NRC; Hemisphere: Washington, DC, USA, 1984. [Google Scholar]
  34. Incropera, F.P.; Dewitt, D.P. Fundamental of Heat Transfer; John Wiley &Sons: Hoboken, NJ, USA, 1981. [Google Scholar]
  35. Blanco, I.; Cicala, G.; Recca, G.; Tosto, C. Specific Heat Capacity and Thermal Conductivity Measurements of PLA-Based 3D-Printed Parts with Milled Carbon Fiber Reinforcement. Entropy 2022, 24, 654. [Google Scholar] [CrossRef]
  36. ISO-IEC 98-3:2008; Uncertainty of Measurement—Part 3: Guide to the Expression of Uncertainty in Measurement (GUM:1995). ISO: Geneva, Switzerland, 2008.
  37. Brandt, S. Data Analysis: Statistical and Computational Methods for Scientists and Engineers; Springer: Cham, Switzerland, 2014. [Google Scholar]
Figure 1. Autocad® 2023 model of the samples.
Energies 16 05959 g001
Figure 2. Depiction of the two tested samples: PLA on the left and aluminium on the right.
Energies 16 05959 g002
Figure 3. Insertion of the PLA sample into the measuring cell.
Energies 16 05959 g003
Figure 4. Look of the TCP and its connections with the measuring apparatus (see Figure 5).
Energies 16 05959 g004
Figure 5. Sketch of the experimental apparatus with its components: 1—Stabilized Power Supply; 2—0.1 Ω Shunt; 3—DAS: data acquisition system; 4—Measuring cell, made of the glass container, the glass cover, the thermostatic fluid (water + ethylene glycol), and the TCP contained in it; 5—CJ: Dewar with mashed ice, acting as cold junction for the thermocouples; 6—Thermostat supplying the thermostatic fluid; 7—TC: internal cell wall thermocouple.
Energies 16 05959 g005
Figure 6. Typical trend of the temperature increase vs. logarithm of time.
Energies 16 05959 g006
Figure 7. ΔT vs. ln t for a test on TCP inserted in water mixed with agar agar.
Energies 16 05959 g007
Figure 8. Thermal conductivity λ in air: (a) only air [30]; (b) PLA foam; (c) Al foam.
Energies 16 05959 g008
Figure 9. Thermal conductivity in water: (a) only water: λ and Tables (Haar et al. [33]); (b) Al foam + water vs. TT = 0.35 ÷ 0.38 °C); (c) PLA in water + agar agar: λ steady state vs. TCP; (d) Al foam + agar agar: λ steady state and TCP (ΔT 2 ÷ 3.5 °C).
Energies 16 05959 g009
Figure 10. Convection heat transfer coefficient h in air: (a) only air, h vs. T; (b) PLA foam in air; (c) Al foam in air.
Energies 16 05959 g010aEnergies 16 05959 g010b
Figure 11. Convection heat transfer coefficient h in water: (a) only water: exp. h and LeFevre & Ede with different ΔT; (b) PLA foam in water; (c) Al foam in water—ΔT = 0.37 and 2.8 °C.
Energies 16 05959 g011
Figure 12. Typical probe temperature trends during an h measurement.
Energies 16 05959 g012
Table 1. Sequence of the operations to obtain the regular structure foam.
1build-up of the model with 3D CAD
2export to CAM software for 3D printing
33D printing of the model using PLA
4plaster casting on the PLA model
5mould drying
6PLA removing from the plaster
7metal casting into the plaster mould
8plaster removal to obtain a foam
Disclaimer/Publisher’s Note: The statements, opinions and data contained in all publications are solely those of the individual author(s) and contributor(s) and not of MDPI and/or the editor(s). MDPI and/or the editor(s) disclaim responsibility for any injury to people or property resulting from any ideas, methods, instructions or products referred to in the content.

