Article

Lowering the Temperature and Increasing the Fill Factor of Silicon Solar Cells by Filtering of Sub-Bandgap Wavelengths

1
Department of Chemical Engineering, Shamoon College of Engineering, Ashdod 77245, Israel
2
Department of Electronics Engineering, Shamoon College of Engineering, Ashdod 77245, Israel
3
Department of Chemistry, Bar-Ilan University, Ramat Gan 52900, Israel
*
Authors to whom correspondence should be addressed.
Energies 2023, 16(15), 5631; https://doi.org/10.3390/en16155631
Submission received: 18 June 2023 / Revised: 21 July 2023 / Accepted: 24 July 2023 / Published: 26 July 2023
(This article belongs to the Section A2: Solar Energy and Photovoltaic Systems)

Abstract

:
Silicon-based photovoltaic (PV) cells are currently the most prevalent and cost-effective solution for solar energy generation. Given their dominance in the market and the extensive research dedicated to them, they are ideal targets for efficiency enhancement through innovative yet straightforward methods. This study explores the potential for improving the efficiency of these cells by managing the PV’s temperature using an infrared (IR) filter. The filter allows photons that can generate free electron–hole pairs to pass while reflecting those with wavelengths below the semiconductor bandgap, which otherwise contribute to performance degradation. Various techniques were applied, including I–V analysis, impedance measurements, and atmospheric scanning electron microscope (Air-SEM) observations, to examine the temperature’s impact on silicon PVs. By integrating IR filters, the results showed a 3% increase in the fill factor and a temperature reduction of approximately 10 degrees Celsius. These findings highlight the potential of this cooling approach for silicon cells, which can enhance the cell’s longevity and efficiency, paving the way for future industrial applications.

1. Introduction

The escalating impacts of global warming are evident across the globe, largely driven by the excessive consumption of fossil fuels and the consequent CO2 emissions, which contribute to the greenhouse effect and climate change [1,2]. The ongoing crisis in Eastern Europe further underscores the urgent need for sustainable, eco-friendly energy alternatives. Solar energy, a plentiful renewable resource, is a prime candidate. Enhancing the efficiency of solar cells not only boosts energy production per unit area but also conserves increasingly scarce resources such as materials and space. Life cycle analysis reports on photovoltaic (PV) cells highlight their environmental impact, emphasizing the importance of reducing waste production [3]. The manufacturing process of solar PV equipment generates various forms of waste, including wastewater, waste gas, and solid waste. The recycling process for this equipment is complex due to the diversity of materials used and the multistep processing required. Improper disposal can lead to severe environmental damage [4,5]. Given the global energy crisis and the imperative to mitigate global warming, the drive to improve solar cell efficiency is more relevant than ever. PV cell degradation is influenced by factors such as humidity, corrosion, ultraviolet (UV) radiation, and temperature. PV cells absorb solar radiation, converting photons with bandgap wavelengths into electric current. Silicon PV cells typically absorb solar irradiance wavelengths from 200 nm to 1200 nm, converting them into electric power. Commercially available silicon PV cells have conversion efficiencies ranging from 12% to 18% under nominal operating temperature conditions. Efficiency is influenced by various physical properties of the materials used, such as bandgap and absorption capabilities, charge carrier excitation, and device collection properties, which can lead to recombination rather than current induction. Long infrared (IR) wavelengths, which constitute 30% of solar radiation, are converted into heat, raising the operating temperature of the PV cell. This increase in temperature negatively impacts panel efficiency [6,7,8,9]. On a clear summer day, cell temperatures can easily reach 60–70 °C for free-standing systems, significantly reducing efficiency and degrading power output properties. Studies show that power degradation can reach 2% a year [10,11]; thus, a solar field can lose up to 20% of its power output after only 10 years. Therefore, it is crucial to keep the cells’ temperature as low as possible in order to keep performance high for a longer period of time while ensuring sufficient light absorption for power generation, balancing cost-effectiveness and efficiency [12]. Various techniques exist for cooling PV modules. One way to tackle this issue today is by using thin-film polysilicon solar cells that can offer a cost-effective and promising alternative to traditional bulk silicon solar cells. Their thinner material composition reduces their reliance on the fluctuating silicon feedstock prices. However, these solar cells have historically exhibited lower performance than bulk Si solar cells due to factors such as small grain size and high recombination velocity at grain boundaries. To enhance the efficiency of polysilicon solar cells, it is imperative to gain a deeper understanding of hydrogen passivation. This knowledge will play a critical role in improving the overall performance of polysilicon solar cells [13]. Recent studies have explored the use of IR filters to manage heat in crystalline silicon PV modules, demonstrating that IR filters can significantly enhance cell efficiency [14,15,16]. The impact of these off-the-shelf IR filters on device temperature and the time required to reach maximum temperatures are investigated for the first time, together with the examination of the cell’s properties and fill factor in relation to temperature changes [17]. In this work, we investigate the effects of adding an IR cutoff filter and its influence on the silicon PV cell’s properties, with the aim of increasing the cell’s efficiency, while investigating the influence of the temperature of the cell with and without the filter. The main parameters we examined were the cell’s V o c and short-circuit current I s c , which indicate the device’s peak power output, alongside the device’s fill factor (FF), which linearly changes with the device’s efficiency and can be used as an indication on how it changes with temperature. Measurement of the current–voltage (I–V) characteristics is used both for practical applications and in fundamental research, including using a Nyquist plot to estimate the changes in the cell’s resistance showing measures of temperature influence on a loaded PV cell by the electron microscopy method under indoor illumination conditions. The scanning electron microscope technique is a research tool commonly used for obtaining topography and chemistry data at nanometer spatial resolution in a closed specimen chamber. However, the atmospheric scanning electron microscope (Air-SEM) technique has been developed as an alternative electron microscopy technique. An electron-transparent membrane is used to separate a vacuum from atmosphere pressure [18]. Operation in the air, without a specimen chamber, will enable the examination of an “unlimited” size of the loaded PV cell under indoor illumination conditions.

2. Experimental Setup

A standard DIY 6V crystalline silicon solar cell was utilized with dimensions of 4.5 cm by 4.5 cm, made from amorphous silicon. A series of experiments were conducted to reduce temperature using a super-cold filter from ASAHI SPECTRA Torrance, CA, USA, catalog number ZSC1100 (see Figure 1). This filter (5.5 cm by 5.5 cm) has a cutoff wavelength of around 1100 nm (see Figure 2). The transmission window of the filter is approximately 90% for wavelengths between 350 and 1000 nm, while monitoring the temperature changes in the cell over time using a thermocouple, under two distinct conditions—in darkness and under illumination. An Oriel Sol3A class AAA provided an illumination solar simulator from Newport Corporation [19] equipped with a 450 W xenon lamp [20]. Figure 3 shows the experimental setup where the filter was put on top of the solar cell covering its entire cell surface inside the solar simulator.

2.1. Optical Absorption Measurements

Absorption experiments were conducted using a Cary 5000 instrument. This instrument is an 88 high-performance UV–Vis–NIR spectrophotometer in the wavelength range of 175–3300 nm with an 89 Pbsmart detector.

2.2. I–V Measurements

For the I–V curve assessments, a Keithley 2410 Source Measure Unit (SMU) was used to adjust the voltage across the cell and record the corresponding current at each temperature point. The device’s response to heat in dark conditions was evaluated, heating it with a TEC1-01715 15 × 15 × 3 mm QMAX:17W Peltier instrument for temperatures between 20 and 60 °C and taking I–V measurements at each temperature point. All temperature readings were captured using a thermocouple. Subsequently, the PV device was placed within the solar simulator with the lights activated, allowing the lamp to gradually heat the cell. During this process, a series of measurements were taken such as the time required for the cell to reach its maximum temperature and I–V characteristic measurements at different temperature points under steady-state conditions. The experiment was repeated under identical illumination conditions, both with and without the filter, inside a solar simulator designed to replicate standard 1.5 air mass radiation. The collected data were processed using MATLAB code and further analyzed with Python. Measurements and error bars were taken by repeating the experiment ten times, and the STD for each point was calculated.

2.3. Impedance Spectroscopy

A Keysight LCR meter was used to measure the real (Z’) and imaginary (Z”) components of the device’s impedance and its response to heat in dark conditions. Impedance spectroscopy can shine light on how the cell’s parameters, such as resistance and capacitance, change with temperature; these parameters were then used to analyze the Nyquist curve [21,22,23]. The experimental setup was housed within a Faraday cage to isolate our system from external interference (see Figure 4), given the high sensitivity of our instruments. The solar device was placed inside the cage, and its impedance was evaluated across a range of AC frequencies from 20 Hz to 1 MHz at 1 V, under varying temperatures in the absence of illumination (dark conditions).

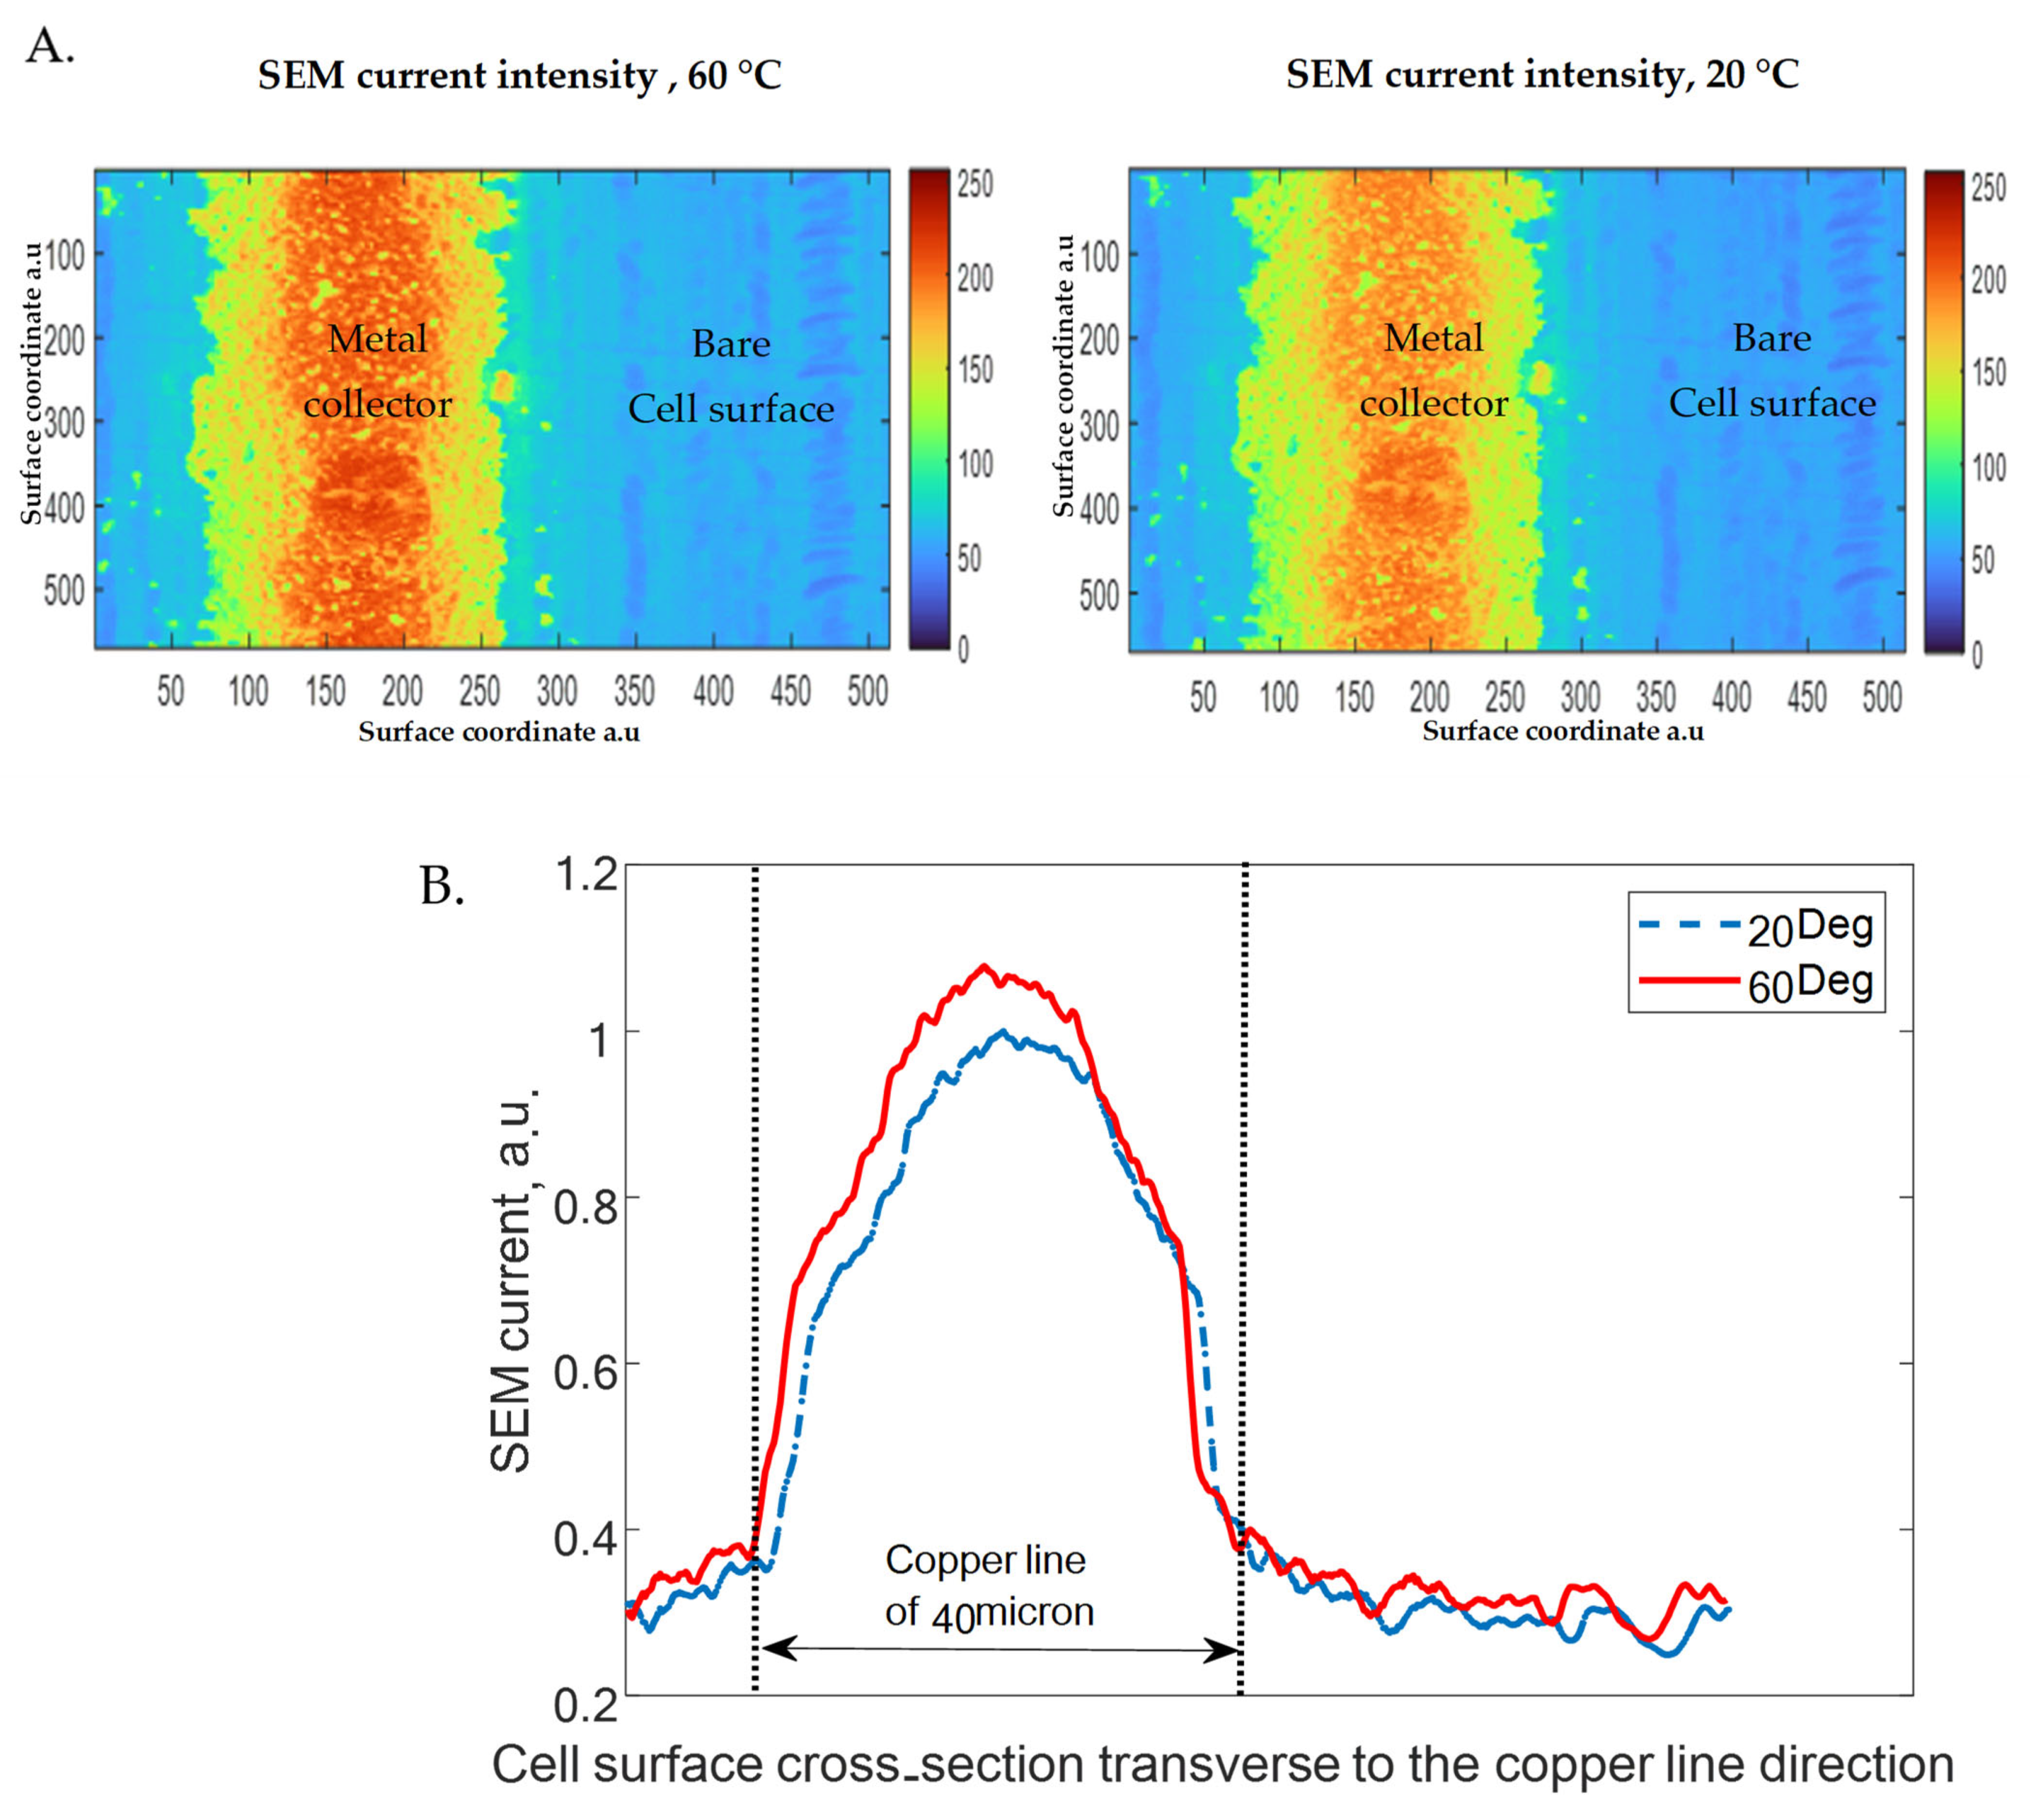
2.4. Air-SEM Microscope Measurements

In the atmospheric scanning electron microscope (Air-SEM) technology, electrons are released from a field emitter gun source under high vacuum conditions of 10-9 Torr. The lower section of the column is maintained at a mid-vacuum condition of 10-6 Torr, separated by a thin, electron-transparent silicon nitride (SiN) membrane measuring 250 µm × 250 µm × 10 nm. The air gap between the membrane and the sample is kept at 50 µm. Air-SEM is a unique technology that allows for the imaging of samples in their natural or as-prepared state without the need for special preparation such as coating or dehydration. This is possible because of the electron-transparent membrane that separates the vacuum from the sample environment, allowing the electron beam to interact with the sample in a near-native state. In this study, we utilized a back-scattered electron (BSE) detector. Back-scattered electrons are high-energy electrons that are reflected or back-scattered out of the specimen by elastic scattering interactions with specimen atoms. BSEs are often used in analytical SEM, along with the spectra made from the characteristic X-rays, because the intensity of the BSE signal is strongly related to the atomic number (Z) of the specimen. BSE images can provide information about the distribution, but not the identity, of different elements in the sample. The resolution of the Air-SEM for this work was determined to be superior to 5 nm at 30 keV, and the contrast/brightness was kept constant for all measurements. This high resolution allows for detailed imaging of the sample, providing valuable insights into its structure and composition.

3. Results and Discussion

3.1. Transmittance Results

In order to evaluate the filter’s transmittance window and impact on the illumination power, spectrum analysis was made showing an average of 90% transmittance in the relevant spectrum.

3.2. Dark Test Results

In the quest to understand the impact of temperature on solar cells and to learn the potential of the IR filter in mitigating these effects, a series of experiments were conducted to first measure the cell’s electrical properties. These measurements were taken under a variety of temperature conditions, ranging from 20 °C to 60 °C, in the absence of light. Although temperatures can reach even 80 degrees when operating in the sun, this can clearly show the effects that temperature has on the device. Staying in this range allows us to look at our particular device in its entire operating range in our lab conditions, and there was no need to explore higher temperatures as the maximum temperature under the lap reached 60 °C. Impedance spectroscopy was used as a powerful tool for characterizing the electrical properties of PV panels to investigate how temperature variations influenced the panels. This technique allowed us to gain insights into the internal behavior of the panels and how they change with temperature [24]. The equivalent circuit for the PV panel, as illustrated in Figure 5, includes a series resistance ( R s ), a parallel resistance ( R s h ), a parallel capacitance ( C p ), and a diode. This circuit representation provides a comprehensive understanding of the electrical behavior of the PV panel and underscores the significance of cooling the device. By examining the changes in these circuit components under different temperatures, it was possible to gain valuable insights into the effects of temperature on the performance of the solar cell and the potential benefits of using an IR filter for device cooling.
To understand the relationship between current and resistance, we refer to Equation (1):
I = I L I 0   e x p q V k T V R S H
In this equation, R s h represents the parallel resistance, R s is the series resistance, and k is the Boltzmann constant. The Nyquist plots, as depicted in Figure 6, exhibit single semicircle structures, indicative of the uniform p-n junction capacitance and resistivity of polycrystalline PV cells. The shunt resistance equals 2Xs, and C p is calculated as per Equation (2):
C p = 1 ω 2 X s ( F )
Here, X s equals the maximum value of X.
Our observations reveal that the changes in C p are minimal: C p = 6.87   n F at 30 °C and C p = 6.74   n F at 60 °C. However, the shunt resistance values decreased significantly from 120 KΩ at 30 °C to 47 KΩ at 60 °C. This reduction in R s h is attributed to the increased concentration of minority carriers in the depletion zone as the temperature rises. Minor changes in capacitance are observed due to an increase in the minority carrier current in the depletion region. Subsequently, we fitted the imaginary part of the cell’s impedance as a function of two temperatures, 30 °C and 60 °C, for the parallel resistor and capacitor (RC) (as shown in Figure 6B). This fitting process aimed to validate our measurements and assess the suitability of this model circuit for our cell. The fitting was based on an article by A. Bouzidi, which provided an equation for the impedance imaginary part [25,26,27]:
X = ω R s h 2 C p 1 + ω R s h C p 2
The fitting results reveal a close resemblance between the resistance measured in the Nyquist diagram and the results of the RC model, confirming a significant drop in the device’s resistance with temperature. The minor differences between the Nyquist and fit values are negligible. As a result of this resistance drop, the device’s power output is highly affected as the I–V curve gets less of a square shape, and more current is lost inside the device and not getting to the collectors. These findings, derived from impedance spectroscopy, underscore the significant impact of temperature dependence on device parameters and its substantial effect on efficiency [28].
In the next phase of our study, we utilized Air-SEM to measure the changes in current with temperature.
Figure 7 presents the SEM current from the solar cell versus the surface coordinates of the cell. The blue color presents the low current intensity of the bare silicon surface. The area of the yellow and red colors presents the metal conductor line on the surface of the cell, showing the increase in current at low voltages close to zero as the temperature rises, a phenomenon observed using the innovative Air-SEM technology. This technology enables us to examine the cell under standard temperature and pressure (STP) conditions. The unique feature of Air-SEM is the absence of a specimen vacuum chamber, which facilitates easy investigation of the temperature’s influence under the cell samples’ load conditions. As depicted in Figure 7, there is a clear increase in current as a function of temperature. This trend is later mirrored in the results of the I–V measurements under illuminated conditions. The ability to observe these changes in real time under standard conditions provides valuable insights into the temperature-dependent behavior of the solar cell and further underscores the potential of Air-SEM technology in this field of study.

3.3. Illumination Test Results

To assess the effectiveness of the IR filter in reducing temperature and enhancing efficiency under illuminated conditions, we plotted a temperature over time graph. The impact of the IR filter on the PV cell temperature was measured within the solar simulator. We first recorded the temperature of the silicon solar cell (without the filter) over time to understand how the IR filter influences the device’s temperature under illumination (refer to Figure 8).
The maximum temperatures observed were approximately 10 °C lower with the filter. The time required for the device to reach its maximum temperature (5τ) extended from 25 to 45 min when the filter was used, suggesting that the filter enhances the device’s thermodynamic properties. After 15 min, the cell without the filter reached 50 °C, while in the cell with the filter, it was only 35 °C, a difference of 15 °C. This difference persisted for 30 min until both reached their maximum temperatures after roughly 50 min. The maximum temperature difference observed was 12 °C (see Figure 8). These findings confirm that the filter operates as anticipated, helping to maintain lower cell temperatures by filtering out some radiation that does not contribute to the current. These results align with those of Asmaa Ahmed [13], who also demonstrated that an effective filter can improve solar efficiency for silicon devices. The drop in the open-circuit voltage ( V o c ) is significantly influenced by the bandgap reduction (see Equation (4)), which is directly related to temperature. These energy losses and heat transfer effects can substantially diminish the device’s efficiency, leading to an efficiency drop of about 0.5% for a 1 °C rise (as per Equation (4)). We aim to minimize these effects by filtering out unnecessary IR wavelengths, which, in the case of silicon, do not contribute to electricity production.
d V o c d T = V G 0 V o c + γ k T q T 2.2   m V   p e r   C   f o r   S i
where V G 0 is the bandgap voltage and γ representing other possible material temperature dependencies and is equal to 3 for silicon. The bandgap determining the time constants and temperature drops of the solar cell, it was important to understand how the filter influenced the device’s efficiency and power output. Figure 9 presents the I–V curves of the device with and without the filter at various temperatures ranging from 20 °C to 60 °C.
The I–V curve provides insights into the primary effects of temperature and the filter on the cell’s performance. As depicted in Figure 9, the short-circuit current ( I s c ) increases with temperature. This rise in temperature reduces the cell’s bandgap and increases the number of minority carriers due to the additional energy introduced into the system. This effect is most evident with the Air-SEM measurements in Figure 7. The increase in temperature adds kinetic energy to the charge carriers, leading to voltage loss due to the decrease in bandgap energy and from heat dissipation in the solar cell, which also contributes to an increase in defects and more phonons states that absorb that energy. This, in turn, elevates the charge carrier concentration and reduces their diffusion length, a significant cause of voltage losses. With that, the decrease in shunt resistance results in higher reverse currents and accelerated recombination, leading to a reduction in open-circuit voltage ( V o c ), which also impacts the fill factor (FF) of the device [6,29,30]. In Figure 9, a comparison of the I–V relation with the filter reveals similar effects. However, the rise in temperature is 10 °C lower, resulting in a better FF, and the effect of the V o c drop is less pronounced. This effect will be further discussed in relation to power output in Figure 10.
Figure 10 demonstrates that the maximum power point (MPP) of the cell significantly decreases as the temperature rises, even when using the filter. We observe approximately a 17% drop in power output when using the filter under the same light conditions, primarily due to the filter’s reflectiveness resulting in less light reaching the cell. This is compared with the results in Asmaa Ahmed’s study [14] and performance characteristics [24], where the drop in the power output was around 60% with an IR filter. By merely changing the filter, we achieve much better results, with the MPP shifting to the right, as shown in the FF graph (Figure 11). This indicates that using the filter can achieve higher efficiency for the same working load. However, our current filter is not entirely transparent to other wavelengths that the silicon cell can absorb, causing a power drop mainly caused by a drop in current, even though the cell’s efficiency increases due to lower temperatures and higher V o c .
Figure 11 shows that when using the filter, the FF stabilizes at around 70%, while under direct light, it drops to 67% as the temperature stops increasing when using the filter. These measurements were taken from within the solar simulator and with dedicated LabVIEW 2014 I-V dedicated software designed to evaluate solar cell parameters. In large-scale solar arrays, even a modest 3% improvement can result in a significant amount of power generated. Additionally, a temperature drop of around 10 °C can lead to less maintenance and money spent on active cooling solutions. The difference in FF is due to less energy reaching the cell, increasing the ratio of flux to power output. The lower temperature keeps the V o c of the device high, which significantly affects the efficiency. Therefore, if we can enhance the filter’s transparency for bandgap photons such that it only cuts off wavelengths that are outside the absorption range of a device we aim to improve, we will be able to achieve better results and efficiency while illuminating with the same flux. This will maximize the power output of the device and its lifespan by reducing heat degradation.
The results were calculated from the I–V curve presented in Figure 9 using I–V Software calculating the parameters as V o c is intersecting with the x axis. Table 1 shows the changes in parameters; we can see that there is a rise in the FF. This happens because V o c is higher with the filter due to the lower temperatures and lower shunt ressistance. Equation (4) demonstrates how V o c is affected by this temperature difference. Therefore, even when the MPP drops due to the current drop caused by the filter transmittance, the squareness of the I–V curve is better, which is what the FF is representing and is linearly connected to efficiency.

4. Conclusions

In this study, we explored the potential of an infrared filter in mitigating temperature-induced power losses in a silicon solar cell device. Our findings confirmed that the use of an IR filter allowed the device to maintain higher efficiency for a prolonged period. Showing a 3% rise in FF while using the filter that can also be seen by a higher V o c at high temperatures. We also examined how other device parameters change due to high temperature, utilizing the innovative technology of the Air-SEM. The results were in line with the expectations: by achieving approximately a 3% increase in fill factor and between 10 and 15 °C difference in temperature with a longer time constant. Using the filter to lower the cell’s temperature resulted in higher resistance, leading to this fill factor increase. This can significantly enhance the power output and lifespan of a solar field. Despite a 13% drop in power due to the lower transparency of the filter, the overall outcome still represents an improvement compared with previous studies in this field.
An ideal filter would further enhance the efficiency of a silicon solar cell. In future work, we plan to investigate innovative perovskite cells [30]. While these cells still face challenges related to lifespan and degradation, this type of filtering method can offer a cost-effective way to improve the cells’ lifespan and power generation. Finding the right combination of a filter and a solar cell is a complex task.
In conclusion, IR radiation significantly impacts the cell’s temperature and performance over time, and correctly filtering it can result in an efficiency and durability boost for a single cell or an entire PV array. Our current filter is not entirely transparent to other wavelengths that the silicon cell can absorb, causing a power drop even though the cell’s efficiency increases due to lower temperatures. It can still make some improvements in the efficiency leading to future work where the aim will be to identify the right materials to develop an optimal filter that will eliminate all the IR radiation and transmit all the silicon bandgap energy. It would also be beneficial to find a way to harness this wasted IR energy and use it to produce electricity instead of merely filtering it. Overall, our study contributes to the ongoing efforts to maximize the potential of solar energy, a crucial step toward a more sustainable and energy-efficient future. Our findings highlight the potential of infrared filters as a simple and effective solution. However, further research is needed to optimize the design and material of these filters and to validate these findings in real-world applications.

Author Contributions

Resources, A.I.; Writing—original draft, O.G.; Writing—review & editing, P.B. and Z.F. All authors have read and agreed to the published version of the manuscript.

Funding

This research received no external funding.

Data Availability Statement

Not applicable.

Acknowledgments

A.I. thanks the Israel Ministry of Science & Technology Ph.D. fellowship support at BI.

Conflicts of Interest

The authors declare no conflict of interest.

References

  1. Tawalbeh, M.; Al-Othman, A.; Kafiah, F.; Abdelsalam, E.; Almomani, F.; Alkasrawi, M. Environmental impacts of solar photovoltaic systems: A critical review of recent progress and future outlook. Sci. Total Environ. 2021, 759, 143528. [Google Scholar] [CrossRef] [PubMed]
  2. Baharwani, V.; Meena, N.; Dubey, A.; Brighu, U.; Mathur, J. Life cycle analysis of solar PV system: A review. Int. J. Environ. Res. Dev. 2014, 4, 183–190. [Google Scholar]
  3. Fthenakis, V.M.; Kim, H.C. Photovoltaics: Life-cycle analyses. Sol. Energy 2011, 85, 1609–1628. [Google Scholar] [CrossRef]
  4. Hosenuzzaman, M.; Rahim, N.A.; Selvaraj, J.; Hasanuzzaman, M.; Malek, A.B.M.A.; Nahar, A. Global Prospects, Progress, Policies, and Environmental Impact of Solar Photovoltaic Power Generation; Renewable and Sustainable Energy Reviews; Elsevier: Amsterdam, The Netherlands, 2015; Volume 41, pp. 284–297. [Google Scholar]
  5. Kim, J.; Rabelo, M.; Padi, S.P.; Yousuf, H.; Cho, E.-C.; Yi, J. A Review of the Degradation of Photovoltaic Modules for Life Expectancy. Energies 2021, 14, 4278. [Google Scholar] [CrossRef]
  6. Cuce, E.; Cuce, P.M.; Bali, T. An experimental analysis of illumination intensity and temperature dependency of photovoltaic cell parameters. Appl. Energy 2013, 111, 374–382. [Google Scholar] [CrossRef]
  7. Martin, L.; Poulek, V.; Kouřím, P. Temperature changes of IV characteristics of photovoltaic cells as a consequence of the Fermi energy level shift. Res. Agric. Eng. 2017, 63, 10–15. [Google Scholar]
  8. Kirchartz, T.; Rau, U. What Makes a Good Solar Cell? Adv. Energy Mater. 2018, 8, 1703385. [Google Scholar] [CrossRef] [Green Version]
  9. Klugmann-Radziemska, E. The effect of temperature on the power drop in crystalline solar cells. Renew. Energy 2003, 28, 1–12. [Google Scholar] [CrossRef]
  10. Romero-Fiances, I.; Livera, A.; Theristis, M.; Makrides, G.; Stein, J.S.; Nofuentes, G.; de la Casa, J.; Georghiou, G.E. Impact of duration and missing data on the long-term photovoltaic degradation rate estimation. Renew. Energy 2022, 181, 738–748. [Google Scholar] [CrossRef]
  11. Deceglie, M.G.; Silverman, T.J.; Johnston, S.W.; Rand, J.A.; Reed, M.J.; Flottemesch, R.; Repins, I.L. Light and Elevated Temperature Induced Degradation (LeTID) in a Utility-Scale Photovoltaic System. IEEE J. Photovolt. 2020, 10, 1084–1092. [Google Scholar] [CrossRef]
  12. Arora, N.D.; Hauser, J.R. Temperature dependence of silicon solar cell characteristics. Sol. Energy Mater. 1982, 6, 151–158. [Google Scholar] [CrossRef]
  13. Carnel, L.; Gordon, I.; Van Gestel, D.; Beaucarne, G.; Poortmans, J. Hydrogen Passivation of Thin-film Polysilicon Solar Cells. MRS Online Proc. Libr. 2006, 989, 1811. [Google Scholar] [CrossRef]
  14. Ahmed, A.; Alzahrani, M.; Shanks, K.; Sundaram, S.; Mallick, T.K. Effect of Using an Infrared Filter on the Performance of a Silicon Solar Cell for an Ultra-High Concentrator Photovoltaic System. Mater. Lett. 2020, 277, 128332. [Google Scholar] [CrossRef]
  15. Yang, W.; Xie, G. The design of UV/IR cut-off filter for silicon solar cell. Art 2006, 6149, 61492Q. [Google Scholar] [CrossRef]
  16. Chapter 3 Semiconductors. In Book Physics of Solar Cells by Peter Würfel Physics of Solar Cells; Wiley Online Library: Hoboken, NJ, USA, 2005; pp. 37–84. [CrossRef]
  17. Nguyen, K.; Holtz, M.; Richmond-Decker, J.; Muller, D. Spatial Resolution in Scanning Electron Microscopy and Scanning Transmission Electron Microscopy Without a Specimen Vacuum Chamber. Microsc. Microanal. 2016, 22, 754–767. [Google Scholar] [CrossRef]
  18. Newport Company Sol3A Calss AAA Solar-Simulators. Available online: https://www.newport.com/f/class-aaa-solar-simulators (accessed on 17 June 2023).
  19. Levi, L. (Ed.) Applied Optics: A Guide to Optical System Design; Wiley Online Library: Hoboken, NJ, USA, 1968; p. 214. [Google Scholar]
  20. Garland, J.E.; Crain, D.; Roy, D. Impedance spectroscopy coupled with voltammetry for quantitative evaluation of temperature and voltage dependent parameters of a silicon solar cell. Sol. Energy 2011, 85, 2912–2923. [Google Scholar] [CrossRef]
  21. von Hauff, E. Impedance Spectroscopy for Emerging Photovoltaics. J. Phys. Chem. C 2019, 123, 11329–11346. [Google Scholar] [CrossRef] [Green Version]
  22. Priyanka, S.S.N.; Singh, M.; Lal, M.H. Temperature dependence of I–V characteristics and performance parameters of silicon solar cell. Sol. Energy Mater. Sol. Cells 2008, 92, 1611–1616. [Google Scholar] [CrossRef]
  23. Cotfas, D.T.; Cotfas, P.A.; Machidon, O.M. Study of Temperature Coefficients for Parameters of Photovoltaic Cells. Int. J. Photoenergy 2018, 2018, 5945602. [Google Scholar] [CrossRef] [Green Version]
  24. Bouzidi, A.; Jilani, W.; Zahran, Y. Impedance spectroscopy of monocrystalline silicon solar cells for photosensor applications: Highly sensitive device. Phys. B Condens. Matter 2020, 596, 412375. [Google Scholar] [CrossRef]
  25. Mora-Sero, I.; Garcia-Belmonte, G.; Boix, P.P.; Vazquez, M.A.; Bisquert, J. Impedance spectroscopy characterisation of highly efficient silicon solar cells under different light illumination intensities Energy. Environ. Sci. 2009, 2, 678–686. [Google Scholar]
  26. Dhass, A.D.; Natarajan, E.; Ponnusamy, L. Influence of shunt resistance on the performance of solar photovoltaic cell. In Proceedings of the International Conference on Emerging Trends in Electrical Engineering and Energy Management (ICETEEEM), Chennai, India, 13–15 December 2012; pp. 382–386. [Google Scholar] [CrossRef]
  27. Chander, S.; Purohit, A.; Sharma, A.; Nehra, S.P.; Dhaka, M.S. A study on photovoltaic parameters of mono-crystalline silicon solar cell with cell temperature. Energy Rep. 2015, 1, 104–109. [Google Scholar] [CrossRef] [Green Version]
  28. Priyanka Singh, N.M. Ravindra, Temperature dependence of solar cell performance—An analysis. Sol. Energy Mater. Sol. Cells 2012, 101, 36–45. [Google Scholar] [CrossRef]
  29. Chegaar, M.; Hamzaoui, A.; Namoda, A.; Petit, P.; Aillerie, M.; Herguth, A. Effect of Illumination Intensity on Solar Cells Parameters. Energy Procedia 2013, 36, 722–729. [Google Scholar] [CrossRef]
  30. Yang, G.; Ren, Z.; Liu, K.; Qin, M.; Deng, W.; Zhang, H.; Wang, H.; Liang, J.; Ye, F.; Liang, Q.; et al. Stable and low-photovoltage-loss perovskite solar cells by multifunctional passivation. Nat. Photon. 2021, 15, 681–689. [Google Scholar] [CrossRef]
Figure 1. (A) Super cold filter used for the experiment. (B) Standard silicon cell.
Energies 16 05631 g001
Figure 2. Filter’s transmittance window within the silicon bandgap wavelength (300–1100 nm), showing a cutoff wavelength around 1100 nm where the silicon also stops absorbing.
Energies 16 05631 g002
Figure 3. Solar simulator experimental setup: the cell is put under the lamp adjusted at the right height, for a 1.5 AM sun irradiance calibrated using a dedicated photodiode, then connected to a thermocouple through a hole under the metal holing plate. It was then connected to LCR for I–V characteristics. The same test was made with the filter on top of the cell as seen in the top schematics.
Energies 16 05631 g003
Figure 4. Impedance spectroscopy experiment setup: the cell is sitting on a Peltier hot plate for controlling the temperature and put inside a Faraday cage connected to the LCR meter, in a dark environment.
Energies 16 05631 g004
Figure 5. Equivalent solar cell circuit: current source with a diode as the cell’s PN junction with 1 parallel RC and a series resistor.
Energies 16 05631 g005
Figure 6. (A) Nyquist plot of the cell’s impedance shows the cell’s change in Cp and Rsh for different temperatures. (B) Impedance imaginary part fit for validating results.
Energies 16 05631 g006
Figure 7. (A) Air-SEM scan of the current of surface solar cell: the rise in current with temperature is demonstrated. The difference between the blue cold area, which is the cell’s bulk PN junction, and the hot red area, which is the metal collector line on top of the cell as the temperature of the metal, is higher, meaning the current is greater. We can see how the current is affected by temperature. (B) Same picture presented as a graph showing the current rise with temperature more clearly where the x values represent spatial cross section and y is current.
Energies 16 05631 g007
Figure 8. Device temperature over time; in red, with the filter showing a drop of 15 degrees °C; in blue, without filter reaching 55 °C after 40 min.
Energies 16 05631 g008
Figure 9. I–V measurements of the cell: the solid lines representing the results without the filter; the dashed lines are with the filter. We are able to see that at max temperatures, we obtain a better V o c with the filter than without.
Energies 16 05631 g009
Figure 10. Cell power output with and without the filter: comparison—corresponding to the I–V in Figure 9. The solid lines represent the power without the filter showing the drop in power with temperature. The dashed lines show the same with a right shift of the MPP indicating an efficiency increase; the error bars were calculated with the same method.
Energies 16 05631 g010
Figure 11. F-F ratio (%) as function of temperature for silicon cell inside solar simulator.
Energies 16 05631 g011
Table 1. Cell parameters as function of temperature with and without the filter.
No FilterFilter
Temperature204060204050
V o c (V)5.885.545.335.815.605.39
I s c (A)0.04400.04490.04550.0350.0360.037
FF (%)737067737270
MPP (W)0.1880.1750.1660.1530.1470.141
Disclaimer/Publisher’s Note: The statements, opinions and data contained in all publications are solely those of the individual author(s) and contributor(s) and not of MDPI and/or the editor(s). MDPI and/or the editor(s) disclaim responsibility for any injury to people or property resulting from any ideas, methods, instructions or products referred to in the content.

