1. Introduction
Since 2014, the Caribbean coasts have experienced an unusually massive influx of pelagic sargassum. Its accumulation along the coast has led to financial loss, public health issues and damage to the ecosystem [
1]. These macroalgae blooms have led to the formation of the Great Atlantic Sargassum Belt (GASB). The GASB is over 8850 km long, extending from the west of Africa to the Gulf of Mexico and containing an estimated 20 million tonnes of biomass [
2]. Sargassum is a brown macroalga that forms floating rafts on the ocean’s surface and is transported along the Caribbean carried by mesoscale eddies exceeding 50 km in radius [
3]. Along with economic issues like the fall in tourism and investment and the disruption to navigation [
4], the accumulation of this biomass along the coastline has resulted in both biochemical and hydrodynamic changes affecting the development of ecotourism services offered in the region. It has also impacted the mangrove root system, which could lead to the loss of the mangrove forest habitat [
5].
Finding alternatives that give it value may help to reduce the impact of these recurring nuisance macroalgal blooms. It was discovered that this algal biomass has the potential for producing biofuel, to be precise, biogas that is created via anaerobic digestion (AD) [
6]. Biogas can be stored, and its use contributes to reducing the use of fossil fuels and the emission of greenhouse gases [
7]. The utilization of seaweeds in AD is currently in its nascent stage, primarily confined to laboratory-scale investigations [
8].
However, it was discovered that mono-digestion of sargassum could present some difficulties when extracting energy via AD due to the limited availability of carbohydrates for decomposition and the presence of recalcitrant materials such as salts, polyphenols, cellulose fibers and lignin [
9,
10], as well as the unpredictability of the available volume of this biomass. On the other hand, anaerobic co-digestion (ACoD), the digestion of algae biomass along with other organic waste, has been demonstrated as a technology that could improve biomethane production and promote its use and displays a positive synergy in the decomposition of the co-substrates. The combination of different substrates in ACoD compensates for the disadvantages when using single substrates [
8,
11,
12,
13,
14,
15]. ACoD can significantly reduce the impact of toxic substances and process inhibitors, such as the concentrations of ammonia, Na
+, Ca
2+, Mg
2+, sulfides, inorganic salts and heavy metals, among others. It was discovered that the combination of different kinds of biowaste could increase the fertilizer value of the digestate [
16] and contribute to the recycling of nutrients in the ecosystem [
15].
ACoD can significantly reduce the impact of toxic substances and process inhibitors, such as the concentrations of ammonia, Na
+, Ca
2+, Mg
2+, sulfides, inorganic salts and heavy metals, among others. It was discovered that the combination of different kinds of biowaste could increase the fertilizer value of the digestate [
16], thereby contributing to the recycling of nutrients in the ecosystem [
15]. Furthermore, the digestate derived from the ACoD process contains relevant plant nutrients (NPK) and organic carbon contents, and the accruing soil organic carbon is considered a key strategy to curb the rise of atmospheric CO
2 concentration [
17].
Furthermore, it enables the combined use of the facilities for the treatment of different wastes, and this can compensate for the seasonal fluctuations in the production of any individual substrates. The cornerstone of a circular economy is the efficient use of available resources, and ACoD enables the use of diverse organic waste materials while providing them with new value [
18].
Rapid urbanization has led to a substantial increase in the generation of solid urban waste (SUW), 15–30 percent of which is food waste [
19]. Likewise, this organic waste material is highly biodegradable and can be used to generate bioenergy via AD [
20].
From this perspective, waste from forest-, agriculture- and marine-based activities can be utilized, offering the potential for significant enhancements in methane production rates. To effectively treat these types of waste, conducting experimental studies on anaerobic digestion is crucial. For instance, incorporating zeolite in the milling process of fresh ashore biomass led to a remarkable increase in the maximum methane production rate compared to untreated biomass [
21].
The most significant product in the anaerobic digestion process is biogas, which is a mixture composed of a set of gases. CH
4 is present approximately between 50–70%, CO
2 in a proportion of 30–50, and other gases such as H
2S, N
2, O
2 and H
2 [
10]. Biochemical methane potential (BMP) is a substrate characterization technique widely used in AD. In terms of BMP, the formation of methane via the AD of biomass is quantified over a determined time period [
22]. Managing the data obtained in this technique, as well as controlling the parameters, varies depending on the aim of the study. Chandrasekhar et al. carried out a BMP analysis of different biomasses like pedicels, fibrils, petioles, fruit bunches, spathes and simple palm biomass. In the study, they highlight the importance of characterizing regional substrates using this technique in order to properly obtain energy from such substrates [
23]. It is desirable that models describing biomethane production provide assertive predictions and are simple enough to be useful in the study and implementation of AD for the use of different substrates [
24,
25]. With the aim of scaling biotechnological systems, kinetic models have been developed that are used to estimate the treatability of a given biomass.
Studies have shown that second-order and modified mathematical models, such as Richards, logistics and Gompertz, are suitable for describing anaerobic fermentation processes and obtaining kinetic parameters for various biomasses. These models demonstrate consistency with experimental data [
24,
25,
26,
27,
28,
29,
30]. However, some authors argue that the first-order kinetic model is the best fit for measured BMP data [
31,
32]. Ripoll et al. (2022) conducted a study to develop a structured kinetic model for the thermophilic ACoD of sewage sludge and sherry distillery wastewater (SW-DW). The model considered the hydrolytic, acidogenic and methanogenic steps involved in the ACoD process. The researchers found that the percentage of SW-DW in the raw material exhibited an inverse relationship with the kinetic parameter associated with hydrolysis. This inverse effect influenced the rate of the hydrolysis step, indicating that the composition of the raw material affects the efficiency of the hydrolysis process. By analyzing the rate-limiting step throughout the fermentation process, the researchers determined that the methanogenic step acted as the limiting factor for the overall rate of the ACoD process over shorter periods of time. On the other hand, the hydrolysis step became the rate-limiting factor over longer durations [
31].
In some microbial growth models, the maximum biogas production is determined by the slope of the tangent at the inflection point of the sigmoid curve. Other modified models enable the determination of the lag phase (λ), or the time it takes the microbial consortia to adapt to the new substrate, in order to initiate its exponential growth [
25,
33], and λ is an important factor in determining the efficiency of the AD [
34]. It was found that gas formation is observed even before the lag phase time is reached [
23]. This lag phase is not merely preparatory but a dynamic, organized, adaptable and evolutionary phase [
35]. A lower delay interval implies greater potential inside the AD [
36].
Today, the sargassum biomass that arrives at Caribbean beaches remains there without any large-scale application, like the vast majority of domestic organic waste generated in the same region affected by these nuisance macroalgal blooms. Therefore, studies are needed to estimate the important parameters that will facilitate the scaling of the AD process [
14]. This research aims to assess the effectiveness of modified kinetic models in characterizing the lag phase of biomethane generation in two experimental systems: the ACoD of
Sargassum spp. and domestic organic waste and mono-digestion of
Sargassum spp. The research hypothesis suggests that the application of these modified kinetic models will accurately capture and describe the lag phase in biomethane generation within the investigated experimental systems. The study of the ACoD of organic waste aims to find an alternative to the current disposal issue and convert this source of contamination into an energy source, as well as provide the authorities in affected regions with an alternative for the clean-up and disposal of this biomass.
2. Materials and Methods
Dry samples of sargassum were used, obtained from the open-air dump at Puerto Morelos beach (Lat. 20°51′ N Long. 86°52′ W, April 2021). The biomass was washed with purified water and dried in an electric oven at 105 °C. According to Vázquez et al. (2021), 2 pelagic species of
Sargassum spp.
(Sargassaceae) were identified,
S. fluitans and
S. natans, the former being more abundant, and together they make up 78.1 to 99.6% of the total biomass that arrives in the Mexican Caribbean. The remaining biomass is benthic macrophytes (seagrass and macroalgae) which are present from 0.4 to 21.9% [
37].
Pelleted dog food, which closely simulates domestic organic waste, was utilized in the study. Previous co-digestion studies have reported that dog food consists of 25.0% crude protein, 16.0% crude lipids, 3.5% crude fiber and 6.2% ashes. Residues, including carbohydrates, account for 49.3% of the dry matter weight [
38]. The use of dog food has demonstrated its suitability for obtaining reliable and consistent data in composting experiments due to its uniform composition [
39,
40].
Both samples were ground down and sieved with mesh number 20 (850 µm) and then stored in a desiccator for subsequent characterization.
To characterize the materials, the following were determined: the dry weight and ash content, the C/N ratio and the metals and metalloids.
Dry weight and ash content: The volatile solids (VS), percentage humidity, and ashes of the biomass samples were determined using STA Regulus 2500 Netzch equipment for thermogravimetric analysis (TG), manufactured by Netzsch Gerätebau GmbH in Germany. The 10 mg biomass sample in an alumina crucible was subjected to a heating ramp rate of 10 °C/min from 20 to 1000 °C, using helium as the carrier gas (99.999%, with a flow rate of 50 mL/min). Differential thermogravimetric analysis (DTG) was also performed.
C/N ratio: The C, H, O and N elements present in the biomass samples were determined via element chromatography in a Thermo Scientific Flash Smart device manufactured by Thermo Fisher Scientific, a company based in the United States, with a Porapak PQS column and molecular sieve, using helium as the carrier gas.
Metals and metalloids: The presence of metals and metalloids (as a concentration mg/kg) was determined according to the methodology of NMX-AA-051-SCFI-2001 [
41]. Two digital hot plates were used with Corning Pyroceram PC-260D stirring and a GBC AVANTA atomic absorption spectrometer manufactured by GBC Scientific Equipment, an Australian company.
Biochemical methane potential (BMP) determination: A batch-type high-density polyethylene biodigester was designed and constructed. It had a 20 L capacity and was installed with a pressure gauge and painted black to increase energy absorption. The internal pressure of the biogas was monitored. The gas concentration and volume were measured regularly using a Landtec Modelo Biogas 5000 probe manufactured by QED Environmental Systems in the United States and a Keuk Dong KG2 diaphragm P/gas meter. The AD of the experimental prototypes was carried out outdoors in the summertime with maximum and minimum environmental temperatures of 38 and 20 °C, respectively.
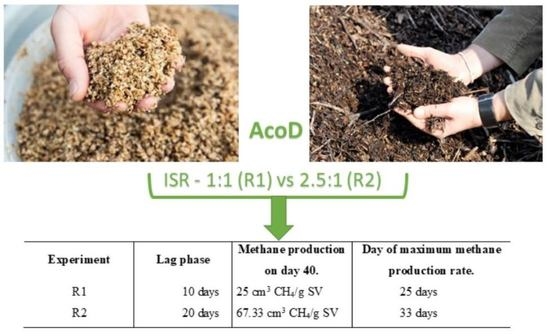
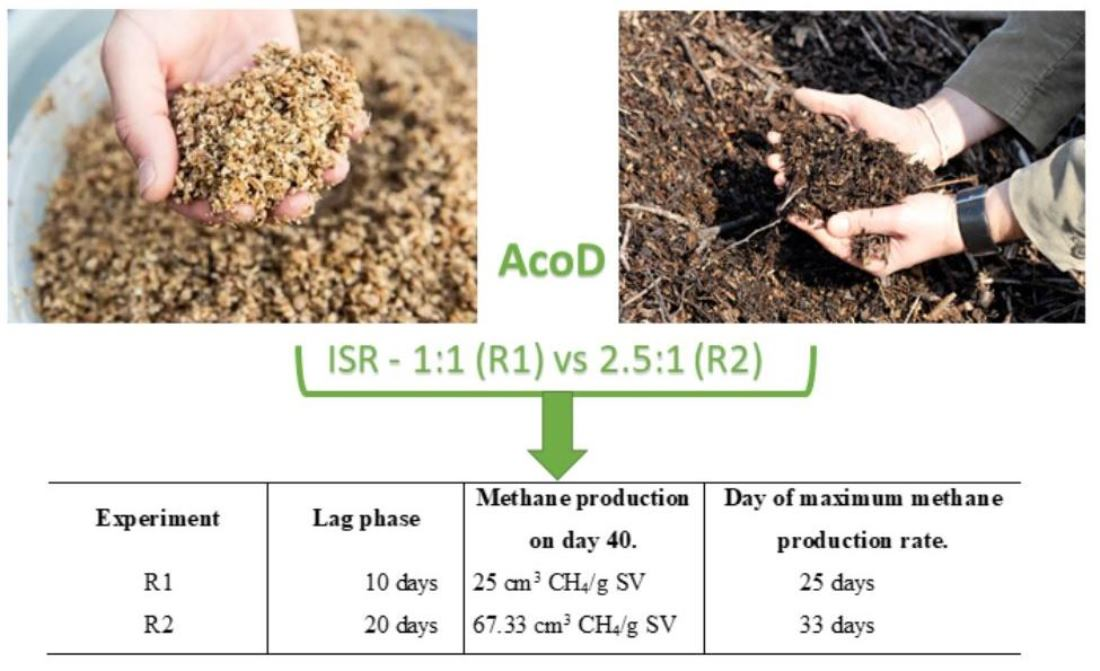
Two BMP experiments were carried out in triplicate: in the first experiment R1, 6 kg of inoculum and 2 kg of dry Sargassum spp. were used, and experiment R2 consisted of a mixture of 6 kg of inoculum, 1.8 kg of dry Sargassum spp. and 200 g of ground dog food. Furthermore, 1 liter of water was added to both experiments.
It was found that the duration of period λ is influenced by the history of the inoculated culture, as its source and chemical composition significantly affect the start time of the AD and methane performance [
35]. The substrate/inoculum ratio is 1 of the most important factors for the start-up of an AD system [
42,
43,
44]. The positive effects of a greater-sized inoculation are the increase in microbial populations and greater buffering capacity, whereas the negative effects are that excessive inoculum takes up space and therefore reduces the efficiency of the reactor’s use [
36]. The experimental setup in this study employed a substrate-inoculum ratio of 1:3 based on dry weight, utilizing a previously acclimated inoculum derived from earlier investigations focused on the anaerobic mono-digestion of sargassum at controlled temperature conditions [
45].
The following was considered in order to obtain the curves for accumulated methane production according to BMP time: the methane concentration measured in the produced biogas volume according to the amount of volatile solids of the biomass present in the experiment [
46].
Lag-phase (λ) determination: The Levenberg–Marquardt method was used in CurveExper Professional 2.6.5 to solve the non-linear regressions, and the methane production experimental data were adjusted to the sigmoid models for kinetic behavior. The Logistic Modified and Gompertz Modified models were used to estimate λ (
Table 1). The differential equations of both models describe the change rate observed in the biogas production, and the models were modified to obtain parameters of microbiological relevance [
47]. The logistical function follows the general form of biogas production kinetics: an initial exponential growth and final stabilization at a maximum production level [
48]. The model assumes that the biomethane production rate is proportional to the microbiome activity represented by the amount of methane already produced and the substrate concentration. Likewise, the Gompertz model assumes that the gas production rate is proportional to the microbiome activity, although the proportionality parameter decreases over time following first-order kinetics, which can be attributed to the loss in efficiency of the fermentation rate over time [
49].
The Logistic Modified and Gompertz Modified models present 3 constants that define the non-linear sigmoid correlation for adjustment to the experimental data.
Table 1 shows the models used for regression and the details of each parameter. The residual sum of squares (RSS), the correlation or determination coefficient (R2) and the standard error of the regression (S) were compared, and a second-order Akaike information criterion (AIC) test was carried out to evaluate the models and determine the correlation of the models with the experimental data.
3. Results and Discussion
3.1. Characterisation of Materials
The different adaptation times for the AD systems have been linked to the amount of humidity present in the process. Better methane performances were found in systems with a higher humidity content [
50]. Wet AD is fermentation with less than 15% dry material in the fermenter [
51]. Fermenters with a high content of dry material (>15%) are considered dry systems.
Based on the proximate analysis in this experiment, it was determined using thermogravimetry that both experimental systems operated under humid conditions of around 25% using dry AD.
Table 2 shows the results of the TG proximate analysis of the
Sargassum spp. biomass and commercial dog food samples.
The result of the last analysis of the samples is shown in
Table 3, and the carbon-nitrogen (C/N) ratio of the biomasses was 44.45 and 6.84 for sargassum and inoculum, respectively. This ratio is significant for operation, and the recommended C/N range for raw materials for biogas production is between 16/1 and 45/1 for efficient digester performance without inhibiting the process [
42]. When this ratio is very high, the nitrogen is consumed quickly, and biogas production decreases. If the ratio is below 15, inhibitors can accumulate, such as ammonia and volatile fatty acids [
52]. Furthermore, it was discovered that out-of-range values such as a 50/1 ratio were also suitable for AD [
53]. Márquez et al. (2014) reported very variable C/N ratios in marine algae biomass, oscillating between 8.72 and 58. During the experiment, they indicated that values between 16 and 45 enable the efficient performance of the digester. Both substrates were determined to be within this range [
54].
The presence of sulfur in the biomass can be an issue for AD processes, as the reducing sulfate bacteria exceed the acetogens and methanogens, generating gasses like H
2S. Sulfur is considered an inhibitor that causes bad odor and corrosion [
55].
The detected metals and metalloids are shown in
Table 4. According to De Souza et al. (2020), trace metals mainly reach aquatic ecosystems through land run-off, the release of effluents, contaminated groundwater and atmospheric deposition, and once in the aquatic environment, these metals can combine with organic and inorganic compounds dissolved in the water or particulate material [
56]. Several authors have found the presence of heavy metals and metalloids in macroalgae [
37,
57,
58,
59,
60]. The concentrations of de Al, Ba, As, Cr, Cu, Mg, Mn and Zn present in sargassum are associated with the sargassum’s capacity to act as a bioabsorbent matrix, and hence its potential for use in capturing contaminants in coastal ecosystems has been identified [
57]. The levels of heavy metals and metalloids detected were found within acceptable levels for the use of AD digestate as fertilizer, with the exception of arsenic. The presence of arsenic limits the application of the macroalgae, as the accumulation of this metalloid in high concentrations prevents the use of pelagic sargassum for nutritional or agricultural means [
60] and makes it more favorable for use in energy generation [
59].
It was found that high concentrations of recalcitrant components in
Sargassum spp. can act as AD inhibitors. On the other hand, some elements present (
Table 4) can act as micronutrients and, in some cases, be enzymatic cofactors [
61]. Particularly, microelements such as Fe, Ni, Mo and Mg can balance out the availability of nutrients for anaerobic microorganisms. Iron (Fe) oxidation/reduction processes are also relevant and must be considered for the links with the phosphorous and sulfur cycles [
53].
The acceptable range of Fe concentration for enhancing biogas production is 362–1450 ppm. Cu concentrations ranging from 281 to 1125 ppm have a negative impact on solids removal and methane generation. Concentrations within the range of 172–692 ppm significantly affect anaerobic digestion performance. The toxicity order of heavy metals in terms of CH
4 reduction is Cu > Pb > Cr > Zn > Fe, although this order may vary depending on biotic and abiotic factors in the reactor. The results obtained indicate that all concentrations were lower than the specified ranges, indicating no inhibition occurred [
62].
According to Thomson et al. (2020), macroalgae contain significant amounts of sodium and other salts that accumulate during their growth in marine environments. These salts are primarily found in the cell wall composition of macroalgae. The authors suggest that these salts can serve as stabilizing agents in reactors by reducing the production of nitrogenous compounds that might impede the system’s functionality. However, on a negative note having a high salt concentration can inhibit microbial growth due to changes in osmotic pressure (dehydration of cells). Furthermore, the calcium salts associated with sodium can synergize or aggravate the antagonistic effects induced by Na [
10].
Vázquez et al. (2021) indicate that the arsenic present depends on the amount of nitrogen and amine groups in the algae, as they are linked by their affinity with this metal. They also mention that the carboxylic groups free from alginate represent binding sites for Zn
+2, and their affinity increases with the guluronic acid content [
37].
The study’s findings align with EU Regulation 2019/1009, which sets maximum concentrations for elements, including zinc (800 mg/kg), copper (300 mg/kg) and arsenic (40 mg/kg), in organic fertilizers [
63]. The investigation demonstrated that the concentrations of these elements remained below the specified limits, providing compelling evidence of compliance with the regulation. Regulations ensure environmental and safety standards in agriculture, mitigating risks from elevated element concentrations in organic fertilizers. Varying regulations across regions highlight the need to consult local standards for compliance.
3.2. AD Experiment and Lag Phase
Table 5 and
Table 6 show the average concentrations for CH
4, CO
2, O
2 and H
2S detected in the biogas produced in experiments R1 and R2.
The gas compositions presented in
Table 5 and
Table 6 do not sum up to 100% due to the presence of other gases, such as hydrogen and ammonia, generated during the anaerobic digestion stages. However, it is important to note that the equipment utilized in this study was unable to detect these gases, resulting in their exclusion from the reported gas compositions.
Table 5 and
Table 6 show an increase in the concentration of CH
4 over time, whereas the concentration of CO
2 decreases in both experiments. This behavior can be associated with the process of methanogenesis, where the CO
2 concentration is reduced (
). Another explanation for this CO
2 behavior is the formation of methane from acetic acid
), if the methanogenesis fails, then the concentration of acetic acid rises, thereby acidifying and inhibiting the AD system.
High percentages (exceeding 9999 ppm) of hydrogen sulfide (H2S) are observed in the biogas. This is a highly hazardous toxic gas in low concentrations (500 ppm) and, therefore, must be removed from the gaseous mixture. The use of physical-chemical filtration systems must be considered in the design of systems using biogas created from sargassum.
The accumulated maximum production, measured experimentally, for R1, was 140,708 cm
3 of CH
4/g SV at 99 days, and for R2 was 161,371 cm
3 of CH
4/g SV at 172 days in ACoD. These values are close to those reported, from 120 to 280 cm
3 of CH
4/g SV, in marine algae [
54,
61,
64,
65] at controlled temperatures and with shorter hydraulic retention times. Kafle and Chen (2016) conducted BMP measurements on five distinct cattle manures, yielding a range of 155–323 cm
3 of CH
4/g SV. Notably, no lag phase was observed for any of the manures. The study determined hydraulic retention times for anaerobic digestion at mesophilic temperatures, ranging from 12 to 44 days [
32]. The authors attributed the longer retention times in biomethane production to the fluctuating ambient temperatures during the outdoor AD experiments.
Table 7 shows the results for constants obtained by means of non-linear sigmoid regression for experiments R1 and R2.
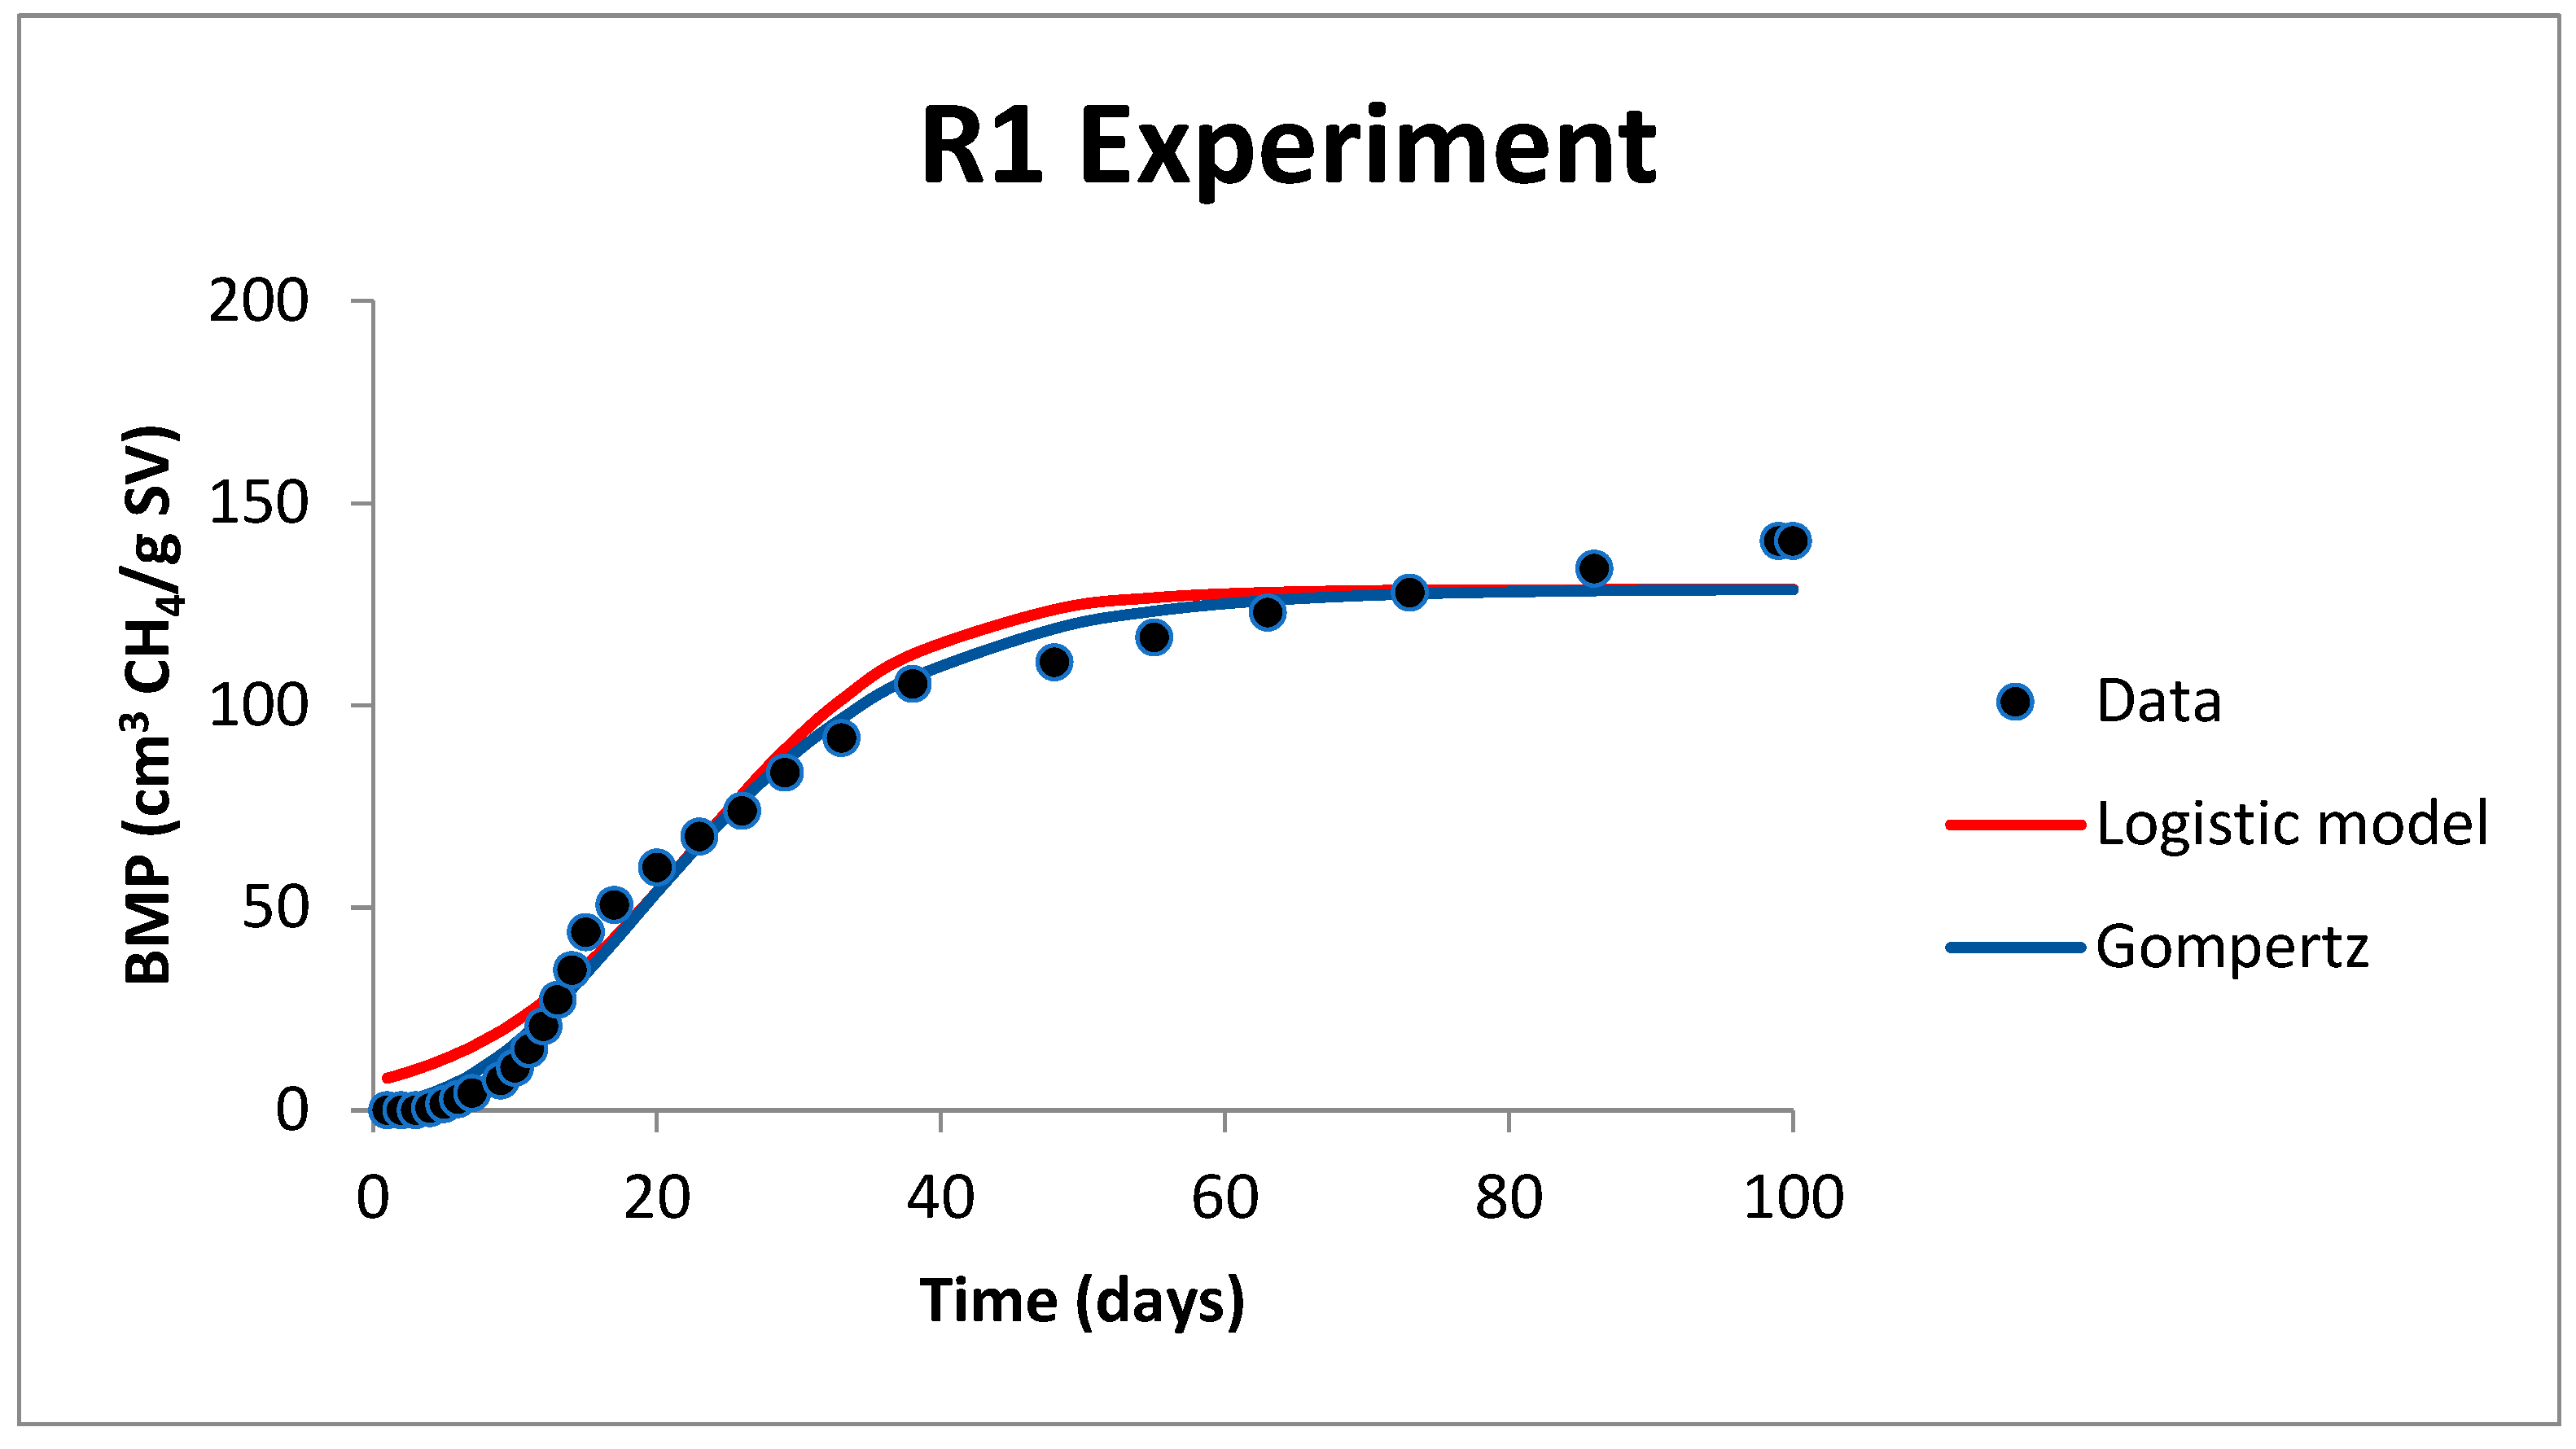
Figure 1 and
Figure 2 show the graph for experimental ACoD and the regression graph for modified sigmoid functions.
For experiment R1, the adjustment parameters “a, b and λ” shown in
Table 7 had very similar values. Therefore, in this case, it can be stated that both models are representative of the experimental data from R1.
For experiment R2 (system under co-digestion), the adjustment parameters “b and λ” shown in
Table 7 have very similar values calculated for both models. However, for parameter “a” associated with the asymptotic volume or methane generation potential, a significant difference is observed. The asymptotic value for the experimental condition R2 for the Logistic Modified model was a = 180.516 cm
3 of CH
4⁄g SV, whereas, for the Gompertz Modified model, it was a = 256.722 cm
3 of CH
4/g SV. This variation can be due to the fact that the experimental data does not yet show a trend towards stability, as it is not yet found on the maximum production curve.
The AD experiments show significant differences; for example, the lag phase in experiment R2 was greater with respect to the process without co-digestion R1, which is a disadvantage. However, the accumulated methane generation tends to be greater in the co-digestion process R2. In experiments R1 and R2, the inflection point was identified, or the maximum biogas generation rate at 25 and 130 days, respectively.
3.3. Statistical Analysis
In order to select the most suitable model from those considered, the residual sum of squares obtained from the equations for each of the experimental cases was compared. The residual sum of squares enabled the variability in modeling errors to be measured. The determination or correlation coefficient (R
2), with a value close to one, indicates better adjustment of the model and experimental data.
Table 8 shows the statistical parameters for experiments R1 and R2 using the LM and GM models. Where RSS is the residual sum of squares, R2 is the determination or correlation coefficient, AIC is the second-order Akaike information criteria that describes the relationship between the bias and the variance in the construction of the model and S is the standard regression error that provides the absolute measurement for the average distance of the values observed with respect to the regression line in units of the dependent variable (days).
The models presented had an R2 > 0.97, and hence the lowest correlation residual values were considered to confirm that these models are representative of the experimental data. The comparative analysis showed that the GM model is better at predicting the experimental condition R1 (without ACoD), whereas the LM model is better in the case of R2.
These choices were associated with a higher R2/lower RSS and, lastly, the Akaike information criteria (to select the best model, the lowest AIC value must be considered) [
24]. In the case of experiment R1, the lowest value was presented using the Gompertz Modified model, and in the case of R2, the Logistic Modified model presented the lowest value. The results agree and show that there is no optimal model for all situations in AD [
24,
25,
46].
According to the results of several authors, the Gompertz Modified model adjusts better to the experimental results that describe this phenomenon [
27,
28,
29,
30,
47]. The Gompertz function is the most used sigmoid curve in predictive microbiology due to its simplicity and effectiveness, as it facilitates the calculation of the parameters for the design and dimensioning of an AD system [
46]. It is important to determine the kinetic function of AD in order to design the fermenter and predict the behavior of the anaerobic system, as well as for the optimization and scaling of AD systems [
24].
The integration of blooming species, such as macroalgae, into recycling processes offers a promising solution to mitigate the detrimental effects associated with improper biomass disposal. By effectively utilizing macroalgal blooms, their management can become sustainable and financially viable, contributing to the advancement of a circular bioeconomy. Macroalgae, especially in biomethane production, offer significant potential as a renewable energy resource. Biomethane derived from macroalgae provides numerous environmental and economic advantages. As a renewable energy source, it reduces dependence on fossil fuels, decreases greenhouse gas emissions and aids in climate change mitigation. Additionally, biomethane can be applied across various sectors, including transportation, heating and electricity generation, promoting diversification and sustainability in energy production. The production of biogas and biomethane from macroalgae aligns with the principles of a circular bioeconomy, emphasizing efficient resource utilization and waste reduction. Macroalgae can be sustainably harvested or cultivated, providing a renewable and abundant biomass feedstock. Through AD, macroalgae can generate biogas, which can be upgraded to biomethane for injection into the natural gas grid or as a transportation fuel. This virtuous model not only addresses biomass disposal issues but also creates opportunities for economic growth and job creation.
Collaborative efforts involving policymakers, researchers, industry stakeholders and communities are vital to fully harness the potential of macroalgae as a valuable resource in the circular bioeconomy. Policymakers should engage in dialogue to establish supportive regulatory frameworks and financing mechanisms that encourage the integration of macroalgae into harvesting and processing systems. This collaboration should prioritize the exploration of innovative strategies to optimize biomass conversion efficiency and maximize the utilization of biomethane. Furthermore, prioritizing research and development efforts is crucial to optimize the utilization of macroalgal blooms. Scientific studies contribute to understanding the optimal cultivation, harvesting and processing techniques, as well as assessing the potential environmental impacts associated with large-scale macroalgae utilization. This knowledge guides the development of sustainable and environmentally friendly practices in the integration of macroalgae into recycling processes.
4. Conclusions
The purpose of this work was to compare the Gompertz Modified and Logistic Modified kinetic models when describing the lag phase in biomethane generation in anaerobic co-digestion systems when using Sargassum spp. and domestic waste and in mono-digestion systems using Sargassum spp.
The BMP results demonstrated higher methane production in the ACoD process, despite a slower start-up or lag phase. This challenge can be overcome by employing an inoculum acclimated to the substrate in a similar experimental AD system. The developed experimental setups effectively monitored biogas generation at ambient temperatures. Furthermore, the use of different sigmoid models in mathematical modeling proved crucial for precise prediction and scaling of the system, considering variations in experimental conditions.
In conclusion, the findings of this study confirm the potential of sargassum for biogas production in ACoD with domestic organic waste, even under ambient temperature conditions. However, it is important to consider the filtration of the generated biogas for its appropriate utilization.
Future research should prioritize conducting a comprehensive assessment of digestate’s suitability for soil improvement and livestock feed applications to advance circular economy models and promote sustainable practices within the agricultural sector. This assessment is of crucial significance as it provides valuable insights into the efficacy of digestate in enhancing soil quality and serving as a nutrient source for livestock.


