1. Introduction
Thermal comfort in offices is a high priority for human health and productivity [
1,
2,
3,
4], whereas the energy demand for the comfort provision is of concern [
5,
6,
7], hence the need for low energy or passive ways for the comfort provision. Thermal comfort is largely a function of both the temperature and humidity in a codependent way [
8]. At a given temperature, if the air is humid (high relative humidity), the perceived thermal sensation will be warmer than it would be with a relatively lower humidity. The control of both temperature and humidity is therefore a requirement for thermal comfort.
The energy consumption to ensure indoor thermal comfort conditions has been cited as one of the major contributors to the high energy utilization in buildings [
5,
6,
7]. Energy production has been blamed for the adverse environmental impact that has caused enumerable problems, including climate change [
5,
9,
10,
11,
12,
13]. Furthermore, active conventional air-conditioning systems use refrigerants that have a global warming effect [
10,
11,
12,
13,
14]. Therefore, research into comfort provision at zero or near-zero energy use through passive options has become imperative.
Indoor air exchanges thermal energy and moisture with the building envelope within the indoor space. The thermal energy and moisture exchange depend on the hygrothermal properties of the involved building envelope materials. To evaluate the performance of possible passive strategies, modeling and simulation of the exchanges between the air and these materials is necessary. Using PCMs for cooling in buildings has been widely researched [
15,
16,
17,
18] but only recently has there been some focus on materials that seek to combine the PCMs and desiccants for combined temperature–humidity regulation [
19,
20]. In Europe, T. Padfield [
21] pioneered the study on the impact of moisture buffering in buildings. However, Rudd [
22] pioneered the enhancement of the moisture buffering capacity of interior wall surfaces. Since both the humidity and temperature are important, especially in warm and humid (35 °C ≥ Ta ≥ 26 °C, RH ≥ 65%) climates, a strategy that seeks to address these two parameters cooperatively is the focus of this paper. The purpose of the study is to provide proof-of-concept feasibility with regard to combining a PCM and a desiccant to passively control the indoor temperature and humidity of the indoor climate. Regeneration (restoration of the PCM and desiccant to the state of being able to buffer the temperature and moisture, respectively) is key to the feasibility of the proposed passive strategy. Therefore, this study mainly focuses on the regeneration of the interior wall surfaces and the indoor climate control.
2. Materials and Methods
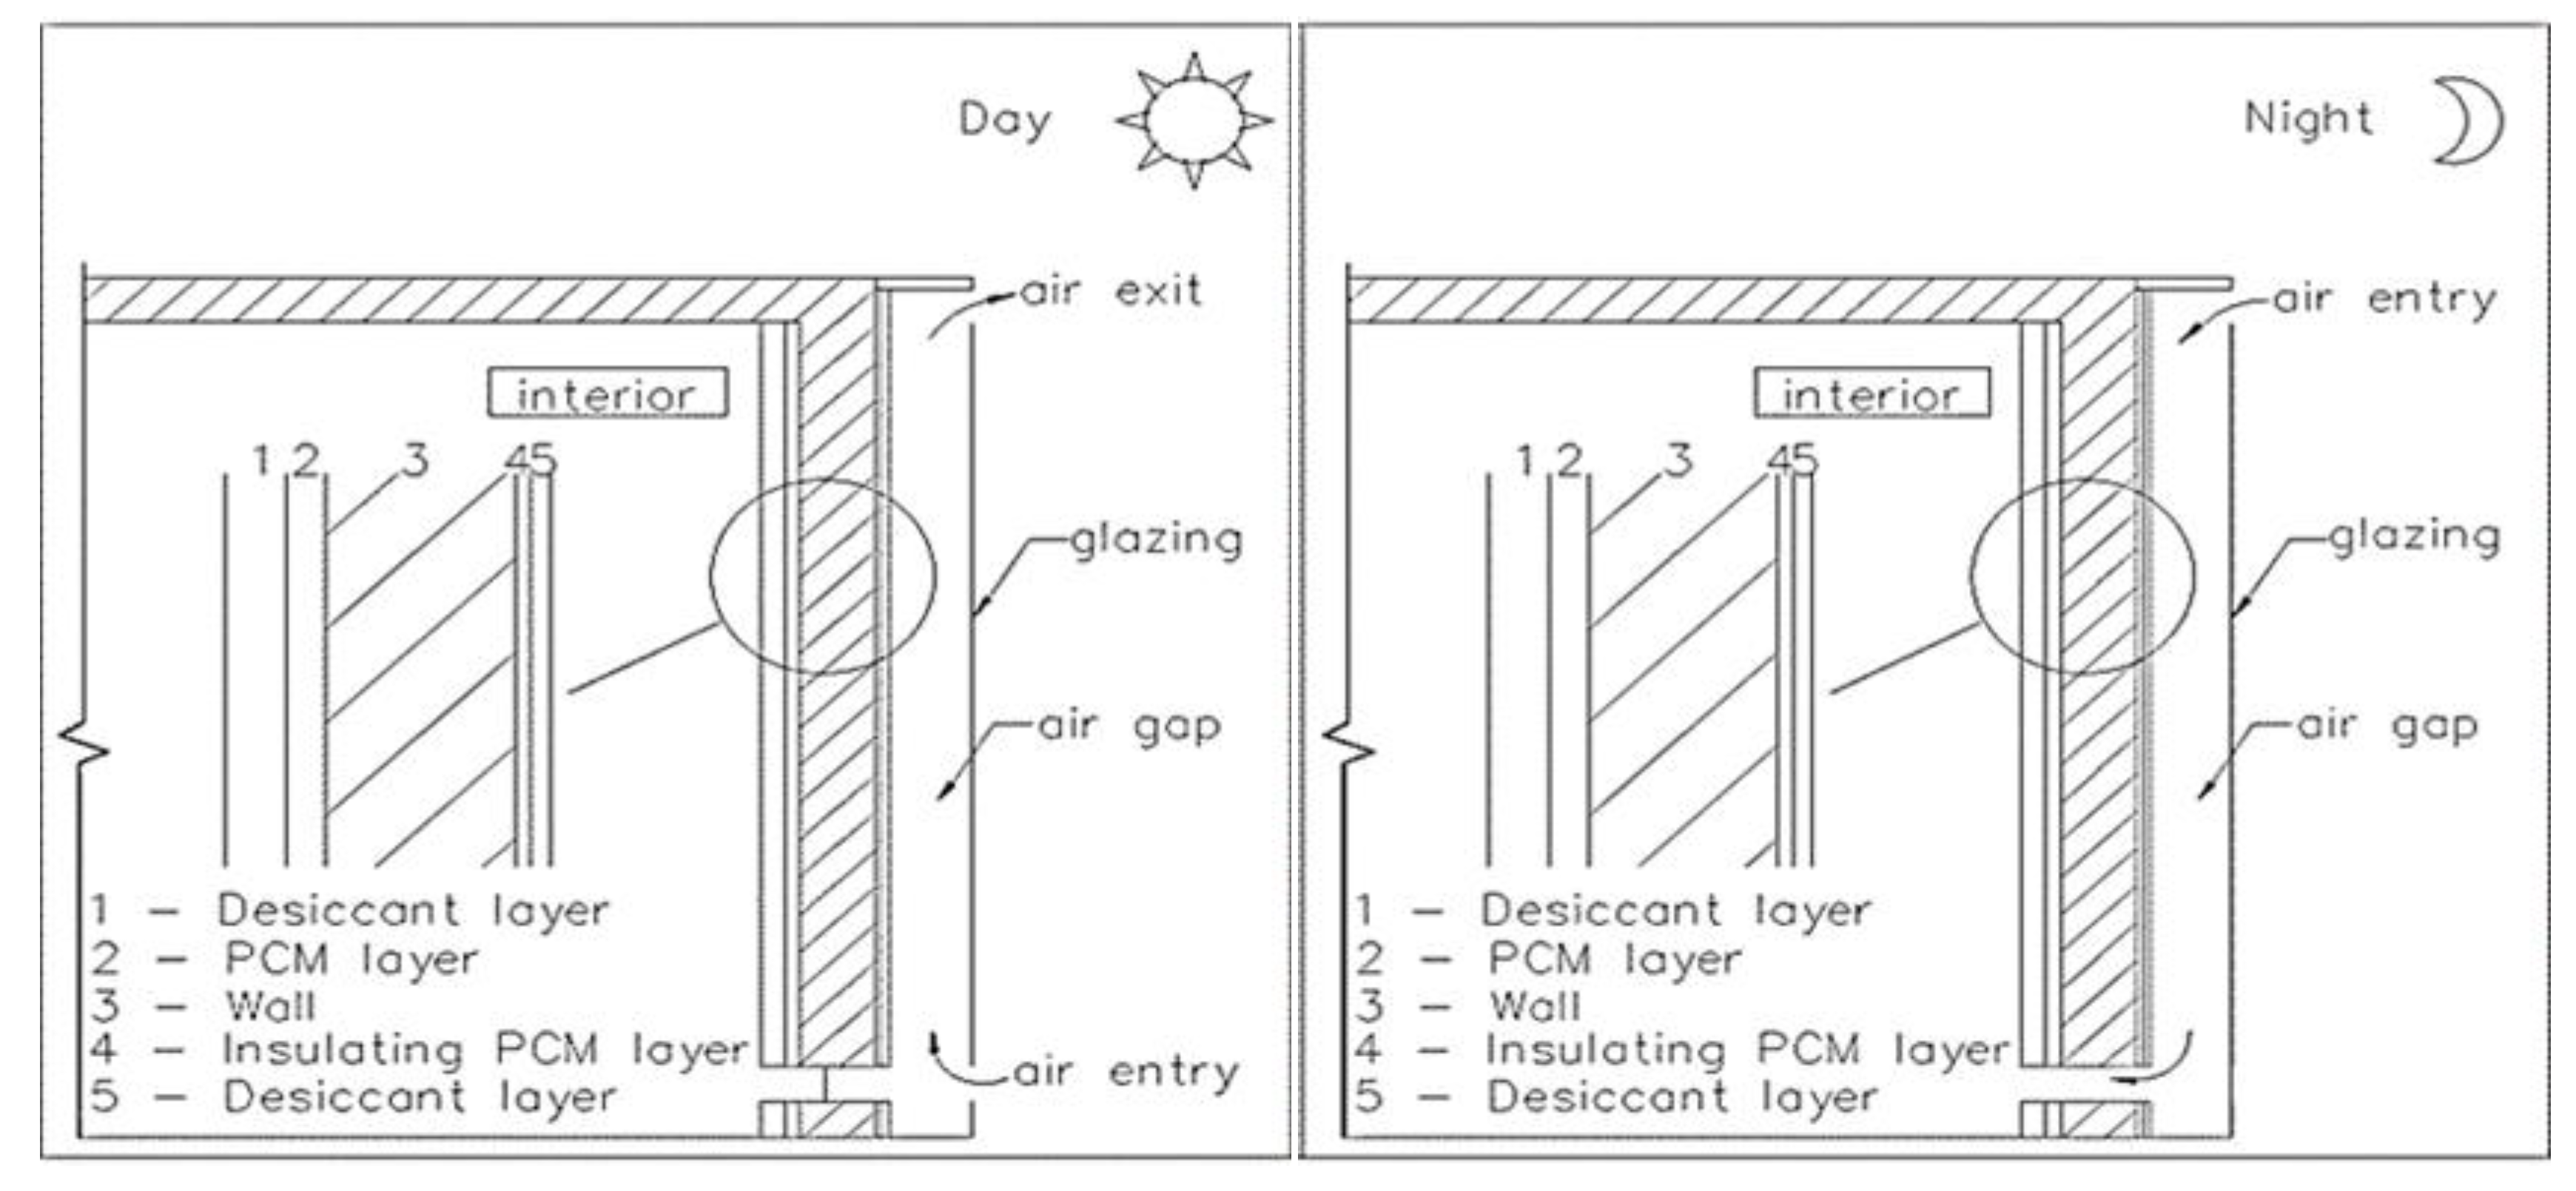
Modeling and simulation were applied to evaluate the effectiveness of a novel passive strategy for the indoor climate control of an office space in a warm and humid climate. The modeling and simulation were applied to a hypothetical office. Regeneration is key to the proposed passive strategy. For the PCM recharging (regeneration), night air ventilation is commonly applied; however, to include desiccant regeneration, a novel approach is called for. The proposed approach involves the use of low air humidity to regenerate hygroscopic internal desiccant-laden surfaces rather than the common approach of using elevated temperatures. The low humidity air is obtained from dry night air using an external desiccant bed. The external bed is solar dried during the day in a solar channel design. As shown in
Figure 1, a solar channel, containing a silica gel bed as the absorber surface, is built onto an external wall (assumed to be not shaded). During the day, the desiccant bed is regenerated by solar radiation. At night, the dry desiccant bed dries night air on its way into the room space; this dried air is responsible for the regeneration of the internal desiccant. This solar-assisted regeneration (SAR) approach allows for the regeneration of both the PCM and the desiccant: the two materials required for the moderation of the temperature and humidity in the indoor space. Davison grade 11 silica gel was applied in the modeling and simulation as the desiccant (based on availability of performance data as well as the good performance within the desired humidity range). RT25HC (a paraffin-based PCM by Rubitherm Technologies GmbH, Berlin, Germany) was the PCM used (based on its superior latent heat capacity of 230 kJ/kg among PCMs with the desired phase change temperature range) [
23]. Mathematical models were developed based on material properties from data in the literature and apposite data curve fitting using an excel spreadsheet. For the simulation, the office is assumed to accommodate two people performing desk work, two personal computers and a printer in operation, as well as lights for a period of 10 h. Sensible and latent loads were estimated through suitable models and data.
The initial step was to determine the moisture content of the solar-dried external silica gel. The next step was to establish the humidity and temperature of the air as it leaves the external silica gel ‘bed’; this air is used for drying the internal silica gel surfaces. The subsequent step is to simulate the drying of the internal silica gel surfaces. The drying process of the internal silica gel and the regeneration of the PCM occur simultaneously. The regeneration of the PCM requires relatively low temperatures, whereas the silica gel regeneration needs relatively high temperatures. The regeneration of the silica gel is endothermic and thus provides a compensatory cooling effect towards achieving the desired coupled regenerations. Additionally, instead of relying on elevated temperatures for silica gel regeneration, the dryness of the air becomes the main driver for the regeneration. Simulation of the indoor air temperature considers the exothermic nature of the dehumidification process through moisture adsorption by the internal silica gel surfaces.
The hypothetical office was a 3 m by 3 m in plan and the roof was considered to be a concrete slab type. It had a 1.8 m2 door as well as a 1.6 m2 window. We considered a plaster–PCM interior painted with desiccant-rich paint; the desiccant mass ratio in the paint was approximated to give 0.5 kg/m2 of desiccant per surface painted. For the external desiccant, the limiting value for the mass of the desiccant was the maximum thickness that remained within the thin-layer definition. Hourly time steps were used since the hourly weather data was available and the hourly time steps provided an adequate simulation resolution.
2.1. External Silica Gel Drying Model
Mass and energy balance principles were applied in the modeling, together with the appropriate boundary and initial conditions. Instant equilibration (or instantaneous local equilibrium (ILE)) was assumed. The energy balance equation for the external silica gel bed system during bed regeneration using solar energy resulted in Equation (1). The energy balance considered the sorption heat. In Equation (1),
is the average channel air temperature,
is the ambient air temperature,
is the mass flow rate of air,
η is the thermal efficiency,
is the surface area and
is the sorption heat.
The rate of moisture uptake by the air passing over the silica gel is given in Equation (2).
where
is the moisture transfer rate from the solid desiccant,
is the mass flow rate of air,
is the specific humidity of air at the outlet and
is the specific humidity of air at the inlet. The moisture transfer rate
based on the linear driving force (LDF) model is shown in Equation (3) [
24]:
where
m is the mass of desiccant,
is the moisture content and
is the equilibrium moisture content. The equilibrium moisture content is correlated with the relative humidity according to Equation (4) [
25]:
The specific humidity of air leaving the desiccant bed can be expressed as:
is the saturated specific humidity of the air at outlet temperature. The saturation pressure as a function of temperature for the dry bulb temperature range 8 °C to 30 °C, based on steam tables, was (through curve fitting) found to be:
According to thermodynamic relationship of moist air properties (specific humidity),
is a function of the saturation pressure
and the relative humidity ∅ can be correlated as follows:
since ∅=1, Equation (5) becomes:
The equations are then solved for the values of and the change in after every time step (hourly basis: the weather data was available in hourly intervals).
2.2. Internal Surfaces Regeneration
During the night, air is passed through the channel and is dried by the desiccant. For the state of the dried air leaving the desiccant, the adsorption model is considered: the hysteresis is ignored such that the drying model was applied, albeit in reverse.
The specific humidity of air leaving the desiccant bed is expressed in Equation (9):
where
is the minimum possible specific humidity of the air at outlet temperature, this is the specific humidity where the air is assumed to have been dried to the point where it comes into equilibrium with desiccant and the desiccant is at its initial moisture content. Expressing
in terms of the moisture content [
24] and substituting in Equation (9) results in Equation (10).
For the internal surfaces, the sorption rate and the equilibrium models are given by Equations (11) and (12) [
23], where in Equation (11)
t is in seconds:
The temperature of the air leaving the desiccant is evaluated by applying Equation (13) (based on energy balance):
The dried air, as it passes through the room, picks up moisture from the moisture-laden surface and to obtain the state of the desiccant at any moment, a desorption model derived from data obtained from the literature through curve fitting was applied. Because the desorption process is endothermic, the interior surface of the room is assumed to be cooled in the process, and this is desirable for the cooling of the PCM. The outdoor air is expected to pass through the external desiccant bed and into the interior and then out through the ventilation.
2.3. Moisture Load Estimation Model
In an office space, the main contributors towards moisture build up are the occupants, infiltration and ventilation. The moisture load due to the respiration and perspiration of the occupants can be estimated using Equation (14)
:In Equation (14),
is moisture released into the occupied space by the occupants (people),
is the number of people and
is the moisture production rate per person. In their experimental work, Zemitis et al. [
26] reported a moisture generation of 51 g/h per person as the generally approximated value for assumed office activities. Infiltration was considered to be largely through the door and the window, and an infiltration rate of 0.5 air changes (ACH) was considered [
27].
2.4. Thermal Load Estimation Model
The thermal load of the office space consists of internal and external sources. Internal heat sources include lights, equipment and people, whereas external heat sources include solar irradiation and external convection. For the considered passive moisture buffering of applying a desiccant silica gel, there is need to also consider the heat of adsorption as an additional heat source in the thermal load model. The heat of adsorption is a function of the moisture adsorption rate and equations for this are taken from the literature [
28]. The internal heat gains are shown in
Table 1.
External heat sources consist of solar radiation through fenestration, heat conduction across the envelope and air exchange with the ambient. For radiation heat that gains entry through fenestration, Equation (15) is applied:
A is the surface area of the transparent window,
is the total radiation on the window and
τ and
α are transmissivity and absorptivity, respectively.
is the overall heat transfer coefficient of the window, whereas
is the external convective heat transfer coefficient. For conductive heat gains through each envelope component, the sol-air temperatures (outside temperatures that consider the effect of the solar radiation) were evaluated and the difference between the sol-air and indoor air temperatures was applied to the conduction equation. The local hourly solar radiation data based on the available 1999 data and the hourly ambient temperatures from the meteorological department of Zimbabwe were employed. The sol-air temperature is defined as the outside air temperature that, in the absence of solar radiation, would give the same temperature distribution and rate of heat transfer through a wall (or roof) as exists due to the combined effects of the actual outdoor temperature distribution plus the incident solar radiation [
29]. The sol-air temperature is given by Equation (16) [
29]
For a vertical wall, ∆
R = 0, whereas for a horizontal wall, ∆
R = 63 W/m
2 [
29].
The heat transfer coefficient of the building envelope was estimated based on a brick and plaster wall and a concrete roof slab. The estimated U-factors for the components are as given in
Table 2. A spreadsheet calculator was prepared, such that each load component was estimated on an hourly basis.
Heat that is transported by the air is estimated by:
where
is the mass density of air,
is volume flow rate of air exchanged between the indoor and outdoor environments,
is the specific heat capacity of air at constant pressure and ∆
T is the temperature difference.
2.5. Buffering Models
2.5.1. Moisture Exchange Model
The moisture buffering potential depends on the rate of moisture removal, which depends on the surface conditions at occupation in the morning and the moisture entry into the occupied space. The change in specific humidity can be expressed by Equation (18):
In finite difference formulation we have Equation (23):
2.5.2. Heat Exchange Model
The rate at which heat or moisture is exchanged between the room air and the envelope is crucial for the passive moderation of the room conditions. The moisture exchange between the air and the interior surfaces is considered to be characterized by the rate of moisture uptake by the silica-laden surface and the subsequent desorption. The rate is dependent on the moisture conditions of both the air and the surface. The thermal energy exchange between the indoor air and the interior surface is considered to be dependent on the perceived rate of heat transfer from the PCM to the air. The potential control will therefore depend on this rate of heat transfer and the thermal storage capacity of the PCM. According to Liu and Awbi [
37], the equation for the convective heat transfer between a wall impregnated with a PCM and room air is given by the following equation:
where
D is the characteristic length, which is given by wall surface area divided by the perimeter and ∆
T is the temperature difference. Equation (23) is applied in the simulation for the heat transfer between room air and the PCM/desiccant wall. The heat of adsorption was considered as part of the load. For the case under consideration, the value of
D is approximately 0.8; this gives the following expression for the heat transfer coefficient:
Applying Newton’s Law of cooling, the rate of heat transfer per unit area of wall was found to be given by Equation (25)
Conduction resistance was ignored: the Biot number was established to be plus or minus 0.1, which is a significant degree less than 1, hence the rate of thermal energy transfer was considered to be largely dependent on the convective rate.
In Equation (28),
is the cooling load,
m is mass of PCM in walls and
is the heat of fusion. A spreadsheet was applied to evaluate the temperature
at time
τ using a finite difference formulation, Equation (27).
The initial temperature at the start of the day is assumed to be equal to the temperature of the PCM,
. The room air and the PCM are assumed to be in thermal equilibrium. The heat of adsorption in kilojoules per kilogram of moisture adsorbed is dependent on the moisture content of the desiccant and, according to Ramzy et al. [
28], this is given by Equation (28)
2.5.3. Cost–Benefit Analysis
A concise cost–benefit analysis was carried out on the basis of investment and operating costs in comparison to the active air conditioning system.
Table 3 below shows the costs involved for the passive and active systems.
2.6. Limitations
The moisture transfer models are premised on a thin-layer drying concept, such that their validity depends on the degree of acquiescence of the system to the thin-layer design limits. It takes the lumped parameter approach that ignores internal resistances and assumes a uniform state within the materials such that the interfacial vapor pressure difference creates the moisture exchange driving force. The mass transfer Biot number could be utilized to establish the validity of the model for any case application. The moisture exchange coefficient is considered constant; however, this assumption holds true only to a certain degree of accuracy within bounded thermal conditions. The curve-fitting-derived governing equations for the paint/desiccant sorption model need validation through empirical data for diverse real environmental conditions. Furthermore, the internal regeneration is largely driven by the vapor pressure difference and the kinetics rate to reach equilibrium is unclear. This determines the adequacy of the time steps valid for application. In the present study, hourly time steps are considered sufficient to assume equilibration. The heat exchange model also takes the lumped capacitance framework; thus, the model is applicable for low surface to air heat exchange rates that give the convective heat transfer dominancy. Therefore, the model is applicable to systems within a certain convective heat transfer range or design and can be characterized by the heat transfer Biot number. The Biot number is the ratio of thermal resistances within a material and at the surface. For Biot numbers considerably smaller than 1, the heat transfer is simplified by assuming uniform internal temperature, such that convection becomes the sole mode of heat transfer. The sole convective heat transfer formulation is a simplification, a more detailed and accurate approach to heat transfer maybe required for more accurate results.
The PCM and desiccant are treated as semi-independent individual layers in direct communication with the indoor air. The PCM’s hygroscopic properties, the desiccant’s thermal capacity and the participation of other materials have been ignored. The boundary conditions and the transport coefficient correlations and values are not easy to obtain or even estimate for real-life situations. This remains a limitation and leads to overreliance on general data; there is need for more reliable empirical data. Some data were limited, such as input weather data; however, effort was made to obtain existing data from the local meteorological department. Certain inputs are based on general estimates obtained from the literature due to the limited local empirical data. The model, although it cannot serve as a definitive design tool, provides a proof-of-concept confidence level for further developments towards more accurate design tools.
3. Results and Discussion
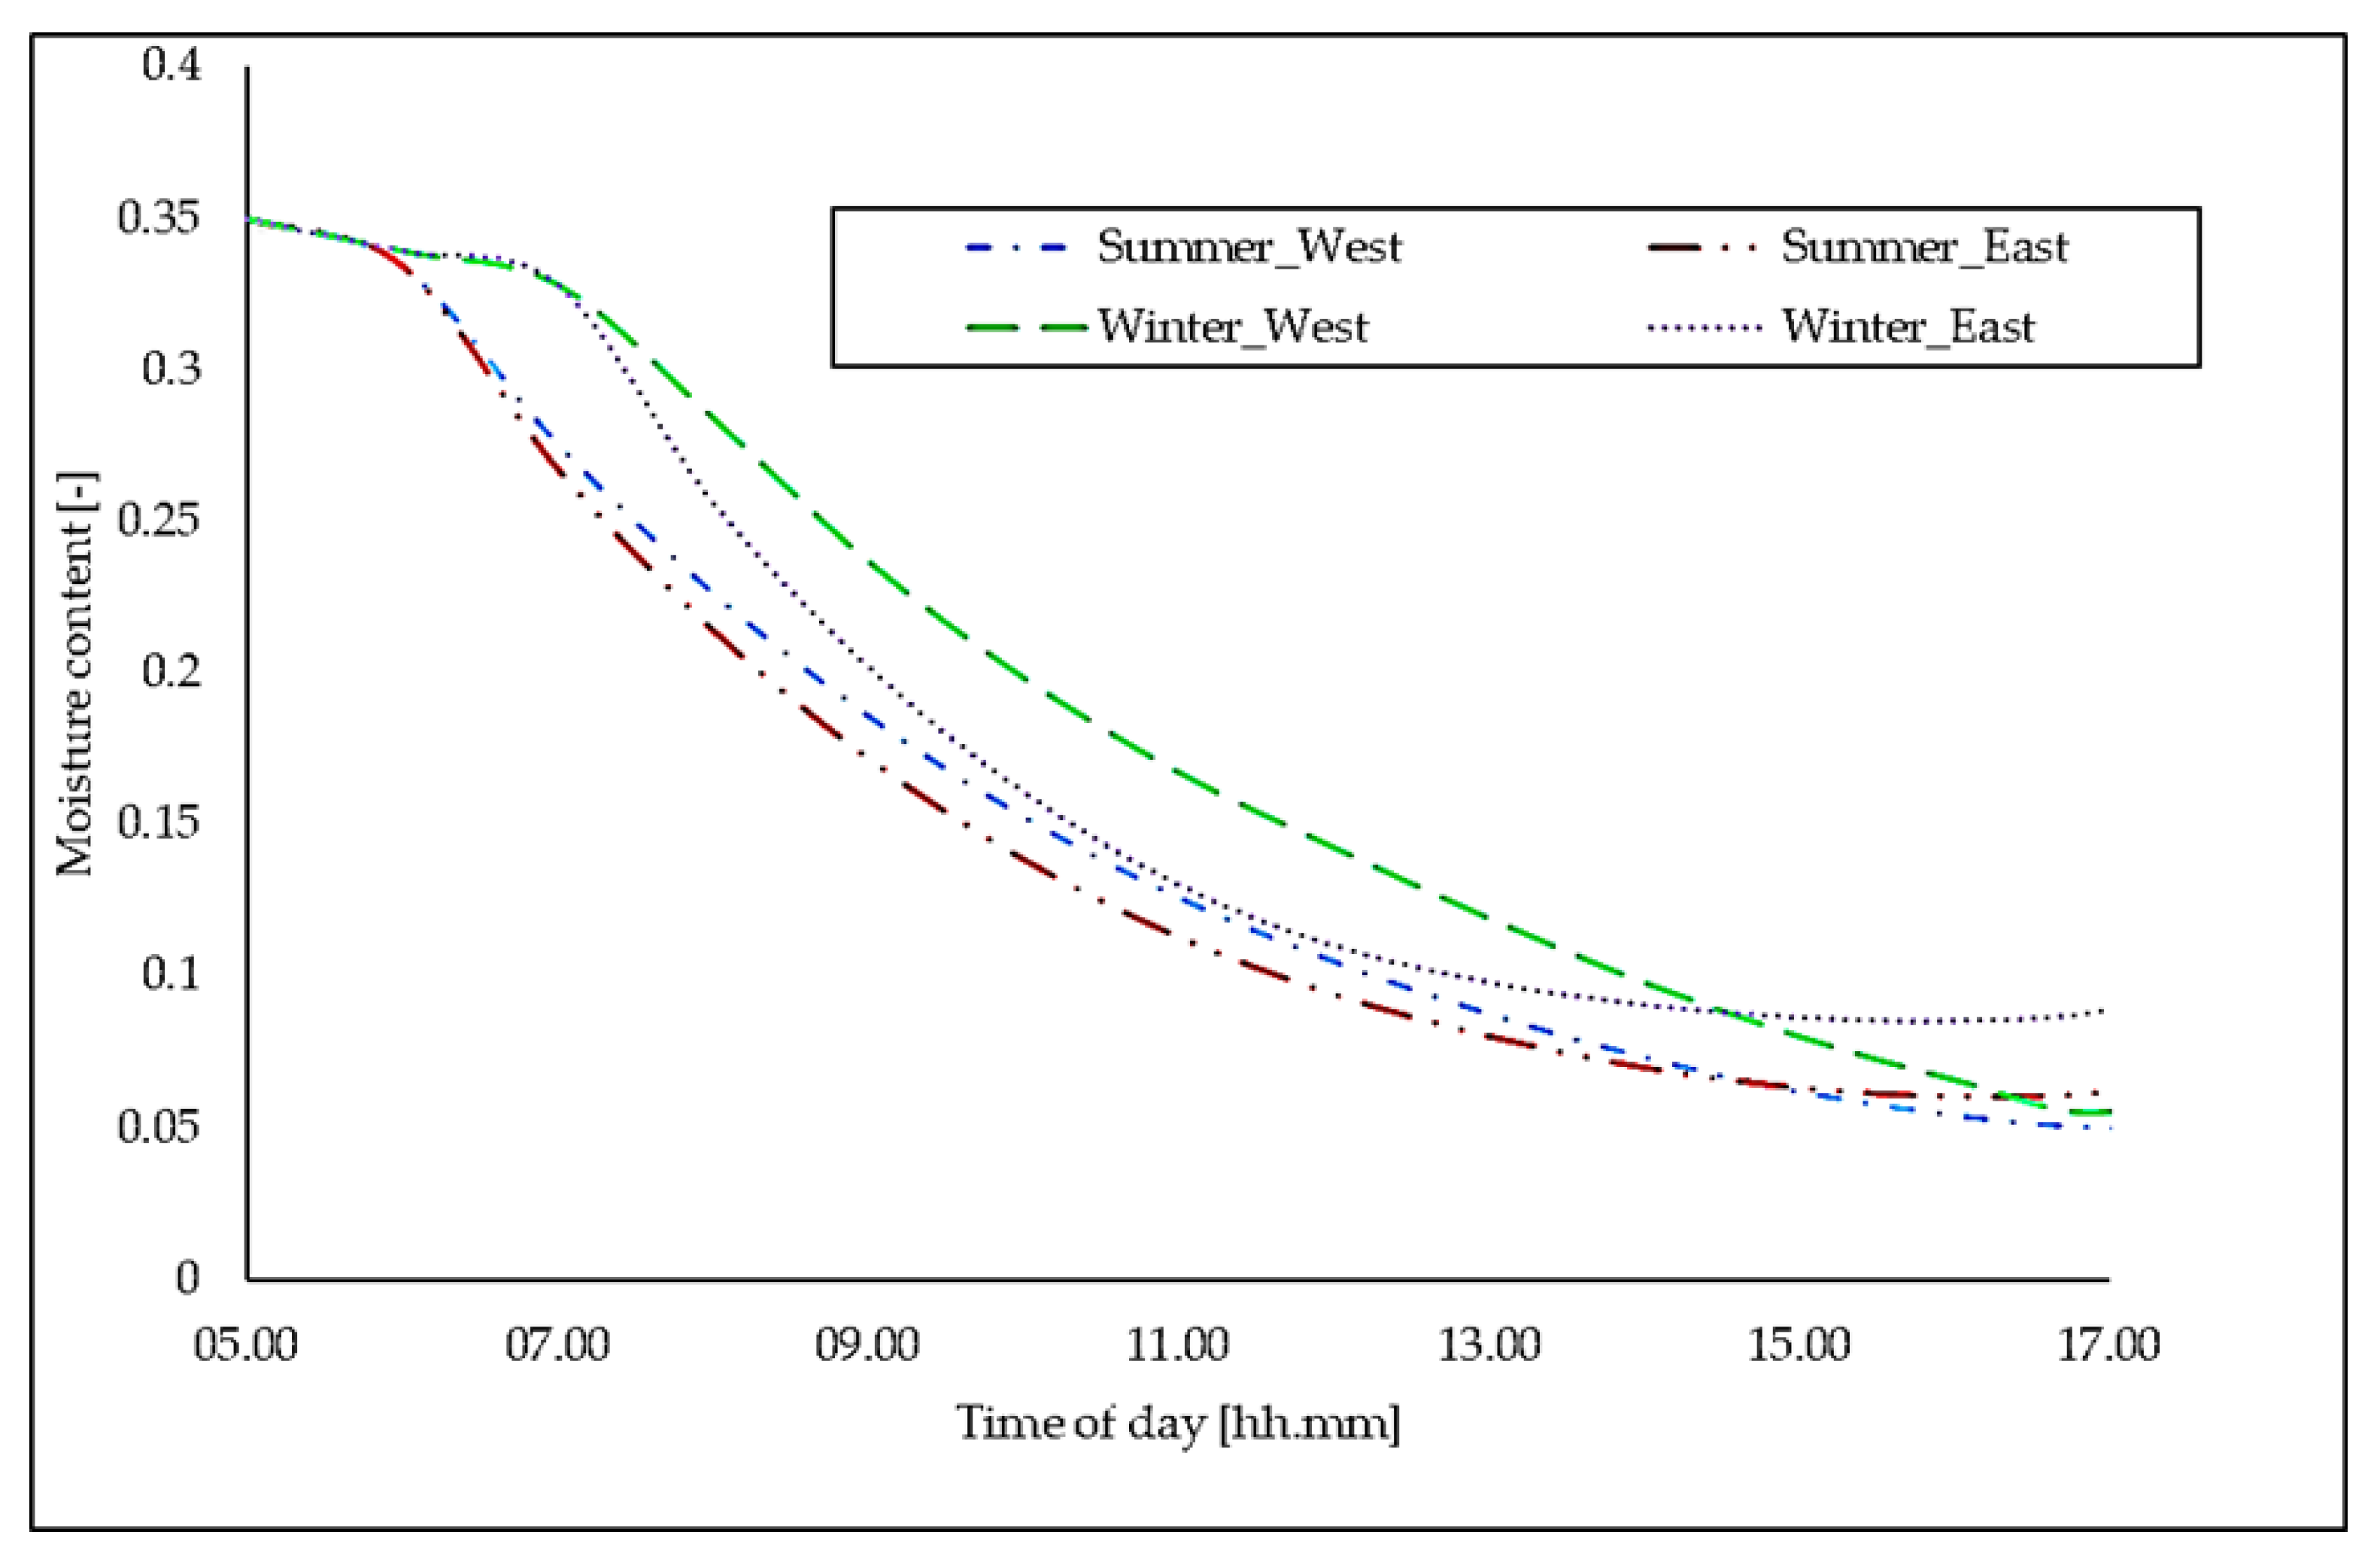
The question of providing thermal comfort passively in an office in a warm and humid climate was the focus of this study. A simulation was performed to evaluate the effectiveness of a novel passive humidity and temperature control strategy to provide thermal comfort for an office in a warm and humid climate. The strategy makes use of a PCM and a desiccant for temperature and humidity regulation, respectively, and employs a solar-assisted regeneration (SAR) approach. The degree to which the external silica gel bed is regenerated (dried) is simulated using January 1999 and June 1999 weather data; these were considered typical summer and winter months, respectively. The results presented are for a solar channel of 1 m width, 0.02 m in depth and 3 m in height. For the simulation, the channel is considered to be either east or west facing; these cardinal orientations receive significant amounts of solar radiation in both summer and winter. The regeneration (drying) curves for the external silica gel are presented in
Figure 2. It can be observed from
Figure 2 that the moisture content drops remarkably within the first 7 h of drying in both the summer and winter. Within the 7 h of regeneration, the moisture content dropped from the initial 0.35 kg/kg to approximately 0.07 kg/kg. In summer, notable drying carries on even towards end of day, but at a reduced rate. However, as the day progresses beyond 16:00, drying recedes and rewetting sets in. By the end of the day (18:00), the external silica gel bed had a moisture content of around 0.1 kg/kg for east orientation in winter and 0.06 kg/kg for west orientation in the summer and winter.
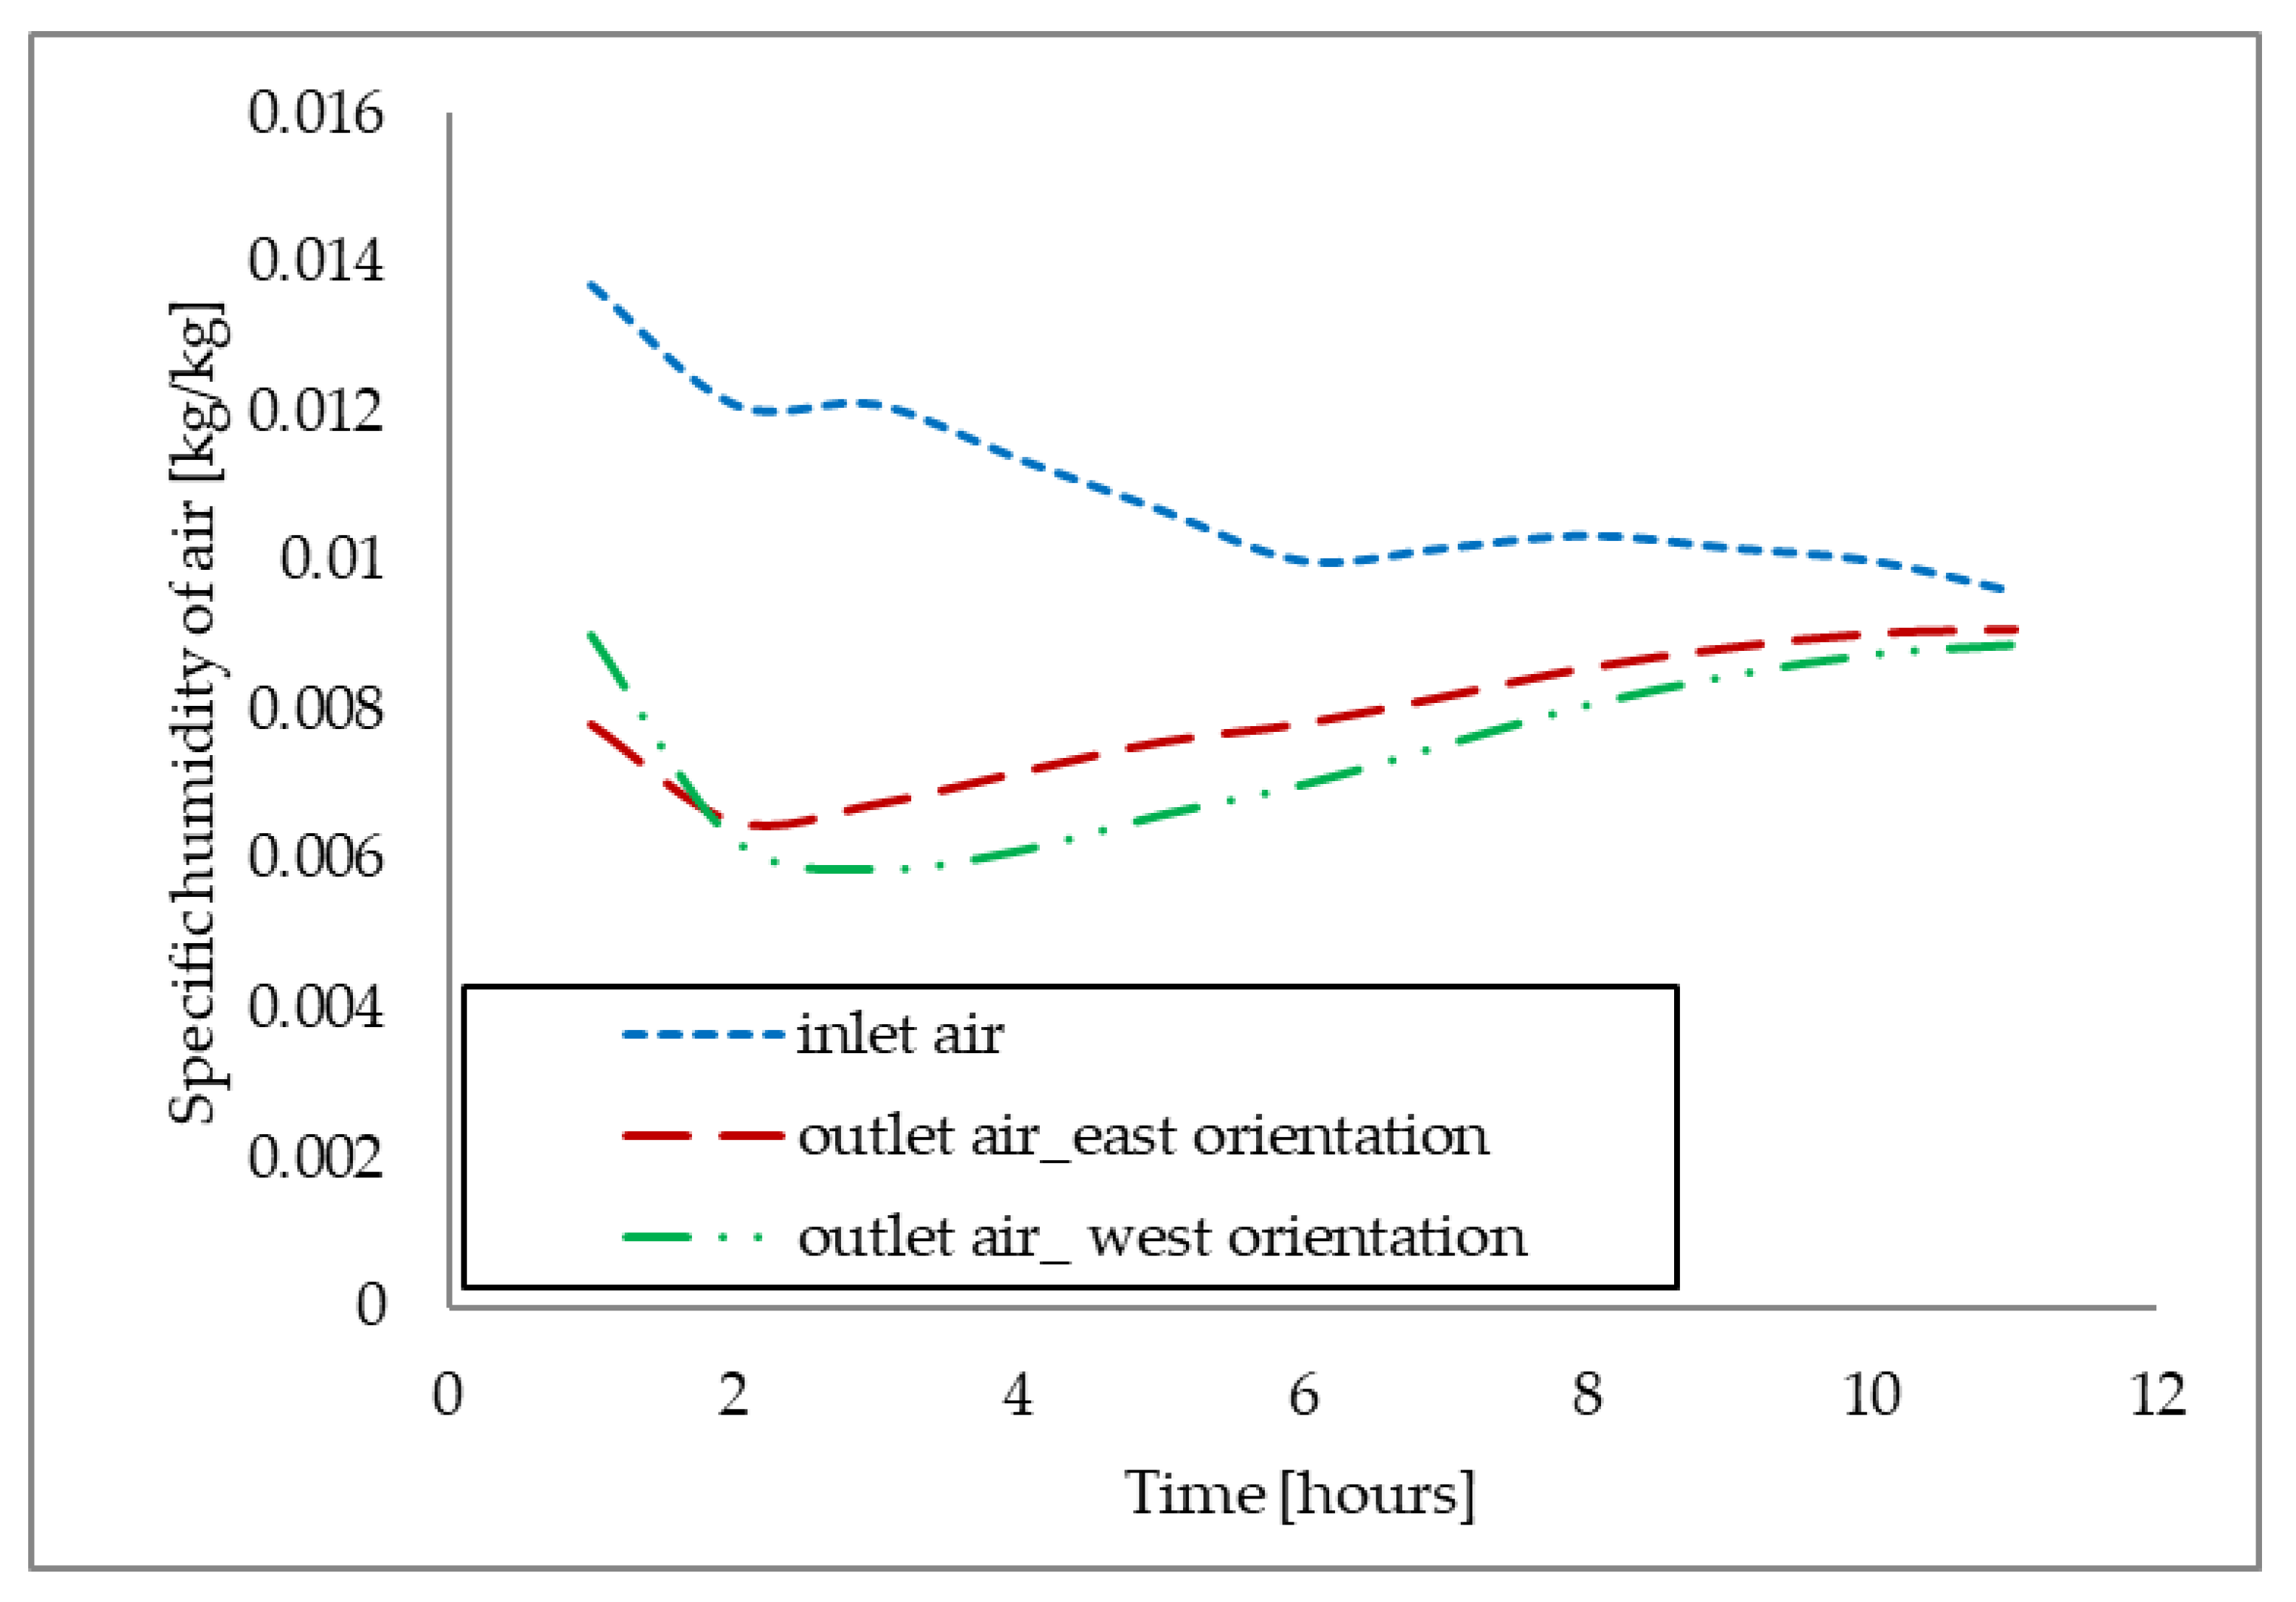
Considering the external bed’s moisture content at the end of the day as the initial input, a simulation of night air conditions was carried out.
Figure 3 shows the specific humidity of the air as it enters and leaves the regenerator (the external silica gel bed). The simulated results indicate that in the first 2 h, the air leaves the regenerator at a specific humidity of around 0.005 kg/kg. The specific humidity of the air leaving the regenerator then increases gradually to a maximum of around 0.006 kg/kg as the regeneration time approaches 8 h. An air specific humidity of 0.006 kg/kg corresponds to a relative humidity of 34% at a temperature of 25 °C, and the equilibrium moisture content of silica gel mixed with paint is approximately 0.02 kg/kg. The air, therefore, has some capacity to dry the interior surfaces that are painted with silica-gel-laden paint.
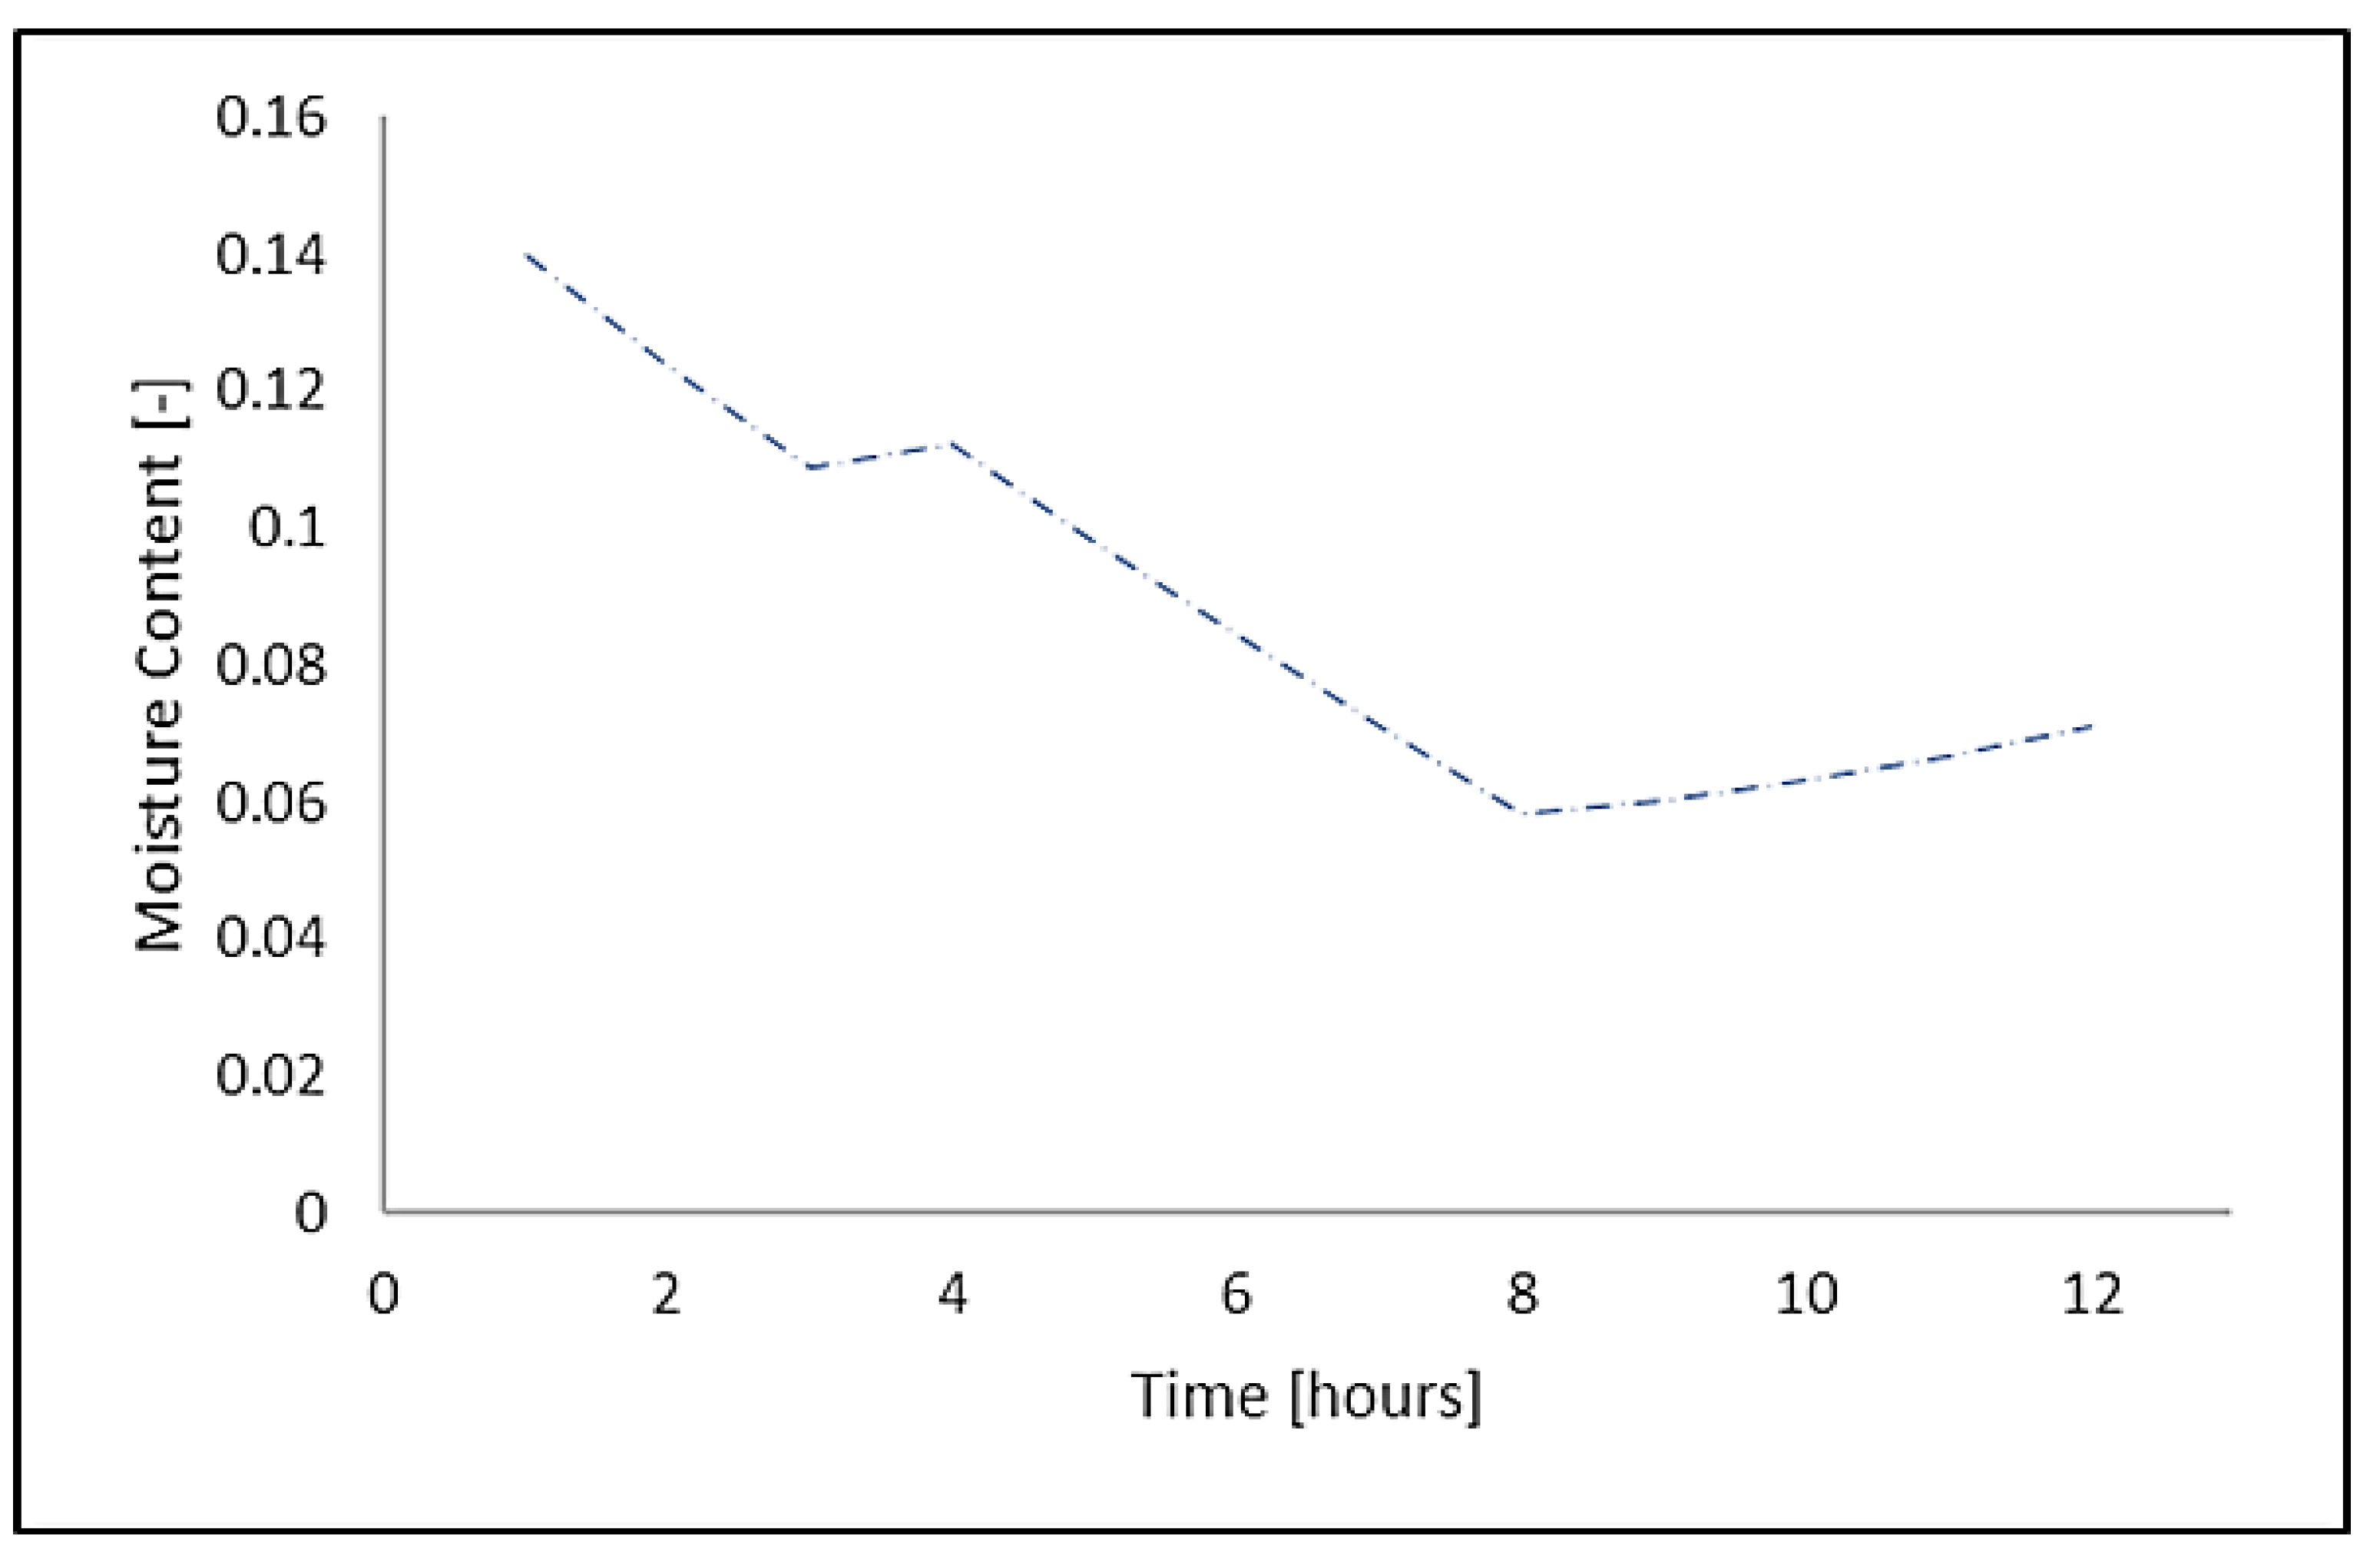
Figure 4 shows the regeneration of the interior surfaces. From
Figure 4, it can be observed that the interior silica gel surfaces are dried to approximately 0.06 kg/kg after 8 h of regeneration, after which rewetting begins. The result of this simulation implies that it is possible to regenerate the internal silica gel surface during the night to make it ready for the next day’s dehumidification process.
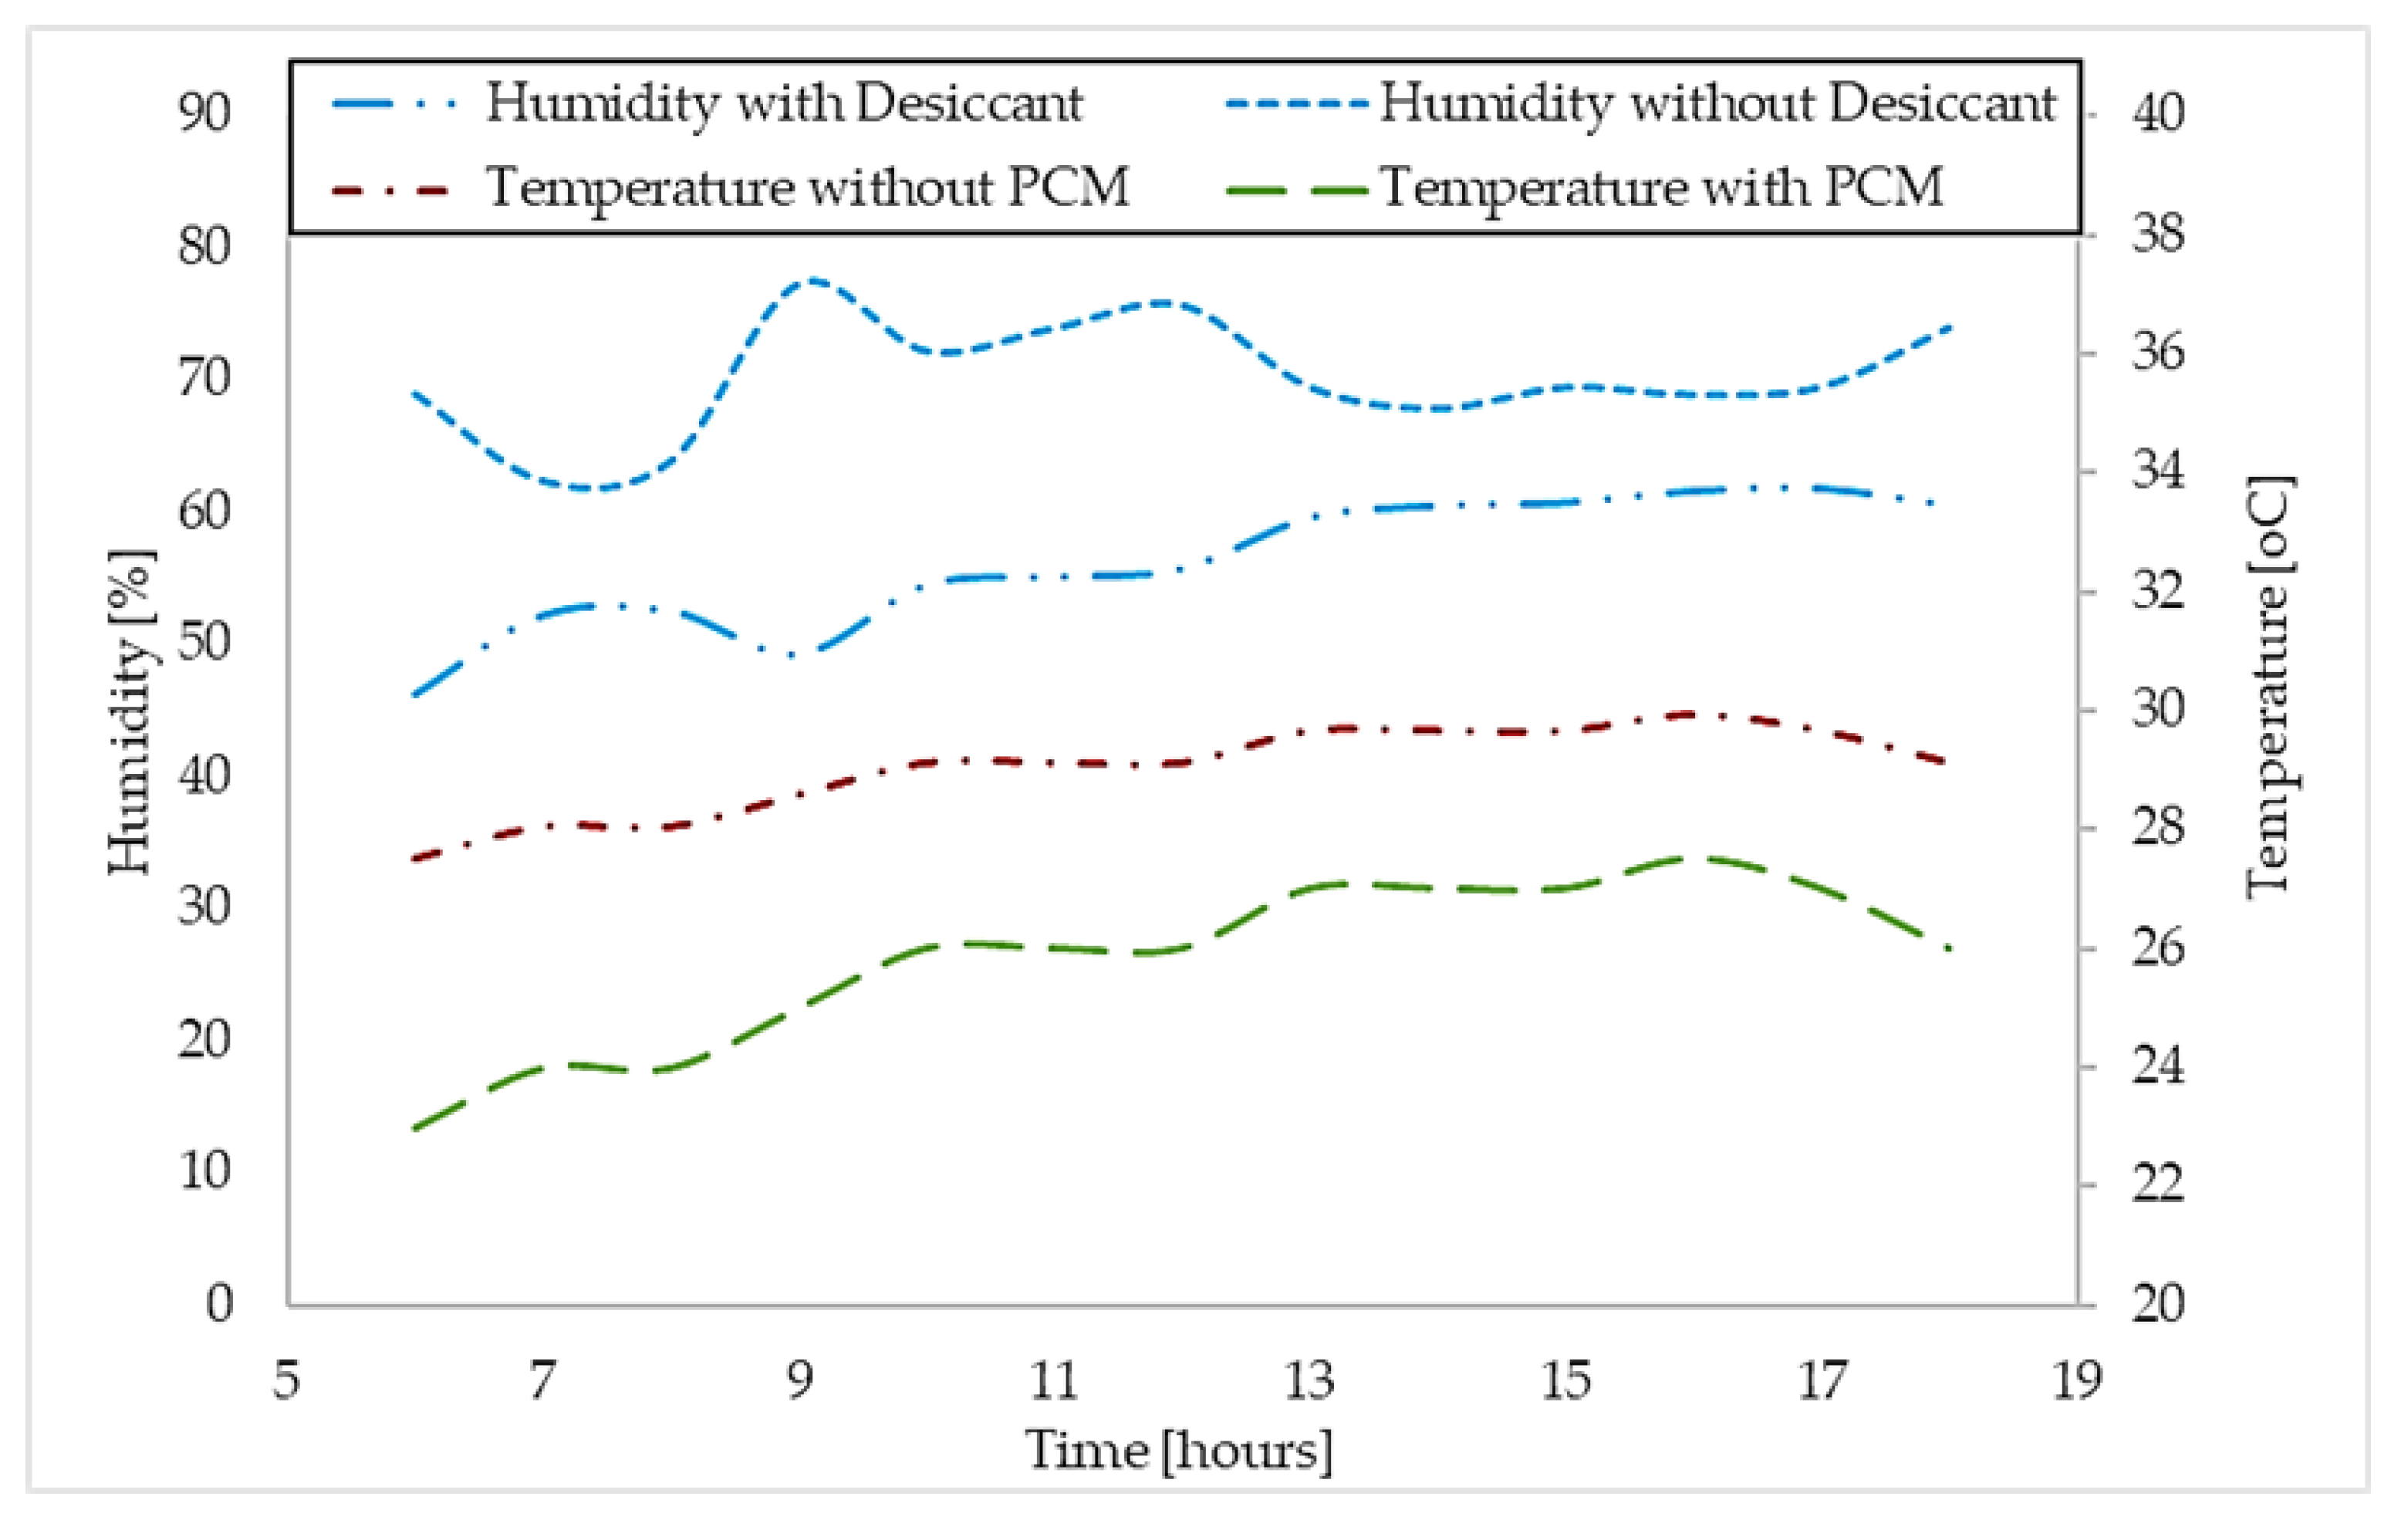
Figure 5 shows the simulated indoor relative humidity and temperature. A maximum relative humidity of around 60% is reached at around 13:00 and maintained until after 17:00 (the time the office is vacated). The temperature reaches a maximum of 27.5 °C in the afternoon at around 15:00.
Thermal comfort is a function of both the temperature and relative humidity in addition to other parameters such as activity level, clothing and local air velocity. Thermal comfort conditions are the conditions of the surroundings that allow optimal thermoregulation, which maintains the core body temperature at ±37 °C. The body can exchange heat with its surroundings due to the presence of a temperature difference or through sweat evaporation. For sweat evaporation to take place, the surrounding air must have the capacity to absorb moisture, and that capacity depends on the air relative humidity. Thus, whereas air temperature is the main parameter in determining thermal comfort, humidity plays a significant role in determining comfort outside the range 30–60%, within which humans do not perceive humidity variation [
41]. High relative humidity inhibits sweat evaporation, so the perceived thermal sensation becomes warmer than if the humidity is relatively low.
The upper limits for temperature according to the ISO 7730 [
42] and ASHRAE 55 [
43] standards are set at a temperature of 26 °C [
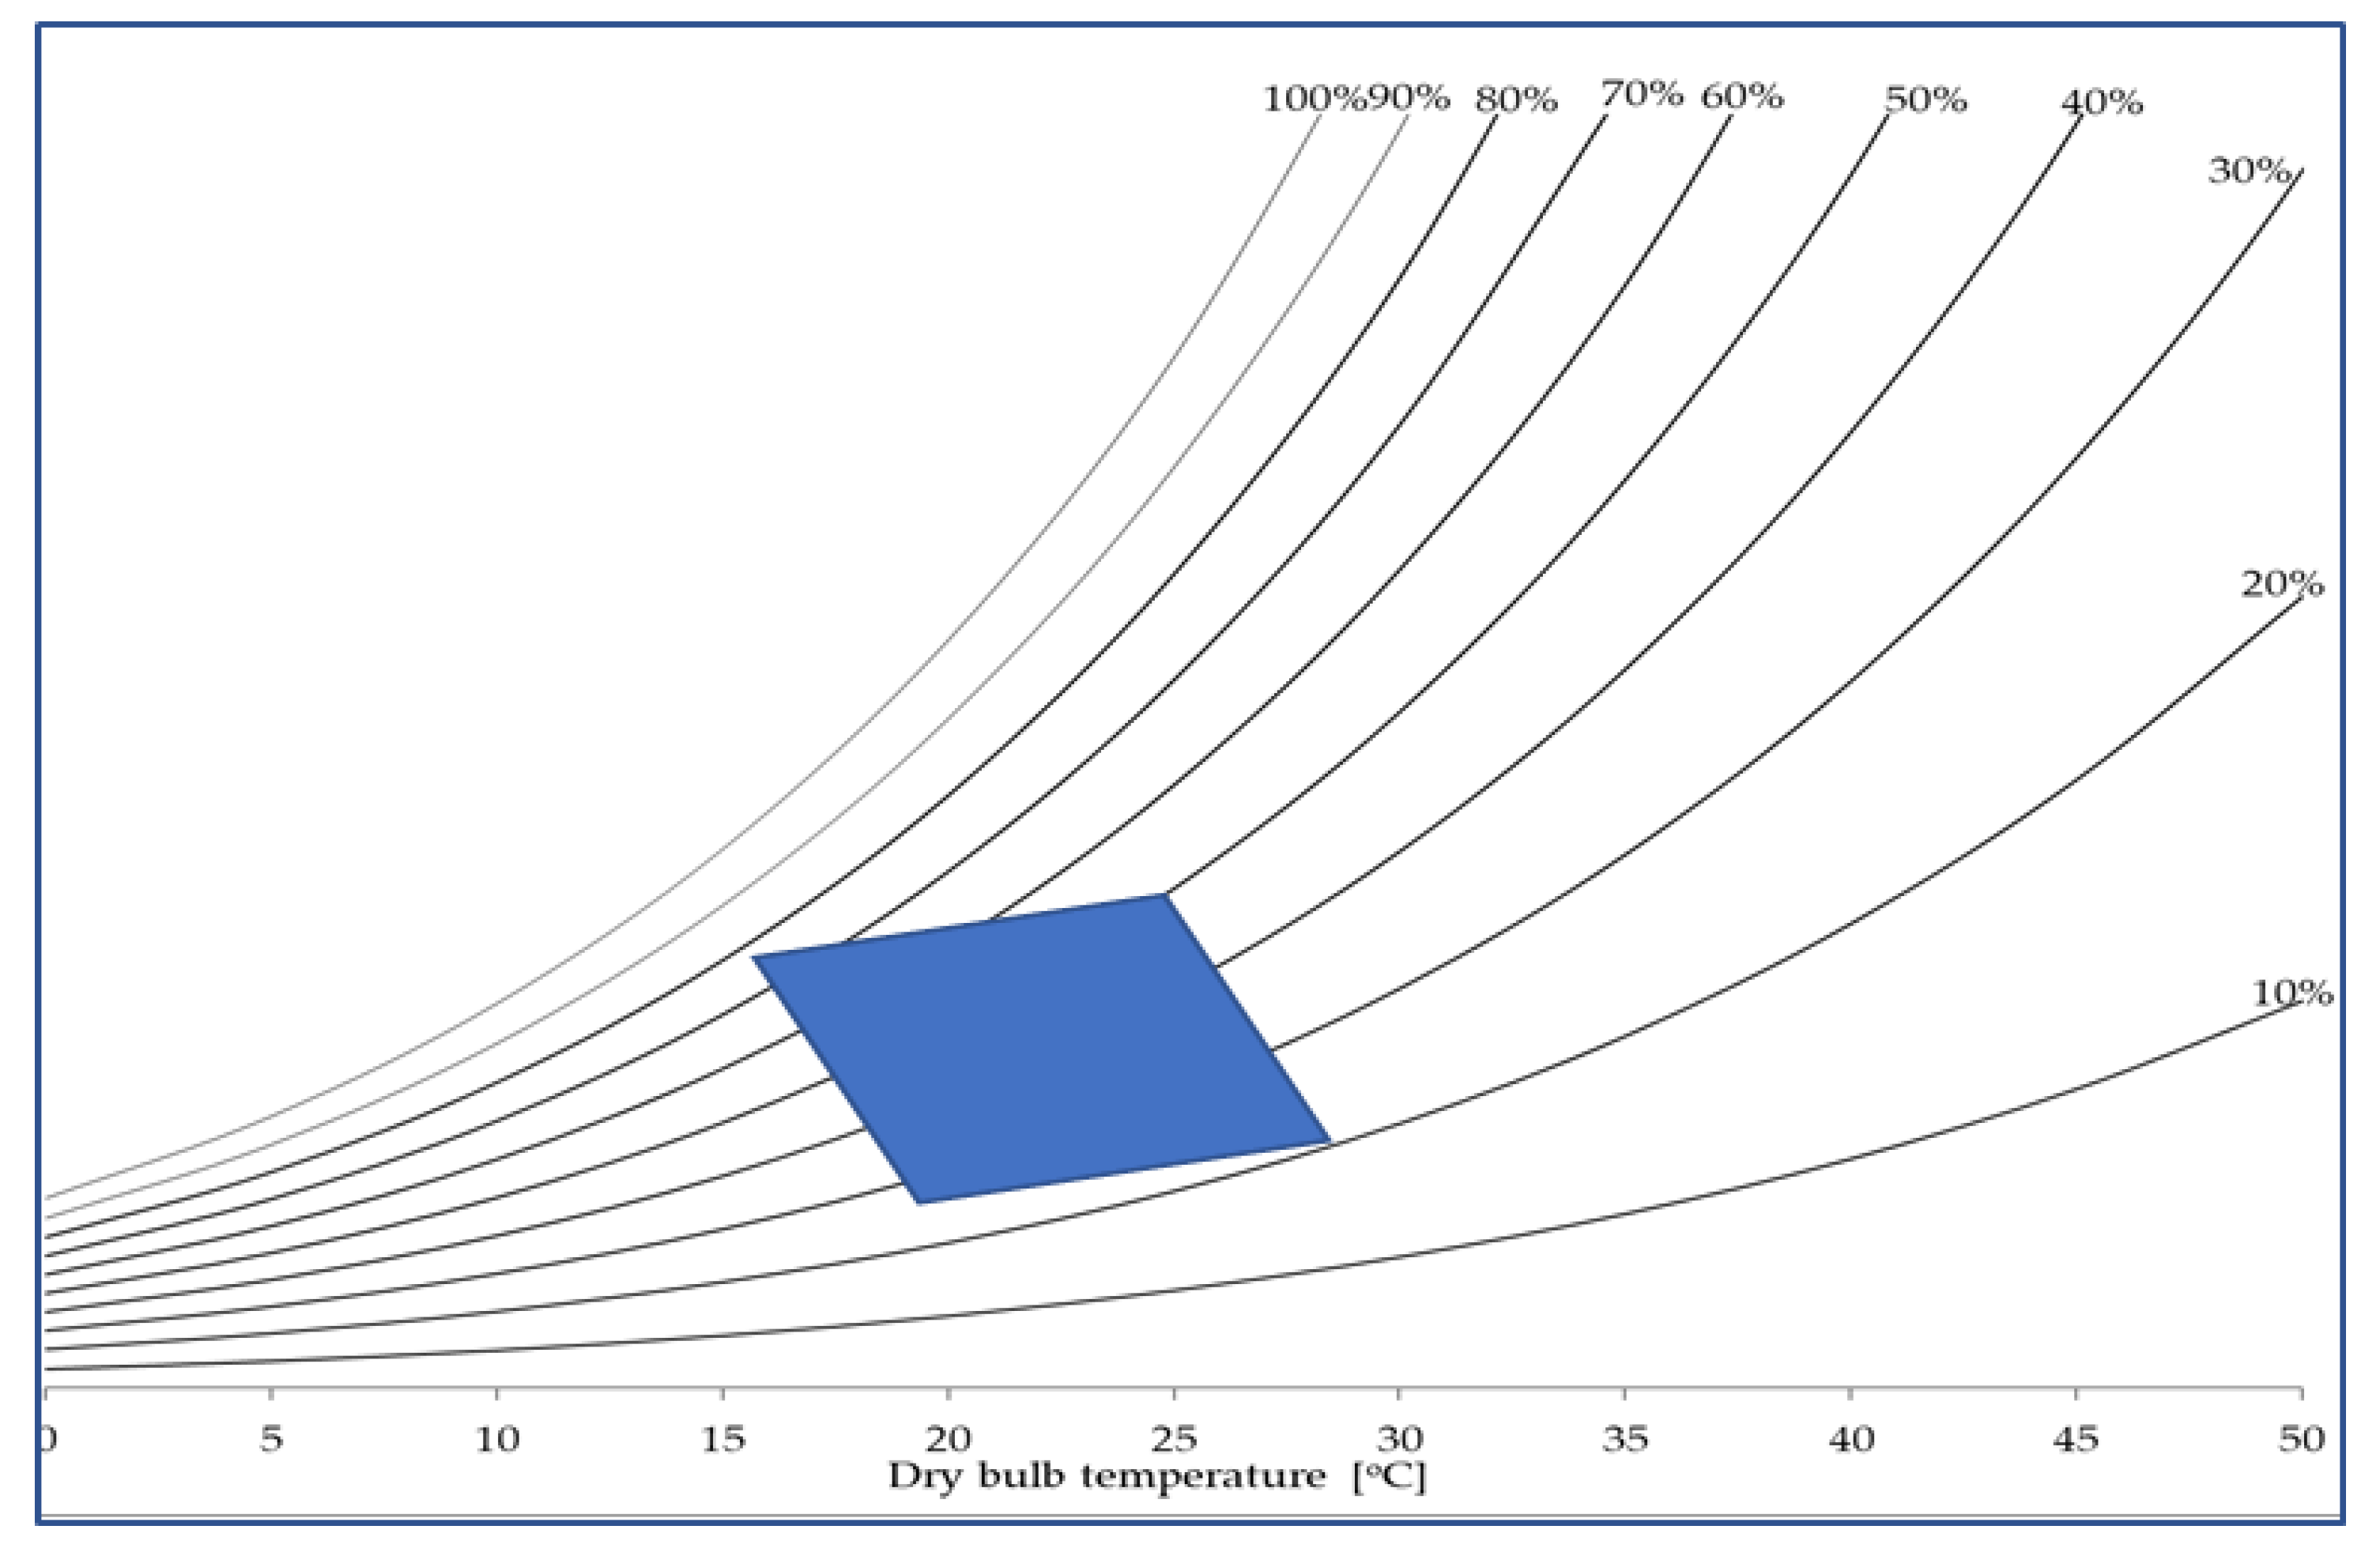
44]. The ASHRAE 55 standard upper limit of 26 °C assumes a relative humidity of 50%, whereas the ISO 7730 specifies relative humidity limits of 30–70%. According to the obtained results from 06:00 to about noon (about 6 h), the temperature is kept under and up to 26 °C, this is within the common two comfort standards’ limits. Beyond noon, the temperature gradually rises, reaching a maximum of 27.5 °C towards end of day. The maximum temperature reached is 1.5 °C higher than the limits set by the ASHRAE/ISO standards, with an associated relative humidity around 60%, which is within the imperceptible range. The relatively low humidity ensures thermal comfort even at the higher temperature (
Figure 6). Considering adaptation, the obtained results are considered to be within acceptable thermal comfort [
45]. Thus, the proposed strategy can provide comfort to an office in a warm humid region.
The performance of such passive strategies is particularly dependent on the load regime; thus, this requires knowledge of the many parameters that characterize the load. An attempt to model the load regime has been performed and applied to the simulation process. The intermittency and indeterminant nature of the parameters involved present the biggest challenges. Due to the paucity of data, the study depended on the estimation of the input variables, which are spatially and temporally diverse in nature. For example, infiltration can have a significant impact; however, its variability is a challenge towards its estimation.
Critical parameters such as mass and heat transfer coefficients between the PCM/DESICCANT system and the air should be verified; these are quite important in the design and performance prediction of such a system. The values used were from the literature and were derived under similar but not identical conditions. Experimental determination of these parameters is therefore recommended. In addition, measurements on a full-scale model office will give even more reliable and conclusive results. Experimental determination of the dynamic parameters of silica gel–water vapor systems in various conditions is also proposed. This study applied simple algorithms for simulation and the results obtained call for more investigation to validate the performance.
The cost of implementing the passive system is estimated to be around USD 1000.00 based on cost of the materials given in
Table 3. The capital cost of an air conditioning unit for the room is estimated to be around USD 750.00. The daily operational costs based on an energy tariff of USD 0.105/kWh, an energy requirement for powering the air conditioning unit of around 0.35 kW power input and 10 h of operation is USD 0.36. The passive system reaches a break-even point in comparison with the active system in year 3; thereafter, the passive system results in cost savings. In addition, the passive system has environmental benefits.
4. Conclusions
From the performed work, it can be concluded that with some load management interventions, systems utilizing PCM and desiccant combinations have the potential for moderating the temperature as well as the humidity in an office in Harare, Zimbabwe. The relative humidity in the room can be kept at around 60%, whereas the temperature can be maintained at around 27 °C or lower by utilizing 1.8 kg of desiccant and 14 kg of PCM per m2 of floor area. Estimation of the indoor conditions without the PCM and desiccant indicates out of comfort conditions of up to around 80% and 30 °C for the relative humidity and temperature, respectively. Although many studies have been carried out on thermal storage in buildings using PCMs for temperature control, there have been very few studies on the possible application of desiccants within building components for moisture control. The present strategy brings the cooperative aspect of the desiccant to ensure comfort is achieved at the temperatures attainable for passive cooling using PCMs. Due to a number of limitations, although our results show some potential, it is important to note that more investigation is necessary. Furthermore, experimental investigation is necessary to validate and/or improve the model. The current study focuses on both temperature and humidity control in an office. The two parameters are critical for thermal comfort and health when considering warm and humid climates. The study is unique because of its application of both a PCM and a desiccant as part of the interior finish and the regeneration of both through night air drying and applying a solar-regenerated external desiccant as a dryer.


