
A Comprehensive Review of a Decade of Field PV Soiling Assessment in QEERI’s Outdoor Test Facility in Qatar: Learned Lessons and Recommendations

 ,
,  , ,
, ,
Abstract
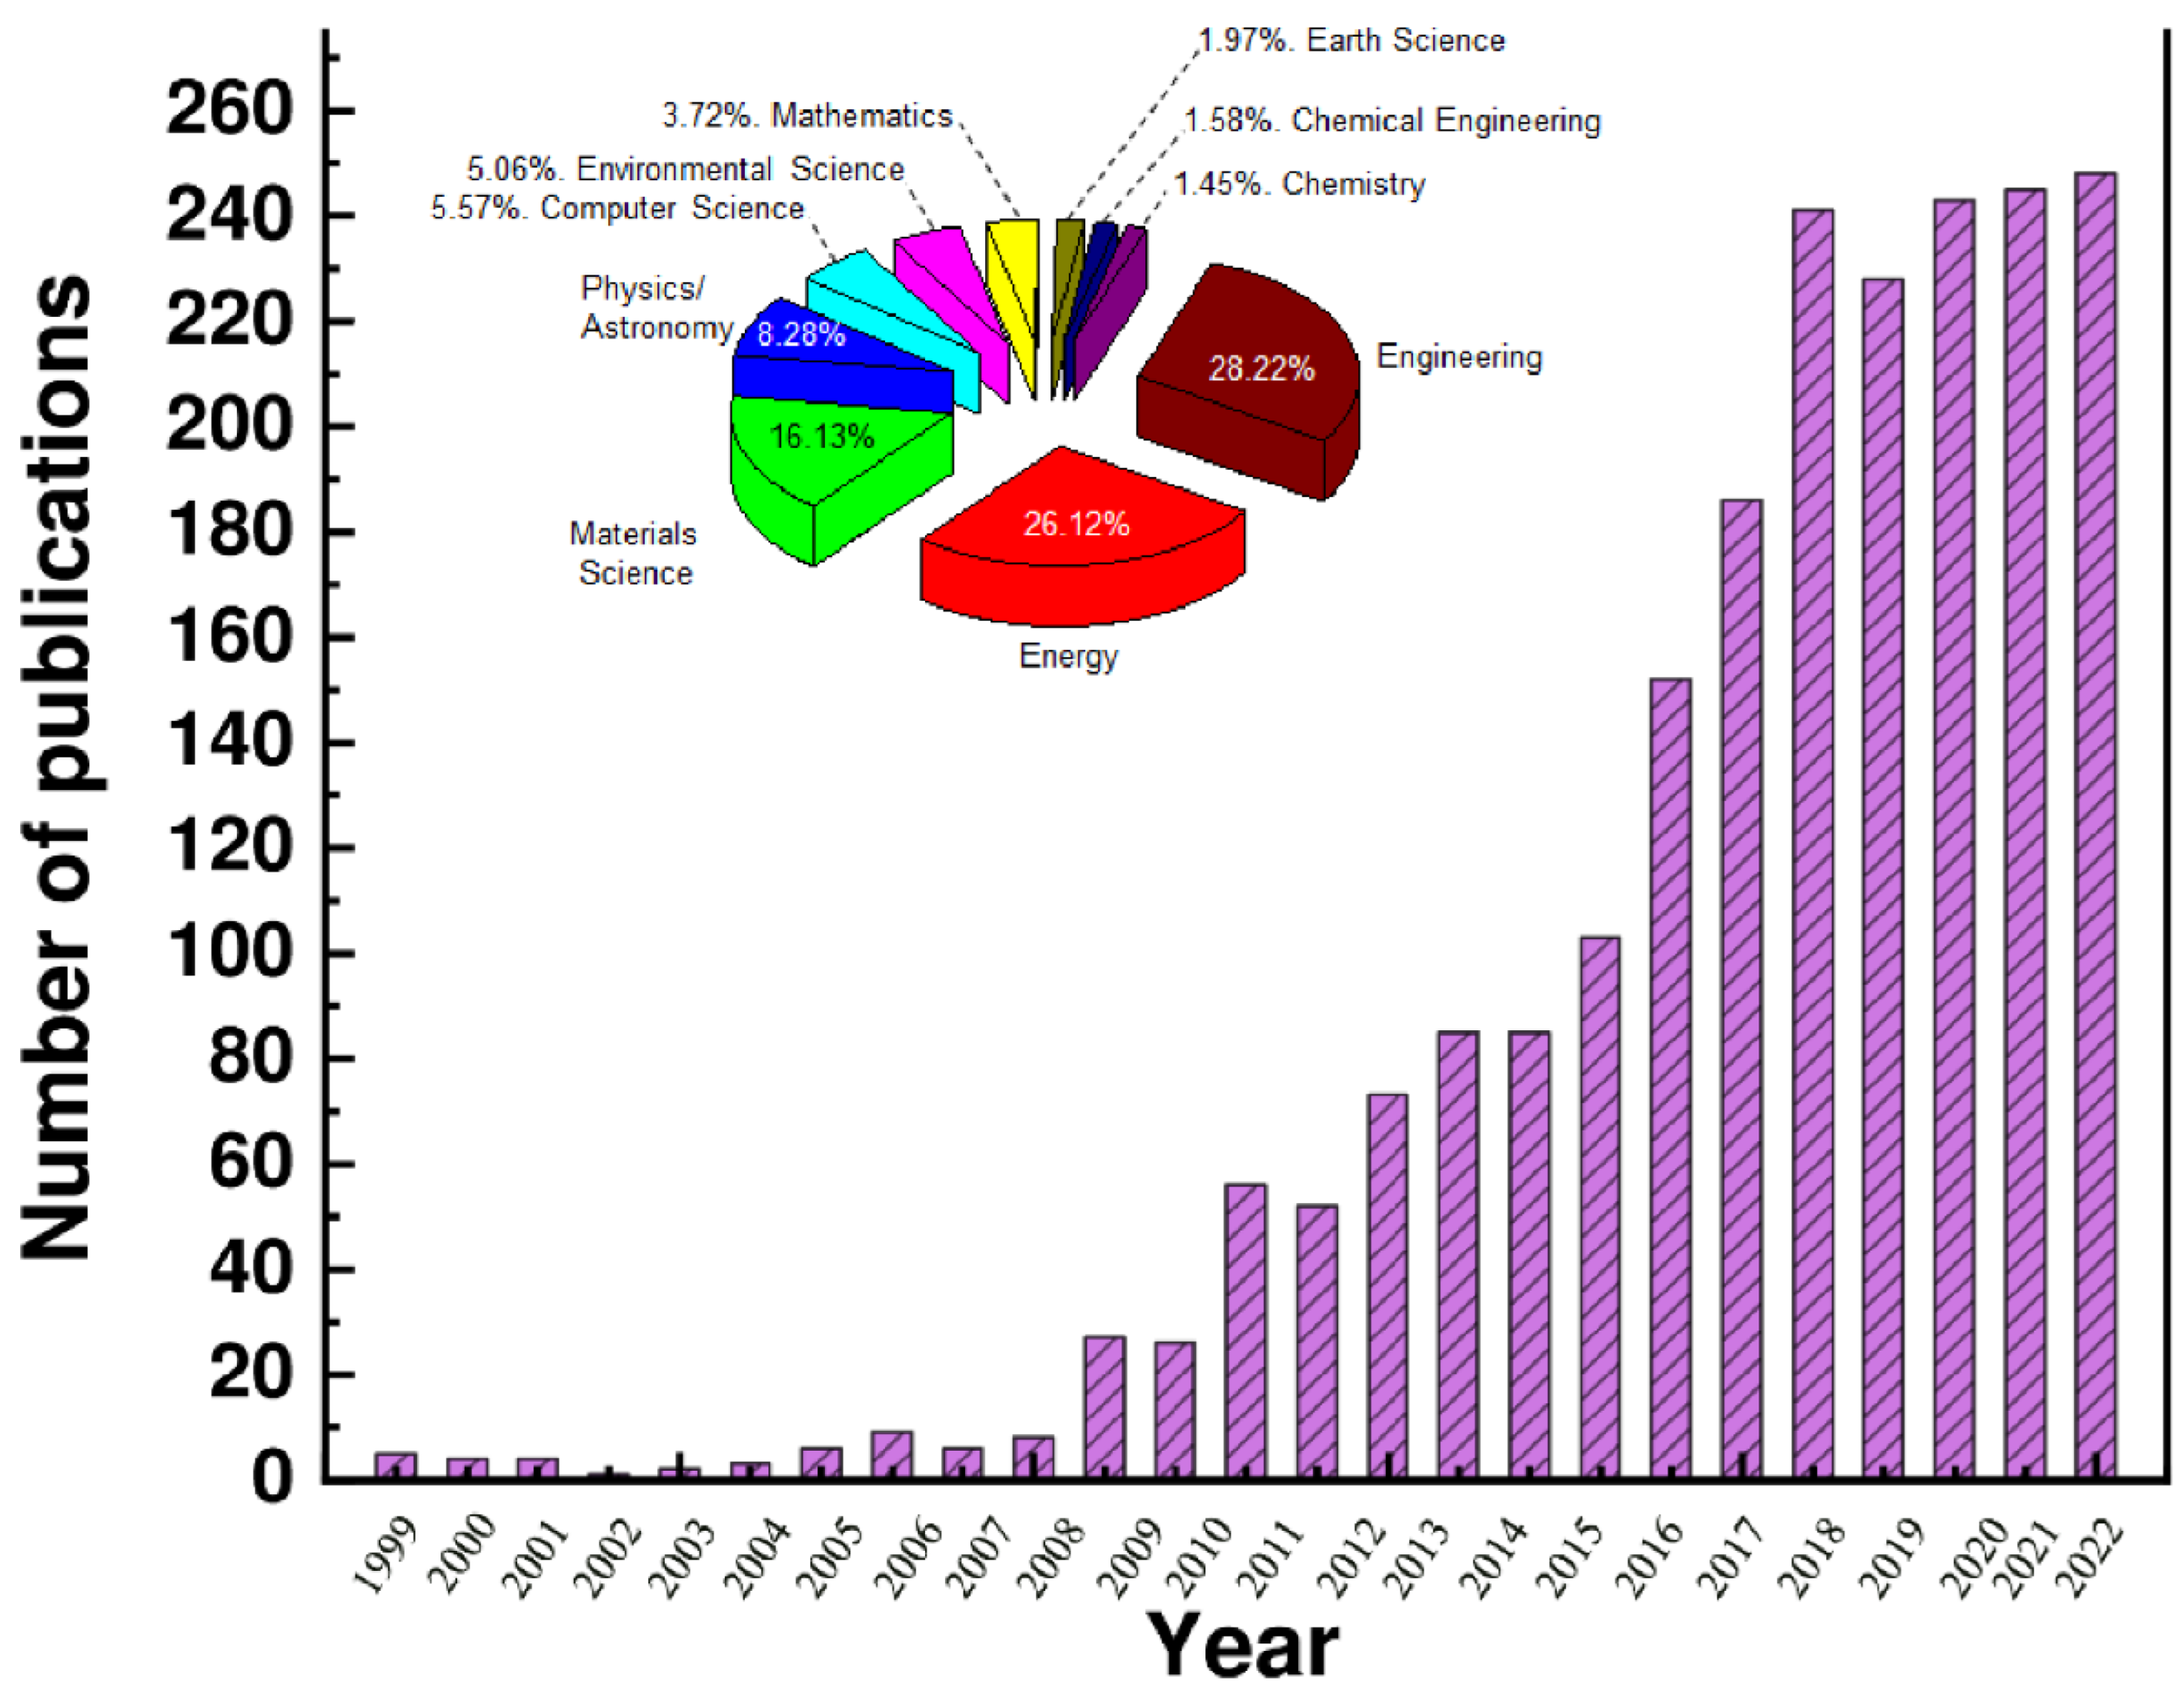
:1. Introduction
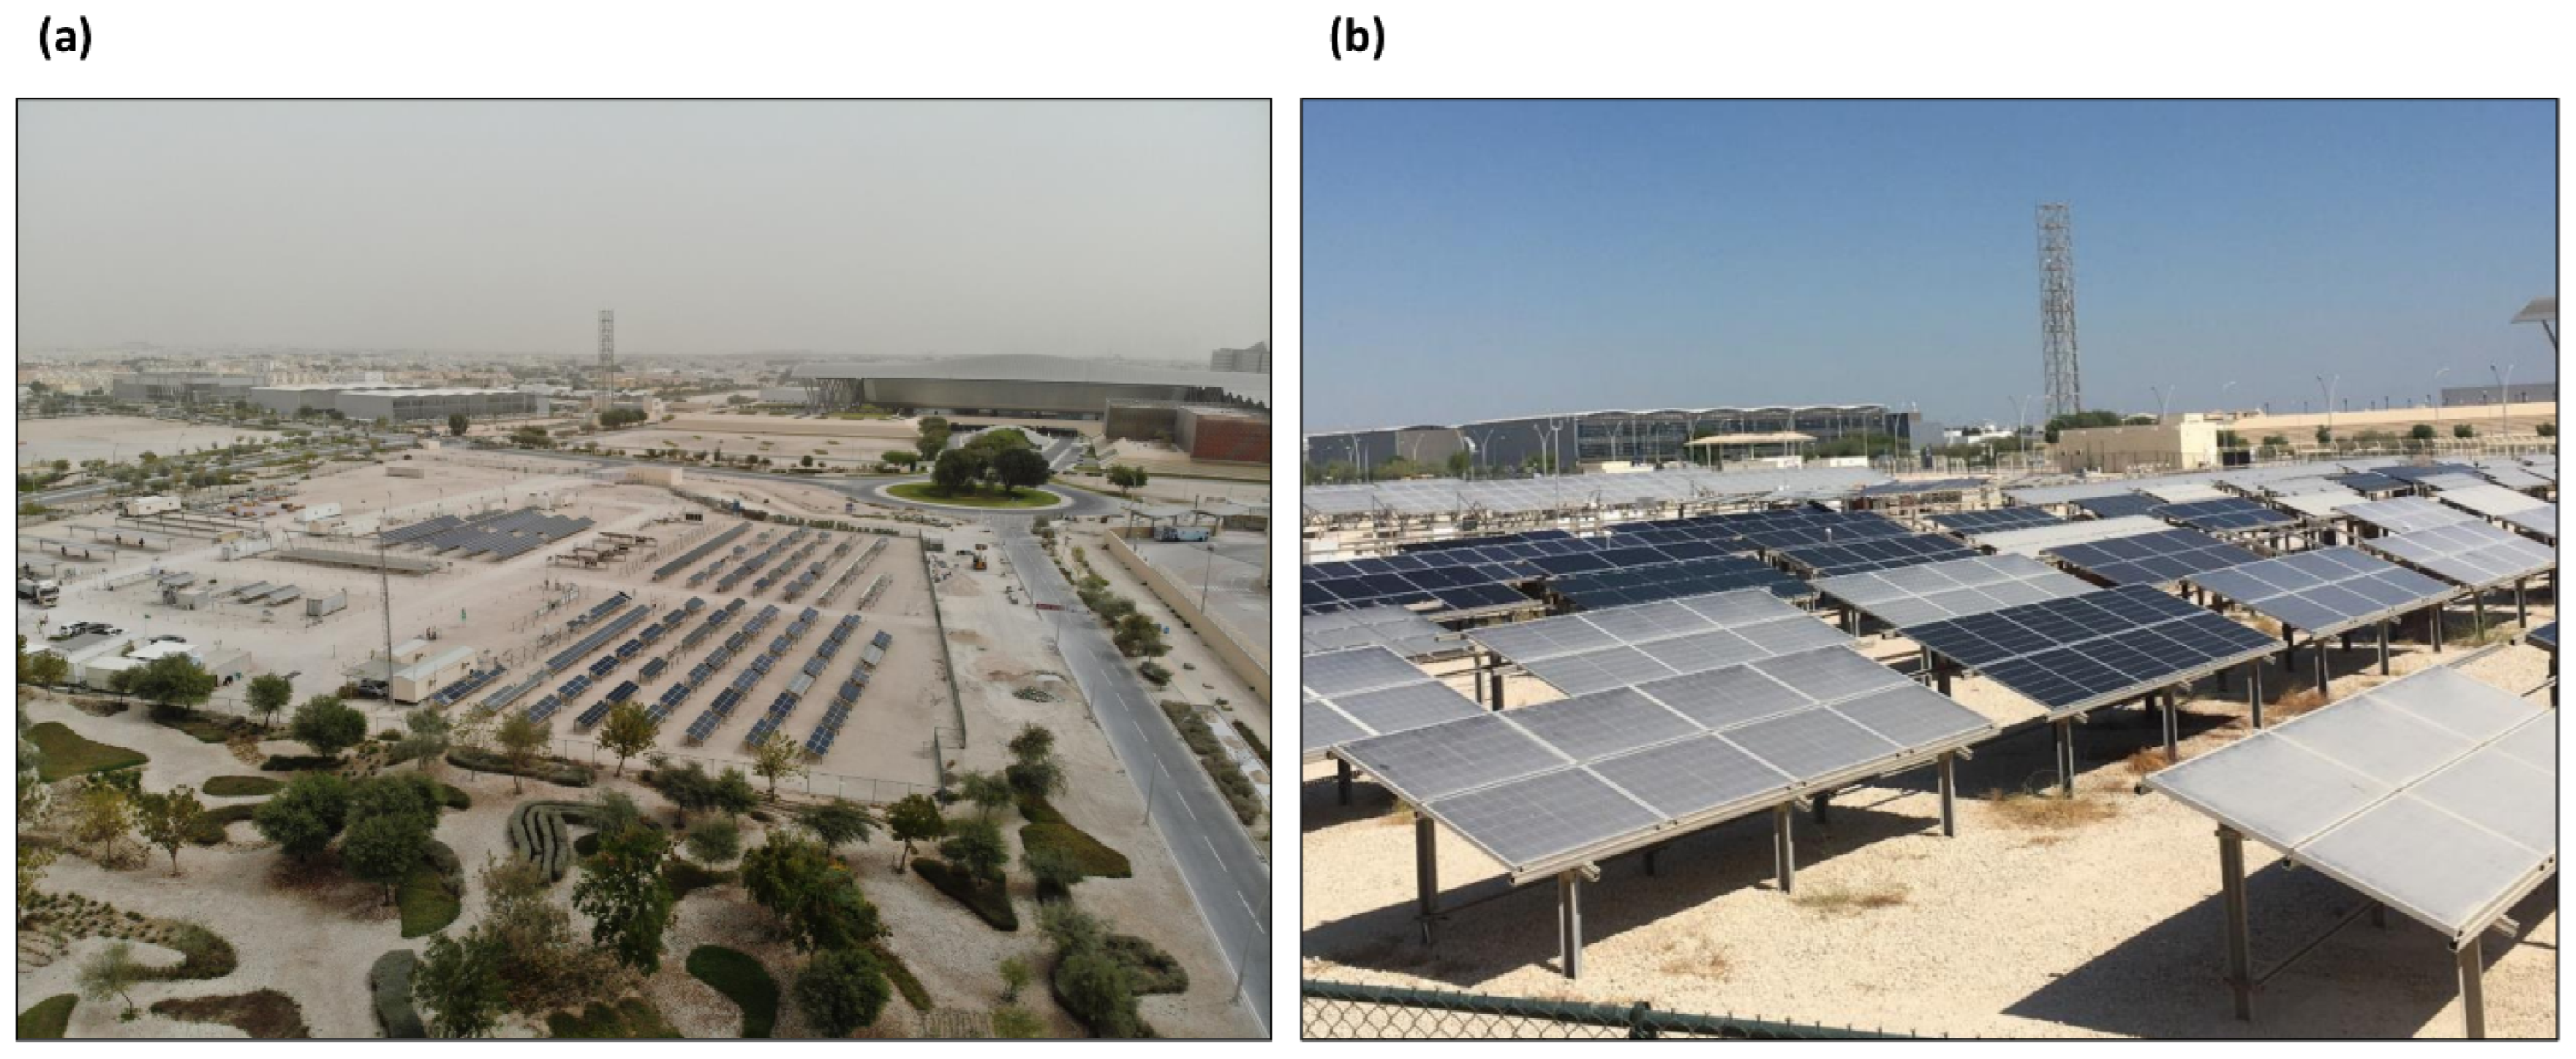
Description of the OTF
- -
- 38 crystalline silicon PV systems—mono-Si, multi-Si, bifacial
- -
- 30 thin-film PV systems—CdTe, CIGS, μSi-aSi
- -
- 4 hybrid PV systems—silicon hetero-junction, PERC, and TOPCon
- -
- 7 concentrating PV systems
- -
- Inverters—central, string, micro-inverters
- -
- Trackers—1-axis, 2-axis
- -
- Battery storage system (500 kWh)
- -
- Linear Fresnel thermal collector
- -
- Anti-soiling coatings
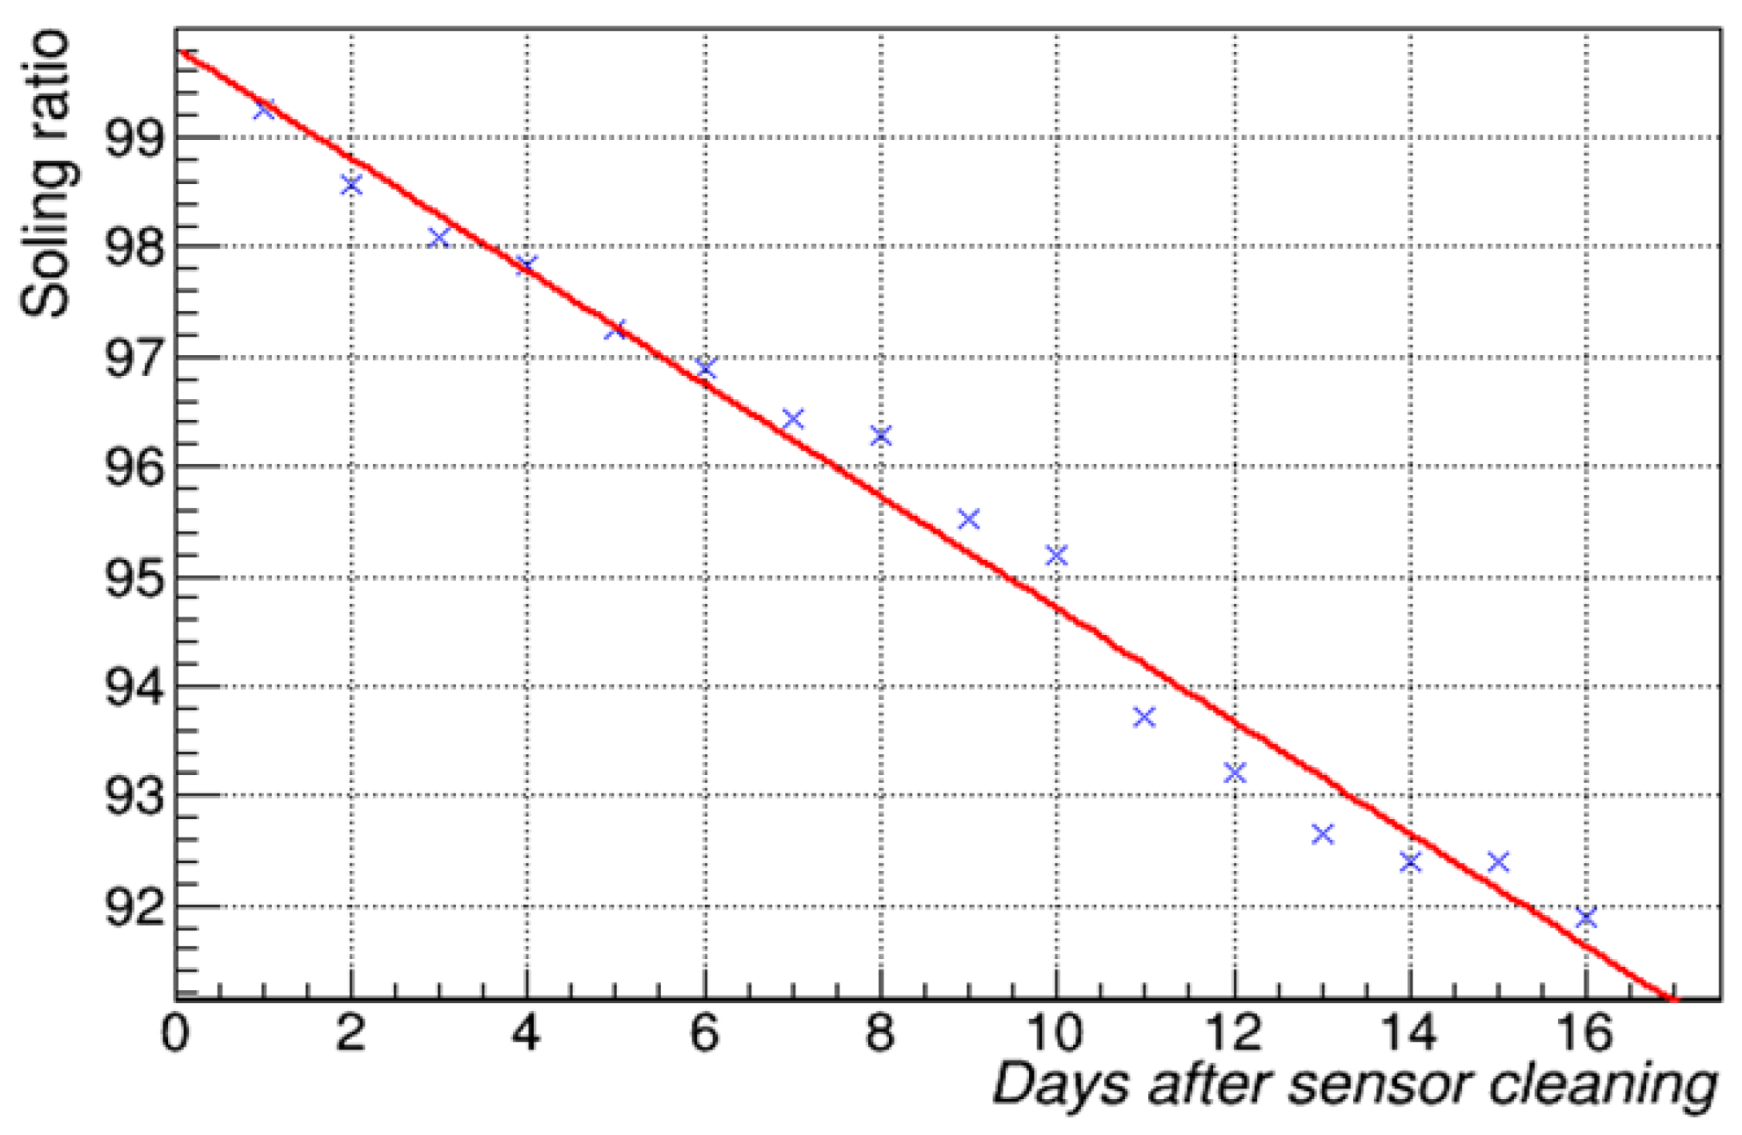
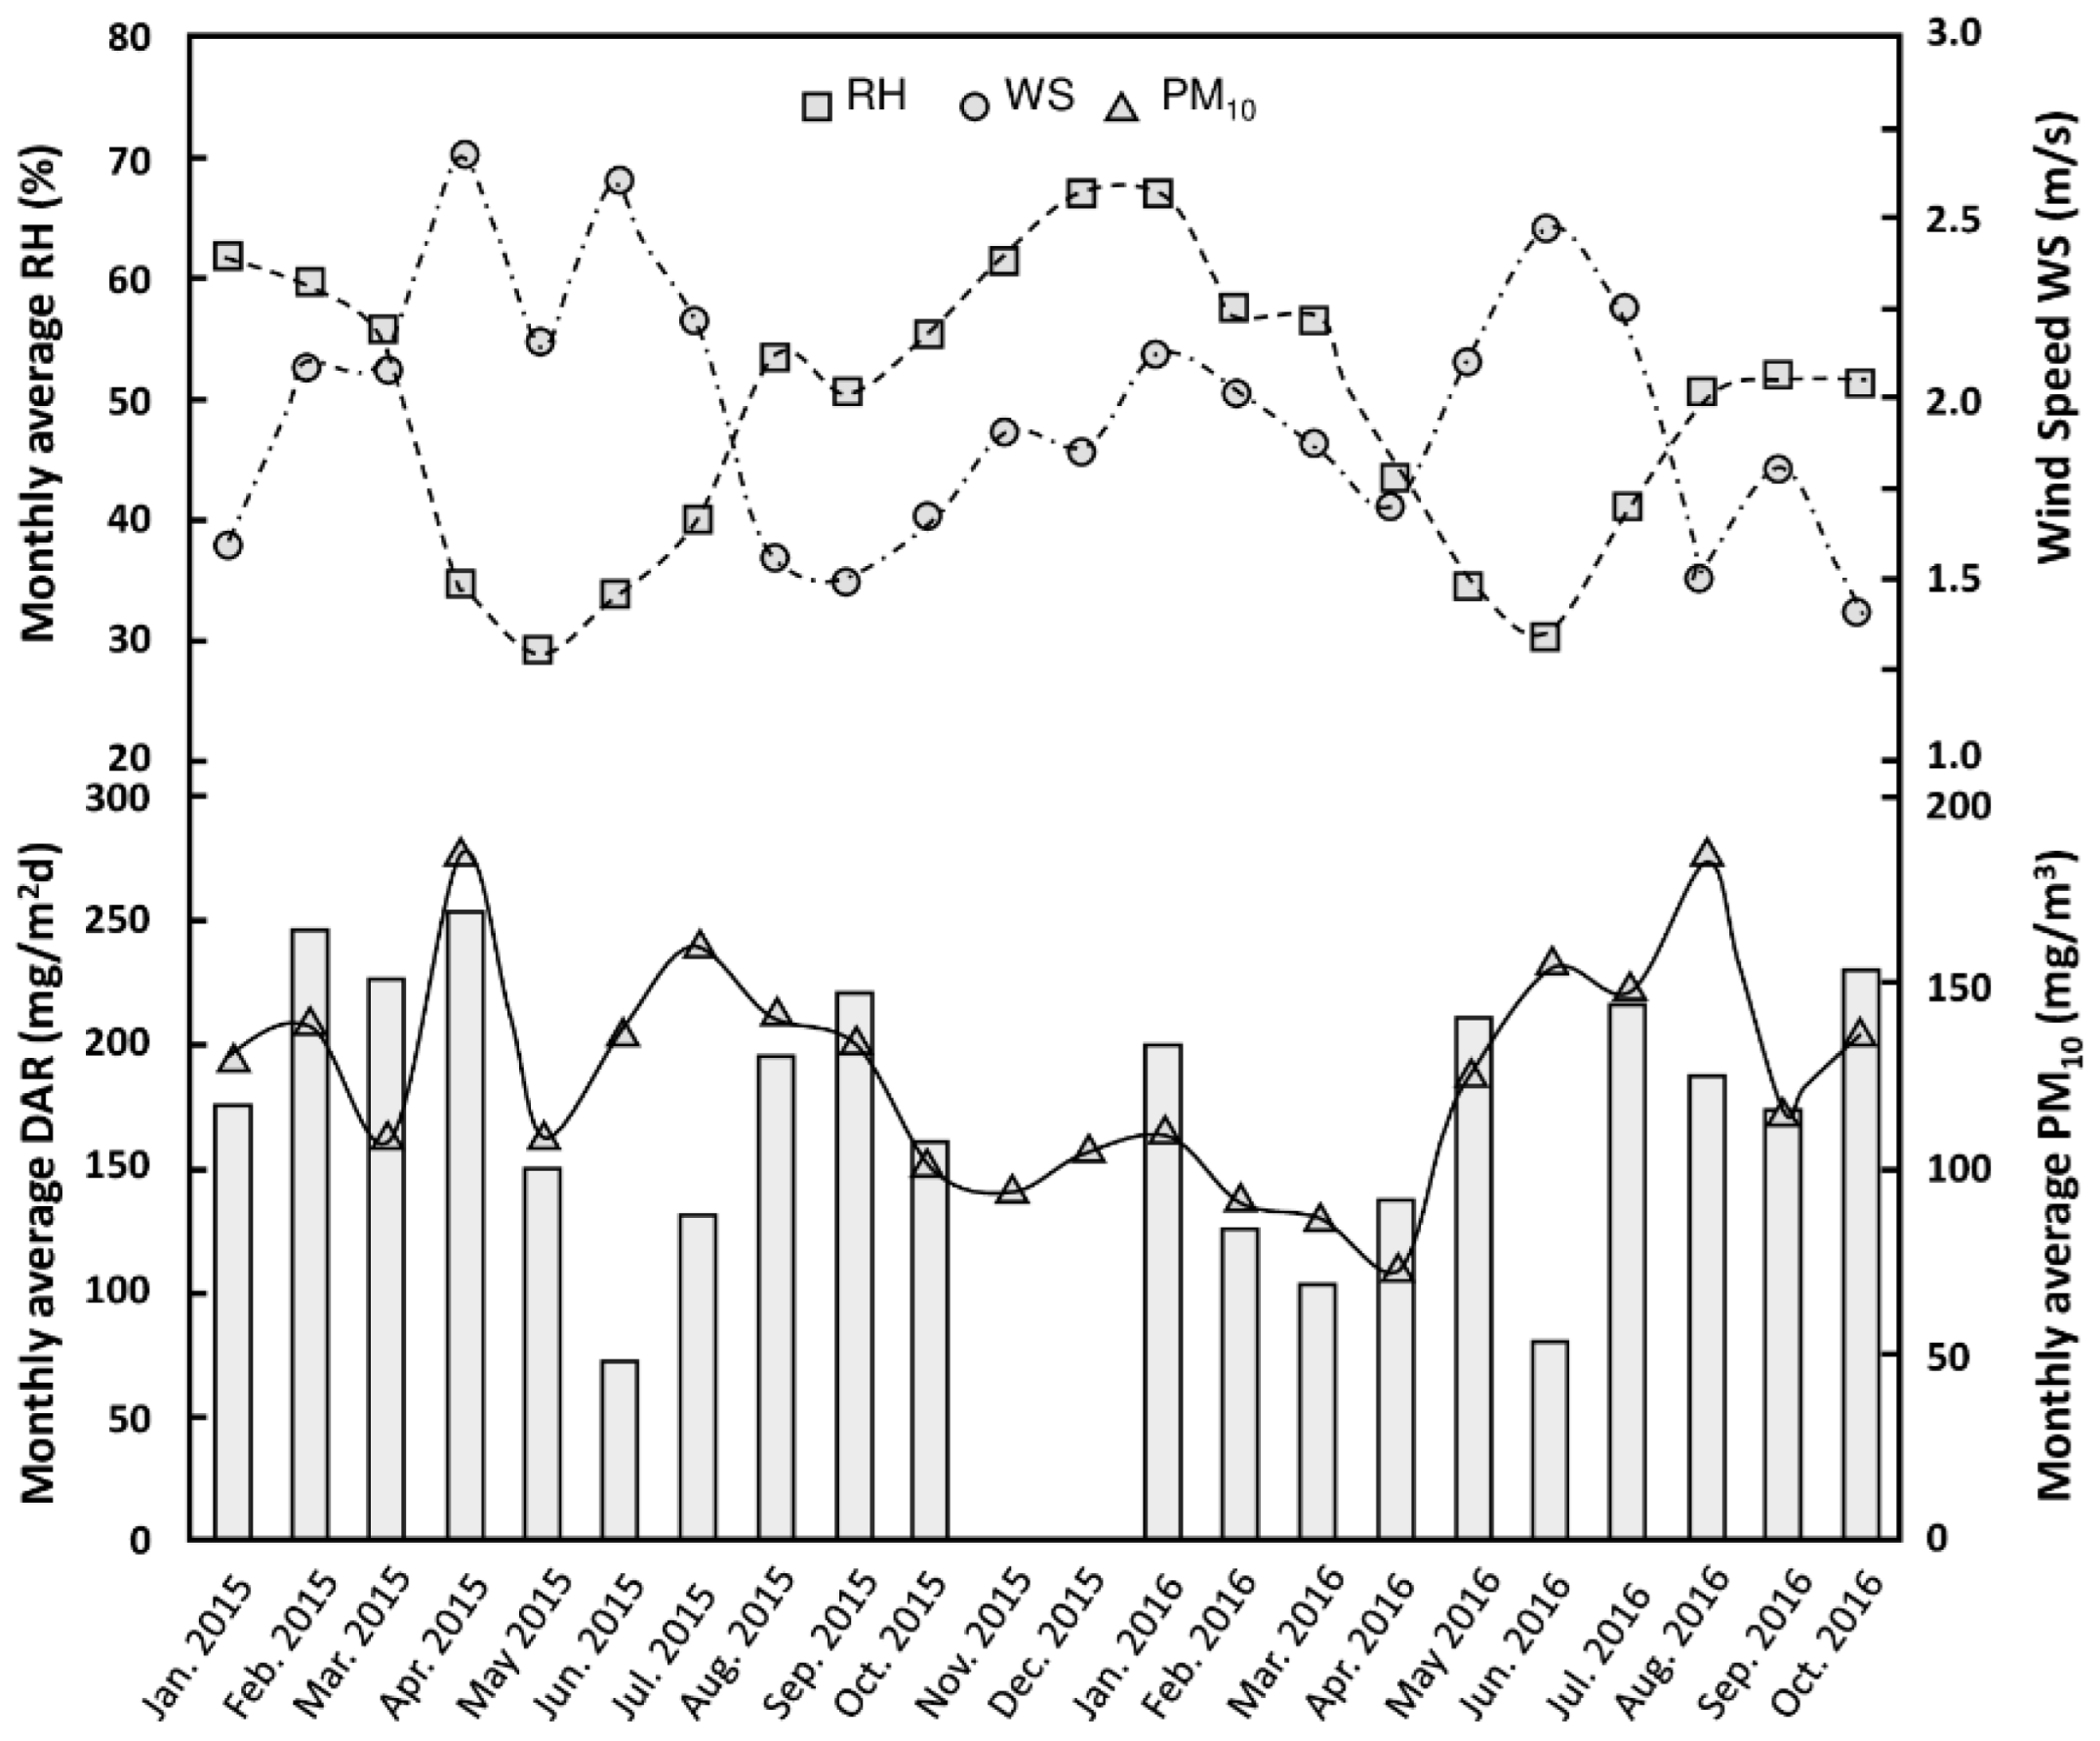
2. Impact of the Soiling on Solar Radiation in Qatar
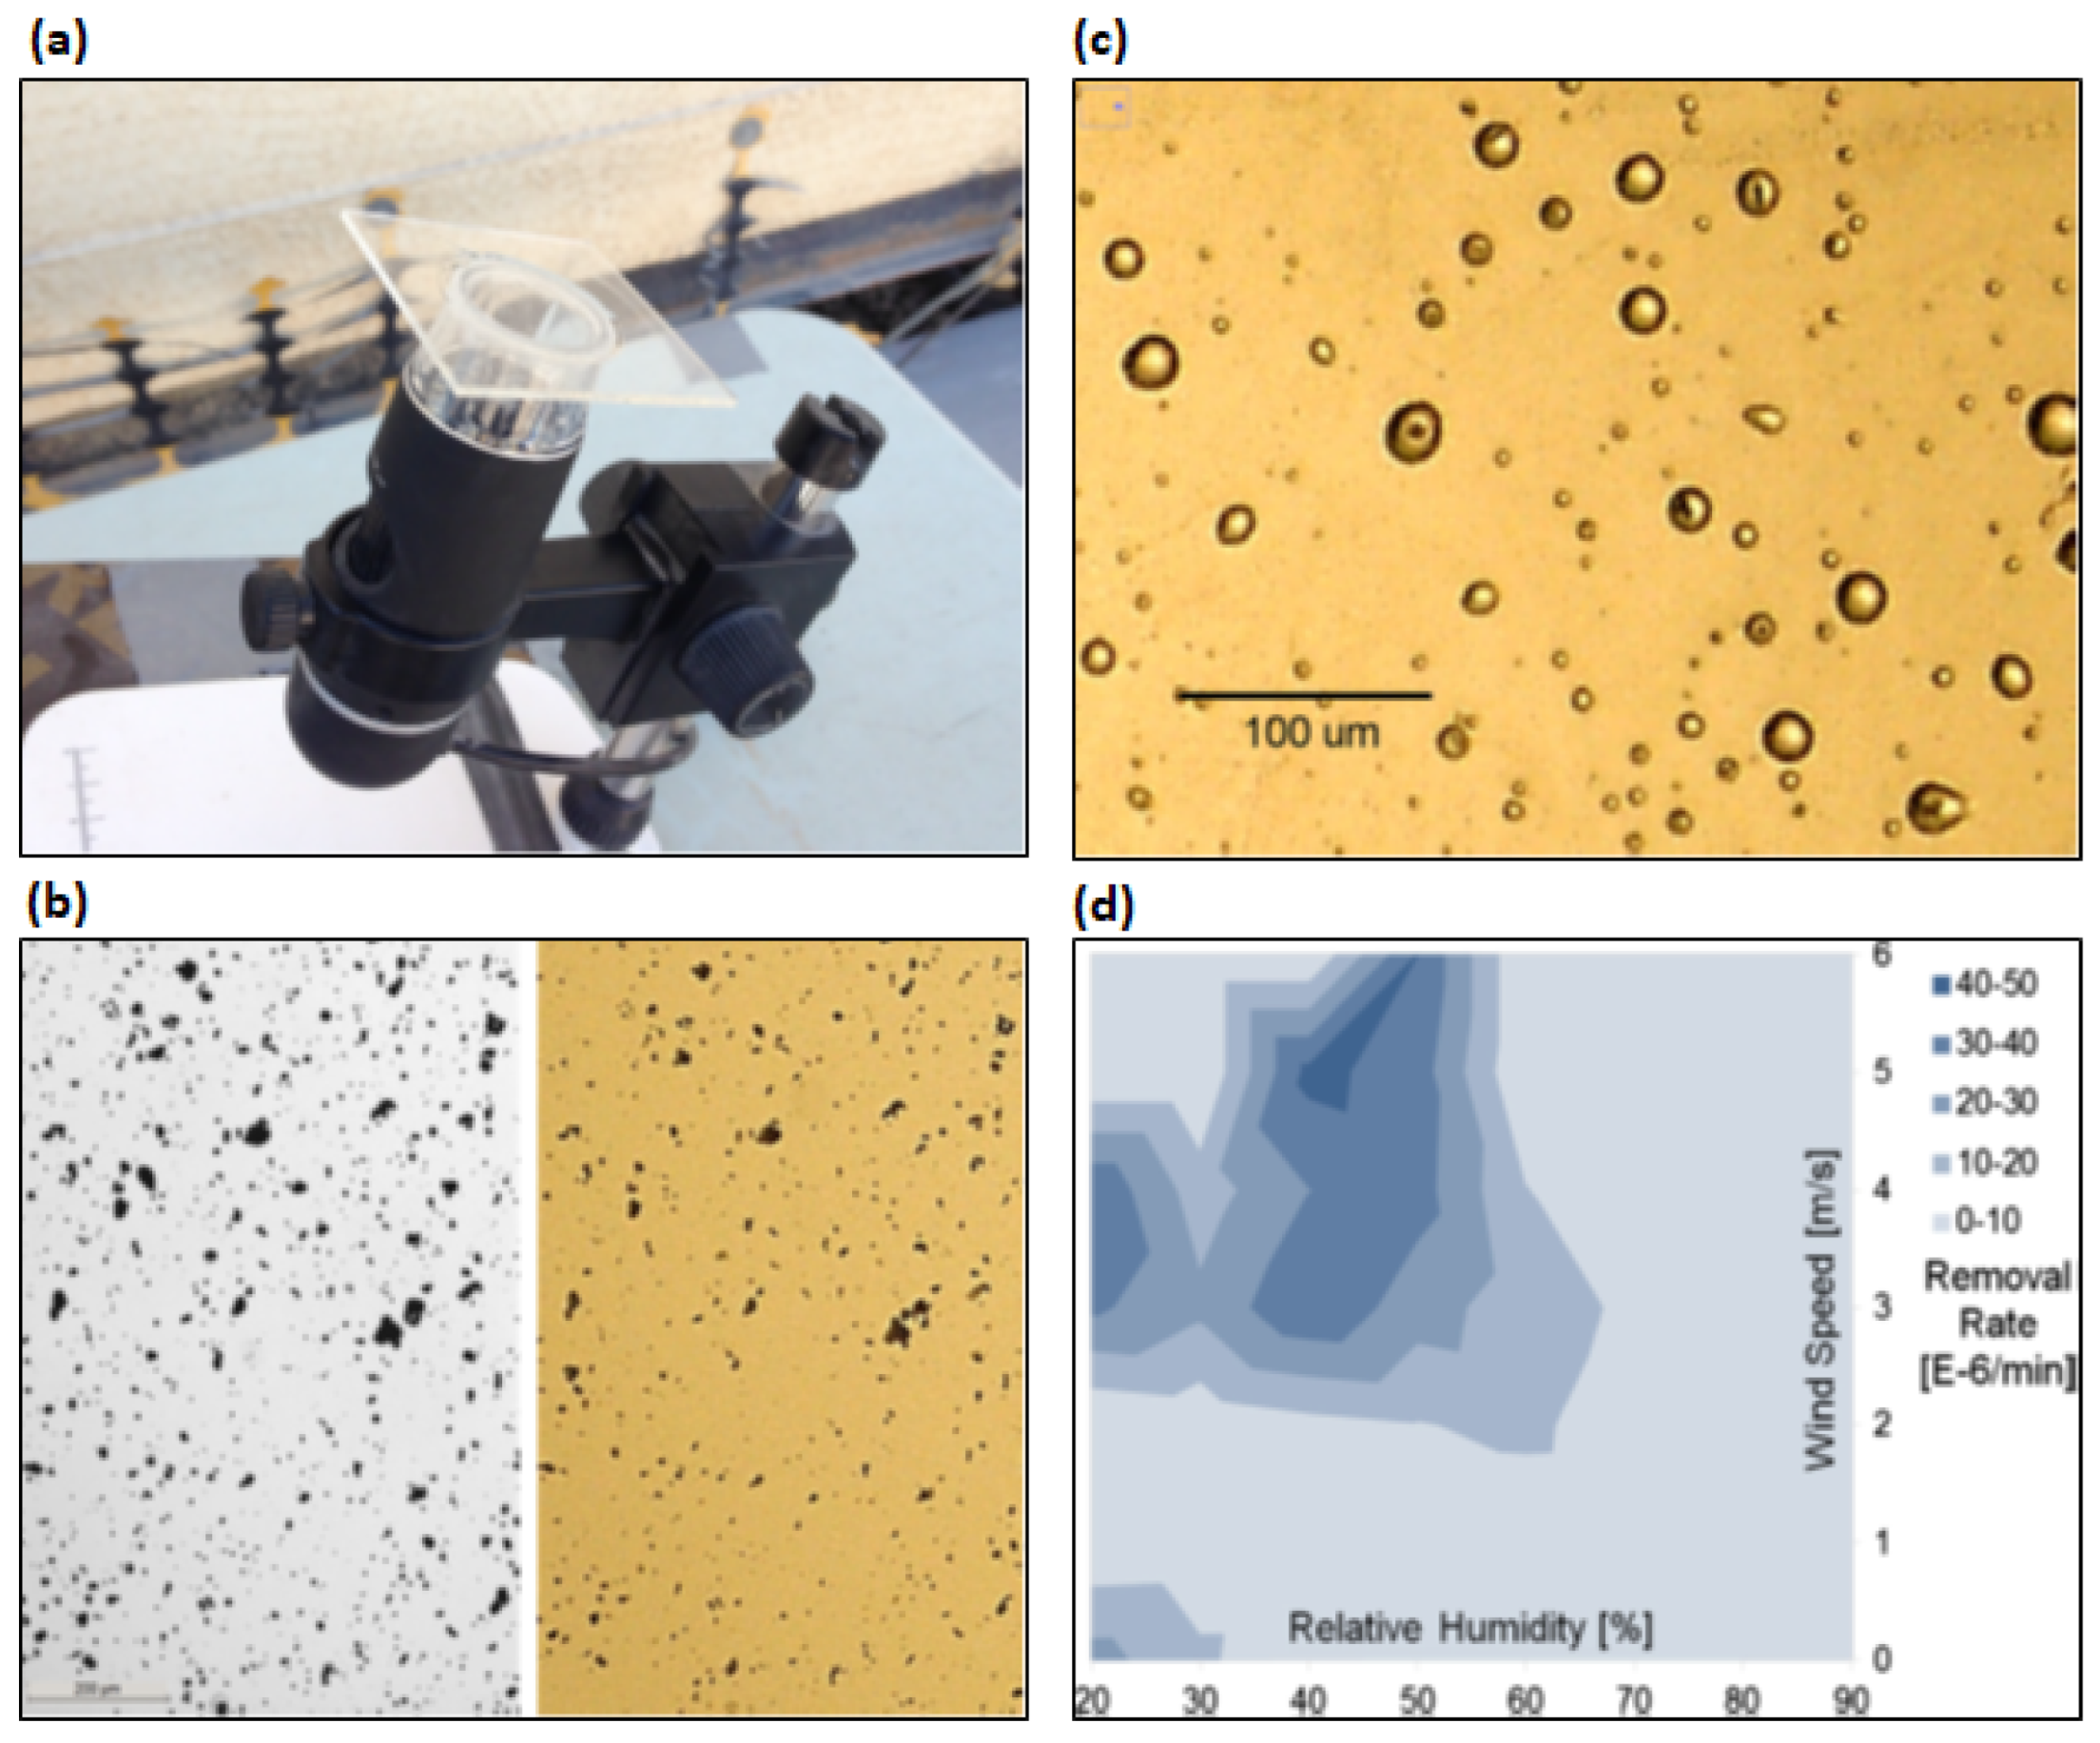
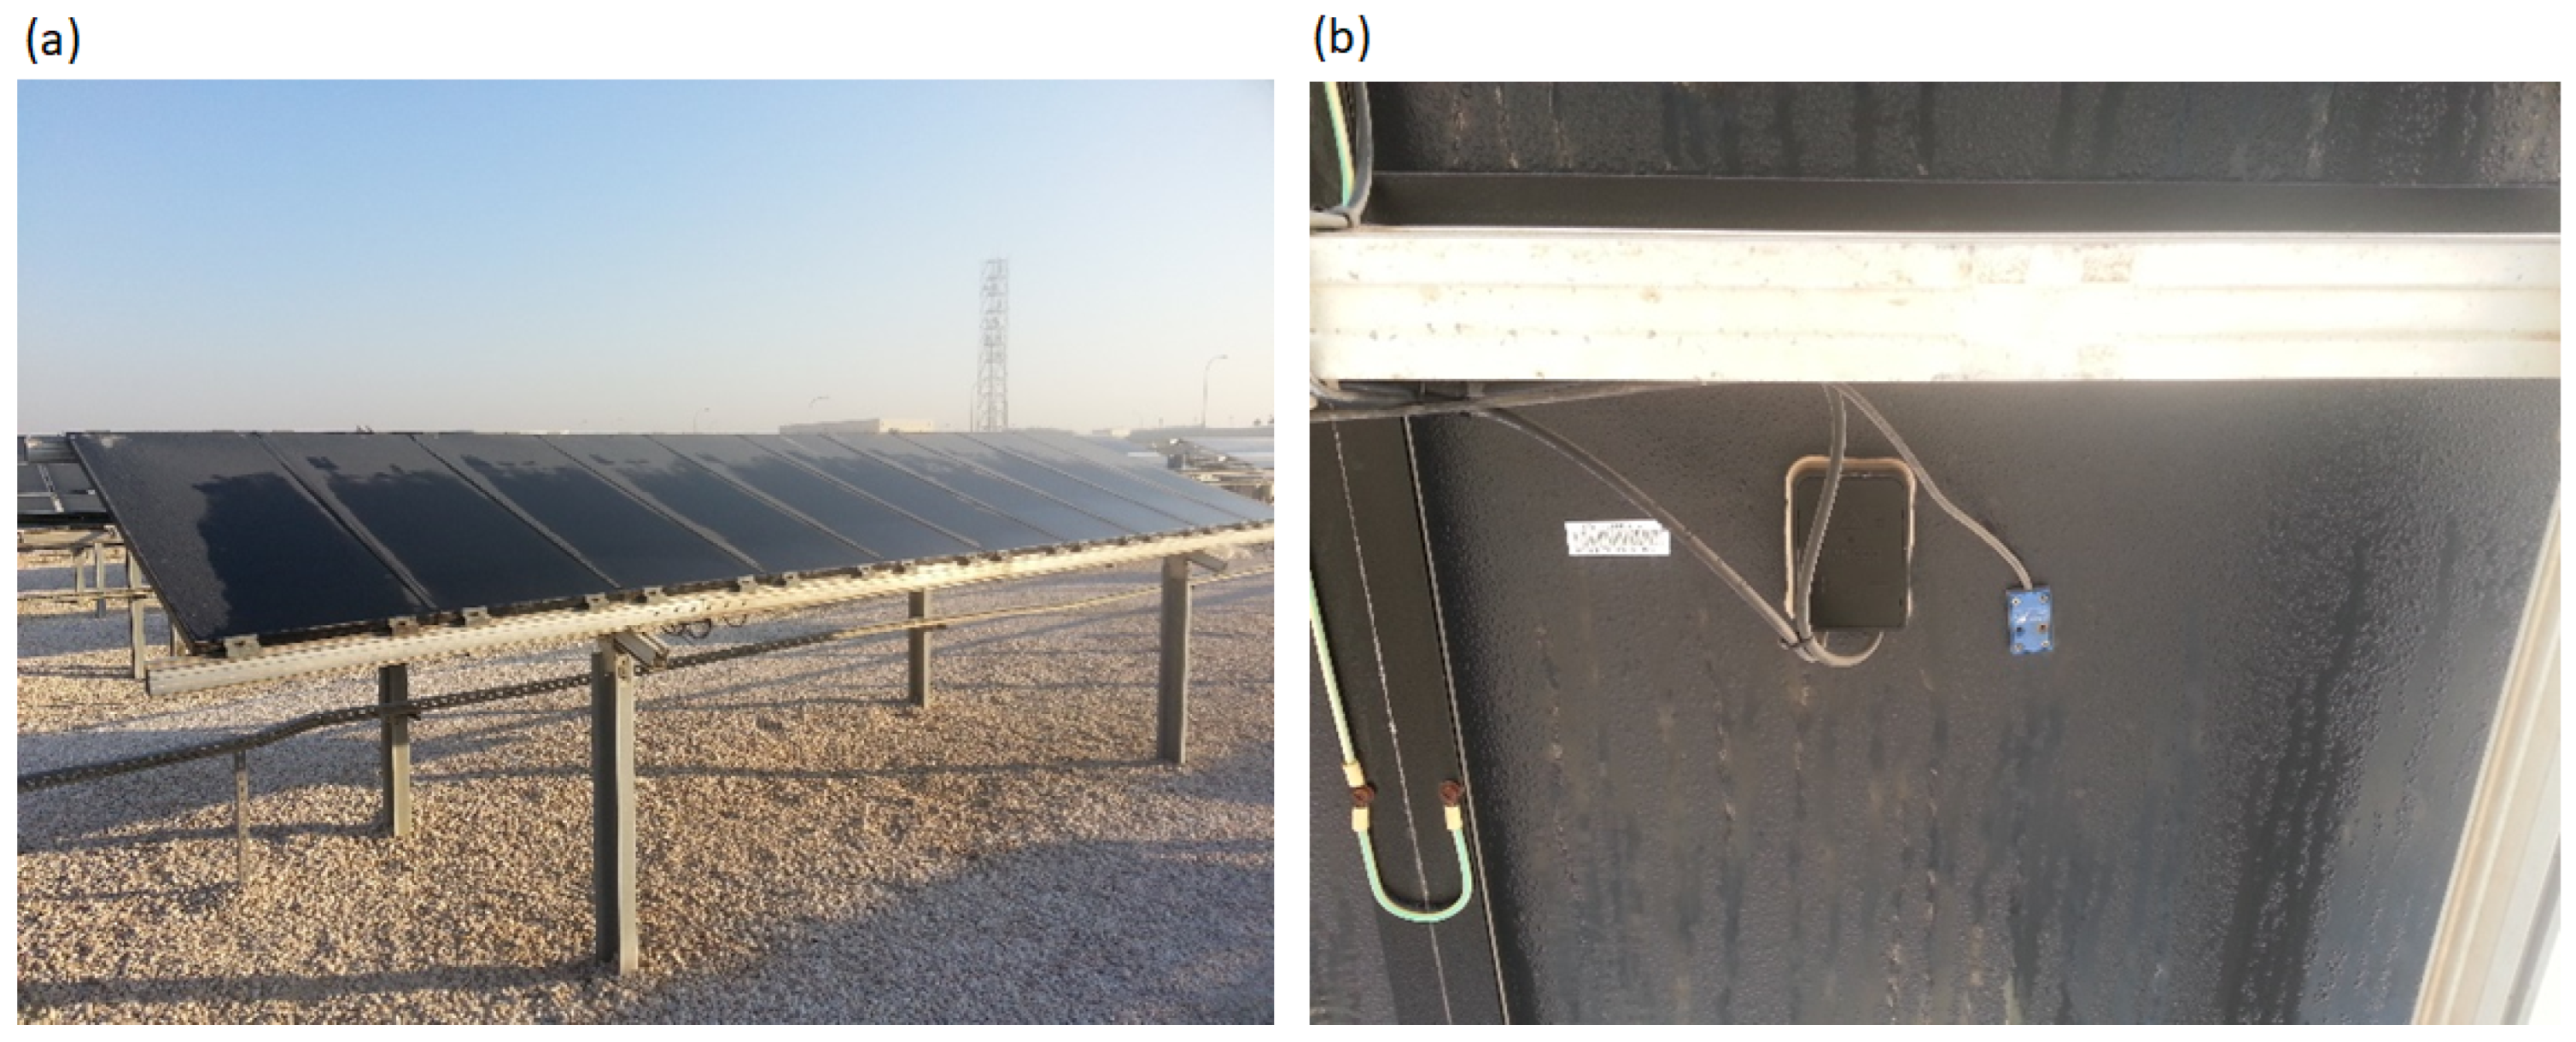
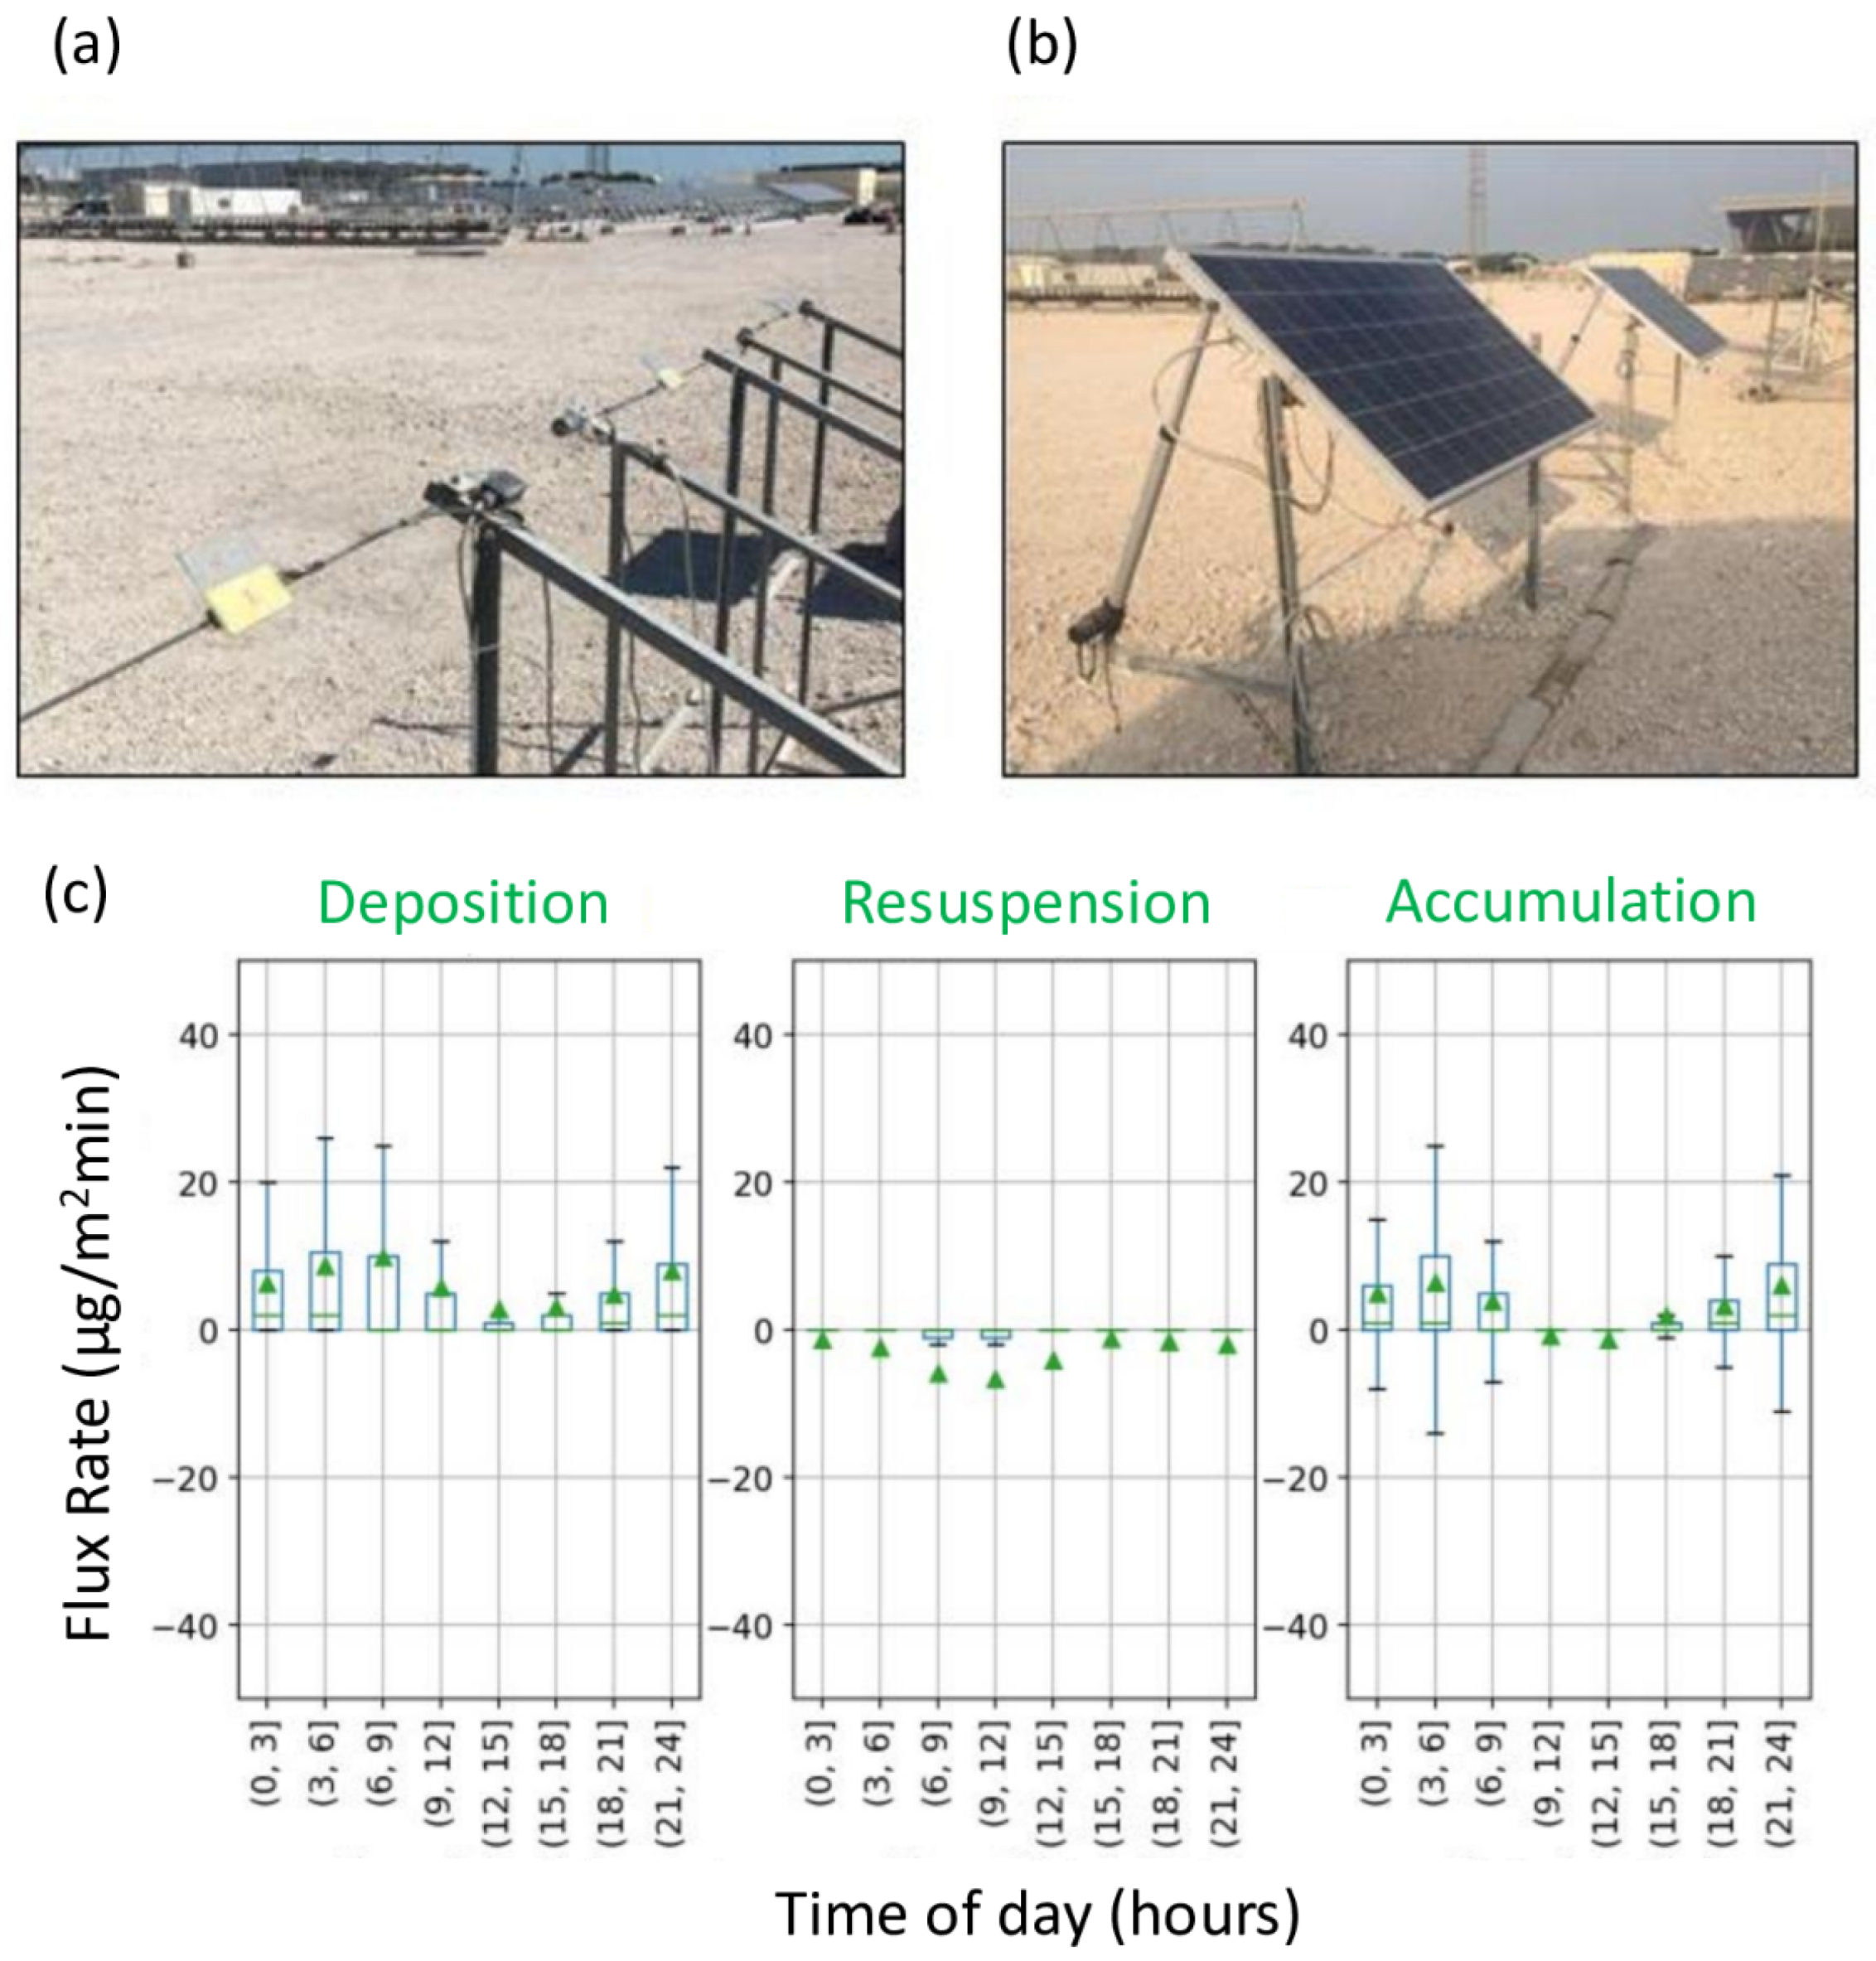
3. Development of an In-House “Outdoor Soiling Microscope”
- detect the onset of condensation,
- detect the vanishing of the condensation,
- measure the deposit dust particles that are above 10 µm2 in size, and
- measure their subsequent removal.
- (a)
- Increased relative humidity leads to a decrease in net resuspension.
- (b)
- Increased PM10 concentration increases dust accumulation.
- (c)
- Increased wind speed favors the natural cleaning by particle resuspension, and is triggered typically at 3 m/s.
- (d)
- Increased wind speed above 4 m/s greatly favors the particles’ resuspension.
- (e)
- During the nighttime, no clear correlations could be claimed.
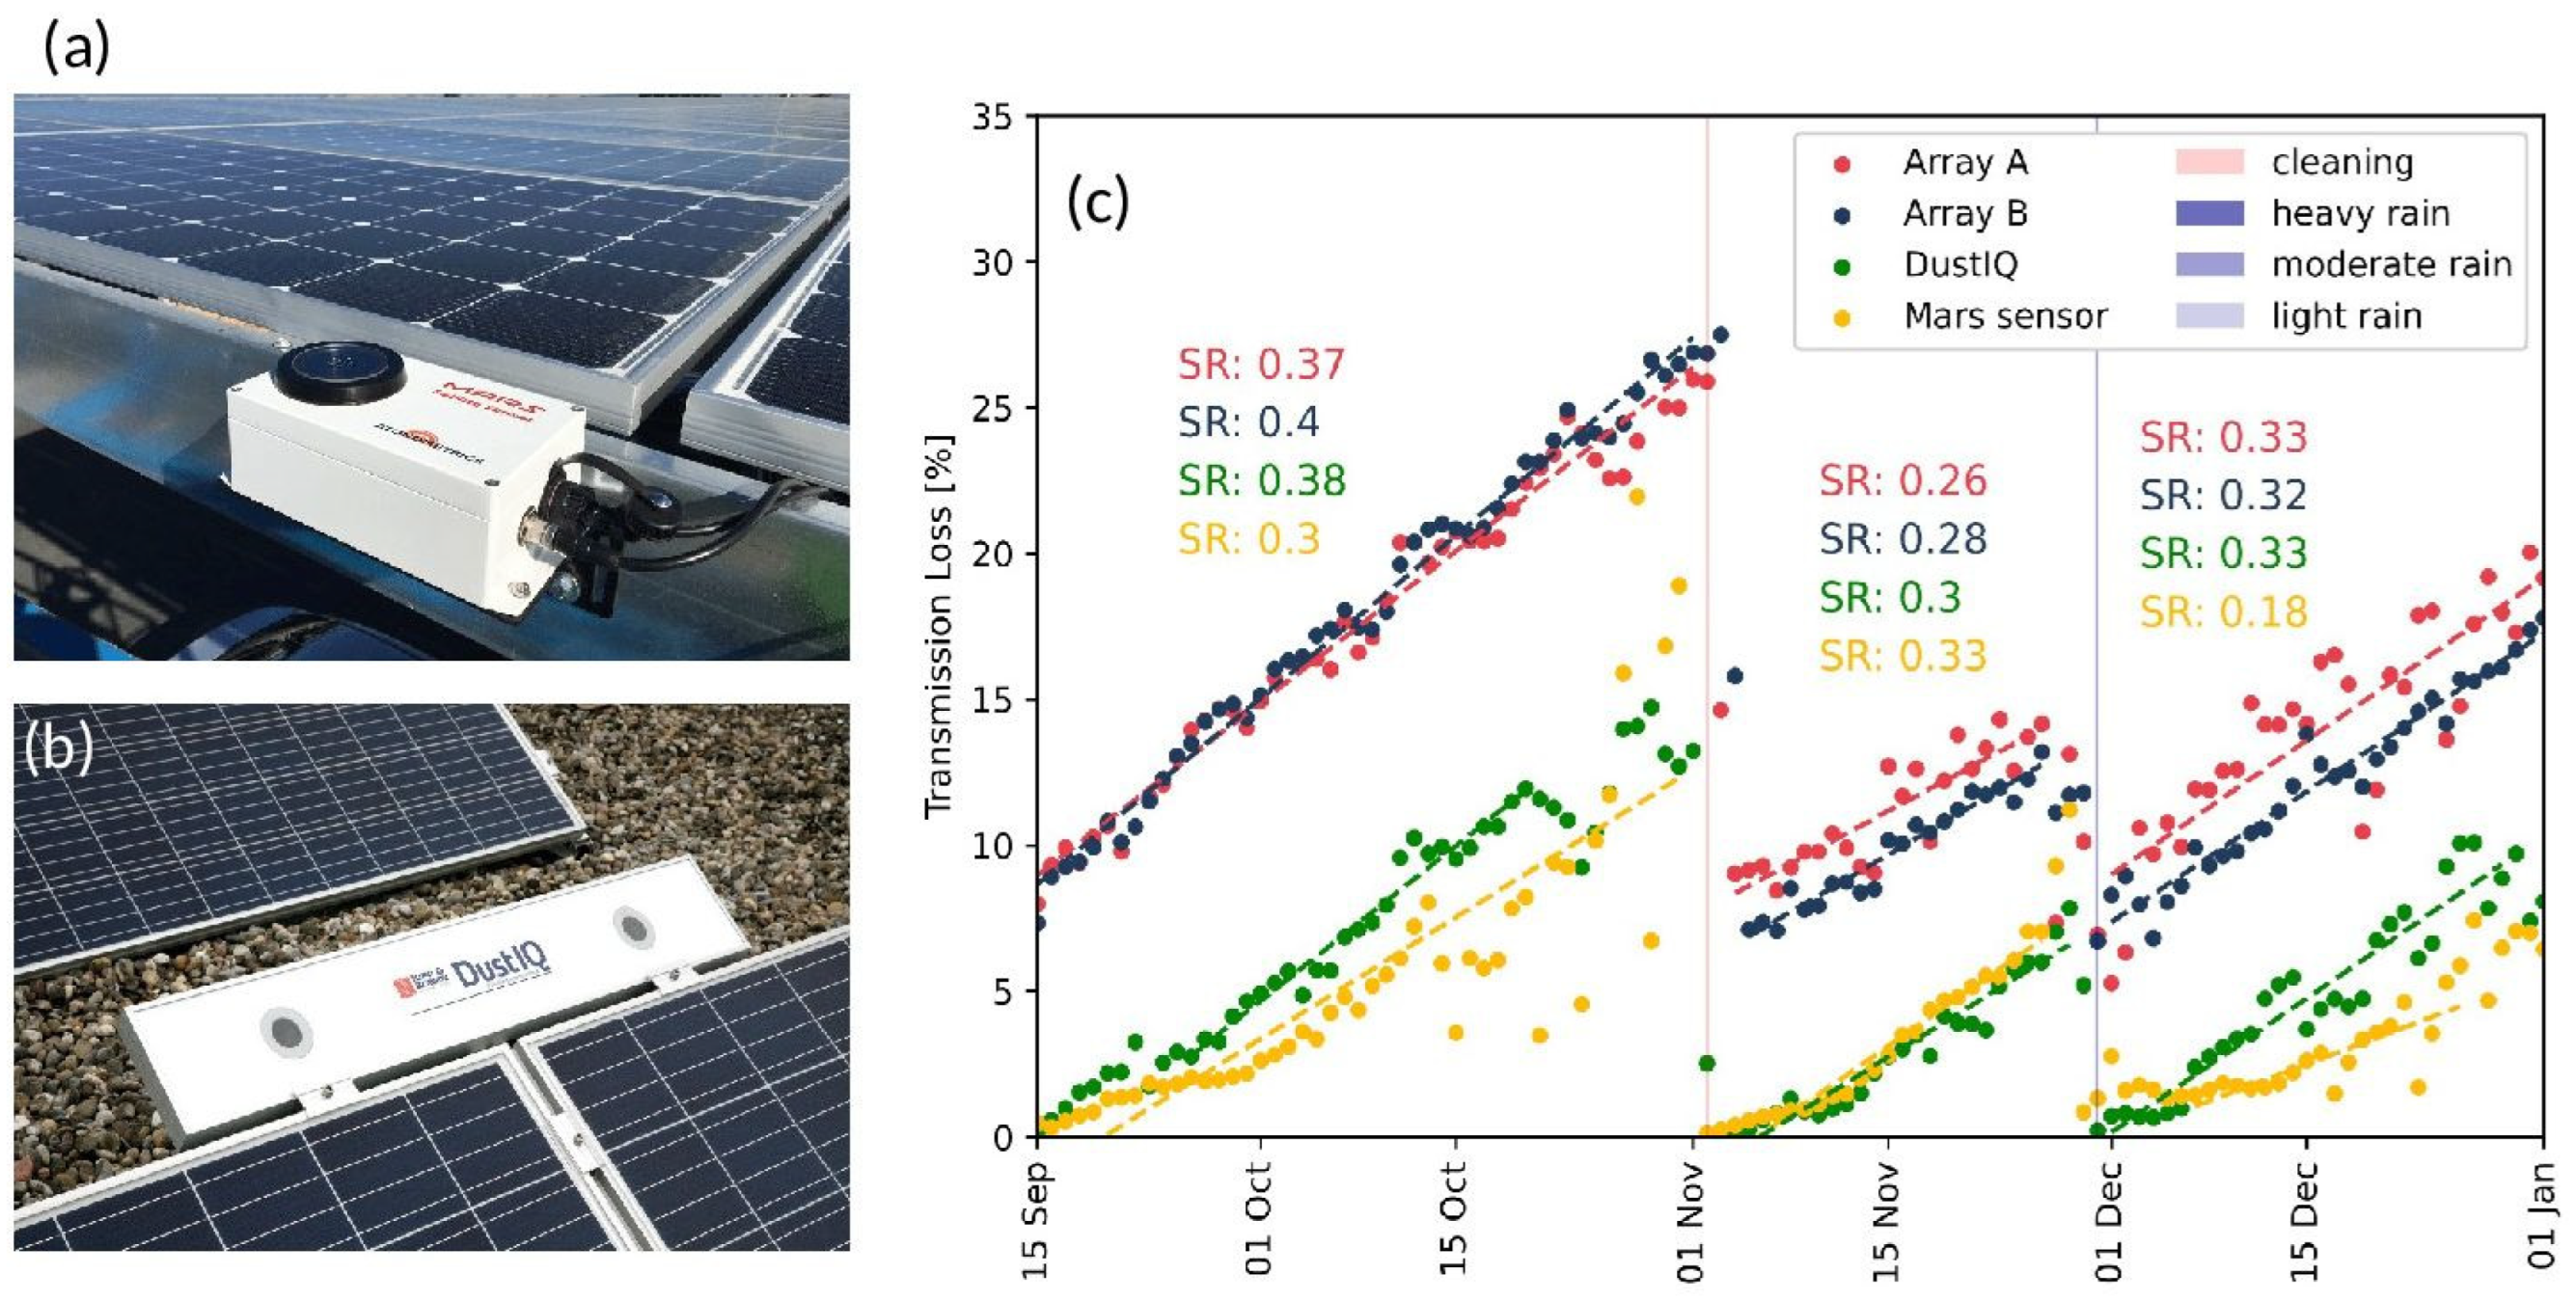
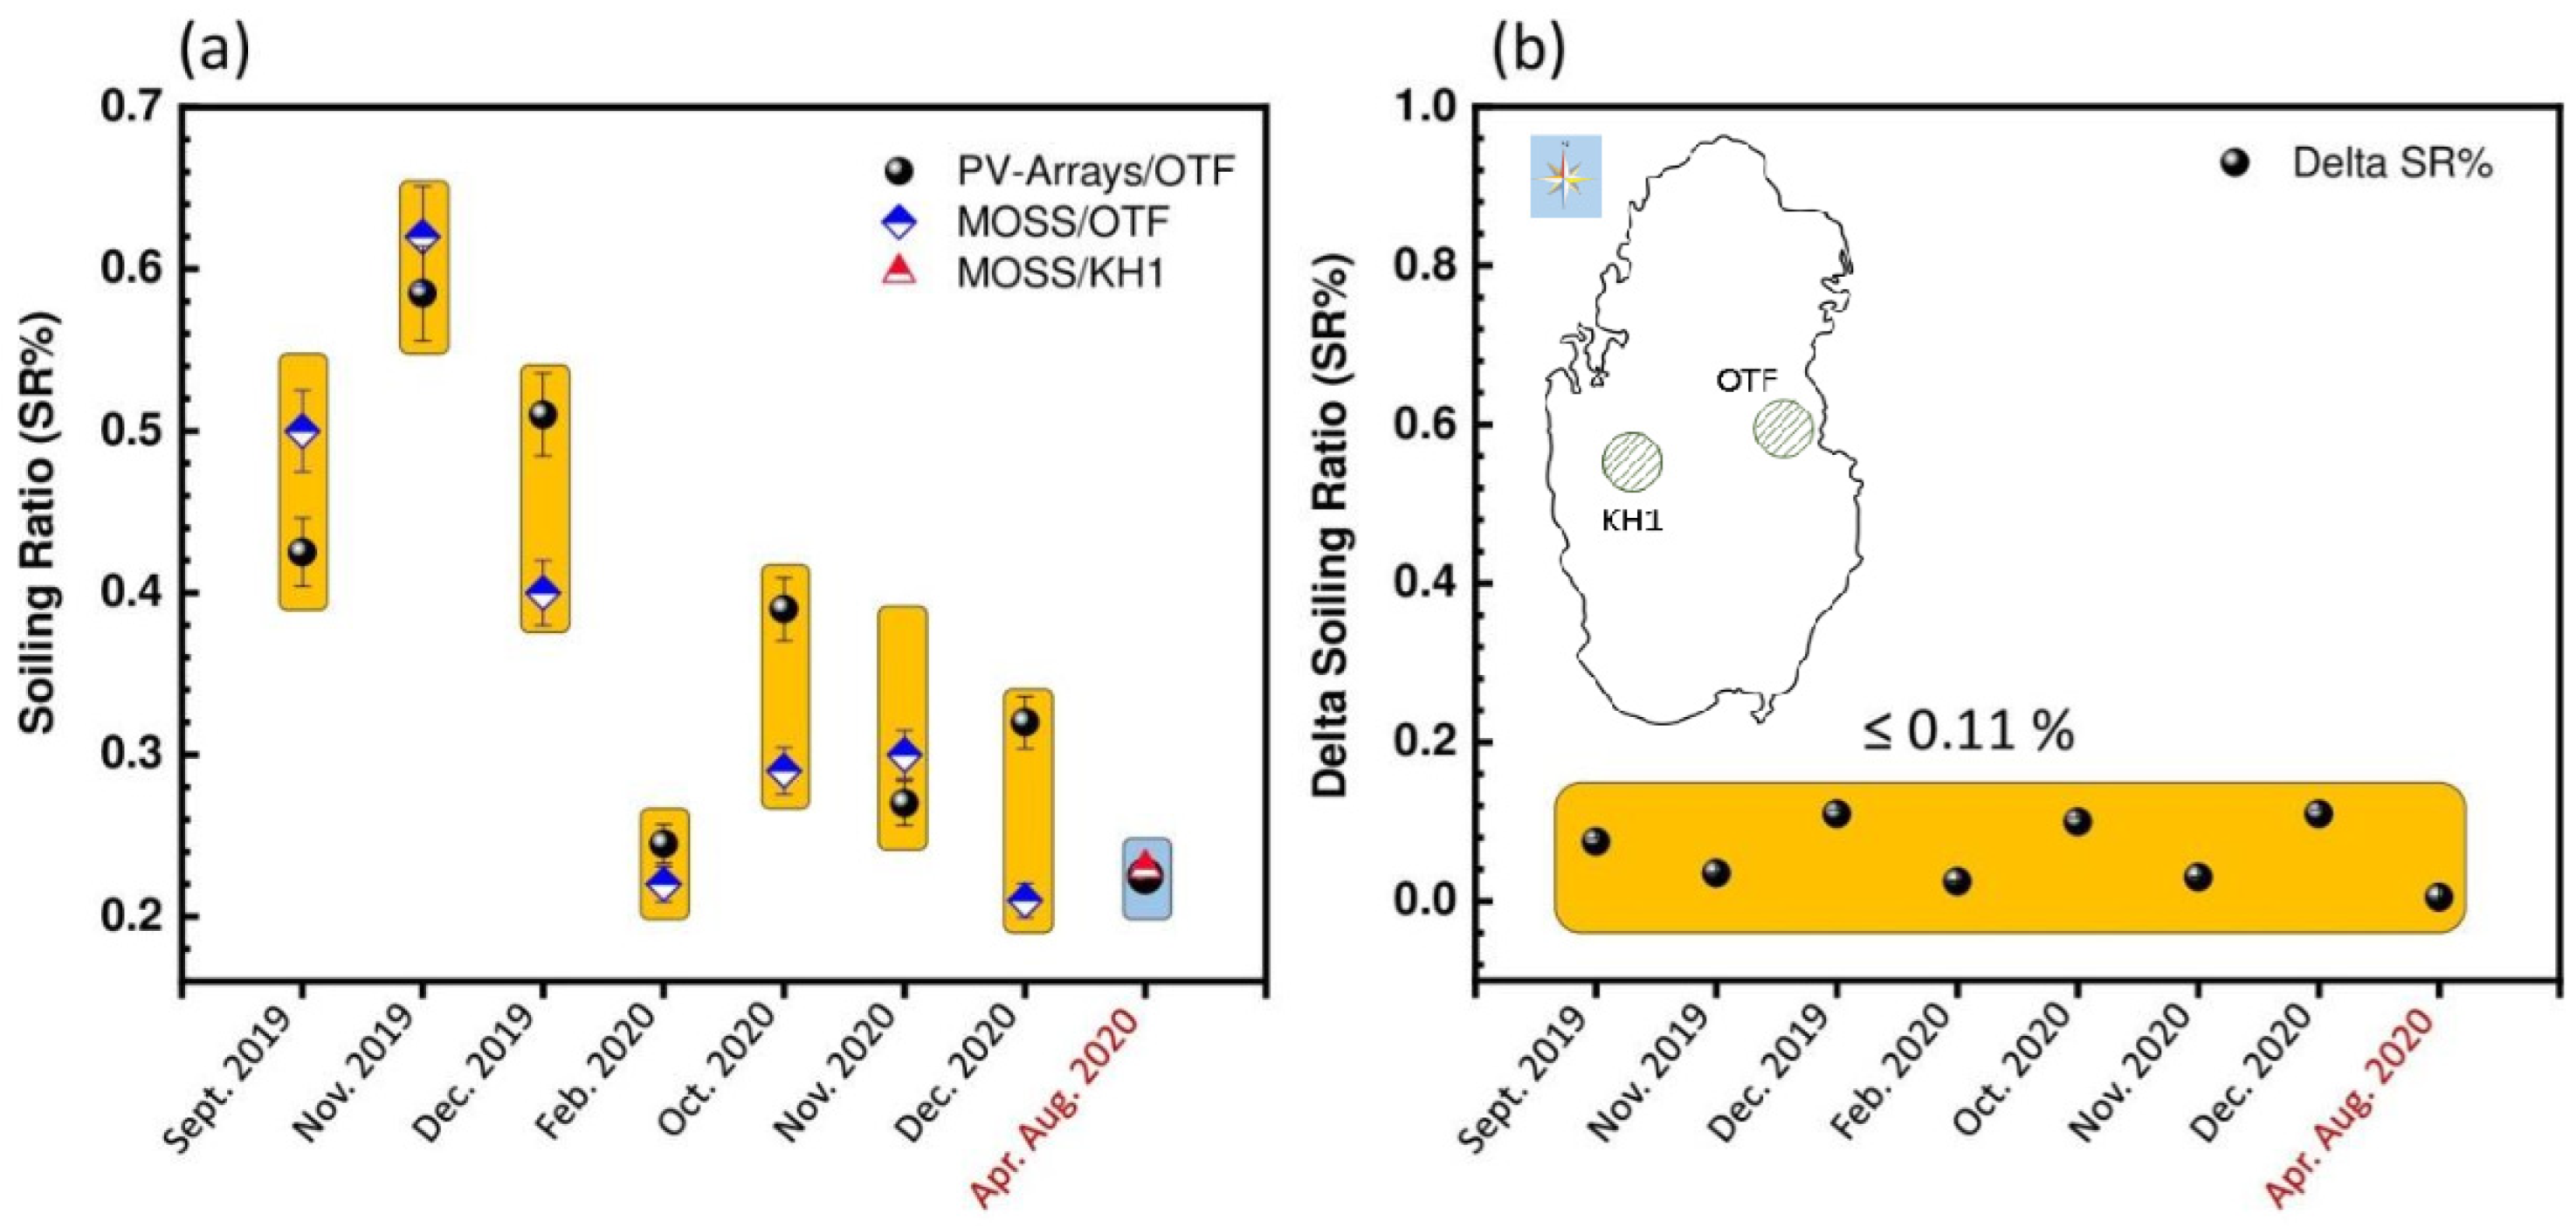
4. Field Measurement of PV Soiling by MarsTM and Dust IQ Sensors
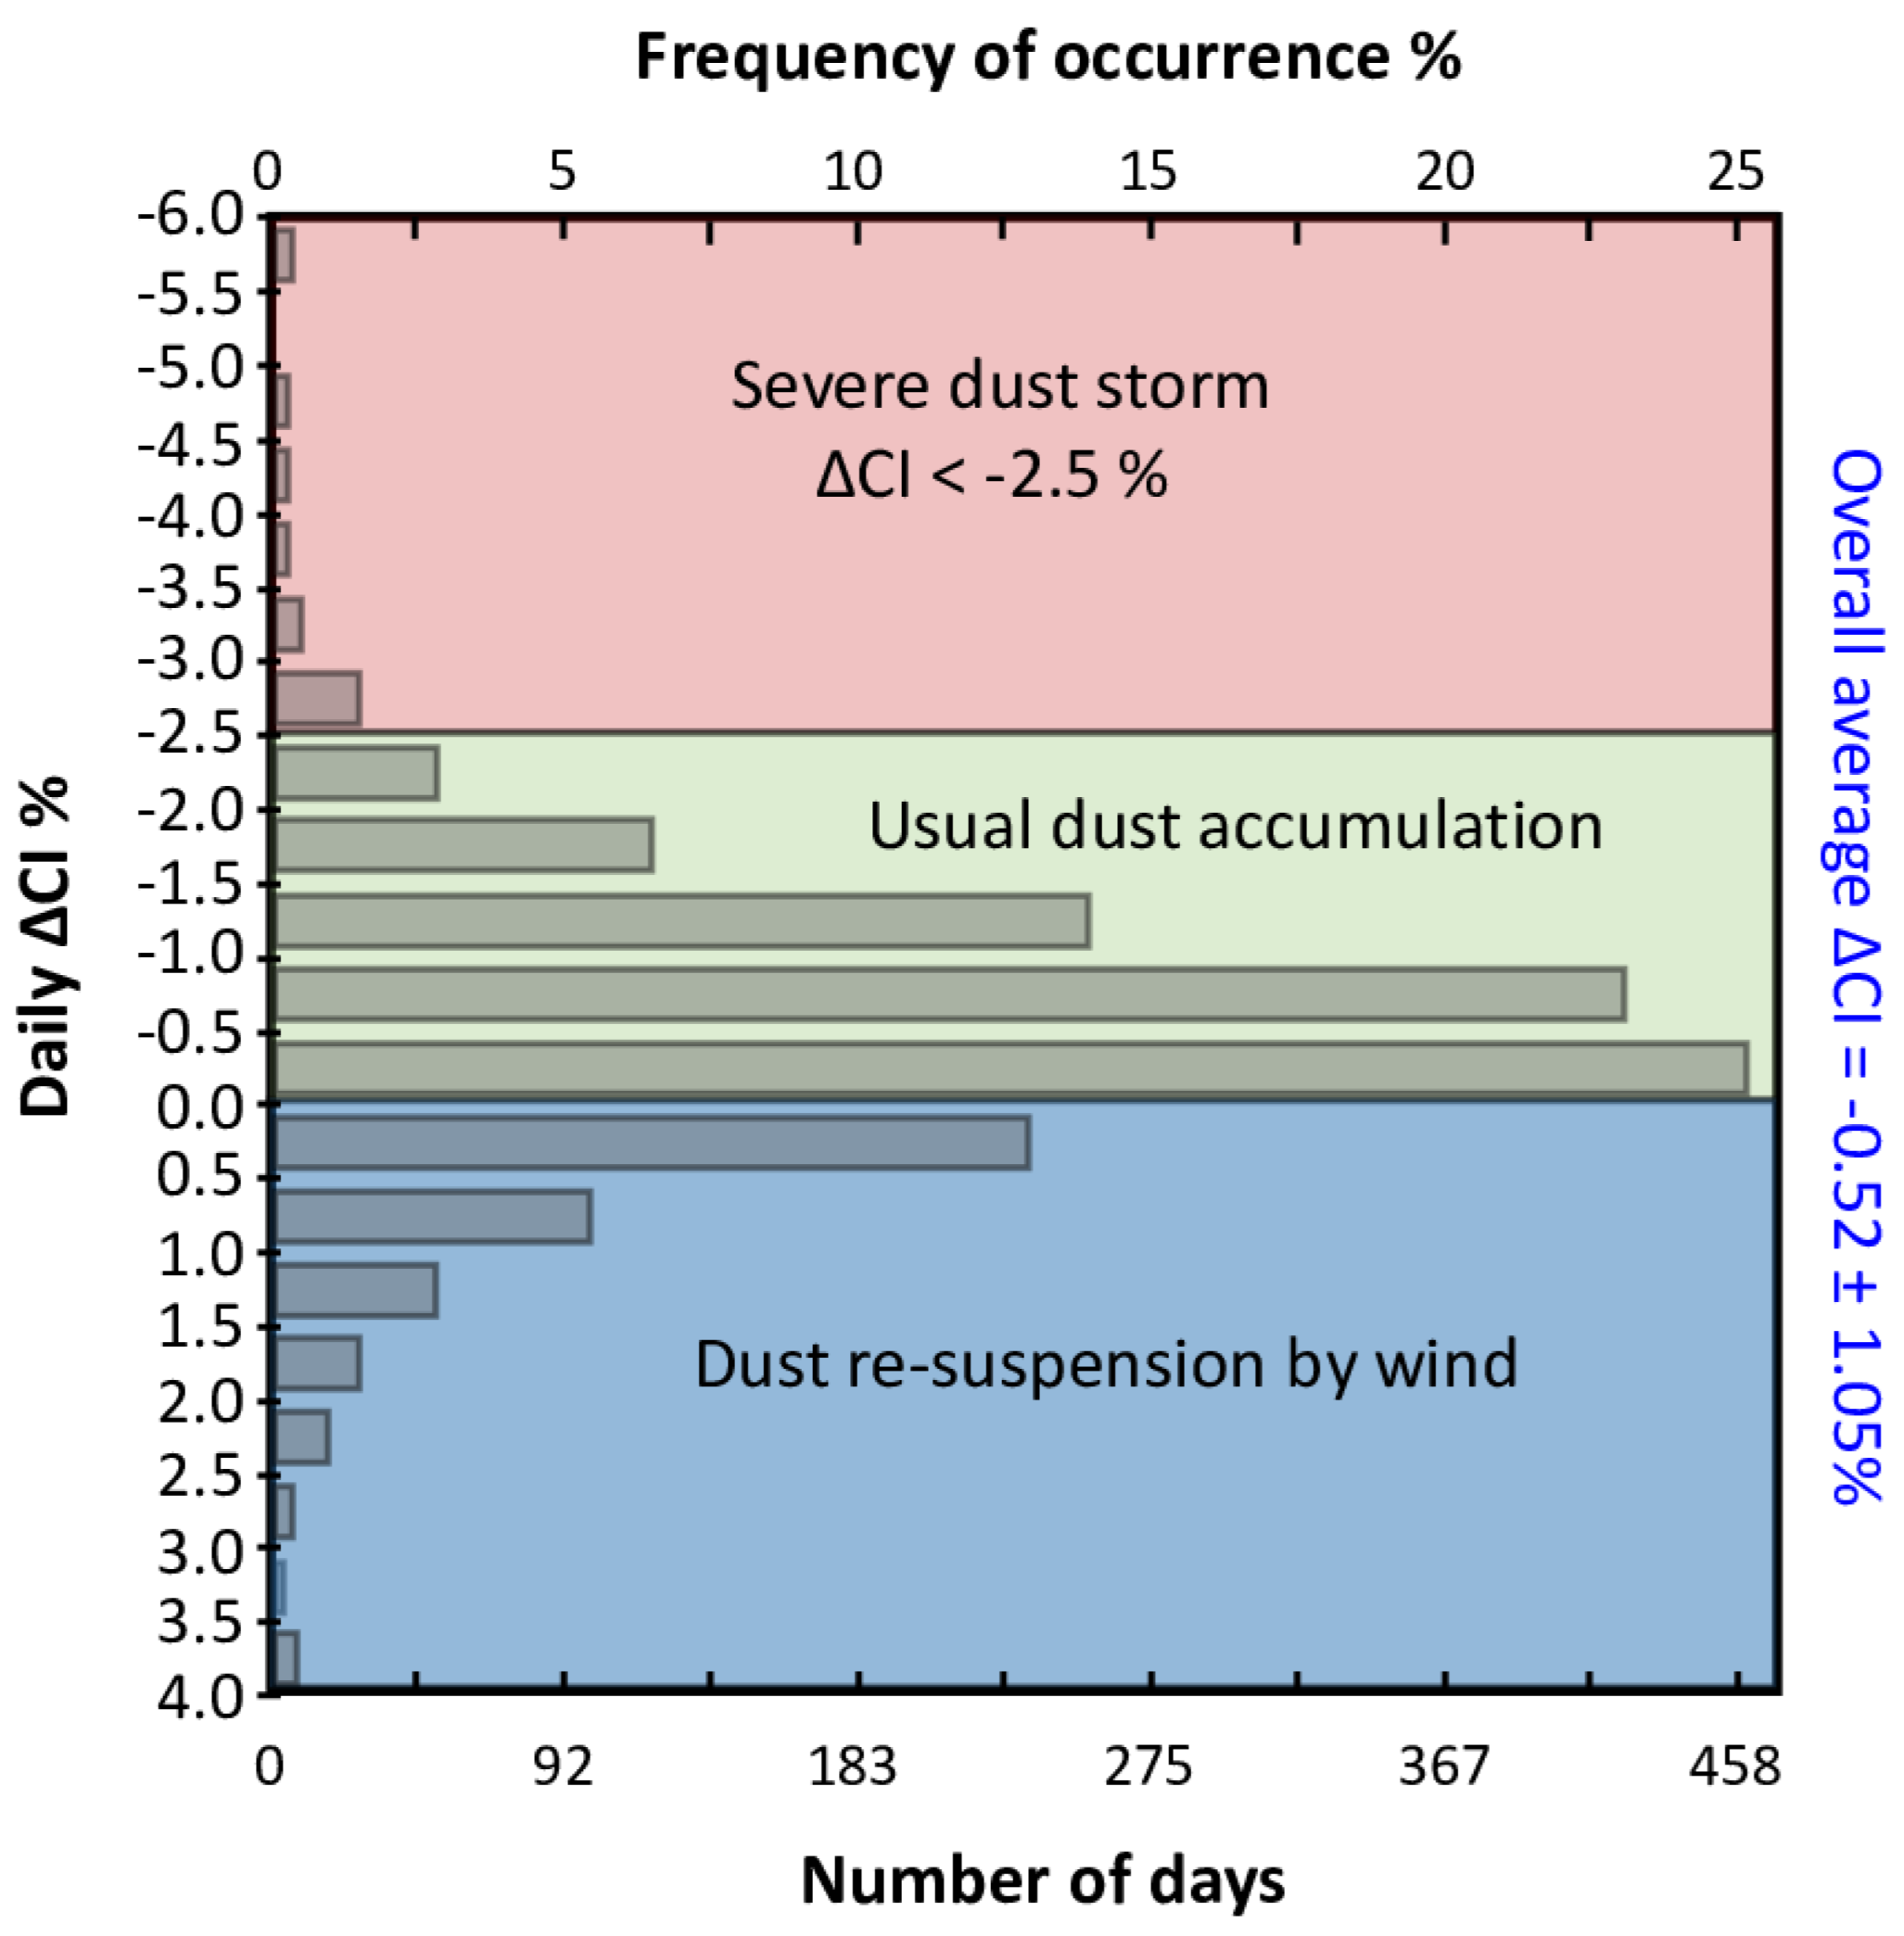
5. Understanding of the Soiling Properties in the Desert Environment
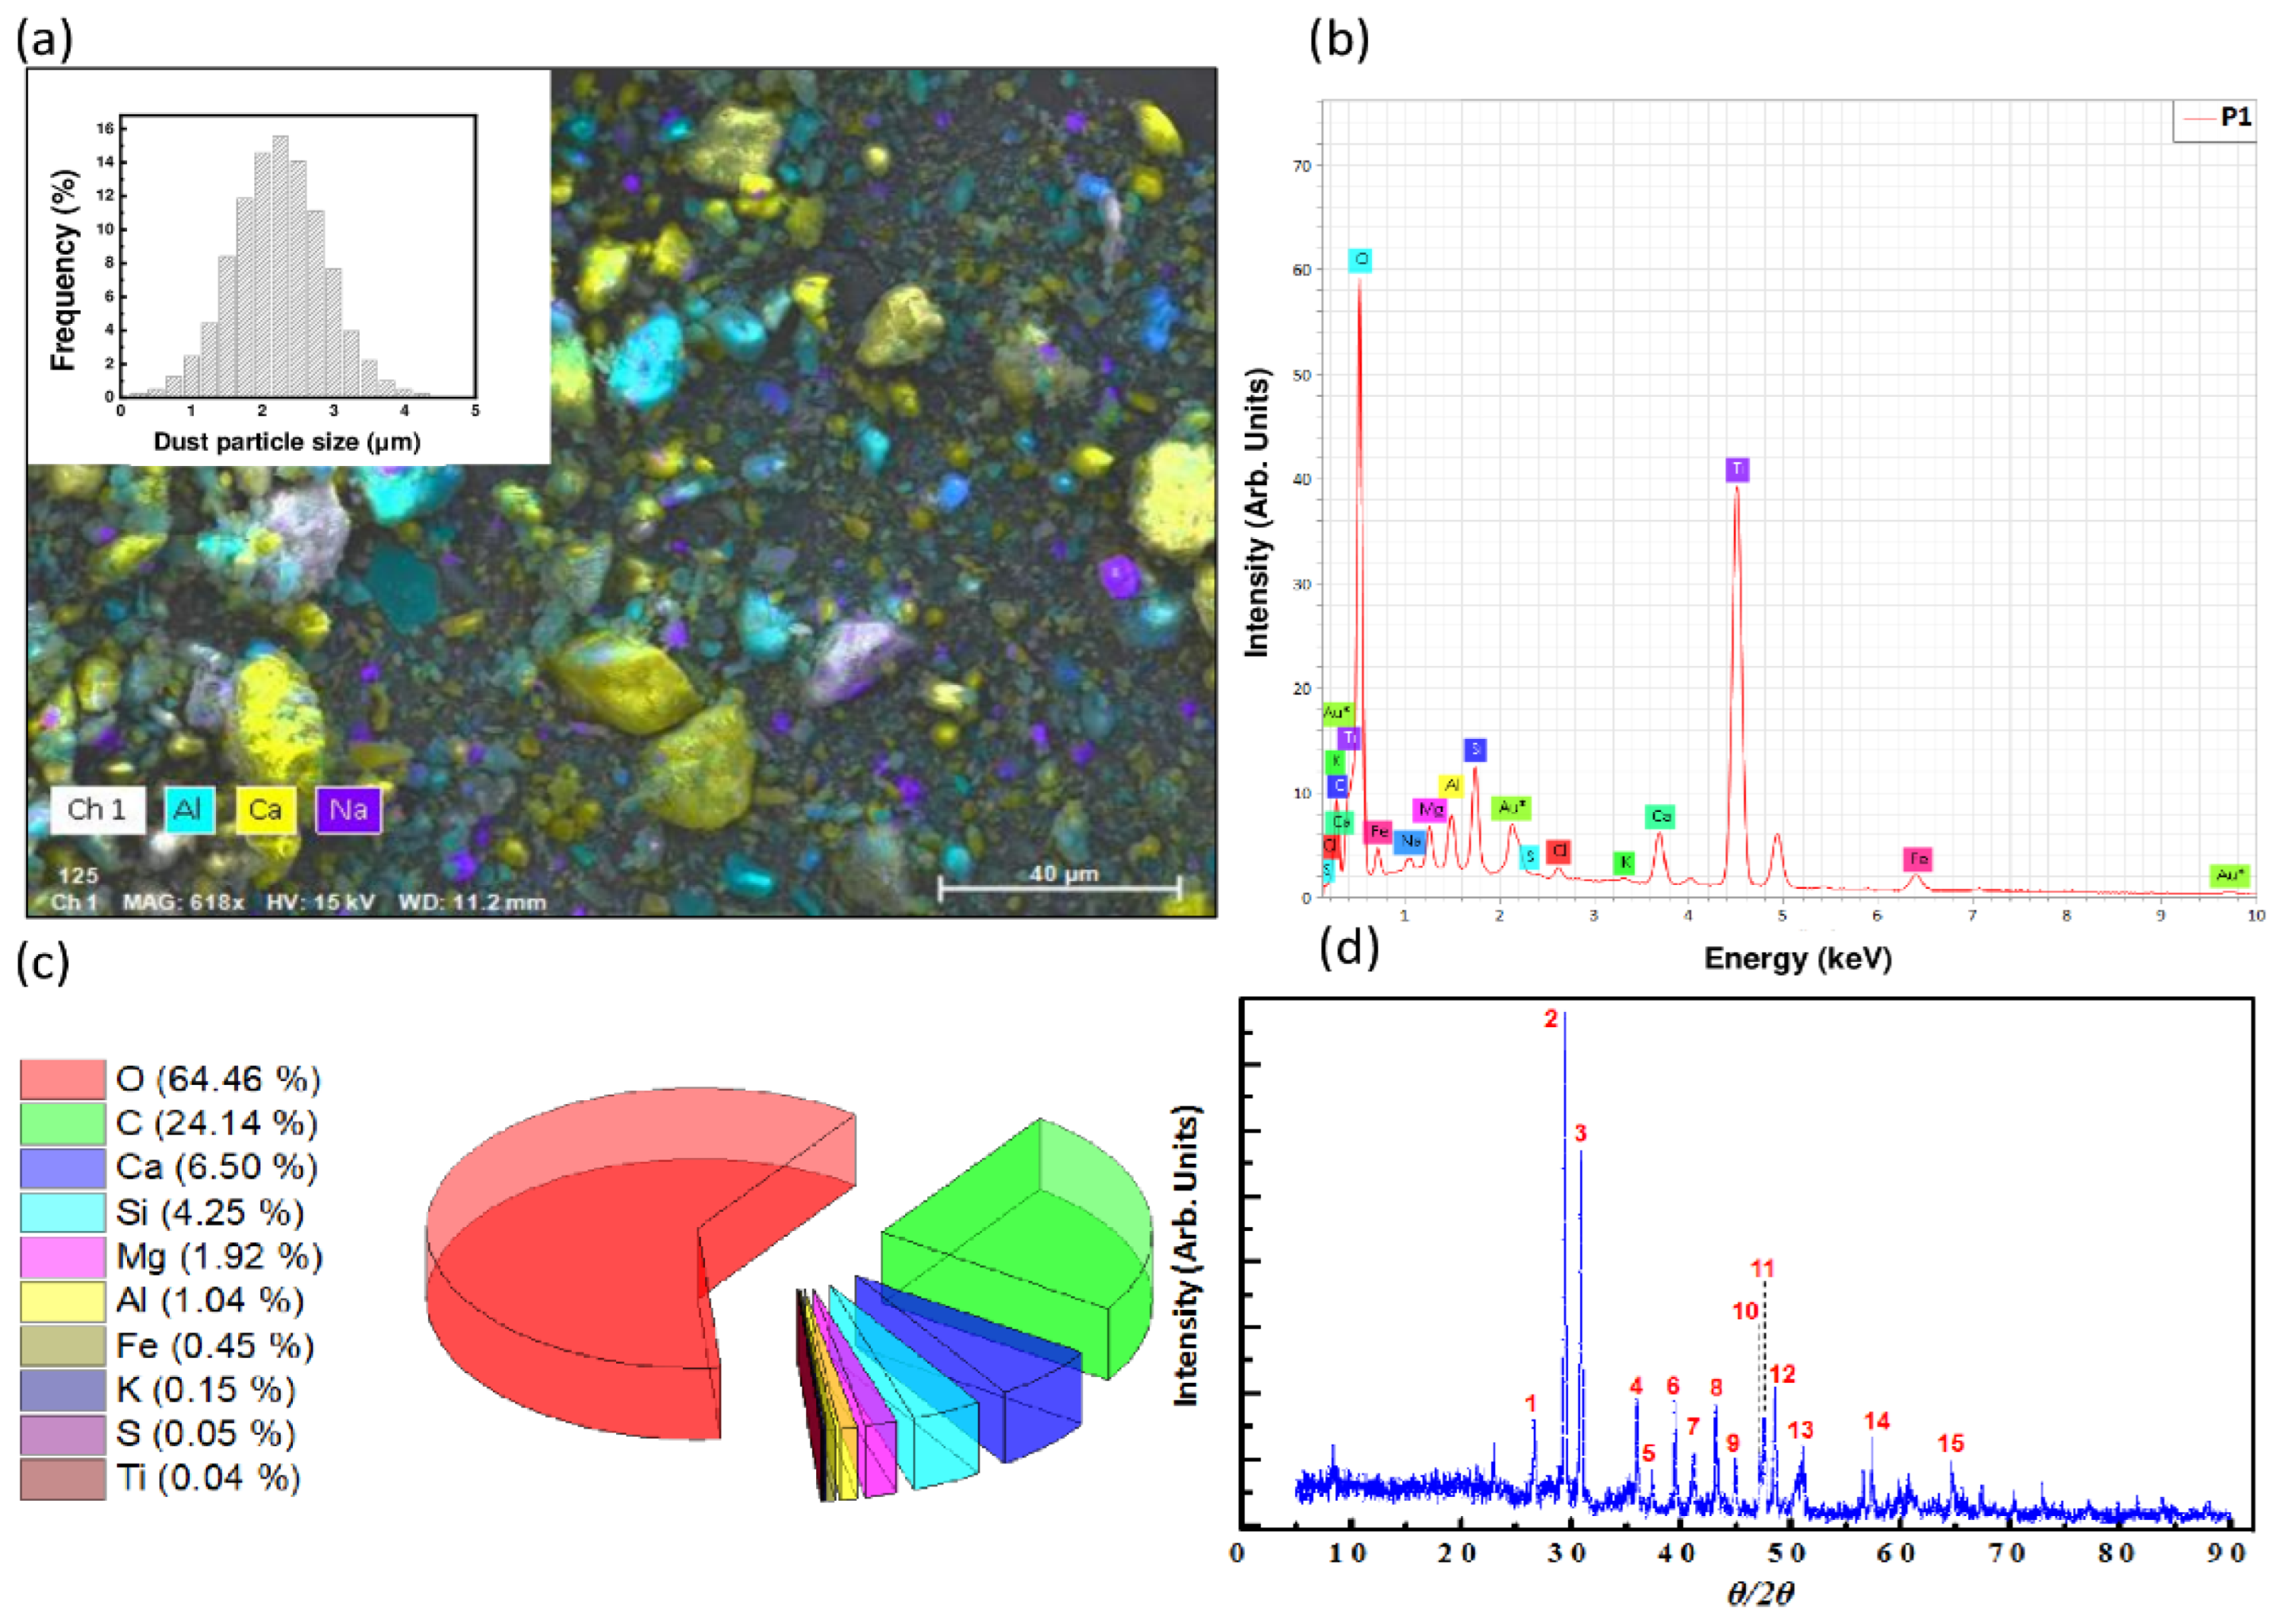
5.1. Physical Characteristics
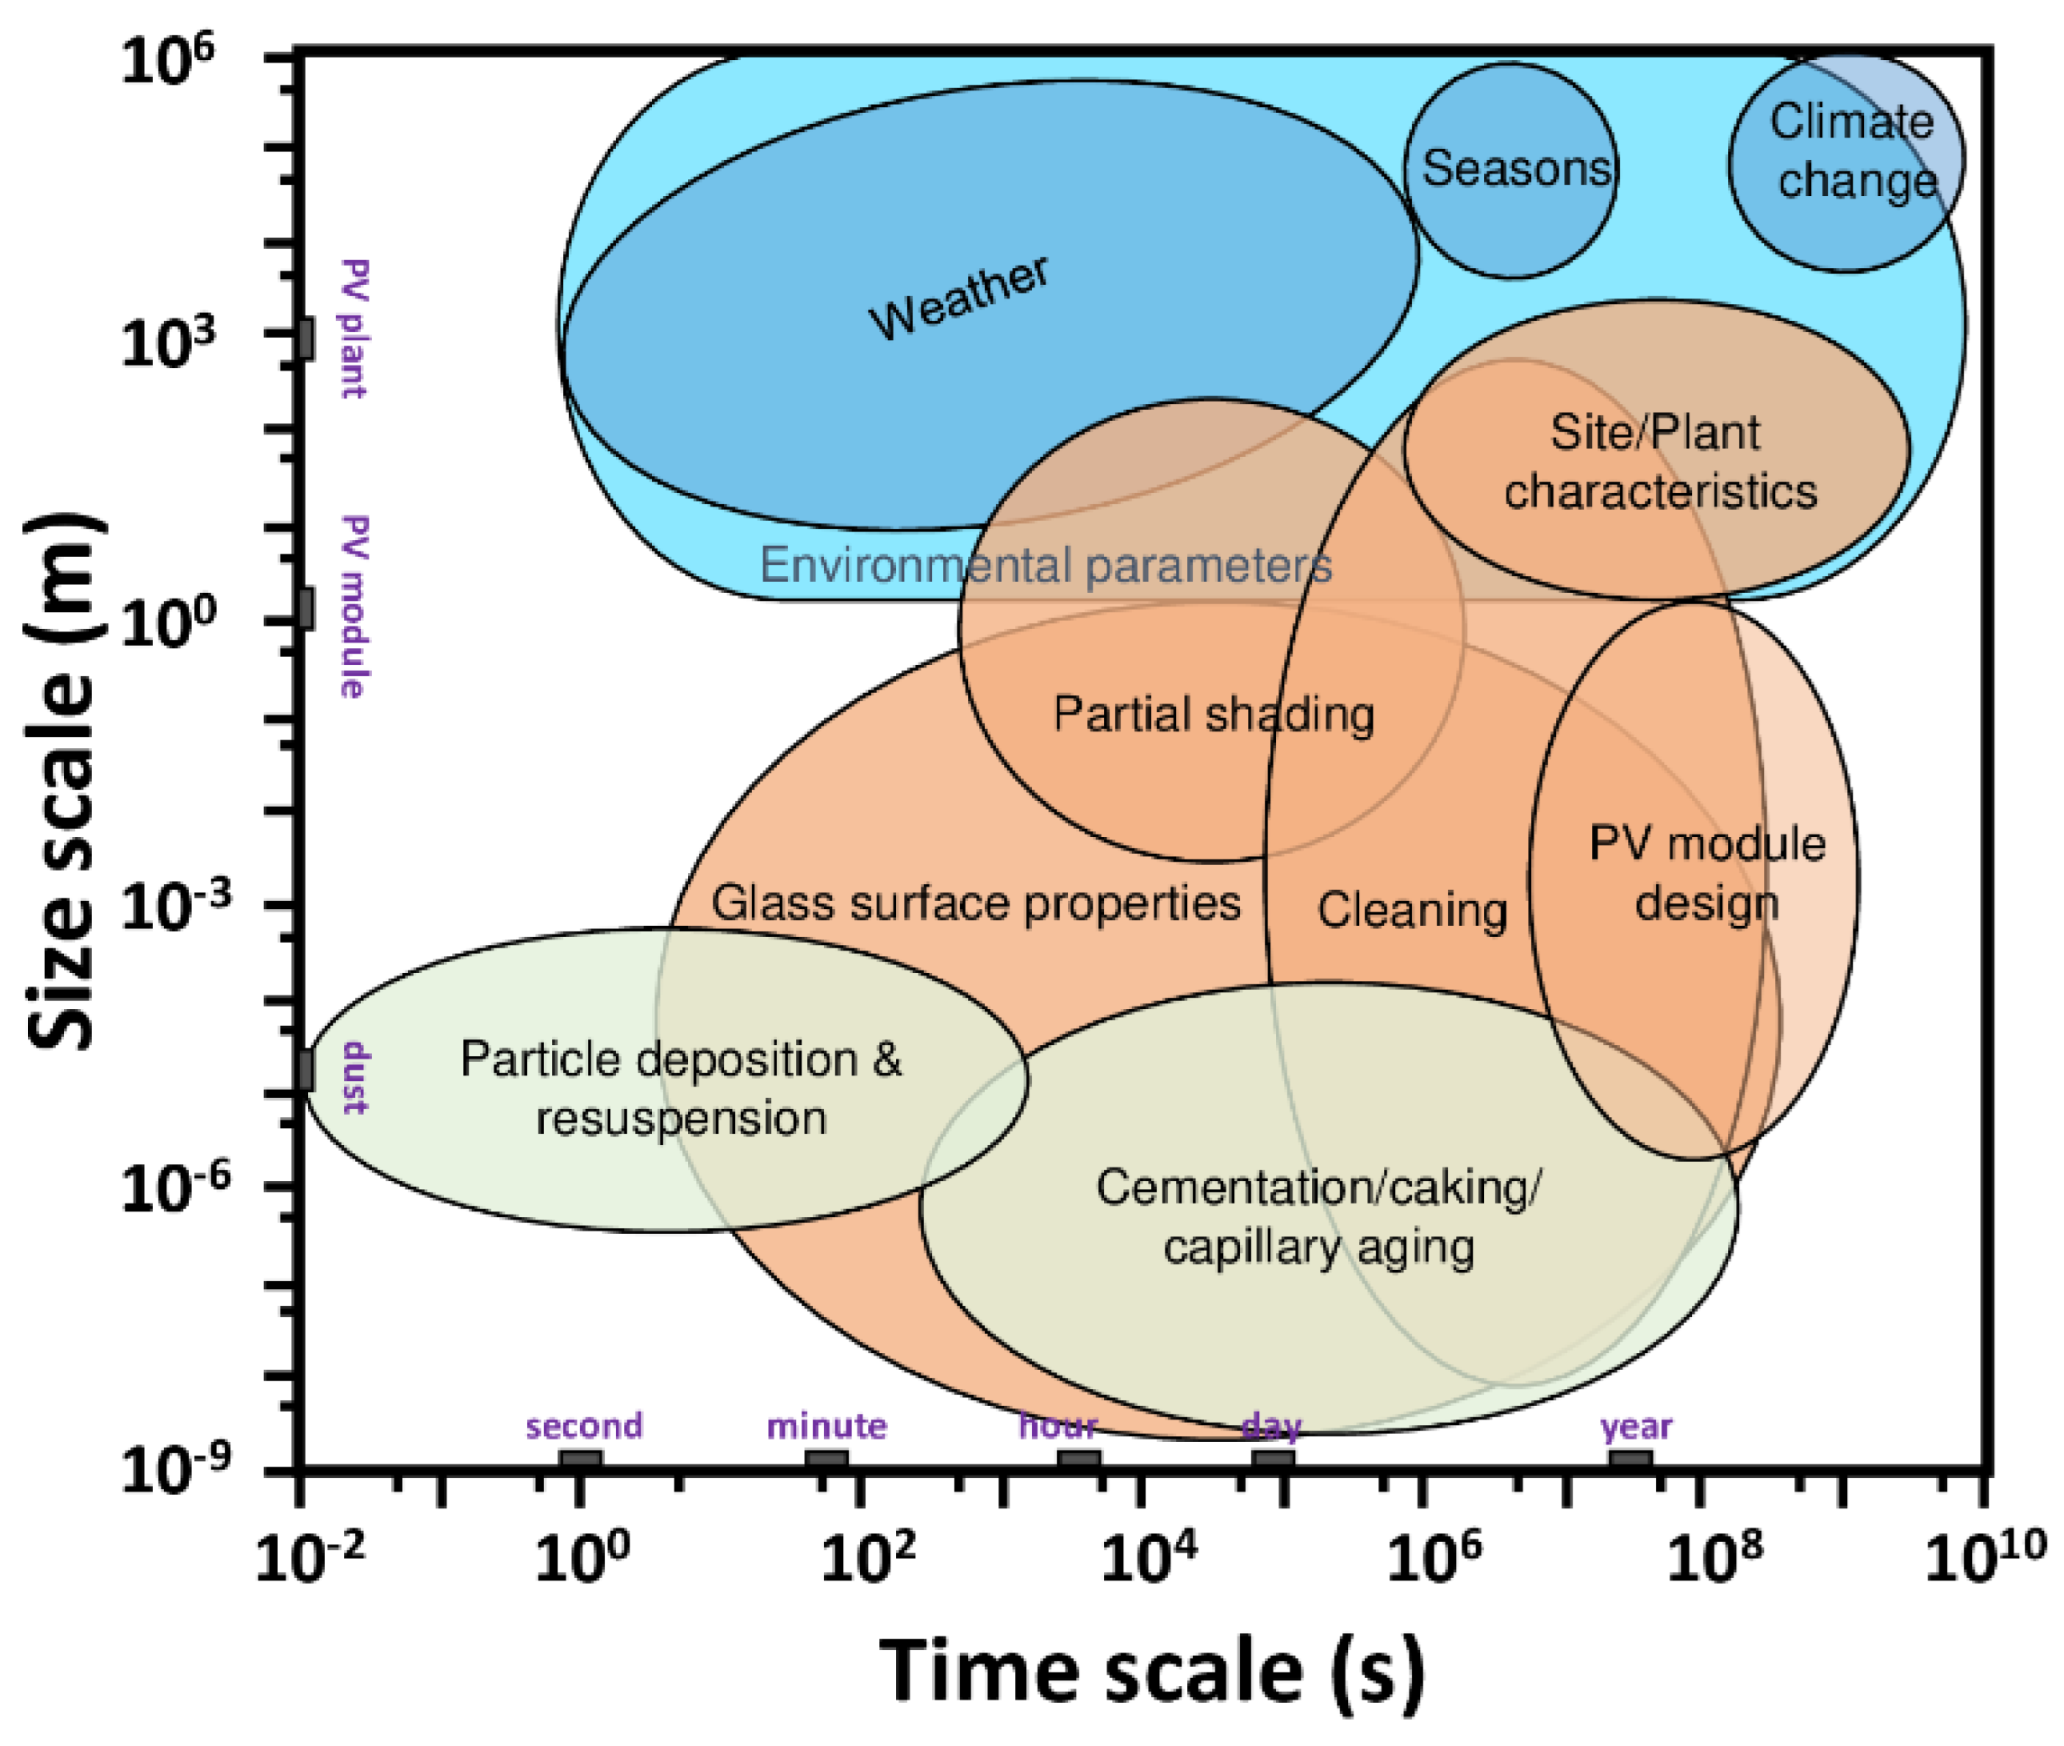
5.2. Fundamentals of Soiling Processes
- (a)
- Macroscopic environmental factors in blue.
- (b)
- Microscopic environmental factors in green.
- (c)
- Manageable impacting factors are in orange. The latter includes PV module design, glass-surface properties, etc.
- (a)
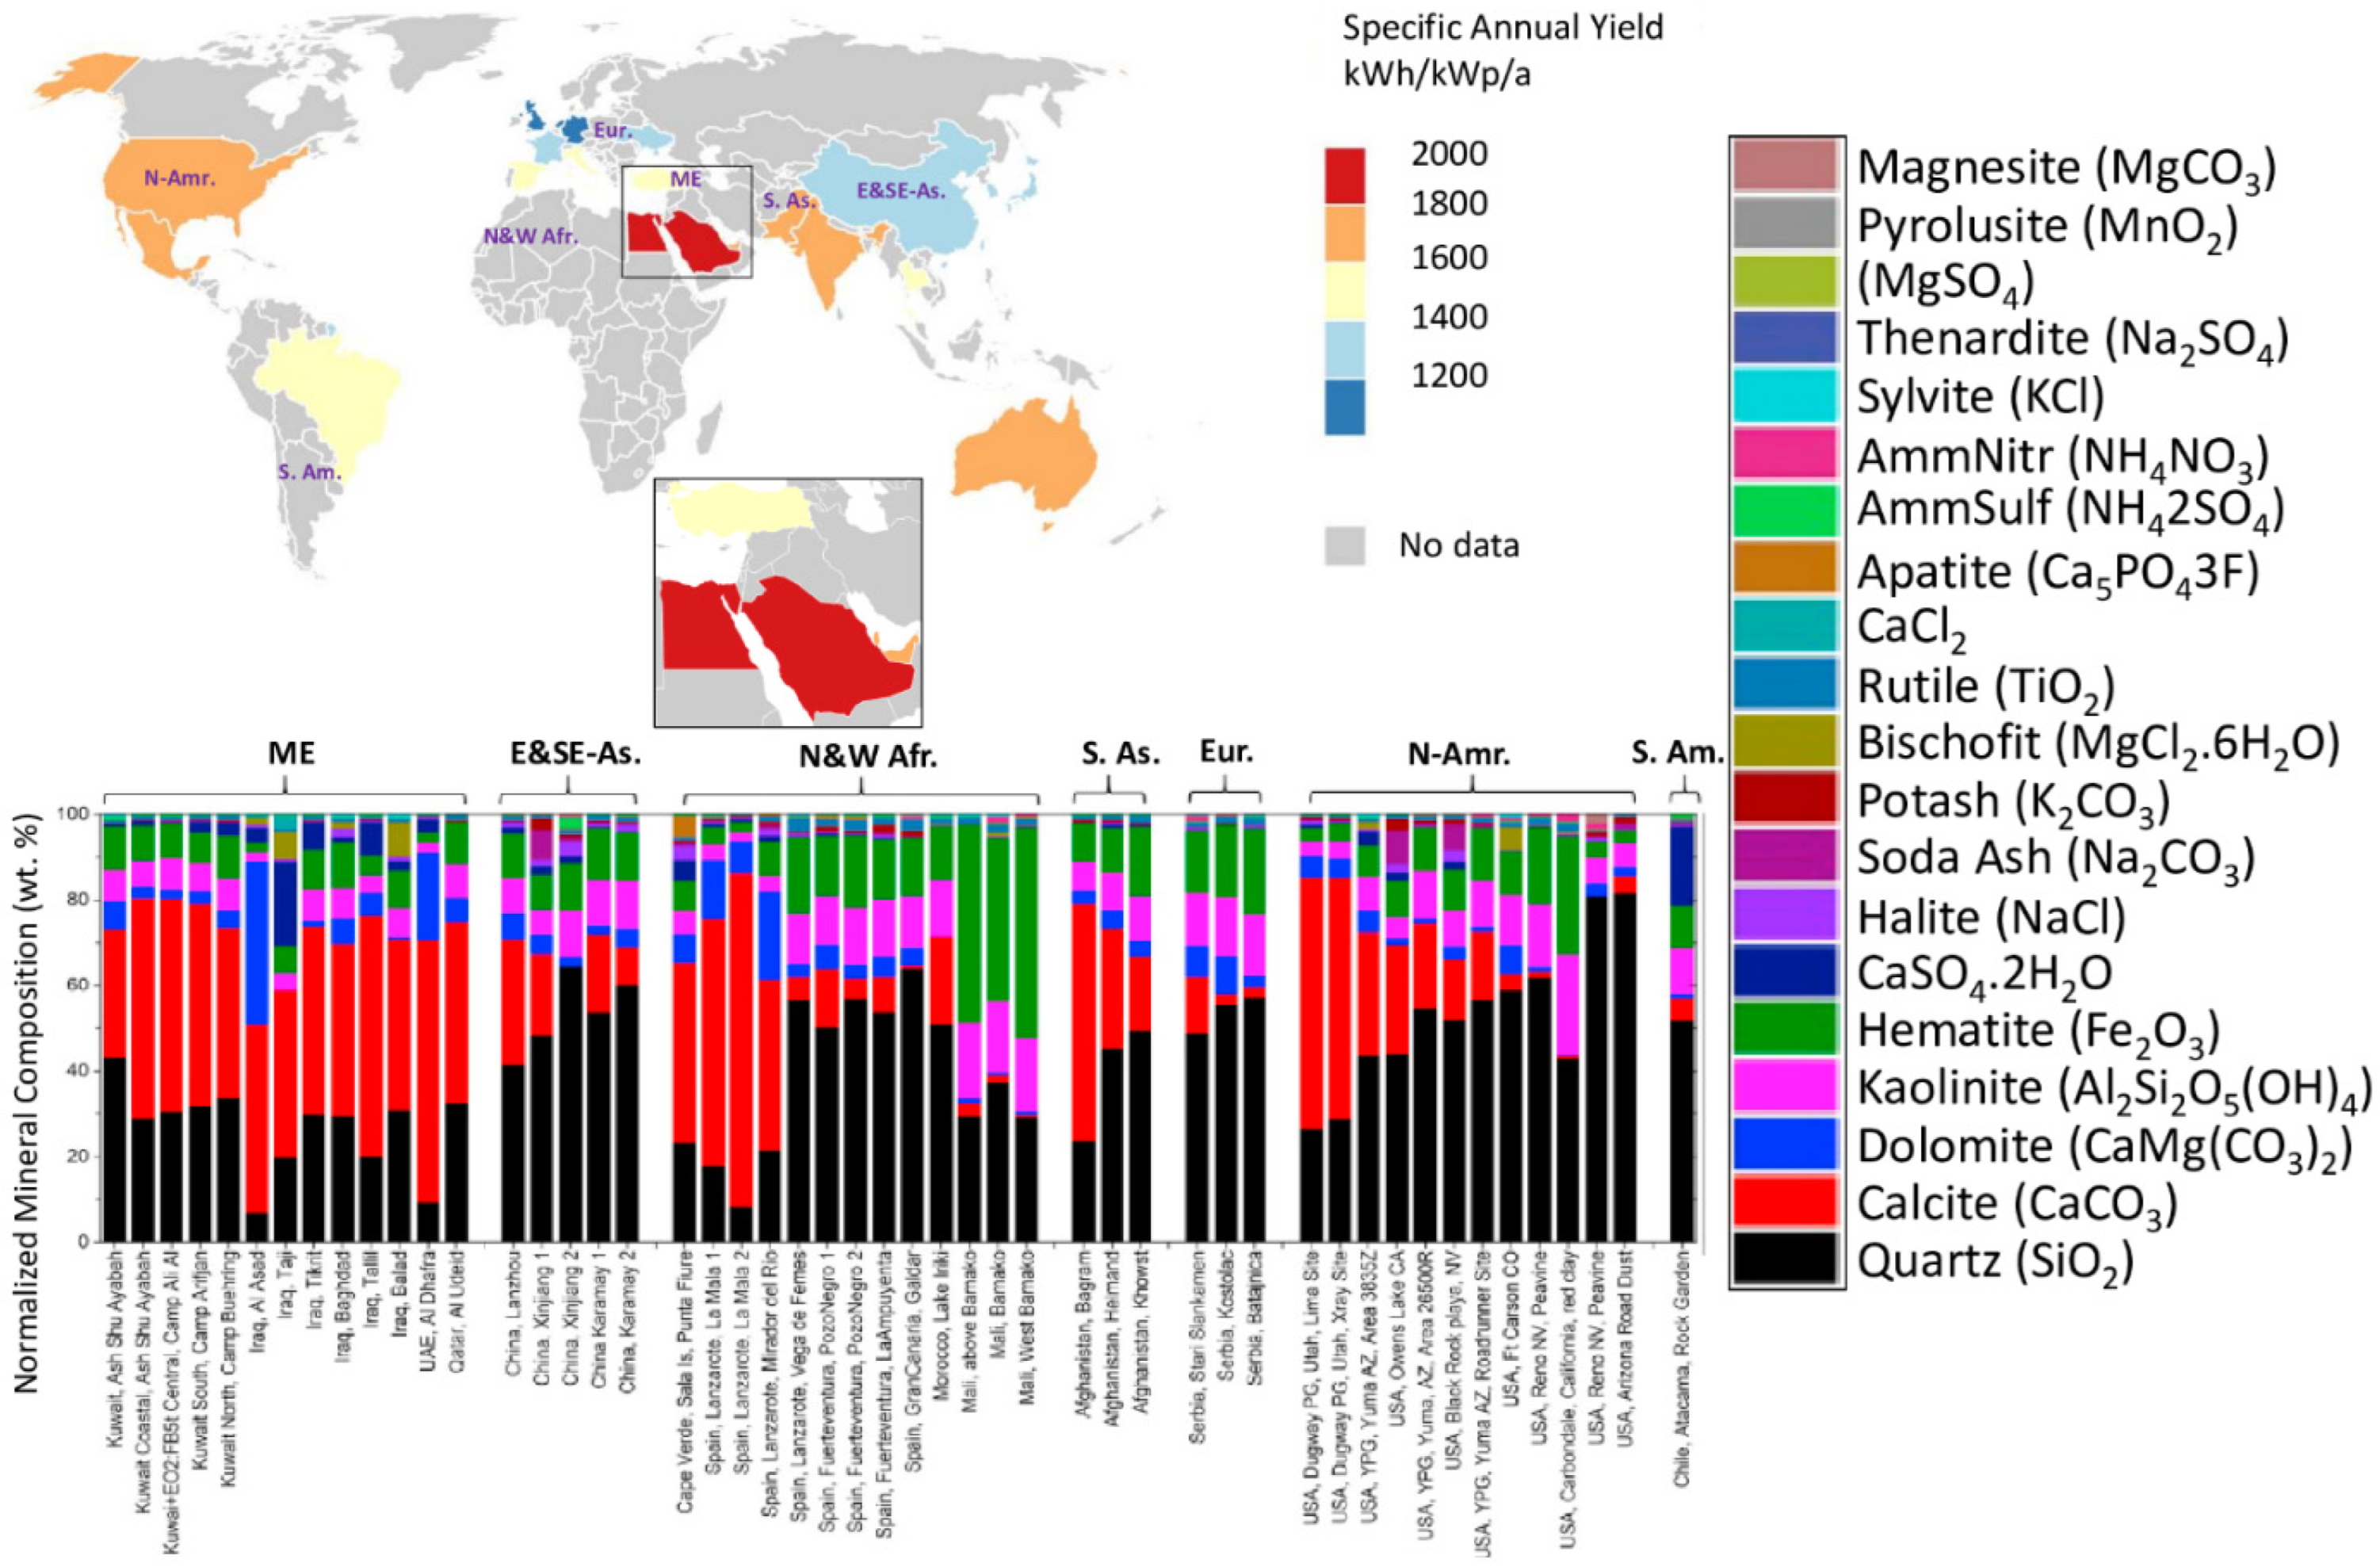
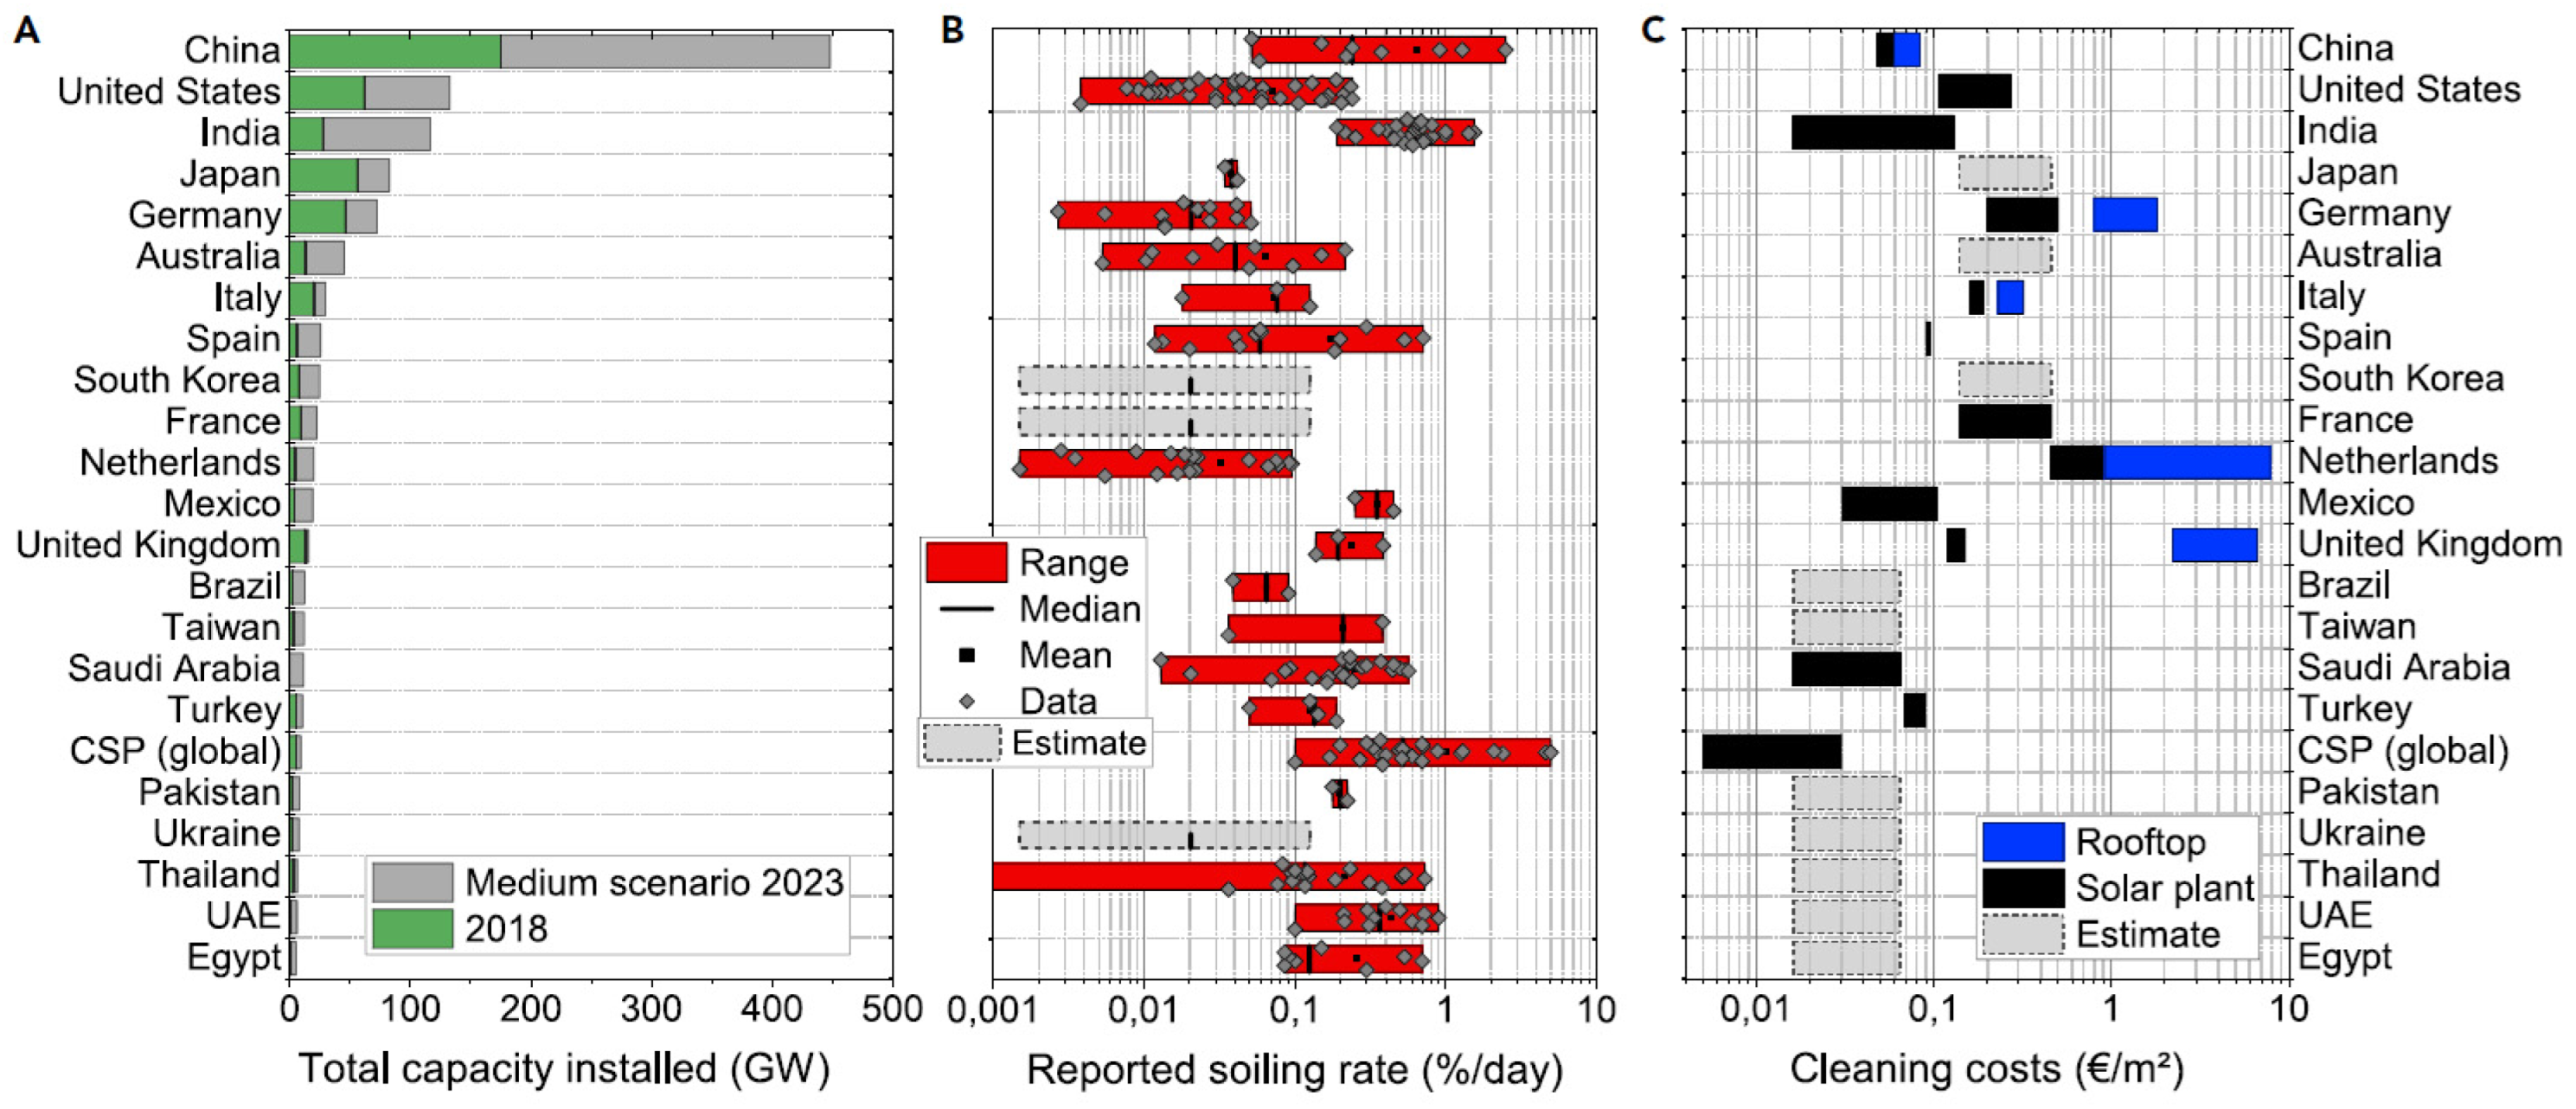
- The concentration of airborne dust was found to be a key factor in forecasting the soiling rates over different geographical locations over medium to long periods [33]. For a shorter period, such as day-to-day variation, additional environmental parameters play a more important role. Moreover, three parameters were found to constitute the best PV soiling predictors, namely (i) the airborne dust concentration, (ii) the duration of the dry periods, and (iii) the rainfall frequency.
- (b)
- The adhesion forces between the flat glass surface and the dust particles were dominated by capillary forces in the presence of moisture, which may also prevent their resuspension by the wind.
- (c)
- van der Waals forces dominated the adhesion in the case of dry conditions, though gravity and electrostatic forces could be considered negligible.
- (d)
- Under windy conditions, when drag forces were present, rolling was the dominant detachment mechanism for particles.
5.2.1. Influence of Environmental Parameters
- Ambient temperature: lower during the night period, higher during the daytime.
- PV module temperature: lower during the night period, higher during daytime (at even higher and lower levels than ambient temperature).
- Relative humidity (RH): higher during the night period, lower during the day. Please note that the temperature of the air governs the concentration of the water-vapor saturation.
- Wind speed (WS): lower during the night period (rarely above 3 m/s) and higher levels during the day going above 5 m/s.
- PM10 concentration: there are no established patterns as observed for other parameters. However, statistically, we record higher mean levels during the night period than during the day. The maximum values of PM10 were observed early morning (6–8 am).
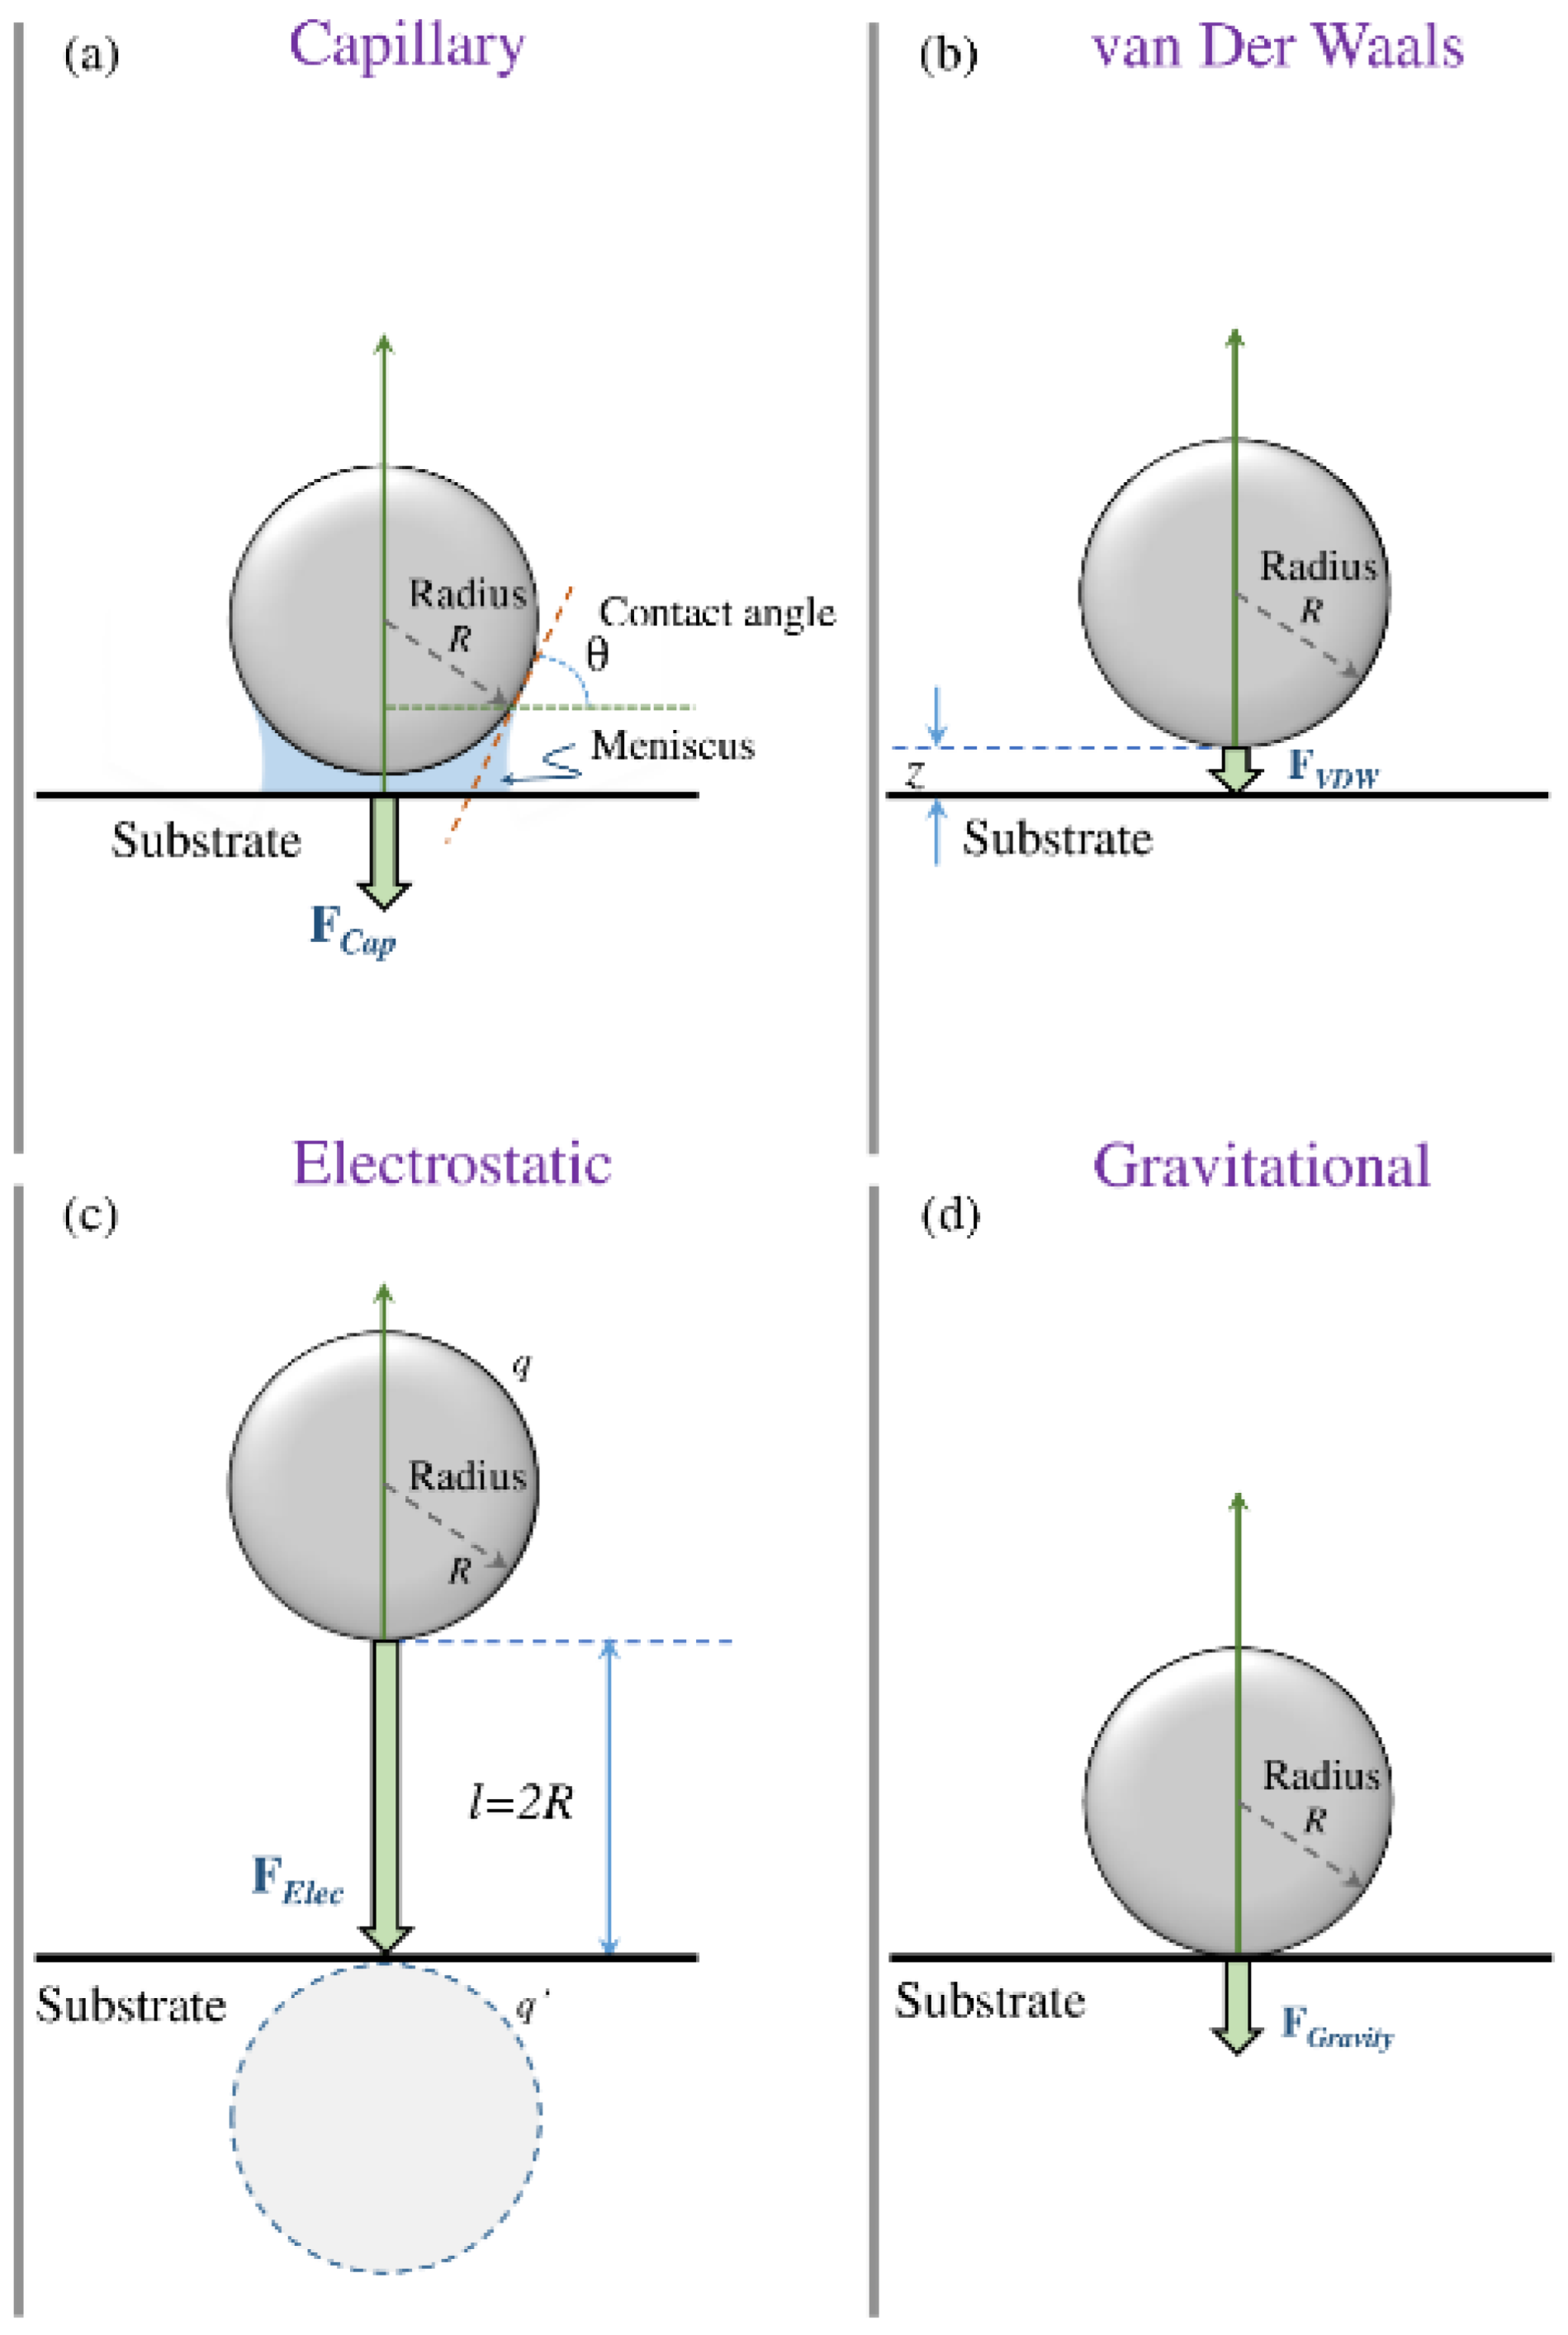
5.2.2. Interaction between Dust Particle and PV Module Surface
- (a)
- Rough and smooth glass surface: van der Waals forces.
- (b)
- Hydrophobic and hydrophilic surface: capillary forces.
- (c)
- Charged particles: Electrostatic forces.
- (d)
- Gravity, when assuming the weight of the particle sphere.
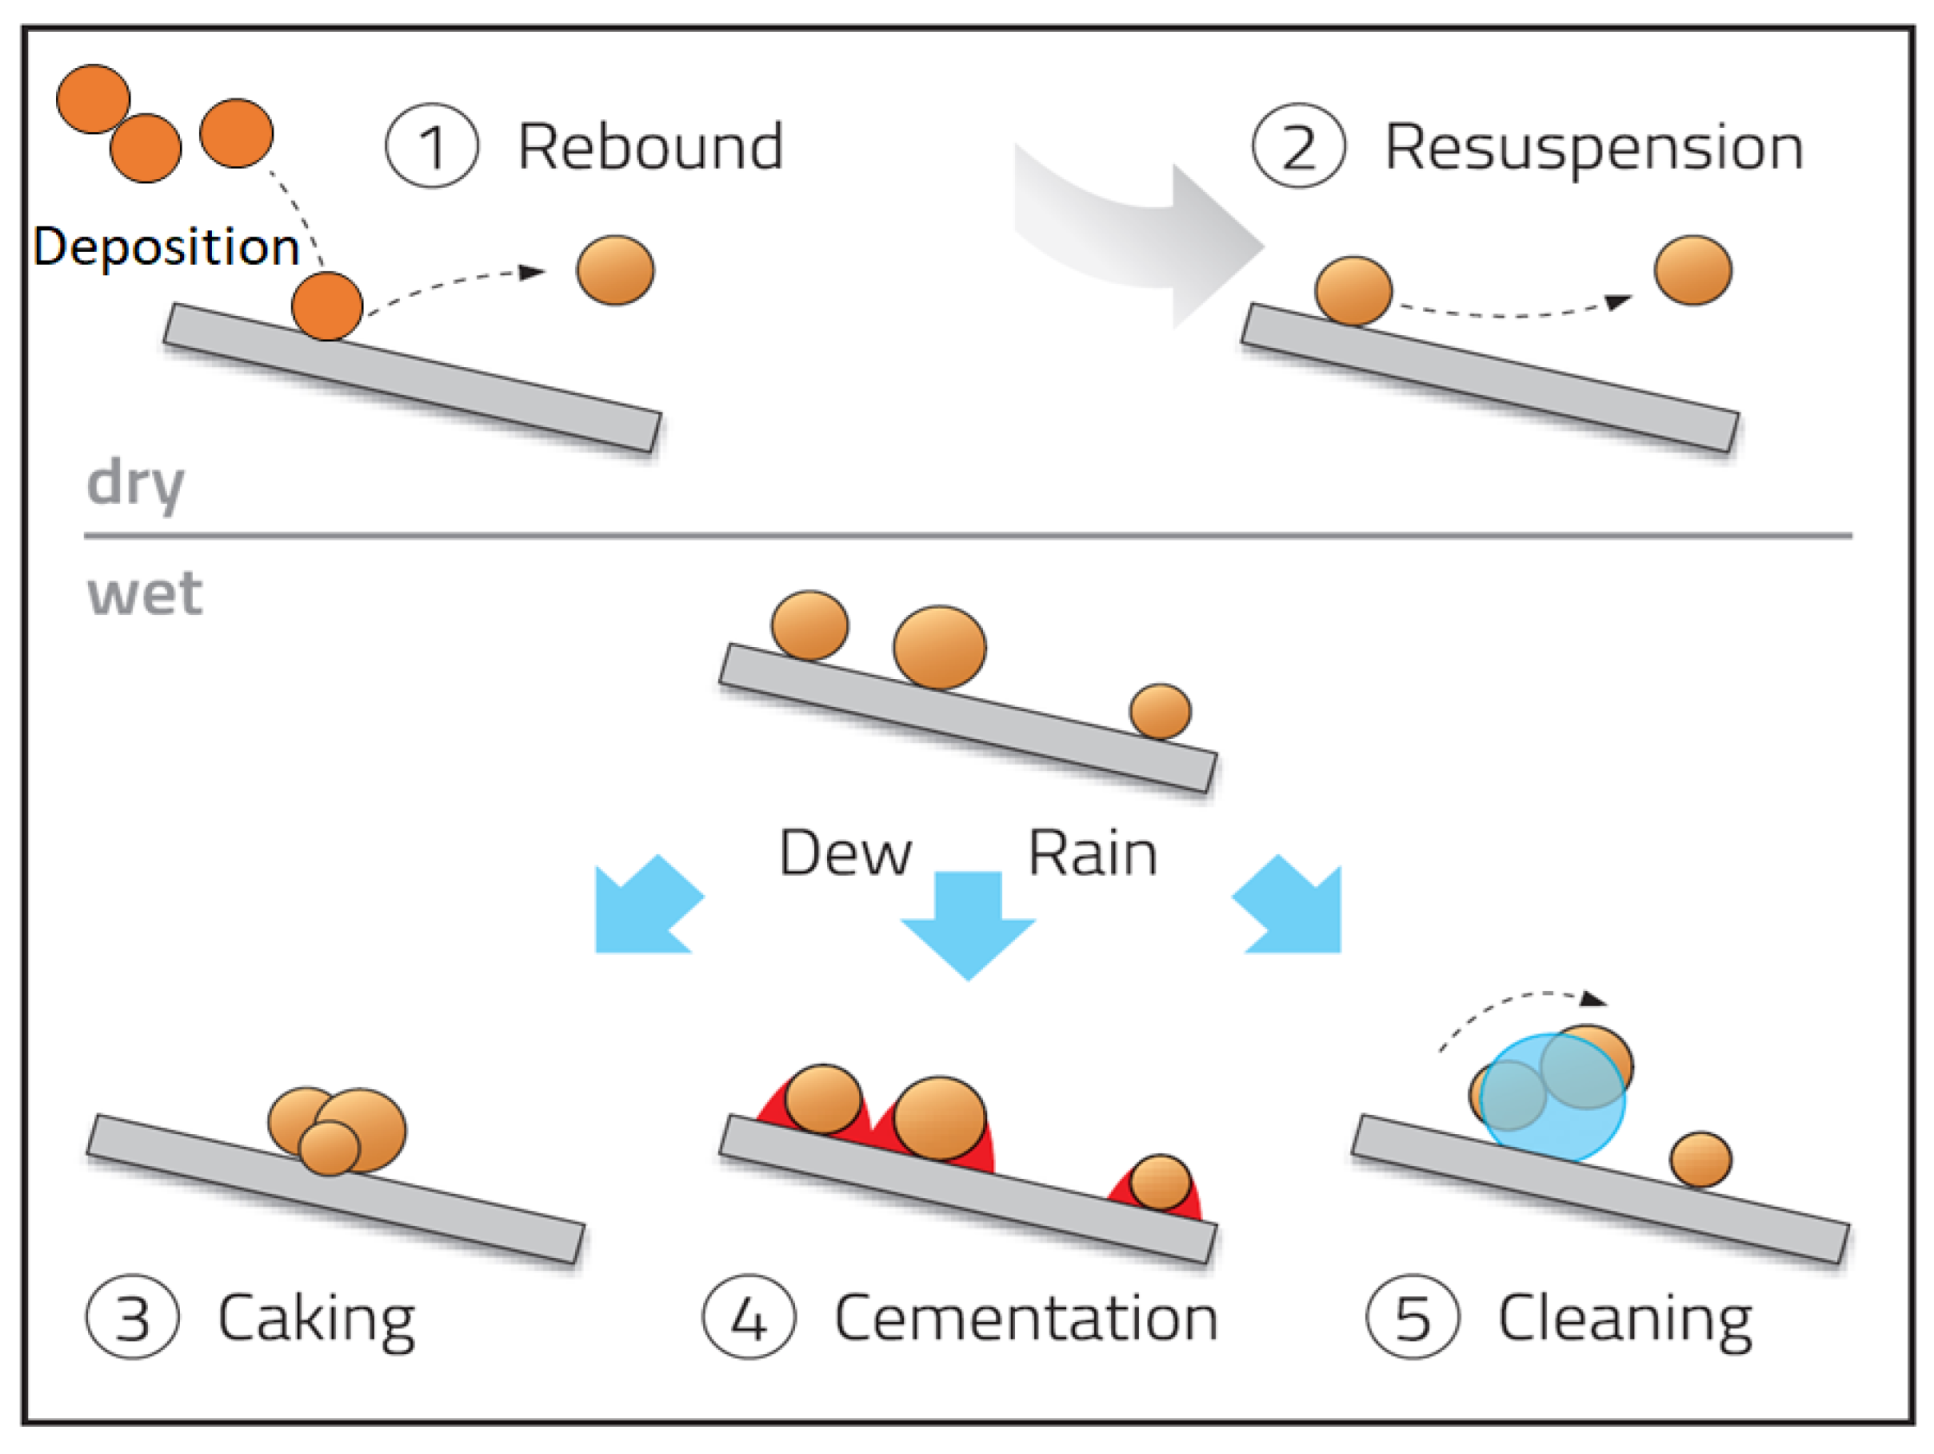
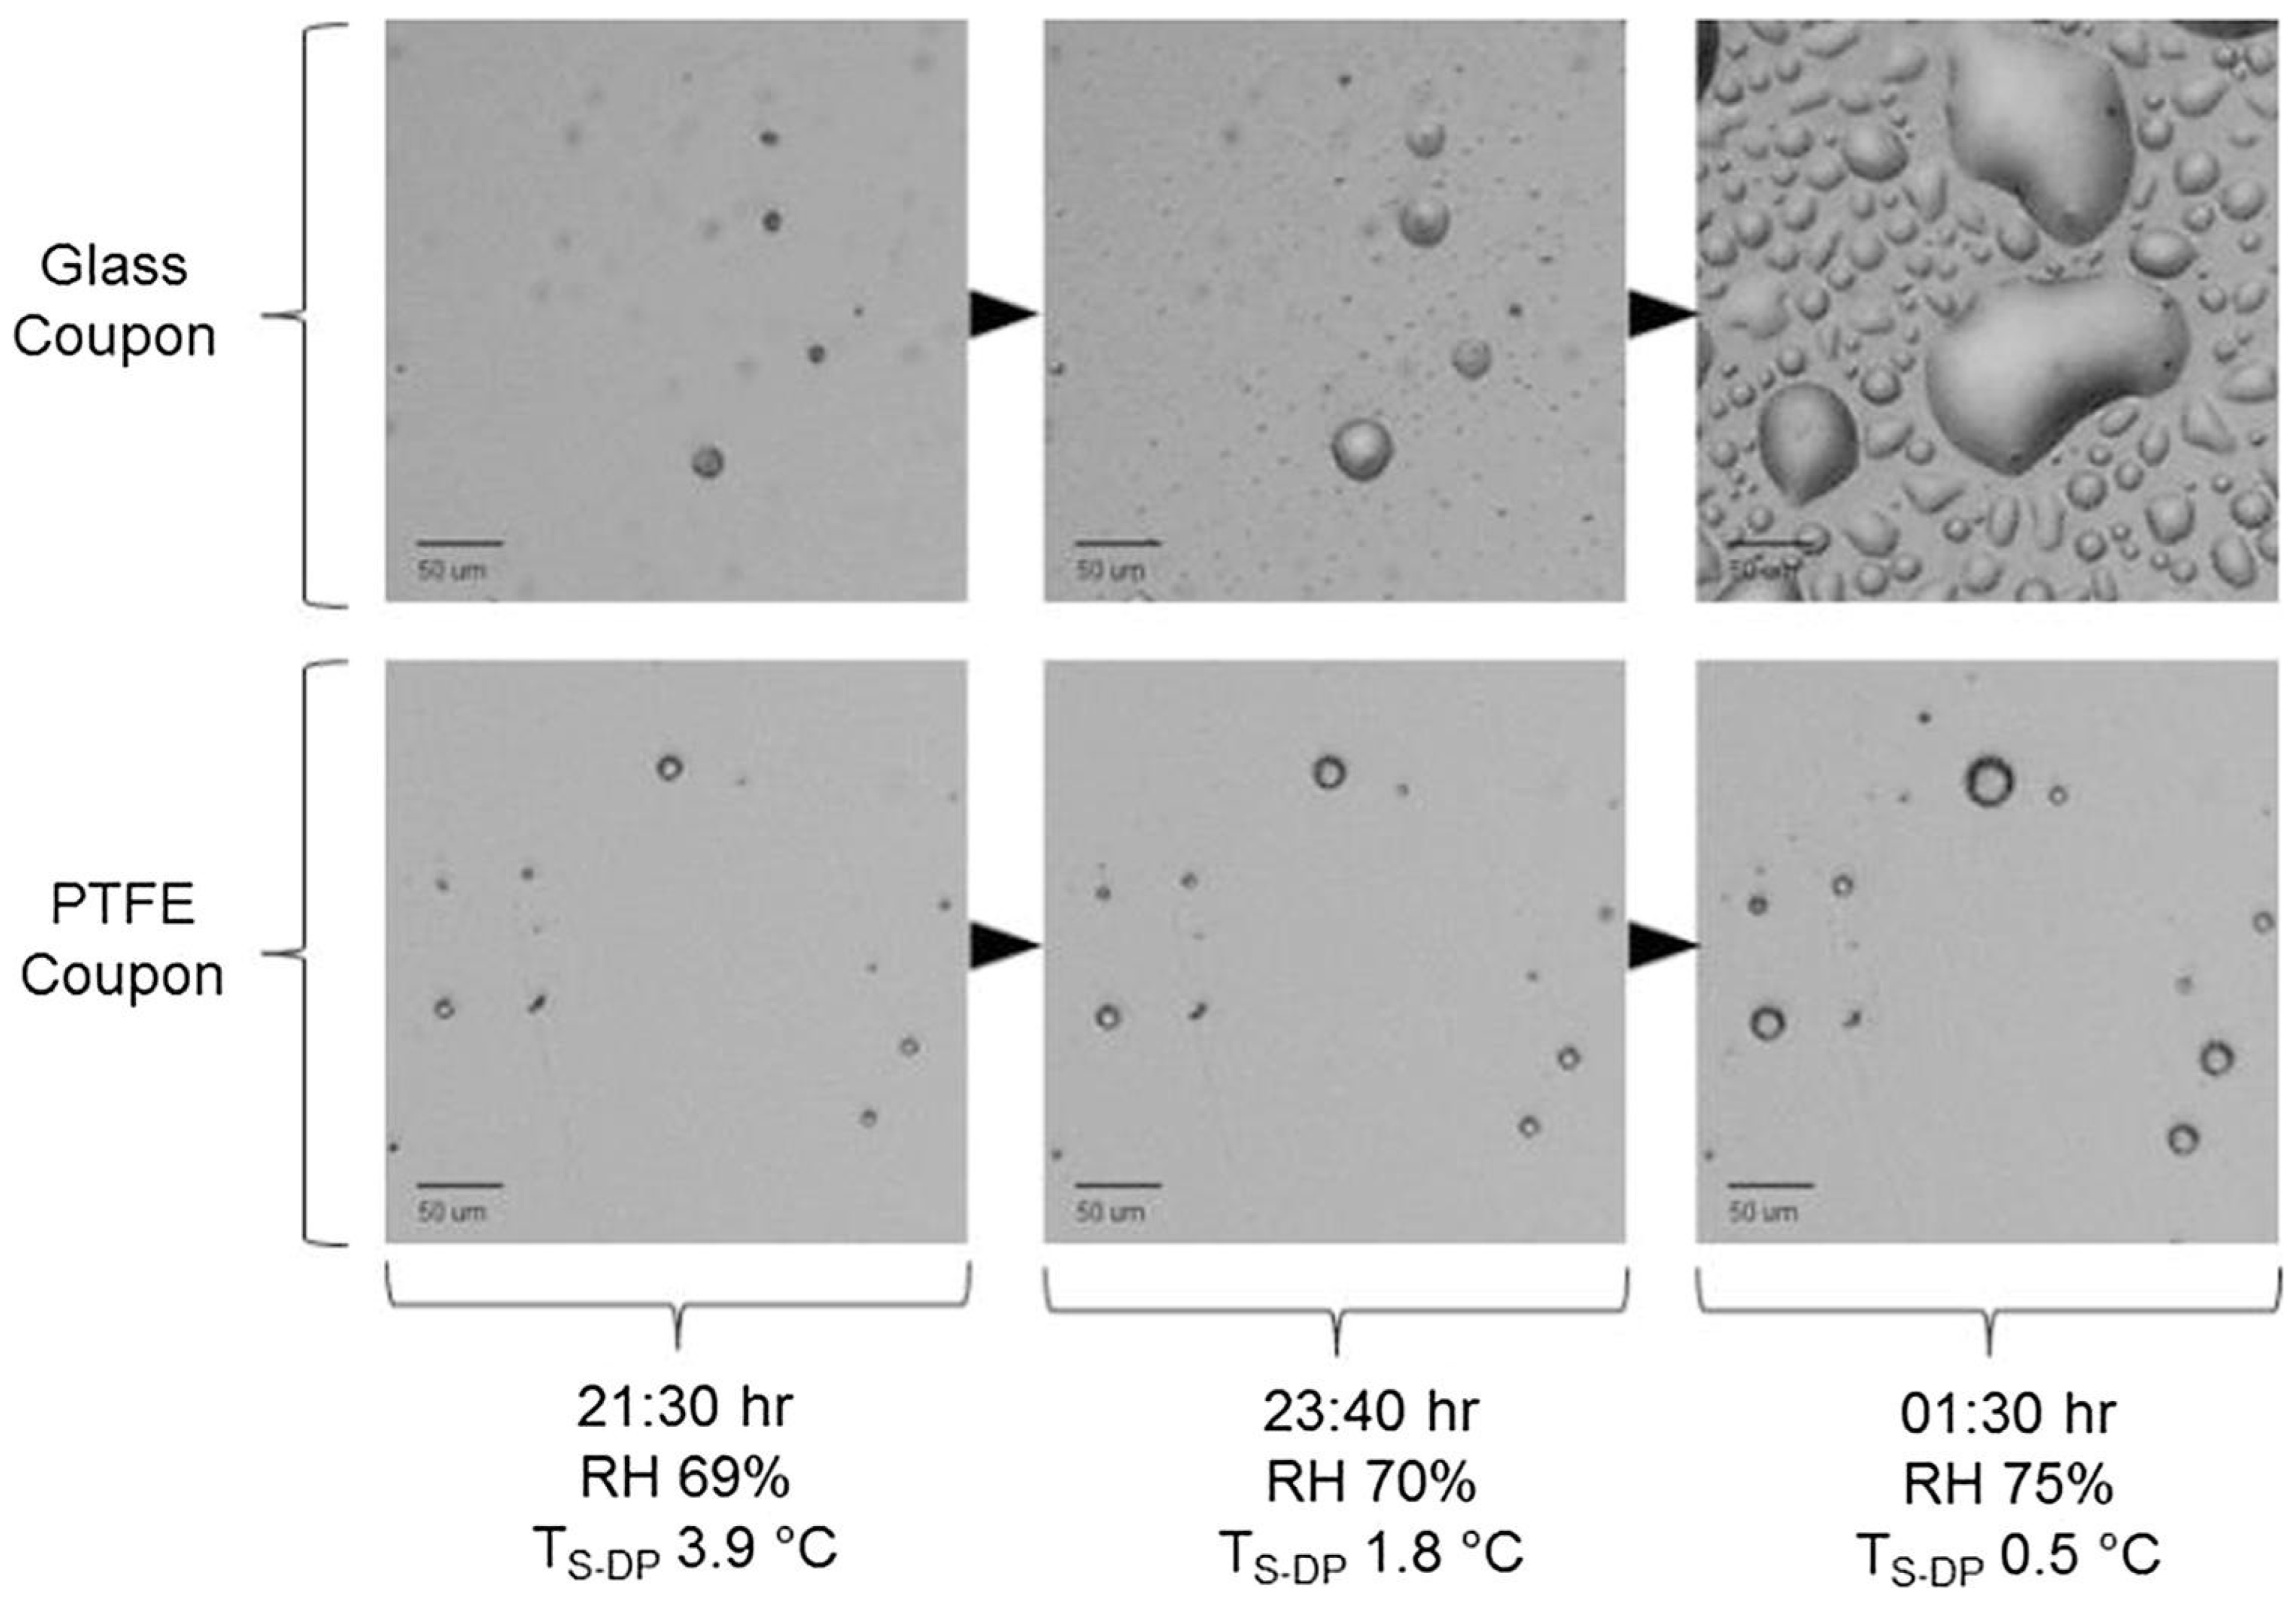
5.3. Parameters Influencing Condensation
- (a)
- “Deposition” refers to the particle in the atmosphere impacting the surface.
- (b)
- “Rebound” is when this particle is rapidly rebounding from this surface without adhering.
- (c)
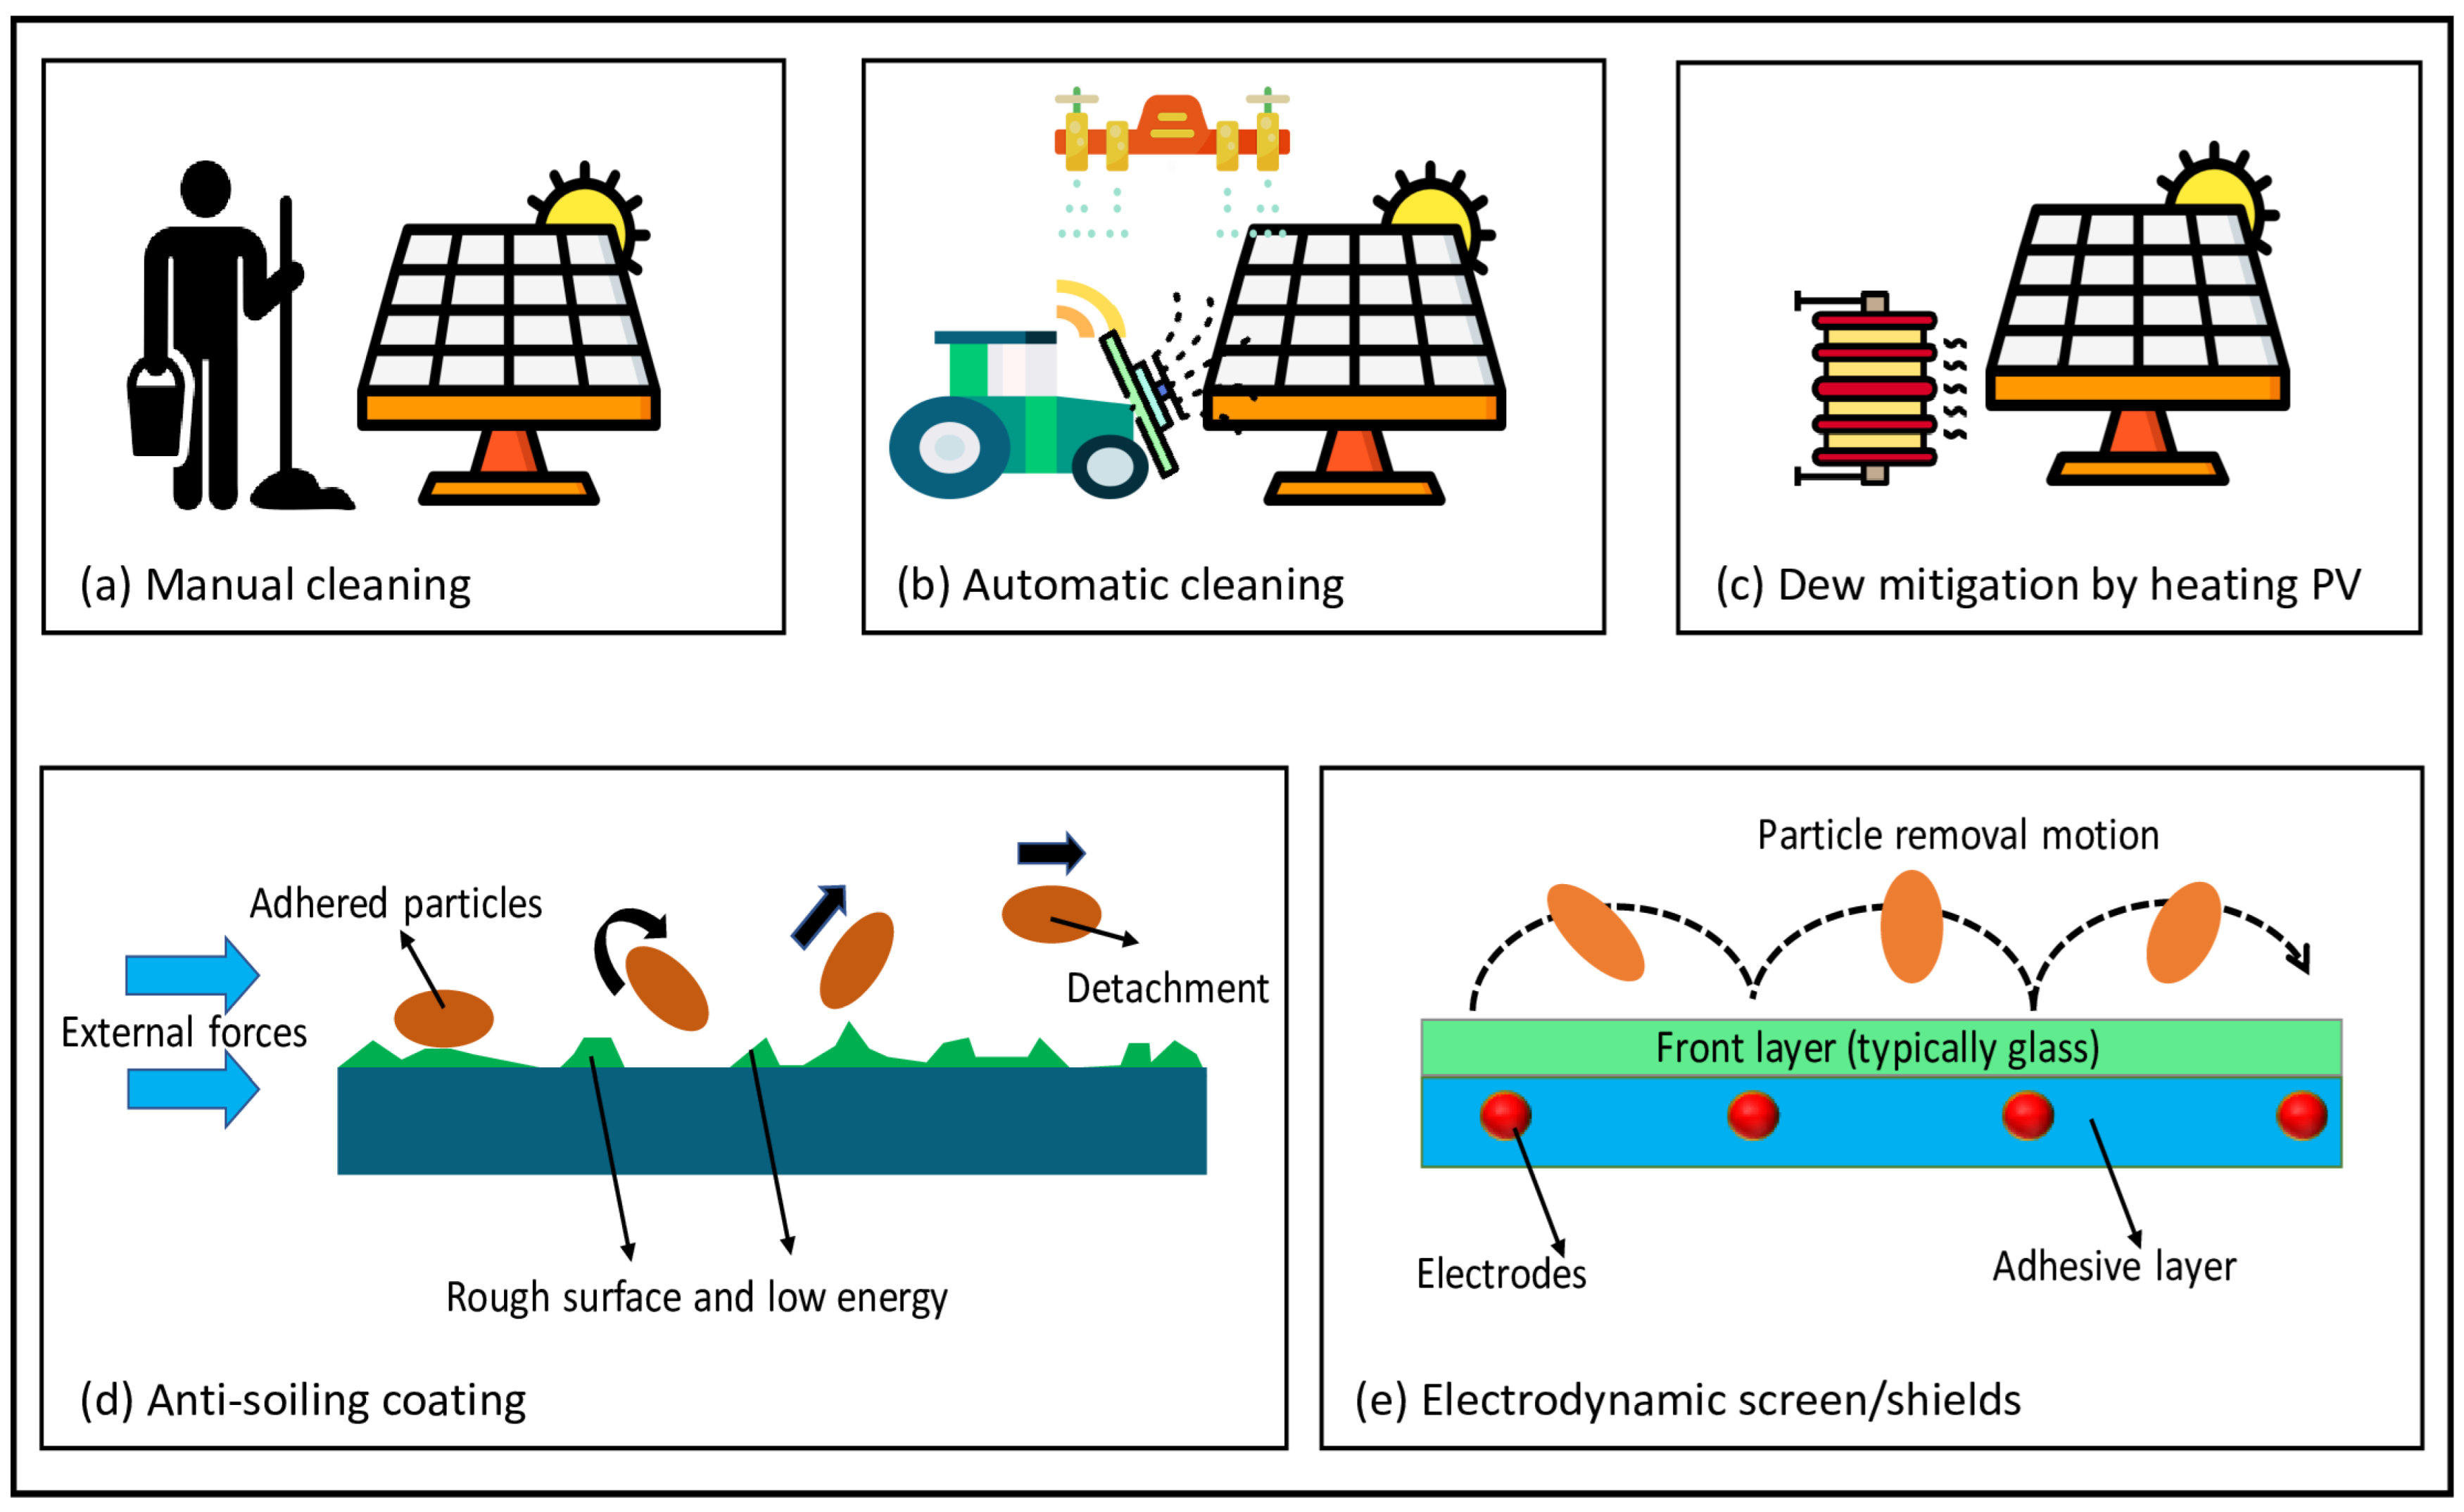
5.4. Dew Mitigation by Heating
6. Impact of PV Soiling on PV Performance
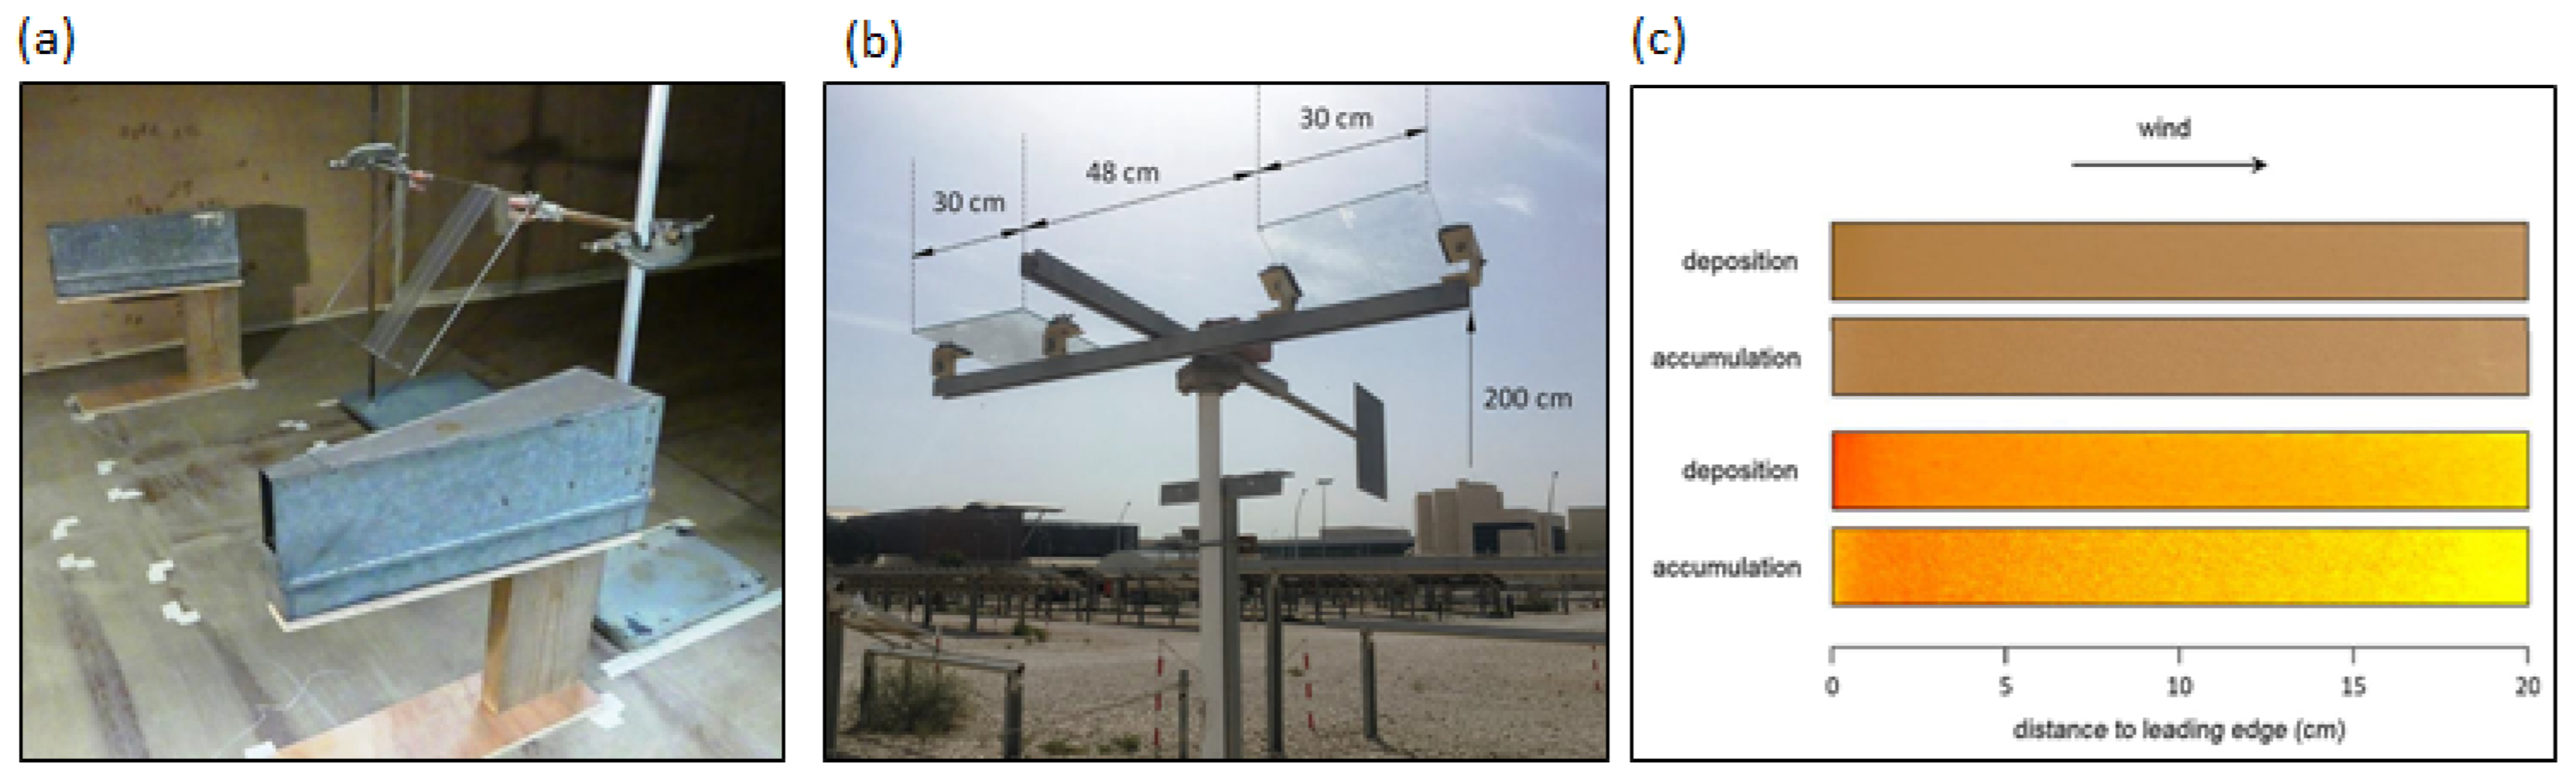
6.1. Effect of PV Module Surface Orientation
- (a)
- The maximum dust deposition in the field test occurred at 45° facing the wind (this deposition was calculated as the total particles impacting the coupon surface).
- (b)
- The maximum accumulation occurred at 22° away from the wind (the accumulation was calculated as the total particles remaining on the coupon surface).
6.2. Dust Potency of PV Soiling Loss
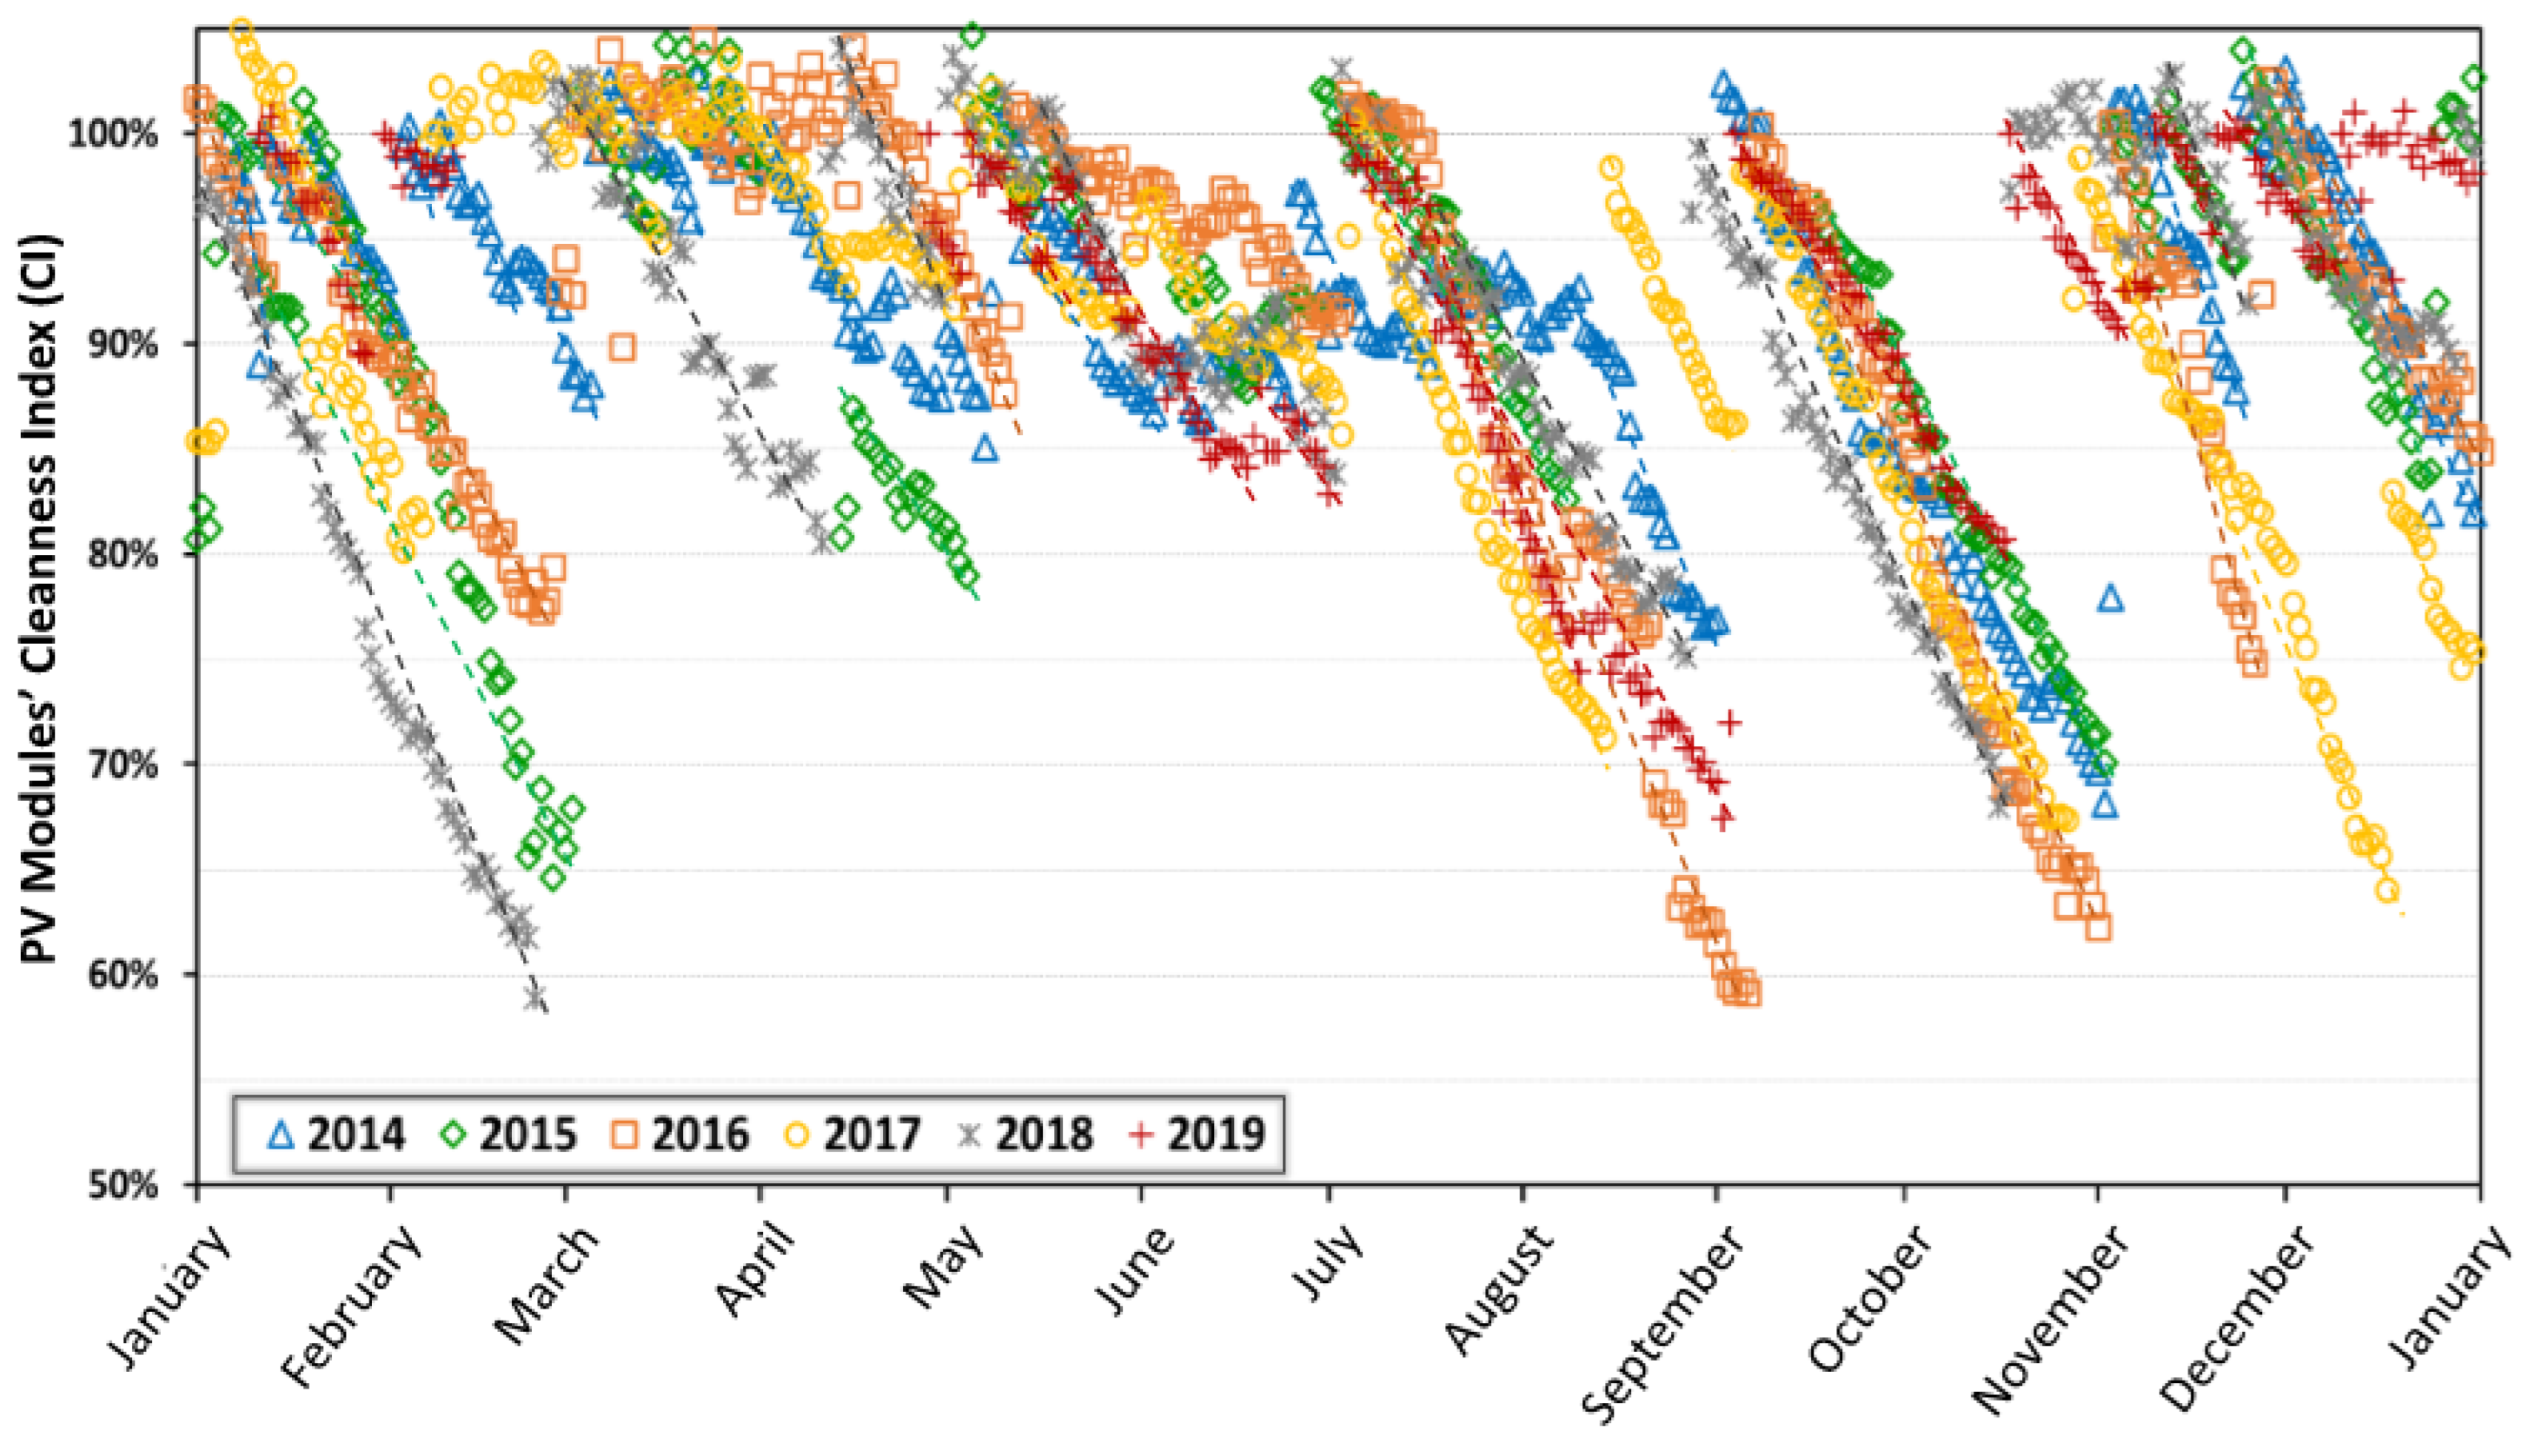
6.3. Seasonal Variability of PV Soiling in Qatar
- The summer season (July–October) showed a decrease in CI by about 20% per month and this occurs consistently during only dry periods year after year.
- Typically, for the bi-monthly cleaned panels, the associated PV power loss was about 15%/ month, with a clearly defined seasonal pattern.
- During wet seasons, i.e., rainy periods, the CI reduction was limited to 10% due to cleaning triggered by the rain that prevents the accumulation of dust for more extended periods.
- Wet season with higher rain rates such as in 2017 has shown a better CI (even close to unity) as compared, for example, to the same season in 2015.
- Although the monthly PV soiling varied noticeably, the associated seasonal trends were more or less respected and the yearly change was less significant.
- Cold, rainy, or warm seasons show different soiling as they are impacted by environmental factors.
- A threshold of a minimum of 3 mm rainfall was found to be the required value to fully clean the PV modules.
- Summer months are characterized by dust storms (DS), yet their impact when they occur during the winter season was found to be more impactful. DS days increase the annual average soiling rate by 23%.
7. Mitigation of PV Soiling
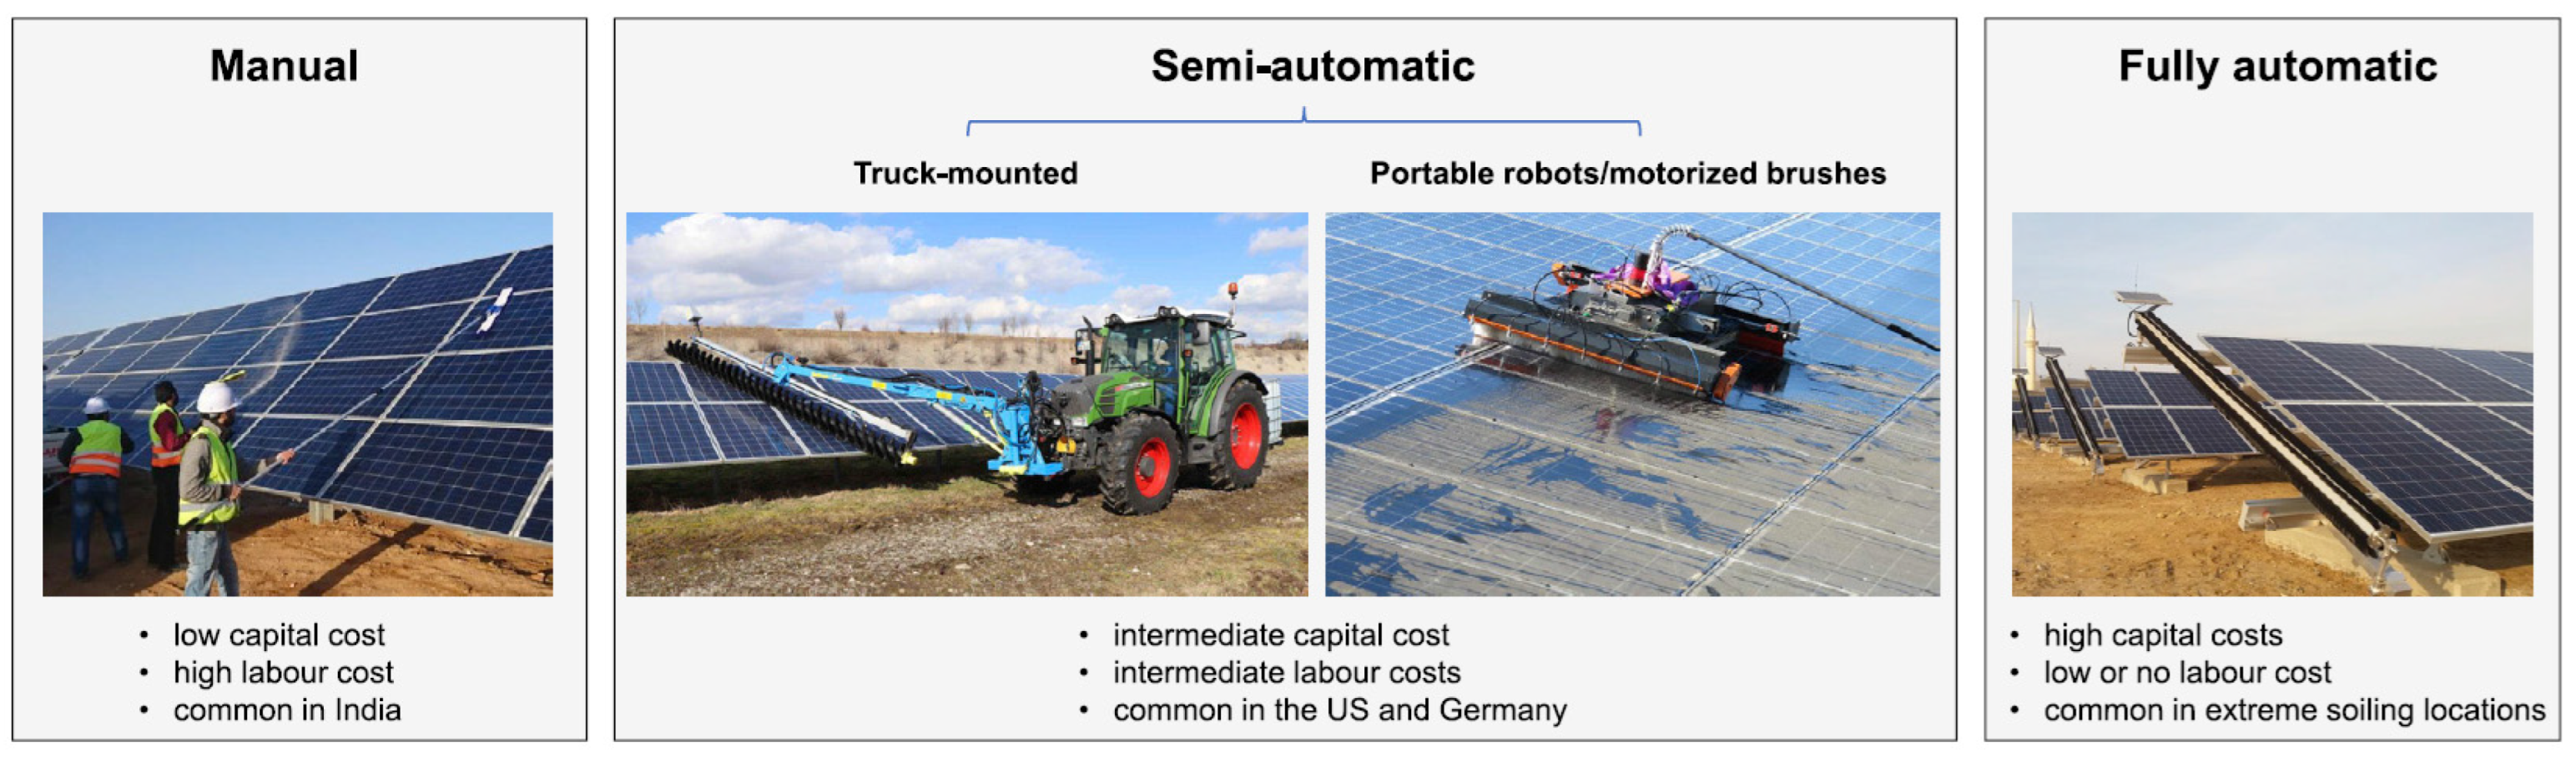
7.1. Manual and Automated Cleaning
- (a)
- Dry-cleaning-based technologies: presently they are available only for PV and not CSP. These cleaning methods are applied in the desert and arid environments where water sources are rare,
- (b)
7.2. Development of Anti-Soiling Coating (ASC)
- (a)
- Geographical and seasonal variation [96].
- (b)
- (c)

| A—International and Regional Efforts | ||
| Institution | Details of the Product | |
| Regional | ||
| [108] | KISR (Kuwait) | Field Testing |
| [109] | KAUST (KSA) | Field Testing/Product Development—Cleaning Robot NOMADD |
| [110] | DEWA (UAE) | Field Testing |
| [8] | QEERI (Qatar) | Field Testing/Dust characterization/Fundamental Research/Anti-soiling coatings/Statistical Models |
| International | ||
| [111] | Fraunhofer | PV Soiling and Degradation |
| [112] | NREL | Photovoltaic Module Soiling Map, Forecasting Tools, Fundamental Research, Abrasion, Soiling, etc. |
| [113] | AtaMoS-Tec—Chile project: ISC Konstanz, Fraunhofer Chile, SERC and French CEA, INES | Photovoltaic Module Soiling study, Forecasting Tools, Fundamental Research |
| [114] | SANDIA LABS/Arizona State University | Soiling Loss Research, PV Reliability |
| [115] | University of Colorado/Pontifícia Universidade Católica de Minas Gerais (Brasil) | Soiling Science and Technology, Coatings and Films |
| [116] | DLR Raumfahrtmanagement (the German Aerospace Center) | Airborne soiling measurements and product development |
| [117] | TÜV Rheinland (Germany) | Anti-soiling coatings |
| [118] | International PV Quality Assurance Task Force (PVQAT) | Sensors and Monitoring, Cleaning Solutions and Anti-Reflective and Anti-Soiling Coatings, Standardization |
| [119] | European Cooperation in Science and Technology (COST) “inDust” program | International effort by WHO, WMO, ECMWF—Dust monitoring and forecasting models |
| B—Cleaning Solutions (Automatic, Robotic) | ||
| [109] | NOMADD | Desert, Utility Scale, Dry Brush |
| [120] | Eccopia | Desert, Utility Scale, Dry Brush |
| [121] | Washpanel | Moderate Climate, Rooftops, Wet cleaning |
| [122] | Greenbotics/ SunPower | General Utility, Wet Cleaning |
| [123] | First Solar/ DEWA | Desert, Utility Scale, Dry Brush |
| [124] | Serbot Gekko | Moderate Climate, Rooftops, Wet cleaning |
| [125] | SOLRIDER | General Utility, Wet Cleaning |
| [126] | Enerwhere | Desert, Rooftops, |
| [127] | BladeRanger | General Utility, Dry Cleaning |
| C—Soiling Sensors | ||
| [128] | German Aerospace Center | Qfly (Airborne soiling measurement of entire solar fields) |
| [129] | Campbell Scientific | Soiling Index Measurement Solution |
| [130] | Kipp and Zonen | DustIQ Soiling Monitoring System |
| [131] | Nor-Cal Controls | MaxSun Soiling Station |
| [123] | NRG | Soiling Measurement Kit |
| [124] | Ammonit | Soiling Measurement Kit |
| [132] | Atonometrics | Mars Optical Soiling Sensor |
| [133] | Kintech Engineering | Soiling Measurement Kit |
| D—Smart PV monitoring systems (IoT/Data analytics) | ||
| [134] | Alternative Energy Solutions | AES PIT (Uses machine learning/advanced data analysis platform) |
| [135] | InnoEnergy | Solar Energy 3.0 (Smart PV monitoring esp. for detecting degradations) |
| [136] | Solar IoT platform | TrackSo (Data-driven predictive and condition monitoring) |
| E—Anti-Soiling Coatings | ||
| [137] | CSD Nano | MoreSun Multi-Function Coating (Electrodynamic Dust Shield, EDS) |
| [138] | Anti-Soiling (AS) coating | DSM (Surface Modified Anti-Soiling Coating) |
| [139] | Hydrophil AS coating | Lotus Leaf Coatings (HydroPhillic Coatings) |
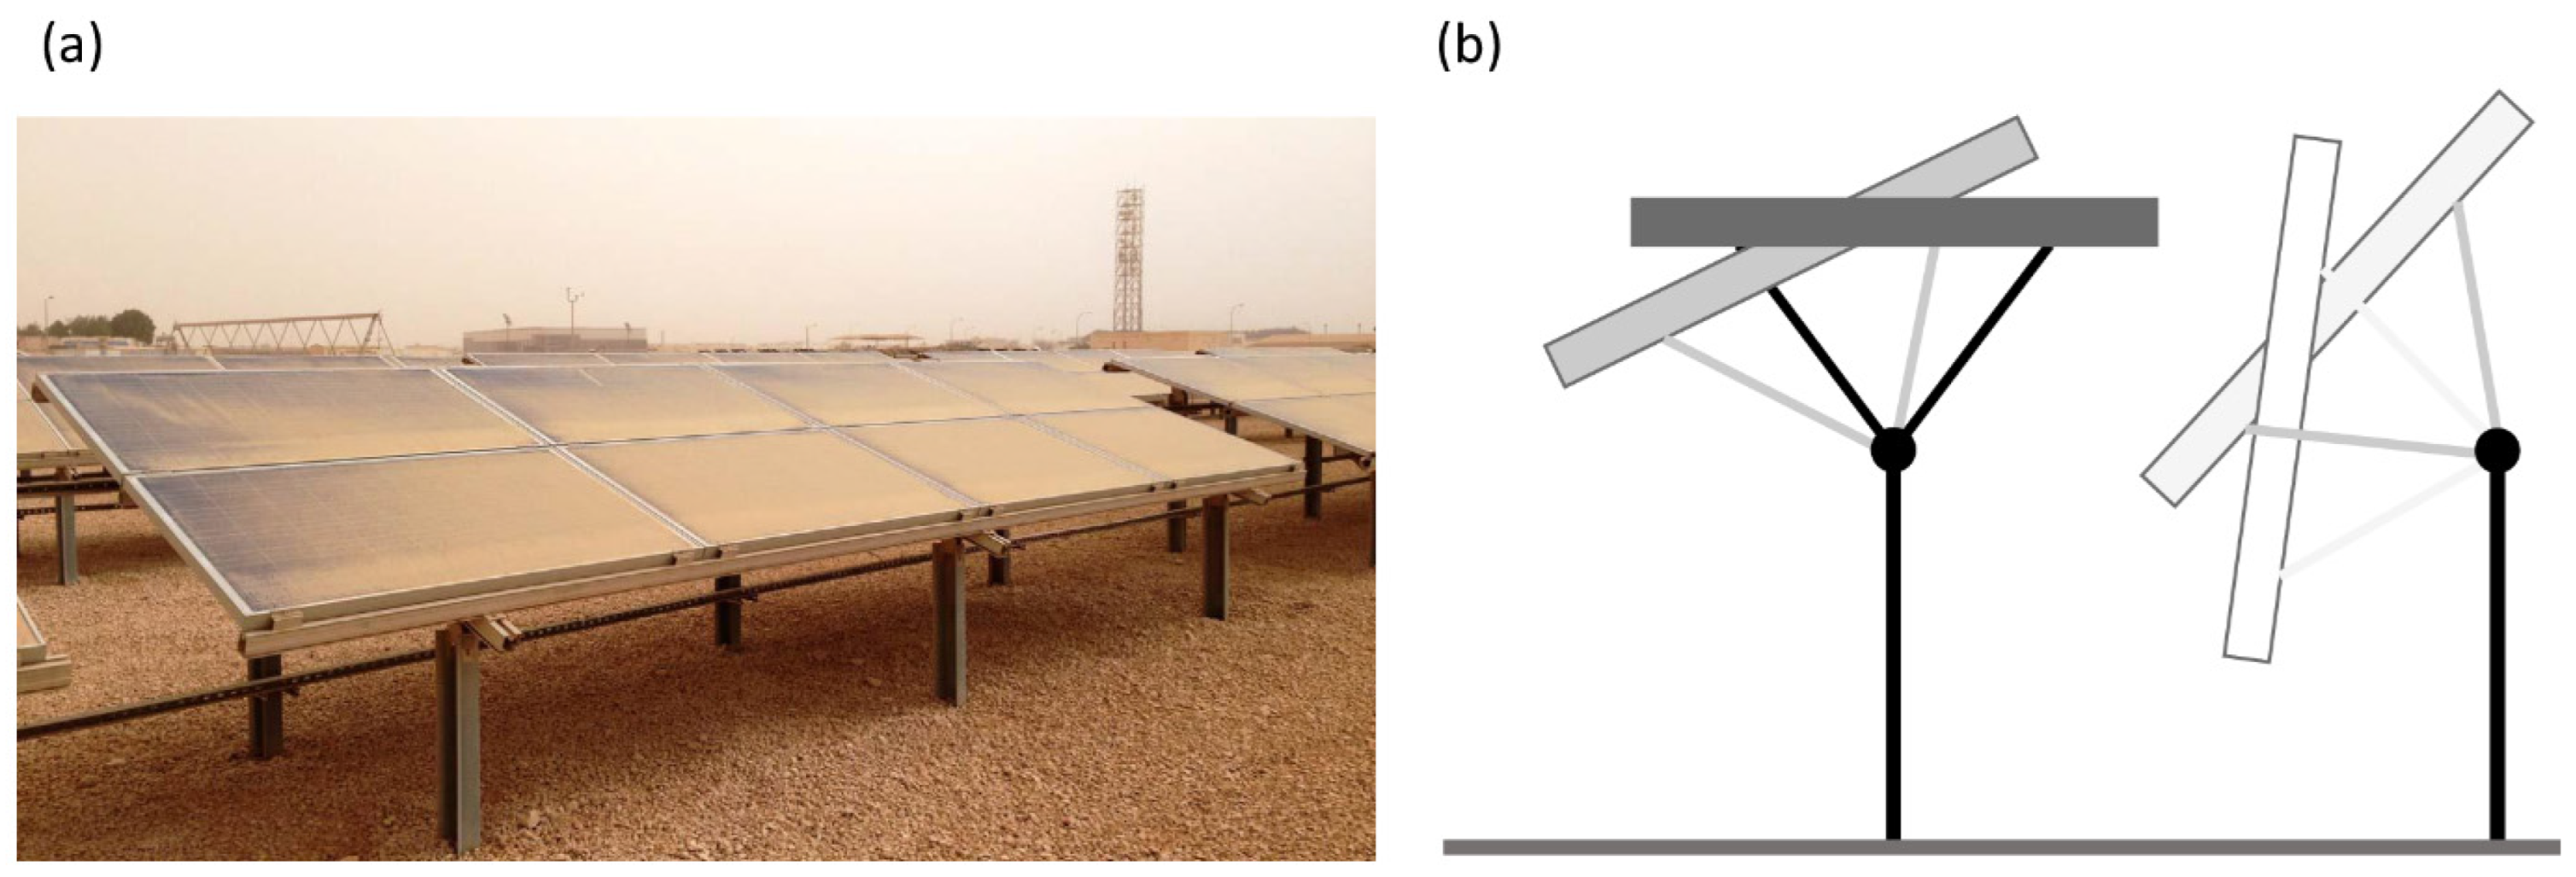
7.3. Anti-Soiling Potential of 1-Axis PV Trackers
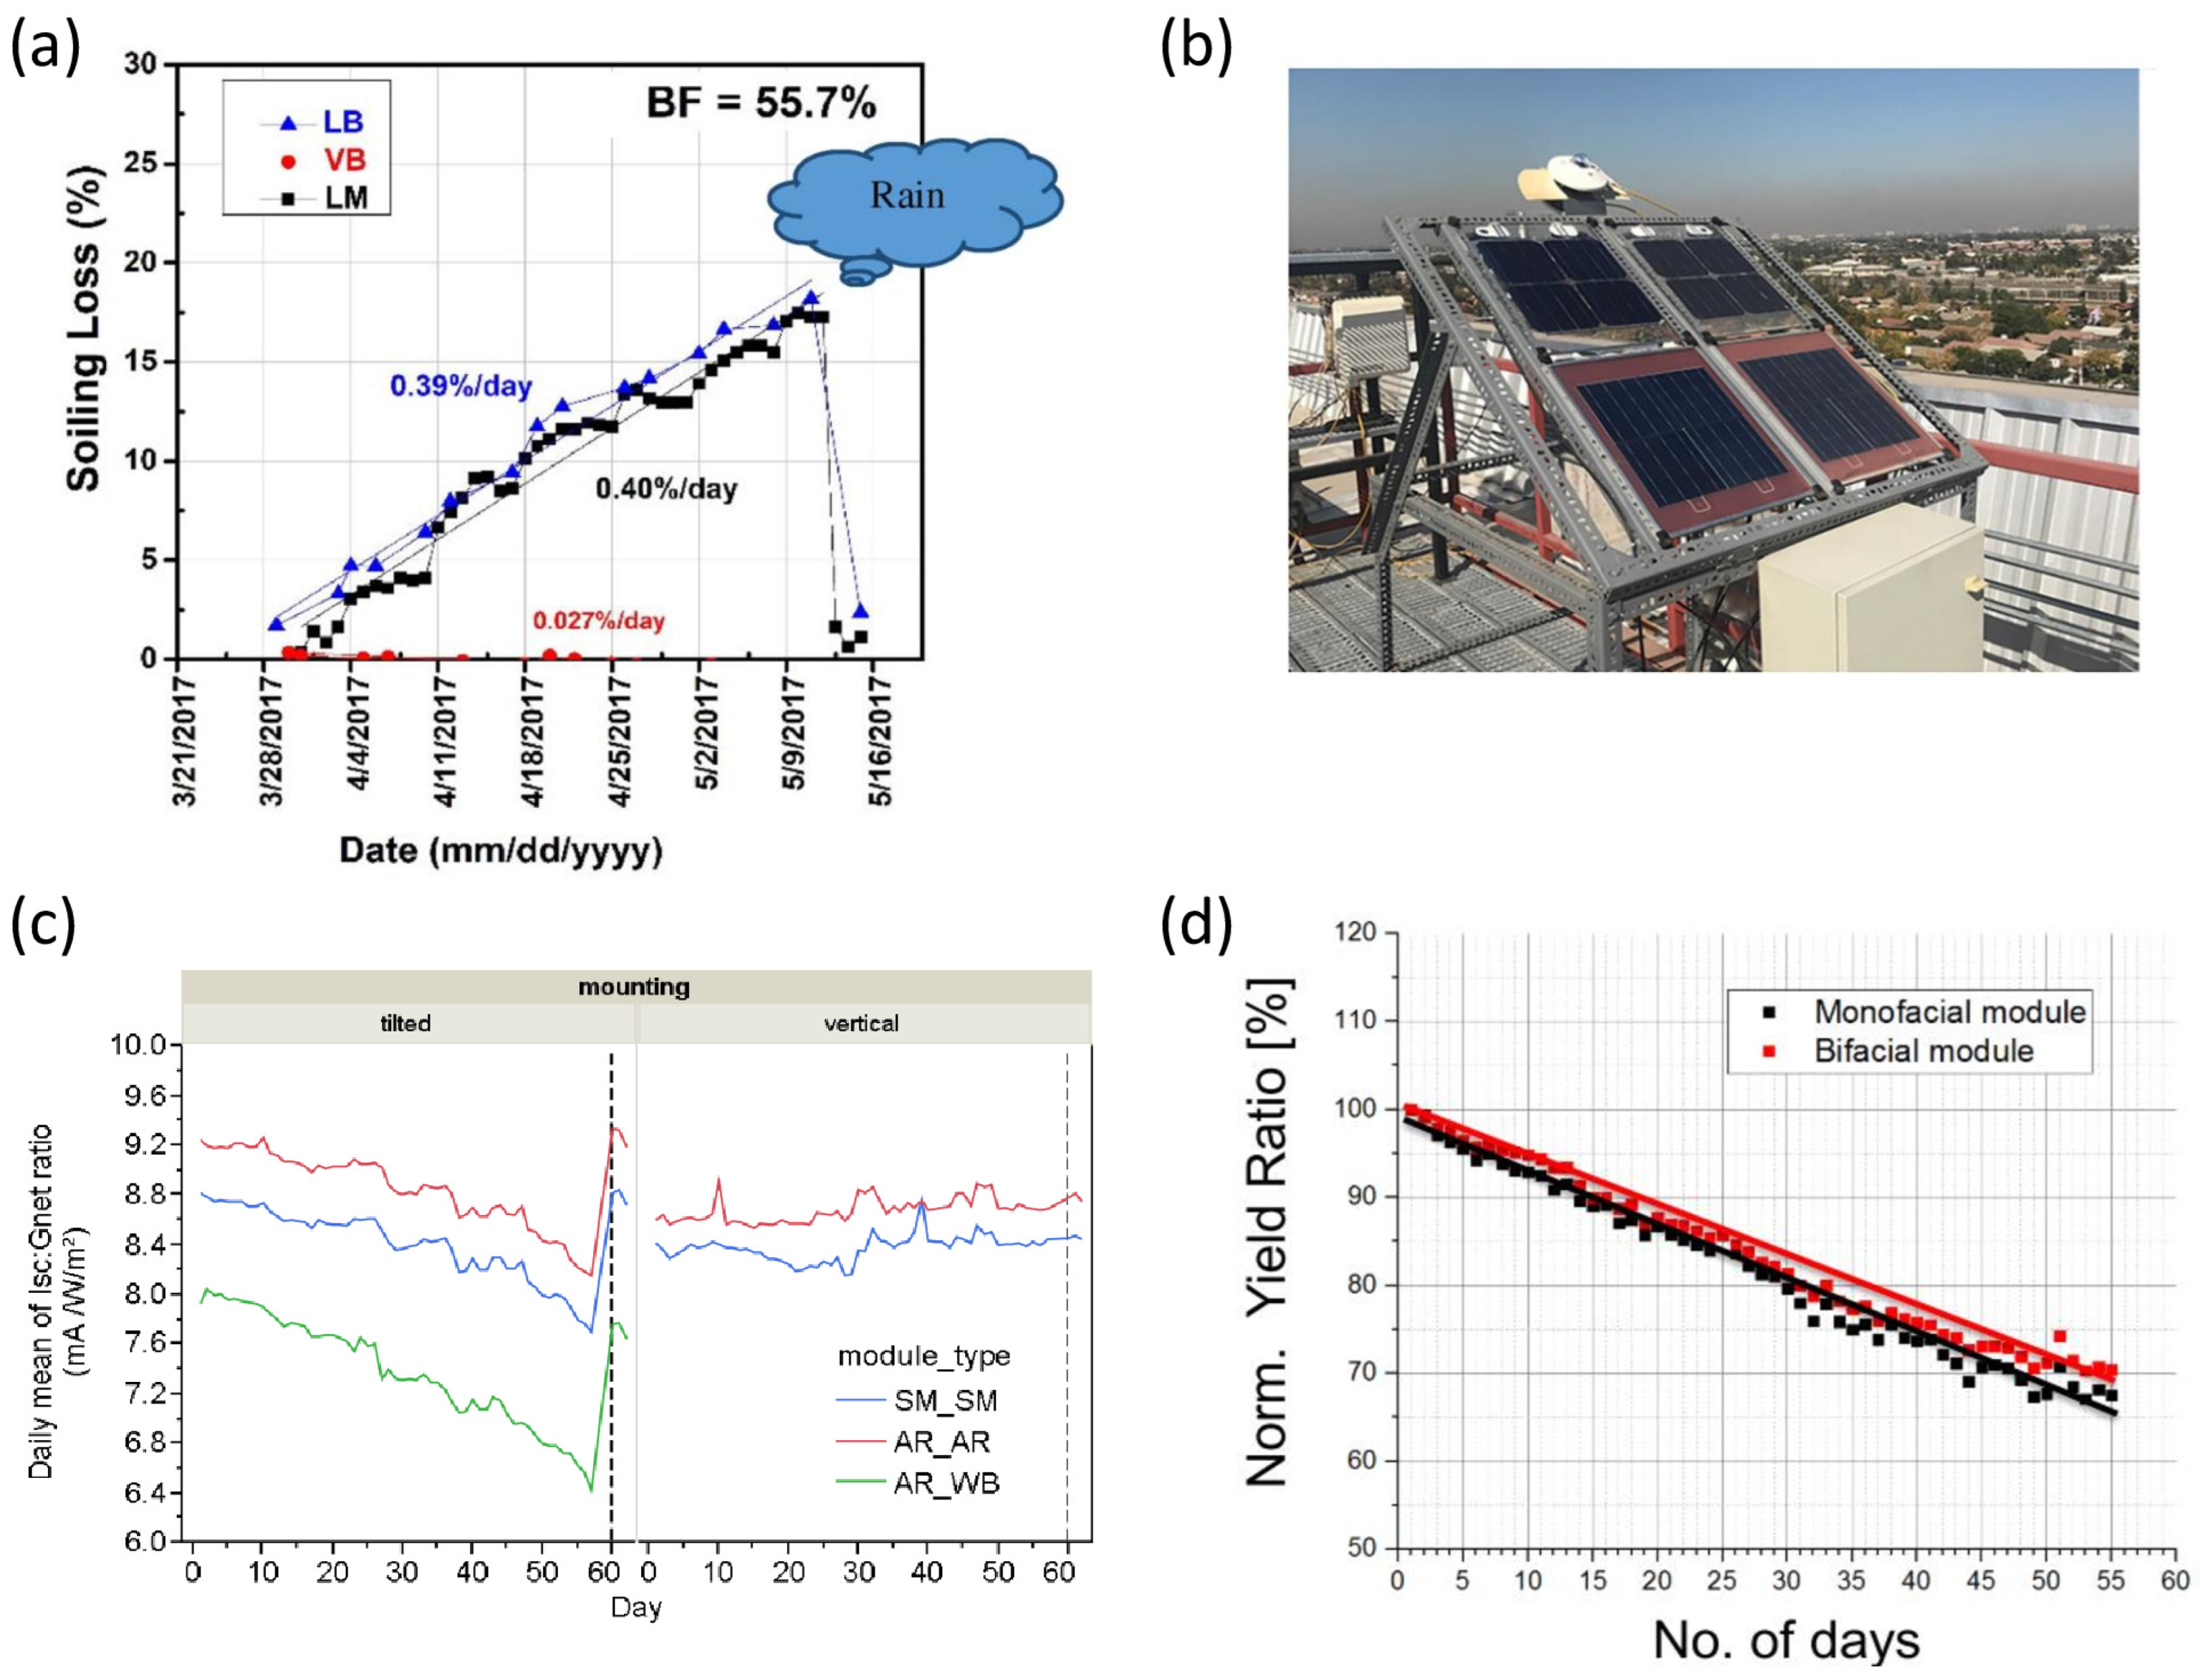
8. Effect of Soiling on Bifacial PV Modules
9. Impact of Soiling on Energy Cost and Power Production
10. Renewable Energy and Soiling within the Gulf Cooperation Council (GCC) Context
11. Conclusions
Funding
Acknowledgments
Conflicts of Interest
Abbreviations
| ΔSR | Soiling ratio | MENA | Middle East and North Africa |
| ADM | Accumulated dust mass | IRENA | International Renewable Energy Agency |
| DS | Dust storms | QEERI | Qatar Environment and Energy Research Institute |
| CI | Cleanness index | QMD | Qatar Meteorological Department |
| AR | Antireflection | OTF | outdoor test facility |
| OPEX | Operational expenditure | GCC | Gulf Cooperation Council |
| PM | Particulate Matter | QSTP | Qatar Science & Technology Park |
| ASC | Anti-soiling coating | TAMUQ | Texas A&M University in Qatar |
| DAR | Dust accumulation rate | SEM | Scanning Electron Microscopy |
| AOD | Aerosol Optical Depth | OSM | Outdoor soiling microscope |
| O&M | Operation & maintenance | XRD | X-ray Diffraction |
| CFD | Computational Fluid Dynamics | STF | Solar Test Facility |
| CSP | Concentrated Solar Power | kW | Kilowatt |
| DNI | Direct Normal Irradiance | PV | Photovoltaic |
| GHI | Global Horizontal Irradiance | HSAT | Horizontal single-axis trackers |
| DHI | Diffuse Horizontal Irradiation | PERC | Passivated Emitter and Rear Cell |
| TNI | Total Normal Irradiance | TOPCon | Tunnel oxide passivated contact |
| POA | Plane of Array | RH | Relative humidity |
| LCOE | The levelized cost of energy | WS | Wind speed |
| LED | Light emitting diode | WD | Wind direction |
| MFRSR | Multi-filter rotating shadow band radiometer | T | Temperature |
| CAMS | Copernicus Atmosphere Monitoring Service | T% | Transmittance |
| PTFE | Polytetrafluoroethylene | IR | Infrared |
| PCM | Phase change Material | VB | Vertical bifacial |
| LM | Latitude tilt monofacial | LB | Latitude tilt bifacial |
References
- Qasem, H.; Betts, T.; Müllejans, H.; AlBusairi, H.; Gottschalg, R. Dust Induced Shading on Photovoltaic Modules. Prog. Photovolt Res. Appl. 2014, 22, 218–226. [Google Scholar] [CrossRef] [Green Version]
- Sarver, T.; Al-Qaraghuli, A.; Kazmerski, L. Comprehensive Review of the Impact of Dust on the Use of Solar Energy: History, Investigations, Results, Literature, and Mitigation Approaches. Renew. Sustain. Energy Rev. 2013, 22, 698–733. [Google Scholar] [CrossRef]
- Sayyah, A.; Horenstein, M.N.; Mazumder, M.K. Energy yield loss caused by dust deposition on photovoltaic panels. Sol. Energy 2014, 107, 576–604. [Google Scholar] [CrossRef]
- Brown, K.; Narum, T.; Jing, N. Soiling Test Methods and their Use in Predicting Performance of Photovoltaic Modules in Soiling Environments. In Proceedings of the Conference Record of the IEEE Photovoltaic Specialists Conference, Austin, TX, USA, 3–8 June 2012. [Google Scholar] [CrossRef]
- Ahmad, Y.; Ghoneim, A. A new correlation between photovoltaic panel’s efficiency and amount of sand dust accumulated on their surface. Int. J. Sustain. Energy 2005, 24, 187–197. [Google Scholar]
- Molki, A. Dust affects solar-cell efficiency. Phys. Educ. 2010, 45, 456. [Google Scholar] [CrossRef]
- Elshobokshy, M.; Hussein, F. Degradation of photovoltaic cell performance due to dust deposition on to its surface. Renew. Energy 1993, 3, 585–590. [Google Scholar] [CrossRef]
- Figgis, B.; Ennaoui, A.; Ahzi, S.; Rémond, Y. Review of PV soiling particle mechanics in desert environments. Renew. Sustain. Energy Rev. 2017, 76, 872–881. [Google Scholar] [CrossRef]
- Figgis, B. Solar Test Facility in Doha, Qatar. 2016. Available online: https://www.researchgate.net/publication/309619145_Solar_Test_Facility_in_Doha_Qatar?channel=doi&linkId=581a3a5608ae30a2c01c9edf&showFulltext=true (accessed on 13 September 2021). [CrossRef]
- Bachour, D.; Perez-Astudillo, D. Deriving solar direct normal irradiance using lidar-ceilometer. Sol. Energy 2014, 110, 316–324. [Google Scholar] [CrossRef]
- Zheng, C.; Zhao, C.; Zhu, Y.; Wang, Y.; Shi, X.; Wu, X.; Chen, T.; Wu, F.; Qiu, Y. Analysis of influential factors for the relationship between PM2.5 and AOD in Beijing. Atmos. Chem. Phys. 2017, 17, 13473–13489. [Google Scholar] [CrossRef] [Green Version]
- Schaap, M.; Apituley, A.; Timmermans, R.; Koelemeijer, R.; de Leeuw, G. Exploring the relation between aerosol optical depth and PM2.5 at Cabauw, the Netherlands. Atmos. Chem. Phys. 2009, 9, 909–925. [Google Scholar] [CrossRef] [Green Version]
- Sioris, C.; Abboud, I.; Fioletov, V.; Mclinden, C. AEROCAN, the Canadian sub-network of AERONET: Aerosol monitoring and air quality applications. Atmos. Environ. 2017, 167, 444–457. [Google Scholar] [CrossRef]
- Srivastava, N. Association of modeled PM2.5 with aerosol optical depth: Model versus satellite. Nat. Hazards 2020, 102, 689–705. [Google Scholar] [CrossRef]
- Martín Pomares, L.; Polo, J.; Perez-Astudillo, D.; Bachour, D. Assessment of Daily Atmospheric Turbidity Databases Using Aerosol Optical Depth and Direct Normal Irradiance Measurements. In Proceedings of the Solar World Congress 2015, Daegu, Republic of Korea, 8–12 November 2015. [Google Scholar] [CrossRef]
- Bachour, D.P.-A. Dust impact on shortwave solar radiation: Case study of dust events in Doha, Qatar. In Proceedings of the 6th International Conference Energy & Meteorology, Copenhagen, Denmark, 24–27 June 2019. [Google Scholar]
- Benedetti, A.; Morcrette, J.; Boucher, O.; Dethof, A.; Engelen, R.; Fisher, M.; Flentjes, H.; Huneeus, N.; Jones, L.; Kaiser, J.; et al. Aerosol Analysis and Forecast in the ECMWF Integrated Forecast System: Data Assimilation; ECMWF Technical Memoranda: Boston, MA, USA, 2008. [Google Scholar]
- Benedetti, A.; Morcrette, J.; Boucher, O.; Dethof, A.; Engelen, R.; Fisher, M.; Flentjes, H.; Huneeus, N.; Jones, L.; Kaiser, J.; et al. Aerosol Analysis and Forecast in the ECMWF Integrated Forecast System: Forward Modelling; ECMWF Technical Memoranda: Boston, MA, USA, 2008. [Google Scholar]
- Bachour, D.; Perez-Astudillo, D.; Martín Pomares, L. Study of Soiling on Pyranometers in Desert Conditions. In Proceedings of the EuroSun 2016, Palma de Mallorca, Spain, 11–14 October 2016. [Google Scholar]
- Figgis, B.; Ennaoui, A.; Guo, B.; Javed, W.; Chen, E. Outdoor soiling microscope for measuring particle deposition and resuspension. Sol. Energy 2016, 137, 158–164. [Google Scholar] [CrossRef]
- Aïssa, B.; Scabbia, G.; Figgis, B.; Garcia-Lopez, J.; Bermudez Benito, V. PV-soiling field-assessment of Mars™ optical sensor operating in the harsh desert environment of the state of Qatar. Sol. Energy 2022, 239, 139–146. [Google Scholar] [CrossRef]
- Aïssa, B.; Isaifan, R.; Madhavan, V.E.; Abdallah, A. Structural and physical properties of the dust particles in Qatar and their influence on the PV panel performance. Sci. Rep. 2016, 6, 31467. [Google Scholar] [CrossRef] [Green Version]
- Chen, G.; Ziemba, L.D.; Chu, D.A.; Thornhill, K.L.; Schuster, G.L.; Winstead, E.L.; Diskin, G.S.; Ferrare, R.A.; Burton, S.P.; Ismail, S.; et al. Observations of Saharan dust microphysical and optical properties from the Eastern Atlantic during NAMMA airborne field campaign. Atmos. Chem. Phys. Discuss. 2010, 11, 723–740. [Google Scholar] [CrossRef] [Green Version]
- Reid, E.A.; Reid, J.S.; Meier, M.M.; Dunlap, M.R.; Cliff, S.S.; Broumas, A.; Perry, K.; Maring, H. Characterization of African dust transported to Puerto Rico by individual particle size segregated bulk analysis. J. Geophys. Res. 2003, 108, 8591. [Google Scholar] [CrossRef]
- Yilbas, B.S.; Ali, H.; Khaled, M.M.; Al-Aqeeli, N.; Abu-Dheir, N.; Varanasi, K.K. Influence of dust and mud on the optical, chemical, and mechanical properties of a PV protective glass. Sci. Rep. 2015, 5, 15833. [Google Scholar] [CrossRef] [Green Version]
- Coz, E.; Gómez-Moreno, F.; Casuccio, G.; Artíñano, B. Variations on morphology and elemental composition of mineral dust particles from local, regional, and long-range transport meteorological scenarios. J. Geophys. Res. 2010, 115, D12204. [Google Scholar] [CrossRef]
- Engelbrecht, J.; Moosmüller, H.; Pincock, S.; Jayanty, R.M.; Lersch, T.; Casuccio, G. Technical Note: Mineralogical, chemical, morphological, and optical interrelationships of mineral dust re-suspensions. Atmos. Chem. Phys. Discuss. 2016, 16, 10809–10830. [Google Scholar] [CrossRef] [Green Version]
- Al-Hasan, A.Y. A new correlation for direct beam solar radiation received by photovoltaic panel with sand dust accumulated on its surface. Sol. Energy 1998, 11, 323–333. [Google Scholar] [CrossRef]
- Bukowiecki, N.; Lienemann, P.; Hill, M.; Furger, M.; Richard, A.; Amato, F.; Prévôt, A.; Baltensperger, U.; Buchmann, B.; Gehrig, R. PM10 emission factors for non-exhaust particles generated by road traffic in an urban street canyon and along a freeway in Switzerland. Atmos. Environ. 2010, 44, 2330–2340. [Google Scholar] [CrossRef]
- Li, T.-C.; Yuan, C.-S.; Huang, H.-C.; Lee, C.-L.; Wu, S.-P.; Tong, C. Inter-comparison of Seasonal Variation, Chemical Characteristics, and Source Identification of Atmospheric Fine Particles on Both Sides of the Taiwan Strait. Sci. Rep. 2016, 6, 22956. [Google Scholar] [CrossRef] [PubMed] [Green Version]
- Ma, M.M.; Liu, X.M.; Pillans, B.; Li, P.Y.; Lu, B.; Hu, S.Y. Magnetic properties particle-size analysis of dust-storm samples collected in Lanzhou Sydney. Aust. J. Earth Sci. 2014, 61, 765–774. [Google Scholar] [CrossRef]
- Micheli, L.; Muller, M. An investigation of the key parameters for predicting PV soiling losses. Prog. Photovolt. Res. Appl. 2017, 25, 291–307. [Google Scholar] [CrossRef]
- Perlwitz, J.; Pérez García-Pando, C.; Miller, R. Predicting the mineral composition of dust aerosols—Part 1: Representing key processes. Atmos. Chem. Phys. 2015, 15, 11593–11627. [Google Scholar] [CrossRef] [Green Version]
- Lawrence, C.; Neff, J. The contemporary physical and chemical flux of Aeolian dust: A synthesis of direct measurements of dust deposition. Chem. Geol. 2009, 267, 46–63. [Google Scholar] [CrossRef]
- Ilse, K.; Figgis, B.; Naumann, V.; Hagendorf, C.; Bagdahn, J. Fundamentals of soiling processes on photovoltaic modules. Renew. Sustain. Energy Rev. 2018, 98, 239–254. [Google Scholar] [CrossRef]
- García, M.; Marroyo, L.; Pigueiras, E.; Perez, M. Soiling and other optical losses in solar-tracking PV plants in Navarra. Prog. Photovolt. Res. Appl. 2011, 19, 211–217. [Google Scholar] [CrossRef] [Green Version]
- Rollingwash. Efficient and wWater-Saving Cleaning of the PV Solar Systems with TF-4 Technology I. General Problems of Solar Systems Cleaning. Available online: https://docplayer.net/42360656-Efficient-and-water-saving-cleaning-of-the-pv-solar-systems-with-tf-4-technology.html (accessed on 9 January 2021).
- Kimber, A.; Mitchell, L.; Nogradi, S.; Wenger, H. The Effect of Soiling on Large Grid-Connected Photovoltaic Systems in California and the Southwest Region of the United States. In Proceedings of the Conference Record of the 2006 IEEE 4th World Conference on Photovoltaic Energy Conversion, Waikoloa, HI, USA, 7–12 May 2006; Volume 2. [Google Scholar]
- Figgis, B.; Guo, B.; Javed, W.; Ilse, K.; Ahzi, S.; Remond, Y. Time-of-day and Exposure Influences on PV Soiling. In Proceedings of the International Renewable and Sustainable Energy Conference, Tangier, Morocco, 4–7 December 2017. [Google Scholar] [CrossRef]
- Ilse, K.; Micheli, L.; Figgis, B.W.; Lange, K.; Daßler, D.; Hanifi, H.; Wolfertstetter, F.; Naumann, V.; Hagendorf, C.; Gottschalg, R.; et al. Techno-Economic Assessment of Soiling Losses and Mitigation Strategies for Solar Power Generation. Joule 2019, 3, 2303–2321. [Google Scholar] [CrossRef] [Green Version]
- Isaifan, R.; Johnson, D.; Ackermann, L.; Figgis, B.; Ayoub, M. Evaluation of the adhesion forces between dust particles and photovoltaic module surfaces. Sol. Energy Mater. Sol. Cells 2019, 191, 413–421. [Google Scholar] [CrossRef]
- Aramrak, S.; Flury, M.; Harsh, J. Detachment of Deposited Colloids by Advancing and Receding Air-Water Interfaces. Langmuir 2011, 27, 9985–9993. [Google Scholar] [CrossRef] [PubMed]
- Quan, Y.-Y.; Zhang, L.-Z.; Qi, R.-H.; Cai, R. Self-cleaning of Surfaces: The Role of Surface Wettability and Dust Types. Sci. Rep. 2016, 6, 38239. [Google Scholar] [CrossRef] [Green Version]
- Pitois, O.; Chateau, X. Small Particle at a Fluid Interface: Effect of Contact Angle Hysteresis on Force and Work of Detachment. Langmuir 2002, 18, 9751–9756. [Google Scholar] [CrossRef]
- Butt, H.-J.; Kappl, M. Normal capillary forces. Adv. Colloid Interface Sci. 2008, 146, 48–60. [Google Scholar] [CrossRef]
- Moutinho, H.; Jiang, C.-S.; To, B.; Perkins, C.; Muller, M.; Al-Jassim, M.; Simpson, L. Adhesion mechanisms on solar glass: Effects of relative humidity, surface roughness, and particle shape and size. Sol. Energy Mater. Sol. Cells 2017, 172, 145–153. [Google Scholar] [CrossRef]
- Visser, J. Adhesion of colloidal particles. Surf. Colloid Sci. 1976, 8, 3–79. [Google Scholar]
- Cleaver, J.; Tyrrell, J. The Influence of Relative Humidity on Particle Adhesion—A Review of Previous Work and the Anomalous Behaviour of Soda-lime Glass. KONA Powder Part. J. 2004, 22, 9–22. [Google Scholar] [CrossRef] [Green Version]
- Figgis, B.; Nouviaire, A.; Wubulikasimu, Y.; Javed, W.; Guo, B.; Ait-Mokhtar, A.; Belarbi, R.; Ahzi, S.; Rémond, Y.; Ennaoui, A. Investigation of factors affecting condensation on soiled PV modules. Sol. Energy 2018, 159, 488–500. [Google Scholar] [CrossRef]
- Ilse, K.K.; Figgis, B.W.; Werner, M.; Naumann, V.; Hagendorf, C.; Pöllmann, H.; Bagdahn, J. Comprehensive analysis of soiling and cementation processes on PV modules in Qatar. Sol. Energy Mater. Sol. Cells 2018, 186, 309–323. [Google Scholar] [CrossRef]
- Mazumder, M.K.; Horenstein, M.N.; Heiling, C.; Stark, J.W.; Sayyah, A.; Yellowhair, J.; Raychowdhury, A. Environmental Degradation of the Optical Surface of PV Modules and Solar Mirrors by Soiling and High RH and Mitigation Methods for Minimizing Energy Yield Losses. In Proceedings of the IEEE 42nd Photovoltaic Specialist Conference (PVSC), New Orleans, LA, USA, 14–19 June 2015. [Google Scholar] [CrossRef]
- Javed, W.; Guo, B.; Figgis, B. Modeling of photovoltaic soiling loss as a function of environmental variables. Sol. Energy 2017, 157, 397–407. [Google Scholar] [CrossRef]
- Heck, M.; Köhl, M. Simulation of Water Vapor Ingress into PV-Modules under Different Climatic Conditions. J. Mater. 2013, 2013, 1–7. [Google Scholar]
- Lombardo, T.; Ionescu, A.; Chabas, A.; Lefèvre, R.A.; Ausset, P.; Candau, Y. Dose–response function for the soiling of silica–soda–lime glass due to dry deposition. Sci. Total Environ. 2009, 408, 976–984. [Google Scholar] [CrossRef] [PubMed]
- Ilse, K.; Khan, M.; Naumann, V.; Hagendorf, C. Dew as a Detrimental Influencing Factor for Soiling of PV Modules. IEEE J. Photovolt. 2018, 9, 287–294. [Google Scholar] [CrossRef]
- Cuddihy, E. Theoretical considerations of soil retention. Sol. Energy Mater. 1980, 3, 21–33. [Google Scholar] [CrossRef]
- Mani, M.; Pillai, R. Impact of dust on solar photovoltaic (PV) performance: Research status, challenges and recommendations. Renew. Sustain. Energy Rev. 2010, 14, 3124–3131. [Google Scholar] [CrossRef]
- Kazmerski, L.L.; Diniz, A.S.A.; Maia, C.B.; Viana, M.M.; Costa, S.C.; Brito, P.P.; Campos, C.D.; Neto, L.V.M.; Hanriot, S.D.M.; Cruz, L.R.D.O. Fundamental studies of the adhesion of dust to PV module chemical and physical relationships at the microscale. IEEE J. Photovolt. 2015, 6, 719–729. [Google Scholar] [CrossRef]
- Ilse, K.; Werner, M.; Naumann, V.; Figgis, B.W.; Hagendorf, C.; Bagdahn, J. Microstructural analysis of the cementation process during soiling on glass surfaces in arid and semi-arid climates. Phys. Status Solidi-Rapid Res. Lett. 2016, 10, 525–529. [Google Scholar] [CrossRef]
- Perkins, C.L.; Muller, M.; Simpson, L. Laboratory Studies of Particle Cementation and PV module Soiling. In Proceedings of the 2017 IEEE 44th Photovoltaic Specialist Conference (PVSC), Washington, DC, USA, 25–30 June 2017; pp. 2294–2297. [Google Scholar] [CrossRef]
- Figgis, B.; Goossens, D.; Guo, B.; Ilse, K. Effect of tilt angle on soiling in perpendicular wind. Sol. Energy 2019, 194, 294–301. [Google Scholar] [CrossRef]
- Smith, K.; Goossens, D. Wind tunnel simulations of aeolian dust deposition on thermic solar collectors. Appl. Sol. Energy (Engl. Transl. Geliotekhnika) 1995, 31, 75–89. [Google Scholar]
- Goossens, D. Soiling of Photovoltaic Modules: Size Characterization of the Accumulated Dust. J. Clean Energy Technol. 2019, 7, 25–31. [Google Scholar] [CrossRef]
- Jaszczur, M.; Koshti, A.; Nawrot, W.; Sędor, P. An investigation of the dust accumulation on photovoltaic panels. Environ. Sci. Pollut. Res. 2020, 27, 2001–2014. [Google Scholar] [CrossRef]
- Javed, W.; Yiming, W.; Figgis, B.; Guo, B. Characterization of dust accumulated on photovoltaic panels in Doha, Qatar. Sol. Energy 2017, 142, 123–135. [Google Scholar] [CrossRef]
- Mastekbayeva, G.; Kumar, S. Effect of dust on the transmittance of low-density polyethylene glazing in a tropical climate. Sol. Energy 2000, 68, 135–141. [Google Scholar] [CrossRef]
- Elminir, H.K.; Ghitas, A.E.; Hamid, R.; El-Hussainy, F.; Beheary, M.; Abdel-Moneim, K.M. Effect of dust on the transparent cover of solar collectors. Energy Convers. Manag. 2006, 47, 3192–3203. [Google Scholar] [CrossRef]
- Hegazy, A. Effect of dust accumulation on solar transmittance through glass covers of plate-type collectors. Renew. Energy 2001, 22, 525–540. [Google Scholar] [CrossRef]
- Alnaser, N.W.; Dakhel, A.A.; Al Othman, M.J.; Batarseh, I.; Lee, J.K.; Najmaii, S.; Alnaser, W.E. Dust Accumulation Study on the Bapco 05 MW p PVProject at University of Bahrain. Int. J. Power Energy Syst. 2015, 2, 35–54. [Google Scholar]
- Tanesab, J.; Parlevliet, D.; Whale, J.; Urmee, T. The effect of dust with different morphologies on the performance degradation of photovoltaic modules. Sustain. Energy Technol. Assess. 2019, 31, 347–354. [Google Scholar] [CrossRef]
- Javed, W.; Guo, B.; Figgis, B.; Aïssa, B. Dust potency in the context of solar photovoltaic (PV) soiling loss. Sol. Energy 2021, 220, 1040–1052. [Google Scholar] [CrossRef]
- Besson, P.; Munoz, C.; Ramirez-Sagner, G.; Salgado, M.; Escobar, R.; Platzer, W. Long-Term Soiling Analysis for Three Photovoltaic Technologies in Santiago Region. IEEE J. Photovolt. 2017, 7, 1755–1760. [Google Scholar] [CrossRef]
- Javed, W.; Guo, B.; Figgis, B.; Pomares, L.M.; Aïssa, B. Multi-year field assessment of seasonal variability of photovoltaic soiling and environmental factors in a desert environment. Sol. Energy 2020, 211, 1392–1402. [Google Scholar] [CrossRef]
- Mondal, S.; Mondal, A.K.; Sharma, A.; Devalla, V.; Rana, S.; Kumar, S.; Pandey, J.K. An Overview of Cleaning and Prevention Processes for Enhancing Efficiency of Solar Photovoltaic Panels. Curr. Sci. 2018, 115, 1065–1077. [Google Scholar] [CrossRef]
- Einhorn, A.; Micheli, L.; Miller, D.C.; Simpson, L.J.; Moutinho, H.R.; To, B.; Lanaghan, C.L.; Muller, M.T.; Toth, S.; John, J.J.; et al. Evaluation of Soiling Potential Mitigation Approaches on Photovoltaic Glass. IEEE J. Photovolt. 2018, 9, 233–239. [Google Scholar] [CrossRef]
- Gallagher, B. Rise of the Machines: Solar Module-Washing Robots. 2018. Available online: https://www.woodmac.com/our-expertise/focus/Power--Renewables/rise-of-the-machines-solar-module-washing-robots/ (accessed on 13 September 2021).
- Maghami, M.R.; Hizam, H.; Gomes, C.; Radzi, M.A.; Rezadad, M.I.; Hajighorbani, S. Power loss due to soiling on solar panel: A review. Renew. Sustain. Energy Rev. 2016, 59, 1307–1316. [Google Scholar]
- Alghamdi, A.S.; Bahaj, A.S.; Blunden, L.S.; Wu, Y. Dust Removal from Solar PV Modules by Automated Cleaning Systems. Energies 2019, 12, 2923. [Google Scholar] [CrossRef] [Green Version]
- Hossain, M.I.; Ali, A.; Bermudez Benito, V.; Figgis, B.; Aïssa, B. Anti-Soiling Coatings for Enhancement of PV Panel Performance in Desert Environment: A Critical Review and Market Overview. Materials 2022, 15, 7139. [Google Scholar] [CrossRef]
- Costa, S.; Cardoso Diniz, A.S.; Kazmerski, L. Solar energy dust and soiling R&D progress: Literature review update for 2016. Renew. Sustain. Energy Rev. 2017, 82, 2504–2536. [Google Scholar]
- Costa, S.; Cardoso Diniz, A.S.; Kazmerski, L. Dust and soiling issues and impacts relating to solar energy systems: Literature review update for 2012–2015. Renew. Sustain. Energy Rev. 2016, 63, 33–61. [Google Scholar] [CrossRef] [Green Version]
- Alkandary, A.T.; Al-Asfour, F.G.A. Comparative Assessment of Anti-soiling Nanocoated Photovoltaic Modules in an Arid Desert Environment. In Proceedings of the 35th European Photovoltaic Solar Energy Conference and Exhibition, Brussels, Belgium, 24–28 September 2018. [Google Scholar]
- Brito, P.P.; Diniz, A.S.; Kazmerski, L.L. Materials design and discovery: Potential for application to soiling mitigation in photovoltaic systems. Sol. Energy 2019, 183, 791–804. [Google Scholar] [CrossRef]
- Abrams, Z.; Gonsalves, P.; Brophy, B.; Posbic, J. Field and Lab Verification of Hydrophobic Anti-Reflective and Anti-Soiling Coatings on Photovoltaic Glass. In Proceedings of the 29th European Photovoltaic Solar Energy Conference and Exhibition, Amsterdam, The Netherlands, 22–26 September 2014; pp. 2759–2764. [Google Scholar] [CrossRef]
- Bahattab, M.A.; Alhomoudi, I.A.; Alhussaini, M.I.; Mirza, M.; Hegmann, J.; Glaubitt, W.; Löbmann, P. Anti-soiling surfaces for PV applications prepared by sol-gel processing: Comparison of laboratory testing and outdoor exposure. Sol. Energy Mater. Sol. Cells 2016, 157, 422–428. [Google Scholar] [CrossRef]
- Brophy, B.; Abrams, Z.; Gonsalves, P.; Christy, K. Field Performance and Persistance of Anti-Soiling Coatings on Photovoltaic Glass. In Proceedings of the 31st European Photovoltaic Solar Energy Conference and Exhibition, Hamburg, Germany, 14–18 September 2015. [Google Scholar]
- Ilse, K.; Khan, M.Z.; Voicu, N.; Naumann, V.; Hagendorf, C.; Bagdahn, J. Advanced performance testing of anti-soiling coatings—Part II: Particle-size dependent analysis for physical understanding of dust removal processes and determination of adhesion forces. Sol. Energy Mater. Sol. Cells 2019, 202, 110049. [Google Scholar] [CrossRef]
- Ferretti, N.; Ilse, K.; Sönmez, A.; Hagendorf, C.; Berghold, J. Investigation on the Impact of Module Cleaning on the Antireflection Coating. In Proceedings of the 32nd European Photovoltaic Solar Energy Conference and Exhibition, Munich, Germany, 20–24 June 2016. [Google Scholar] [CrossRef]
- Wilke, K.; Preston, D.; Lu, Z.; Wang, E. Toward Condensation-Resistant Omniphobic Surfaces. ACS Nano 2018, 12, 11013–11021. [Google Scholar] [CrossRef] [PubMed]
- Isbilir, K.; Lisco, F.; Womack, G.; Abbas, A.; Walls, J. Testing of an Anti-Soiling Coating for PV Module Cover Glass. In Proceedings of the 2018 IEEE 7th World Conference on Photovoltaic Energy Conversion (WCPEC) (A Joint Conference of 45th IEEE PVSC, 28th PVSEC & 34th EU PVSEC, Waikoloa, HI, USA, 10–15 June 2018. [Google Scholar] [CrossRef] [Green Version]
- Toth, S.; Muller, M.; Miller, D.C.; Moutinho, H.; To, B.; Micheli, L.; Linger, J.; Engtrakul, C.; Einhorn, A.; Simpson, L. Soiling and cleaning: Initial observations from 5-year photovoltaic glass coating durability study. Sol. Energy Mater. Sol. Cells 2018, 185, 375–384. [Google Scholar] [CrossRef]
- Ilse, K.K.; Rabanal, J.; Schonleber, L.; Khan, M.Z.; Naumann, V.; Hagendorf, C.; Bagdahn, J. Comparing Indoor Outdoor Soiling Experiments for Different Glass Coatings Microstructural Analysis of Particle Caking Processes. IEEE J. Photovolt. 2018, 8, 203–209. [Google Scholar] [CrossRef]
- Steensma, G.; Román, R.; Marshall, C.; Bermejo, J.; Iyer, K.; Al-Hajraf, S.; Al-Qattan, A. Shagaya renewable energy park project. In Proceedings of the 24th SolarPACES International Conference, Casablanca, Morocco, 2–5 October 2018; Volume 2126. [Google Scholar]
- PV Cleaning Solution Company NOMADD Desert Solar Solutions Secures Funding Round from Saudi Arabian Investor CEPCO. 2018. Available online: http://www.nomaddesertsolar.com/news (accessed on 15 October 2020).
- Albadwawi, O.; John, J.; Elhassan, Y.; Albanna, F.; Almamari, F.; Alqassim, A.; Alnuaimi, A. Quantification of spectral losses of Natural soiling and detailed microstructural analysis of Dust collected from Different locations in Dubai, UAE. In Proceedings of the 2019 IEEE 46th Photovoltaic Specialists Conference (PVSC), Chicago, IL, USA, 16–21 June 2019. [Google Scholar] [CrossRef]
- Figgis, B. QEERI Solar Test Facility 5-Year Report; Qatar Environment and Energy Research Institute: Ar-Rayyan, Qatar, 2018. [Google Scholar] [CrossRef]
- Nitz, P. Investigations into Soiling and Degradation. Available online: https://www.ise.fraunhofer.de/en/business-areas/photovoltaics/iii-v-and-concentrator-photovoltaics/concentrator-optics/investigations-into-soiling-and-degradation.html (accessed on 3 March 2021).
- Simpson, L.J.; Muller, M.; Deceglie, M.; Moutinho, H.; Perkins, C.; Jiang, C.S.; Miller, D.C.; Micheli, L.; Tamizhmani, G.; Tatapudi, S.R.V.; et al. NREL Efforts to Address Soiling on PV Modules. In Proceedings of the 2017 IEEE 44th Photovoltaic Specialist Conference (PVSC), Washington, DC, USA, 25–30 June 2017; pp. 2789–2793. [Google Scholar] [CrossRef] [Green Version]
- Cabrera, E.; Araya, F.; Schneider, A.; Marzo, A.; Roescu, R.; Rabanal, J.; Ferrada, P.; Ayala, P.; Berrian, D.; Libal, J.; et al. AtaMoS-TeC Project: The bifacial institute for desert PV. In Proceedings of the Bifi PV Workshop, Denver, CO, USA, 10–11 September 2018. [Google Scholar]
- King, B. Overview of Sandia’s Soiling Program: Experimental Methods and Framework for a Quantitative Soiling Model. Sandia National Laboratories Internal Report, Published on 22 October 2015. Available online: https://www.osti.gov/servlets/purl/1331410 (accessed on 2 February 2020).
- Welcome to PVReliability.org Our Collaborative R&D Program Aimed at Ensuring the Reliability of Solar PV Systems. Available online: http://www.pvreliability.org/ (accessed on 4 March 2021).
- Institute of Solar Research in the EU-Funded Project WASCOP: Soiling Prediction Model, Tests of mirror Coatings and Innovative Cleaning Methods for Solar Mirrors. 2016. Available online: https://www.dlr.de/sf/en/desktopdefault.aspx/tabid-10436/20174_read-47350/ (accessed on 4 March 2021).
- Herrmann, W. Impact of Soiling on PV Module Performance for Various Climates. In Proceedings of the 4th PV Performance Modelling and Monitoring Workshop, Cologne, Germany, 22–23 October 2015. [Google Scholar]
- Soiling: Task Group 12. Available online: https://www.pvqat.org/project-status/task-group-12.html (accessed on 4 March 2021).
- Available online: https://cost-indust.eu/the-action/working-groups (accessed on 6 April 2021).
- Empowering Solar World Leader in Robotic Solar Cleaning. Available online: https://www.ecoppia.com/ (accessed on 6 April 2021).
- Automatic and Semiautomatic Portable Washing Systems for PV Plants. Available online: http://www.washpanel.com/en/ (accessed on 6 April 2021).
- ERICWESOFF; HT SunPower Cleans up Solar with Acquisition of Greenbotics. 2013. Available online: https://www.greentechmedia.com/articles/read/sunpower-cleans-up-solar-with-acquisiton-of-greenbotics (accessed on 6 April 2021).
- First Solar Rooftop in the UAE with 100% Robotic Maintenance Is Completed. 2019. Available online: http://www.mesia.com/2019/02/18/first-solar-rooftop-in-the-uae-with-100-robotic-maintenance-is-completed/ (accessed on 29 January 2021).
- Available online: https://www.serbot.ch/en/ (accessed on 29 January 2021).
- Solar Panel Automatic Cleaning Robot with Self-Propelling Guide Rail (the World’s First). 2014. Available online: https://www.skyrobot.co.jp/en/solrider.html (accessed on 28 January 2021).
- Solar Hybrid Technology. Available online: https://www.enerwhere.com/technology (accessed on 28 January 2021).
- BladeRanger Autonomous Cleaning and Inspection of Solar Power Installations: Let the Sunshine In! Available online: https://bladeranger.com/ (accessed on 11 January 2021).
- Wolfertstetter, F.; Fonk, R.; Prahl, C.; Röger, M.; Wilbert, S.; Fernández-Reche, J. Airborne soiling measurement of entire solar fields with Qfly. In Proceedings of the International Conference on Concentrating Solar Power and Chemical Energy Systems, Daegu, South Korea, 1–4 October 2019. [Google Scholar]
- SMP100 Solar-Module Performance Monitoring System. Available online: https://www.campbellsci.com/smp100 (accessed on 3 May 2021).
- DustIQ Soiling Monitoring System. Available online: https://www.kippzonen.com/Product/419/DustIQ-Soiling-Monitoring-System (accessed on 9 January 2022).
- Available online: https://norcalcontrols.net/ (accessed on 9 January 2022).
- Mars Optical Soiling Sensor—Revolutionary New Product. Available online: http://www.atonometrics.com/mars-optical-soiling-sensor-revolutionary-new-product/ (accessed on 9 January 2022).
- Soiling Measurement KIT. Available online: https://www.kintech-engineering.com/catalogue/soiling-measurement-kit/soiling-measurement-kit/ (accessed on 9 January 2022).
- Quantifying Solar O&M’S Dirty Side. Available online: https://europe.solar-asset.management/new-updates-source/2017/10/19/quantifying-solar-oms-dirty-side (accessed on 9 January 2022).
- Solar Energy 3.0. Available online: https://www.innoenergy.com/discover-innovative-solutions/sustainable-products-services/electricity-heat-production/solar-pv/solar-energy-30/ (accessed on 9 January 2022).
- Available online: https://trackso.in/ (accessed on 9 January 2022).
- CHRIS COWELL. Anti-Soiling Coating That Can Increase Solar Panel Output Heads to Commercial Deployment. 2019. Available online: https://solarbuildermag.com/products/anti-soiling-coating-that-can-increase-solar-panel-output-heads-to-commercial-deployment/ (accessed on 1 February 2022).
- Anti-Soiling Coatings. Available online: https://www.dsm.com/dsm-in-solar/en_US/technologies/anti-soiling-coatings-for-solar-glass.html (accessed on 1 February 2022).
- Nano-Coatings for Water Control Moisture·Condensation·Wetting. Available online: https://lotusleafcoatings.com/ (accessed on 10 June 2021).
- Figgis, B.; Ilse, K. Anti-Soiling Potential of 1-Axis PV Trackers. 2019. Available online: https://www.eupvsec-proceedings.com/proceedings?paper=48143 (accessed on 6 February 2021). [CrossRef]
- Gu, W.; Ma, T.; Ahmed, S.; Zhang, Y.; Peng, J. A comprehensive review and outlook of bifacial photovoltaic (bPV) technology. Energy Convers. Manag. 2020, 223, 113283. [Google Scholar] [CrossRef]
- Guo, S. Vertically mounted bifacial photovoltaic modules: A global analysis. Energy 2013, 61, 447–454. [Google Scholar] [CrossRef]
- Ito, M.; Gerritsen, E. Geographical Mapping of the Performance of Vertically Installed Bifacial Modules. In Proceedings of the 32nd European Photovoltaic Solar Energy Conference and Exhibition, Munich, Germany, 20–24 June 2016. [Google Scholar]
- Kopecek, R.; Libal, J. Towards large-scale deployment of bifacial photovoltaics. Nat. Energy 2018, 3, 443–446. [Google Scholar] [CrossRef]
- Ullah, A.; Amin, A.; Kazmi, T.; Saleem, M.; Butt, N. Investigation of soiling effects, dust chemistry and optimum cleaning schedule for PV modules in Lahore, Pakistan. Renew. Energy 2020, 150, 456–468. [Google Scholar] [CrossRef]
- Rabanal Arabach, J.; Schneider, A.; Mrcarica, M.; Kopecek, R.; Heckmann, M. The Need of Frameless Mounting Structures for Vertical Mounting of Bifacial PV Modules. In Proceedings of the 32nd EU PVSEC, Munich, Germany, 20–24 June 2016. [Google Scholar] [CrossRef]
- Bhaduri, S.; Kottantharayil, A. Mitigation of Soiling by Vertical Mounting of Bifacial Modules. IEEE J. Photovolt. 2018, 9, 240–244. [Google Scholar] [CrossRef]
- Luque, E.; Antonanzas, F.; Escobar, R. Effect of soiling in bifacial PV modules and cleaning schedule optimization. Energy Convers. Manag. 2018, 174, 615–625. [Google Scholar] [CrossRef]
- Dassler, D.; Malik, S.; Figgis, B.; Bagdahn, J.; Ebert, M. Bifacial gain simulations of modules and systems under desert conditions. In Proceedings of the 4th bifi PV Workshop, Konstanz, Germany, 25–26 October 2017. [Google Scholar]
- Rodríguez-Gallegos, C.D.; Liu, H.; Gandhi, O.; Singh, J.P.; Krishnamurthy, V.; Kumar, A.; Stein, J.S.; Wang, S.; Li, L.; Reindl, T.; et al. Global Techno-Economic Performance of Bifacial and Tracking Photovoltaic Systems. Joule 2020, 4, 1514–1541. [Google Scholar] [CrossRef]
- Cabrera, E.; Araya, F.; Schneider, A.; Marzo, A.; Roescu, R.; Rabanal, J.; Ferrada, P.; Ayala, P.; Berrian, D.; Libal, J.; et al. AtaMoS TeC Project: Soiling Impact on Bifacial Modules with Different Mounting Geometry in the Atacama Desert in Chile. In Proceedings of the 2018 IEEE 7th World Conference on Photovoltaic Energy Conversion (WCPEC) (A Joint Conference of 45th IEEE PVSC, 28th PVSEC & 34th EU PVSEC), Waikoloa, HI, USA, 10–15 June 2018. [Google Scholar] [CrossRef]
- Moehlecke, A.; Febras, F.; Zanesco, I. Electrical performance analysis of PV modules with bifacial silicon solar cells and white diffuse reflector. Sol. Energy 2013, 96, 253–262. [Google Scholar] [CrossRef]
- Schmela, M.; Beauvais, A.; Chevillard, N.; Paredes, M.; Heisz, M.; Rossi, R. Global Market Outlook For Solar Power. Glob. Mark. Outlook 2018, 1–92. Available online: https://www.photovoltaique.info/media/filer_public/2d/a7/2da79273-50e7-4099-9fe8-c1c3e4a47590/solarpower-europe-global-market-outlook-2019-2023.pdf (accessed on 6 February 2021).
- Jäger-Waldau, A. JRC Science for Policy Report; PV Status Report; European Commission: Brussels, Belgium, 2017; pp. 3–83. [Google Scholar] [CrossRef]
- Jäger-Waldau, A. Snapshot of photovoltaics-February 2018. EPJ Photovolt. 2018, 9, 6. [Google Scholar] [CrossRef]
- Apostoleris, H.; Sgouridis, S.; Stefancich, M.; Chiesa, M. Evaluating the factors that led to low-priced solar electricity projects in the Middle East. Nat. Energy 2018, 3, 1109–1114. [Google Scholar] [CrossRef]
- Labordena, M.; Neubauer, D.; Folini, D.; Patt, A.; Lilliestam, J. Blue skies over China: The effect of pollution-control on solar power generation and revenues. PLoS ONE 2018, 13, e0207028. [Google Scholar] [CrossRef]
- Boys, B.L.; Martin, R.V.; van Donkelaar, A.; MacDonell, R.J.; Hsu, N.C.; Cooper, M.J.; Yantosca, R.M.; Lu, Z.; Streets, D.G.; Zhang, Q.; et al. Fifteen-Year Global Time Series of Satellite-Derived Fine Particulate Matter. Environ. Sci. Technol. 2014, 48, 11109–11118. [Google Scholar] [CrossRef]
- Yang, X.; Jiang, L.; Zhao, W.; Xiong, Q.; Zhao, W.; Yan, X. Comparison of Ground-Based PM2.5 and PM10 Concentrations in China, India, and the U.S. Int. J. Environ. Res. Public Health 2018, 15, 1382. [Google Scholar] [CrossRef] [Green Version]
- Butt, E.W.; Turnock, S.T.; Rigby, R.; Reddington, C.L.; Yoshioka, M.; Johnson, J.S.; A Regayre, L.; Pringle, K.J.; Mann, G.W.; Spracklen, D.V. Global and regional trends in particulate air pollution and attributable health burden over the past 50 years. Environ. Res. Lett. 2017, 12, 104017. [Google Scholar] [CrossRef]
- Weagle, C.L.; Snider, G.; Li, C.; Van Donkelaar, A.; Philip, S.; Bissonnette, P.; Burke, J.; Jackson, J.; Latimer, R.; Stone, E.; et al. Global Sources of Fine Particulate Matter: Interpretation of PM 2.5 Chemical Composition Observed by SPARTAN using a Global Chemical Transport Model. Environ. Sci. Technol. 2018, 52, 11670–11681. [Google Scholar] [CrossRef]
- Al-Kouz, W.; Al-Dahidi, S.; Hammad, B.; Al-Abed, M. Modeling and Analysis Framework for Investigating the Impact of Dust and Temperature on PV Systems’ Performance and Optimum Cleaning Frequency. Appl. Sci. 2019, 9, 1397. [Google Scholar] [CrossRef] [Green Version]
- Lopez-Lorente, J.; Polo, J.; Martín-Chivelet, N.; Norton, M.; Livera, A.; Makrides, G.; Georghiou, G.E. Characterizing soiling losses for photovoltaic systems in dry climates: A case study in Cyprus. Sol. Energy 2023, 255, 243. [Google Scholar] [CrossRef]
- Micheli, L.; Smestad, G.P.; Bessa, J.G.; Muller, M.; Fernandez, E.F.; Almonacid, F. Tracking soiling losses: Assessment, Uncertainty, and challenges in mapping. IEEE J. Photovolt. 2022, 12, 114. [Google Scholar] [CrossRef]
- Bhaduri, S.; Bajhal, R.; Farkade, M.; Mallick, S.; Shiradkar, N.; Kottantharayil, A. Understanding Multiple Stressors Which Degrade Antisoiling Coatings: Combined Effect of Rain, Abrasion, and UV Radiation. IEEE J. Photovoltaics. 2023, 1–7. [Google Scholar] [CrossRef]
- IRENA. Renewable Energy Marbifacialket Analysis: GCC 2019; IRENA: Masdar City, Abu Dhabi, 2019. [Google Scholar]


| Type of Adhesion Force | Measured Value (Averaged over Samples) |
|---|---|
| Capillary | 1951 nN |
| Van der Waals | 39.4 nN in humid conditions, 324 nN in dry air |
| Electrostatic | 0.026 nN |
| Gravitational | 0.0018 nN |
| Mitigation Technology | Potential Optimum Reduction of Soiling Rates | Costs | Potential Limitations | Application Scenario |
|---|---|---|---|---|
| Fully automated cleaning | >95% | 2.4–8.2 €/m2 | Integration in plant design | PV utility scale, ground mounted |
Anti-soiling coatings:
| <<80% (literature review) <20%–50% (authors estimate) 32% reported for commercial coating | <2 €/m2 | Performance dependent on location and season, degradation by cleaning and environmental stresses | Utility scale, residential, ground mounted and rooftop, BiPV, CSP + extra benefit from AR property |
| Tracking | <40%–60% | N.A. | Integration in plant process; involves additional costs | Utility scale, ground mounted, state of the art in CSP |
| Electrodynamic screen/shield | <<98% (laboratory) 32% reported for 2-year study in Saudi Arabia | <30 €/m2 | Expensive, large-scale application needs to be proven | BiPV, island systems, street lighting, rooftop, CSP |
Heating
| <20%–60% | <80 €/m2 (PCM) N.A. | Expensive, large-scale application needs to be developed | BiPV, island systems, street lighting, rooftop installations + extra benefit from cooling during day for PCM + PVT |
| Optimized PV module design and orientation | <65% | %0 €/Wp | Integration into mass production | Utility scale, rooftop installations |
| Site adaption | unknown, site specific | N.A. | Low experience, research needed | Utility scale PV and CSP |
| Study Reference | PV Technology | Tilt Angle | Soiling Parameters |
|---|---|---|---|
| Ullah et al. [131] | Bifacial | 30° | 1.12% (daily soiling loss) |
| Vertical | 0.22% (daily soiling loss) | ||
| Monofacial | 30° | 0.84% (daily soiling loss) | |
| Vertical | 0.11% (daily soiling loss) | ||
| Bhaduri and Kottantharayil [133] | Bifacial | Vertical | 0.027%/day |
| Latitude Tilt | 0.39%/day | ||
| Monofacial | Latitude Tilt | 0.40%/day | |
| Qasem et al. [1] | Monofacial | Variable Tilt | 9 times less soiling on vertical modules than 30° tilted modules |
| Luque, Antonanzas-Torres, and Escobar [134] | Bifacial | Latitude Tilt | 0.236%/day (Total Soiling rate) 0.0394%/day (Rear Side Bifacial Soiling rate) |
| Monofacial | 0.301%/day (Soiling rate) | ||
| Rabanal-Arabach et al. [132] | Bifacial | Vertical | No notable soiling loss, ~−0.0% |
| Latitude Tilt | −12.5% (power loss due to dust) | ||
| Monofacial | Latitude Tilt | −17.25% (power loss due to dust) | |
| Dassler et al. [135] | Bifacial | 22° Tilt | 0.61%/day (Soiling rate) |
| Monofacial | 0.57%/day (Soiling rate) | ||
| Moehlecke et al. [138] | Monofacial and Bifacial | Latitude Tilt | Power degradation due to dust is similar for both technologies: 1–4% |
| Wind | PV Roof-Top | PV Utility Scale | CSP | Waste to Energy | Total | Source | |
|---|---|---|---|---|---|---|---|
| Capacity in 2030 (MW) | |||||||
| Oman | 1210 | 990 | 2420 | 770 | 110 | 5500 | Target: 2.6 GW (~2025) + 0.6 GW every year up to 2030 |
| Bahrain | 20 | 70 | 520 | 70 | 20 | 700 | IRENA expectation |
| Kuwait | 200 | 1000 | 5800 | 1000 | - | 8000 | Inputs from country |
| Qatar | - | 150 | 2250 | 600 | 100 | 3100 | IRENA expectation |
| UAE | 300 | 4200 | 18,900 | 6000 | 600 | 30,000 | Based on Masdar Institute/IRENA |
| KSA | 3500 | 750 | 10,500 | 9500 | 750 | 25,000 | Target: 9.5 GW (~2023) + 2 GW every year up to 2030 |
| Section | Main Findings/Recommendations | References |
|---|---|---|
| Impact of the soiling on solar radiation in Qatar |
| [10,11,12,13,14,15,16,17,18,19] |
| Development of an in-house “outdoor soiling microscope” |
| [20] |
| Field measurement of PV soiling by MarsTM and Dust IQ sensors |
| [21] |
| Understanding of the soiling properties in the desert environment |
| [22,23,24,25,26,27,28,29,30,31,32,33,34,35,36,37,38,39,40,41,42,43,44,45,46,47,48,49,50,51,52,53] |
| Impact of PV soiling on PV performance |
| [8,54,55,56,57,58,59,60,61,62,63,64,65,66,67,68,69,70,71,72,73,74,75,76,77,78] |
| Mitigation of PV soiling |
| [40,79,80,81,82,83,84,85,86,87,88,89,90,91,92,93,94,95,96,97,98,99,100,101,102,103,104,105,106,107,108,109,110,111,112,113,114,115,116,117,118,119,120,121,122,123,124,125,126,127,128,129,130,131,132,133,134,135,136,137,138,139] |
| Effect of soiling on bifacial PV modules |
| [1,127,128,129,130,131,132,133,134,135,136,137,138] |
| Impact of soiling on energy cost and power production |
| [40,136] |
| Renewable Energy and soiling within the Gulf Cooperation Council (GCC) context |
| [139,140,141,142,143,144,145,146,147,148,149,150,151,152] |
Disclaimer/Publisher’s Note: The statements, opinions and data contained in all publications are solely those of the individual author(s) and contributor(s) and not of MDPI and/or the editor(s). MDPI and/or the editor(s) disclaim responsibility for any injury to people or property resulting from any ideas, methods, instructions or products referred to in the content. |
© 2023 by the authors. Licensee MDPI, Basel, Switzerland. This article is an open access article distributed under the terms and conditions of the Creative Commons Attribution (CC BY) license (https://creativecommons.org/licenses/by/4.0/).
Share and Cite
Aïssa, B.; Isaifan, R.J.; Figgis, B.W.; Abdallah, A.A.; Bachour, D.; Perez-Astudillo, D.; Sanfilippo, A.; Lopez-Garcia, J.; Bermudez Benito, V. A Comprehensive Review of a Decade of Field PV Soiling Assessment in QEERI’s Outdoor Test Facility in Qatar: Learned Lessons and Recommendations. Energies 2023, 16, 5224. https://doi.org/10.3390/en16135224
Aïssa B, Isaifan RJ, Figgis BW, Abdallah AA, Bachour D, Perez-Astudillo D, Sanfilippo A, Lopez-Garcia J, Bermudez Benito V. A Comprehensive Review of a Decade of Field PV Soiling Assessment in QEERI’s Outdoor Test Facility in Qatar: Learned Lessons and Recommendations. Energies. 2023; 16(13):5224. https://doi.org/10.3390/en16135224
Chicago/Turabian StyleAïssa, Brahim, Rima J. Isaifan, Benjamin W. Figgis, Amir A. Abdallah, Dunia Bachour, Daniel Perez-Astudillo, Antonio Sanfilippo, Juan Lopez-Garcia, and Veronica Bermudez Benito. 2023. "A Comprehensive Review of a Decade of Field PV Soiling Assessment in QEERI’s Outdoor Test Facility in Qatar: Learned Lessons and Recommendations" Energies 16, no. 13: 5224. https://doi.org/10.3390/en16135224