
Treatment of Effluent Containing p-Cresol through an Advanced Oxidation Process in a Batch Reactor: Kinetic Optimization

 , ,
, ,  ,
,  and
and
Abstract
:1. Introduction
2. Materials and Methods
2.1. Chemicals
2.2. Experimental Setup
2.3. Analytical Methods
2.3.1. High-Performance Liquid Chromatography (HPLC)
2.3.2. Total Organic Carbon (TOC)
2.4. Definition of Response Variables
2.5. Statistical Techniques and Optimization of Kinetic Variables
2.6. Kinetic Modeling of p-Cresol Degradation
3. Results
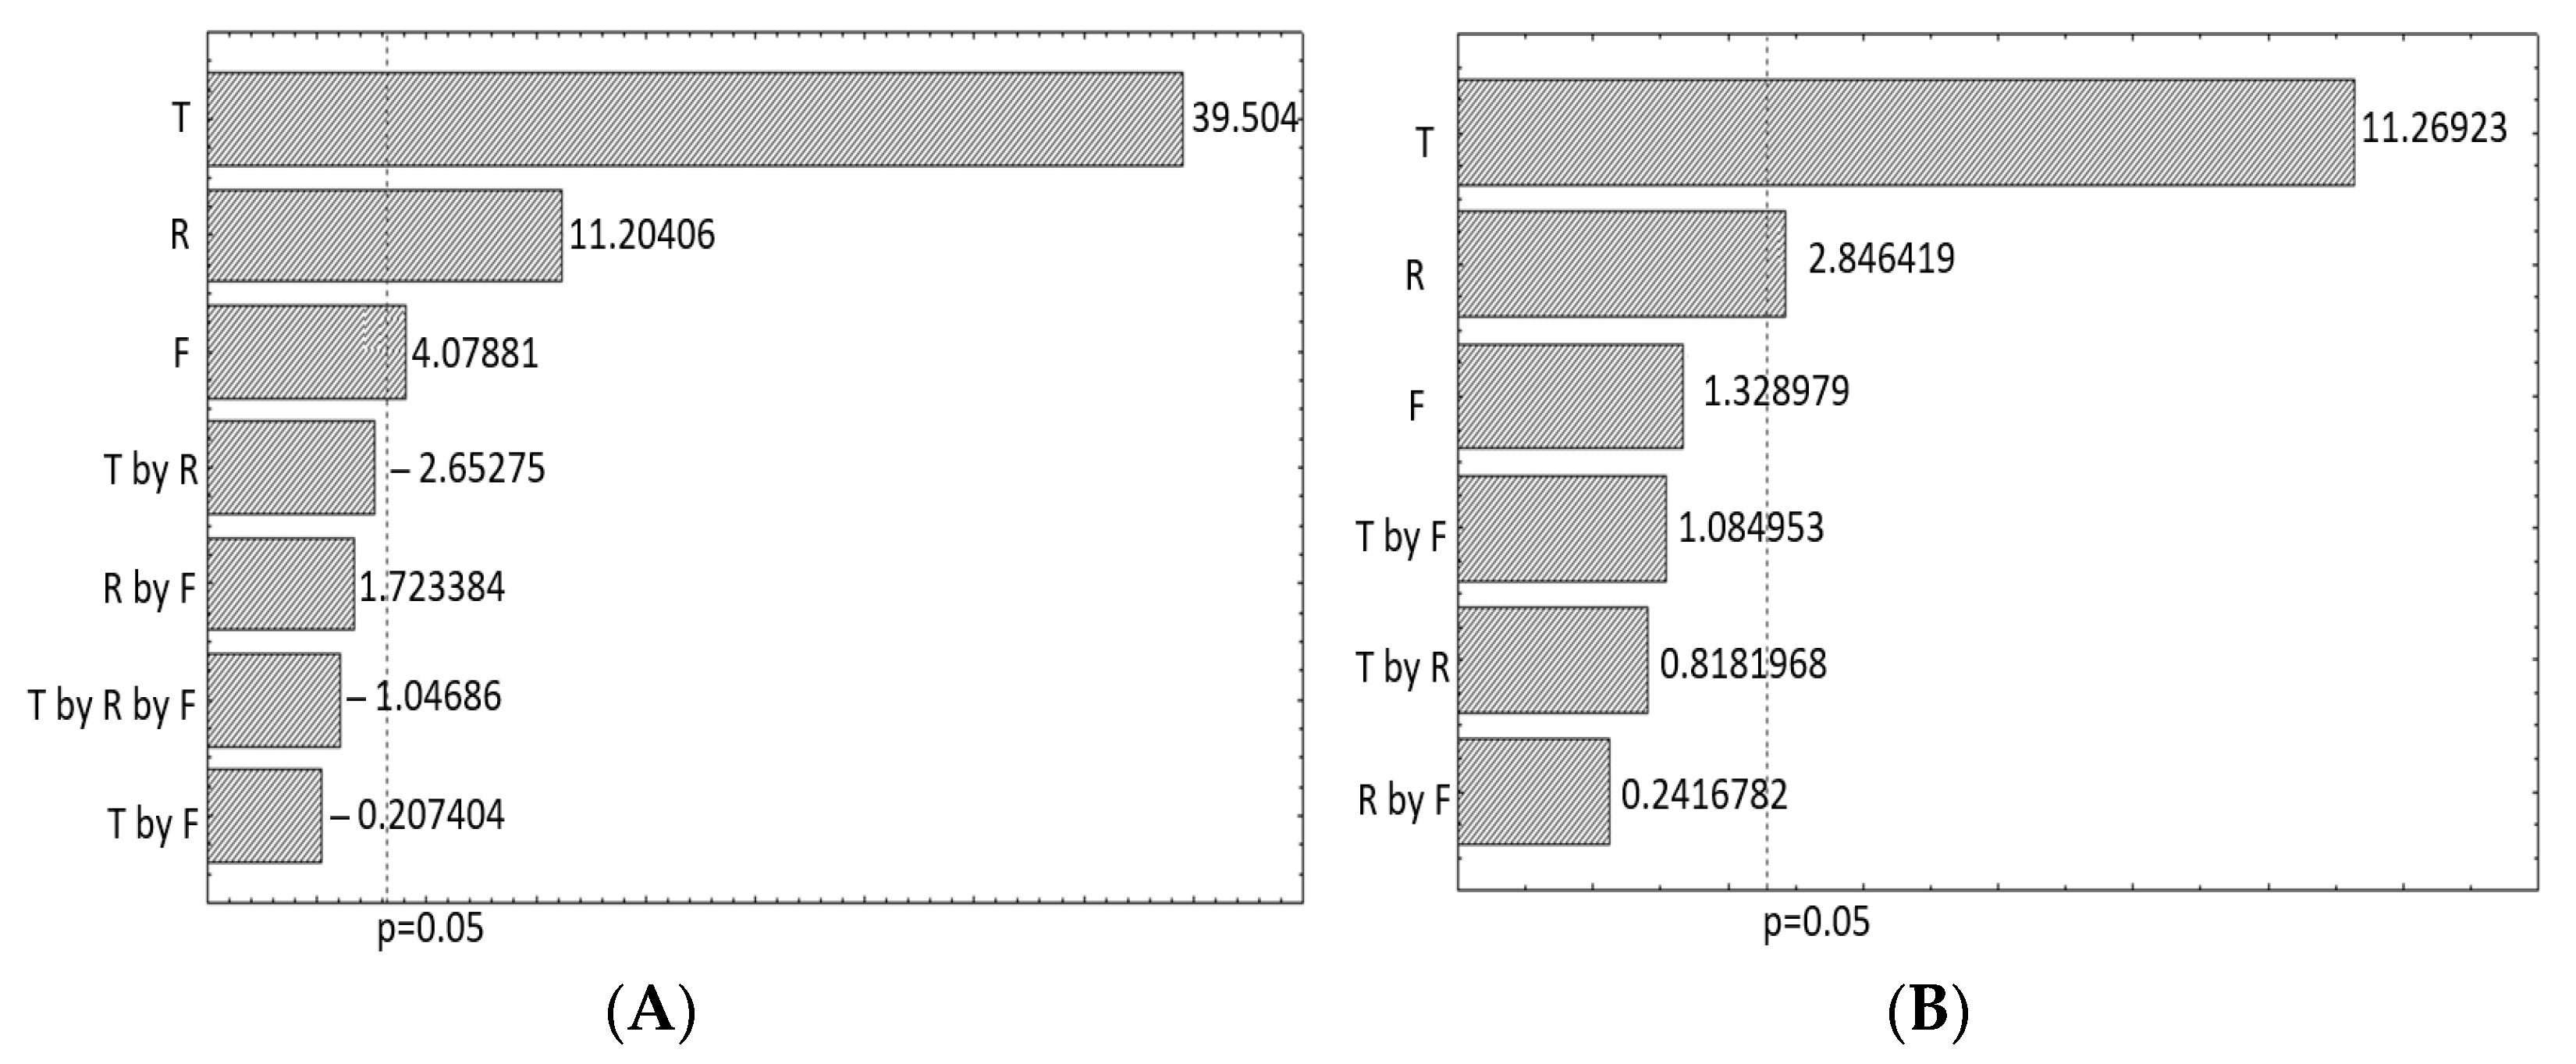
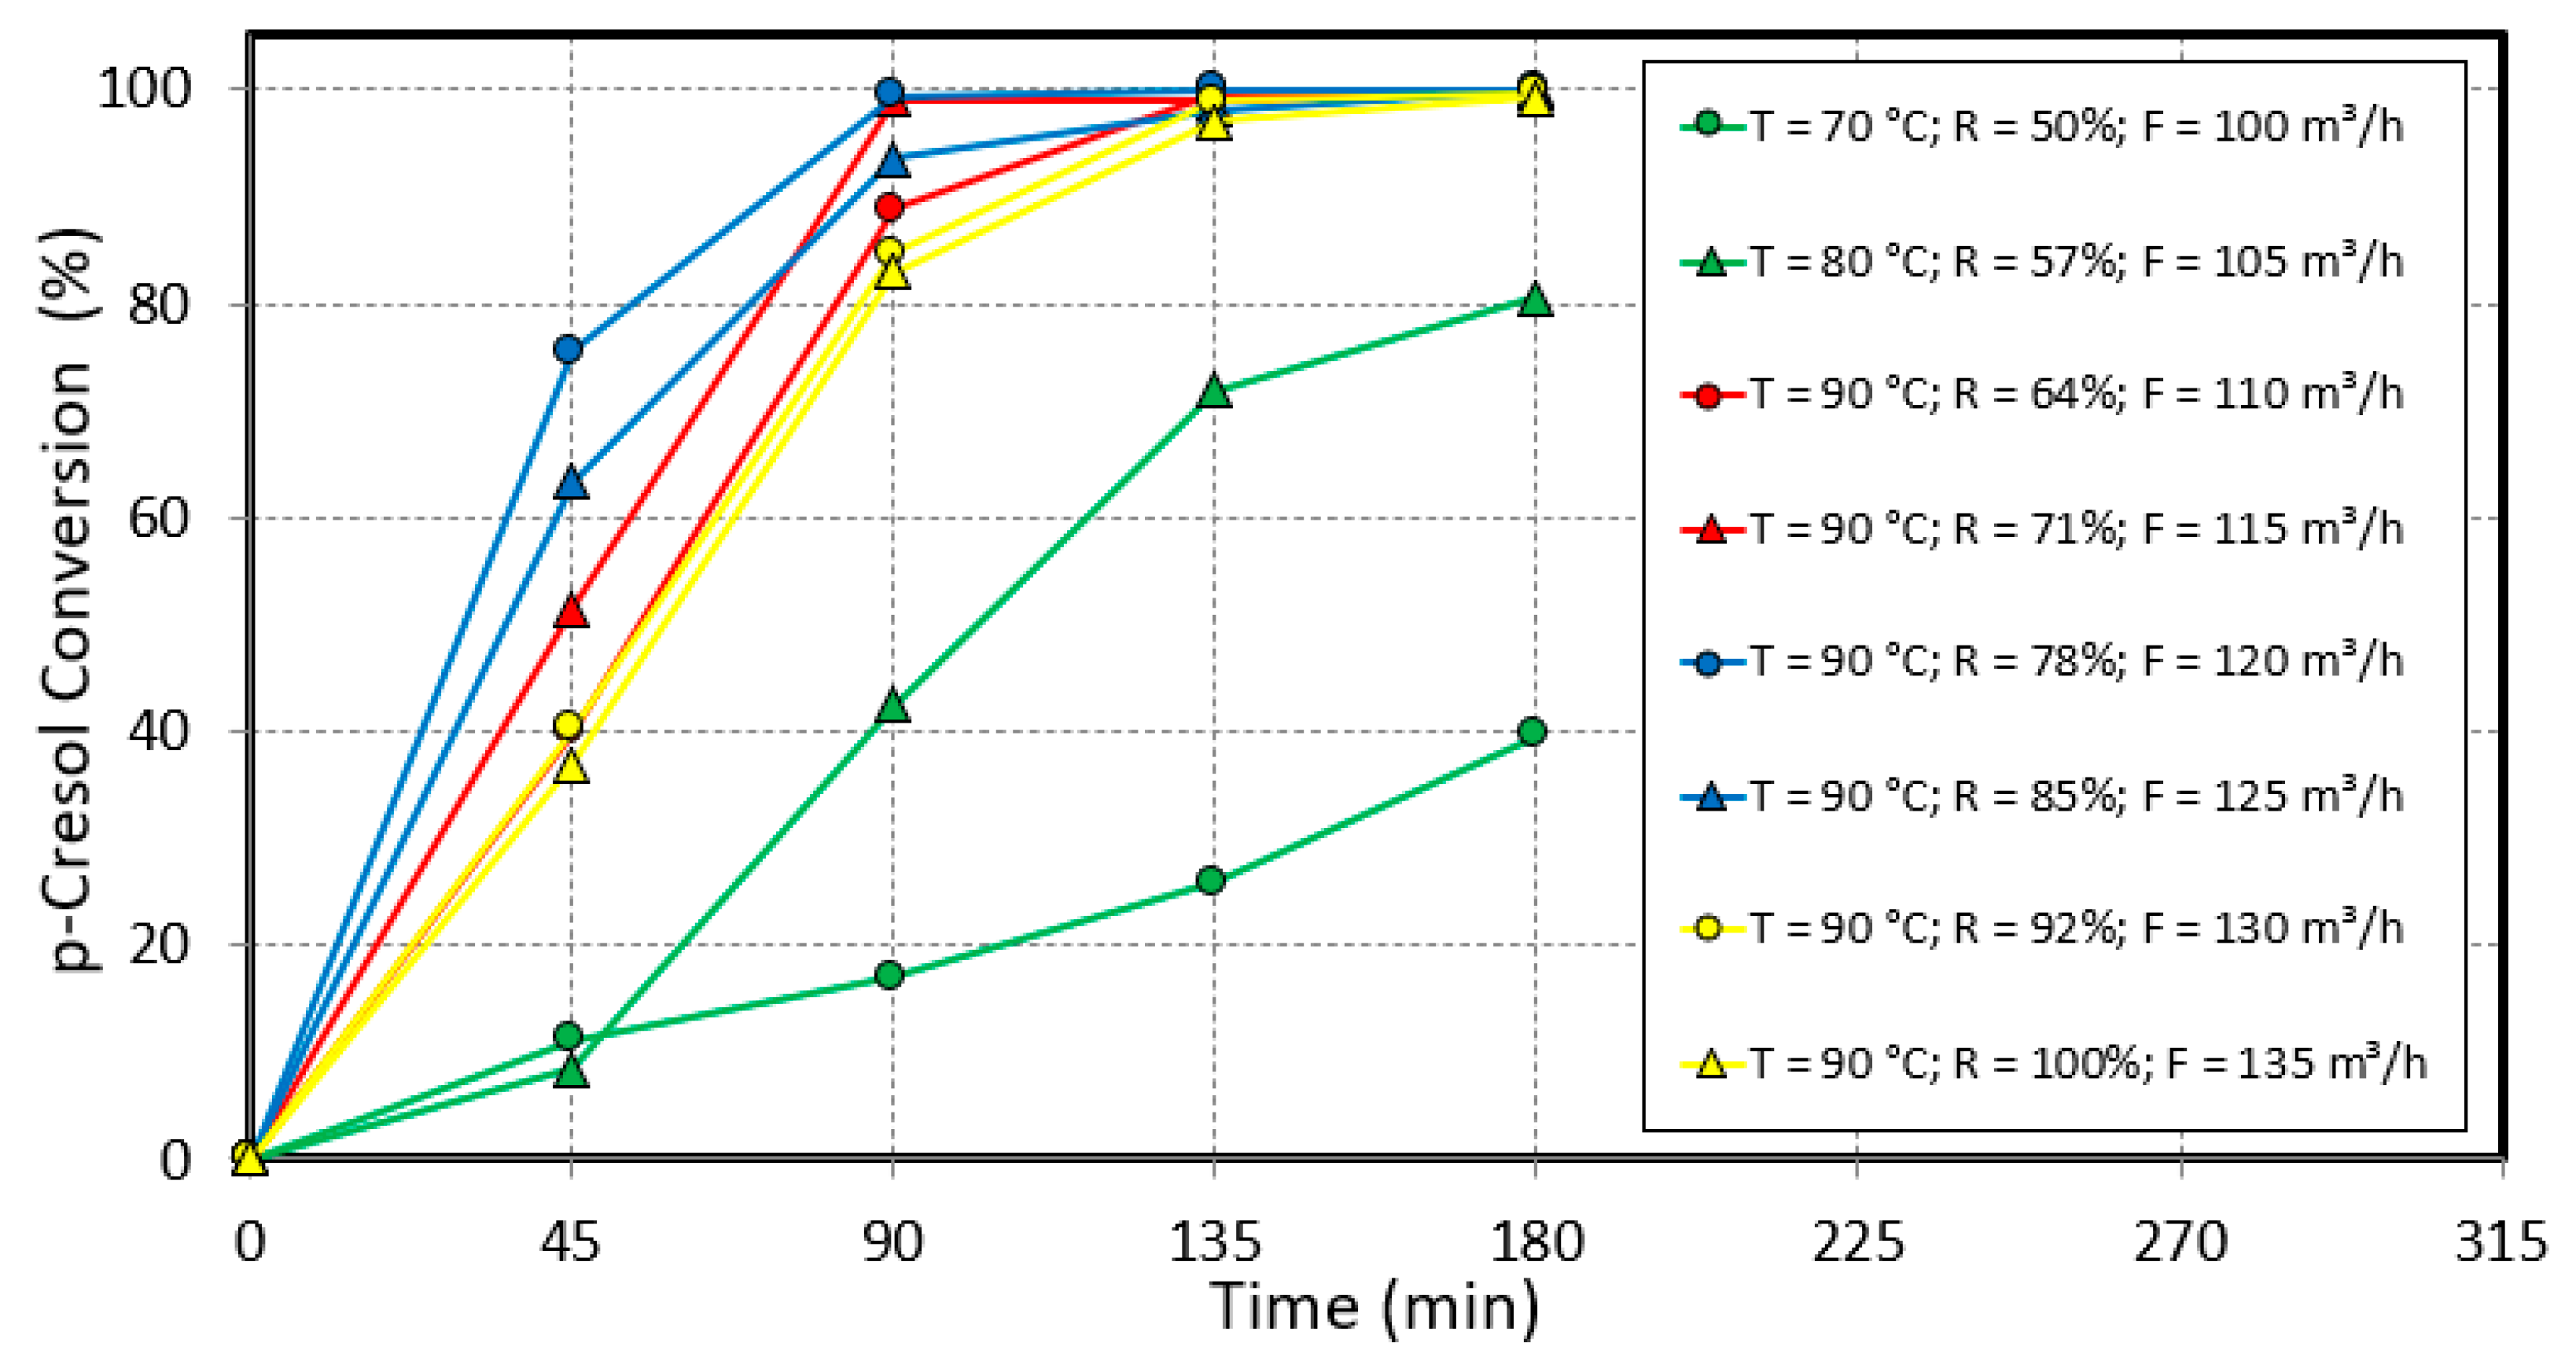
3.1. Optimization of Kinetic Variables
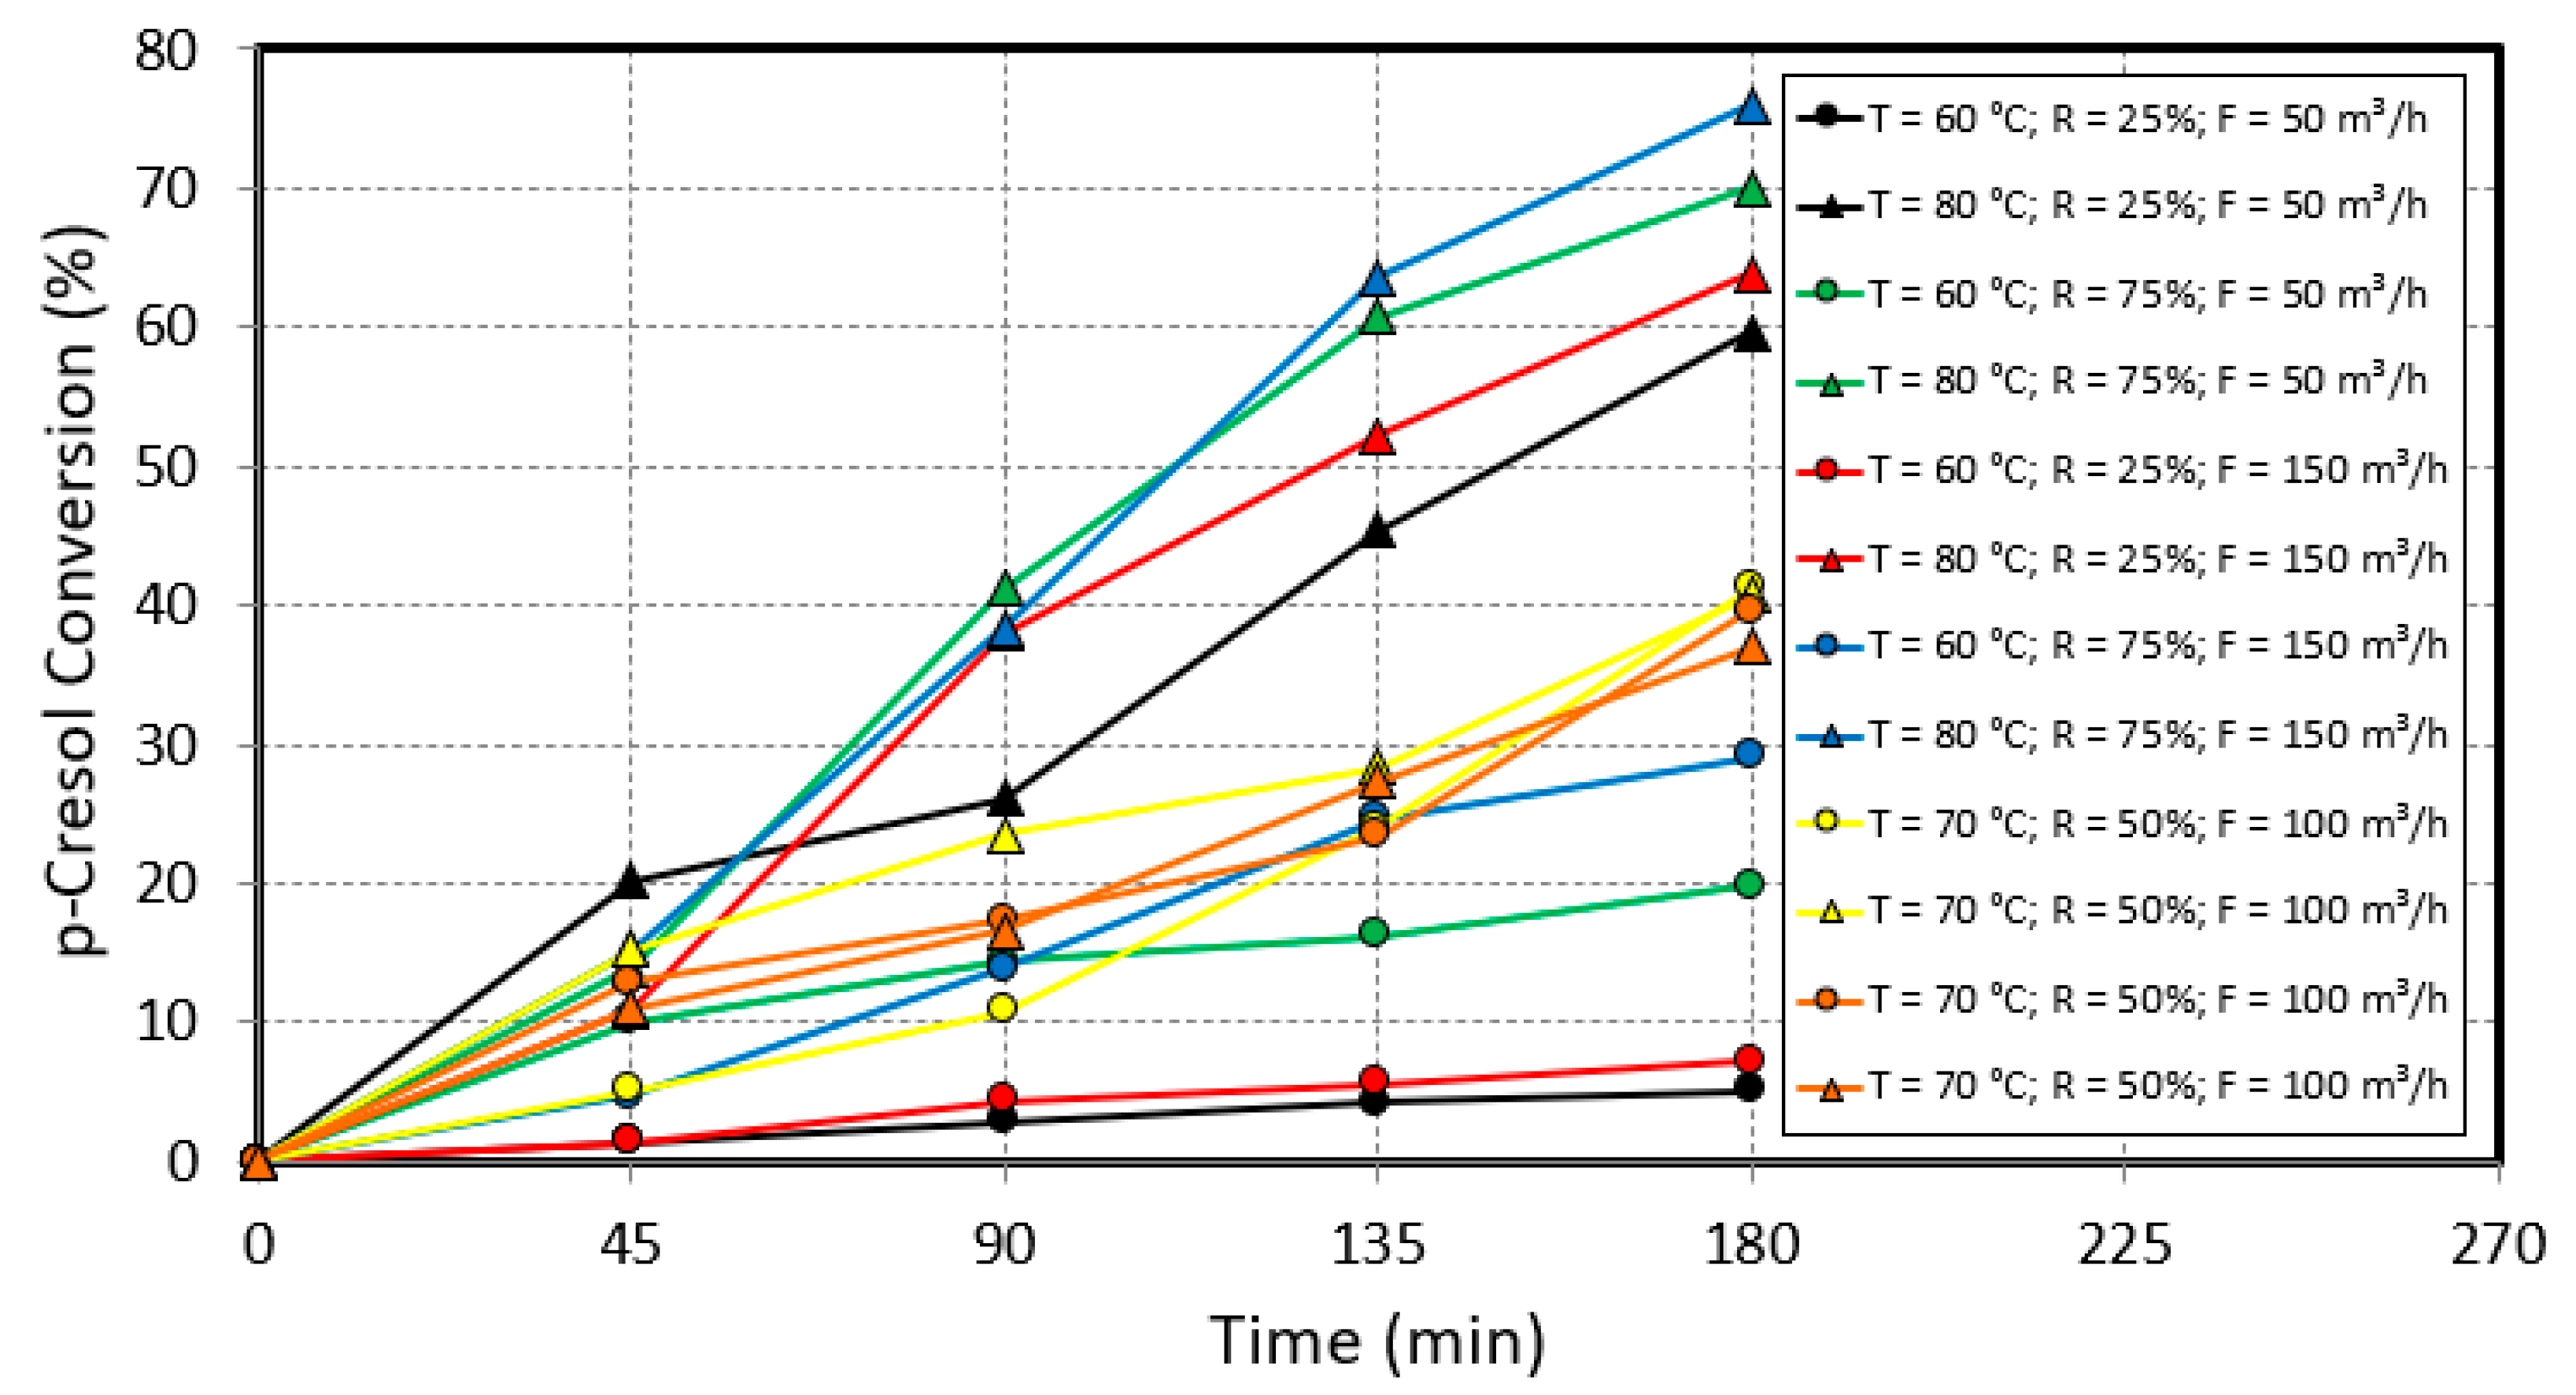
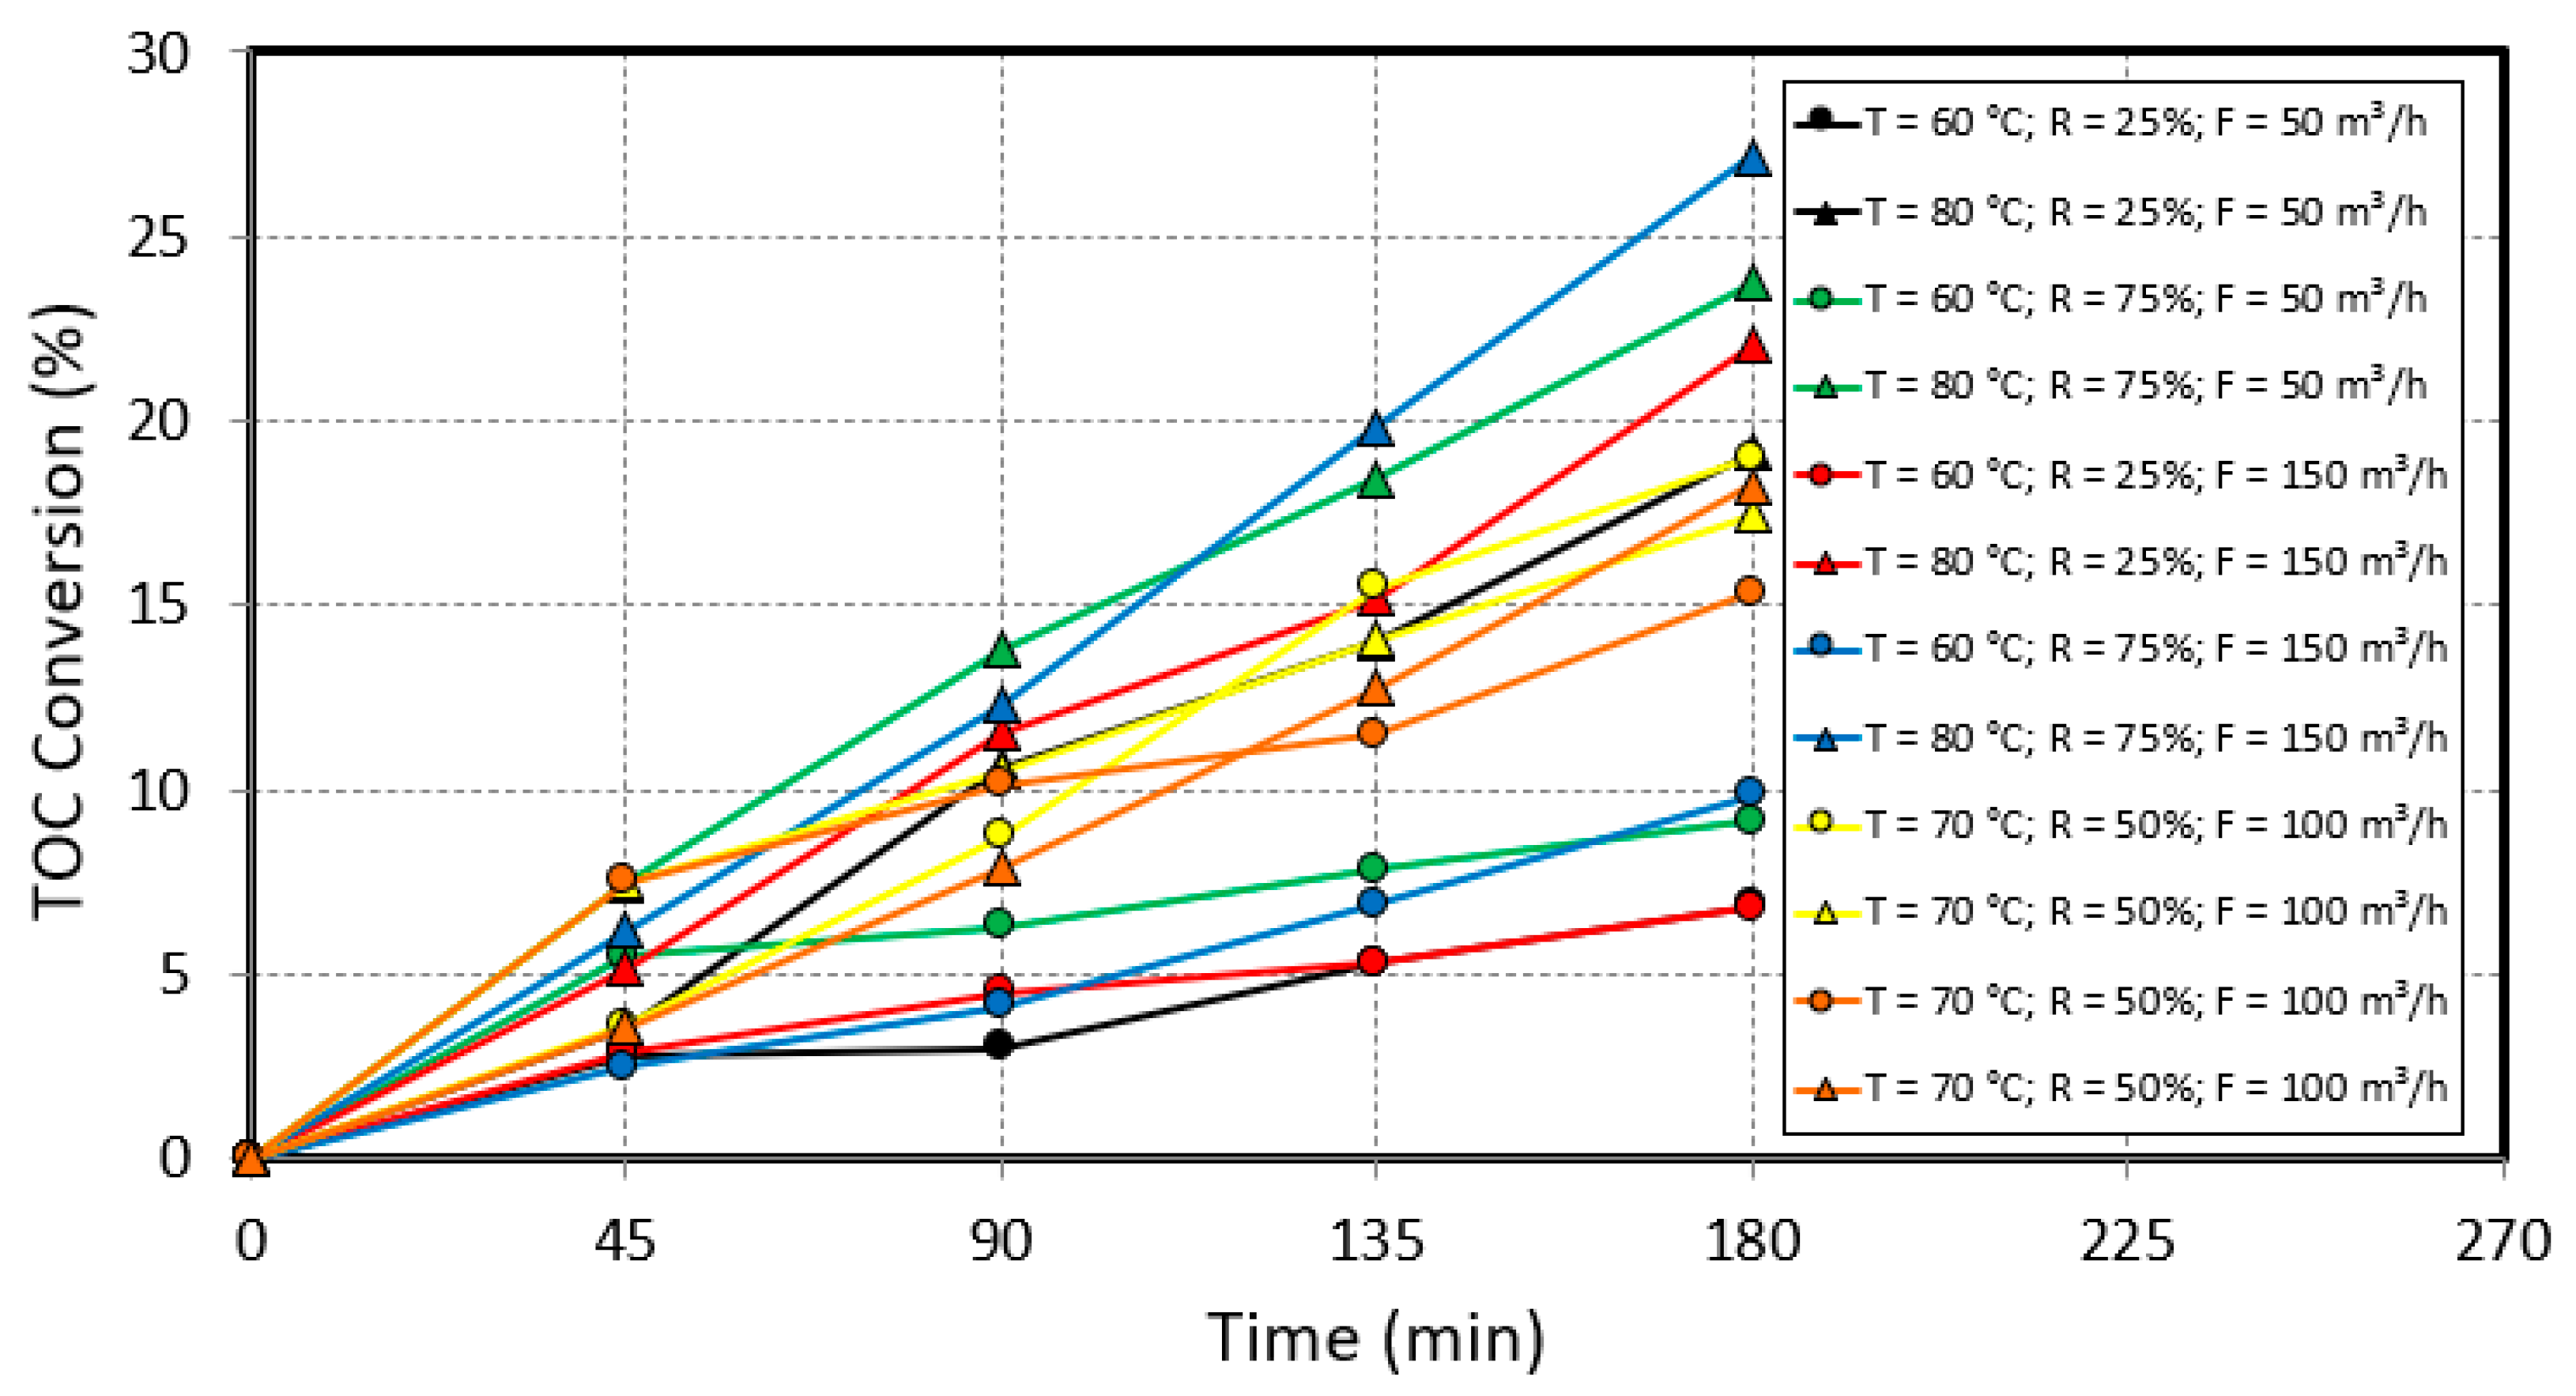
3.2. Kinetics of p-Cresol Oxidation
4. Discussion
5. Conclusions
Author Contributions
Funding
Acknowledgments
Conflicts of Interest
References
- Sheng, J.; Voldsund, M.; Ertesvåg, I.S. Advanced exergy analysis of the oil and gas processing plant on an offshore platform: A thermodynamic cycle approach. Energy Rep. 2023, 9, 820–832. [Google Scholar] [CrossRef]
- De Oliveira, S., Jr.; Van Hombeeck, M. Exergy analysis of petroleum separation processes in offshore platforms. Energy Convers. Manag. 1997, 38, 1577–1584. [Google Scholar] [CrossRef]
- Kayadelen, H.K. Effect of natural gas components on its flame temperature, equilibrium combustion products and thermodynamic properties. J. Nat. Gas Sci. Eng. 2017, 45, 456–473. [Google Scholar] [CrossRef]
- Neff, J.; Lee, K.; DeBlois, E.M. Produced water: Overview of composition, fates, and effects. In Produced Water: Environmental Risks and Advances in Mitigation Technologies, 1st ed.; Lee, K., Neff, J., Eds.; Springer: New York, NY, USA, 2011; Volume 18, pp. 4–5. [Google Scholar]
- Al-Kaabi, M.A.; Zouari, N.; Da’Na, D.A.; Al-Ghouti, M.A. Adsorptive batch and biological treatments of produced water: Recent progresses, challenges, and potentials. J. Environ. Manag. 2021, 290, 112527. [Google Scholar] [CrossRef] [PubMed]
- Faksness, L.-G.; Grini, P.G.; Daling, P.S. Partitioning of semi-soluble organic compounds between the water phase and oil droplets in produced water. Mar. Pollut. Bull. 2004, 48, 731–742. [Google Scholar] [CrossRef] [PubMed]
- Chittick, E.A.; Srebotnjak, T. An analysis of chemicals and other constituents found in produced water from hydraulically fractured wells in California and the challenges for wastewater management. J. Environ. Manag. 2017, 204, 502–509. [Google Scholar] [CrossRef]
- Neto, S.L.d.C.; Viviani, J.C.T.; Weschenfelder, S.E.; Cunha, M.d.F.R.d.; Junior, A.E.O.; Costa, B.R.D.S.; Mazur, L.P.; Marinho, B.A.; da Silva, A.; de Souza, A.A.U.; et al. Evaluation of petroleum as extractor fluid in liquid-liquid extraction to reduce the oil and grease content of oilfield produced water. Process. Saf. Environ. Prot. 2022, 161, 263–272. [Google Scholar] [CrossRef]
- Brandão, Y.; Teodosio, J.; Benachour, M.; Oliveira, J.; Marinho, I.; Figueirêdo, F.; Anselmo-Filho, P. Estudo do efeito do excesso de ar e da potência dissipada do queimador sobre as capacidades do processo DiCTT no tratamento de efluentes líquidos fenólicos. Rev. Ibero-Am. Sist. Cibernética E Inf. 2010, 7, 1–9. [Google Scholar]
- Fedorov, K.; Plata-Gryl, M.; Khan, J.A.; Boczkaj, G. Ultrasound-assisted heterogeneous activation of persulfate and peroxymonosulfate by asphaltenes for the degradation of BTEX in water. J. Hazard. Mater. 2020, 397, 122804. [Google Scholar] [CrossRef]
- Saikia, S.; Gogoi, R.D.; Yadav, M.; Yadav, H.S. Isolation, purification and characterization of peroxidase from Raphanus sativus and its applications in biotransformation of cresols. Biocatal. Agric. Biotechnol. 2022, 46, 102540. [Google Scholar] [CrossRef]
- Jun, L.Y.; Yon, L.S.; Mubarak, N.; Bing, C.H.; Pan, S.; Danquah, M.K.; Abdullah, E.; Khalid, M. An overview of immobilized enzyme technologies for dye and phenolic removal from wastewater. J. Environ. Chem. Eng. 2019, 7, 102961. [Google Scholar] [CrossRef]
- Benali, M.; Guy, C. Thermochemical oxidation of phenolic-laden liquid effluent models. J. Environ. Eng. Sci. 2007, 6, 543–552. [Google Scholar] [CrossRef]
- Iliuta, I.; Iliuta, M.C. Intensified phenol and p-cresol biodegradation for wastewater treatment in countercurrent packed-bed column bioreactors. Chemosphere 2021, 286, 131716. [Google Scholar] [CrossRef] [PubMed]
- Singh, R.K.; Kumar, S.; Kumar, S.; Kumar, A. Biodegradation kinetic studies for the removal of p-cresol from wastewater using Gliomastix indicus MTCC 3869. Biochem. Eng. J. 2008, 40, 293–303. [Google Scholar] [CrossRef]
- Duan, W.; Meng, F.; Cui, H.; Lin, Y.; Wang, G.; Wu, J. Ecotoxicity of phenol and cresols to aquatic organisms: A review. Ecotoxicol. Environ. Saf. 2018, 157, 441–456. [Google Scholar] [CrossRef]
- China Chemical Safety Association. Available online: https://www.aiche.org/content-source/china-chemical-safety-association (accessed on 15 May 2023).
- Helcom. Response to Accidents at Sea Involving Spills of Hazardous Substances and Loss of Packaged Dangerous Goods; Baltic Marine Environment Protection Commission: Helsinki, Finland, 2002; pp. 64–87. [Google Scholar]
- Wei, X.; Gilevska, T.; Wetzig, F.; Dorer, C.; Richnow, H.-H.; Vogt, C. Characterization of phenol and cresol biodegradation by compound-specific stable isotope analysis. Environ. Pollut. 2016, 210, 166–173. [Google Scholar] [CrossRef]
- Brandão, Y.B.; Oliveira, D.C.; Dias, F.F.S.; Teodosio, J.R.; Oliveira, J.G.C.; Oliveira, C.G.C.; Moraes, C.M.; Araújo, L.A.; Benachour, M. Thermochemical advanced oxidation process by DiCTT for the degradation/mineralization of effluents phenolics with optimization using response surface methodology and artificial neural networks modelling. PPEJ 2023, 7, 000329. [Google Scholar] [CrossRef]
- Liu, Z.; Xu, J.; Liu, M.; Yin, Z.; Liu, X.; Yin, L.; Zheng, W. Remote sensing and geostatistics in urban water-resource monitoring: A review. Mar. Freshw. Res. 2023, 74, 22167. [Google Scholar] [CrossRef]
- Tian, Y.; Yang, Z.; Yu, X.; Jia, Z.; Rosso, M.; Dedman, S.; Zhu, J.; Xia, Y.; Zhang, G.; Yang, J.; et al. Can we quantify the aquatic environmental plastic load from aquaculture? Water Res. 2022, 219, 118551. [Google Scholar] [CrossRef]
- Shim, J.; Kumar, M.; Goswami, R.; Mazumder, P.; Oh, B.-T.; Shea, P.J. Removal of p-cresol and tylosin from water using a novel composite of alginate, recycled MnO2 and activated carbon. J. Hazard. Mater. 2019, 364, 419–428. [Google Scholar] [CrossRef]
- Xiao, M.; Qi, Y.; Feng, Q.; Li, K.; Fan, K.; Huang, T.; Qu, P.; Gai, H.; Song, H. P-cresol degradation through Fe(III)-EDDS/H2O2 Fenton-like reaction enhanced by manganese ion: Effect of pH and reaction mechanism. Chemosphere 2021, 269, 129436. [Google Scholar] [CrossRef]
- Aziz, F.; Jalil, A.; Hassan, N.; Fauzi, A.; Khusnun, N.; Ali, M.; Bahari, M.; Nabgan, W. CuO improved energy band of AgO/fibrous SiO2–ZrO2 for optimized simultaneous photocatalytic redox of chromium (VI) and p-cresol using response surface methodology. Environ. Res. 2023, 220, 115151. [Google Scholar] [CrossRef] [PubMed]
- Somu, P.; Narayanasamy, S.; Gomez, L.A.; Rajendran, S.; Lee, Y.R.; Balakrishnan, D. Immobilization of enzymes for bioremediation: A future remedial and mitigating strategy. Environ. Res. 2022, 212, 113411. [Google Scholar] [CrossRef] [PubMed]
- Razzaghi, M.; Karimi, A.; Ansari, Z.; Aghdasinia, H. Phenol removal by HRP/GOx/ZSM-5 from aqueous solution: Artificial neural network simulation and genetic algorithms optimization. J. Taiwan Inst. Chem. Eng. 2018, 89, 1–14. [Google Scholar] [CrossRef]
- Brandão, Y.B.; Oliveira, J.G.C.; Benachour, M. Phenolic waste waters: Definition, sources and treatment processes. In Phenolic Compounds: Natural Sources, Importance and Applications; Soto-Hernandez, M., Tenango, M.P., Gárcia-Mateos, M.d.R., Eds.; IntechOpen: Rijeka, Croatia, 2017; Volume 1, pp. 154–196. [Google Scholar]
- Teodosio, J.R.; Brandão, Y.B.; Oliveira, D.C.; Dias, F.F.S.; Moraes, C.M.; Araújo, L.A.; Oliveira Júnior, D.C.; Oliveira, J.G.C.; Benachour, M. Treatment of effluents containing hydroquinone in a batch reactor: Optimization technique via RSM, MAGM and kinetic modelling. PPEJ 2023, 7, 000341. [Google Scholar] [CrossRef]
- Yang, L.; Jiao, Y.; Xu, X.; Pan, Y.; Su, C.; Duan, X.; Sun, H.; Liu, S.; Wang, S.; Shao, Z. Superstructures with atomic-level arranged perovskite and oxide layers for advanced oxidation with an enhanced non-free radical pathway. ACS Sustain. Chem. Eng. 2022, 10, 1899–1909. [Google Scholar] [CrossRef]
- Wang, Y.; Sun, T.; Tong, L.; Gao, Y.; Zhang, H.; Zhang, Y.; Wang, Z.; Zhu, S. Non-free Fe dominated PMS activation for enhancing electro-Fenton efficiency in neutral wastewater. J. Electroanal. Chem. 2023, 928, 117062. [Google Scholar] [CrossRef]
- Bilińska, L.; Gmurek, M.; Ledakowicz, S. Textile wastewater treatment by AOPs for brine reuse. Process. Saf. Environ. Prot. 2017, 109, 420–428. [Google Scholar] [CrossRef]
- Renuka, M.K.; Gayathri, V. UV/solar light induced photocatalytic degradation of phenols and dyes by Fe(PS-BBP)Cl3. J. Photochem. Photobiol. A Chem. 2018, 353, 477–487. [Google Scholar] [CrossRef]
- Berenguer, C.F.; Brandão, Y.B.; Benachour, M. Estudo de tratamento de água em efluentes refratários por processo Fenton para degradação e mineralização desses compostos em reator de escala laboratorial modelo PARR. In Ciência e Engenharia de Materiais; Abdala, R.W.S., Ed.; Atena: Ponta Grossa, PR, Brazil, 2018; Volume 3, pp. 139–155. [Google Scholar]
- Brandão, Y.B.; Dias, F.F.; Oliveira, D.C.; Zaidan, L.E.; Teodosio, J.R.; Oliveira, J.G.; Benachour, M. Unconventional advanced oxidation technique: Evaporation liquid rate and phenolic compounds degradation evaluation and modelling/optimization process with CFD, RSM and ANNs. Fuel 2021, 300, 120967. [Google Scholar] [CrossRef]
- Li, X.; Zhou, M.; Pan, Y.; Xu, L.; Tang, Z. Highly efficient advanced oxidation processes (AOPs) based on pre-magnetization Fe 0 for wastewater treatment. Sep. Purif. Technol. 2017, 178, 49–55. [Google Scholar] [CrossRef]
- Resolução CONAMA N0 430 de 13/05/2011. Available online: https://www.legisweb.com.br/legislacao/?id=114770 (accessed on 15 May 2023).
- Myers, R.H.; Montgomery, D.C.; Anderson-Cook, C.M. Response Surface Methodology: Product and Process Op-timization Using Designed Experiments, 2nd ed.; John Wiley and Sons: New York, NY, USA, 2002; pp. 856–863. [Google Scholar]
- Barros Neto, B.; Scarminio, I.S.; Bruns, R.E. Como Fazer Experimentos, 4th ed.; Bookman: Porto Alegre, RS, Brazil, 2010; pp. 413–419. [Google Scholar]
- Harrington, E.C., Jr. The desirability function. Ind. Qual. Control. 1965, 21, 494–498. [Google Scholar] [CrossRef] [Green Version]
- Derringer, G.; Suich, R. Simultaneous optimization of several response variables. J. Qual. Technol. 1980, 12, 214–219. [Google Scholar] [CrossRef]
- Surajit, P.; Susanta, K.G. A desirability functions-based approach for simultaneous optimization of quantitative and ordinal response variables in industrial processes. Int. J. Eng. Sci. Technol. 2018, 10, 76–87. [Google Scholar] [CrossRef] [Green Version]
- Amdoun, R.; Khelifi, L.; Khelifi-Slaoui, M.; Amroune, S.; Asch, M.; Assaf-ducrocq, C.; Gontier, E. The desirability optimization methodology; a tool to predict two antagonist responses in biotechnological systems: Case of biomass growth and hyoscyamine content in elicited Datura starmonium hairy roots. Iran. J. Biotechnol. 2018, 16, e1339. [Google Scholar] [CrossRef] [Green Version]
- Siebert, A.P.F.; Silva, A.C.B.; Moraes, C.M.; Bezerra, R.S.; Silva, L.C.M.; Oliveira, D.C.; Benachour, M.; Brandão, Y.B. Utilização da Moringa oleifera Lam e da radiação solar no tratamento de água para consumo humano. Braz. J. Dev. 2020, 6, 86102–86129. [Google Scholar] [CrossRef]
- Brandão, Y.; Teodosio, J.; Dias, F.; Eustáquio, W.; Benachour, M. Treatment of phenolic effluents by a thermochemical oxidation process (DiCTT) and modelling by artificial neural networks. Fuel 2013, 110, 185–195. [Google Scholar] [CrossRef]
- Li, L.; Chen, P.; Gloyna, E.F. Generalised kinetic model for wet oxidation of organic compounds. AIChE J. 1991, 37, 1687–1697. [Google Scholar] [CrossRef]
- Devlin, H.R.; Harris, I.J. Mechanism of the oxidation of aqueous phenol with dissolved oxygen. Ind. Eng. Chem. Res. 1984, 23, 387–392. [Google Scholar] [CrossRef]
- Sayğılı, H.; Güzel, F.; Önal, Y. Conversion of grape industrial processing waste to activated carbon sorbent and its performance in cationic and anionic dyes adsorption. J. Clean. Prod. 2015, 93, 84–93. [Google Scholar] [CrossRef]
- Tian, K.; Hu, L.; Li, L.; Zheng, Q.; Xin, Y.; Zhang, G. Recent advances in persulfate-based advanced oxidation processes for organic wastewater treatment. Chin. Chem. Lett. 2022, 33, 4461–4477. [Google Scholar] [CrossRef]
- Ji, R.; Chen, J.; Liu, T.; Zhou, X.; Zhang, Y. Critical review of perovskites-based advanced oxidation processes for wastewater treatment: Operational parameters, reaction mechanisms, and prospects. Chin. Chem. Lett. 2021, 33, 643–652. [Google Scholar] [CrossRef]
- Tessmer, C.H.; Vidic, R.D.; Uranowski, L.J. Impact of oxygen-containing surface functional groups on activated carbon adsorption of phenols. Environ. Sci. Technol. 1997, 31, 1872–1878. [Google Scholar] [CrossRef]
- Alvarez, L.H.; Arvizu, I.C.; García-Reyes, R.B.; Martinez, C.M.; Olivo-Alanis, D.; Del Angel, Y.A. Quinone-functionalized activated carbon improves the reduction of congo red coupled to the removal of p -cresol in a UASB reactor. J. Hazard. Mater. 2017, 338, 233–240. [Google Scholar] [CrossRef] [PubMed]
- Luna, A.J.; Rojas, L.O.A.; Melo, D.M.A.; Benachour, M.; de Sousa, J.F. Total catalytic wet oxidation of phenol and its chlorinated derivates with MnO2/CeO2 catalyst in a slurry reactor. Braz. J. Chem. Eng. 2009, 26, 493–502. [Google Scholar] [CrossRef] [Green Version]
- Napoleão, D.C. Avaliação e Tratamento dos Contaminantes Emergentes (Ácido Acetilsalicílico, Diclofenaco e Paracetamol) utilizando Processos Oxidativos Avançados. Master’s Thesis, Universidade Federal de Pernambuco, Recife, Brasil, 2011. [Google Scholar]
- Britto, J.M.; Rangel, M.D.C. Processos avançados de oxidação de compostos fenólicos em efluentes industriais. Química Nova 2008, 31, 114–122. [Google Scholar] [CrossRef]
- Kavitha, V.; Palanivelu, K. Destruction of cresols by Fenton oxidation process. Water Res. 2005, 39, 3062–3072. [Google Scholar] [CrossRef]
- Kshirsagar, V.; Nadgeri, J.; Tayade, P.; Rode, C. Reaction kinetics of liquid phase air oxidation of p-cresol to p-hydroxybenzaldehyde. Appl. Catal. A Gen. 2008, 339, 28–35. [Google Scholar] [CrossRef]


| Run | T (°C) | R (%) | F (L h−1) |
|---|---|---|---|
| 1 | 60 (−1) | 25 (−1) | 50 (−1) |
| 2 | 80 (+1) | 25 (−1) | 50 (−1) |
| 3 | 60 (−1) | 75 (+1) | 50 (−1) |
| 4 | 80 (+1) | 75 (+1) | 50 (−1) |
| 5 | 60 (−1) | 25 (−1) | 150 (+1) |
| 6 | 80 (+1) | 25 (−1) | 150 (+1) |
| 7 | 60 (−1) | 75 (+1) | 150 (+1) |
| 8 | 80 (+1) | 75 (+1) | 150 (+1) |
| 9 * | 70 (0) | 50 (0) | 100 (0) |
| 10 * | 70 (0) | 50 (0) | 100 (0) |
| 11 * | 70 (0) | 50 (0) | 100 (0) |
| 12 * | 70 (0) | 50 (0) | 100 (0) |
| Run | T (°C) | R (%) | F (L h−1) |
|---|---|---|---|
| 1 | 70 | 50 | 100 |
| 2 | 80 | 57 | 105 |
| 3 | 90 | 64 | 110 |
| 4 | 90 | 71 | 115 |
| 5 | 90 | 78 | 120 |
| 6 | 90 | 85 | 125 |
| 7 | 90 | 92 | 130 |
| 8 | 90 | 100 | 135 |
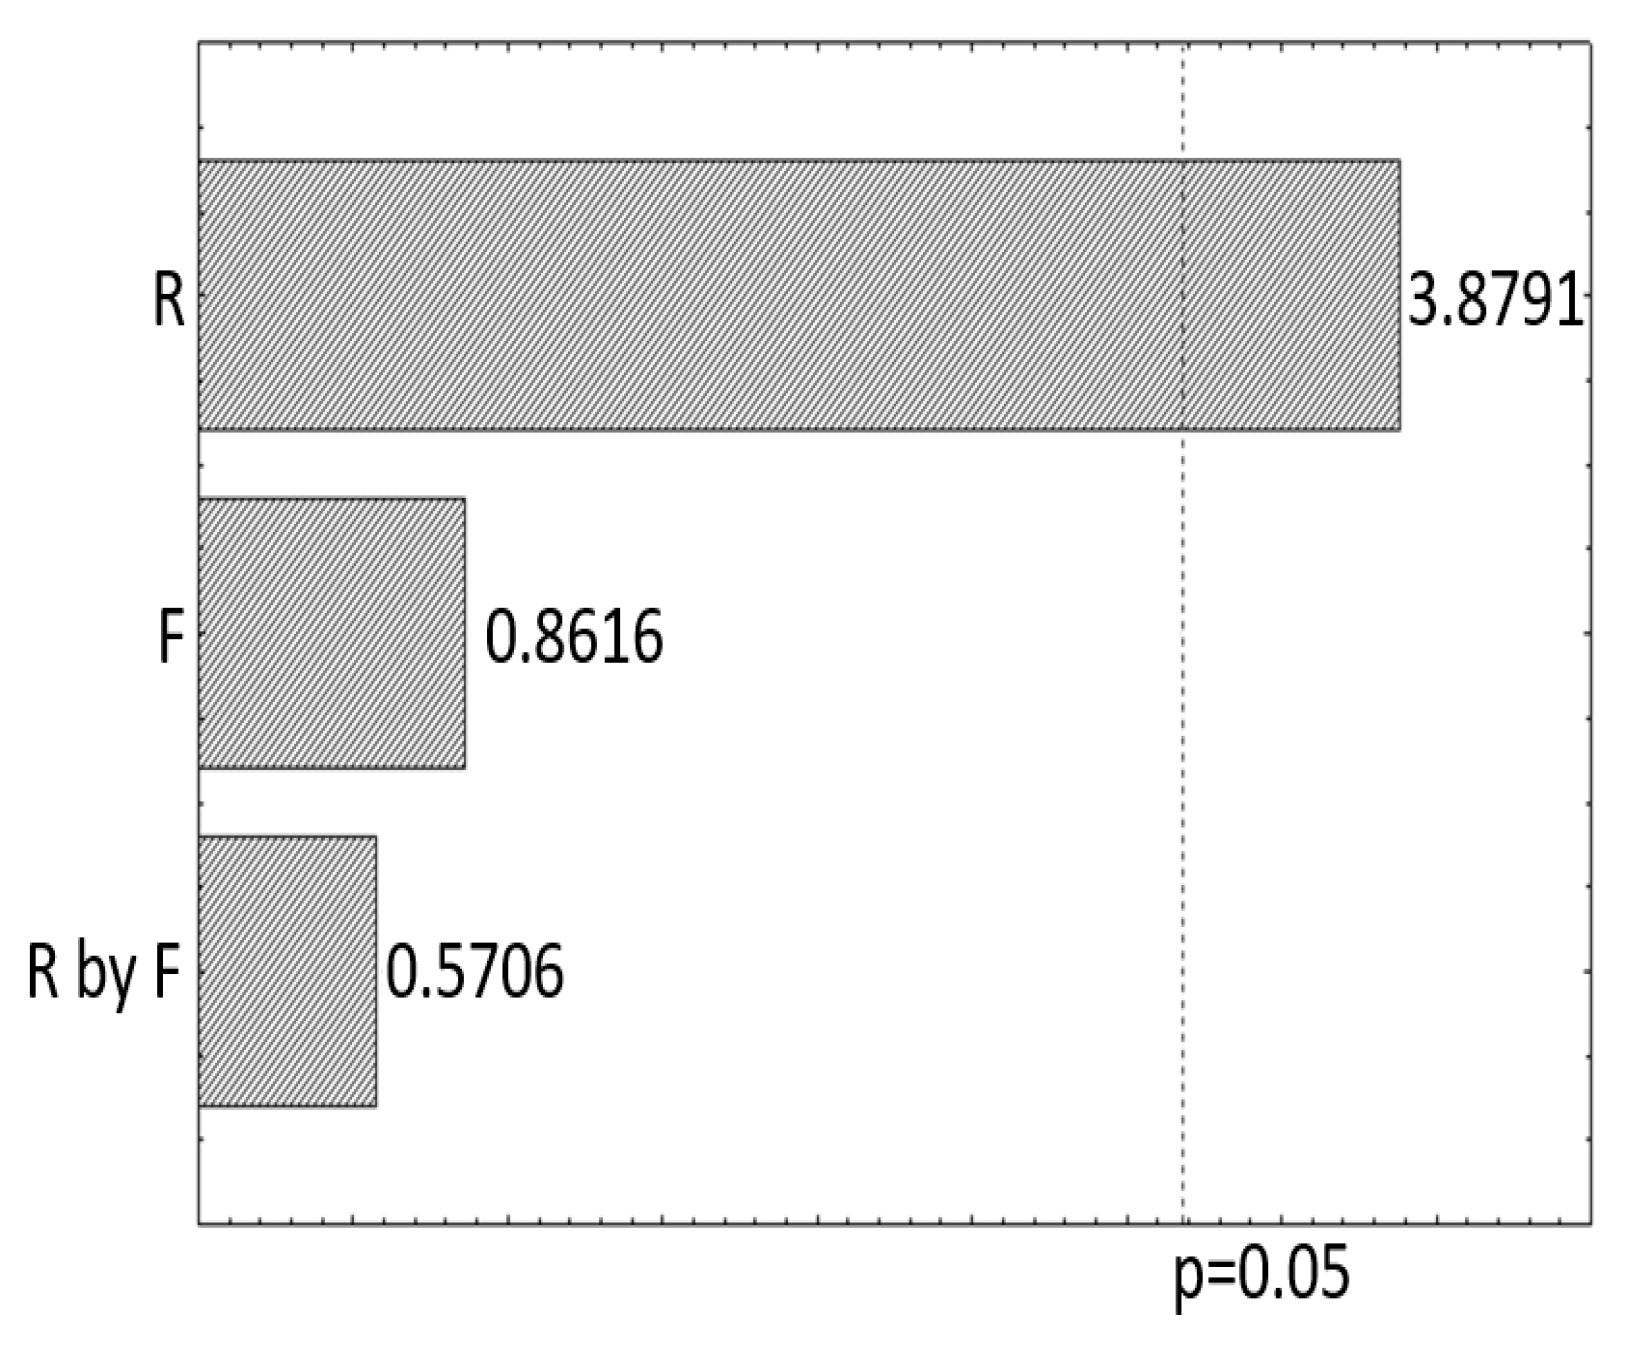
| Run | R (%) | F (L h−1) |
|---|---|---|
| 1 | 64 (−1) | 110 (−1) |
| 2 | 64 (−1) | 130 (+1) |
| 3 | 92 (+1) | 110 (−1) |
| 4 | 92 (+1) | 130 (+1) |
| 5 * | 78 (0) | 120 (0) |
| 6 * | 78 (0) | 120 (0) |
| 7 * | 78 (0) | 120 (0) |
| 8 * | 78 (0) | 120 (0) |
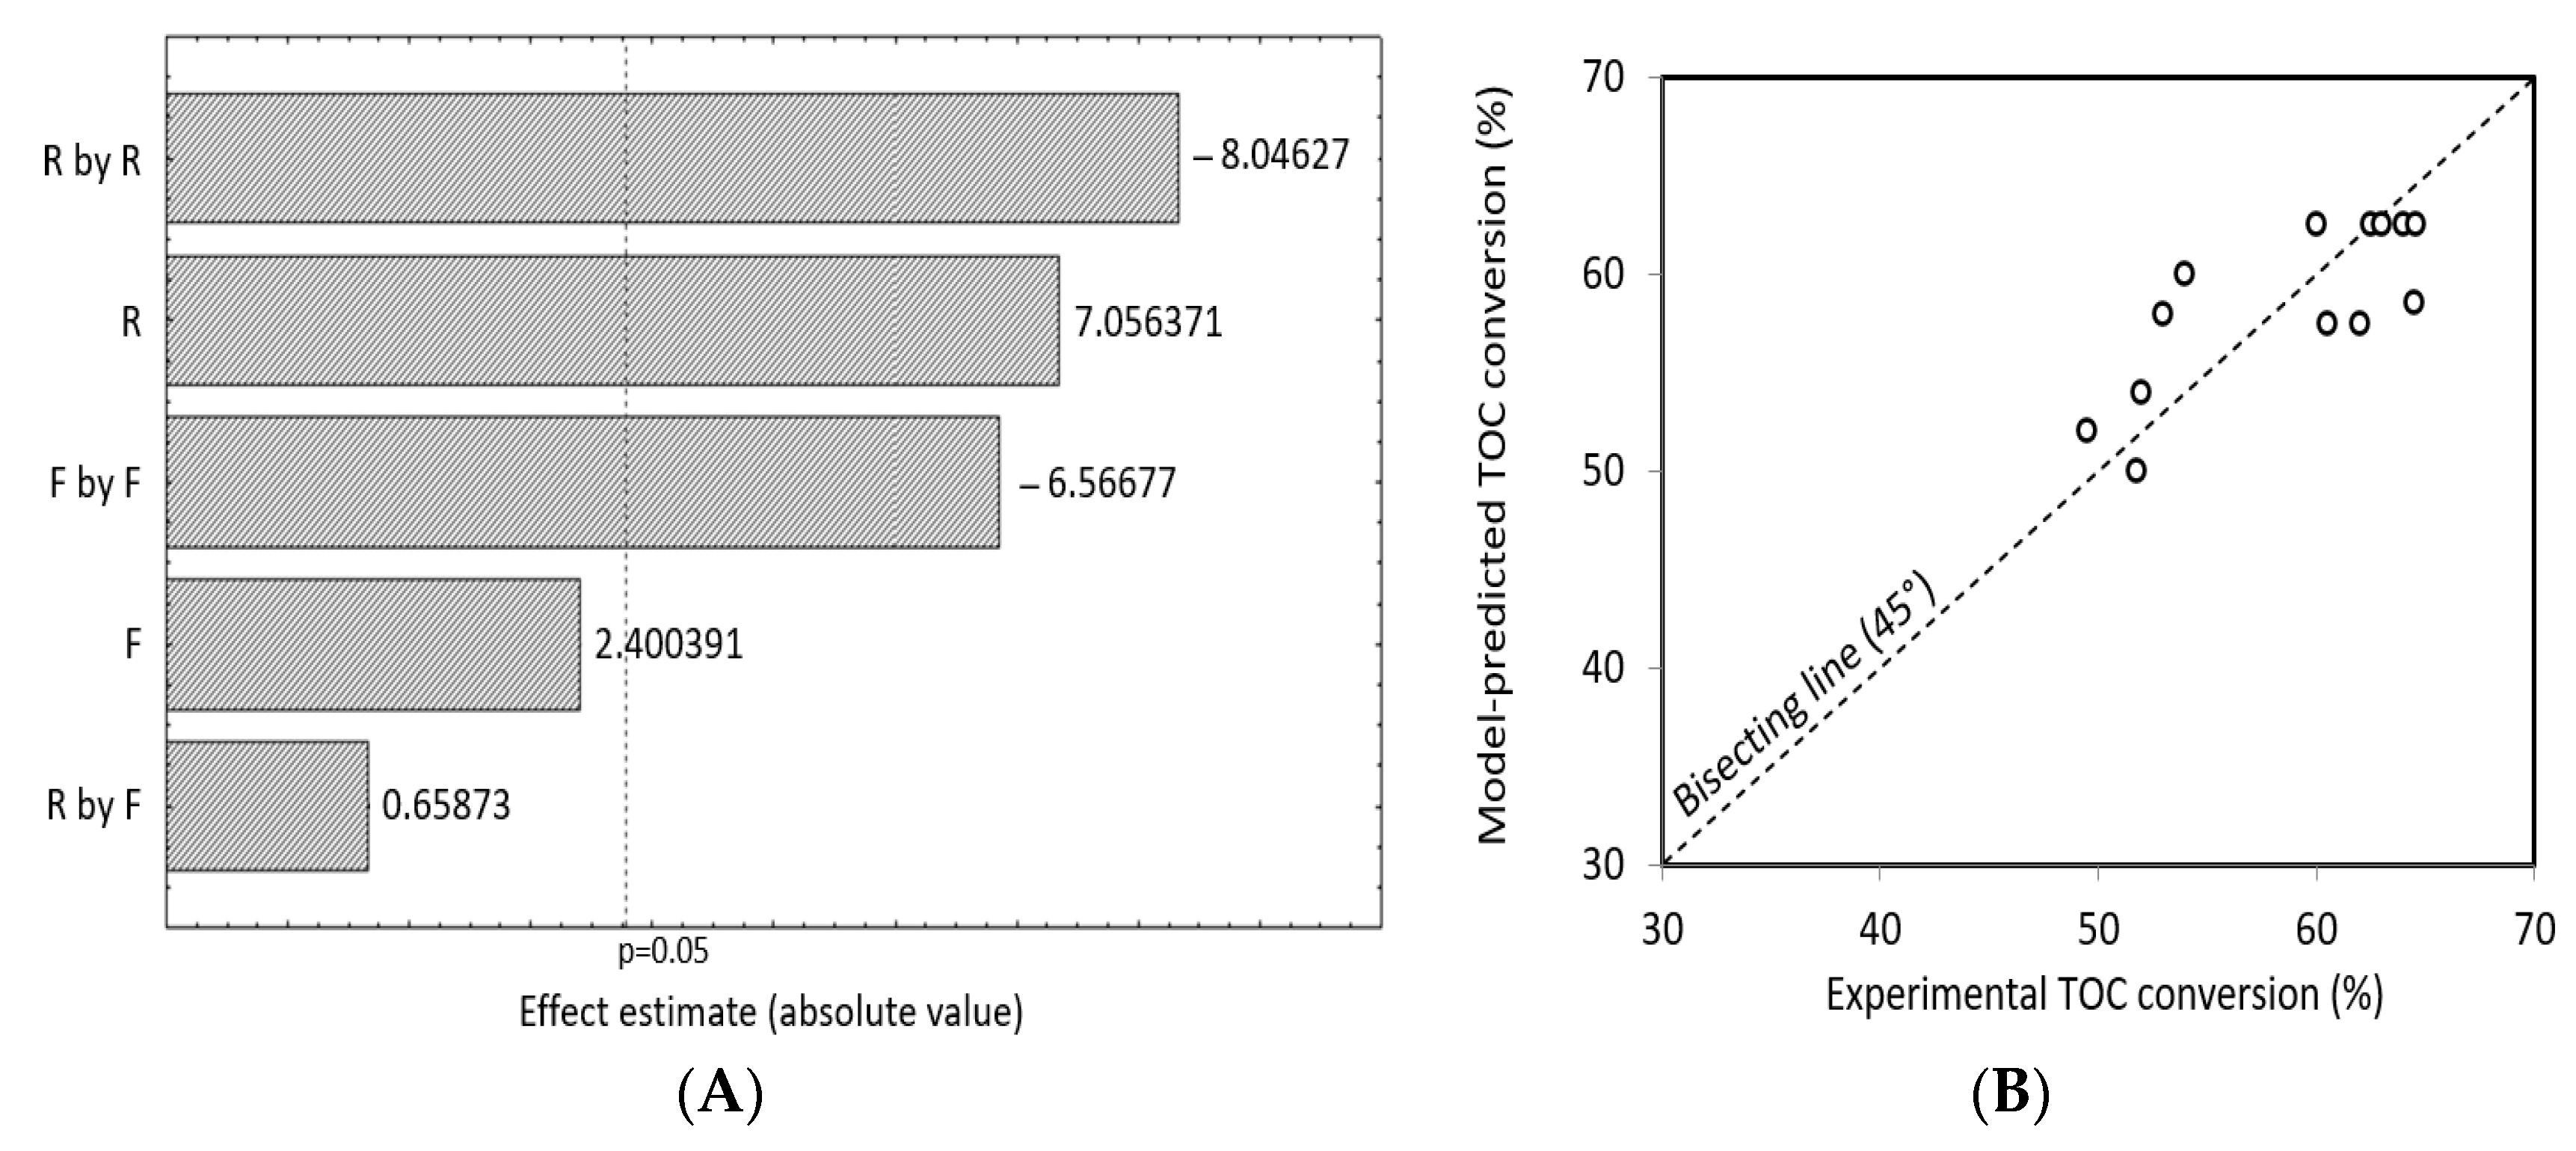
| Run | R (%) | F (L h−1) |
|---|---|---|
| 1 | 58 (−1.41) | 120 (0) |
| 2 | 78 (0) | 106 (−1.41) |
| 3 | 98 (+1.41) | 120 (0) |
| 4 | 78 (0) | 134 (+1.41) |
| 5 | 78 (0) | 120 (0) |
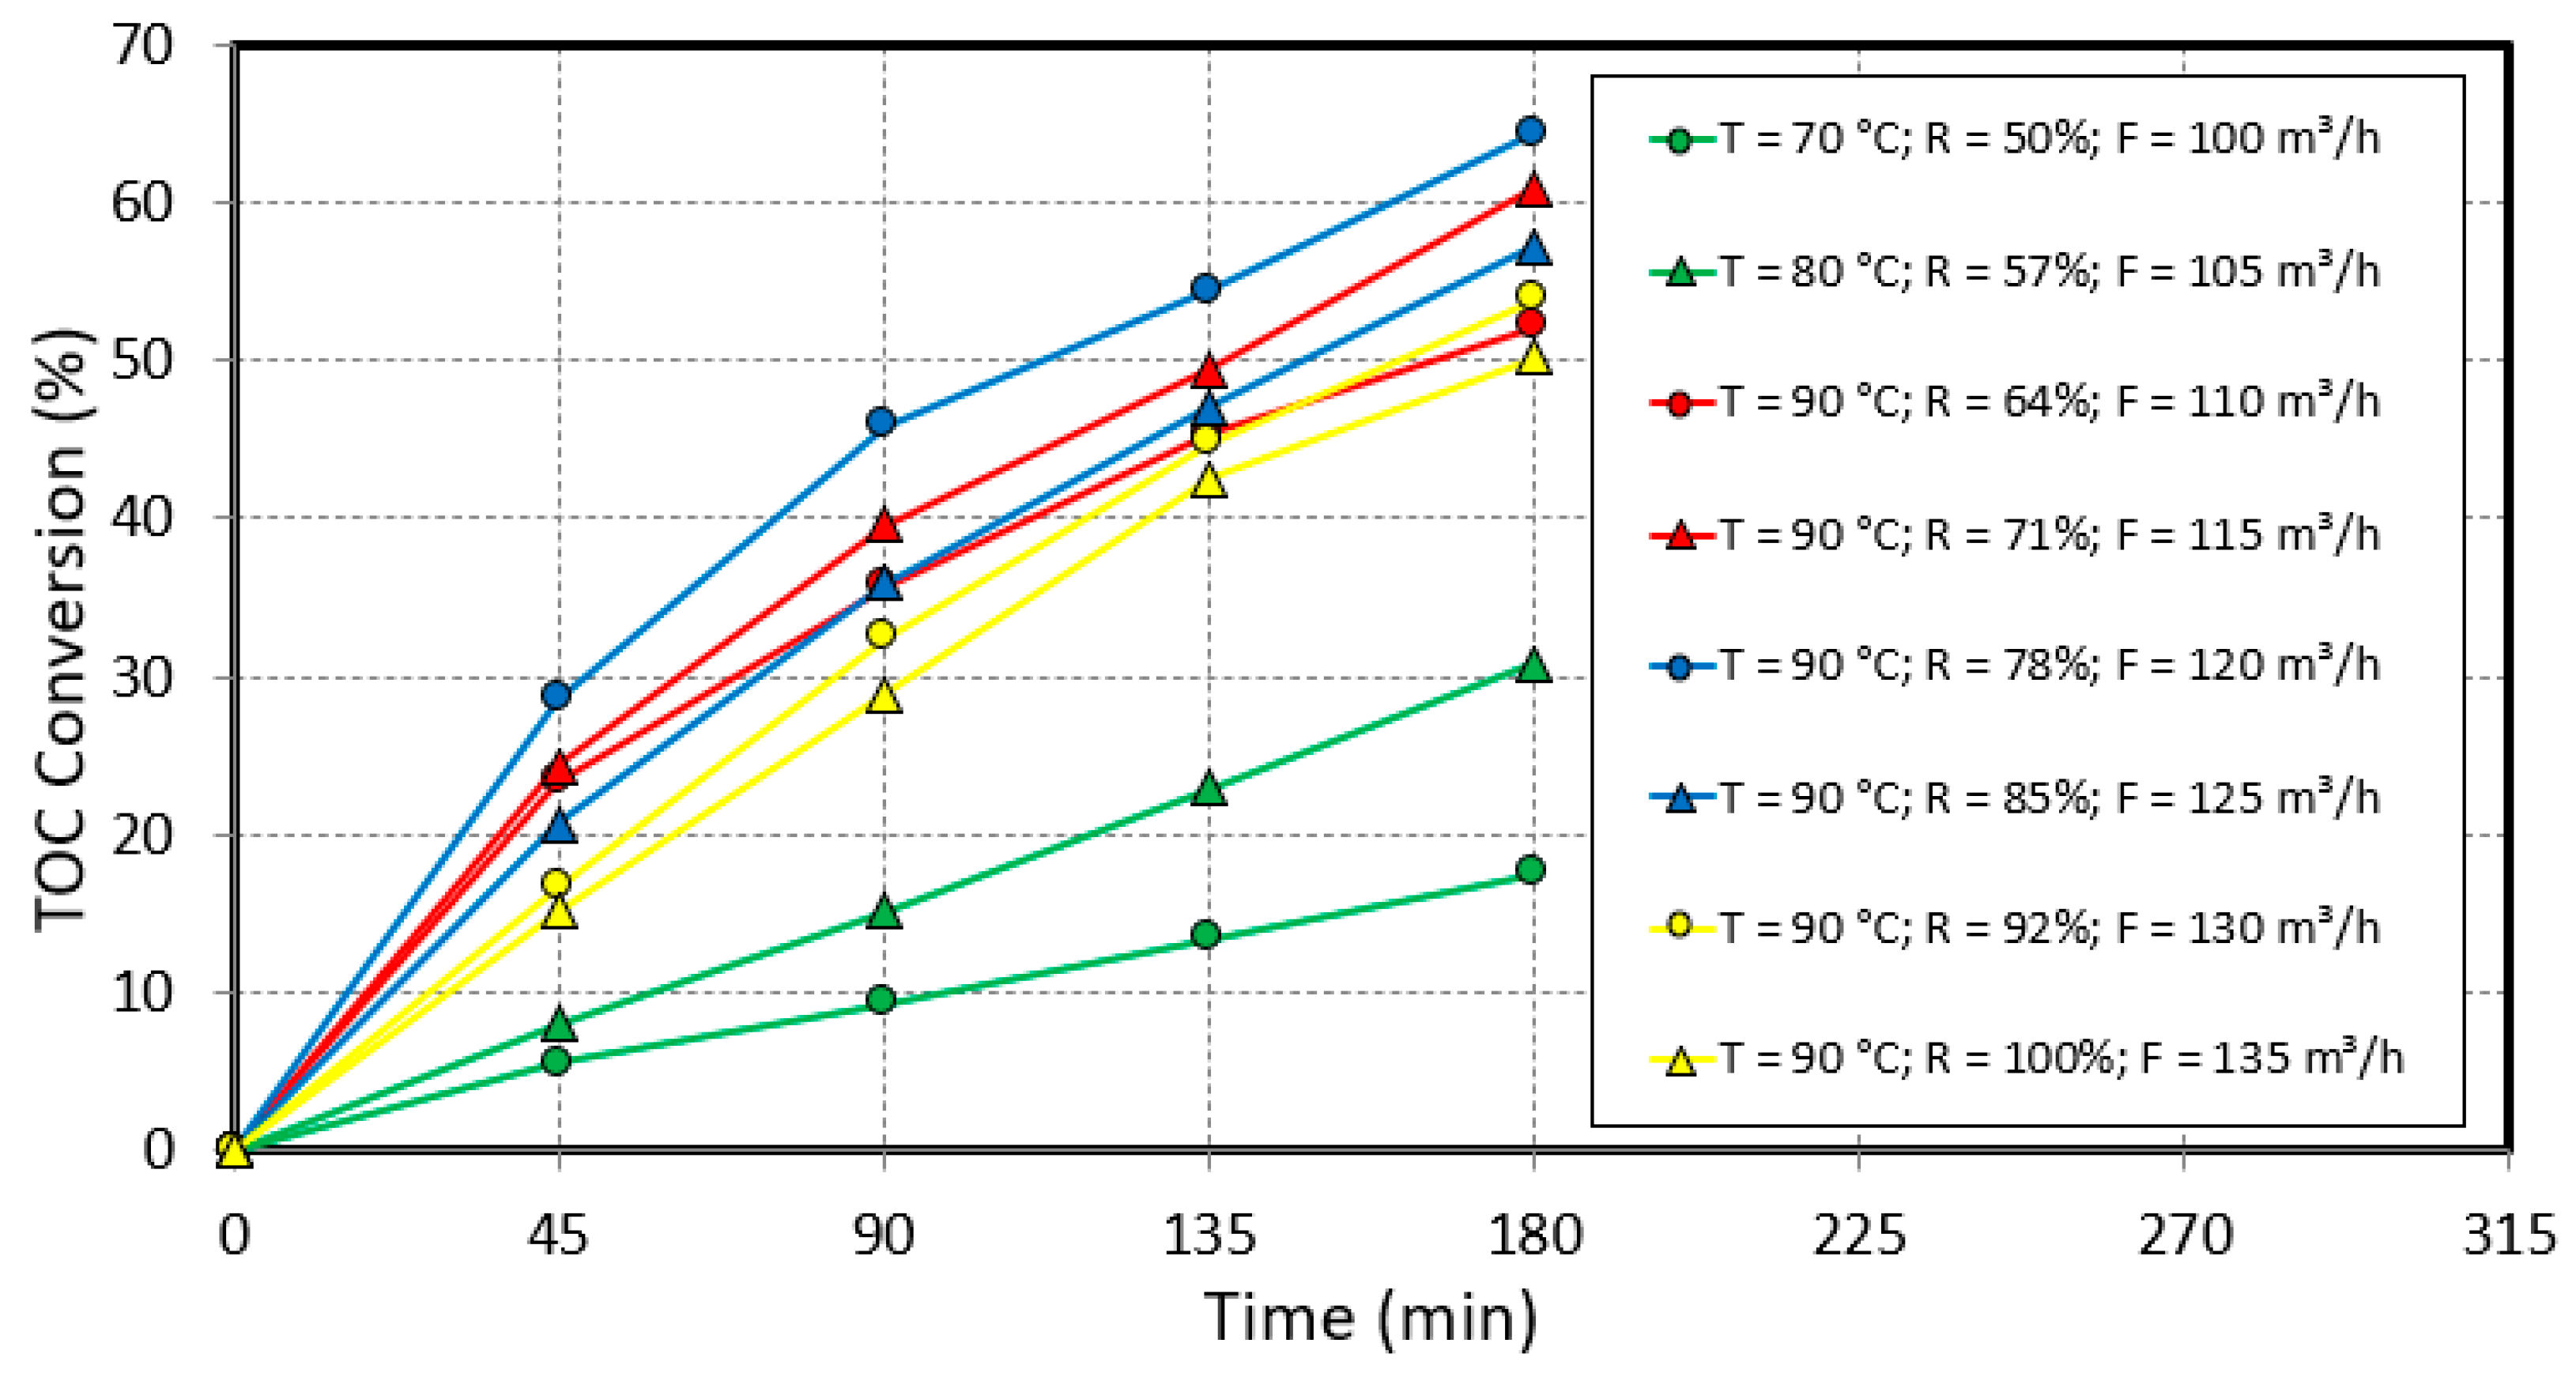
| Run | Increment | T (°C) | R (%) | F (L h−1) | p-Cresol Conversion(%) | TOC Conversion(%) |
|---|---|---|---|---|---|---|
| 1 | Cxi | 70 | 50 | 100 | 39.65 | 17.48 |
| 2 | Cxi + Δxi | 80 | 57 | 105 | 80.58 | 30.80 |
| 3 | Cxi + 2Δxi | 90 | 64 | 110 | 99.92 | 52.10 |
| 4 | Cxi + 3Δxi | 90 | 71 | 115 | 100.00 | 60.86 |
| 5 | Cxi + 4Δxi | 90 | 78 | 120 | 100.00 | 64.27 |
| 6 | Cxi + 5Δxi | 90 | 85 | 125 | 99.80 | 57.15 |
| 7 | Cxi + 6Δxi | 90 | 92 | 130 | 99.62 | 53.88 |
| 8 | Cxi + 7Δxi | 90 | 100 | 135 | 99.17 | 50.15 |
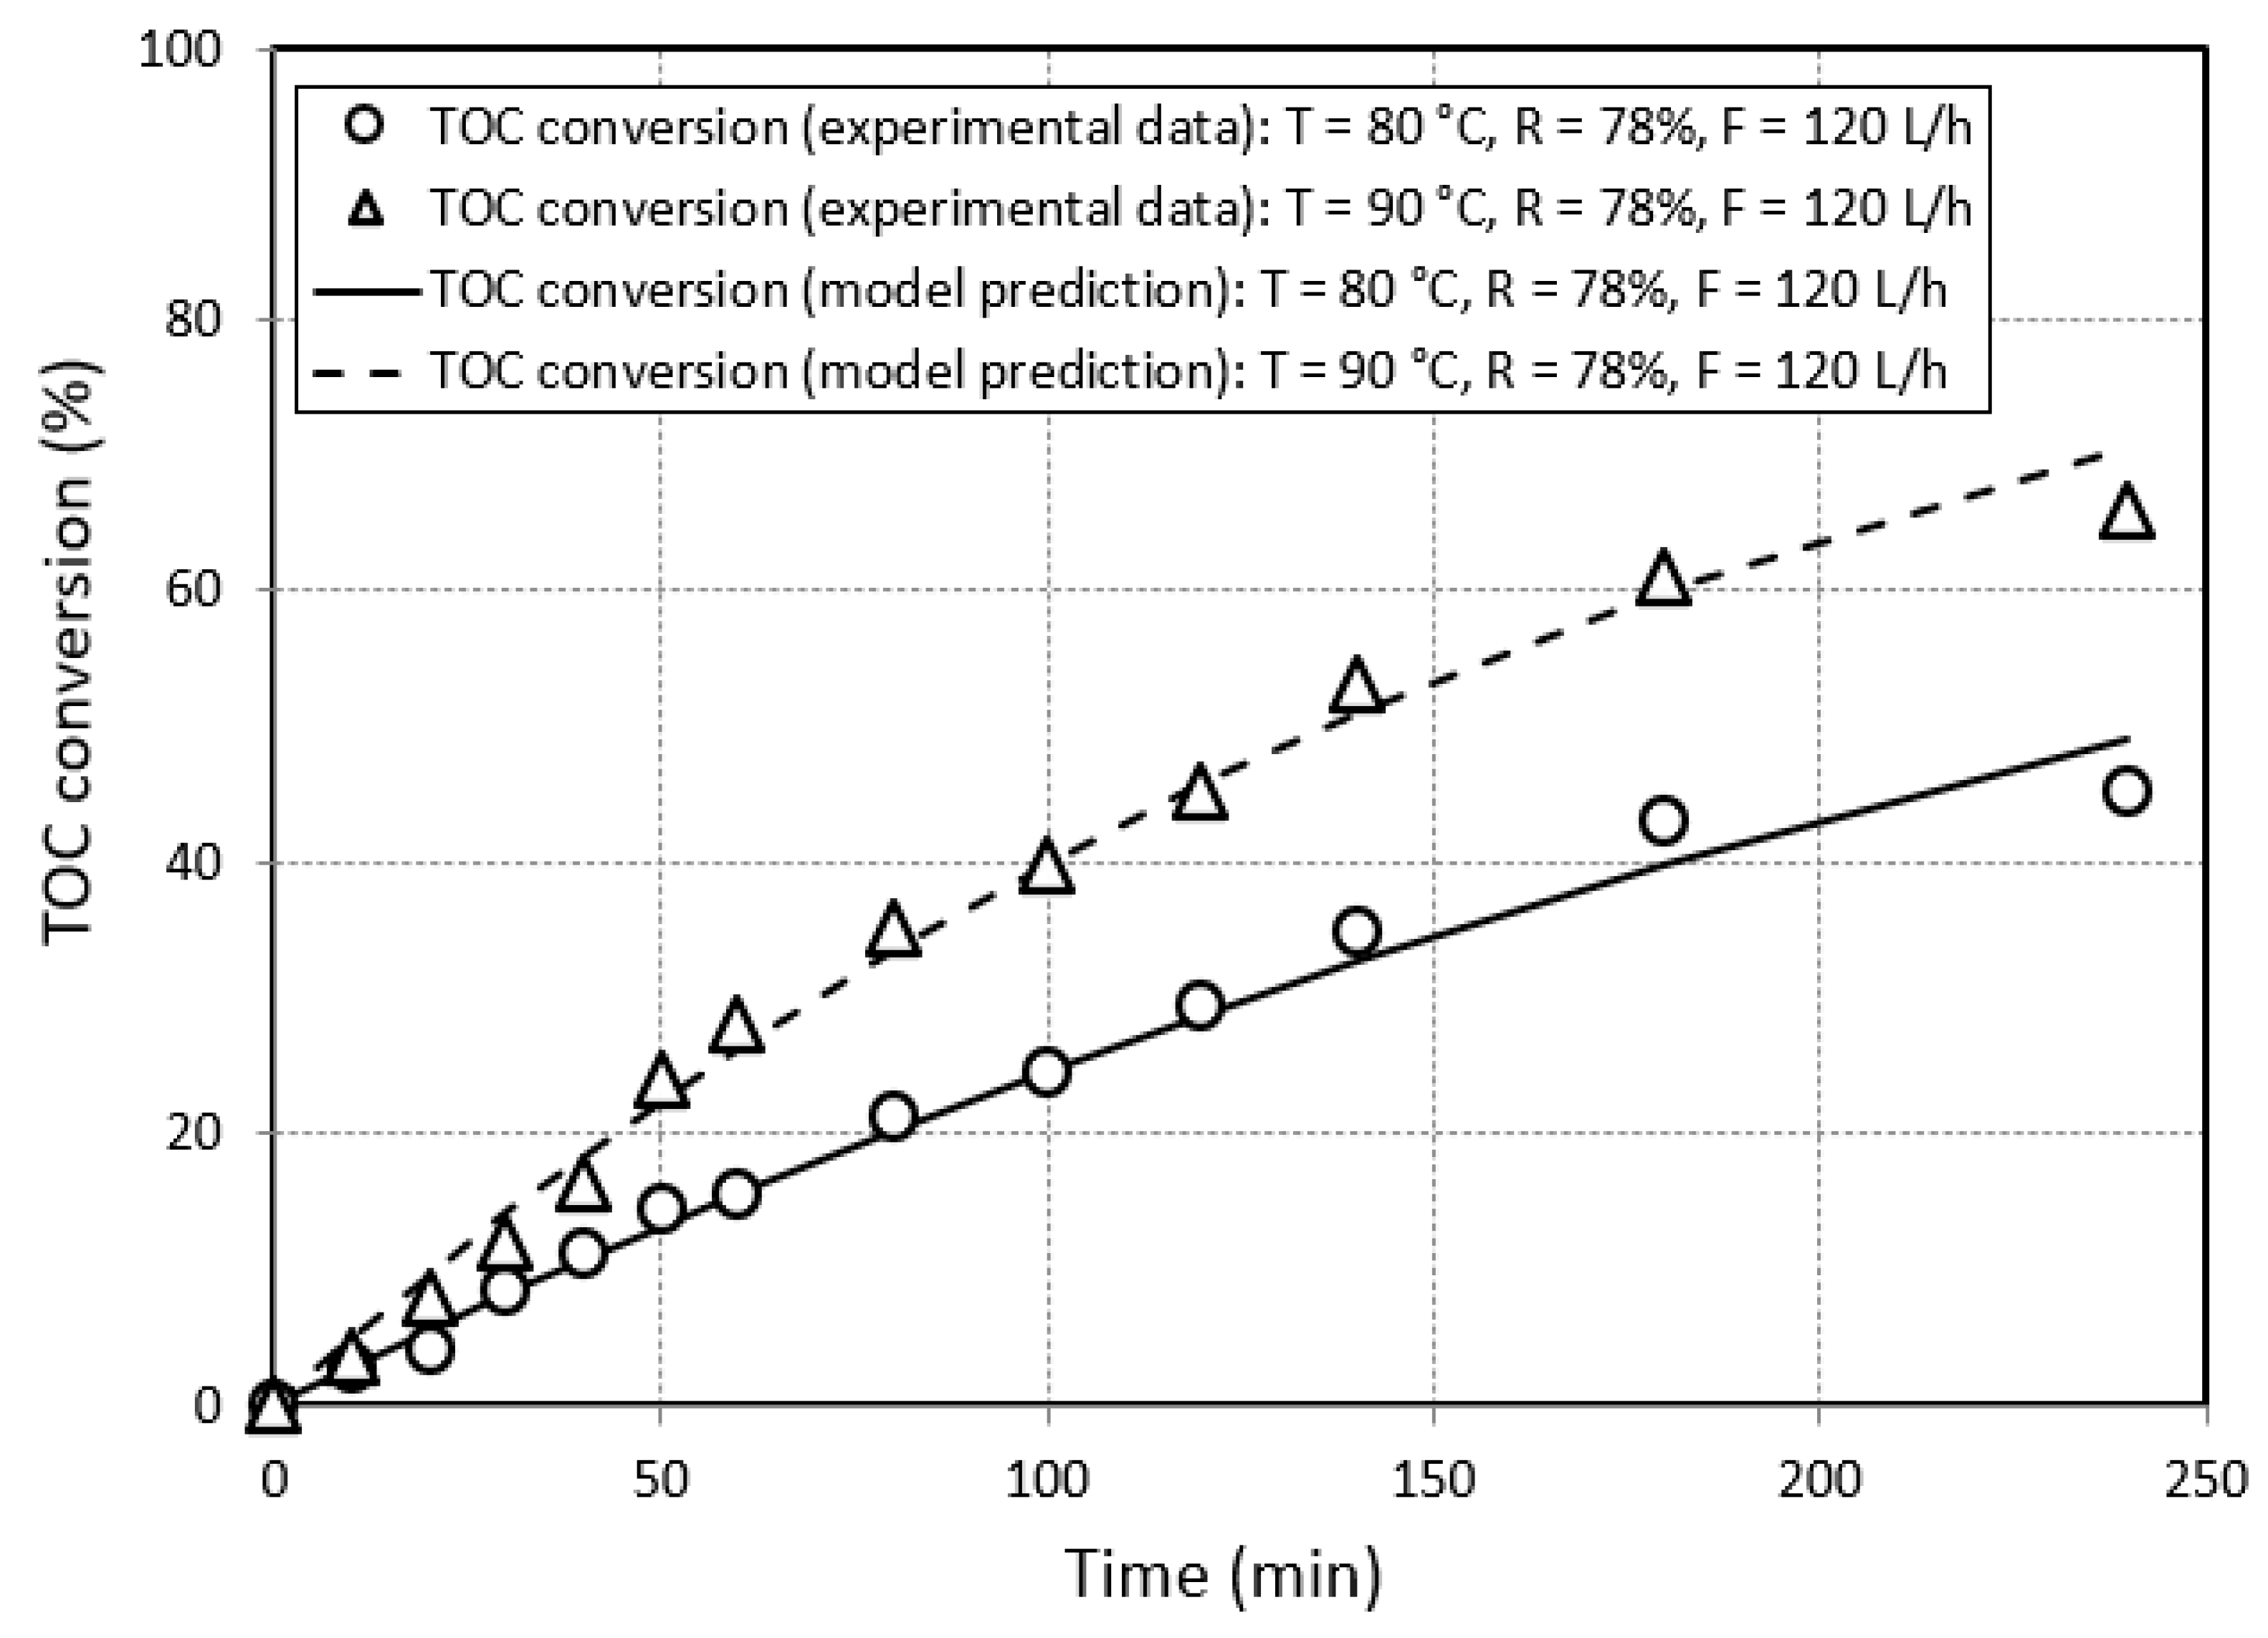
| Time (min) | T = 80 °C | T = 90 °C | ||||
|---|---|---|---|---|---|---|
| TOC (mg L−1) | TOC/TOC0 | TOC Conversion (%) | TOC (mg L−1) | TOC/TOC0 | TOC Conversion (%) | |
| 0 | 387.20 | 1.00 | 0.00 | 382.93 | 1.00 | 0.00 |
| 10 | 376.53 | 0.97 | 2.75 | 369.33 | 0.96 | 3.55 |
| 20 | 370.75 | 0.96 | 4.25 | 352.80 | 0.92 | 7.87 |
| 30 | 354.59 | 0.92 | 8.42 | 337.33 | 0.88 | 11.91 |
| 40 | 344.08 | 0.89 | 11.14 | 320.53 | 0.84 | 16.30 |
| 50 | 331.20 | 0.86 | 14.46 | 290.67 | 0.76 | 24.09 |
| 60 | 326.61 | 0.84 | 15.65 | 274.93 | 0.72 | 28.20 |
| 80 | 304.99 | 0.79 | 21.23 | 237.87 | 0.62 | 37.88 |
| 100 | 292.48 | 0.76 | 24.46 | 204.80 | 0.53 | 46.52 |
| 120 | 273.07 | 0.71 | 29.48 | 185.25 | 0.48 | 51.62 |
| 140 | 251.81 | 0.65 | 34.97 | 165.68 | 0.43 | 56.73 |
| 180 | 220.16 | 0.57 | 43.14 | 148.93 | 0.39 | 61.11 |
| 240 | 212.05 | 0.55 | 45.23 | 124.34 | 0.32 | 67.53 |
| Kinetic Constant | T = 80 °C | T = 90 °C |
|---|---|---|
| k1 (min−1) | 3.19 × 10⁻¹ | 4.73 × 10⁻¹ |
| k2 (min−1) | 2.99 × 10⁻³ | 5.52 × 10⁻³ |
| k3 (min−1) | 0.00 | 0.00 |
| Reaction Temperature (°C) | k2 (min−1) | Ea2 (kJ mol−1) |
|---|---|---|
| 80 | 2.82 × 10⁻³ | 62.94 |
| 90 | 5.09 × 10⁻³ |
Disclaimer/Publisher’s Note: The statements, opinions and data contained in all publications are solely those of the individual author(s) and contributor(s) and not of MDPI and/or the editor(s). MDPI and/or the editor(s) disclaim responsibility for any injury to people or property resulting from any ideas, methods, instructions or products referred to in the content. |
© 2023 by the authors. Licensee MDPI, Basel, Switzerland. This article is an open access article distributed under the terms and conditions of the Creative Commons Attribution (CC BY) license (https://creativecommons.org/licenses/by/4.0/).
Share and Cite
Oliveira, J.G.C.; Brandão, Y.B.; Oliveira, D.C.; Teodosio, J.R.; Moraes, C.M.; Converti, A.; Casazza, A.A.; Sarubbo, L.A.; Benachour, M. Treatment of Effluent Containing p-Cresol through an Advanced Oxidation Process in a Batch Reactor: Kinetic Optimization. Energies 2023, 16, 5027. https://doi.org/10.3390/en16135027
Oliveira JGC, Brandão YB, Oliveira DC, Teodosio JR, Moraes CM, Converti A, Casazza AA, Sarubbo LA, Benachour M. Treatment of Effluent Containing p-Cresol through an Advanced Oxidation Process in a Batch Reactor: Kinetic Optimization. Energies. 2023; 16(13):5027. https://doi.org/10.3390/en16135027
Chicago/Turabian StyleOliveira, Julierme G. C., Yana B. Brandão, Dinaldo C. Oliveira, Jailson R. Teodosio, Cristiane M. Moraes, Attilio Converti, Alessandro Alberto Casazza, Leonie Asfora Sarubbo, and Mohand Benachour. 2023. "Treatment of Effluent Containing p-Cresol through an Advanced Oxidation Process in a Batch Reactor: Kinetic Optimization" Energies 16, no. 13: 5027. https://doi.org/10.3390/en16135027