1. Introduction
It is known that free path and wire-guided underwater spark discharges can generate strong pressure impulses; such impulses have been studied for examples in [
1,
2] and in [
3,
4]. Pressure impulses generated by underwater spark discharges can be used for electrohydraulic crushing and fragmentation of solid materials, for waste utilization and management [
5], extraction and liberation of valuable minerals and inclusions in mineral processing [
6] and in other practical applications.
Although the breakdown processes in water have been studied over several decades, these complex phenomena are not yet fully understood. It is known that the magnitude of pressure impulses generated by underwater spark discharges depends on the energy delivered into the spark channel [
4]. Thus, in order to achieve stronger pressure impulses for the same available discharge energy, pre-breakdown energy losses should be minimized since they reduce the amount of energy available to be delivered into the post-breakdown plasma channel.
In the case of free path discharges, the inter-electrode gap is filled with water (the electrodes are submerged in water). Thus, the pre-breakdown process depends upon the conductivity of the water [
7], the electrode topology and the pulse parameters of the high-voltage impulses, which are defined by the pulse-driving circuit. The initial phase of a free underwater discharge may include the formation of a gas cavity through joule heating and the subsequent development of a gas discharge in this cavity (the gas bubble theory [
8,
9]). As discussed in [
10], for µs high-voltage impulses, the formation of gas-filled structures could be the dominant factor that governs the entire pre-breakdown process. For ms impulses, the joule heating process plays a critical role in the development of the breakdown of water [
11]. However, if the electrodes are stressed with shorter, sub-µs high-voltage impulses, the breakdown process may progress through transient ionization of the water without the formation of gas cavities [
12], i.e., through the development of fast ionization fronts (streamers) [
13].
To stabilize the breakdown process and to develop longer spark plasma channels, a thin conductive wire can be placed between the electrodes. In such cases of wire-guided discharges, the pre-breakdown processes include the fast impulsive heating and melting of the wire and the subsequent breakdown of the channel filled with gas (vapour) and liquid metal droplets. Such wire-initiated breakdowns typically result in a significantly shorter pre-breakdown time and lower pre-breakdown energy losses as compared with free path discharges in water. For example, in [
14], it was shown that the use of a thin 100 µm-diameter, 5 cm-long copper wire resulted in a ~4 µs delay to the formation of a highly conductive post-breakdown plasma channel. However, in the case of free path discharges in a 0.4 cm long gap, the pre-breakdown delay time was ~120 µs with the same energy, and 675 J was available in discharge and at the same 15 kV charging voltage. Thus, a thin conductive wire connecting the two electrodes helps to minimize the pre-breakdown energy loss. Underwater wire-guided discharges can support high density and high temperature plasma, and the generation of strong shock waves. Such discharges can be used in different practical applications including oil-well unblocking and electro-hydraulic forming [
15,
16].
The energy and hydrodynamic aspects of free path and wire-guided underwater spark discharges and the characteristics of pressure impulses generated by these discharges have been investigated since the late 1950s. For example, in [
17], it was found that the pressure in the plasma channel developed by wire-guided discharges could exceed 20,000 atm. The total capacitance of the pulsed capacitive system used in this work was 5.8 µF, the charging voltage was 25 kV and the length of the wire (developed plasma channel) was 1.5 cm. More recently, in [
18], the authors used a capacitive pulsed power system with similar parameters (5.4 µF total capacitance, charging voltage of 30 kV) to generate underwater wire-guided discharges stabilized by longer 8.5 cm copper wires. It was estimated that the maximum pressure in the plasma channel in such conditions was over 6000 atm. The study of underwater spark discharges continues, e.g., wire-guided discharges and the characteristics of pressure pulses generated by these discharges have recently been investigated in [
10,
19,
20]. In [
21], characteristics of the pressure impulses generated by free path discharges in water were studied. In [
22], the pressure wave magnitude and energy efficiency of both types (free path and wire-guided) of underwater discharges were investigated and analysed.
However, despite the significant number of studies focused on the breakdown processes in water under different energization regimes, the complex processes involved in the formation of underwater discharges still require further investigation in order to provide reliable models that can be used for the optimization of energy characteristics and pressure impulses generated by underwater spark discharges.
In particular, it is important to compare the pre-breakdown energy losses for free path and wire-guided discharges for the same energy available in the discharge in order to optimize the operational parameters of the pulse-driving circuits and to improve the efficiency of energy conversion required for the generation of stronger pressure impulses for the same amount of stored electrical energy. Moreover, postulating the importance of the role of joule heating in the development of underwater discharges in the case of µs (or longer) high-voltage impulses, the development of models that can be used in the analysis of the fast local heating of water in high electric fields is required. Such a thermal model has been developed in the present paper for free path underwater discharges. The time of cavity formation and energy required to form the cavity obtained from the model are compared with the experimentally measured values.
The experimental part of the present work focused on the study of pressure impulses generated by free path and wire-guided discharges using the same energy available in the discharge, and on the analysis of the pre-breakdown energy losses and energy delivered into the spark channel. The nominal magnitude of the generated pressure impulses, the energy delivered into the plasma channel and the pre-breakdown energy losses obtained for free path and wire-guided discharges were obtained and compared in order to establish the most efficient method of generation of pressure impulses. The nominal magnitude of the pressure impulse as a function of distance from the spark discharge was obtained and analysed for pressure impulses generated by free path and wire-guided underwater discharges.
2. Experimental Setup
The experimental system used in the present work consists of a capacitive pulsed power system which generates HV impulses, a water tank filled with tap water, an electrode system used to generate either free path or wire-guided discharges and electrical and pulsed pressure diagnostic devices. This set-up presented in
Figure 1 is similar to the systems described in [
4,
23].
The capacitor
C, used for energy storage in the pulsed power system, is a HV capacitor manufactured by Maxwell Laboratories Inc., San Diego, California, USA with a nominal capacitance of 265 nF. It was charged using a DC power supply (Matsusada AU series) manufactured by Matsusada Precision Inc., Shiga, Japanthrough a charging resistor (1 MΩ). The charging voltage used in all tests was 35 kV. The output HV pulse was generated by manually operating mechanical closing switch. The output voltage was measured using a HV probe (Tektronix P6015A, Tektronix Inc, Beaverton, OR, USA, 1000:1 division ratio and 75 MHz bandwidth,); the current in the discharge circuit was obtained using a low-inductance current shunt with a sensitivity of 29.6 V/kA, manufactured by SAMTECH Ltd. The voltage and current waveforms were recorded using a digitizing oscilloscope, (Tektronix TBS1102B, Tektronix Inc., Beaverton, OR, USA, 100 MHz bandwidth, 2 GS/s sampling rate, shown as “Oscilloscope 1” in
Figure 1,).
The total circuit inductance and circuit resistance (with no plasma discharge) are represented as inductor
L and resistor
RLoss,
Figure 1. The circuit resistance
RLoss governs the fraction of the total available energy that is dissipated in the circuit (excluding the plasma channel) during the post-breakdown process. The rest of the energy available in the discharge after establishment of the plasma channel is intended to be delivered into this channel.
The electrode systems used to generate free path and wire-guided discharges were located in a water tank with dimensions of (2 m) × (1 m) × (1 m), which was filled with tap water with conductivity of ~50 μS/cm at room temperature. The electrode systems were energized using the pulsed power system shown in
Figure 1. The electrical and pressure pulse parameters of free path and wire-guided underwater discharges were investigated. Each electrode system was located in the centre of the water tank and connected to the HV output terminal of the capacitive pulsed power system. The gap between the two electrodes in the case of free path discharges was set to either 5 mm or 10 mm. The conical ground electrode had a sharpened tip with a radius of 0.45 mm. The upper HV electrode had a more complex profile with a short rod structure protruding at its end, the radius of the rod is 1.25 mm, and the edge radius being 0.18 mm. The smaller edge radius of the HV electrode (as compared with the conical grounded electrode) leads to a higher electric field, which helps to promote the development of discharges from this HV electrode, while the rod structure of the HV electrode helps to reduce the erosion rate of the edge. The radii were measured using an optical microscope with a 4 × D objective equipped with a CCD camera (M1000-D, Swift Optical Instruments, Schertz, TX, USA). Photographs of the high voltage and ground electrodes used to generate free path discharges in water are presented in
Figure 2.
A schematic diagram of the test-cell assembly used to generate wire-guided discharges is presented in
Figure 3. This system consists of two circular stainless-steel flanges (plates) with radii of 50 mm connected by three stainless-steel rods. In the centre of this test-cell formed by the flanges and rods, two crocodile clips were located at the upper clip, which was connected to a high-voltage cable, and the lower clip, which was attached to a stainless-steel rod bolted to the lower grounded flange. In each test, a high-purity copper wire (99.5% Cu) with 0.025-mm radius was located between and fixed by the crocodile clips. The distance between the clips was either 30 mm or 50 mm, these being the two lengths of wire used to generate wire-guided discharges.
A piezoelectric acoustic sensor (Pinducer VP-1093, Valpey Fisher, now CTS Corporation, Lisle, IL, USA) was used to detect the pressure impulses generated by spark discharges in water and to measure their nominal magnitude. The output voltage signal from the acoustic sensor was monitored by a digitizing oscilloscope (Tektronix DPO2024, 200 MHz bandwidth and 1 GS/s sample rate, Tektronix Inc, Beaverton, OR, USA, “Oscilloscope 2” in
Figure 1). The pressure signals were measured in the interval from 40 cm to 70 cm away from the spark-discharges source, in 10 cm increments.
3. Electrical Parameters
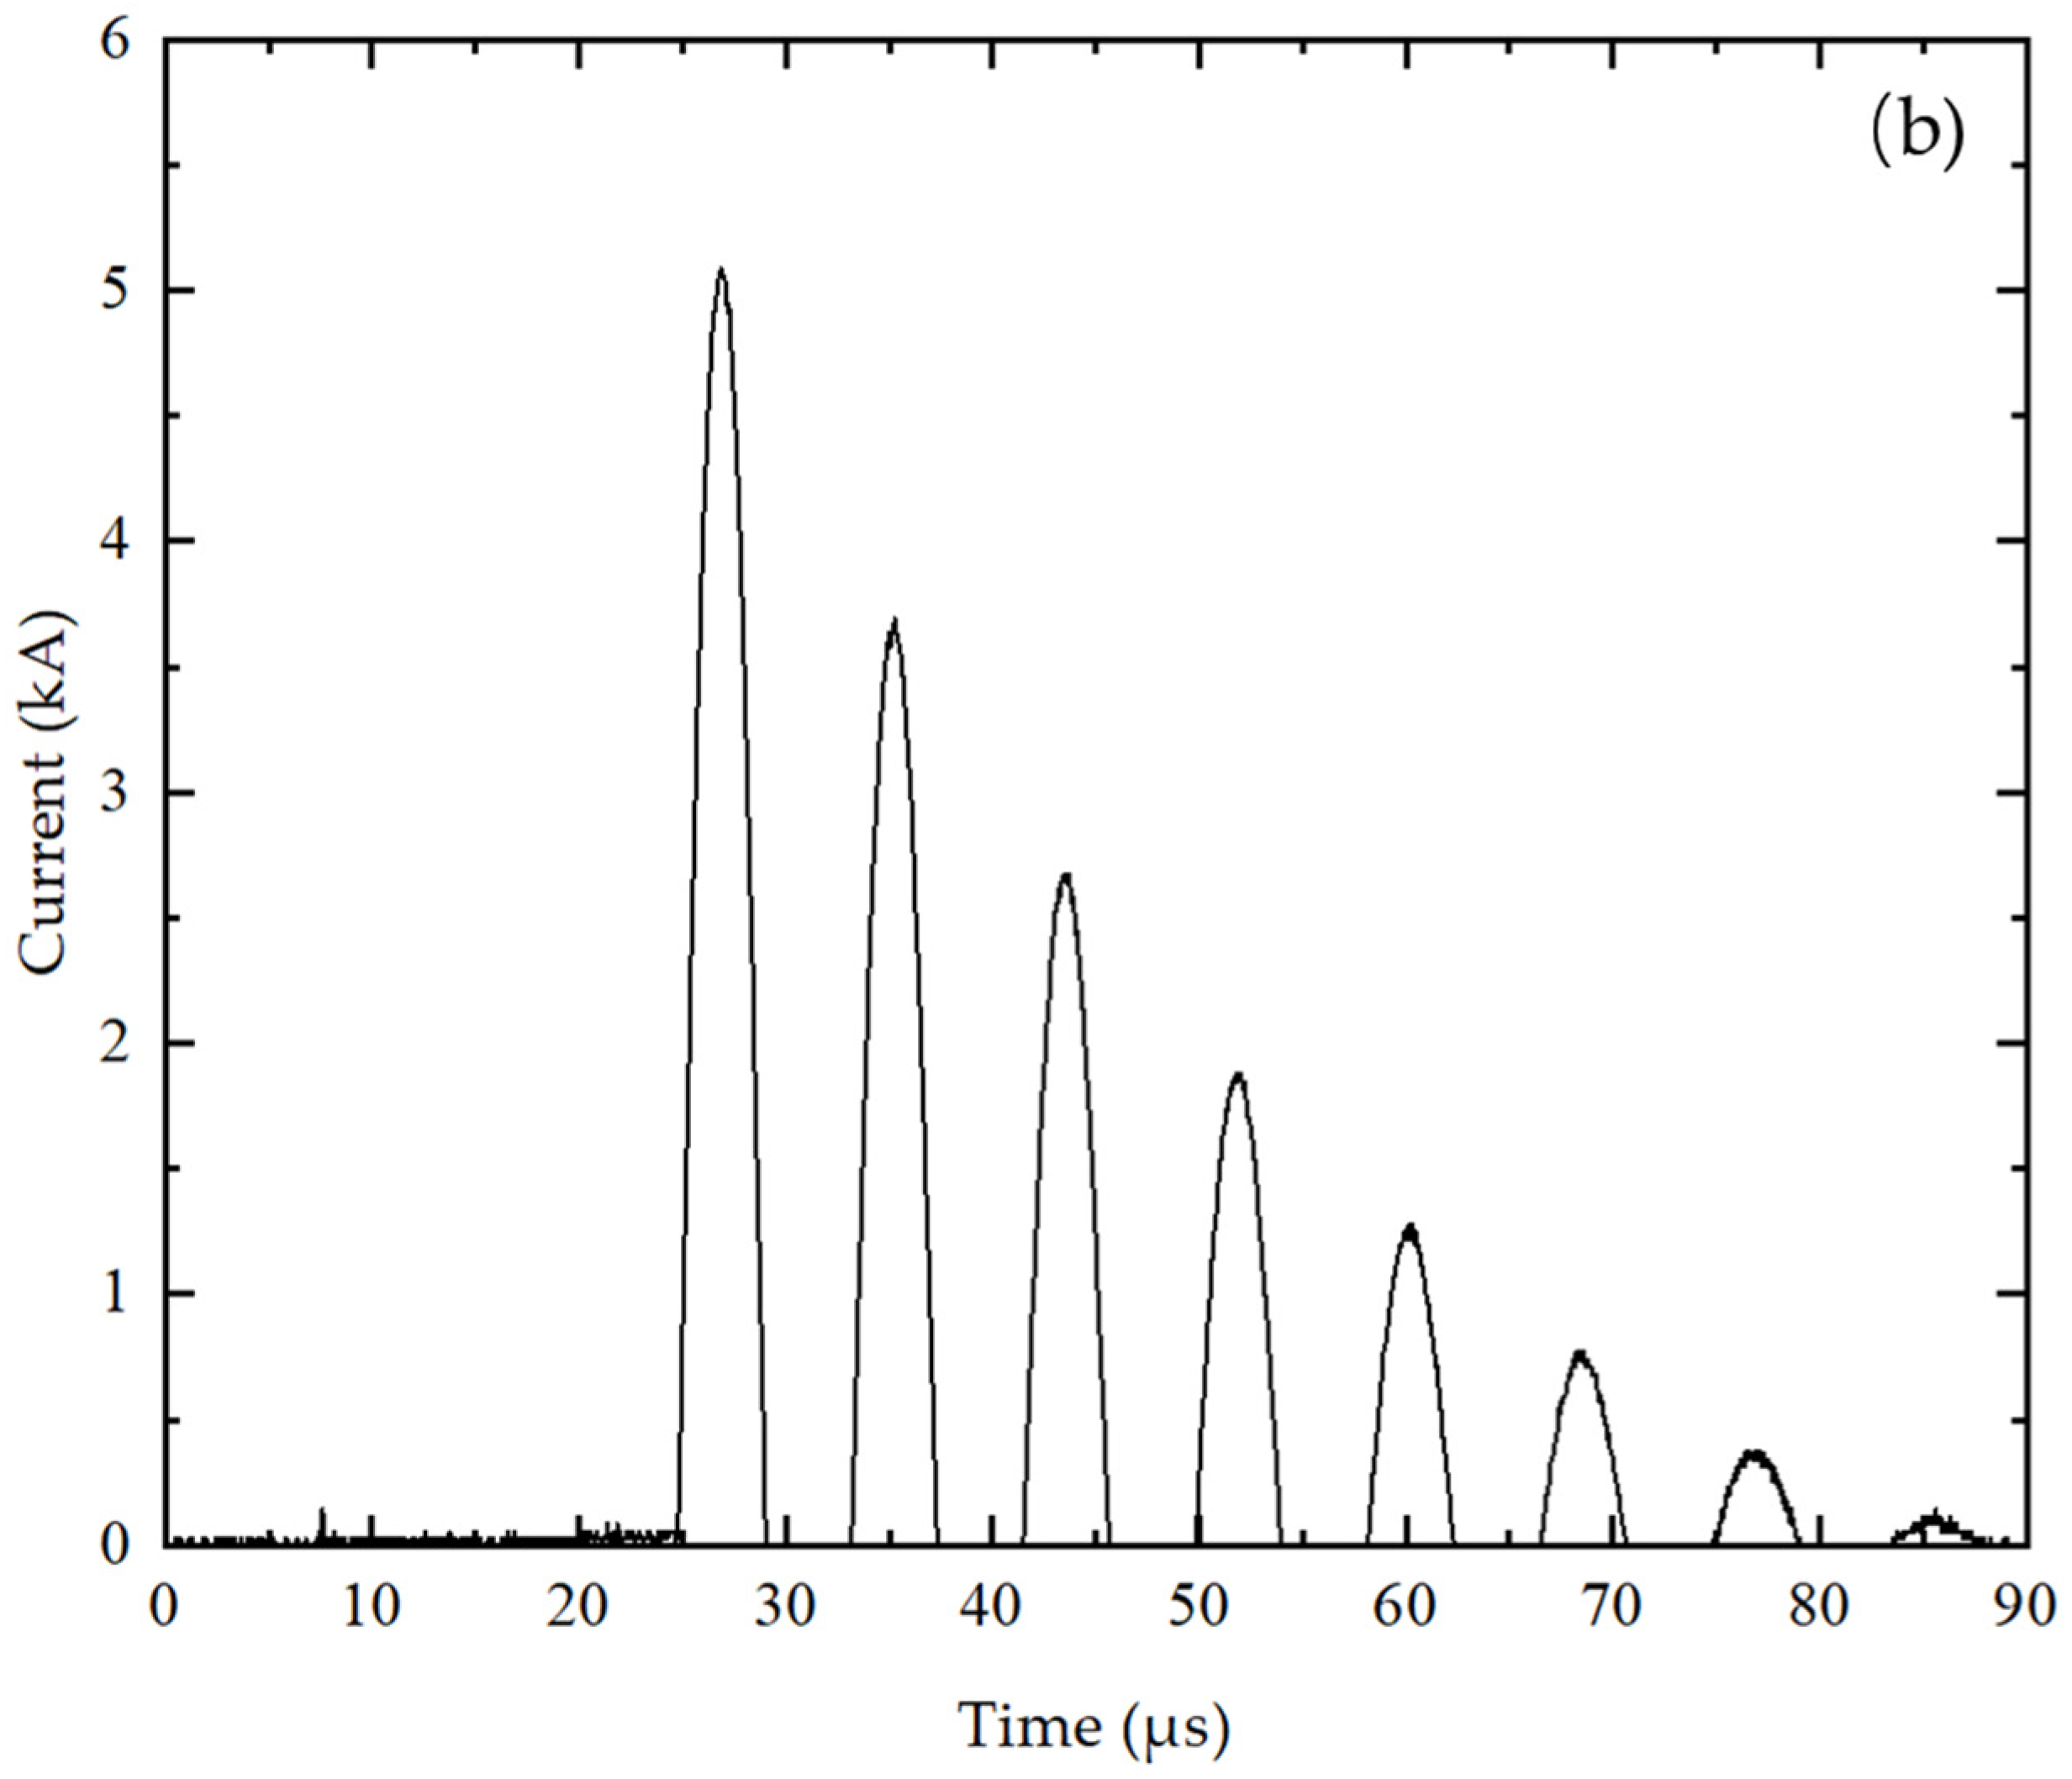
Voltage and current waveforms were obtained in each underwater discharge test. Typical waveforms for a free path discharge in water are shown in
Figure 4. There are two main phases that can be distinguished in the free path breakdown process. Initially, the applied voltage,
V0, appears across the electrodes upon closure of the switch in the pulsed power circuit. The tap water used in this work had a conductivity of ~50 μS/cm, resulting in a decay of the voltage across the electrodes up to the moment of breakdown. The voltage value at this moment of breakdown is
Vbr. The time interval between application of
V0 and the moment of breakdown is defined as the pre-breakdown time interval,
T0. After breakdown and the formation of a conductive plasma channel between the electrodes, a significant post-breakdown current starts to flow through this breakdown channel. The post-breakdown circuit can be approximated by a lumped RLC circuit. For the experimental conditions used in the present work, the post-breakdown current and voltage waveforms show an underdamped oscillatory behaviour. The envelopes of the post-breakdown oscillations of voltage and current are symmetrical relative to the zero axis. This allows the analysis of the plasma resistance based on Equation (1) to be performed using only the positive peaks. Thus, for better visualization of the envelopes and to provide better visual resolution of the positive pre-breakdown behaviour, only positive parts of the waveforms are shown in
Figure 4.
For the development of a free path underwater discharge through the thermal mechanism, it can be assumed that during the pre-breakdown time, T0, a gas cavity is formed at the surface of the HV electrode, due to intensive joule heating. After the formation of this cavity and breakdown of the gas/vapour inside it, a fast ionization front(s)/streamer(s) bridges the remaining water gap, leading to the development of a post-breakdown plasma channel in the inter-electrode gap.
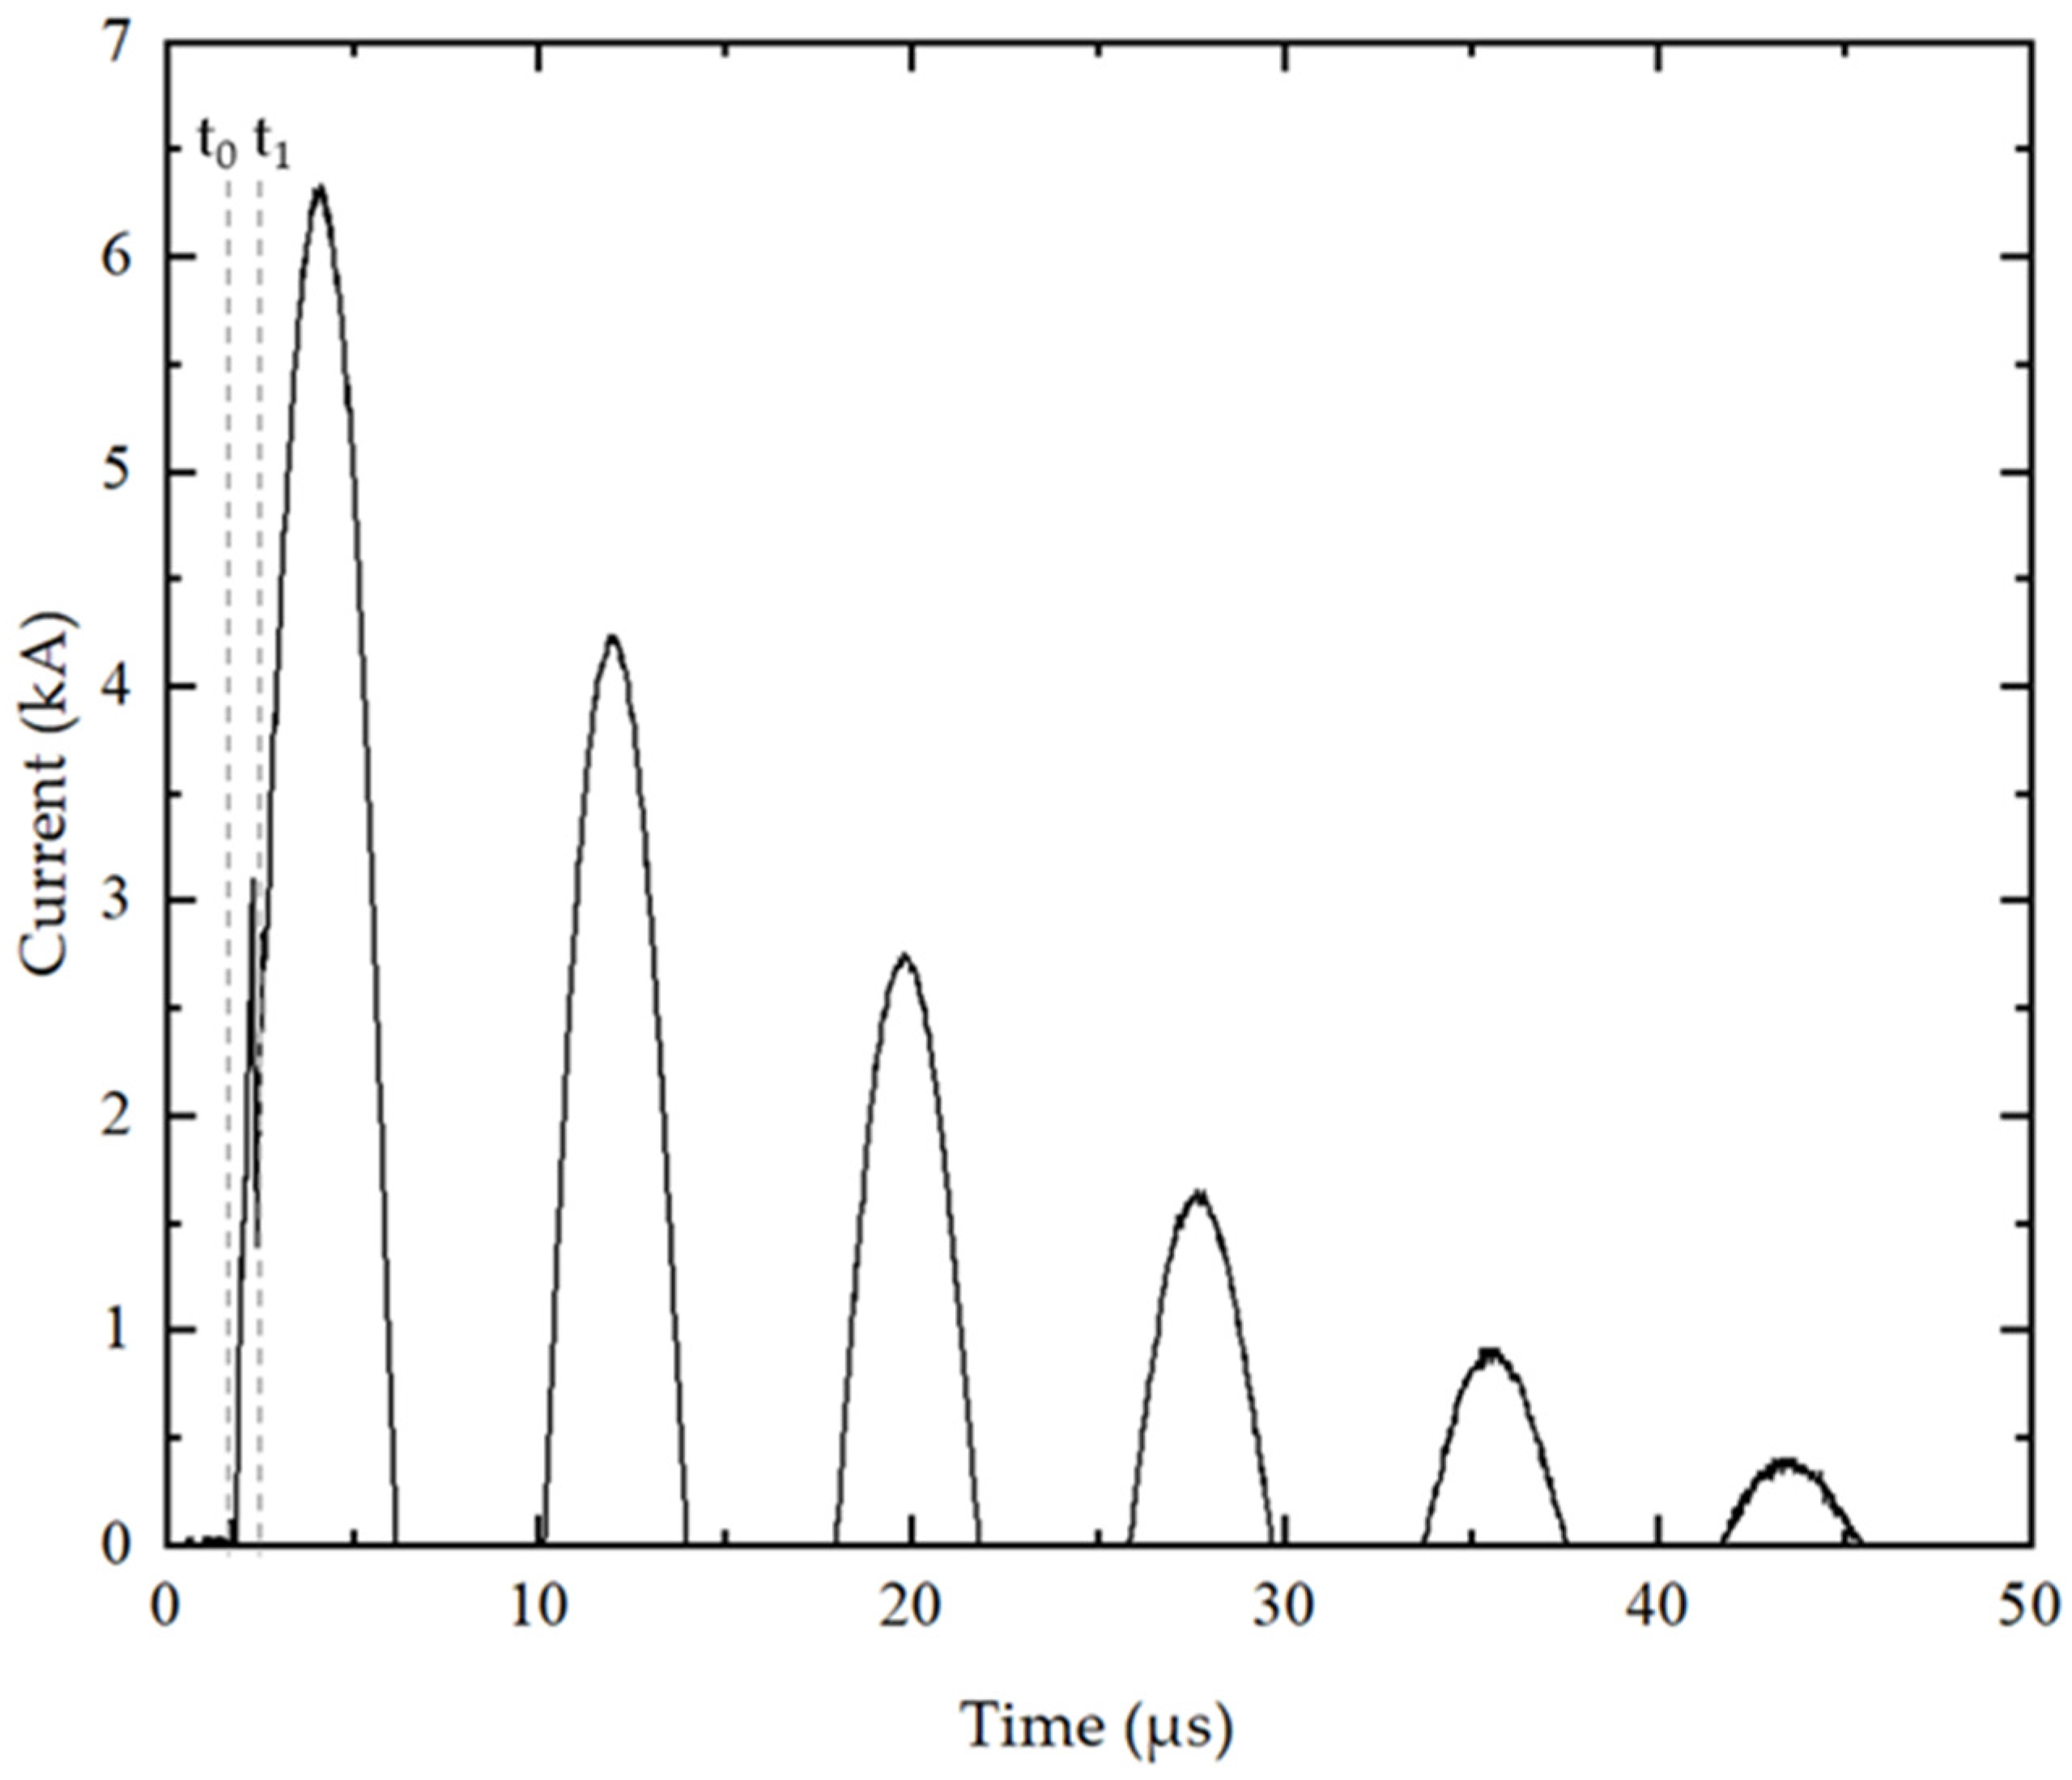
In the case of wire-guided discharges, the mechanism of formation of post-breakdown plasma channels is different. A thin wire provides a conductive path between the HV and ground electrodes. Thus, upon closure of the switch at
t0, a high current starts to flow through the wire resulting in its intensive heating and disintegration. At the moment of the wire’s disintegration, which is indicated as time
t1 in
Figure 5 (which presents an example of a current waveform measured for a wire-guided discharge), the conductive path is interrupted and the current drops. For the experimental conditions used herein, the time interval required for wire evaporation and disintegration was ~0.5 μs. Typically, such current interruption and the subsequent current re-strike is a characteristic of wire-guided discharges in gas and vacuum and high energy (kJ range) wire-guided discharges in water [
20]. However, as can be seen from
Figure 5, this pattern of current interruption and current re-strike was also observed for the experimental conditions used herein. The gas breakdown that takes place in the channel formed following disintegration of the wire (this channel is filled with gas, vapor and metallic droplets) results in the formation of an expanding post-breakdown plasma channel, and under-damped current oscillations in the pulse-driving circuit. As in the case of free discharges (
Figure 4), the envelop of the post-breakdown current oscillations is symmetrical relative to the zero axis. Therefore, only positive current peaks were used in the analysis of the plasma resistance, Equation (1). Again, for clarity, only the positive part of the current waveform is shown in
Figure 5, which helps to provides better visual resolution of the current behaviour during the wire heating and disintegration phase, which is completed at time
t1.
The post-breakdown circuit, including the plasma channel (formed by either a free path or wire-guided discharges) bridging the electrodes, can be modelled as a lumped RLC circuit assuming that the resistance of this plasma channel can be represented by a constant nominal value,
Rpl [
24,
25], and the resistance of other elements of this circuit is represented by a constant value,
Rloss. The underdamped current oscillations in this circuit are described by Equation (1):
where
I0 is a constant related to the magnitude of the first current peak,
R is the total resistance of the circuit (
R =
Rpl +
RLoss),
L is the total inductance of the circuit and
C is the capacitance. The attenuation coefficient α and angular velocity ω can be obtained from the experimental current waveforms.
This allows experimental values of
R and
L to be determined and the nominal constant plasma channel resistance,
Rpl, to be obtained using Equation (2):
The circuit resistances RLoss of the systems (pulse-driving circuit and electrodes) used to generate the free path and wire-guided discharges in water were obtained by shorting the electrodes of these systems with a conductor, registering the current oscillation under these conditions and calculating the circuit resistance using Equation (1) (R = RLoss in this case). It was found that RLoss for the system used to generate free path discharges in water is 0.39 ± 0.01 Ω while for the wire-guided discharge system RLoss is 0.37 ± 0.01 Ω. RLoss values were calculated using 20 individual data points, with the (±) errors representing the standard deviation.
The nominal plasma resistance,
Rpl, could be considered as an equivalent parameter that defines the portion of energy available in the discharge that is dissipated in the conductive plasma channel (through joule heating). Typically, the radiation losses in practical post-breakdown
RLC circuits used for the generation of spark discharges (which can be estimated by the Larmor equation) are significantly lower than the amount of energy delivered into the plasma channel and dissipated in the circuit. Thus, the approach based on Kirchhoff’s equation for an RLC circuit, in which only the resistance of the plasma channel and circuit elements is included, can be used in the analysis of the energy delivered into the post-breakdown plasma channel. Using this method, the nominal resistance of the plasma channel can be approximated by a constant value [
26] or can be considered as a time-dependent parameter [
27].
Table 1 shows the time delay to breakdown and nominal resistance of the plasma channel obtained by (2) for free path and wire-guided discharges. The values of
Rpl given in
Table 1 were obtained using at least 20 individual data points for each gap length, with the (±) errors representing the standard deviation. It can be seen that the nominal plasma resistance increases with an increase in the gap length. Furthermore,
Table 1 shows that for free path discharges, the pre-breakdown time is longer for longer gaps: 18.84 µs for a 5-mm gap, increasing to 28.6 µs for a 10-mm gap. In contrast, for wire-guided discharges, the time required for wire disintegration and current re-strike is much shorter than the pre-breakdown time for free path discharges: 0.62 µs for 30-mm wires and 0.67 µs for 50-mm wires. The standard deviation in the wire disintegration time for wire guided discharges is also much lower than the standard deviation in pre-breakdown time for free path discharges.
Based on the results presented in
Table 1, it can be stated that the nominal plasma channel resistance increases with an increase in the inter-electrode gap length for both free path and wire-guided discharges.
The ratio between the nominal constant plasma channel resistance and the circuit resistance,
Rpl/Rtotal, was also calculated. This ratio presented in
Table 2 indicates the fraction of energy dissipated in the plasma channel during the post-breakdown current oscillation increases with increasing plasma channel (gap) length.
Based on the results in
Table 2, it can be stated that longer inter-electrode distance leads to higher proportion of the post-breakdown energy being delivered into the plasma channel, which could be beneficial for the generation of stronger shock waves in water.
4. Pressure Impulses
As discussed in
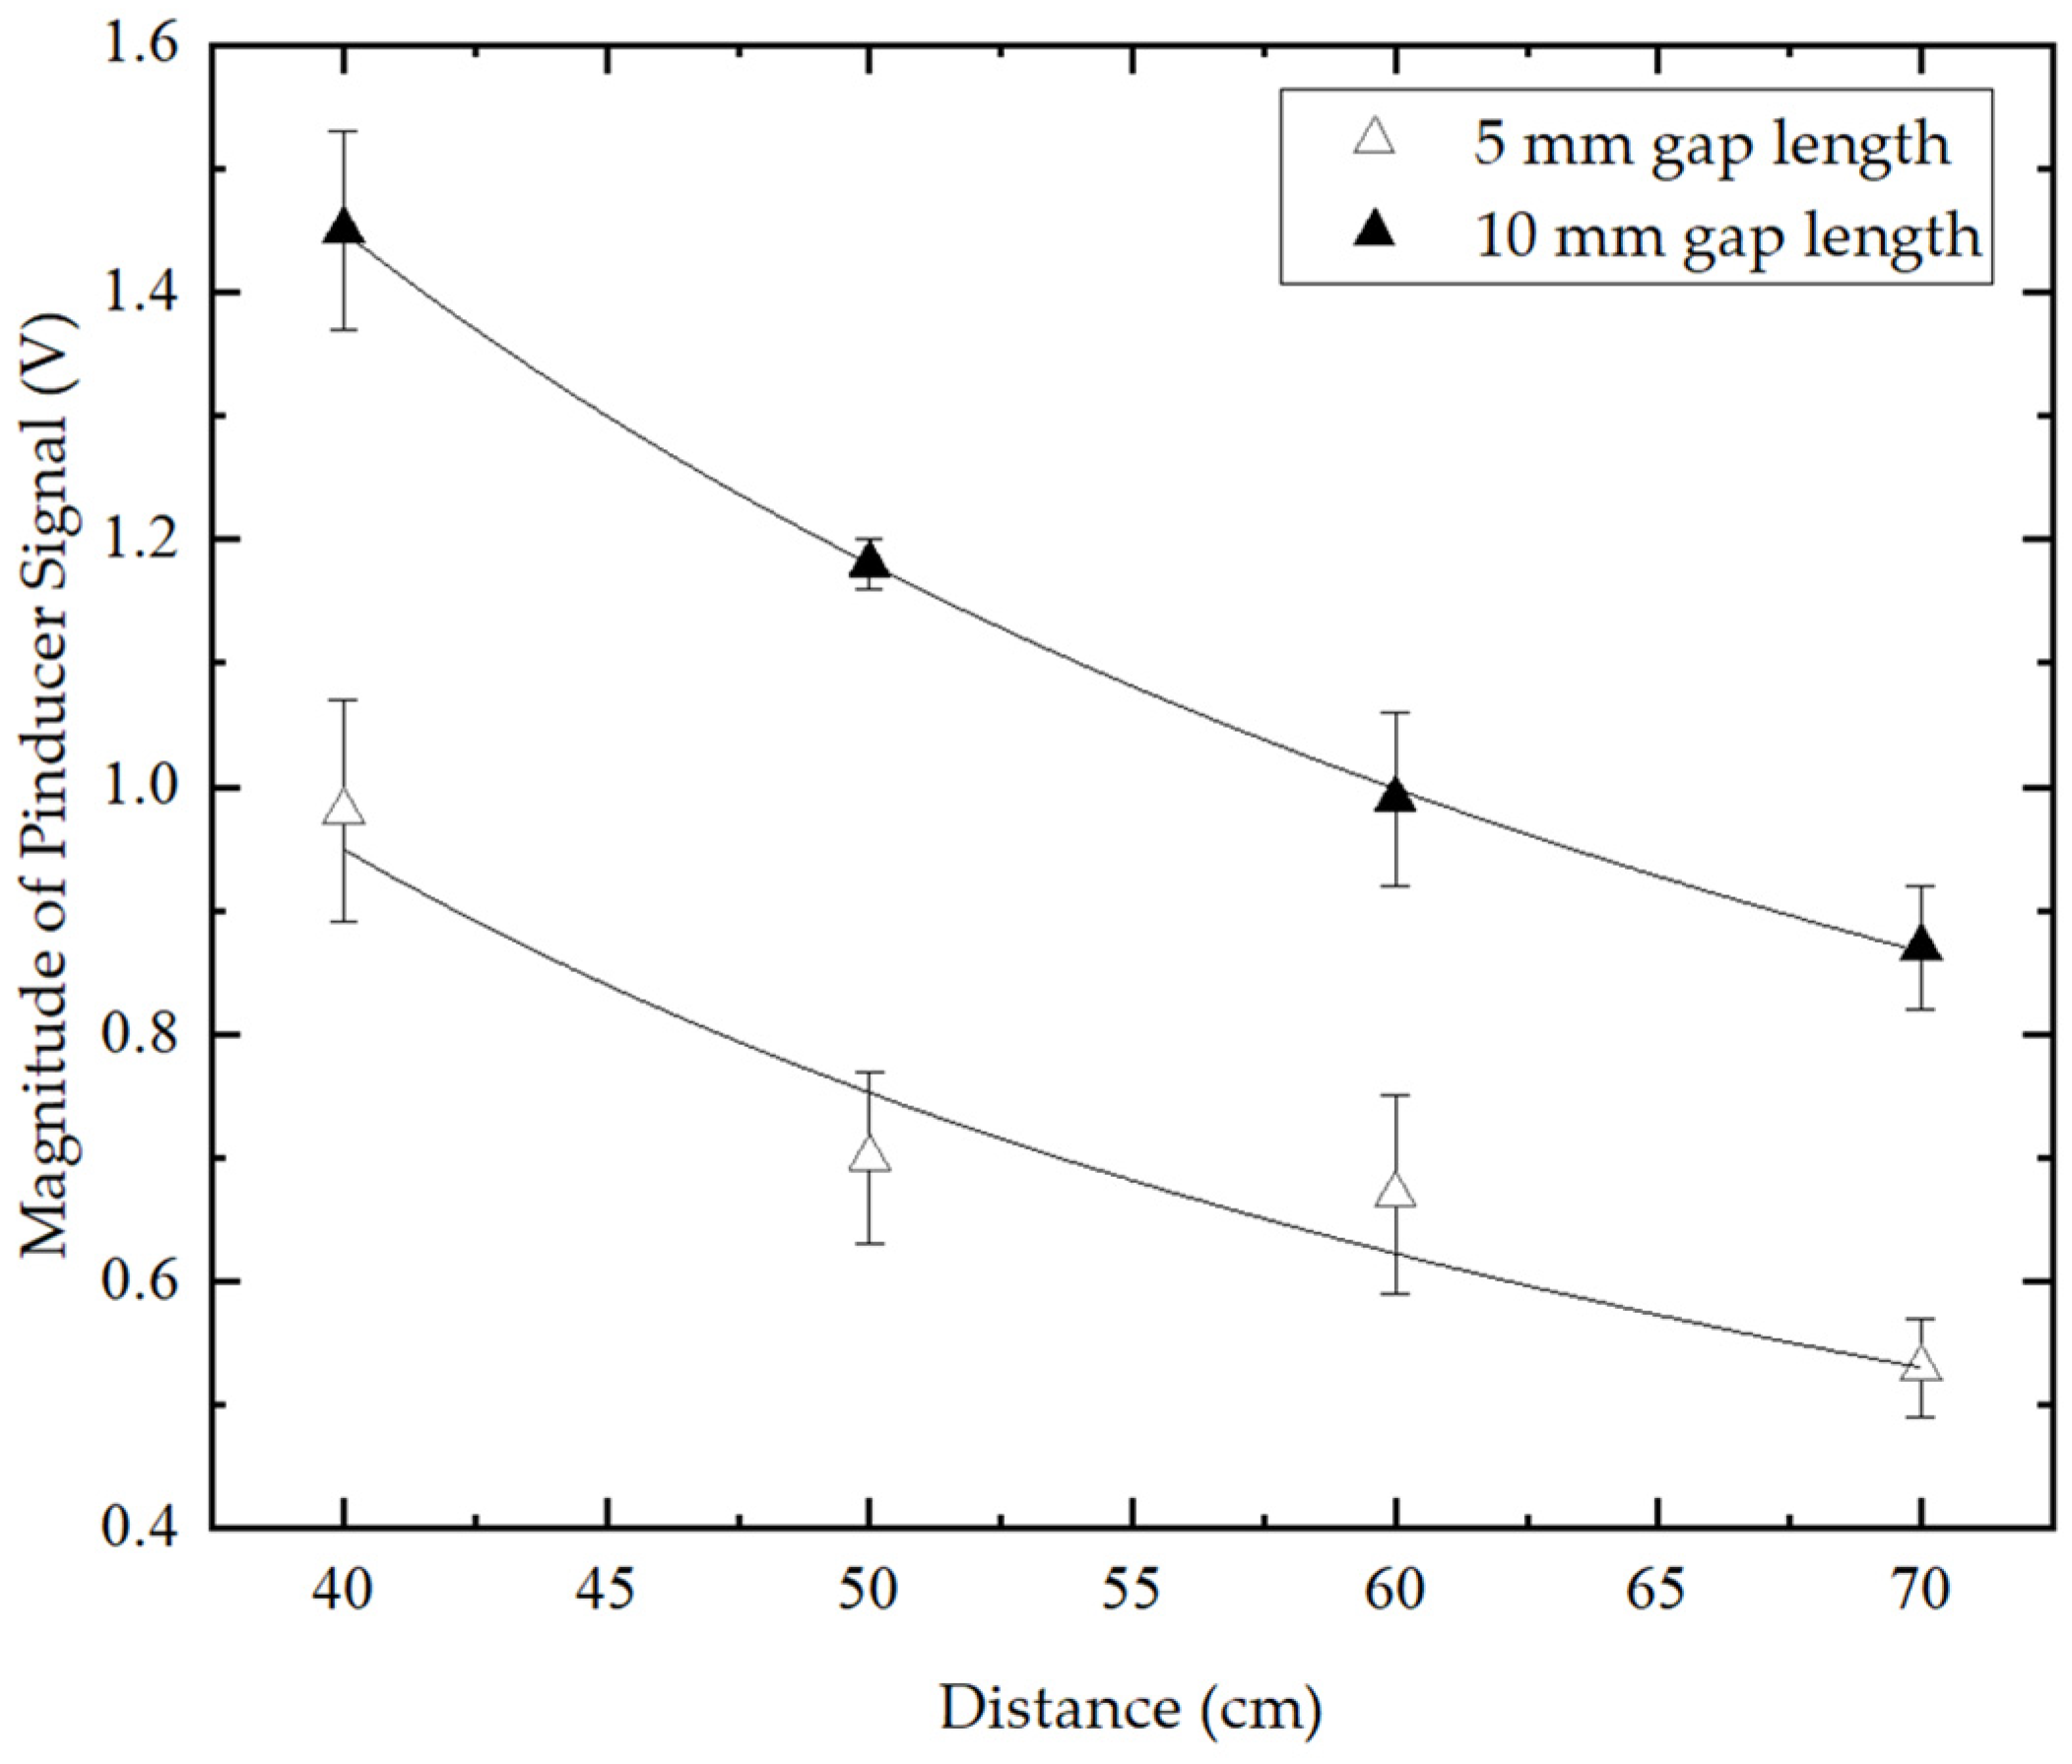
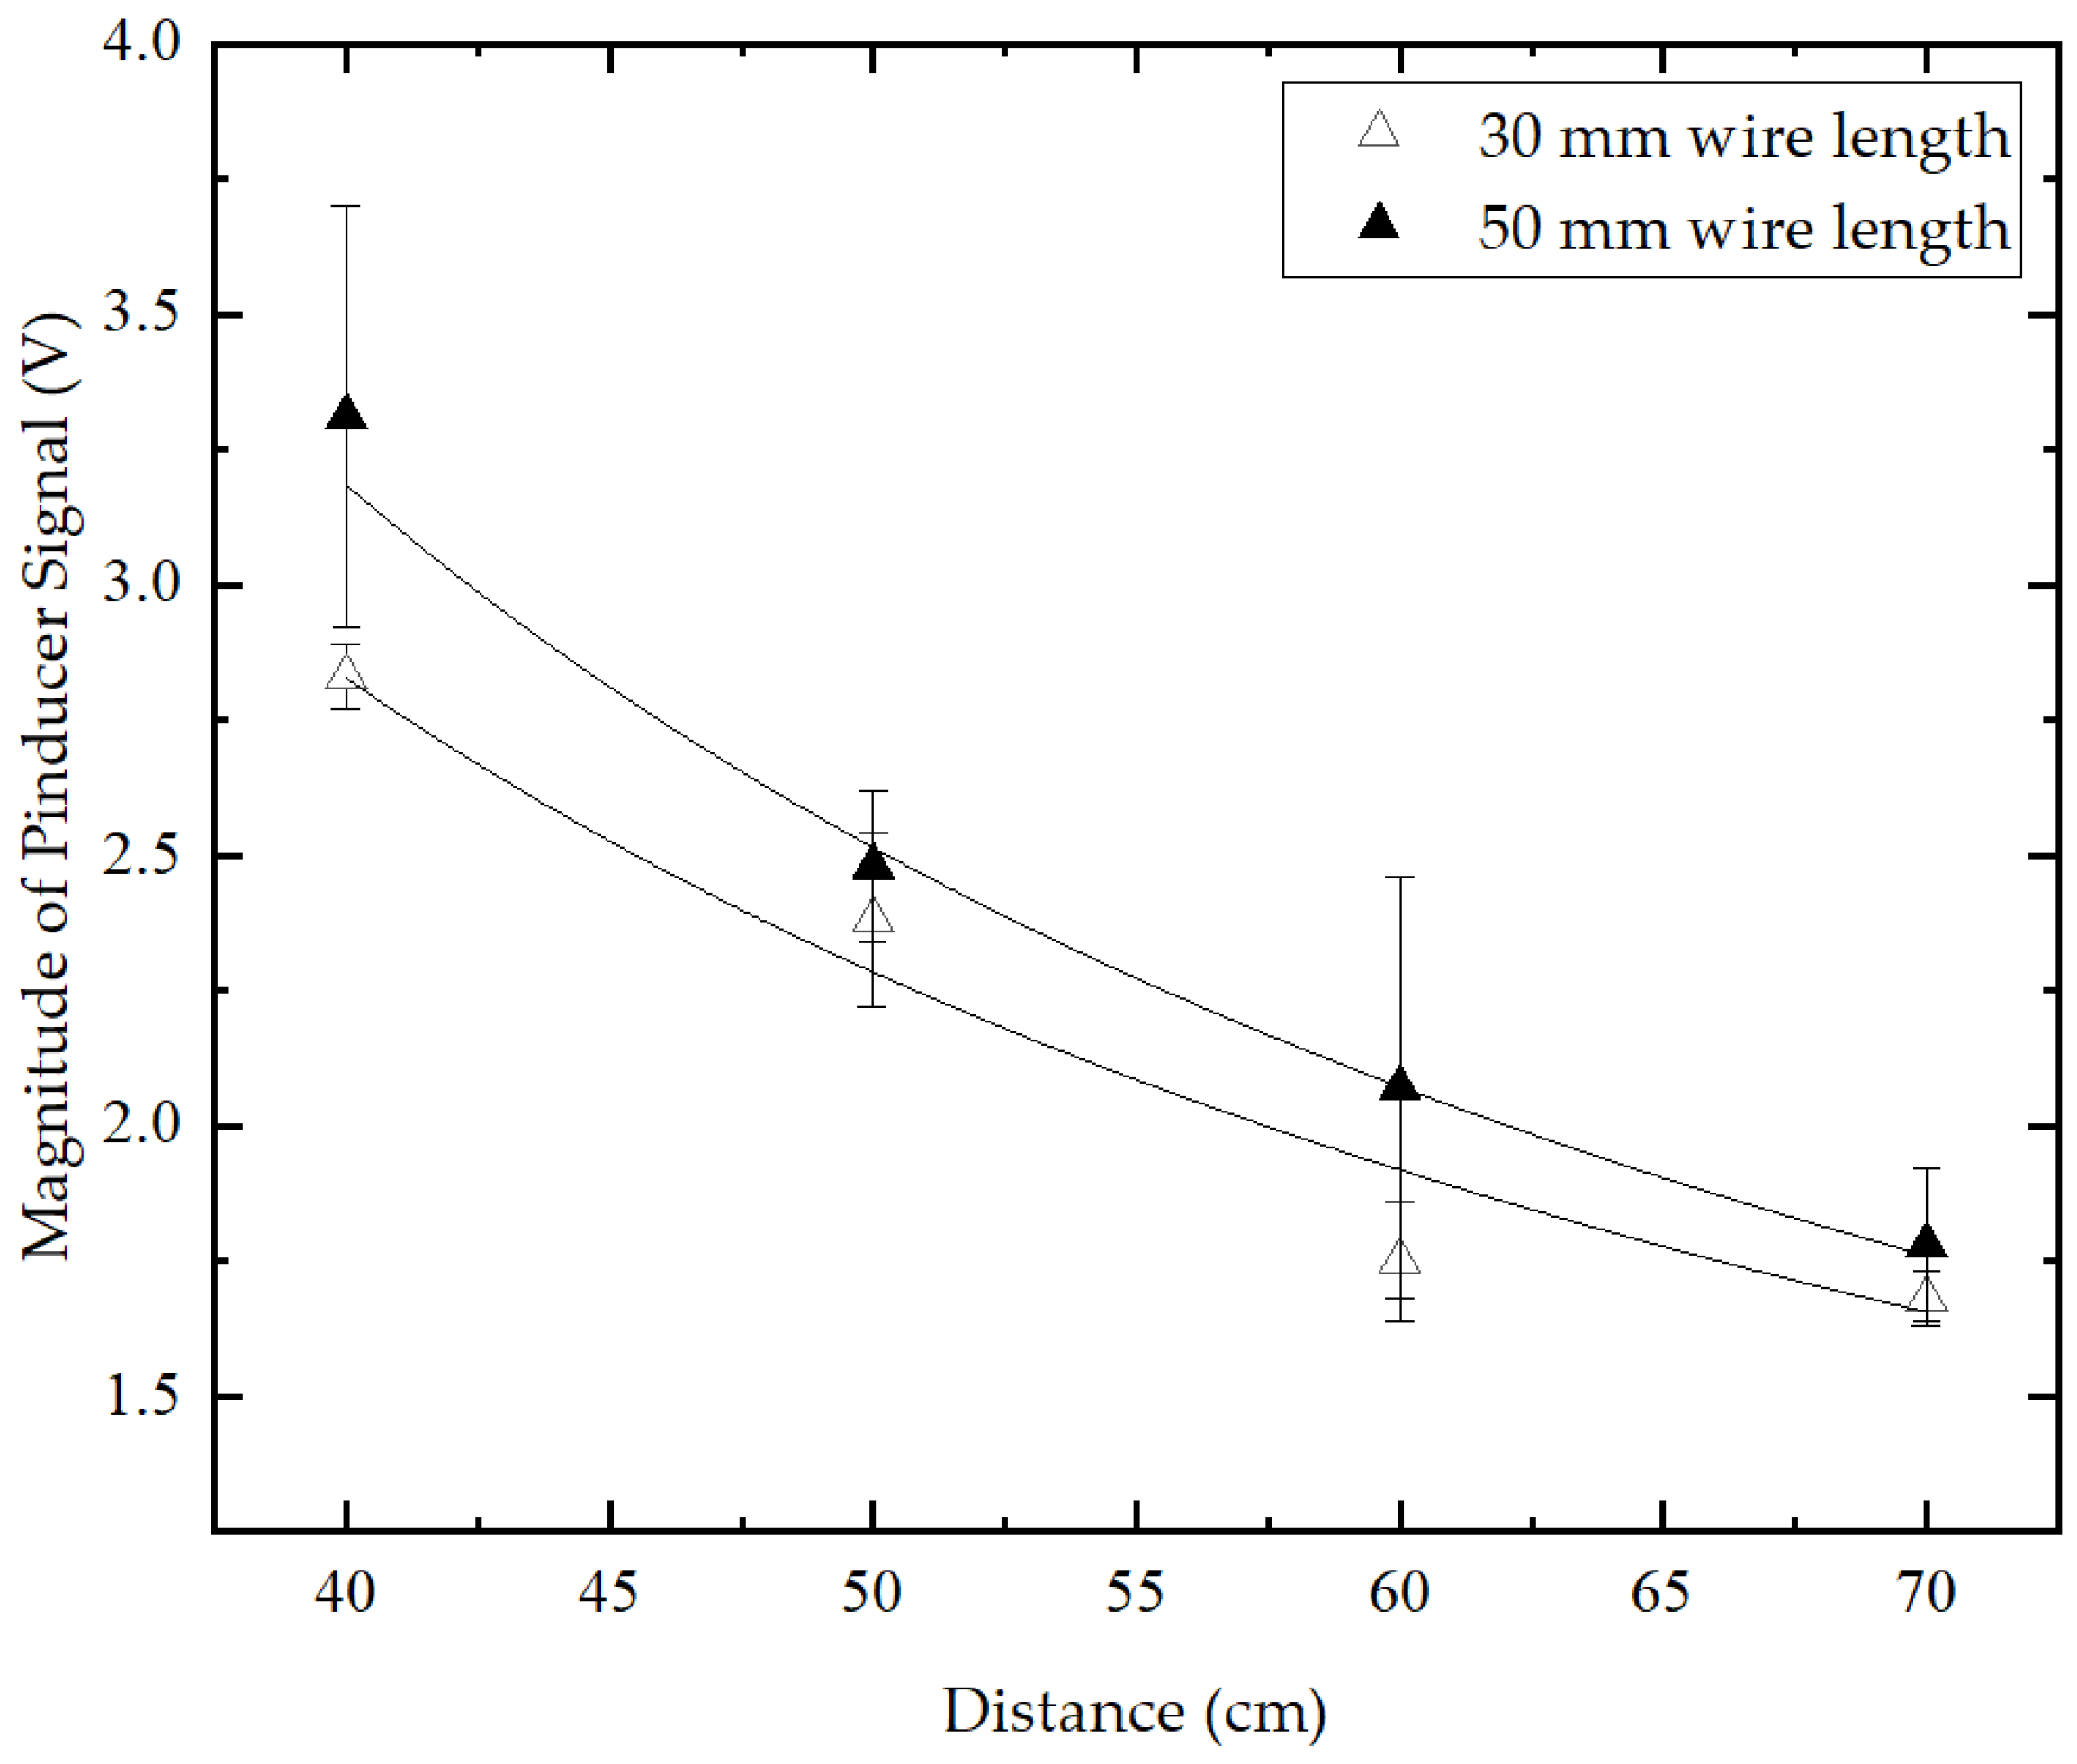
Section 2, the same charging voltage of 35 kV and the same capacitance of 265 nF were used to produce both free path and wire-guided discharges. This means that in both discharge types, the energy stored in the capacitor and available to the discharge was the same, i.e., ~162 J. The pressure signal (i.e., the voltage signal from the Pinducer sensor) was obtained for each test together with the current and voltage waveforms. The same sensor was located at distances of 40 cm, 50 cm, 60 cm and 70 cm away from the discharge electrodes in different tests. The peak magnitude of the voltage signals from the sensor obtained at each observation distance is presented in
Figure 6 and
Figure 7 for free path and wire-guided discharges, respectively. Each symbol (datapoint) shown in these graphs represent an average value of at least five peak magnitudes obtained in individual breakdown events. The standard deviation was obtained in each case and the error bars show the one standard deviation (1-σ) range.
The experimental data in
Figure 6 and
Figure 7 were fitted with analytical curves using Equation (3) in the OriginPro 2020 data analysis and graphing software:
where
P is the peak signal resulting from the pressure pulse (V),
ℓ is the observation distance (cm) and
A and
B are empirical constants obtained by the fitting procedure.
The empirical constants for free path and wire-guided discharges are shown in
Table 3. It was found that the value of the constant
B which provides the rate of attenuation of the pressure pulse magnitude with distance was
B ~ 1 for both types of discharge, meaning that the pressure is inversely proportional to the observation distance. Thus, it can be stated that the pressure waves in these tests can be defined as spherical waves [
28].
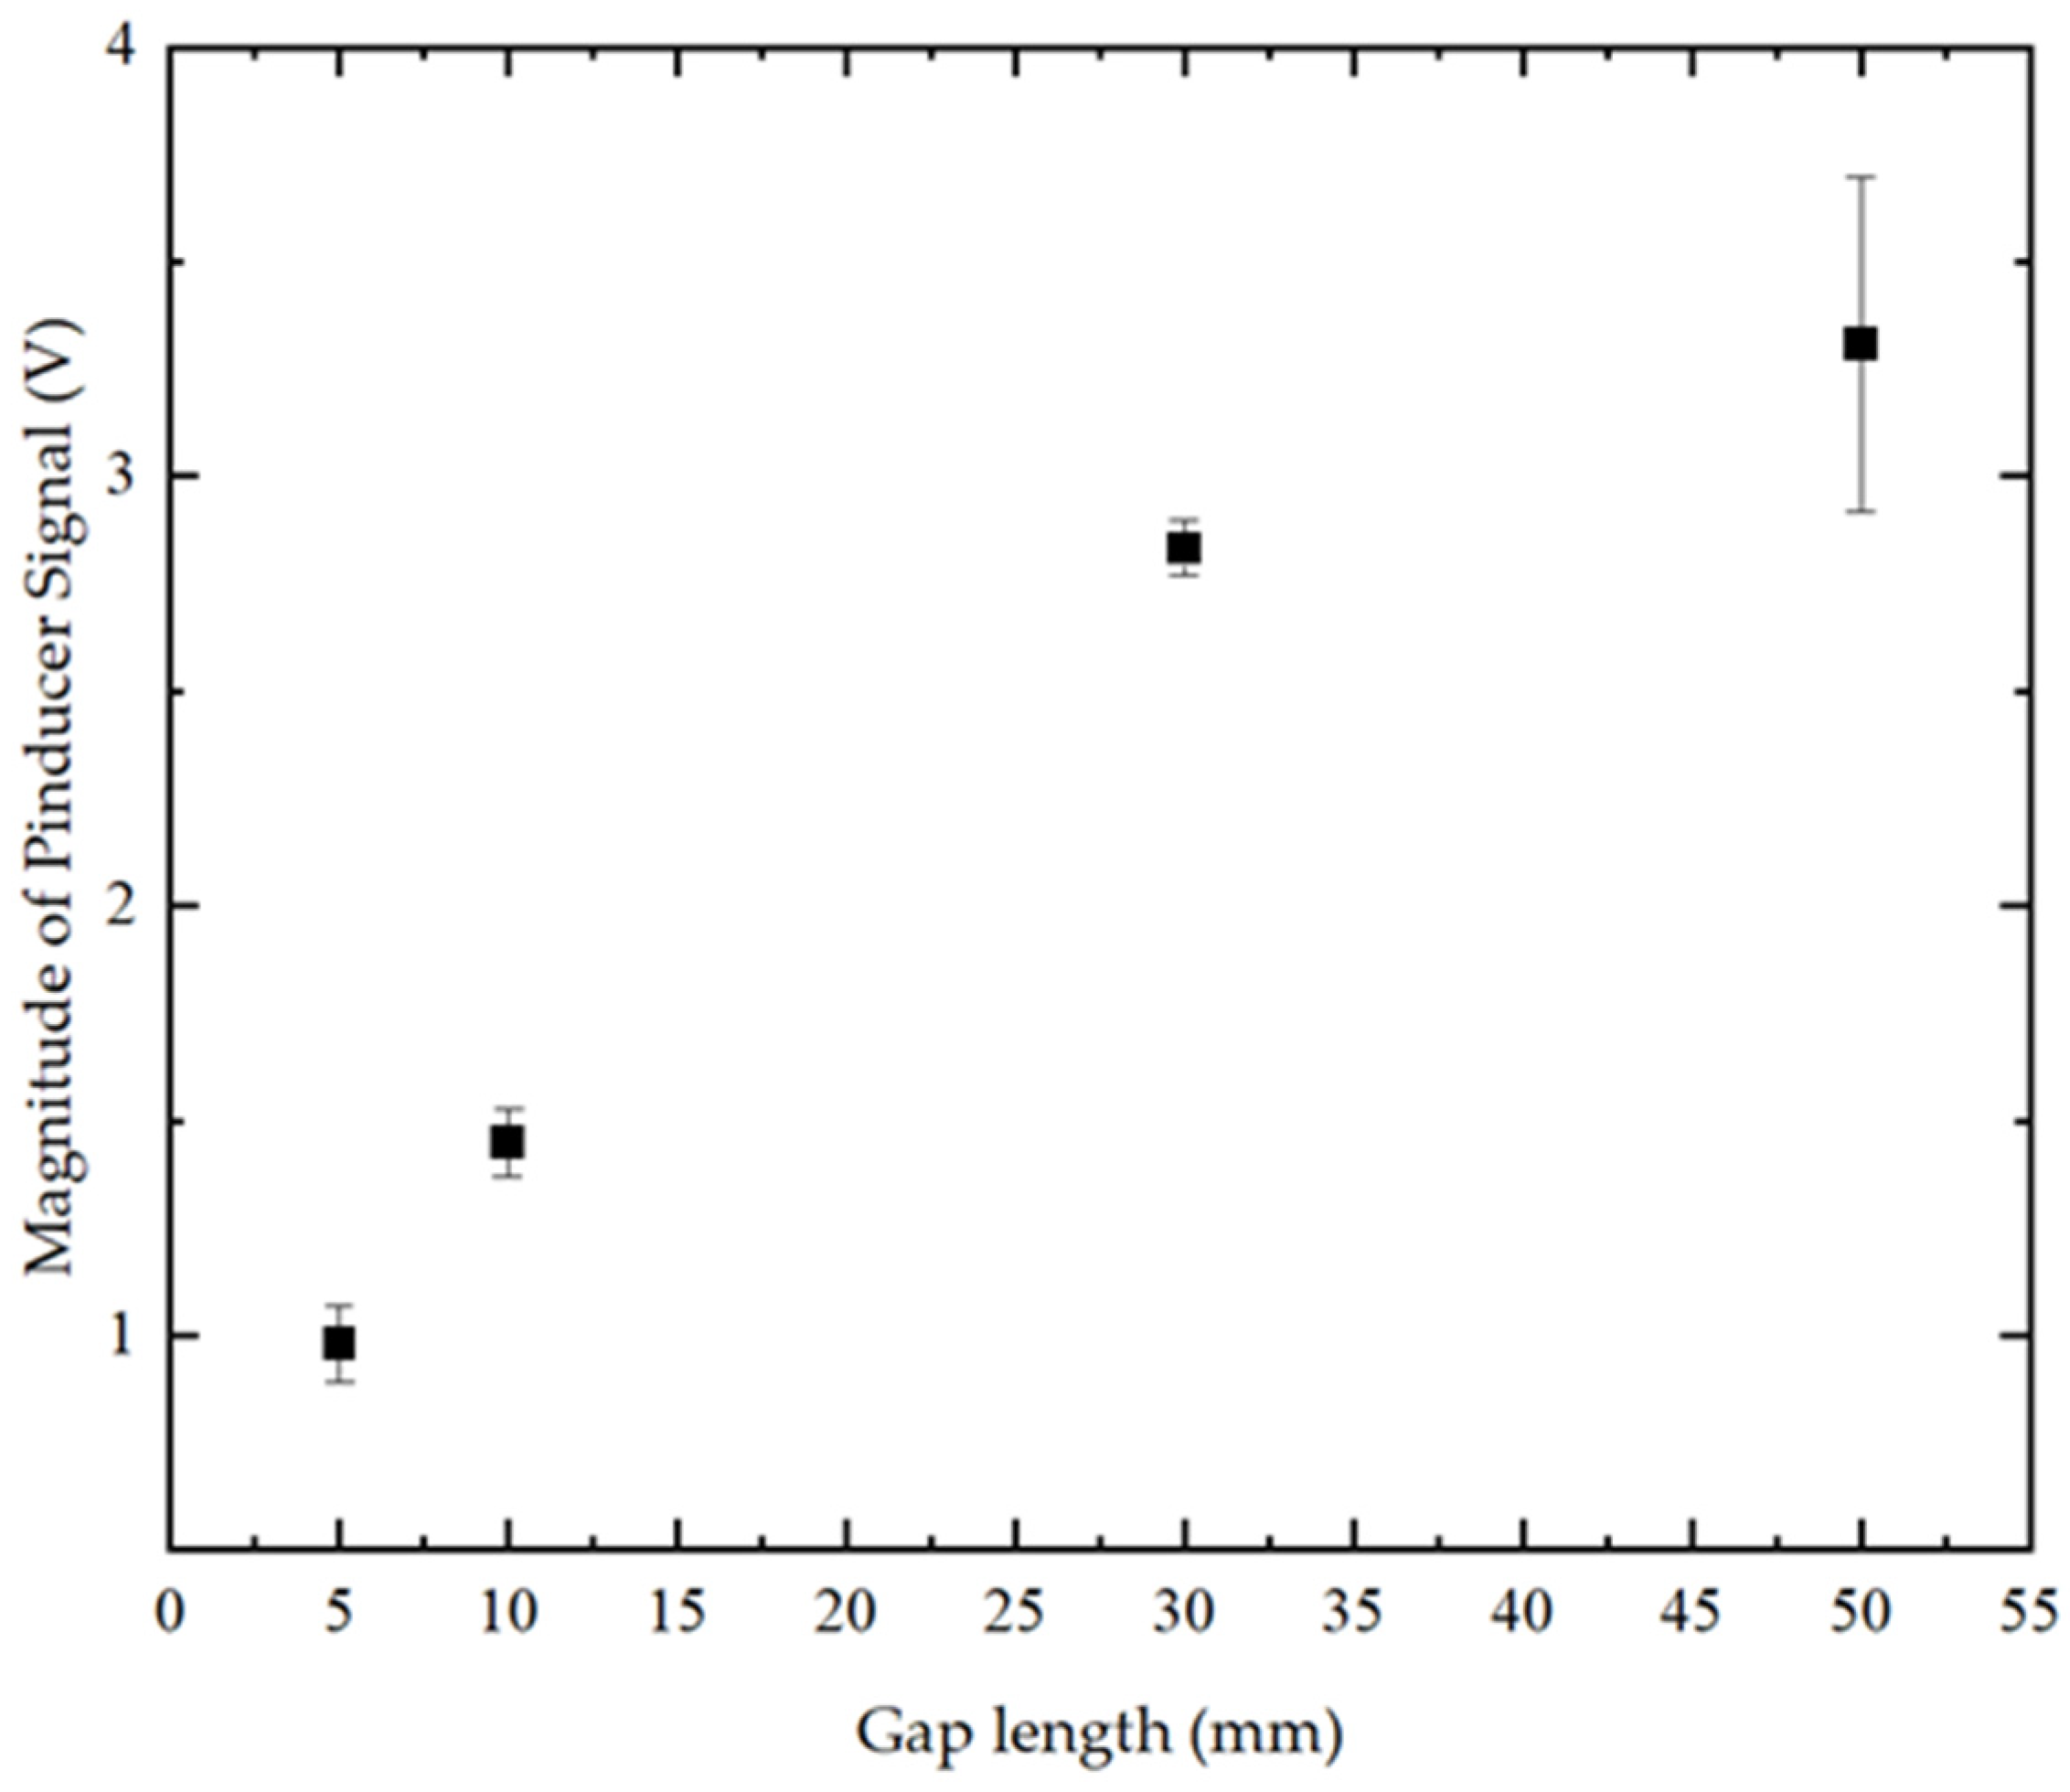
Figure 8 shows the peak magnitude of the signal from the Pinducer for different gap lengths at 40 cm away from the electrode system. It was found that the pulse pressure increased with an increase in the inter-electrode gap length regardless of the type of discharge for the conditions used in the present study.
This tendency correlates with the results presented in
Table 2, which shows that the proportion of the post-breakdown energy delivered into the spark channel increases with an increase in the inter-electrode gap length. However, for the gap length of 50 cm, the peak magnitude of the pressure signal started to show a tendency towards saturation, which was confirmed by additional tests with 70-mm wires. It was shown that the magnitude of the pressure signals generated by discharges initiated with 70-mm wires was only ~6% higher that obtained with 50-mm wires: 3.53 ± 0.24 V and 3.31 ± 0.39 V, respectively. Therefore, in the present experimental conditions (charging voltage, capacitance of the pulsed power system), it is expected that further increases in the length of wire used to initiate discharge does not lead to an increase in the pressure pulse magnitude. Therefore, the maximum length of wires reported in the present work was limited to 50 mm. Moreover, it is expected that the pressure pulse magnitude will start to decrease with further increase in the gap length, due to a reduction in the energy delivered per unit length of the plasma channel.
5. Thermal Model: Formation of Gas Cavity in the Free Path Discharge Topology
A simulation model was developed to predict the time required for the formation of a gas cavity in the vicinity of the HV electrode in the case of free path discharges in water. This model implemented using the QuickField software package (version 6.5) is based upon the electric field distribution in the inter-electrode gap. This electric field distribution in water with known conductivity is then used to model the transient joule heating process; thus, the temperature distribution in the water gap can be obtained. It is assumed that at the moment, when water temperature reaches its boiling point, a vapour-filled cavity is formed, and the (liquid) breakdown process is triggered through a gas breakdown mechanism. Thus, the time to breakdown can be approximated by the time required to heat a thin water layer (cavity) at the edge of the HV electrode to 100 °C. The energy required for the formation of such a gas cavity was also obtained (
Section 6).
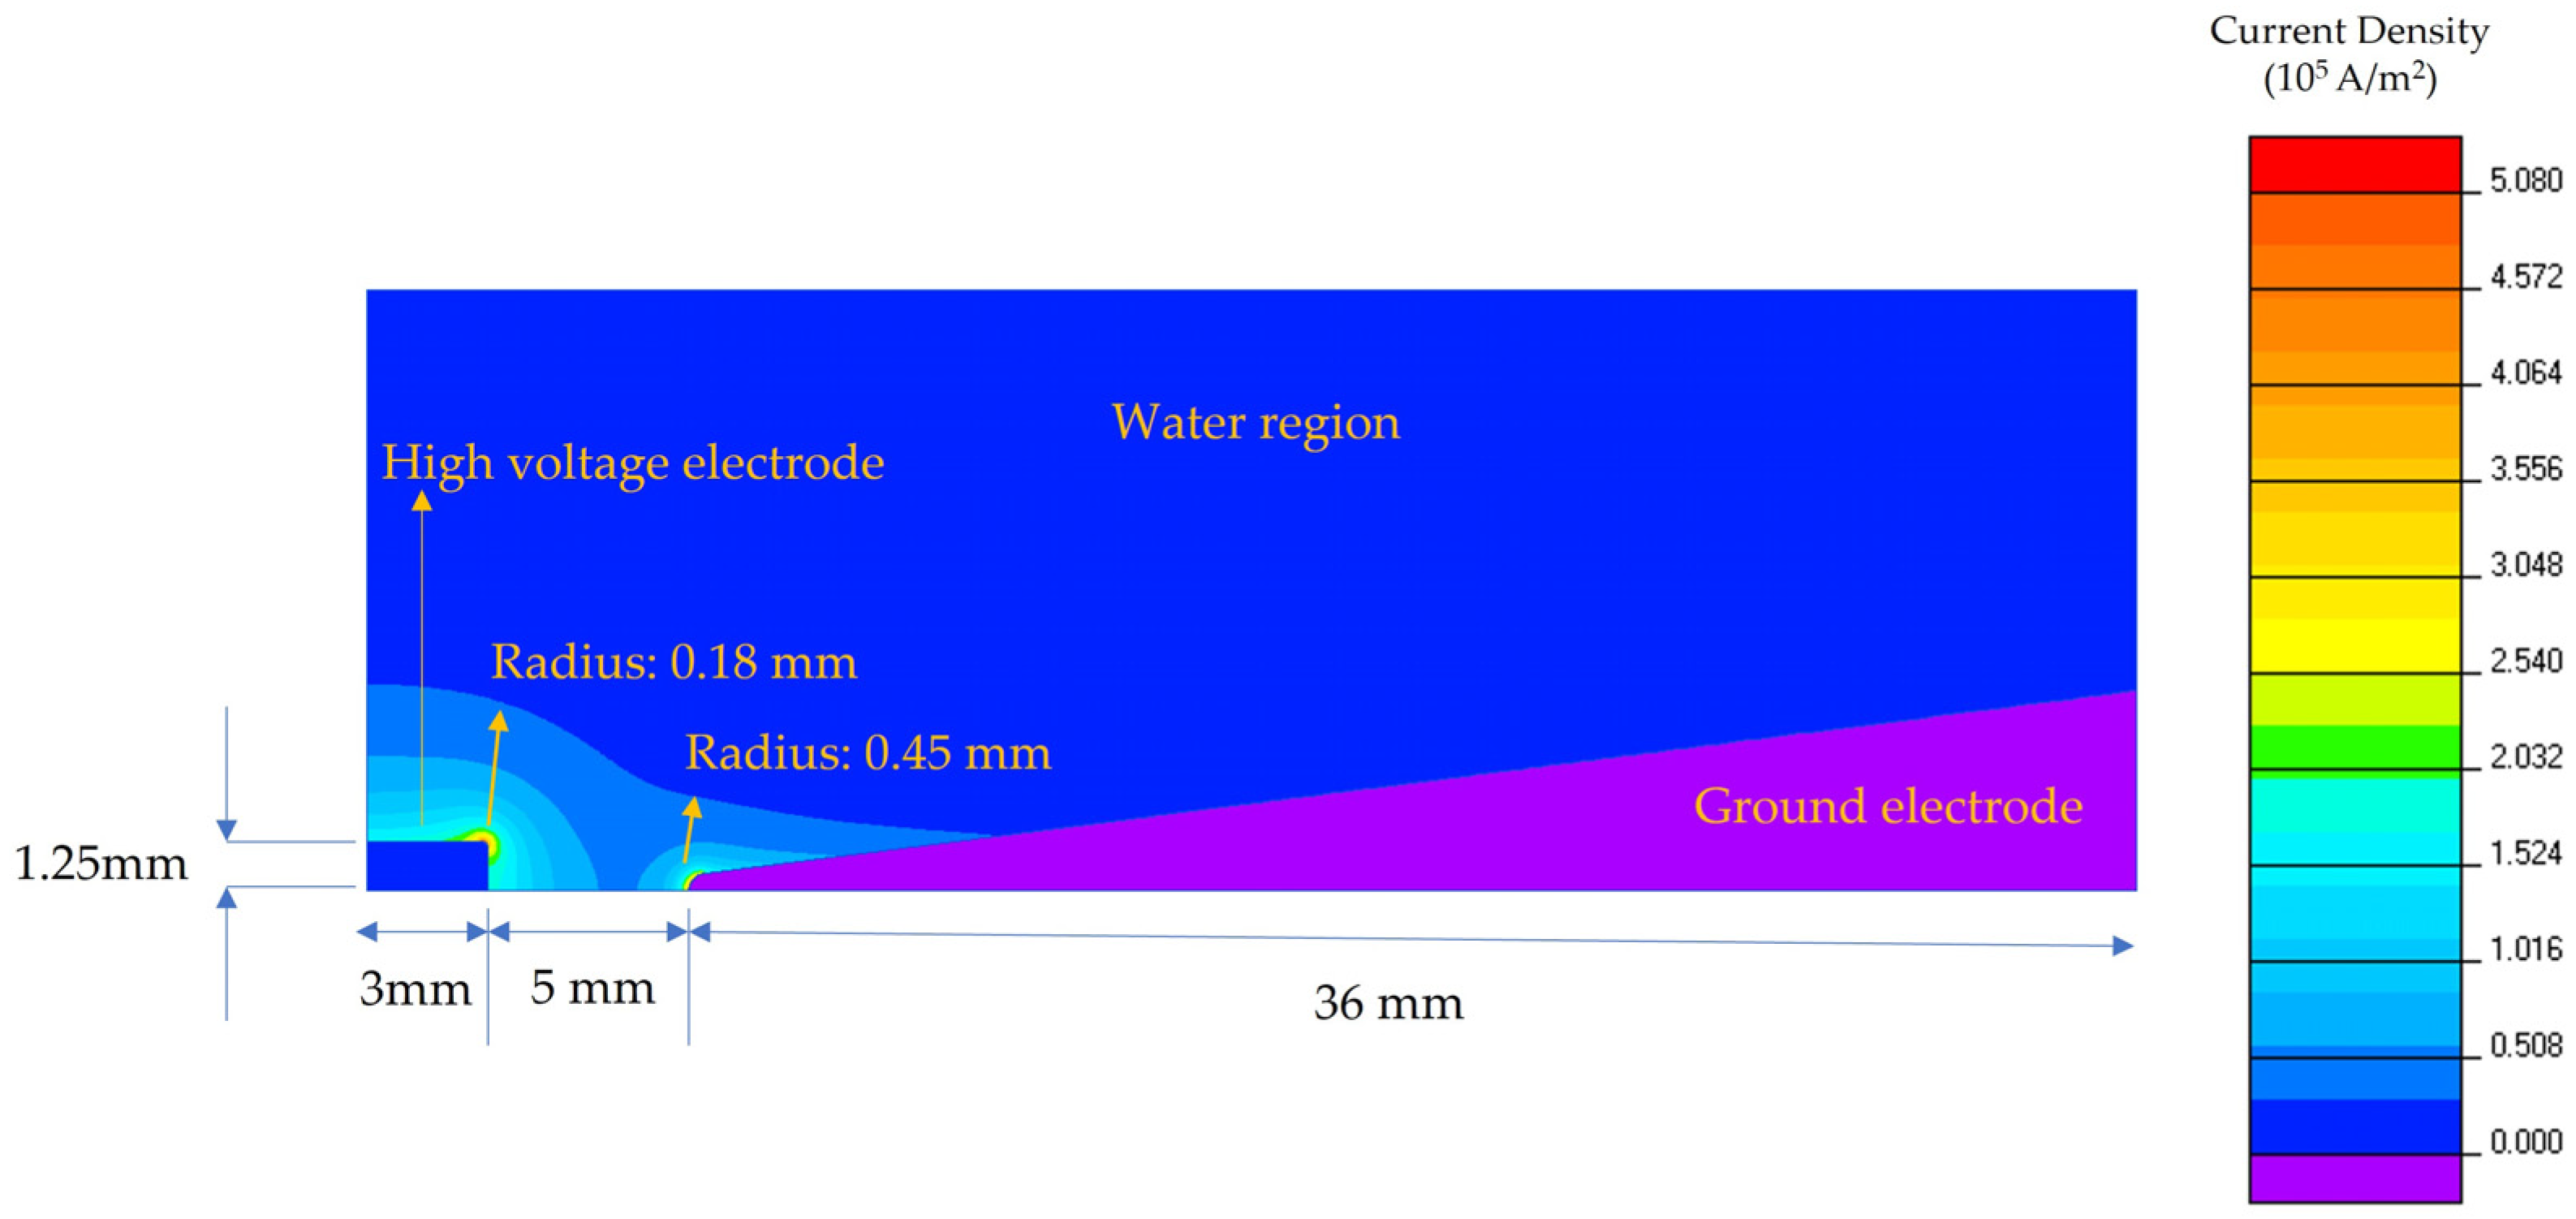
Figure 9 shows the cross-sectional view of the free path discharge system encompassing the high-voltage and ground electrodes. This model is an axisymmetric model which rotates around the horizontal axis. The high-voltage electrode was a 3-mm-long rod with a radius of 1.25 mm and an edge radius of 0.18 mm. The ground electrode was a 36-mm-long needle with a 0.45-mm tip radius. The gap between these two electrodes was 5 mm.
As discussed in [
29], the conductivity of water is a linear function of the water temperature:
where
σ is the conductivity of water (μS/cm),
T is temperature (±),
C is a constant (μS/cm) and
K is a constant (1/°C).
This temperature-dependence of the conductivity of water was incorporated into the model. Using the values provided in [
29],
K and
C for water with conductivity of 50 μS/cm were found to be 1.315 1/°C and 12.449 µS/cm, respectively. Therefore, the temperature dependent conductivity of water used in this study was as shown in equation (5):
Table 4 shows other parameters which were used in this simulation model.
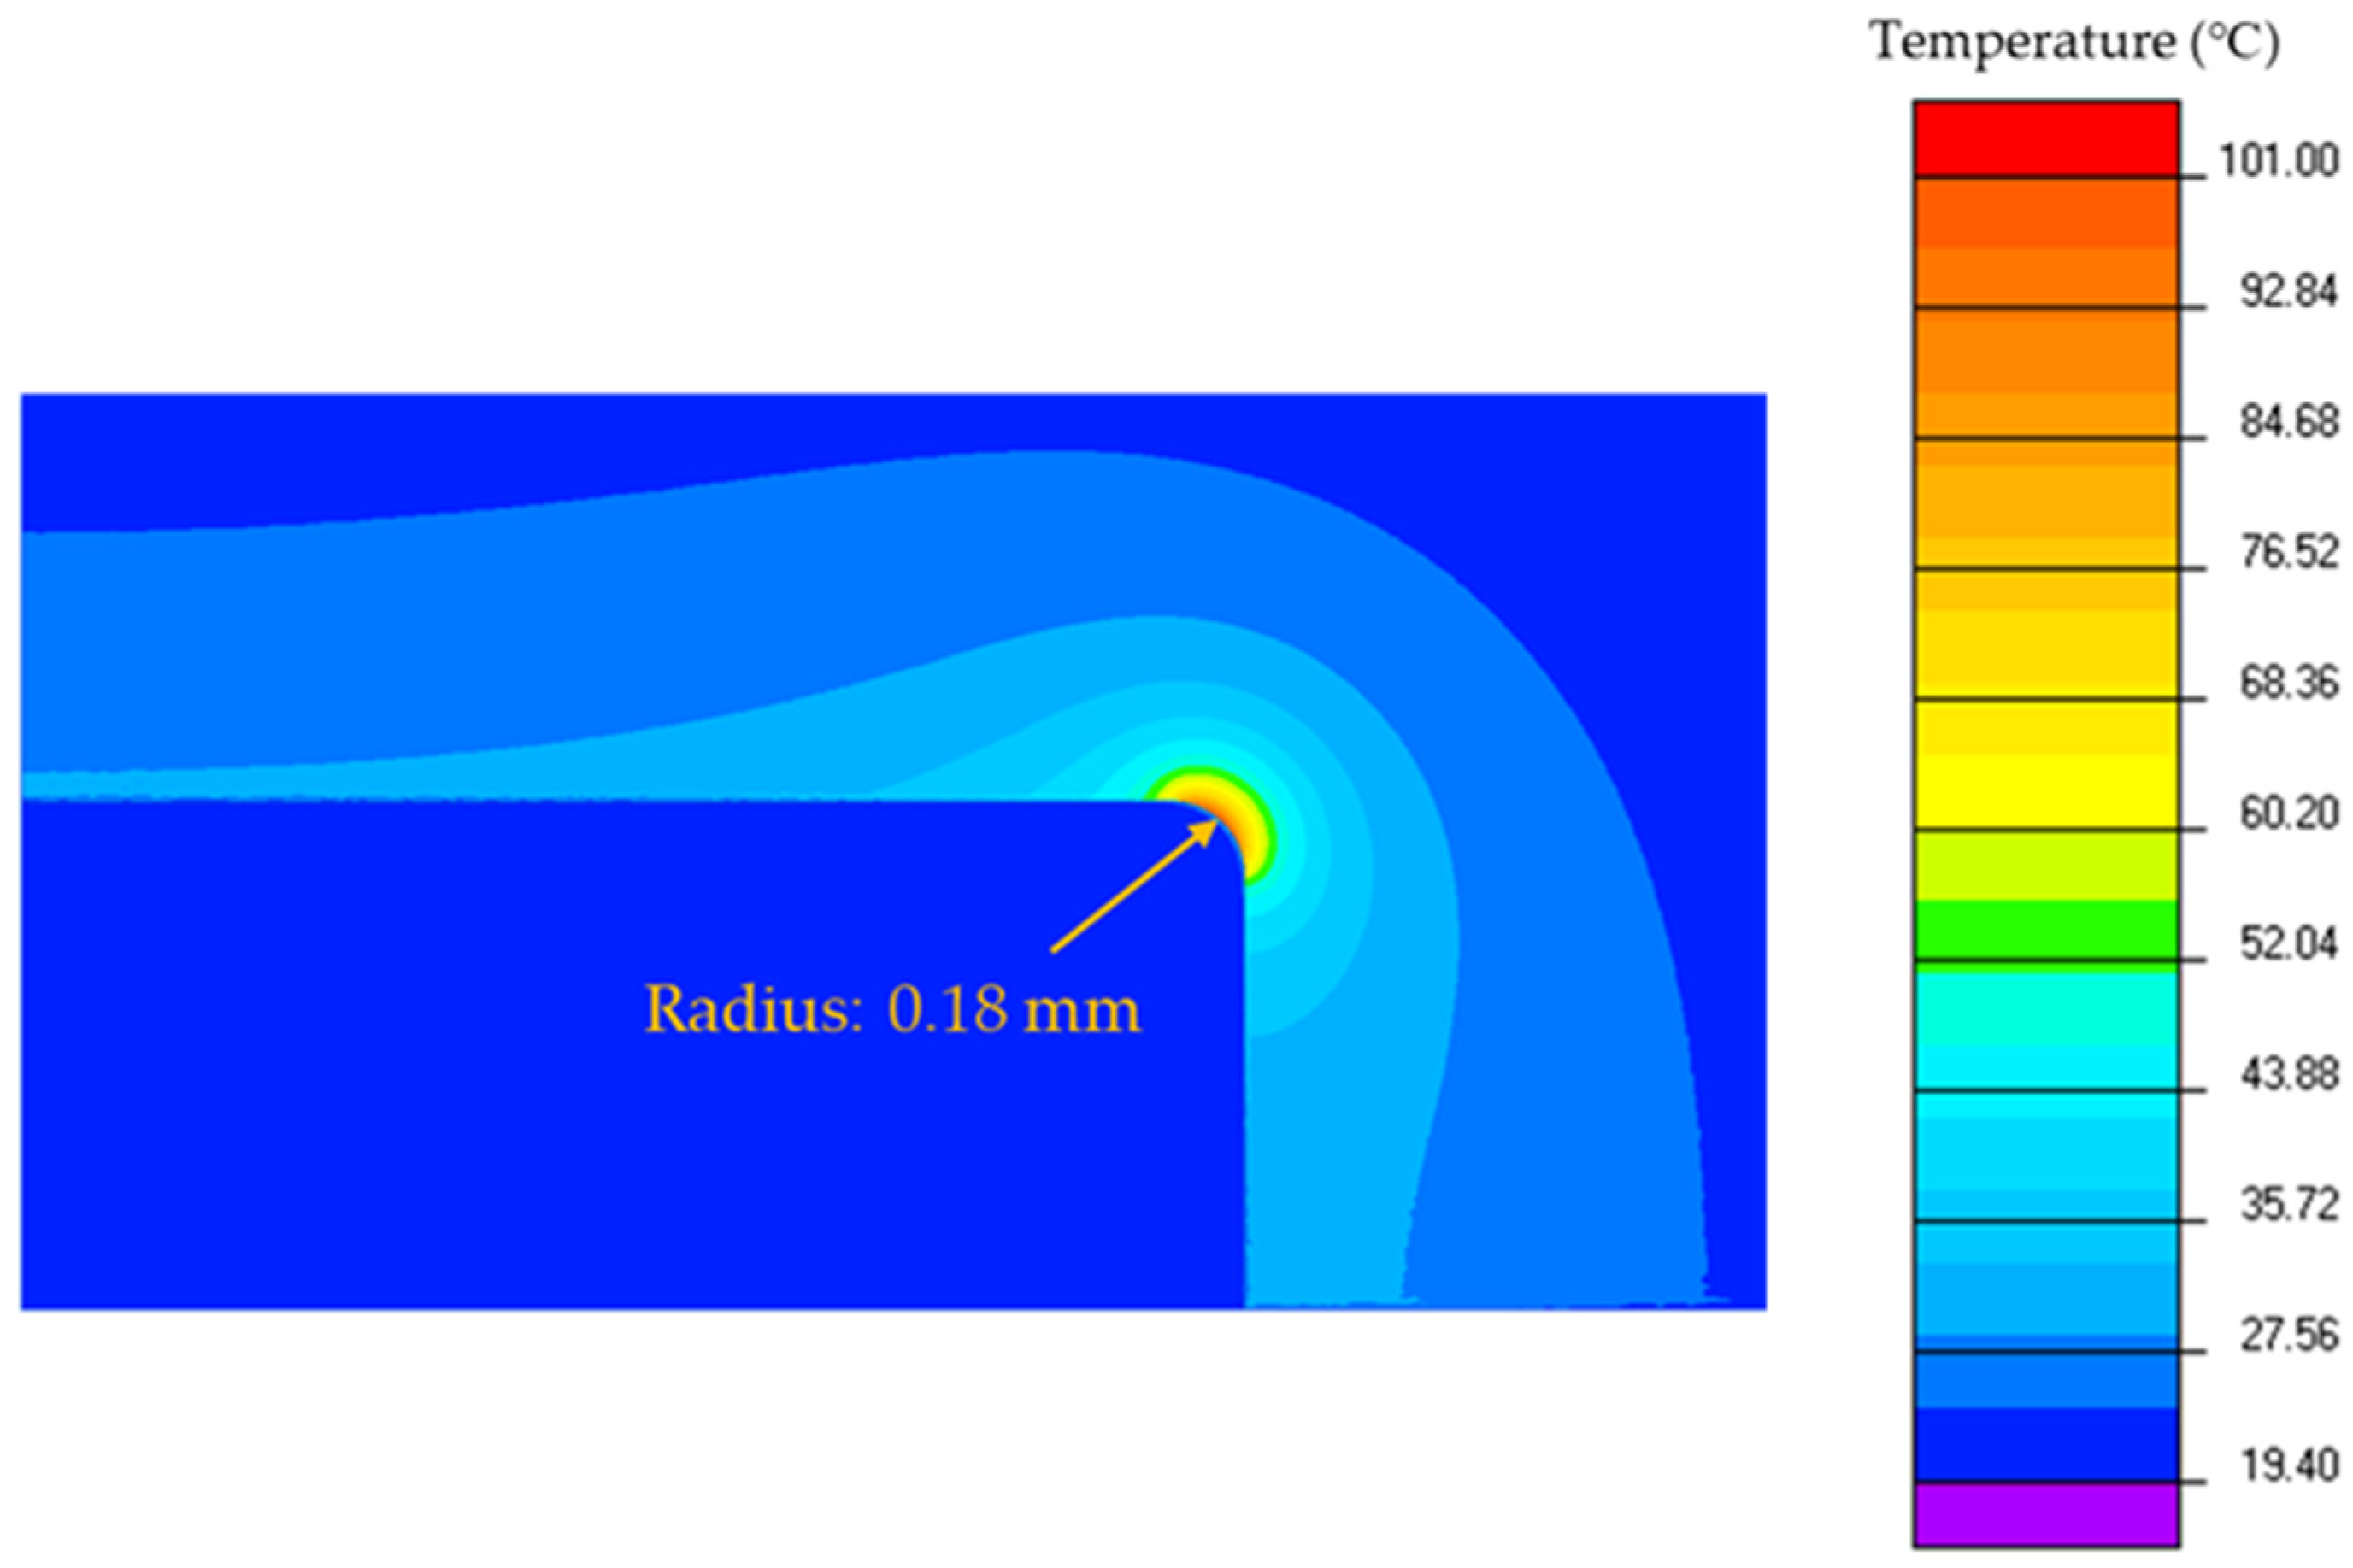
Figure 10 presents an example of the temperature distribution in a 5-mm water gap (shown in
Figure 9) at a time of 18.5 μs after application of high voltage (35 kV). At this moment in time, the local temperature of the water at the edge of the high-voltage electrode reaches 100 °C. Thus, it can be assumed that the vapour cavity that triggers a breakdown event is formed at ~18.5 μs after application of high voltage in this case.
Table 5 shows the experimental and simulation results on time to breakdown for free path discharges in water. It can be found that the time of cavity formation estimated by joule heating of a thin layer of water close to the HV electrode is similar to the experimentally measured pre-breakdown time.
Two types of pre-breakdown streamers—i.e., supersonic and sub-sonic—have been reported in the literature [
36,
37]. In the case of slower, sub-sonic pre-breakdown streamers that develop with velocities of 10’s of m/s, the time to breakdown for 5-mm and 10-mm gaps would be much longer than the observed experimental values in
Table 5. Thus, it could be postulated that under the present experimental conditions the pre-breakdown streamer(s) propagate with much higher, potentially super-sonic velocities, i.e., >10 km/s. The time required for such fast streamers to cross a 5-mm or 10-mm gap would be much shorter than the observed experimental pre-breakdown times. This implies that most of the pre-breakdown time could have been spent on the formation of the gas cavity, which triggers the development of these fast (supersonic) streamers. This analysis is in line with the times required to heat a small amount of water close to the HV electrode to its boiling point, obtained using the thermal model described in this section. However, the development and propagation of streamers is a complex process that requires further investigation for example through optical visualization of streamers.
6. Energy Loss during the Pre-Breakdown Process
The pre-breakdown phase of underwater spark discharges is characterized by energy losses. In the case of free path discharges, these losses are due to the electrical conductivity of the water, and in the case of wire-guided underwater discharges, the losses are governed by the energy required for wire heating, melting and disintegration. Thus, before formation of the post-breakdown spark channel, some energy will be lost, which will result in a smaller portion of the total energy being available for delivery into the plasma channel and for the following generation of pressure impulses. The pre-breakdown energy losses can be significant, and it is important to evaluate this portion of (lost) energy in order to analyse the efficiency of the formation of pressure waves in water. The pre-breakdown energy losses for free path and wire-guided discharges are estimated in this section both analytically and using the experimental data.
Nominally, the total energy stored in the capacitor,
Etotal (J), is given by Equation (6):
where
C is the capacitance (F) and
V0 is the charging voltage, (V).
Using Equation (6), it can be found that the energy stored in the capacitor in the circuit shown in
Figure 1 is ~162 J (for nominal charging voltage of 35 kV). In the case of free path discharges in water, the voltage across the electrodes decreases during the pre-breakdown phase due to the electrical conductivity of the water, and the energy available at the moment of breakdown is given by Equation (7):
where
Vbr is the breakdown voltage, as shown in
Figure 3.
Thus, the pre-breakdown energy loss,
, in the case of free path discharges is given by Equation (8):
The thermal conduction model which was developed in
Section 5 was used to predict the time required for heating of a thin water layer at the edge of the HV electrode to 100 °C. However, QuickField software model does not allow for the energy required to heat this volume of water to its boiling temperature to be obtained. Thus, a straightforward analytical model was developed to estimate these losses from the thermal energy point of view. In this model, it is assumed that during the pre-breakdown time a thin layer of water close to the HV electrode is intensively heated by joule heating. In the framework of this model, breakdown occurs when the water in this region transforms into gas (vapour), i.e., when the temperature of the water in this layer reaches ~100 °C. The amount of energy required to transform this water layer into vapour due to intensive joule heating is given by Equation (9):
where
Cm is the heat capacity of the water (4182 J/kg·°C) [
38];
m is the mass of water in the layer (kg); ∆
T is the temperature change (°C); and
Lm is the latent heat of vaporization of water (2260 kJ/kg) [
39]. The mass of water in the layer is given by Equation (10):
where
ρ is the density of water which is 1000 kg/m
3 and
Vsim is the volume of the cavity obtained from the simulation, (m
3).
The cavity volume,
Vsim, can be approximated as the volume of a thin layer at the edge of the HV electrode where water temperature has reached ~100 °C, as shown in
Figure 10. It was found that the energy required to heat this volume of water,
EJH-water, is less than 6 mJ for both free path discharge cases (5-mm and 10-mm gap lengths), which is significantly lower than the total pre-breakdown energy loss in the case of free path discharges,
(10’s J). These results are presented in
Table 5.
In the case of wire-guided discharges, the estimated total energy required for heating and evaporation of the wire consists of two components: the energy required for heating the wire up to its melting temperature,
EJH, and the energy required to convert the melted metal into vapor,
Evapor [
40], as given in Equation (11):
Therefore, based upon Equation (9), the total energy for wire evaporation is calculated using Equation (12):
where
Cm−wire is the heat capacity of the copper wire (386 J/kg°C) [
41];
ρwire is the density of the copper wire (8900 kg/m
3);
Vwire is the volume of the copper wire, which is treated as a cylinder (m
3); ∆
T is the temperature change from 20 °C to the melting temperature of Cu (1085 °C) [
41,
42]; and
Lf is the latent heat of fusion for Cu (205 kJ/kg) [
42].
Table 6 presents the energy losses for free path and wire guided discharges. For free path discharges, the total pre-breakdown energy losses were obtained using Equation (8) with
V0 and
Vbr obtained from the experimental voltage waveforms. Equations (9) and (10) were used to estimate the amount of energy required for heating of a small volume of water close to the HV electrode to 100 °C and the formation of a vapour cavity. It is shown that this energy is significantly lower than the total pre-breakdown energy loss.
In the case of wire guided discharges, the energy required for melting and evaporation of the wire was obtained using Equations (11) and (12). It was found that even for longer wires (30 mm and 50 mm) the pre-breakdown losses are less than 1 J, while for shorter (5 mm and 10 mm in the case of free path discharges) water gaps, the energy losses are ~20 J and ~25 J. However, the energy required for formation of the gas cavity (in the case of free path discharges) is much lower than the energy required for melting and evaporation of the copper wires. Thus, it can be stated that the main energy loss during the pre-breakdown process in the case of free path discharges is joule heating due to conduction through the mass of water.
Based on the results shown in
Table 6, it can be stated = that the energy loss during the pre-breakdown process for free path discharges,
, is ~15% of the total energy stored in the capacitor
while for wire-guided discharges the energy required for wire melting and evaporation,
Ewire, is less than 0.5% of
. The estimated energy required for formation of a vapour cavity is less than 6 mJ, which is much smaller than the total pre-breakdown energy loss (i.e., ~(20–26) J) for free path discharges. Thus, almost all pre-breakdown energy losses in this case are due to conduction through the bulk of water. In the case of wire-guided discharges, the energy required for wire melting and evaporation during the pre-breakdown phase is less than 1 J, which is significantly lower than the pre-breakdown energy losses in free discharges.


