1. Introduction
The revolution due to technological advancement has paved the way for clean and efficient transportation systems, which, in turn, has posed new social and technical challenges to the current electric grid. Most implementations of electro-mobility envision large amount of charging of electric vehicles (EVs) from the low- or medium-voltage distribution network. The impacts of charging on those grids could put a limit on the electrification of transport, at least in the long term.
When a few EVs are charging, the impacts may be small and may be negligible, or, in some cases, the impacts may be big but not of concern. For example, consider the case of harmonics aggregation of photovoltaics/wind systems and EVs; the harmonics aggregation at the PCC may get attenuated and, hence, the impact of EV charging will be less than the available margins. But, in some cases, the harmonics may get amplified due to resonance and may deteriorate the system. Hence, it is very important to study the impacts due to EV charging in a critical manner.
There are a large number of studies that estimate the impact of EV charging on the distribution network, using stochastic charging profiles [
1] and optimization-based charging coordination [
2,
3,
4]. Applying these techniques requires a detailed and accurate representation of the uncertainties that characterize the charging process. This information is often not available. Authors in [
1] have used available transportation data to extract probability distribution functions to define the uncertainties. The limitations of such studies are the low sample size, which does not reflect the wide variations in the charging profile.
The concept of “hosting capacity” has been presented to estimate the impact of distributed generation on the electric power system [
5]. The concept can be equally well-used to quantify the impacts of EV charging. From this concept, it is possible to determine the limits of unacceptable deterioration. In other words, performance criteria and limits need to be defined. The amount of charging for which the deterioration becomes unacceptable is referred to as the “hosting capacity” of the grid for electric vehicle charging. In other words, the hosting capacity is the limitation set by the electric power system on the amount of charging and, thus, on the amount of electro-mobility.
Different impacts of charging will set different limitations on the amount of charging; they will have different hosting capacities. In the end, it is the lowest of the hosting capacities that set the actual limit. Thus, it is important to know the limitations set by local impacts and the distribution network to the charging of EVs.
In this paper, the different impacts of electro-mobility on the distribution grid are discussed in a general, and in a mainly qualitative way. Studies have revealed that even moderate EV penetration levels have surpassed the limits of undervoltage, unbalance, and harmonics above the established standard limits, whereas, power quality concerns, such as local overloading, supraharmonics, and flicker, are less reliant on the quantity of EV chargers connected to the system.
A distinction will be made in this paper between the different levels of impact and the associated limitations. Impacts due to EV charging on the local PCC and distribution network are discussed in
Section 2. The different phenomena, such as undervoltage, overvoltage, unbalance, harmonics, interharmonics, supraharmonics, fast voltage variations, light flicker, and local thermal overload are discussed in detail. Limitations set by the distribution network as a whole on the phenomena, such as overloading of cables, lines, and transformers, and overloading due to fast charging, are also discussed. These phenomena set barriers when multiple charging installations are connected to the same distribution grid, all of them, on their own, not having any unacceptable local impacts. Increased use of EV charging is expected to be associated with the increased use of renewable energy sources and energy storage systems. The combined impact of this is discussed in
Section 3.
Section 4 deliberates some of the expected changes in the grid due to EV charging and its potential side effects.
Section 5 addresses the need for modern computing tools, such as soft computing techniques for waveform distortion pattern identification, and illustrates a case study for EV Charging. Such tools will be an advantage to identify useable information which will be benefit future research. Thereafter, the findings and recommendations are presented in
Section 6. Finally, the paper summarizes the work with a discussion and conclusion in
Section 7 and
Section 8, respectively.
2. Impacts Due to EV Charging on the Local PCC and Distribution Network
The limits for EV charging on the local PCC and distribution network mainly depend on the charging load and the impedance of the grid. With very few charging units, the impact is only on the local PCC, but, as the number of charging units increases, the impact will be propagated to the distribution network.
2.1. Undervoltage
The phenomenon of undervoltage may occur when an EV is connected to the grid as it consumes active power. The severity of the voltage drop will depend on factors such as the power rating of the EV charger, number of EVs connected to the phase, the impedance of the grid, and the voltage check control logics applied at the start and at regular intervals [
6]. The voltage drops or rises in a single-phase system is half the drop in the active phase and half in the neutral return phase, due to the current flowing through it. In the case of a three-phase balanced system, where each phase is 120 degrees, out of phase, the neutral current is zero. Hence, the voltage drops in a three-phase system is 1/6th the voltage drops in an equivalent single-phase system. According to IEC60364-5-52 standards [
7], the permissible voltage drop is 3% for lighting load and 5% for other loads, in the case of low-voltage distribution systems. The probability of undervoltage due to EVs is during the peak evening hours, when the RMS voltage is already low. The extreme steps to overcome this problem is the curtailment of active power demand at the user end, during dangerous situations.
One of the best methods for voltage support in the case of low-voltage distribution networks during undervoltage is the injection of reactive power. This is because of the high resistance to reactance ratio of the low-voltage distribution network. In [
8], a dual control technique was used, where the local control was achieved by controlling the converters of EV and rooftop PV and wind systems in a home environment, to maintain the point of connection (POC) voltage within the limits. The central control was done remotely, controlling the Battery Energy Storage system (BESS) and the onload tap changer.
The Flemish distribution grid topology was used by investigators in [
9] to inject reactive power from inverters of EVs to compensate for the voltage drop in EV. Henceforth, the hosting capacity of EV during uncoordinated charging and the off-peak tariff period of residential charging has been increased. An EV integration study on an IEEE European low-voltage test feeder identifies 45% probability of undervoltage in 12 nodes with 11 EVs’ (20.00% of the dwellings) penetration [
10].
2.2. Overvoltage
The combination of EV and PV integration may result in unique operational challenges for the network operators at the distribution side. At a home connected with a three-phase PV system, which is charging a single-phase EV, the possibility of overvoltage on the phases which are not connected to the EV is predicted [
11,
12]. The other possibility of overvoltage is the post-disturbance voltage rise due to a tripping of the Plug-in Electric Vehicle (PEV) caused by voltage sag during nights when the nominal load is minimum. A study on the overvoltage due to synchronous tripping of PEVs was illustrated with two standard distribution test networks: one, a 23 kV feeder, and the second, the standard IEEE-34 distribution feeder [
13]. The study reveals that the location of PEVs in the feeder has a major influence on the post-disturbance overvoltage. The network is most vulnerable to overvoltage when PEV load is located at the far end of the feeder. The paper suggests an alteration in standard [
14] to ensure a grid-friendly approach of PEV tripping during voltage dips.
2.3. Unbalance
In the case of the low-voltage distribution grid, the single-phase plug-in EV charging causes voltage unbalance. It mainly depends on different factors, such as charger size, the typical impedance of the grid, the EV penetration level, and distribution of load among different phases [
6]. For a weaker grid, the impact is greater. Along with EV charging systems the modern grid has the integration of battery energy storage systems (BESS) and renewable energy systems. The uncertainties in the energy generation of RES, the state of charge (SOC) of the BESS, and the time of charging and SOC of the EV batteries complicates the load flow calculations further. Under this condition, the conventional symmetrical load flow techniques fail.
EN50160 standards define the voltage range for normal operating conditions; it states that the voltage unbalance should be within 2% for the 10 min average value monitored for 95% of the data during a week [
15]. The voltage unbalance factor VUF is given by Equation (1).
where, %VUF is the voltage unbalance factor,
is the positive sequence voltage,
is the negative sequence voltage,
is zero sequence voltage,
are the line-line voltages,
∠120°, and
∠240°.
Different studies have used asymmetrical load flow calculations in which some studies used equal loads in all phases before the EV integration [
16,
17,
18]. Very few studies have reported unbalance load (
Table 1) [
19]. The study [
19] demonstrates the unbalance with the help of a German village network comprising of 1-phase and 3-phase PV, heat pump, single-phase and three-phase EV and PHEV. The evaluation of VUFrms was carried out from 2 pm to 7 pm. A worst-case scenario with 50% cars in one conductor, and 25% each in the other two conductors, at 6 pm, was considered on the 3rd Feeder with 16 nodes. There was a voltage drop from 224.9 to 216.5 at node 16 with EV penetration and the degree of asymmetry, VUFrmf was 3.2%, which was beyond the 2% limit, as per the EN 50160 standard. In [
17], the Nissan Leaf PEV was used as an Energy Storage System (ESS) for mitigating the voltage unbalance of VUF 6.350% to 1.885% during peak hours.
2.4. Harmonics
The AC-to-DC power converter in an EV charger injects harmonic currents into the grid. The harmonic spectrum depends on the technology used, but harmonic-free converters are, in practice, not available. As per article [
20], single-phase diode-bridge chargers have the 3rd and 5th as dominant current harmonics, whereas, in three-phase diode chargers, the dominant harmonics are the 5th and 7th. For chargers consisting of a six-pulse thyristor bridge, the prominent harmonics are the 5th and 7th (The relationship of pulse number to harmonic order is expressed by h = kn ± 1, where, ‘h’ is the harmonic order, ‘k’ is any integer, and ‘n’ is the pulse number of the device/circuit. Hence, in a six-pulse thyristor bridge, the 5th and 7th harmonics are prominent), with significant percentages of the 9th, 11th, 13th, and 15th, and a THD as high as 70%. On the other hand, a 12-pulse charger has a lower THD value of about 12 to 15% [
20].
A measurement at the 0.4 kV side of a transformer supplying an EV charging station with 8 charging outlets is discussed [
21]. It was noticed that the harmonics current phase angles are basically constant during charging, since the equivalent resistance and the equivalent inductance and capacitance depend on the charging infrastructure, but it mainly changes during the constant current and constant voltage charging phases of the control logic.
A measurement was done on a 160 kW, 375 A DC fast charger for a period of one month, in which time it obtained around 82 charging cycles of different vehicles. The 5th, 7th, and 11th harmonic values obtained using a power quality analyzer are shown in
Figure 1a,
Figure 1b, and
Figure 1c, respectively.
From
Figure 1, it can be noticed that almost all of the EVs generate significant 5th harmonic components, irrespective of the power electronic converter used. The summary of the lower-order harmonics as a box plot for the above-discussed case for a period of one month at a single charging outlet is shown in
Figure 2.
Though the harmonic emissions are within the limit, higher harmonic values are possible when large numbers of charging stations are connected to transformers with many customers, due to harmonic aggregation. In
Figure 2, high values of even harmonics (4th, 200 Hz) are also noticed, which may be due to frequency aggregation or direct currents. Taking into account the calculation of total harmonic current in the LV network, article [
23] emphasizes the need for phase angle determination of the harmonic current to study the harmonic cancellation effect. When new power electronic components, such as the converters of EVs and LEDs, are slowly integrated to the grid, a better THD evaluation technique needs to be introduced in the standards. As the first step, the article identified the phase angles of the 3rd and 5th harmonics as 195° and 330°, respectively.
Traditionally, many researches focused on the issue of harmonic elimination due to EV chargers. The research article [
24] investigated the EV coordination technique to eliminate current harmonic distortion, however, this solution also faced the trade-off between the interests of network operator and customers. To avoid any customer inconvenience posed by the utility fees and schedule, promising harmonic mitigation approaches move towards the use of active filters in smart appliances, such as PV inverters. The use of PV installation can offer the double benefit of charging the EVs and filtering the harmonics. In [
25], an active filter solution was proposed to resolve harmonic issues. The study case considered an LV network supplied by a 250 kVA transformer, with five 215 kW EV fast charging stations and a 50 kW PV installation. In that scenario, the use of an active filter decreased the voltage THD from 11.4% to 5.6%, keeping the THD below the standard limit of 8%.
2.5. Interharmonics
Interharmonics are frequency components (below 2 kHz) that are not an integer multiple of the power-system frequency.
Their propagation through the grid is similar to the propagation of (normal, integer) harmonics: they have during-charging levels depending on pre-charging levels, emitted currents, and source impedance. There are, however, two important differences:
Pre-charging levels of interharmonics are typically low; the during-charging levels, therefore, depend mainly on the emitted current and source impedance. A consequence of this is that the phase angle of the interharmonic current, in most cases, does not matter for the resulting magnitude of the interharmonic voltage.
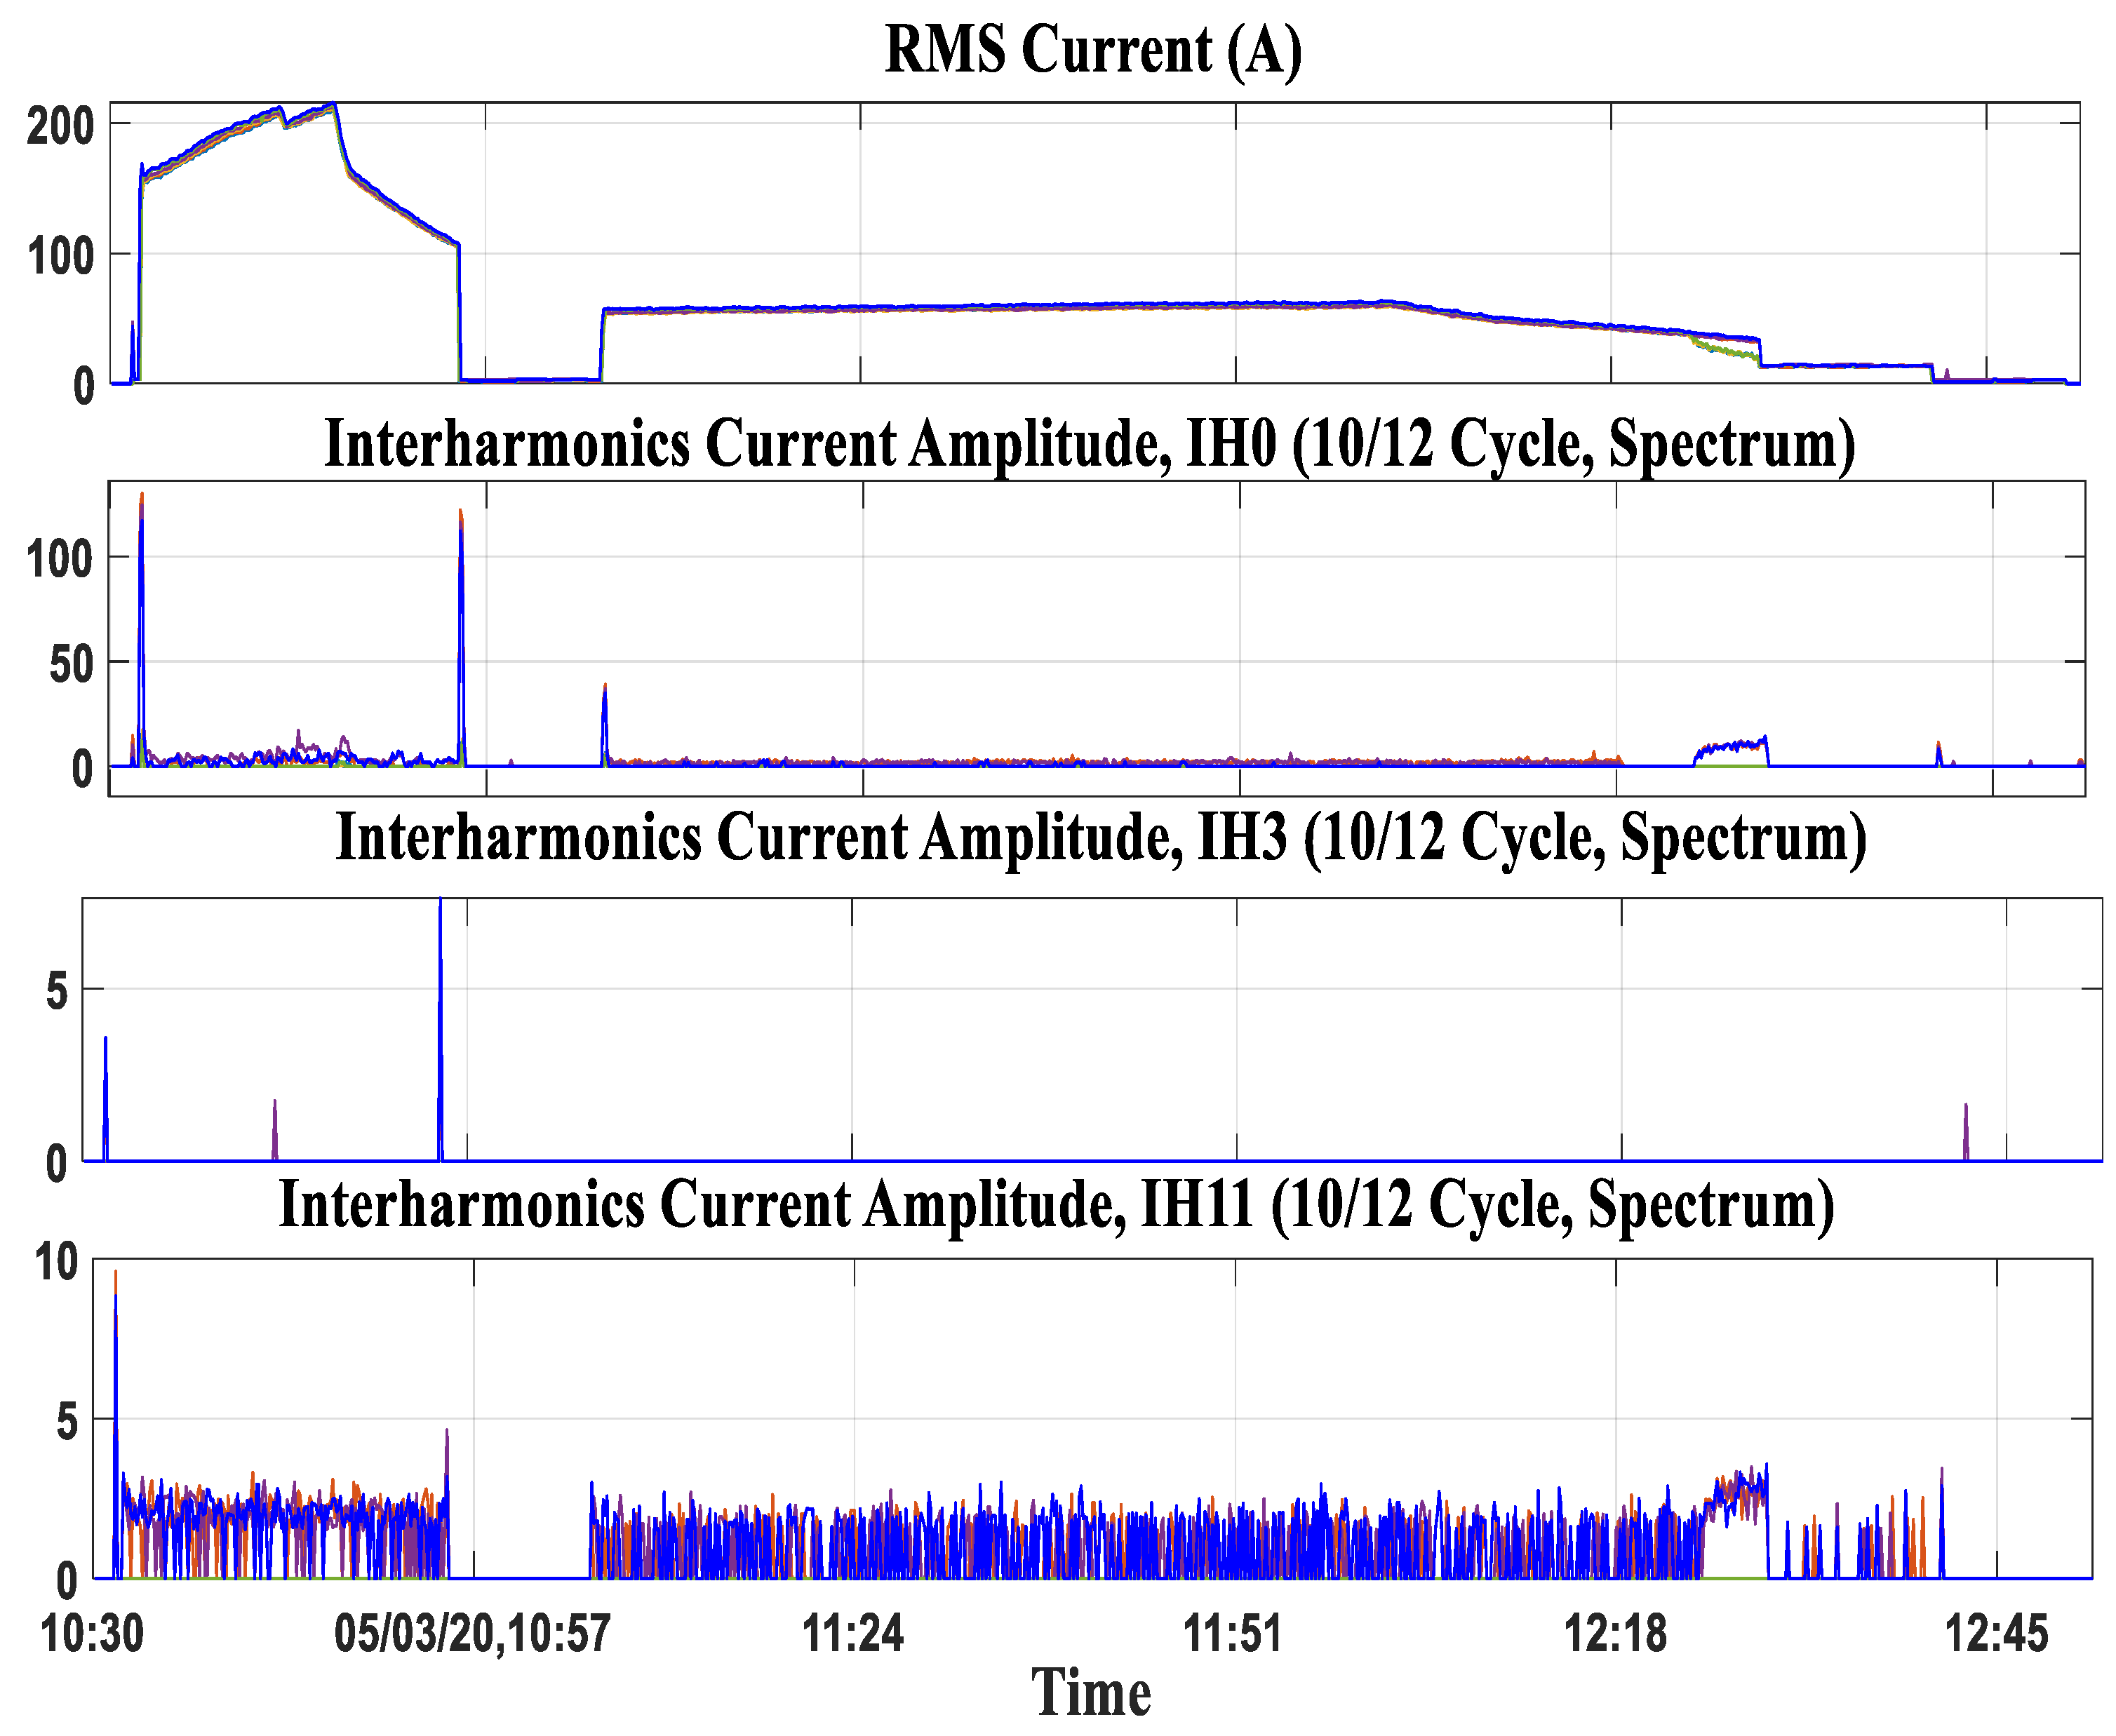
The three-phase EV charging RMS current and 10/12 spectrum of interharmonics current at a 175 kW, 360 A fast charging station are shown in
Figure 3.
Interharmonics are mainly associated with the transients in the charging current. From grouping of interharmonics 0.5 (IH0), 3.5 (IH3), and 11.5 (IH11), it is inferred that the interharmonic component is higher during the transients at the start or end of fast charging. A higher value of interharmonics at 0.5 (IH0) grouping is observed because it includes the DC component also. Limited information is available in the literature on interharmonic currents emitted by EV charging.
2.6. Supraharmonic
Supraharmonics are defined by the frequency components in the range between 2 kHz and 150 kHz. In the modern grid, with penetration of renewable energy sources, EV, and many other components with power electronic converters, a new high-frequency component of distortion is observed in the grid at both the distribution and transmission side. The research of such high-frequency components is a relatively new field of study [
26,
27]. Hence, standardization of supraharmonic limits in the grid, and immunity limits for the equipment that produce it, is an urgent need. A recent study on propagation of supraharmonics in the medium-voltage network with 8 feeders reveals that the bigger the network, the more resonant frequencies are observed, whereas the amplitude of the resonant peak of the driving point impedance decreases. The aggregation of supraharmonics generated by multiple devices can get amplified by resonance and may cross the limit of 2% of nominal voltage set by the EN 50065 and IEC 61000-3-8 standards [
28,
29]. These standards are defined for 3 and 9 kHz frequencies only [
30].
Emission of supraharmonic currents is observed with several measurements of the EV charging current. Supraharmonic voltages and changes compared to existing levels of supraharmonic voltages can thus be expected with EV charging.
A 6.6 kW EV charger measurement at Luleå Tekniska Universitet (LTU), Sweden, found the presence of supraharmonic emissions in the broadband range of 43 to 58 kHz, as shown in
Figure 4.
The supraharmonic emissions from EV may propagate through the protective earth. High magnitudes of the supraharmonic current through the protective earth, or leakage current beyond the installation, may result in tripping of residual current devices [
31]. If the grid is weak, then the supraharmonic component may flow towards the grid and cause high supraharmonic voltages elsewhere [
30].
2.7. Fast Voltage Variations
In the case of EV charging, the magnitude of fast voltage fluctuations depends on the transient charging current peak and impedance of the grid. The current peak depends on the state of the charge (SOC) of the EV. The SOC depends on the ambient temperature and on the battery’s age and capacity. A rapid voltage change is noticed during the start and end of the charging cycle, apart from the regular voltage checks done by the charging control circuit. This rapid voltage changes could create a light flicker (repetitive change in light intensity) that humans can perceive.
The charging signatures of vehicles A, B, and C are given in [
32]. The battery status check of vehicle A, brief period charging breaks of Vehicle B, and rapid voltage charge of vehicle C, until it is unplugged, are discussed in [
32].
During EV charging, the diagnosis and monitoring processes cause rapid voltage fluctuation [
33].
The impact of those rapid voltage changes is light flicker; though not continuous, they result in temporary blinks in the light. When the blinks occur repetitively, this can be perceived as annoying, too.
2.8. Light Flicker
The root cause for light flicker is identified as the periodic amplitude modulation of the voltage waveform envelope, caused due to loads such as EV charging, ON/OFF of motor, switching of capacitor banks, etc. The voltage variation may include RMS dips, interharmonics, amplitude modulation, and notches. Very few researcher articles have addressed the issue of light flicker due to EV charging [
22,
32,
34].
The flicker is calculated by a statistical process over a 10 min internal of voltage data, which is represented by Pst. A Pst > 1 indicates irritating flicker for a 60-watt incandescent lamp, as per the IEEE 1453 standard [
35]. The flicker limits, with respect to the EV fleet, also depends on the background flicker due to other grid connected installations. In [
34], light flicker on grids of different strength levels, based on short-circuit level and impedance angle, are analyzed. The study considered an Irish Atlantic Marine Energy Test site where an EV fleet was connected to the 20 kV bus. The analysis was done based on grid operator perspective, to maintain the voltage within the ±10% of the nominal voltage. Ten group of EVs were considered, in which each group created a 0.01 pu voltage deviation. The result shows a minimum short-circuit ratio of 19 for the impedance angle of 30, corresponding to the stringent limit of Pstmax = 0.3, for 5 groups of the EV fleet, connected. One of the disadvantages of this study was that it considered several groups of EV fleet getting connected to the grid with constant power, which might not be the scenario in reality.
Light flicker is a subject that has a direct impact on the customer, and is probably, therefore, one of the most commonly reported power-quality problems. The lighting industry and power-quality researchers are still struggling to establish links to characterize the temporal light flicker problems. Further studies are needed to find at least an explanation for the high number of reported cases.
2.9. Local Thermal Overload
In future, it is anticipated that more EVs will be charged residentially. Hence, safety precautions need to be taken against overloading and fire. In general, home wiring will not be able to continuously cater to 16 A/32 A for single-phase/three-phase charging, and may get heated up. Hence, it is advisable to a have separate connection for EV charging, with the socket outlet of the supply installed at least 2.6 feet above the ground level. Regardless of the sanctioned load, an earth leakage protection device needs to be installed.
2.10. Overloading of Cables, Lines, and Transformers
The large penetration of renewable energy sources and electric vehicles into the grid creates new challenges to the life of cables, transformers, and lines. Transformer and cable end-of-life failure is more dependent on the deterioration of the insulation, with respect to the temperature factor. In case of line failure, it is the loading factor [
36].
The transformer is a major component whose life will be affected. In [
37], a transformer thermal model has been developed which estimates the aging of a 25 kVA overhead distribution transformer servicing 12 homes, based on the IEEE C57.91-1995 standards [
38]. The weakest link, which determines the transformer aging, is its internal insulation failure. With respect to the loading and temperature condition, an accelerated loading test was carried out to estimate the transformer’s life. The results show that the temperature-based smart coordinated charging of an AC Level 2 charger can reduce transformer’s life by a factor of 9.79 to 0.9 in Phoenix, Arizona. A study on transformer end-of-life estimation, based on the Arrhenius-Weibull distribution model, shows that, for a 200% EV penetration, the failure probabilities of a substation transformer is 13.2%, and that of line failure is 1.4% [
36].
The impact of EV charging on the 7.5 kW North American Distribution System model was studied by the investigators in [
39]. In article [
39], the transformer’s loss-of-life (LoL) and the aging factor for 4 different scenarios of EV charging were studied, and the impact of EV charging was qualified using the IEEE Standard C57.91-2011. Four different scenarios were considered: (i) level 1 charger; (ii) 50% of level 1 and level 2; (iii) level 2; (iv) 40% level 1 overlapped with peak residential load. Considering the 4 scenarios, the transformer life was predicted, and it was observed that the life decreased by 10-, 14-, 66-, and 22-times the baseline load for an increased EV penetration. A local reactive power compensation technique was used to improve the transformer’s life by 49%, compared to the uncompensated technique.
Considering all the above factors, it can be concluded that the risk of overloading depends on the preloaded condition of the grid and the actual hosting capacity of the grid. For EV penetration into the grid, the transformers, line, and cables are more vulnerable to failures [
36].
2.11. Overload Due to Fast Charging
Modern rapid chargers can charge at a very fast rate, with a power rating up to 350 kW. Such fast chargers will draw a huge current, up to 1250 A, during a very short period of time.
Table 2 gives the electrical characteristics of slow and fast chargers.
Fast chargers are a concern in rural areas with weak grid impedance, where the distribution transformers may easily get overloaded.
For conductive charging of both AC and DC up to 1000 A AC and 1500 A DC, the IS 12360/IEC 60038 standard [
41,
42] requirements are followed. The CCS, CHAdeMO, and Type 2 AC fast chargers are the most common fast charging connectors used internationally. Some of the minimum requirements while installing such fast chargers that need to be considered are: (i) an exclusive transformer with all substation equipment related to the rating of the fast charger, including safety appliances; (ii) 33/11 kV line/cables with associated equipment, such as line termination, metering, digital communication equipment, etc. [
43].
The different power quality (PQ) impacts discussed above cause peculiar operation of electrical devices, which cause heavy economic loss to both local customers and network operators. Since, with each power quality phenomenon, the indictors for ranking, such as severity with respect to magnitude, duration of the impact, fault clearing time, economic aspect, etc., varies, the quantification of losses is very complex. With a conventional outlook, it is expected that, in urban areas, overloading will be the major issue and, in rural areas, undervoltage will be the concern for network failure.
As per the Leonardo Power Quality Initiative (LPQI) survey in Europe and the Electric Power Research Institute (EPRI) survey in the United States, voltage sag and interruptions are the most common PQ problems, covering 55% and 48% of problems, respectively. On the other hand, the harmonics’ share is 5% in Europe and 22% in the US. In Australia, the distribution voltage is at a higher level; hence, overvoltage is a common PQ issue which results in premature aging of equipment. Hence, the ranking of the PQ impacts varies among different countries.
3. Combined Effect of Grid-Integrated Renewable Energy Sources, Energy Storage Devices, and EV on the Grid
The combined effect of renewable energy sources and EVs can cause stability and power quality issues in the grid, due to the intermittent nature of renewable energy sources such as PV/wind and the uncertainty of the EV. Recent research has proved that the coordinated control of sources and EVs can overcome these issues.
The power converters in RES, ESS, and EV inject harmonic distortion, and their aggregation at the PCC may be an amplification or attenuation [
6]. In [
44], the investigators studied the PQ impact of EVs, windfarm, PV, and fuel cell units under different loading and weather conditions, on a modified radial 16 bus test system. This study uses 10 kW fast charger EVs, which can charge in 10–15 min.
The expected PQ problem with a hybrid system is the inrush current transient, due to the renewable energy generation system and grid voltage difference. It can cause voltage sag in the adjacent bus, thermal stress of power components, and nuisance tripping of protection systems. The severity of the inrush current depends on the system impedance magnitude of the coupling transformer and nonlinear magnetic saturation current and the direction of the flux linkage of the coupling transformer [
44]. The other PQ problems reported are the protection failure during a fault or an unintended islanding operation that may result in the REG system feeding power to the load, even after the network is disconnected from the utility grid. The hybrid system, with wind and solar, results in output power fluctuation, due to the minute-to-minute variation of wind speed and solar irradiation. This, in turn, results in overloading or underloading, unacceptable voltage fluctuation, and voltage flicker.
The power imbalance between the renewable energy sources and load results in frequency deviation (FD). FD reduction techniques involve coordinated control methods applied in a localized, decentralized, or centralized manner. In [
45], a particle swarm optimization (PSO) -based fuzzy logic controller scheme is used for frequency regulation of a microgrid with RES, non-renewable energy sources, and prosumers. Here, a multi-objective optimization technique was used, where, under a normal state of operation, minimization of FR cost, considering the battery degradation cost, is done, and, under abnormal operation, the objective function was to minimize the frequency restoration duration.
The major power quality issue due to PV-EV integration in the grid is the component loading and unbalance. One of the solutions is to use a static switch and switch the load among different phases [
46]. Another method is to use control techniques for providing a negative sequence current [
47]. Reactive power control by the PV inverter to improve the grid voltage may result in component loading and grid losses; hence, in [
46], a local coordination charging algorithm, without communication infrastructure and with less computational burden, is used. It claims that, in other such algorithms reported in the literature, the PV power production and the EV charging time and duration are known, which is not possible in reality. Hence, the investigator used the local voltage profile and estimated the droop constant, which defines the setpoints for the absorption and injection of power in each phase. This was achieved using two balancing chargers and two balancing PV inverters.
In [
48], the investigators introduced a highly efficient bidirectional zero-voltage switching DC/DC EV charger on the high-voltage DC bus of the PV inverter to divert the fast transient output current of PV into the EV battery. By doing so, the output power slew rate reduced significantly. In a similar study, the DC link voltage is regulated using an optimized adaptive control technique under different test conditions, such as PV intermittency, load perturbation, load fault, weak grid conditions, and grid disturbances.
In recent research, a cloud-based virtual power plant (VPP) is the solution for the coordination of EVs, RES, and ESS. The VPP can perform the energy management of the heterogeneous distributed energy resources (DER), such as the photovoltaic system, wind generators, fuel cells, batteries, EVs, etc. The requirements of the virtual power plant are the integration of the (i) communication network; (ii) protocols for data transfer; and (iii) cyber security system with the power network. Being a multidisciplinary research area, a lot of scope exists in defining a VPP architecture for this dynamic, unpredicted, and growing smart grid.
4. Expected Changes in the Grid Due to EV Charging
Going for a next-generation transmission infrastructure to cater to the growing need of EVs and the emerging demands of society is a long-period goal, and achieving it in a short time-scale is impossible. Hence, alternative solutions in line with the long-term goal need to be planned.
The first change expected in the grid to accommodate more EVs is the ancillary upstream infrastructure, such as the distribution transformer. When more customers go for fast charging, more network reinforcement is required. Especially, a large number of home installations need to be converted to three-phase connections. Some of the possible solutions are to create microgrids with more distributed generation, with a higher ratio of renewable energy sources and energy storage systems. The other solution is to implement smart charging coordination by shifting the load to non-peak hours and the maximum utilization of existing infrastructure. Several mitigation solutions based on the above are suggested in the literature [
49,
50,
51]. In the research articles [
49,
50,
51], time-of-use (TOU)-based strategies for electricity rate are discussed. For instance, according to the research done in [
51], the optimal time to start the off-peak rate is between midnight and 12 PM. By doing so, overload can be avoided.
Participation of EV Batteries in Electricity Markets
It is anticipated that batteries from electric vehicles will support the grid in the near future. The term “vehicle-to-grid” (V2G) is often used for this. The different market strategies considered are: day-ahead spot markets for energy [
52,
53,
54]; real-time markets for upward and downward regulation [
55]; and frequency control [
56,
57]. To implement real-time pricing, the system requires IT technologies for communication and data flow with secure data exchange and storage, in order to address consumers’ privacy and data protection concerns.
5. Soft Computing for Waveform Distortion Pattern Identification for EV Charging
Soft computing is one of the most powerful tools today for solving complex real-time problems. It is tolerant to uncertainty, inaccuracy, irregularities, partial truth, and approximations. Different soft computing techniques popularly used in engineering and science are fuzzy logic, expert systems, artificial neural networks, machine learning, deep learning, and optimization algorithms [
58]. The Fuzzy, AI, and neural-based models are used for driving range estimation [
59,
60], electric vehicle energy demand modelling [
61], hybrid electric vehicles’ carbon dioxide emissions [
62], photovoltaic generation capacity prediction [
63], etc. Very few recent papers have reported classification of power quality disturbances using soft computing techniques [
64,
65,
66]. These articles were able to extract more critical information in the field of sustainable electro-mobility systems.
Research was carried out to identify the most dominant current harmonics in a EV charging station using an unsupervised deep, autoencoder learning technique. The dataset from a 160 kW, 375 A DC fast charger from northern Sweden was applied to deep clustering to classify the EV charging patterns. The data consists of non-interrupted measurements over 31 days.
Figure 5a shows the heatmap of the data by reshaping it to each day of the measurements versus the number of samples per day. To extract the periods when the EV station was in operation, the first derivative of active power was applied.
Figure 5c exemplifies this process for a single charging period. By applying the first derivative, the raw data is flagged to indicate the initiation and ending of the charging period. These flags allow for the extraction of only the EV charging instances.
Figure 5b shows the resulted heatmap matrix by applying such flagging. In total, 82 charging periods were identified. The pre-processed data is normalized and applied to the autoencoder. In this example, the objective is only to find power consumption patterns during EV charging. However, such flagging can also be used to analyze other phenomena, such as harmonic distortion.
Figure 6 shows the obtained results for the clusters from 1 to 5. The number of clusters was decided based on the information that five types of cars were charged in the installation when the measurements were performed. The goal was to find five such different patterns. It cannot be affirmed that each cluster represents a different car, but it is possible to affirm that each cluster represents a different pattern concerning the peak active power and charging duration. The peak active power differs among the cluster: Cluster 1 is 15 kW, Cluster 2 is 50 kW, Cluster 3 is 22 kW, Cluster 4 is 22 kW, and Cluster 5 is 34 kW, as shown in
Figure 6.
Clusters 1 and 4 represent a shorter-duration charging pattern when compared to the other clusters. The difference between Clusters 1 and 4 is the additional step in the charging, which appears only in Cluster 1. Cluster 5 represents the highest charging duration. Clusters 2 and 3 present a duration higher than Cluster 1 and lower than Cluster 5.
The flagging used for pre-processing the spectra data with current harmonic components from the 2nd to the 50th order were sampled every 100 ms. The deep clustering was applied to the pre-processed spectra data in order to find the typical current harmonic spectra during EV charging.
Figure 7a shows the five patterns for the spectra, and
Figure 7b shows the distribution of the patterns during the charging instances that are presented in
Figure 7b. Cluster 1 is associated with periods without charging. Cluster 3 appears only in charging instance 75, and represents lower distortion than clusters 2, 3, 4, and 5, but it is higher than Cluster 1. Cluster 2, 4, and 5 represent the spectra during charging. Cluster 2 and 5 presents the 3rd, 11th, and 13th components as dominants. However, the 3rd harmonic component is higher in Cluster 2 than in Cluster 5. Cluster 4 presents mainly the 13th component. This way, the most dominant current harmonic components for all the charging instances are determined as the 3rd, 11th, and 13th. Hence, these powerful tools can be used to extract more valuable information from big data obtained from massive charging.
6. Findings and Recommendations
With the increasing penetration of EVs, renewable energy sources and energy storage systems the future grid will face significant power quality impacts. In addition to the many suggestions for future research that are addressed already in the paper, an attempt has been done in this section to emphasize the educational, data, and research requirements in the power quality domain.
Research Requirement
- (i)
Overload and undervoltage
Today, a lot of effort within the research field is focused mainly on smart solutions for mitigating the adverse impacts of massive EV charging, if any. Constructive research should be carried out that can provide guidance to network operators on when to use classical solutions and when to go for advanced solutions. Most of these new solutions to avoid overload and undervoltage offer economic incentives for reducing or shifting EV charging to off-peak load hours. A quantitative understanding of the price elasticity for different types of EV charging is needed. Research is also needed to map any potential unintentional social consequences of these economic-incentive schemes.
Efforts towards applying thermal rating methods for allowing more EV charging to be connected to distribution networks are definitely needed. Methods for the dynamic rating of overhead lines needs to be developed. The main interest in dynamic rating of cables and transformers is in distribution networks.
Two different types of overloading needs to be differentiated: (a) actual thermal overloading; and (b) lack of reserve. For high voltage levels, manual switching or parallel operation are generally followed, while falling short of reserve. Data-driven dynamic ratings of different strategies are desired for different types of overloading and reserve.
- (ii)
Unbalance
The unbalance studies have shown that the medium-voltage (MV) network has greater impact due to EV charging; hence, more research is required in the MV network with EV charging. At the same time, more research should focus on the PV-EV integration and its coordination studies, since it is a solution for mitigating unbalance. This scenario may vary between different countries, depending on the different forms of distribution systems they have adopted.
- (iii)
Harmonics
Though harmonic emission for individual devices are defined in the IEC/TR 61000-3-7 standards [
67], the information about the emissions from new and future equipment are not clear. The models of harmonics aggregation from different sources are theoretically presented in a number of studies. However, more practical measurements are required to validate the models on harmonic aggregation from multiple sources.
- (iv)
Interharmonics
The aggregation of interharmonic emissions generated by multiple EVs, or by EVs and other equipment, are less explored. Interharmonic aggregation may result in instability issues of the control system. Measurements are required to develop models based on interharmonic propagation and aggregation from multiple EVs, especially in parking lots. More studies are also required in the area of PV—EV charging, especially during sunrise, peak solar hours, and sunset, when PV power is varying drastically, resulting in interharmonics.
- (v)
Supraharmonics
Studies have reported emissions of supraharmonics from individual sources. The propagation of supraharmonics generated from single sources are also reported in the literature. Data collection and more detailed studies to understand interferences due to supraharmonics from multiple sources, such as multiple EV charging or hybrid systems, such as solar photovoltaic systems, wind generators, energy storage systems and, EV charging, are required. The rating of the EV charger also plays a major role in the magnitude of supraharmonics. Fast chargers of high-current ratings consuming active power, connected to the MV network, are also the concern for high magnitudes of supraharmonics. An awareness of supraharmonic impacts on the medium-voltage network and distribution network need to be carried out among engineers in the industry. Further studies to support the standardization committee for setting up standards are required.
Ranking/quantifying the power quality impact is a topic that needs to be researched. An impact indicator for power quality problems need to be defined based on their severity, with respect to magnitude, duration of the impact, fault clearing time, and economic aspect, i.e., both direct and indirect cost. Hence, the ranking of all PQ impacts due to EV, renewable sources, and ESS integration with grid respect to different countries, need to be studied.
- (vi)
Data Requirement
- ⮚
The field measurements on fast charging stations, especially above power levels of 50 kW, are needed. Such measurements are required for the study of the impact of EV charging;
- ⮚
As the impact of EV battery charging on the grid depends on weather conditions, the data of EV charging, with respect to different temperature scenarios, are required;
- ⮚
Measurements for determining the input impedance of EV at different harmonic frequencies are required to make optimal modals for harmonic studies;
- ⮚
In order to perform network hosting capacity studies, data of the existing network is required. Two specific needs are the RMS voltage and unbalance values, along with the phase angle statistics of the LV customers.
- (vii)
Educational Requirement
The conventional hosting capacity studies used for PV installations are suitable for estimating EV charging installations. It is required to educate network operators to estimate the hosting capacity for EV charging, with respect to the distribution transformers.
- (viii)
Harmonic Elimination Solutions
Recent research has reported the impact of electric vehicle charging in the grid [
22,
68,
69], and, thus, power quality-improved electric chargers are designed in [
70,
71,
72]. Isolated solar-based, bidirectional Electric Vehicle Chargers [
73] and an off-board PV-Grid Adjustable Charger [
74] with Power Quality Enhancement Features are reported in the literature [
75]. A continuous development towards the design of more optimal converters and their control logics for power quality improvements in EV applications should happen.
7. Discussion
In the current scenario, EV charging does not pose significant obstacles to the power system. However, from the EV penetration rate, it is evident that the distribution network as a whole will have to set limits.
The majority of the EV charging problems documented in the literature are related to high power demand during peak hours. The impacts of the above problem are unintentional triggering of the protection system and overloading of transformers, lines, and cables, which, in turn, causes serious problems to customers and network operators.
Large penetration of EVs into the distribution network causes undervoltage. The major factors that impact the severity of the undervoltage are the rating of the charger, the type of charger, i.e., fast or slow, instant of charging, SOC of the battery, driving cycle, etc. On the other hand, the factors that influence the severity of unbalance are the power rating of the charger, grid impedance, and the background unbalance of the existing network. A single-phase EV charger with rated power of 3.3 kW, 230 V and 16 A does not cause significant unbalance [
3], but it may exceed the standard limit of 2% in certain locations, depending on the existing background unbalance and higher EV charger rating [
24]. The study also proves that, with a low penetration of 30%, the impact may be higher at the medium-voltage level.
Even taking PV penetration into account, there is no proof that the unbalance will be mitigated. Hence, PV and EV integration-based coordination strategies for mitigating the unbalance issue need to be devised. Fast voltage fluctuations caused due to sudden changes in charging currents within a 10 min interval may cause recurrent changes in light intensity that people may find disturbing. With large numbers of EV charging loads, with respect to the short-circuit current of the PCC, the probability of light flicker increases. This is another serious issue that need to be addressed.
Despite the harmonic emissions from individual EVs being within the permitted standard limits, harmonic aggregation due to multiple EV charging cannot be ignored. The use of diverse chargers from different brands of different topologies and different ratings may have both positive and negative effects on the aggregation of harmonics.
Studies related to interharmonic emissions due to EV charging are very limited. Interharmonics are generally low in magnitude and are observed whenever there is a momentary change in the charging level of the battery, or whenever there is a state-of-charge check. For a detailed understanding of interharmonics, experiments in a controlled environment needs to be done to understand the complete charging cycle behavior of different EV chargers. Problems with supraharmonics are typically local issues, and the EV power level is not necessarily a reliable indicator of the impact level. The power electronics control logic used in chargers, as well as the connection of other appliances in the vicinity of the EV charger, are typically the reasons for the emission of supraharmonics. Supraharmonics propagate mostly through interaction between the various appliances. In most circumstances, the primary emission produced by EVs that are linked to the grid is not very high. However, high levels could be produced by network resonances, secondary emission from other equipment, and intermodulation, resulting in high compatibility levels. Additionally, interferences brought on by the spread of supraharmonics have been seen when both the emitting device and the one being interfered with are EVs. The supraharmonics emitted by every EV are unique.
It is usually a broadband/narrowband signal in the frequency range of 5 to 60 kHz. The supraharmonics’ time-frequency behavior is dependent on the device’s topology.
In the case of a sub-transmission grid, a large EV penetration improves the voltage profile, but at the risk of increased congestion. Power system stability is the main concern of the large-scale transmission network. In order to keep pace with the drastic penetration rate of EV adoption in the near future, together with the local impacts, the potential impacts at the distribution, sub-transmission, and transmission network all need to be addressed.
Compared to the consumption profile of a household, the EV charger power demand is high. Hence, an optimal location of charging pile in the distribution network, with an objective to reduce the investment cost and operating cost and maximize reliability and charger utilization, is the issue of which the network operators are concerned.
In countries where the LV network is completely three-phased, the domestic customer can connect three-phase equipment directly, but this is not the case in many countries. In such cases, the difference in low-voltage networks between countries becomes relevant.
Ranking/quantifying the power quality impact is a topic that needs to be investigated. An impact indicator for power quality problems need to be defined based on their severity, with respect to magnitude, duration of the impact, fault clearing time, and economic aspect, i.e., both direct and indirect cost. Hence, the ranking of all PQ impacts due to EV, renewable sources, and ESS integration with grid respect to different countries need to be studied. Hence, a need to quantify a power quality index for EV penetration into the grid, with respect to different charging strategies, exists.
8. Conclusions
The technological shift towards electro-mobility presents unique challenges and opportunities for network operators globally. This study addresses the limitations set by the existing grid on different types of charging associated with electro-mobility. The implications were considered to formulate recommendations and draw conclusions. The general conclusions can be summarized as follows:
- ⮚
Slow domestic charging impact studies have been reported in the literature. However, research on the impact of a greater number of such chargers on the grid is not reported. At the same time, the futuristic scenario is the impact of fast chargers, wireless in-road EV chargers, and electrified roads on the grid. More gaps, with regard to power quality challenges and opportunities, are identified for further research;
- ⮚
Proper direction needs to be given to the network operators for making smart decisions/preventive action to avoid adverse power quality impacts such as overloading;
- ⮚
A mapping of the low- and medium-voltage networks of different nations is required. This may provide an opportunity for the power system experts/network operators to derive some valuable conclusions and interpret the results obtained from other countries for solving their issues;
- ⮚
Powerful tools for analyzing big data acquired from hybrid systems such as RES, ESS, and EV integration should be used for extracting useful information.
This study helps researchers, industrial professionals, and network operators to gain a better understanding of power quality issues, with regard to electro-mobility.
Author Contributions
Conceptualization, S.S.L., M.H.J.B., T.B., A.E.D., E.M., H.B., J.S., K.M.U.A., N.N., S.S. and V.R.; methodology, M.H.J.B., S.S.L., T.B., A.E.D., E.M., H.B., J.S., K.M.U.A., N.N., S.S. and V.R.; software, S.S.L. and M.H.J.B.; validation, S.S.L. and M.H.J.B.; formal analysis, M.H.J.B. and S.S.L.; investigation, S.S.L.; resources, S.S.L., M.H.J.B., T.B., A.E.D., E.M., H.B., J.S., K.M.U.A., N.N., S.S. and V.R.; data curation, M.H.J.B.; writing—original draft preparation, M.H.J.B. and S.S.L.; writing—review and editing, S.S.L.; supervision, M.H.J.B.; project administration, M.H.J.B.; funding acquisition, M.H.J.B. All authors have read and agreed to the published version of the manuscript.
Funding
This research project funded by the Swedish Energy Agency under Grant number 47904-1.
Data Availability Statement
No new data were created or analyzed in this study. Data sharing is not applicable to this article.
Conflicts of Interest
The authors declare no conflict of interest.
References
- Mohamed, S.E.; Magdy, M.A.S. A comprehensive study of the impacts of PHEVs on residential distribution networks. IEEE Trans. Sustain. Energy 2014, 5, 332–342. [Google Scholar] [CrossRef]
- Sortomme, E.; Hindi, M.M.; MacPherson, S.D.J.; Venkata, S.S. Coordinated charging of plug-in hybrid electric vehicles to minimize distribution system losses. IEEE Trans. Smart Grid 2011, 2, 186–193. [Google Scholar] [CrossRef]
- Deilami, S.; Masoum, A.S.; Moses, P.S.; Masoum, M.A.S. Real-time coordination of plug-in electric vehicle charging in smart grids to minimize power losses and improve voltage profile. IEEE Trans. Smart Grid 2011, 2, 456–467. [Google Scholar] [CrossRef]
- Richardson, P.; Flynn, D.; Keane, A. Local versus centralized charging strategies for electric vehicles in low voltage distribution systems. IEEE Trans. Smart Grid 2012, 3, 1020–1028. [Google Scholar] [CrossRef]
- Bollen, M.H.J.; Häger, M. Power quality: Interactions between distributed energy resources, the grid, and other customers. In Proceedings of the 1st International Conference on Renewable Energy Sources and Distributed Energy Resources, Brussels, Belgium, 1–3 December 2004. [Google Scholar]
- Letha, S.S.; Busatto, T.; Bollen, M.H.J. Interaction between Charging Infrastructure and the Electricity Grid: The Situation and Challenges Regarding the Influence of Electromobility on Mainly Low Voltage Networks; Luleå University of Technology: Luleå, Sweden, 2021; ISBN 978-91-7790-807-4. [Google Scholar]
- IEC 60364-5-52:2009; Low-voltage electrical installations—Part 5-52: Selection and erection of electrical equipment—Wiring systems. International Electrotechnical Commission: Geneva, Switzerland, 2009.
- Behravesh, V.; Keypour, R.; Akbari Foroud, A. Control strategy for improving voltage quality in residential power distribution network consisting of roof-top photovoltaic-wind hybrid systems, battery storage and electric vehicles. Sol. Energy 2019, 182, 80–95. [Google Scholar] [CrossRef]
- Leemput, N.; Frederik Geth, F.; Roy, J.V.; Büscher, J.; Driesen, J. Reactive power support in residential LV distribution grids through electric vehicle charging. Sustain. Energy Grids Netw. 2015, 3, 24–35. [Google Scholar] [CrossRef]
- Fuentes, E.V.; Deniz, F.; Martínez, A.V. Electric vehicle grid integration analysis in low voltage networks—A case study. Int. Conf. Mod. Electr. Power Eng. 2016, 1, 85–88. [Google Scholar]
- Bollen, M.H.J. Överspänning Från Enfasanslutna Solpaneler; Energiforsk Report 506; Energiforsk/Luleå Tekniska Universitet: Luleå, Sweden, 2018. [Google Scholar]
- Bollen, M.H.J.; Rönnberg, S.K.; Lennerhag, O. Påverkan på Nätet av Stora Mängder Solkraft; Energiforsk Rapport 539; Energiforsk/Luleå Tekniska Universitet: Luleå, Sweden, 2018. (In Swedish) [Google Scholar]
- Kundu, S.; Hiskens, I.A. Overvoltages due to Synchronous Tripping of Plug-in Electric-Vehicle Chargers Following Voltage Dips. IEEE Trans. Power Deliv. 2014, 29, 1147–1156. [Google Scholar] [CrossRef]
- SAE International. Power quality requirements for plug-in electric vehicle chargers. In Surface Vehicle Recommended Practice J2894–1; SAE International: Warrendale, PA, USA, 2011. [Google Scholar]
- EN 50160; Voltage Characteristics of Electricity Supplied by Public Distribution Systems. Wroclaw University of Technology: Wroclaw, Poland, 2007.
- Ul-Haq, A.; Cecati, C.; Strunz, K.; Abbasi, E. Impact of Electric Vehicle Charging on Voltage Unbalance in an Urban Distribution Network. Intell. Ind. Syst. 2015, 1, 51–60. [Google Scholar] [CrossRef] [Green Version]
- Panich, S.; Singh, J.G. Impact of plug-in electric vehicles on voltage unbalance in distribution systems. Int. J. Eng. Sci. Technol. 2015, 7, 76–93. [Google Scholar] [CrossRef] [Green Version]
- Shahnia, F.; Ghosh, A.; Ledwich, G.; Zare, F. Predicting Voltage Unbalance Impacts of Plug-in Electric Vehicles penetration in residential low-voltage distribution networks. Electr. Power Compon. Syst. 2013, 41, 1594–1616. [Google Scholar] [CrossRef]
- Helm, S.; Hauer, I.; Wolter, M.; Wenge, C.; Balischewski, S.; Komarnicki, P. Impact of unbalanced electric vehicle charging on low-voltage grids. In Proceedings of the IEEE PES Innovative Smart Grid Technologies Europe (ISGT-Europe), The Hague, The Netherlands, 26–28 October 2020; pp. 665–669. [Google Scholar] [CrossRef]
- Gómez, J.C.; Morcos, M.M. Impact of EV Battery Chargers on the Power Quality of Distribution Systems. IEEE Trans. Power Deliv. 2003, 18, 975–981. [Google Scholar] [CrossRef]
- Zhang, Y.; Yu, D.; Zhang, G.; Wang, H.; Zhuang, J. Harmonic Analysis of EV Charging Station Based on Measured Data. In Proceedings of the IEEE/IAS Industrial and Commercial Power System Asia, Weihai, China (I&CPS Asia), Weihai, China,, 13–15 July 2020; pp. 475–480. [Google Scholar] [CrossRef]
- Letha, S.S.; Bollen, M.H.J. Impact of Electric Vehicle Charging on The Power Grid; Luleå University of Technology: Luleå, Sweden, 2021; ISBN 978-91-7790-763-3. [Google Scholar]
- Meyer, J.; Blanco, A.; Domagk, M.; Schegner, P. Assessment of prevailing harmonic current emission in public low-voltage networks. IEEE Trans. Power Deliv. 2017, 32, 962–970. [Google Scholar] [CrossRef]
- Deilami, S.; Masoum, A.S.; Moses, P.S.; Masoum, M.A.S. Voltage profile and THD distortion of residential network with high penetration of plug-in electrical vehicles. In Proceedings of the 2010 IEEE PES Innovative Smart Grid Technologies Conference Europe (ISGT Europe), Gothenberg, Sweden, 11–13 October 2010; pp. 1–6. [Google Scholar]
- Nguyen, V.L.; Tran-Quoc, T.; Bacha, S. Harmonic distortion mitigation for electric vehicle fast charging systems. In Proceedings of the 2013 IEEE Grenoble Conference, Grenoble, France, 16–20 June 2013; pp. 1–6. [Google Scholar] [CrossRef]
- Rönnberg, S.K.; Bollen, M.H.J. Propagation of Supraharmonics in the Low-Voltage Grid; Energiforsk Rapport 461; Energiforsk/Luleå Tekniska Universitet: Luleå, Sweden, 2017. (In Swedish) [Google Scholar]
- Rönnberg, S.K.; Bollen, M.H.J.; Amaris, H.; Chang, G.W.; Gu, I.Y.H.; Kocewiak, Ł.H.; Meyer, J.; Olofsson, M.; Ribeiro, P.; Desmet, J. On waveform distortion in the frequency range of 2 kHz–150 kHz—Review and research challenges. Electr. Pow. Syst. Res. 2017, 150, 1–10. [Google Scholar] [CrossRef]
- EN 50065; Signalling on low-voltage electrical installations in the frequency range 3 kHz to 148,5 kHz - Part 1: General requirements, frequency bands and electromagnetic disturbances. European Standard: Brussels, Belgium, 2011.
- IEC 61000-3-8:1997; Electromagnetic compatibility (EMC)—Part 3: Limits—Section 8: Signalling on low-voltage electrical installations—Emission levels, frequency bands and electromagnetic disturbance levels. International Electrotechnical Commission: Geneva, Switzerland, 1997.
- Letha, S.S.; Delgado, A.E.; Rönnberg, S.K.; Bollen, M.H.J. Evaluation of Medium Voltage Network for Propagation of Supraharmonics Resonance. Energies 2021, 14, 1093. [Google Scholar] [CrossRef]
- Sutaria, J.; Ahmed, K.; Rönnberg, S.K.; Bollen, M.H.J. Propagation of supraharmonics through EMI filters with varying loads. In Proceedings of the 2019 Nordic Workshop on Power and Industrial Electronics (NORPIE), Narvik, Norway, 25–27 September 2019. [Google Scholar]
- Seljeseth, H.; Taxt, H.; Solvang, T. Measurements of network impact from electric vehicles during slow and fast charging. In Proceedings of the 22nd International Conference and Exhibition on Electricity Distribution (CIRED 2013), Stockholm, Sweden, 10–13 June 2013; pp. 1–4. [Google Scholar]
- IEEE Std 2030.1.1-2015; IEEE Standard Technical Specifications of a DC Quick Charger for Use with Electric Vehicles. IEEE Vehicular Technology Society: Piscataway, NJ, USA, 2015.
- Blavette, A.; Le Goff Latimier, R.; Ahmed, H.B.; Multon, B. Analysis of the flicker level generated by the grid-connection of a fleet of electric vehicles. In Proceedings of the 2016 IEEE PES Innovative Smart Grid Technologies Conference Europe (ISGT-Europe), Ljubljana, Slovenia, 9–12 October 2016; pp. 1–6. [Google Scholar] [CrossRef] [Green Version]
- IEEE 1453-2022; IEEE Standard for Measurement and Limits of Voltage Fluctuations and Associated Light Flicker on AC Power Systems. IEEE Power and Energy Society: Piscataway, NJ, USA, 2022.
- Zhao, J.; Arefi, A.; Borghetti, A. End-of-life Failure Probability Assessment Considering Electric Vehicle Integration. In Proceedings of the 2021 31st Australasian Universities Power Engineering Conference (AUPEC), Perth, Australia, 26–30 September 2021; pp. 1–6. [Google Scholar] [CrossRef]
- Hilshey, A.D.; Hines, P.D.H.; Rezaei, P.; Dowds, J.R. Estimating the Impact of Electric Vehicle Smart Charging on Distribution Transformer Aging. IEEE Trans. Smart Grid 2013, 4, 905–913. [Google Scholar] [CrossRef]
- IEEE C57.91-1995; IEEE Guide for Loading Mineral-Oil-Immersed Transformers. IEEE Power and Energy Society: Piscataway, NJ, USA, 1995.
- Jain, A.; Karimi-Ghartemani, M. Mitigating Adverse Impacts of Increased Electric Vehicle Charging on Distribution Transformers. Energies 2022, 15, 9023. [Google Scholar] [CrossRef]
- Atmaja, T.D.; Amin. Energy Storage System Using Battery and Ultracapacitor on Mobile Charging Station for Electric Vehicle. Energy Procedia 2015, 68, 429–437, ISSN 1876-6102. [Google Scholar] [CrossRef] [Green Version]
- IS 12360; Voltage Bands for Electrical Installations Including Preferred Voltage and Frequency. Bureau of Indian Standards: New Delhi, India, 1998.
- IEC 60038:2009; IEC standard voltages. International Electrotechnical Commission: Geneva, Switzerland, 2009.
- Amitabh, K.; Randheer, S.; Sanjeev, K.K.; Ashutosh, S.; Sajid, M.; Abhishek, S.; Chaitanya, K.; Shyamasis, D.; Pawan, M. Handbook of Electric Vehicle Charging Infrastructure Implementation, Version-1. In Handbook of NITI Aayog, MoP, DST, BEE, and WRI India; NITI Aayog: New Delhi, India, 2021. [Google Scholar]
- Farhoodnea, M.; Mohamed, A.; Shareef, H.; Zayandehroodi, H. Power Quality Impact of Renewable Energy based Generators and Electric Vehicles on Distribution Systems. Procedia Technol. 2013, 11, 11–17. [Google Scholar] [CrossRef] [Green Version]
- Iqbal, S.; Habib, S.; Khan, N.H.; Ali, M.; Aurangzeb, M.; Ahmed, E.M. Electric Vehicles Aggregation for Frequency Control of Microgrid under Various Operation Conditions Using an Optimal Coordinated Strategy. Sustainability 2022, 14, 3108. [Google Scholar] [CrossRef]
- Shahnia, F.; Wolfs, P.; Ghosh, A. Voltage unbalance reduction in low voltage feeders by dynamic switching of residential customers among three phases. IEEE Trans. Smart Grid 2014, 5, 1318–1327. [Google Scholar] [CrossRef] [Green Version]
- Weckx, S.; Driesen, J. Load Balancing With EV Chargers and PV Inverters in Unbalanced Distribution Grids. IEEE Trans. Sustain. Energy 2015, 6, 635–643. [Google Scholar] [CrossRef] [Green Version]
- Traube, J.; Lu, F.; Maksimovic, D.; Mossoba, J.; Kromer, M.; Faill, P.; Katz, S.; Borowy, B.; Nichols, S.; Casey, L. Mitigation of Solar Irradiance Intermittency in Photovoltaic Power Systems with Integrated Electric-Vehicle Charging Functionality. IEEE Trans. Power Electron. 2013, 28, 3058–3067. [Google Scholar] [CrossRef]
- Shao, S.; Zhang, T.; Pipattanasomporn, M.; Rahman, S. Impact of TOU rates on distribution load shapes in a smart grid with PHEV penetration. In Proceedigns of the IEEE PES T&D 2010, New Orleans, LA, USA, 19–22 April 2010; pp. 1–6. [Google Scholar]
- Gao, Y.; Wang, C.; Wang, Z.; Liang, H. Research on time-of-use price applying to electric vehicles charging. In Proceedings of the IEEE PES Innovative Smart Grid Technologies, Tianjin, China, 21–24 May 2012; pp. 1–6. [Google Scholar]
- Dubey, A.; Santoso, S.; Cloud, M.P.; Waclawiak, M. Determining Time-of-Use Schedules for Electric Vehicle Loads: A Practical Perspective. IEEE Power Energy Technol. Syst. J. 2015, 2, 12–20. [Google Scholar] [CrossRef]
- Bessa, R.J.; Matos, M.A. Global against divided optimization for the participation of an EV aggregator in the day-ahead electricity market. Part I Theory Elect. Power Syst. Res. 2013, 95, 309–318. [Google Scholar] [CrossRef] [Green Version]
- Bessa, R.J.; Matos, M.A. Global against divided optimization for the participation of an EV aggregator in the day-ahead electricity market. Part II Numer. Anal. Elect. Power Syst. Res. 2013, 95, 319–329. [Google Scholar] [CrossRef] [Green Version]
- Kristoffersen, T.K.; Capion, K.; Meibom, P. Optimal charging of electric drive vehicles in a market environment. Appl. Energy 2011, 88, 1940–1948. [Google Scholar] [CrossRef]
- Effect of electromobility on the power system and the integration of RES. In METIS Studies European Commission Report; Directorate-General for Energy: Mestreech, The Netherlands, 2018.
- Meng, J.; Mu, Y.; Jia, H.; Wu, J.; Yu, X.; Qu, B. Dynamic frequency response from electric vehicles considering travelling behavior in the Great Britain power system. Appl. Energy 2016, 162, 966–979. [Google Scholar] [CrossRef]
- Han, S.; Sezaki, K. Development of an optimal vehicle-to-grid aggregator for frequency regulation. IEEE Trans. Smart Grid. 2010, 1, 65–72. [Google Scholar] [CrossRef]
- Ibrahim, D. An Overview of Soft Computing. Procedia Comput. Sci. 2016, 102, 34–38. [Google Scholar] [CrossRef] [Green Version]
- George, D.; Sivraj, P. Driving Range Estimation of Electric Vehicles using Deep Learning. In Proceedings of the 2021 Second International Conference on Electronics and Sustainable Communication Systems (ICESC), Coimbatore, India, 4–6 August 2021; pp. 358–365. [Google Scholar] [CrossRef]
- Eagon, M.J.; Kindem, D.K.; Selvam, H.P.; Northrop, W.F. Neural Network-Based Electric Vehicle Range Prediction for Smart Charging Optimization. J. Dyn. Syst. Meas. Control 2021, 144, 011110. [Google Scholar] [CrossRef]
- Topić, J.; Škugor, B.; Deur, J. Neural Network-Based Modeling of Electric Vehicle Energy Demand and All Electric Range. Energies 2019, 12, 1396. [Google Scholar] [CrossRef] [Green Version]
- Maino, C.; Misul, D.; Di Mauro, A.; Spessa, E. A deep neural network based model for the prediction of hybrid electric vehicles carbon dioxide emissions. Energy AI 2021, 5, 100073, ISSN 2666-5468. [Google Scholar] [CrossRef]
- Xu, F.Y.; Tang, R.X.; Xu, S.B.; Fan, Y.L.; Zhou, Y.; Zhang, H.T. Neural network-based photovoltaic generation capacity prediction system with benefit-oriented modification. Energy 2021, 223, 119748. [Google Scholar] [CrossRef]
- de Oliveira, R.A.; Bollen, M.H. Deep learning for power quality. Electr. Power Syst. Res. 2023, 214, 108887. [Google Scholar] [CrossRef]
- Topaloglu, I. Deep learning based a new approach for power quality disturbances classification in power transmission system. J. Electr. Eng. Technol. 2023, 18, 77–88. [Google Scholar] [CrossRef]
- Liu, M.; Chen, Y.; Zhang, Z.; Deng, S. Classification of Power Quality Disturbance Using Segmented and Modified S-Transform and DCNN-MSVM Hybrid Model. IEEE Access 2023, 11, 890–899. [Google Scholar] [CrossRef]
- IEC TR 61000-3-7:2008; Electromagnetic compatibility (EMC)—Part 3-7: Limits—Assessment of emission limits for the connection of fluctuating installations to MV, HV and EHV power systems. International Electrotechnical Commission: Geneva, Switzerland, 2008.
- Pisano, G.; Ruggeri, S.; Soma, G.G.; Falabretti, D.; Grillo, S.; Gulotta, F.; Pilo, F. Impact of Electrical Vehicle Private Charging Stations on the Quality of the Low Voltage Network Supply. IEEE Open Access J. Power Energy 2023, 10, 351–362. [Google Scholar] [CrossRef]
- Vinusha, B.; Kalpana, R.; Kishan, D. Improved Power Quality of Single Phase On-Board Charger with Wide Voltage Conversion Range. In Proceedings of the IEEE IAS Global Conference on Renewable Energy and Hydrogen Technologies (GlobConHT), Male, Maldives, 11–12 March 2023; pp. 1–6. [Google Scholar] [CrossRef]
- Gupta, J.; Kushwaha, R.; Singh, B. Improved Power Quality Charger Based on Bridgeless Canonical Switching Cell Converter for a Light Electric Vehicle. In Proceedings of the IEEE 9th Power India International Conference (PIICON), Sonepat, India, 28 February–1 March 2020; pp. 1–6. [Google Scholar] [CrossRef]
- Vaideeswaran, V.; Veerakumar, S.; Sharmeela, C.; Bharathiraja, M.; Chandrasekaran, P. Modelling of an Electric Vehicle Charging Station with PWM Rectifier to mitigate the Power Quality Issues. In Proceedings of the IEEE Transportation Electrification Conference (ITEC-India), New Delhi, India, 16–19 December 2021; pp. 1–6. [Google Scholar] [CrossRef]
- Bhargav; Sarkar, I. Bhargav; Sarkar, I. Solar Isolated Bi-directional Electric Vehicle Charger with Power Quality Enhancement Features. In Proceedings of the IEEE IAS Global Conference on Renewable Energy and Hydrogen Technologies (GlobConHT), Male, Maldives, 11–12 March 2023; pp. 1–6. [Google Scholar] [CrossRef]
- Arshdeep, S.; Letha, S.S.; Nikhil. Design and Analysis of off-board PV-Grid Adjustable Charger for Electric Vehicle Battery. Int. J. Eng. Adv. Technol. 2020, 9, 1005–1013. [Google Scholar] [CrossRef]
- Hariprabhu, M.; Sarankumar, M.; Sharansharvesh, S.; Sivakumar, S.M.; Sridharani, S. Implementation of PV Integrated Power Quality Enhancement and Performance Analysis of Battery Operated Electric Vehicle using Boost Converter. In Proceedings of the 5th International Conference on Smart Systems and Inventive Technology (ICSSIT), Tirunelveli, India, 23–25 January 2023; pp. 308–314. [Google Scholar] [CrossRef]
- Mousavi Agah, S.M.; Abbasi, A. The impact of charging plug-in hybrid electric vehicles on residential distribution transformers. In Proceedings of the 2nd Iranian Conference on Smart Grids (ICSG), Tehran, Iran, 24–25 May 2012; Volume 25, pp. 371–380. [Google Scholar]
| Disclaimer/Publisher’s Note: The statements, opinions and data contained in all publications are solely those of the individual author(s) and contributor(s) and not of MDPI and/or the editor(s). MDPI and/or the editor(s) disclaim responsibility for any injury to people or property resulting from any ideas, methods, instructions or products referred to in the content. |
© 2023 by the authors. Licensee MDPI, Basel, Switzerland. This article is an open access article distributed under the terms and conditions of the Creative Commons Attribution (CC BY) license (https://creativecommons.org/licenses/by/4.0/).


 ,
, 


