Review

A Review on Solar Energy Policy and Current Status: Top 5 Countries and Kazakhstan

by
Saulesh Minazhova
1,
Ruslan Akhambayev
1,
Timur Shalabayev
2,
Amangeldy Bekbayev
1,
Bolat Kozhageldi
3 and
Manuela Tvaronavičienė
4,5,*
1
Department of Power Engineering, Satbayev University, Almaty 050000, Kazakhstan
2
“Qazaq Green” Association, Astana 010000, Kazakhstan
3
Department of Power Engineering, M.Kh. Dulaty Taraz Regional University, Taraz 080000, Kazakhstan
4
Department of Business Technologies and Entrepreneurship, Vilnius Gediminas Technical University (VILNIUS TECH), LT-10223 Vilnius, Lithuania
5
Institute Humanities & Social Sciences, Daugavpils University, LV-5401 Daugavpils, Latvia
*
Author to whom correspondence should be addressed.
Energies 2023, 16(11), 4370; https://doi.org/10.3390/en16114370
Submission received: 7 May 2023 / Revised: 23 May 2023 / Accepted: 24 May 2023 / Published: 27 May 2023

Abstract

:
The article describes the world’s experience in developing the solar industry. It discusses the mechanisms of state support for developing renewable energy sources in the cases of five countries that are the most successful in this area—China, the United States, Japan, India, and Germany. Furthermore, it contains a brief review of state policy in producing electricity by renewable energy facilities in Kazakhstan. This paper uses statistical information from the International Renewable Energy Agency (IRENA), the International Energy Agency (IEA), British Petroleum (BP), and the Renewable Energy Network (REN21), and peer-reviewed sources. The research methodology includes analytical research and evaluation methods to examine the current state of solar energy policy, its motivators and incentives, as well as the prospects for its development in Kazakhstan and in the world. Research shows that solar energy has a huge development potential worldwide and is sure to take its place in gross electricity production. This paper focuses on the selected economic policies of the top five countries and Kazakhstan, in what may be considered a specific research limitation. Future research suggestions for the expansion of Renewable Energy (RE) in Kazakhstan could include analysing the impact of introducing dedicated policies and incentives for solar systems and exploring the benefits and challenges of implementing large RE zones with government–business collaboration.

1. Introduction

The annual growth in electricity consumption due to the improvement in living standards, the development of technology and industry, and globalisation makes the energy industry one of the most important fields in the world. Considering that many countries are highly dependent on fossil fuels, the issue of climate change and environmental pollution due to emissions of harmful substances into the atmosphere is also acute. To overcome energy supply constraints and reduce emissions, current sustainable development policies should aim to create a more decentralised, balanced, and environmentally friendly energy supply system that will include various types of Renewable Energy Sources (RES) [1].
In 1992, almost all countries of the world and absolutely all major states signed the UN Framework Convention on Climate Change, where the main goal was to stabilise the level of the concentration of greenhouse gases in the atmosphere at a level that would not allow dangerous anthropogenic impact on the planet’s climate system [2]. This document became the foundation for most subsequent international agreements, such as the Kyoto Protocol (2005) and the Paris Agreement (2015). Currently, the Paris Agreement is accepted as a global agreement, which identified three critical goals for sustainable development: to ensure the availability and reliability of modern energy services, to significantly increase the share of RES in the global energy mix, and to double the global rate of improvement in energy efficiency [3]. Therefore, governments worldwide are taking initiatives to solve this problem, encouraging the introduction of Renewable Energy (RE) within the framework of various national programs [4].
After signing the Paris Agreement, the participating countries began to determine their target indicators for increasing the share of RE in the country’s energy balance. These indicators were approved at the legislative level since they could stimulate the deployment of RES as a political tool and also serve as a clear signal to the international community and the market [5]. By 2017, almost all countries have defined their Renewable Energy Targets (RET) [6]. Further, draft laws supporting the introduction and development of RES were gradually developed, initiatives for the transition to a green economy were created, and incentive mechanisms such as Feed-in-Tariffs (FIT), state subsidies, quotas, tax exemptions, auctions, Net Energy Metering (NEM), and portfolio standards were introduced [7].
Kazakhstan did not stand aside and determined its paths to the sustainable development of the energy industry and the formation of “green” energy in the country. To improve the mechanisms for integrating RE facilities into the electrical network of Kazakhstan, in 2009 the Head of State adopted the Law “On Supporting the Use of Renewable Energy” (hereinafter—the Law on RES) [8]. Another significant initiative to support the development of RES in Kazakhstan was the “Concept for the transition of the Republic of Kazakhstan to a green economy until 2050”, adopted in 2013, which provides for the principles of forming a “green economy” in the future [9]. Within the framework of this concept, Kazakhstan outlined its target indicators for increasing the share of RES in total electricity generation from just over 1% to 3% by 2020, up to 30% by 2030, and 50% by 2050.

2. Materials and Methods

Despite the impact of the COVID-19 pandemic on energy industries and markets worldwide [10], RES set a record for new capacity in 2019–2020 and was the only source of electricity production that recorded a net increase in total capacity [11]. According to the IRENA report [12], the total installed capacity of RE facilities in 2019 amounted to 2538.4 GW and 2799.1 GW in 2020. Most installed capacity came from wind and solar energy (Table 1). Based on Agency’s calculations, this is approximately 91% of renewable technologies’ total newly installed capacity, in which solar photovoltaic technologies are leading.
Kursiv Research [13] reports that, in 2019–2020, Kazakhstan also experienced a rapid growth of renewables in the energy industry. During these years, five larges RE facilities were put into operation, four of which are Solar Power Plants (SPPs) with a capacity of 100 MW. Moreover, Kursiv Research ranked the top 15 RE facilities in Kazakhstan, of which the number is dominated by SPPs: 11 out of 15. This trend shows the popularity of Solar Photovoltaic Systems (SPVS) in the country, obviously due to climatic conditions, relatively low costs, and a lack of technical and logistical barriers compared with other renewable sources.
Table 1. Renewable power capacity growth in 2019–2021, GW.
2019Growth2020Growth2021
World RE2538.4+260 (↑ 10%)2799.1+265 (↑ 9.5%)3064
Solar584.7+126 (↑ 21.5%)710.3+133 (↑ 19%)843.1
Wind622.3+111 (↑ 18%)733.3+92 (↑ 12%)825
Hydropower1190.5+20 (↑ 10%)1210.7
Kazakhstan RE1.050+0.585 (↑ 56%)1.635+0.375 (↑ 23%)2.010
Solar0.542+0.370 (↑ 68%)0.912+0.126 (↑ 14%)1.038
Wind0.284+0.202 (↑ 72%)0.486+0.198 (↑ 41%)0.684
Hydropower0.222+0.008 (↑ 4%)0.2300.05 (↑ 22%)0.280
Sources: [12,14,15,16]; Note: (↑)—growth indicator of energy capacity.
According to BP statistics [15], in 2019 solar power generation accounted for 3% of the world’s electricity. It represented the second largest absolute generation growth among all renewable technologies, being slightly behind wind and ahead of hydropower (small HPP). Furthermore, BP reports that, in 2020, solar systems showed another increase in the total share of electricity generation with an additional 20%.
Electricity generation by SPPs in Kazakhstan is also growing from year to year. Thus, according to the Ministry of Energy, in 2020 there was a sharp jump in solar power generation from 0.4 TWh to 1.4 TWh, which means a 200% increase in electricity production by solar technologies (Table 2). This can be explained by the fact that large PV plants were actively put into operation in 2020, the construction of which was slowed down due to the start of the COVID-19 pandemic in 2019.
In the International Energy Agency report [17], the IEA predicted a 60% increase in installed RE capacity by 2026, amounting to more than 4800 GW. According to the report, 1100 GW of capacity will come from solar PV energy, twice as much as in the previous five years. To sum up, the world is expected to see a significant increase in the share of Renewable Energy (RE) in the energy mix, in which half of the production will come from solar photovoltaic systems. Therefore, this paper is an up-to-date overview of the solar industry in Kazakhstan and the world, using the examples of the top five countries. This article presents current initiatives and mechanisms that stimulate the development of RE, analyses the political approach and existing barriers, and discusses development prospects.
The methodology used in this research combines analytical research and evaluation methods to examine the current situation, drivers, and incentives in solar energy policy, as well as future prospects for development in Kazakhstan and around the world. This study draws on data and information gathered from both the peer-reviewed literature and the “gray” literature, which provide an up-to-date analysis of solar energy. To assess the prospects for solar power, this paper compares best practices for implementing solar systems and, based on this analysis, identifies the best and worst pathways. This study of electricity generation in the top five countries assesses the effectiveness of the incentives and mechanisms implemented in the renewable energy sector. This study also emphasizes the need to constantly update and supplement legislation and plans, taking into account technological progress, market structure, international experience, and the current situation in the country.

3. Results

3.1. Current Situation Analysis and Future Provisions of Solar Energy in the World

According to IRENA [18], over the next three decades, the solar industry will develop rapidly, and by 2050 it will become one of the main renewable sources with a share of 25% of all electricity in the world. In terms of installed capacity, the Agency reports that the next decade’s annual growth of solar PV systems will be approximately 450 GW/year and, by 2030, the cumulative installed capacity will reach 5200 GW. Additionally, the Bloomberg agency reveals that, until 2050, the total installed capacity in the world will increase to 14,000 GW (Table 3) [19].
A significant reason for solar energy development is the steady decline of costs over the last decade (Table 4). Only in 2021 did prices for solar modules increase due to the shortage of polysilicon worldwide. Subsequently, in the first half of 2021, the price of solar modules expanded by 18%. In addition, prices have changed because of higher transportation costs. This situation occurred due to restrictive measures during COVID-19, which complicated the export process from China and increased the cost of shipping containers [20]. Nonetheless, the demand for photovoltaic energy remained high; hence, in the second half of 2021, investors participated in auctions and corporate purchases with “new” prices [17].
Despite rising prices for solar PV panels, 133 GW of new capacity was installed globally in 2021. Generation by solar PV facilities worldwide increased by 23% over the last year from 846.2 TWh to 1032.5 TWh [22]. The leaders in terms of production were China, the USA, Japan, India, and Germany [23]. The top five countries accounted for 67.4% of all electricity generated by PV facilities (Figure 1).
According to IEA forecasts, in the future, 80% of the worldwide expansion of solar energy capacity will be in China, Europe, the United States, and India.

3.2. Solar Energy Outlook, Incentives, and Policies of Top Five Countries

3.2.1. China

Currently, China is a giant solar PV manufacturer in the world. China is engaged in producing solar technologies and actively promotes solar energy in its country, as evidenced by its inclusion among the top countries in producing solar energy. In the late XX century, China successfully exported solar panels to developing countries. In 2008. China exported 95% of its solar products [24] but needed to pay more attention to the development of the solar industry within the country. Following the global financial crisis in 2008, the Chinese government was forced to introduce many domestic stimulus measures that benefited struggling Chinese solar companies [25]. As a result, China is now the leader in solar-installed capacity, having installed 205 GW in 2019 and 254 GW in 2020, bringing the cumulative installed capacity to 306 GW in 2021 [26]. According to IEA forecasts, China will maintain its leadership position and, by 2026, will increase its capacity of solar energy by an additional 450 GW. Moreover, the president announced that China plans to double its current capacity by 2030 and achieve net zero emissions before 2060 [17].
China’s solar energy policy has gone through many changes since 1996. In the early stage, it was based more on R&D and subsidy programs such as the Brightness Program (1996) and The Township Electrification Program (2002) [27]. These two programs were formed to electrify Western regions using solar energy systems. Further, in 2009, the Ministry of Finance initiated two more programs—the Roof-top Subsidy Program and the Golden Sun Demonstration Program—to boost China’s solar PV market [28]. In 2011, the National Development and Reform Commission (NDRC) adopted its first FIT mechanism that incentivises the development of solar PV technologies in China. According to the FIT scheme, distributed and utility PV systems are purchased at a fixed price of 1 CNY per kWh for 20 years. In 2013, the FIT was categorised by regions and set at 0.9, 0.95, and 1.00 CNY/kW h for Region I, II, and III, respectively [29]. The FIT mechanism became a driving factor of solar energy deployment among all policy incentives and mechanisms in China such as VAT exemption, financial grants and subsidies, custom duty exemption, and no standard price-setting. With all these policies, China’s solar power capacity increased from 3 GW in 2011 to 306 GW in 2021 [30].

3.2.2. United States

Until the 2000s, solar energy development in the United States (US) was insignificant due to its high cost. Since 2014, with a price drop of 50%, solar energy has become more affordable and prevalent in the United States. In 2021, the US solar power production was 165.4 TW h—33% more than the previous year. Unlike other countries, the US is developing not only solar PV systems but also concentrated Solar–Thermal Plants (CSP). Solar PV systems’ capacity in the US accounts for 97.2 GW in 2021, 1.8 GW of which is CSP [31]. According to the Energy Information Administration (EIA), in 2022 the capacity of solar PV systems is estimated to add 22 GW [32]. Furthermore, IEA forecasts the growth of solar PV capacity by 75% over the next five years [17]. Furthermore, the US government plans to increase solar power generation to 14% by 2035 and 20% by 2050, reaching the net zero emission target in the same year [33].
Solar energy is one of the fastest-growing sources of new-generation electricity in the US. For this reason, the US government has focused on incentives and mechanisms towards solar energy deployment. Unlike other countries, in the United States, RE policies are driven by local, state, and federal entities. Initially, the Energy Policy Act passed in 2005 by the Department of Energy (DOE) provided renewable source tax exemptions [34]. Under this Act, federal entities formed an Investment Tax Credit (ITC) law that created a tax credit up to 30% for commercial and residential systems [35]. Regarding local entities, a net-metering law was adopted in 43 states, under which consumers generated electricity and reduced their bills [36]. Additionally, clean energy funds, FITs, auctions, Solar Renewable Energy Certificates (SRECs), and low-interest loans were established to encourage solar energy growth. All these incentives and mechanisms positively influenced the solar industry in the United States.
The first solar PV panel production started in Ohio in 2000, with an annual production capacity of 100 MW [37]. In 2014, America put into operation the largest CSP plant in the world, with an installed capacity of 392 MW. The number of solar installations in America reached 1 million in 2016. Recently, the US government has been trying to diversify solar technologies to achieve its ambitious goals for the transition to clean energy.
The Inflation Reduction Act, the most substantial step Congress has ever taken on renewable energy and climate change, was signed into law on 16 August 2022 [38]. The Inflation Reduction Act is firmly focused on improving America and achieving President Biden’s goal of ensuring that the country, driven by American workers, continues to lead the world in clean energy technology, manufacturing, and innovation. The $370 billion in investments made possible by the Inflation Reduction Act will lower energy costs for individuals and small businesses, speed up private investment in clean energy solutions across the board, strengthen supply chains for everything from essential minerals to energy-efficient appliances, and generate new and well-paying employment opportunities [38].

3.2.3. Japan

For Japan, developing solar energy and RE, in general, is a big challenge and a chance to increase the country’s energy self-sufficiency. Due to the lack of conventional energy resources (coal, oil, gas), Japan is dependent on carbon-intensive fossil fuel imports. In addition, after the Fukushima accident, Japan struggled with nuclear power and tried to minimise its dependence on it. Therefore, the large-scale deployment of RE in Japan is the best solution for the country’s energy security.
Over the past decade, Japan has increased the installed solar energy capacity from 4 GW to 74 GW [39]. In terms of solar energy generation, Japan’s total generated solar energy reached 130 TWh in 2021. Considering the insignificance of its territory compared with China, India, and the United States, the Japanese government also put efforts into developing floating solar plants. As a result, the all-round development of solar systems in Japan has made it the world’s third largest producer of solar energy. According to [39], the annual generation of PV energy was estimated to increase on average by 1.7% in 2030, 3.9% in 2050, and 4.9% in 2070 due to climate change.
To quickly deploy solar technologies, the Japanese government has applied several policy measures, such as subsidising the construction of SPPs, the use of solar energy in total electricity production, the purchase of electricity from solar sources at a fixed rate (2012), and the introduction of auction systems for trading SPPs (2017). Recently, Japan’s Ministry of Economy, Trade and Industry (METI) has been bidding 0.010 $/kWh for roof-top PVs and 0.087 $/kWh for solar energy auctions, which is considered insufficient due to the increase in prices for solar technologies [40].

3.2.4. India

India has tremendous potential for harnessing solar energy. The average solar radiation incident in India varies from 4 kWh/day to 7 kWh/day and initiates a solar energy of about 5 × 10¹⁸ Wh/year [41]. Since 2011, India’s solar energy capacity has grown from 0.6 GW to 49.3 GW in 2021 [42]. Its annual growth of solar energy production was 5.2% and reached 68 TWh in 2021. India is estimated to add 121 GW of renewables between 2021 and 2026, of which 74% of the shares belong to solar technologies, while 16% will be wind [17]. Due to the country’s large-scale deployment of solar energy, India has become competitive and is ranked fourth in the world in solar energy generation. According to the National Solar Mission (2015), the government of India revised its target from 20 GW by 2022 to 100 GW by 2022. It has set an ambitious solar energy target of 280–300 GW by 2030, with net zero emissions by 2070 [43].
Despite the great potential of solar radiation, solar energy needed some policy measures to initiate its deployment. Therefore, the government of India adopted several laws, such as the Electricity Act (2003), the National Electricity Policy (2005), and the National Tariff Policy (2006), that are fundamental to the development of RE in the country [44]. Moreover, in 2003–2014, the Solar Home System (SHS) Program was launched to electrify off-grid rural homeowners. In 2010, the National Solar Mission was formed, which aimed to meet 100 GW by 2022. Additionally, incentives and mechanisms were implemented to stimulate the solar energy sector in India: more accessible land acquisition, FIT, auction bidding, special grants, and free transmission infrastructure [45].

3.2.5. Germany

According to BP statistics, Germany ranks fifth in solar power generation in the world. The growth dynamics of electricity production from solar energy in Germany over the past decade show a remarkable rate, rising from 12 TWh (2010) to 50 TWh (2021) [15]. Despite the positive growth of solar energy production, in 2021 the total share of renewables in the net electricity generation fell by 4.3% compared with the previous year. This situation developed due to climatic conditions that have affected the generation of wind turbines (−12%), but not solar panels [46].
According to the Fraunhofer ISE, by the end of 2021, solar power added 4.9 GW of capacity, increasing the total installed capacity to 58.6 GW [47]. Moreover, IEA forecasts that the share of solar energy in the total RE of Germany is expected to increase from 22% to 36% during 2021–2026 [17]. Despite promising statistics for the development of solar systems in the country, Germany is still dependent on fossil fuels, mainly brown coal. Nonetheless, the share of renewable sources is growing annually, as Germany has set demanding goals to reduce Greenhouse Gas (GHG) emissions by 55% by 2030 and by 80–95% by 2050 [48].
The development of energy policies in Germany began with the adoption of the Electricity Feed Law in 1990 and the Renewable Energy Law (orig.—EEG) in 2000 [49]. EEG is considered a key mechanism for the widespread use of RES in Germany. Initially, it was driven by guaranteed, long-term FITs for renewable sources but then, in 2014–2017, it was replaced by a competitive auction system. Another important document in the energy policy of Germany is the Climate Action Plan 2050, first entered in 2016 [50]. Under this climate policy, Germany set an ambitious target to achieve carbon neutrality by 2050.
Two of these key energy policies are undergoing preparations for reform in connection with the Russian–Ukrainian war. According to the German Chancellor, Germany needs a rapid transition to 100% renewable sources to achieve independence from fossil fuel imports. In this regard, on May 2022 the Economy and Climate Ministry (orig.—BMWK) published its work plan for reforms regarding solar energy, which includes revising FITs for solar installations, classifying owners into generating and partly consuming, increasing auction capacities for solar systems, and dividing subsidies equally between roof-top and utility-scale PVs [51].

3.3. Solar Energy Potential and Solar System Policies of Kazakhstan

Kazakhstan, the heart of the Eurasian continent, has a vast territory of 2.7 million km2 with a population density of 7 people/km2. Most of the territory is occupied by steppes and deserts, suitable for developing solar and wind energy in the country. The annual potential of solar energy is estimated at 0.25 × 10⁹ Wh [52]. It experiences 2200–3000 h of sunlight per year, which provides a sizeable solar insolation of 1300–1800 kW/m2/year throughout the country (Figure 2). Notably, due to its geographical features, the southern parts of Kazakhstan have a higher intensity of solar light than others.
Therefore, most of all integrated solar plants are located in this country. Based on the National Energy Report (2021) [53], 45 SPPs are in operation in this country, half of which are placed in the southern regions (Figure 3).
According to the Ministry of Energy, for the first half of 2022, SPPs generated 0.854 TWh [54] and accounted for 1.2% of gross electricity generation (Figure 4).
As mentioned above, Kazakhstan began its pathway towards integrating RES with the Law on RES, adopted in 2009. Further, the “Kazakhstan-2050” Strategy improved the development of RE in the country [55]. This strategy became an operational plan for all levels of government, the purpose of which is to become one of the 30 most developed economies in the world by 2050 [56]. Based on the Strategy-2050 of May 2013, the government formed “the Concept for the transition to a green economy” based on energy efficiency and innovative technologies for sustainable growth [9].
Between 2013–2017, the Law on RES was revised and amended with the following steps [8,57]:
-
In 2013, a Settlement and Financial Centre (RFC) was created under TSO, which undertook to purchase all generated electricity from RE facilities at a fixed rate for 15 years. Such a change in the law guaranteed investors payback for the project. Furthermore, TSO undertook to connect RE facilities to its transmission networks.
-
In 2016, RE projects were included in an “investment projects” list and therefore were exempt from VAT and customs duties.
-
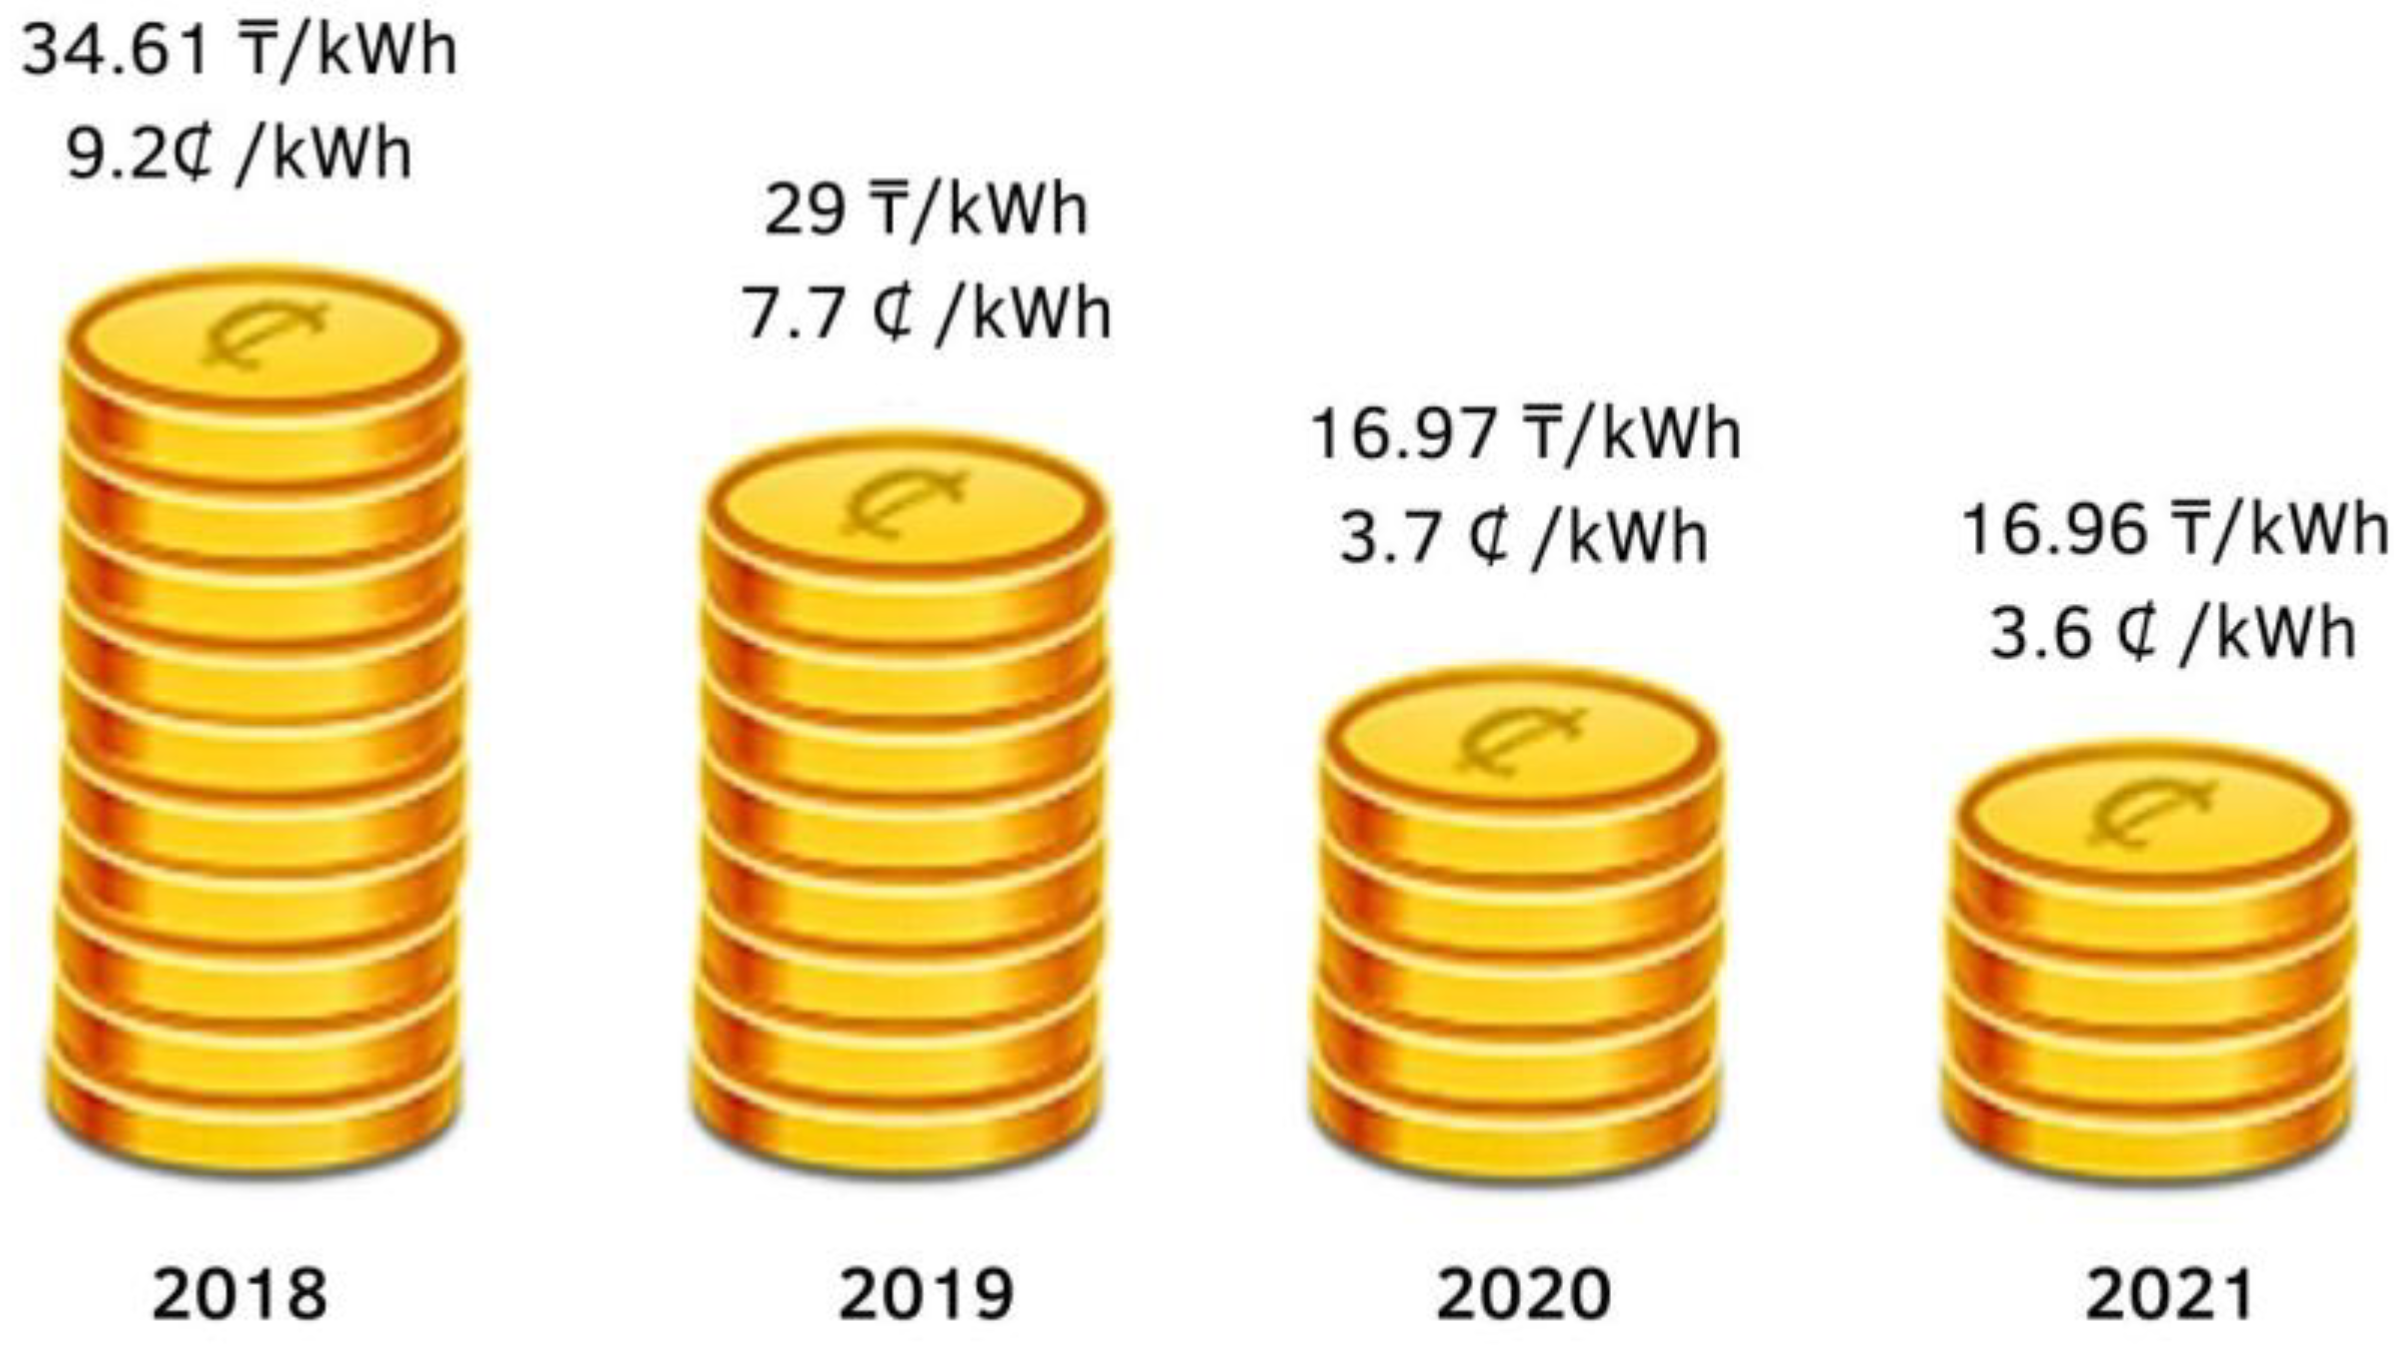
In 2017, an auction mechanism for RE facilities was adopted. However, the first auction was held a year later, in 2018, and replaced fixed tariffs. This mechanism was introduced to increase the investment attractiveness of RES projects. The dynamics of changes in auction tariffs for SPP projects are shown in Figure 5.
-
In 2019, a “project auction” was introduced. This mechanism differed from previous auctions in that, before the start of the auction, the investor is provided with information on the technical conditions for connecting the facility and on the commercial efficiency of the project, as well as data on the allocated site. This approach was designed to eliminate hidden risks and reduce the tariff.
-
In 2020, RES projects were included in a “priority investment projects” list. According to which, RES facilities became exempt from taxes on land and property. Moreover, the guaranteed purchase of electricity was increased to 20 years (Figure 5).
Figure 5. Dynamics of marginal auction prices for SPP projects in 2018–2021. Source: Ministry of Energy.
Energies 16 04370 g005
Since 2018, the United Nations Development Programme (UNDP) in Kazakhstan, together with the Ministry of Energy of Kazakhstan, is implementing a project to reduce the risks of investing in renewable energy sources with the financial support of the Global Environment Facility. This is a joint initiative that aims to support the government in developing and amending the country’s legislation on RES, as well as the introduction of pilot mechanisms for SMEs interested in using RES technologies.
The main improvement of the investment system was a new innovative mechanism for RES—an auction with ready-made documentation (project auction). The key point of the proposed practice was that, prior to the auction, the potential investor is provided with data on the main parameters of the project in a package of pre-project documentation:
-
Information about the specific site of the project;
-
Points, technical conditions for its connection to the energy system;
-
An enlarged estimate of the cost of constructing a RES power plant/calculation of the commercial efficiency of the project.
This allowed bidders to calculate their capabilities, exclude “hidden” risks, and offer even lower tariffs during bidding. Currently, Kazakhstan has 134 operating objects of RES, with a total capacity of 2010 MW (WES-684 MW; SPP-1038 MW; HPP-180 MW; BioES-8 MW). By the end of 2021, power generation by RES facilities was about 4.2 × 10⁹ Wh. The share of RES-generated electricity in the total volume of electricity production is 4% [54].
The United Nations Development Program in Kazakhstan presented an effective model for financing energy-efficient modernization in pilot apartment buildings. Five apartment buildings located between Pushkin and Zhubanov Streets in Astana, which were built back in 1964, were selected for the pilot project. The basis of the multi-apartment housing stock of the Republic of Kazakhstan are buildings built in 1960–1990. An important aspect of the sustainable development of the city remains the support, rehabilitation, and reconstruction of the old housing stock. This sector is the third largest consumer of heat and electricity after the energy and manufacturing sectors, consuming about 11 percent of the electricity and 40 percent of the heat supplied.
More than half of greenhouse gas emissions in the residential heat and power sector in Kazakhstan come from space heating. According to expert estimates, about 60,000 apartment buildings have thermal characteristics that do not meet modern requirements and require energy-efficient modernization. In the course of modernization, measures such as insulating house walls and interpanel joints, restoring gutters and downspouts, and replacing entrance doors and balcony structures were carried out. LED lighting was completely replaced in the entrances, the heating system and the hot- and cold-water supply were modernized, pipelines were replaced, and automatic heating substations were installed. The model was financed from several sources, including the funds of apartment owners.
A similar mechanism of co-financing measures to improve the energy efficiency of apartment buildings was tested in Temirtau. A number of activities were carried out: the insulation of roofing, joints, and basement ceilings, the replacement of windows and entrances, the installation of an Automated Heat Substation (AHS), balancing, pipe insulation, the replacement of light fixtures. Part of the measures were implemented by engaging companies that invested in modernization (ATP, lighting), and the apartment owners’ investments were reimbursed through savings under the energy service contract model [54].
To date, the Ministry of Energy has developed “the Energy Balance of the Republic of Kazakhstan until 2035”, which compromises an increase in flexible capacities, the number of RES, and the development of energy systems in neighbouring countries [58]. According to the analysis, electricity consumption in the country will grow to 15.29 × 109 Wh by 2035, and the average annual growth in electricity consumption will increase by 2.7% between 2021–2035. To cover the needs of the economy and the population, it will be necessary to commission 17.5 GW of new generation by 2035 [47].
According to IRENA’s projection of the transformational scenario for the fuel and energy complex, wind power will be the main source of electricity generation, providing more than one-third of total electricity demand globally by 2050. This will be followed by solar photovoltaic systems providing 25 percent of total electricity demand, leading to more than a 10-fold increase in solar PVs’ share of the generation mix by 2050 compared with 2017 levels. In the context of total installed capacity, a much larger capacity expansion will be required for solar PV plants (8519 GW) compared with wind plants (6044 GW) by 2050. Experts expect the rate of growth in the commissioning of new RES capacity to remain high. Solar PV development will continue to break records, with annual growth projected at 162 GW by 2022, nearly 50% higher than before the 2019 pandemic [21].

4. Discussion

In analysing the international experience in pursuing a policy to promote RE—and solar energy in particular—it is necessary to single out the most effective mechanisms: FIT, net-metering, and auction bidding. These mechanisms are widely used, as they positively impact the investment attractiveness of RE projects. However, some experts believe that they may have a negative impact on stakeholders and the grid [59]. For example, in Germany, with the introduction of FITs for solar PV, the number of installed solar facilities has increased significantly and rapidly. As a result, this has led to an oversupply of solar PVs and, subsequently, unreliable electric systems. Therefore, fixed tariffs in Germany have undergone several adjustments over the past decade and have been reduced several times.
The same problem occurred in China. The introduction of FIT mechanisms has led to the rapid deployment of the domestic PV market; thus, the FIT policy needed to be updated. Unlike Germany, China has divided fixed tariffs into levels depending on the region [60]. Due to the vast territory, transferring electricity from solar stations in the west to consumers in the central and eastern areas was difficult. Subsequently, the value of fixed tariffs was revised to consider solar radiation, and the development and attractiveness of the region for investors. Like other countries, Kazakhstan also implemented FIT mechanisms for the broad penetration of solar facilities. However, in Kazakhstan, there was no mass connection of small-scale solar PVs, due to consumers’ disinterest and the legislative framework’s underdevelopment. Nevertheless, utility-scale solar systems have become widespread through FIT mechanisms.
The net-metering mechanism has become widely used in America, along with guaranteed tariffs for RE. This type of mechanism has become popular in the residential sector, as the consumer can sell surplus produced energy to the grid [61]. According to statista.com, in 2020, the number of photovoltaic net-metering customers was over 2 million [62]. In Japan, on the contrary, NEM for the residential sector has been cancelled since 2012, and all surplus electricity is purchased at a fixed price for 10 years as a subsidy for installing PV panels [63]. In India, the net-metering mechanism was only introduced in 2021, for prosumers with loads up to 500 kW [64]. This mechanism aims to develop the roof-top segment to achieve its ambitious goals of 40 GW by 2022.
In Kazakhstan, the NEM mechanism has yet to find wide application among households due to the lack of a specially designed program. In addition, the price and quality of “traditional” electricity from the network are entirely satisfactory for most country residents. Although, given the vast territoriality of Kazakhstan, this type of mechanism would have a good effect on consumers in remote and hard-to-reach places, who could produce energy for their own needs and immediately consume it, without losses in the networks. Additionally, these consumers could transfer excess generated energy to the grid and participate in the electricity market. The auction mechanism has become popular due to its investment attractiveness. This mechanism is used in all developed countries, as it is incredibly transparent and economically attractive for investors [65].
In the studies of S. K. Kar et al., the solar energy potential of India, its market developments, capacity additions, actual production, and the economics of solar energy were reviewed [66]. Based on G. Adwek et al., Kenya has a huge potential for solar energy that needs to be used properly [67]. In this study, the authors focused on opportunities to develop solar electrification in Kenya, the existing barriers, government policies, and future perspectives on solar energy. The authors concluded that for the large-scale deployment of solar energy in the country, a strict adherence to existing policies was needed, as well as the reform of energy subsidies, tax exemptions, and the implementation of a NEM system. Another African country was reviewed in the scope of solar energy development. Researchers from Ghana studied the current situation of solar energy and the existing energy policy that can affect the deployment of the solar power industry in the country [68]. Moreover, in this work, the Low Emissions Analysis Platform (LEAP) model was used to predict energy demand using historical data from 2000 to 2018. In Waldau’s study, the rapid increase in SPVS in the world was considered, as well as the factors affecting this increase [69]. The research was carried out for the European Union and included studies on the solar PV market. It was concluded that future policies and regulations in the field of SPVS should be implemented considering the high costs of household PV systems. A decade of solar energy development in ASEAN countries was examined in [70]. This work investigated the solar policy and support mechanisms for each ASEAN country. As a result, the authors gave policy recommendations depending on different stages of the country’s level. The World Bank [71] undertook a huge and important work in the field of solar power potential. Considering each country’s location, solar radiation, and climatic conditions, the Bank prepared a report that consists of potential solar power factsheets for 210 countries.
A. Aszodi et al. presented a model of electric supply using Energy Scenarios Simulation Tools (ESST) for 19 European countries [72]. As initial data, the authors used hourly resolution schedules from the ENTSO-E database and the energy strategy documents of each country. In this wide range of research, authors compared the possibility of the power plant portfolios of the individual countries to cover the electricity needs to be foreseen by their national energy strategies. Comparative analysis was carried out for all energy sources, including SPPs. S. Kok investigated the solar energy policy for two large solar energy-producing countries—China and India [73]. This work studied solar policy, particularly the solar energy auction. The author concludes that the demand and consumption of electricity is increasing in both countries. Even if they are fossil-fuel-based, they actively promote RES and low-carbon technologies. Among all types of renewable sources, solar energy is a fundamental strategy for sustainable energy supply in these two countries. However, according to the author, these two countries have some distinctive features. Comparing the solar energy policies of the two countries, it turned out that China is predominantly stronger than India in general terms of politics. In contrast, in individual politics, China is inferior to India, namely in the developing of solar energy auctions. This situation is because India has paid great attention to previous RE sector experience and the sustainability of the policies when developing the solar energy auction policy.
This paper focuses on the selected economic policies of the top five countries and Kazakhstan, in what may be considered a specific research limitation. It must be noted that the transition to renewable energy sources and a more circular economy is under discussion worldwide, e.g., [74,75,76,77,78]. The factors that facilitate this transition and hinder it are complex, and economic policy, despite being very important, is just one of many driving forces.

5. Conclusions

According to the research, the solar energy industry has great potential to develop worldwide and will take its place in gross electricity production. World experience in the development of the solar industry shows that the introduction of measures, incentives, and the use of RE directly affects its deployment. Based on the volumes of electricity generated by the solar systems of the top five countries, it is obvious that all the incentives and mechanisms introduced in the field of RE were effective. In addition, RE policy analysis shows that legislative acts and plans were constantly updated and supplemented depending on technology progress, market structure, international experience, and the current situation in the country.
Therefore, considering the above, some recommendations for the further expansion of RE in Kazakhstan to achieve the goals set by 2030–2050 have been prepared. Since there is no separate policy for solar systems in Kazakhstan, the following recommendations for the development of the RE as a whole, which includes solar energy as well, are given. The issue of balancing the national electricity market is one of the most relevant. For 13 years now, the balancing market of Kazakhstan has been operating in a simulation mode, which is why there is no real financial responsibility for imbalances in the network. As a result, market participants did not take proper measures to prevent or mitigate the imbalances they produced. Moreover, overlapped imbalances worsen the situation in the energy system. Subsequently, there are large overflows on the border with Russia that cause overpays and strains relations with the National Electrical Grid of the Russian Federation.
It is necessary to develop large RES zones with favourable potential and an easy access to networks to combine government and business efforts to decarbonise the energy sector. Large RE capacities can be placed in such zones using various technologies (solar energy, wind energy, etc.). For developing such zones, using the PPP principle, the government should connect all the necessary communications (roads, networks, water supply, etc.). The selection of investors in such zones is carried out according to the auction mechanism. Undoubtedly, these zones will become the point of attraction for significant foreign investments from the world giants of the sector, which will be able to offer advanced technologies and competitive tariffs.

Author Contributions

Conceptualization, S.M., R.A. and T.S.; methodology, A.B., B.K. and M.T.; software, S.M.; validation, A.B. and T.S.; formal analysis, R.A., A.B. and B.K.; resources, M.T., S.M. and R.A.; writing—review and editing, S.M., T.S., R.A., A.B., B.K. and M.T.; visualization, S.M., M.T., T.S. and B.K. All authors have read and agreed to the published version of the manuscript.

Funding

This research received no external funding.

Data Availability Statement

The data that support the findings of this study are available on request from the corresponding author.

Conflicts of Interest

The authors declare no conflict of interest.

Abbreviations

AcronymDesignation
RERenewable Energy
IRENAInternational Renewable Energy Agency
IEAInternational Energy Agency
BPBritish Petroleum
RESRenewable Energy Sources
FITFeed-in-Tariffs
RETRenewable Energy Targets
NEMNet Energy Metering
SPPsSolar Power Plants
SPVSPopularity of Solar Photovoltaic Systems
PVPhotovoltaic
RERenewable Energy
DOEDepartment of Energy
ITCInvestment Tax Credit
SRECsSolar Renewable Energy Certificates
MWMegawatt
GWGigawatt
TWhTerawatt-hour
NDRCNational Development and Reform Commission
kWhKilowatt-hour
CSPSolar–Thermal Plants
METIMinistry of Economy, Trade and Industry
SHSSolar Home System
GHGGreenhouse Gas
RFCSettlement and Financial Centre
LEAPLow Emissions Analysis Platform
UNDPUnited Nations Development Programme
AHSAutomated Heat Substation

References

  1. Kozhageldi, B.Z.; Tulenbayev, Z.S.; Orynbayev, S.; Kuttybaev, G.; Abdlakhatova, N.; Minazhova, S. Development of integrated solutions for the decentralisation of electricity supply to power-hungry regions. Electr. J. 2022, 35, 107108. [Google Scholar] [CrossRef]
  2. Framework Convention on Climate Change. 1992. Available online: https://unfccc.int/files/essential_background/background_publications_htmlpdf/application/pdf/conveng.pdf (accessed on 13 October 2022).
  3. United Nations Department of Economic and Social Affairs. Sustainable Development Goal 7: Ensure Access to Affordable, Reliable, Sustainable and Modern Energy for All. 2017. Available online: https://sustainabledevelopment.un.org/sdg7 (accessed on 13 October 2022).
  4. IEA. Southeast Asia Energy Outlook. 2019. Available online: https://www.iea.org/reports/southeast-asia-energy-outlook-2019 (accessed on 13 October 2022).
  5. International Renewable Energy Agency. Renewable Energy Target Setting. 2015. Available online: https://www.irena.org/publications/2015/Jun/Renewable-Energy-Target-Setting (accessed on 13 October 2022).
  6. Renewables 2018 Global Status Report. REN21 2018. Available online: https://www.ren21.net/wp-content/uploads/2019/05/GSR2018_Full-Report_English.pdf (accessed on 13 October 2022).
  7. Solangi, K.H.; Islam, M.R.; Saidur, R.; Rahim, N.A.; Fayaz, H. A review on global solar energy policy. Renew. Sustain. Energy Rev. 2011, 15, 2149–2163. [Google Scholar] [CrossRef]
  8. The Law of the Republic of Kazakhstan Dated 4 July 2009 No. 165-IV on Support of the Use of Renewable Energy Sources. 2022. Available online: https://adilet.zan.kz/eng/docs/Z090000165 (accessed on 13 October 2022).
  9. Decree of the President of the Republic of Kazakhstan No. 577 “On the Concept for the Transition of the Republic of Kazakhstan to a “Green Economy””. 2019. Available online: https://adilet.zan.kz/rus/docs/U1300000577 (accessed on 13 October 2022).
  10. Anderson, R.M.; Heesterbeek, H.; Klinkenberg, D.; Hollingsworth, T.D. How will country-based mitigation measures influence the course of the COVID-19 epidemic? Lancet 2020, 395, 931–934. [Google Scholar] [CrossRef] [PubMed]
  11. Renewables 2021 Global Status Report. REN21 2021. Available online: https://www.ren21.net/wp-content/uploads/2019/05/GSR2021_Full_Report.pdf (accessed on 13 October 2022).
  12. International Renewable Energy Agency. Renewable Capacity Statistics. 2021. Available online: https://www.irena.org//media/Files/IRENA/Agency/Publication/2021/Apr/IRENA_RE_Capacity_Statistics_2021.pdf (accessed on 13 October 2022).
  13. Mashaev, A. 2021 Should Be Considered a Breakthrough Year for Renewable Energy. 2021. Available online: https://kz.kursiv.media/2021-09-10/kursiv-research-2021-god-sleduet-schitat-proryvnym-dlya-vie/ (accessed on 13 October 2022).
  14. International Renewable Energy Agency. Renewables Take Lion’s Share of Global Power Additions in 2021. 2022. Available online: https://www.irena.org/news/pressreleases/2022/Apr/Renewables-Take-Lions-Share-of-Global-Power-Additions-in-2021 (accessed on 13 October 2022).
  15. BP. BP Statistical Review of World Energy; BP Publishing: London, UK, 2022. [Google Scholar]
  16. Ministry of Energy of the Republic of Kazakhstan. Development of Renewable Energy Sources. 2022. Available online: https://www.gov.kz/memleket/entities/energo/activities/4910?lang=en (accessed on 13 October 2022).
  17. International Energy Agency. Renewables 2021: Analysis and Forecast to 2026. 2021. Available online: https://iea.blob.core.windows.net/assets/5ae32253-7409-4f9a-a91d-1493ffb9777a/Renewables2021-Analysisandforecastto2026.pdf (accessed on 13 October 2022).
  18. International Renewable Energy Agency. Future of Solar Photovoltaic. 2019. Available online: https://www.irena.org/-/media/Files/IRENA/Agency/Publication/2019/Nov/IRENA_Future_of_Solar_PV_2019.pdf (accessed on 13 October 2022).
  19. Solar May Generate Half of World’s Power by 2050, Trina CEO Says. 2022. Available online: https://www.bloomberg.com/news/articles/2022-04-20/solar-energy-may-generate-half-of-world-s-power-by-2050?leadSource=uverify%20wall (accessed on 13 October 2022).
  20. International Energy Agency. 2021. Renewables 2022. Available online: https://www.ren21.net/wp-content/uploads/2019/05/GSR2022_Full_Report.pdf (accessed on 13 October 2022).
  21. IRENA. Renewable Power Generation Costs in 2020. 2021. Available online: https://www.irena.org/-/media/Files/IRENA/Agency/Publication/2021/Jun/IRENA_Power_Generation_Costs_2020.pdf (accessed on 13 October 2022).
  22. Progress towards Clean Power Targets Germany 2000–2040. Available online: https://ember-climate.org/countries-and-regions/countries/germany/ (accessed on 13 October 2022).
  23. Solar Power by Country. 2022. Available online: https://worldpopulationreview.com/country-rankings/solar-power-by-country (accessed on 15 April 2023).
  24. Liu, J.; Goldstein, D. Understanding China’s renewable energy technology exports. Energy Pol. 2013, 52, 417–428. [Google Scholar] [CrossRef]
  25. Jackson, M.M.; Lewis, J.I.; Zhang, X. A green expansion: China’s role in the global deployment and transfer of solar photovoltaic technology. Energy Sustain. Dev. 2021, 60, 90–101. [Google Scholar] [CrossRef]
  26. Cumulative Installed Solar Power Capacity in China from 2012 to 2021. Available online: https://www.statista.com/statistics/279504/cumulative-installed-capacity-of-solar-power-in-china/#:~:text=As%20of%202021%2C%20China%20has,to%20306.56%20gigawatts%20in%202021 (accessed on 15 April 2023).
  27. Ren, F.-R.; Tian, Z.; Liu, J.; Shen, Y. Analysis of CO2 emission reduction contribution and efficiency of China’s solar photovoltaic industry: Based on Input-output perspective. Energy 2020, 199, 117493. [Google Scholar] [CrossRef]
  28. A National Laboratory of the U. S. Department of Energy. Renewable Energy in China. 2004. Available online: https://www.nrel.gov/docs/fy04osti/36045.pdf (accessed on 15 April 2023).
  29. Zhang, S.; He, Y. Analysis on the development and policy of solar PV power in China. Ren. Sust. Ener. Rev. 2013, 21, 393–401. [Google Scholar] [CrossRef]
  30. Zhang, S. Analysis of DSPV (distributed solar PV) power policy in China. Energy 2016, 98, 92–100. [Google Scholar] [CrossRef]
  31. Solar Energy Technologies Office. Solar Energy in the United States. 2022. Available online: https://www.energy.gov/eere/solar/solar-energy-united-states (accessed on 15 April 2023).
  32. U.S. Energy Information Administration. Preliminary Monthly Electric Generator Inventory, October 2021. Available online: https://www.eia.gov/electricity/data/eia860m/ (accessed on 15 April 2023).
  33. The United States Department of State. The Long-Term Strategy of the United States: Pathways to Net-Zero Greenhouse Gas Emissions by 2050; White House: Washington, DC, USA, 2021.
  34. Energy Policy Act of 2005. 2005. Available online: https://www.congress.gov/109/plaws/publ58/PLAW-109publ58.pdf (accessed on 15 April 2023).
  35. Stokes, L.C.; Breetz, H.L. Politics in the U.S. energy transition: Case studies of solar, wind, biofuels and electric vehicles policy. Energy Pol. 2018, 113, 76–86. [Google Scholar] [CrossRef]
  36. Smith, K.M.; Koski, C.; Siddiki, S. Regulating net metering in the United States: A landscape overview of states’ net metering policies and outcomes. Electr. J. 2021, 34, 106901. [Google Scholar] [CrossRef]
  37. Solar Achievements Timeline. 2023. Available online: https://www.energy.gov/eere/solar/timeline/solar-achievements-timeline (accessed on 15 April 2023).
  38. Inflation Reduction Act. 2022. Available online: https://www.whitehouse.gov/cleanenergy/inflation-reduction-act-guidebook/ (accessed on 15 April 2023).
  39. Henmi, K.; Hirano, M.; Hironaka, S.; Kato, O.; Kawano, J.; Kuboki, M. The Electric Power Industry in Japan; JEPIC: Tokyo, Japan, 2020. [Google Scholar]
  40. Bellini, E. Japan Unveils 2022 Feed-In Tariff Levels for PV. 2022. Available online: https://www.pv-magazine.com/2022/02/24/japan-unveils-2022-feed-in-tariff-levels-for-pv/ (accessed on 15 April 2023).
  41. Sheoran, M.; Kumar, P.; Sharma, S.; Bukya, M. Current Situation Analysis of Solar PV Waste Management in India. Mater. Today Proc. 2022, 58, 773–782. [Google Scholar] [CrossRef]
  42. Sahoo, S. Renewable and sustainable energy reviews solar photovoltaic energy progress in India: A review. Renew. Sustain. Energy Rev. 2016, 59, 927–939. [Google Scholar] [CrossRef]
  43. Shiradkar, N.; Arya, R.; Chaubal, A.; Deshmukh, K.; Ghosh, P.; Kottanthrarayil, A.; Kumar, S.; Vasi, J. Recent developments in solar manufacturing in India. Sol. Comp. 2022, 1, 10009. [Google Scholar] [CrossRef]
  44. Badhotiya, G.; Sharma, V.; Singh, D.; Dobriyal, R. Identification of key determinants of solar power system adoption in India. Mater. Today Proc. 2021, 46, 10449–10453. [Google Scholar] [CrossRef]
  45. Chowdhury, D. Renewable Energy Regulations in India. 2021. Available online: https://law.asia/renewable-energy-regulations-india/#:~:text=At%20present%2C%20there%20is%20no,trading%20and%20use%20of%20electricity (accessed on 15 April 2023).
  46. Federal Ministry for the Environment, Nature Conservation, Bulding and Nuclear Safety of Germany. Development of Renewable Energy Sources in Germany in the Year 2021. 2022. Available online: https://www.erneuerbare-energien.de/EE/Redaktion/DE/Downloads/development-of-renewable-energy-sources-in-germany-2020.pdf?__blob=publicationFile&v=29 (accessed on 15 April 2023).
  47. Burger, B.; Hanisch, C. Public Net Electricity Generation in Germany in 2021: Renewables Weaker Due to Weather. 2022. Available online: https://www.ise.fraunhofer.de/en/press-media/news/2022/public-net-electricity-in-germany-in-2021-renewables-weaker-due-to-weather.html (accessed on 15 April 2023).
  48. International Trade Administration. Energy Resource Guide. 2021. Available online: https://www.trade.gov/energy-resource-guide-germany-renewable-energy#:~:text=In%202019%2C%2046%25%20of%20the,the%20remainder%20stemming%20from%20hydropower (accessed on 15 April 2023).
  49. Renewable Energy Source Act. Revised in 2017. 2017. Available online: https://www.bmwk.de/Redaktion/EN/Downloads/renewable-energy-sources-act-2017.pdf?__blob=publicationFile&v=3 (accessed on 15 April 2023).
  50. Federal Ministry for the Environment, Nature Conservation, Bulding and Nuclear Safety of Germany. Climate Change Action Plan 2050. 2016. Available online: https://www.bmuv.de/fileadmin/Daten_BMU/Pools/Broschueren/klimaschutzplan_2050_en_bf.pdf (accessed on 15 April 2023).
  51. Appunn, K.; Wettengel, J. Germany Boosts Renewables with “Biggest Energy Policy Reform in Decades”. 2022. Available online: https://www.cleanenergywire.org/news/germany-boosts-renewables-biggest-energy-policy-reform-decades (accessed on 15 April 2023).
  52. Terehovics, E.; Khabdullin, A.; Khabdullin, A.; Khabdullina, Z.; Khabdullina, G.; Veidenbergs, I.; Blumberga, D. Why solar electricity has high potential for Kazakhstan industries. Energy Proc. 2017, 113, 417–422. [Google Scholar] [CrossRef]
  53. Kazakhstan Association of Oil and Gas and Energy Sector Organizations “KAZENERGY”. The National Energy Report KAZENERGY 2021. 2022. Available online: https://www.kazenergy.com/upload/document/energy-report/NationalReport21_en.pdf (accessed on 15 April 2023).
  54. Ministry of Energy of the Republic of Kazakhstan. Information on the Production of Electricity by Renewable Energy Facilities for the 1st Half of 2022. 2022. Available online: https://www.gov.kz/memleket/entities/energo/documents/details/327995?lang=ru (accessed on 15 April 2023).
  55. Nazarbayev, N.A. Strategy “Kazakhstan-2050”. 2012. Available online: https://www.akorda.kz/en/official_documents/strategies_and_programs (accessed on 15 April 2023).
  56. World Bank Group. Green Economy: Realities and Prospects in Kazakhstan. 2018. Available online: https://sk.kz/upload/iblock/3f5/3f5f8e2087688517bcc667eeebc82630.pdf (accessed on 15 April 2023).
  57. Tulaganov, A.; Sagindykova, G.; Isaev, M.; Bimbetova, B.; Kaiyrgaliyeva, M.; Aidosova, B.; Orynbassarova, A. The impact analysis of electricity prices on the energy intensity of the Kazakhstani economy and sustainable development. Int. J. Energy Econ. Policy 2022, 12, 241–248. [Google Scholar] [CrossRef]
  58. Kalkabayeva, G.; Rakhmetova, A.; Assanova, M. Financing of eco-innovations: Sources and trends in Kazakhstan. Int. J. Energy Econ. Policy 2021, 11, 173–179. [Google Scholar]
  59. Mihaylov, M.; Rădulescu, R.; Razo-Zapata, I.; Jurado, S.; Arco García, L.; Avellana, N.; Nowe, A. Comparing stakeholder incentives across state-of-the-art renewable support mechanisms. Renew. Energy 2018, 131, 689–699. [Google Scholar] [CrossRef]
  60. Ye, L.-C.; Rodrigues, J.; Lin, H. Analysis of feed-in tariff policies for solar photovoltaic in China 2011–2016. Appl. Energy 2017, 203, 496–505. [Google Scholar] [CrossRef]
  61. Kaplun, V.; Osypenko, V.; Makarevych, S. Forecasting the electricity pricing of energy islands with renewable sources. Machin. Energ. 2022, 13, 38–47. [Google Scholar] [CrossRef]
  62. Statista. Number of Net Metering Customers in the United States from 2010 to 2021, by Technology. 2022. Available online: https://www.statista.com/statistics/298949/net-metering-customers-in-the-united-states-by-technology/#:~:text=In%202020%2C%20there%20were%20around,majority%20were%20photovoltaic%20generating%20customers (accessed on 15 April 2023).
  63. International Energy Agency. National Survey Report of PV Power Applications in Japan. 2019. Available online: https://iea-pvps.org/wp-content/uploads/2020/10/NSR_Japan_2019.pdf (accessed on 15 April 2023).
  64. Kabir, A.; Farjana, F.; Choudhury, R.; Kayes, A.I.; Ali, S.; Farrok, O. Net-metering and Feed-in-Tariff policies for the optimum billing scheme for future industrial PV systems in Bangladesh. Alex. Eng. J. 2023, 63, 157–174. [Google Scholar] [CrossRef]
  65. Danylyshyn, V.; Koval, M. Development of alternative energy in the world and Ukraine. Machin. Energy 2022, 13, 50–61. [Google Scholar] [CrossRef]
  66. Kar, S.K.; Sharma, A.; Roy, B. Solar energy market developments in India. Renew. Sustain. Energy Rev. 2016, 62, 121–133. [Google Scholar] [CrossRef]
  67. Adwek, G.; Boxiong, S.; Arowo, M.; Ndolo, P.; Shimmon, J. Review of solar energy development in Kenya: Opportunities and challenges. Renew. Energy Focus 2019, 29, 123–140. [Google Scholar]
  68. Amo-Aidoo, A.; Kumi, E.N.; Hensel, O.; Korese, J.K.; Sturm, B. Solar energy policy implementation in Ghana: A LEAP model analysis. Sci. Afr. 2022, 16, 01162. [Google Scholar] [CrossRef]
  69. Jäger-Waldau, A.; Huld, T.; Szabo, S. Residential photovoltaic electricity generation in the European Union 2017—Opportunities and challenges. In Proceedings of the IEEE 44th Photovoltaic Specialist Conference, Washington, DC, USA, 25–30 June 2017; pp. 2167–2169. [Google Scholar]
  70. Sreenath, S.; Azmi, A.M.; Dahlan, N.Y.; Sudhakar, K. A decade of solar PV deployment in ASEAN: Policy landscape and recommendations. Energy Rep. 2022, 8, 460–469. [Google Scholar] [CrossRef]
  71. The World Bank. Global Photovoltaic Power Potential Country. 2022. Available online: https://documents1.worldbank.org/curated/en/466331592817725242/pdf/Global-Photovoltaic-Power-Potential-by-Country.pdf (accessed on 15 April 2023).
  72. Aszódi, A.; Biró, B.; Adorján, L.; Dobos, Á.C.; Illés, G.; Tóth, N.K.; Zagyi, D.; Zsiborás, Z.T. Comparative analysis of national energy strategies of 19 European countries in light of the green deal’s objectives. Energy Conv. Manag. X 2021, 12, 100136. [Google Scholar] [CrossRef]
  73. Kok, S. Examining Solar Energy Policy in China and India: A Comparative Study of the Potential for Energy Security and Sustainable Development; Uppsala University: Uppsala, Sweden, 2015. [Google Scholar]
  74. Conigliani, C.; Iorio, M.; Salvatore Monni, S. Water, energy and human development in the Brazilian Amazon: A municipal Human Development Index adjusted for accesses. Entrep. Sustain. Issues 2023, 10, 318–328. [Google Scholar] [CrossRef]
  75. Piccinetti, L.; Rezk, M.R.A.; Kapiel, T.Y.S.; Salem, N.; Khasawneh, A.; Santoro, D.; Sakr, M.M. Circular bioeconomy in Egypt: The current state, challenges, and future directions. Insights Reg. Dev. 2023, 5, 97–112. [Google Scholar] [CrossRef] [PubMed]
  76. Shava, E.; Vyas-Doorgapersad, S. Inclusive participation in information and communication technologies (ICTs) processes for smart services in the city of Johannesburg. Insights Reg. Dev. 2023, 5, 26–40. [Google Scholar] [CrossRef]
  77. Mazina, A.; Syzdykova, D.; Myrzhykbayeva, A.; Raikhanova, G.; Nurgaliyeva, A. Impact of green fiscal policy on investment efficiency of renewable energy enterprises in Kazakhstan. Int. J. Energy Econ. Policy 2022, 12, 491–497. [Google Scholar] [CrossRef]
  78. Genys, D.; Pažėraitė, A. Mapping Lithuanian transition towards sustainable energy: Sociological account on a waste-to-energy case. Entrep. Sustain. Issues 2023, 10, 527–543. [Google Scholar] [CrossRef] [PubMed]
Figure 1. Electricity generation by solar PV worldwide in view of the top 5 countries.
Energies 16 04370 g001
Figure 2. DNI solar map of Kazakhstan. Source: [39].
Energies 16 04370 g002
Figure 3. Installed solar power plants in Kazakhstan. Source: [53].
Energies 16 04370 g003
Figure 4. Structure of electricity production by fuel type. Source: [43].
Energies 16 04370 g004
Table 2. Electricity generation in 2019–2021, TWh.
201920202021
TotalREPVsShare of PVTotalREPVsShare of PVTotalREPVsShare of PV
World27,0002789.2707.92.6%26,8233147.0855.73.2%28,466365710323.6%
RK106.51.10.40.4%109.23.71.41.3%114.44.21.61.4%
Source: [15,16].
Table 3. World’s solar PV system development dynamics.
2010202020302050
Share in total generation0.2%3.1%13%25%
Total installed capacity (GW)39710.3520014,000
Annual increase (GW/year)1767450444
Source: [16,18,19].
Table 4. Solar PV installation cost changes.
2010202020302050
Total installation cost (USD/kW)4731883834–340481–165
LCOE (USD/kWh)0.3810.0570.08–0.20.05–0.01
Sources: [18,21].
Disclaimer/Publisher’s Note: The statements, opinions and data contained in all publications are solely those of the individual author(s) and contributor(s) and not of MDPI and/or the editor(s). MDPI and/or the editor(s) disclaim responsibility for any injury to people or property resulting from any ideas, methods, instructions or products referred to in the content.

