
Paleoenvironment Change and Organic Matter Accumulation of Marine Shale in the Zigong Area, Southern Sichuan Basin, China: A Case Study of Well Z303

Abstract
:1. Introduction
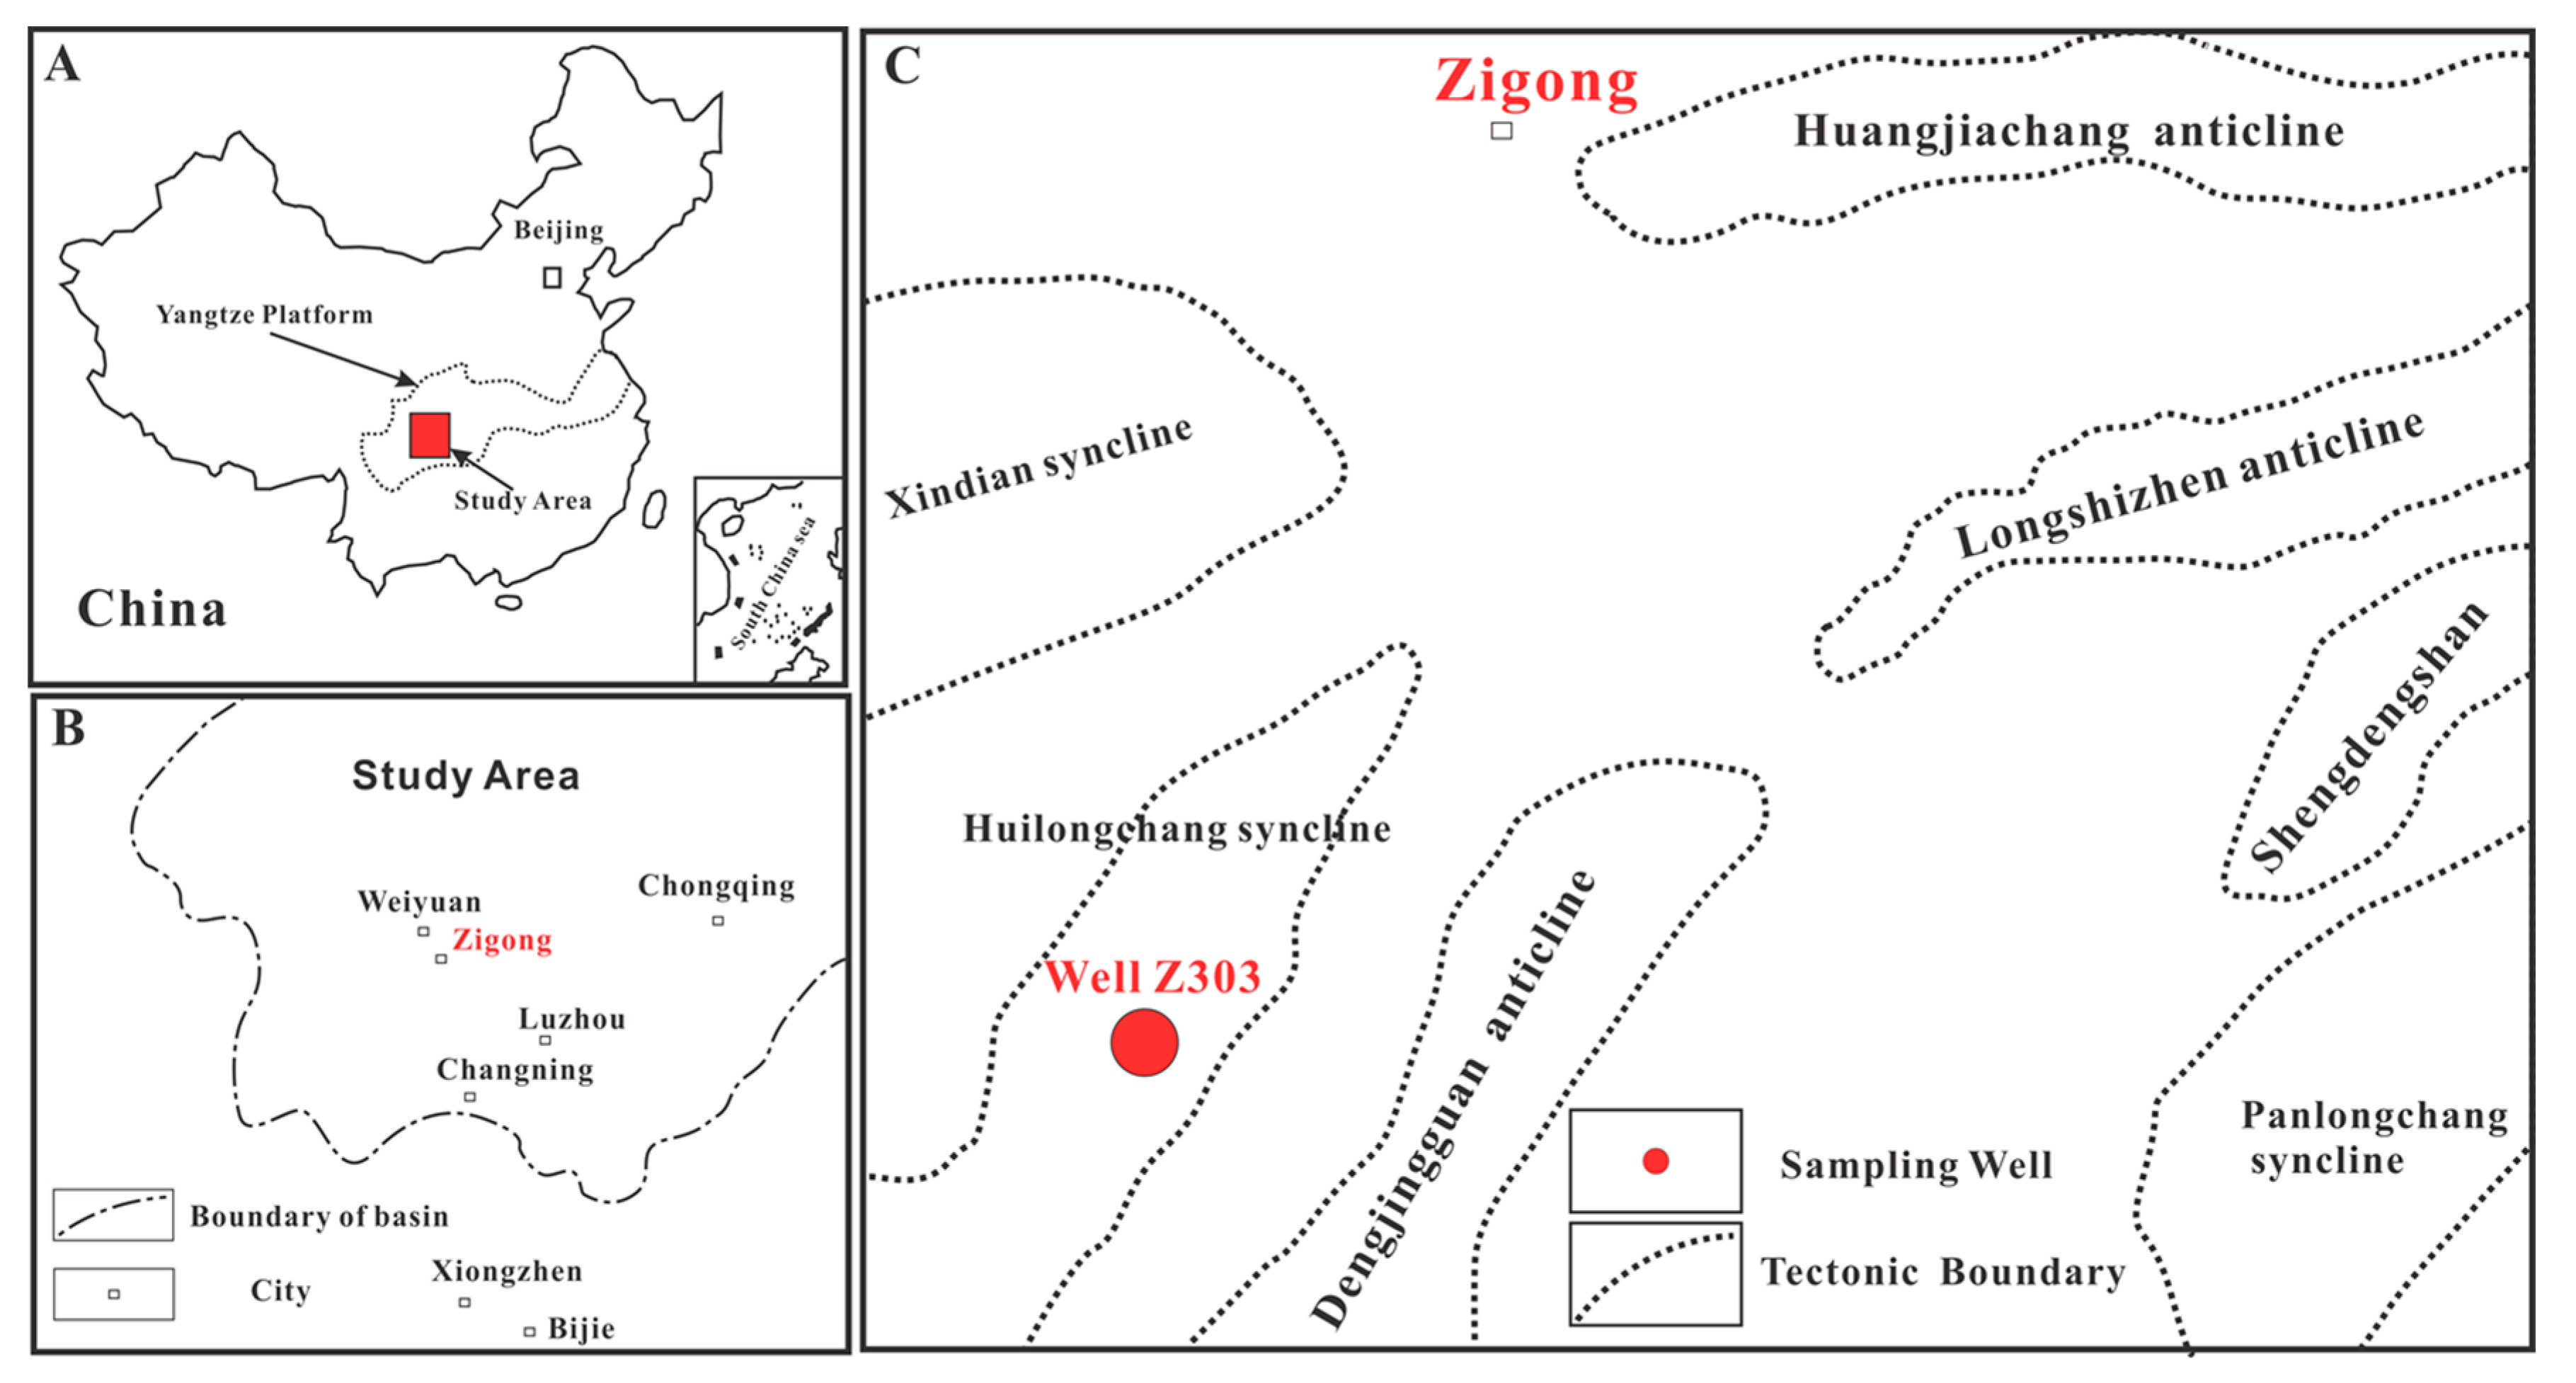
2. Geologic Setting
3. Samples and Experiments Methods
3.1. Samples
3.2. Experimental Methods
3.2.1. XRD
3.2.2. TOC
3.2.3. Major and Trace Elements
3.2.4. Asphaltene Reflectance Values
3.3. Data Analysis
4. Results
4.1. Organic Geochemical Characteristics
4.1.1. TOC Characteristics
4.1.2. Type of Organic Matter
4.1.3. Maturity of Organic Matter
4.2. Mineral Composition and Lithofacies Classification
4.3. Major and Trace Elements
5. Discussion
5.1. Depositional Environment Analysis
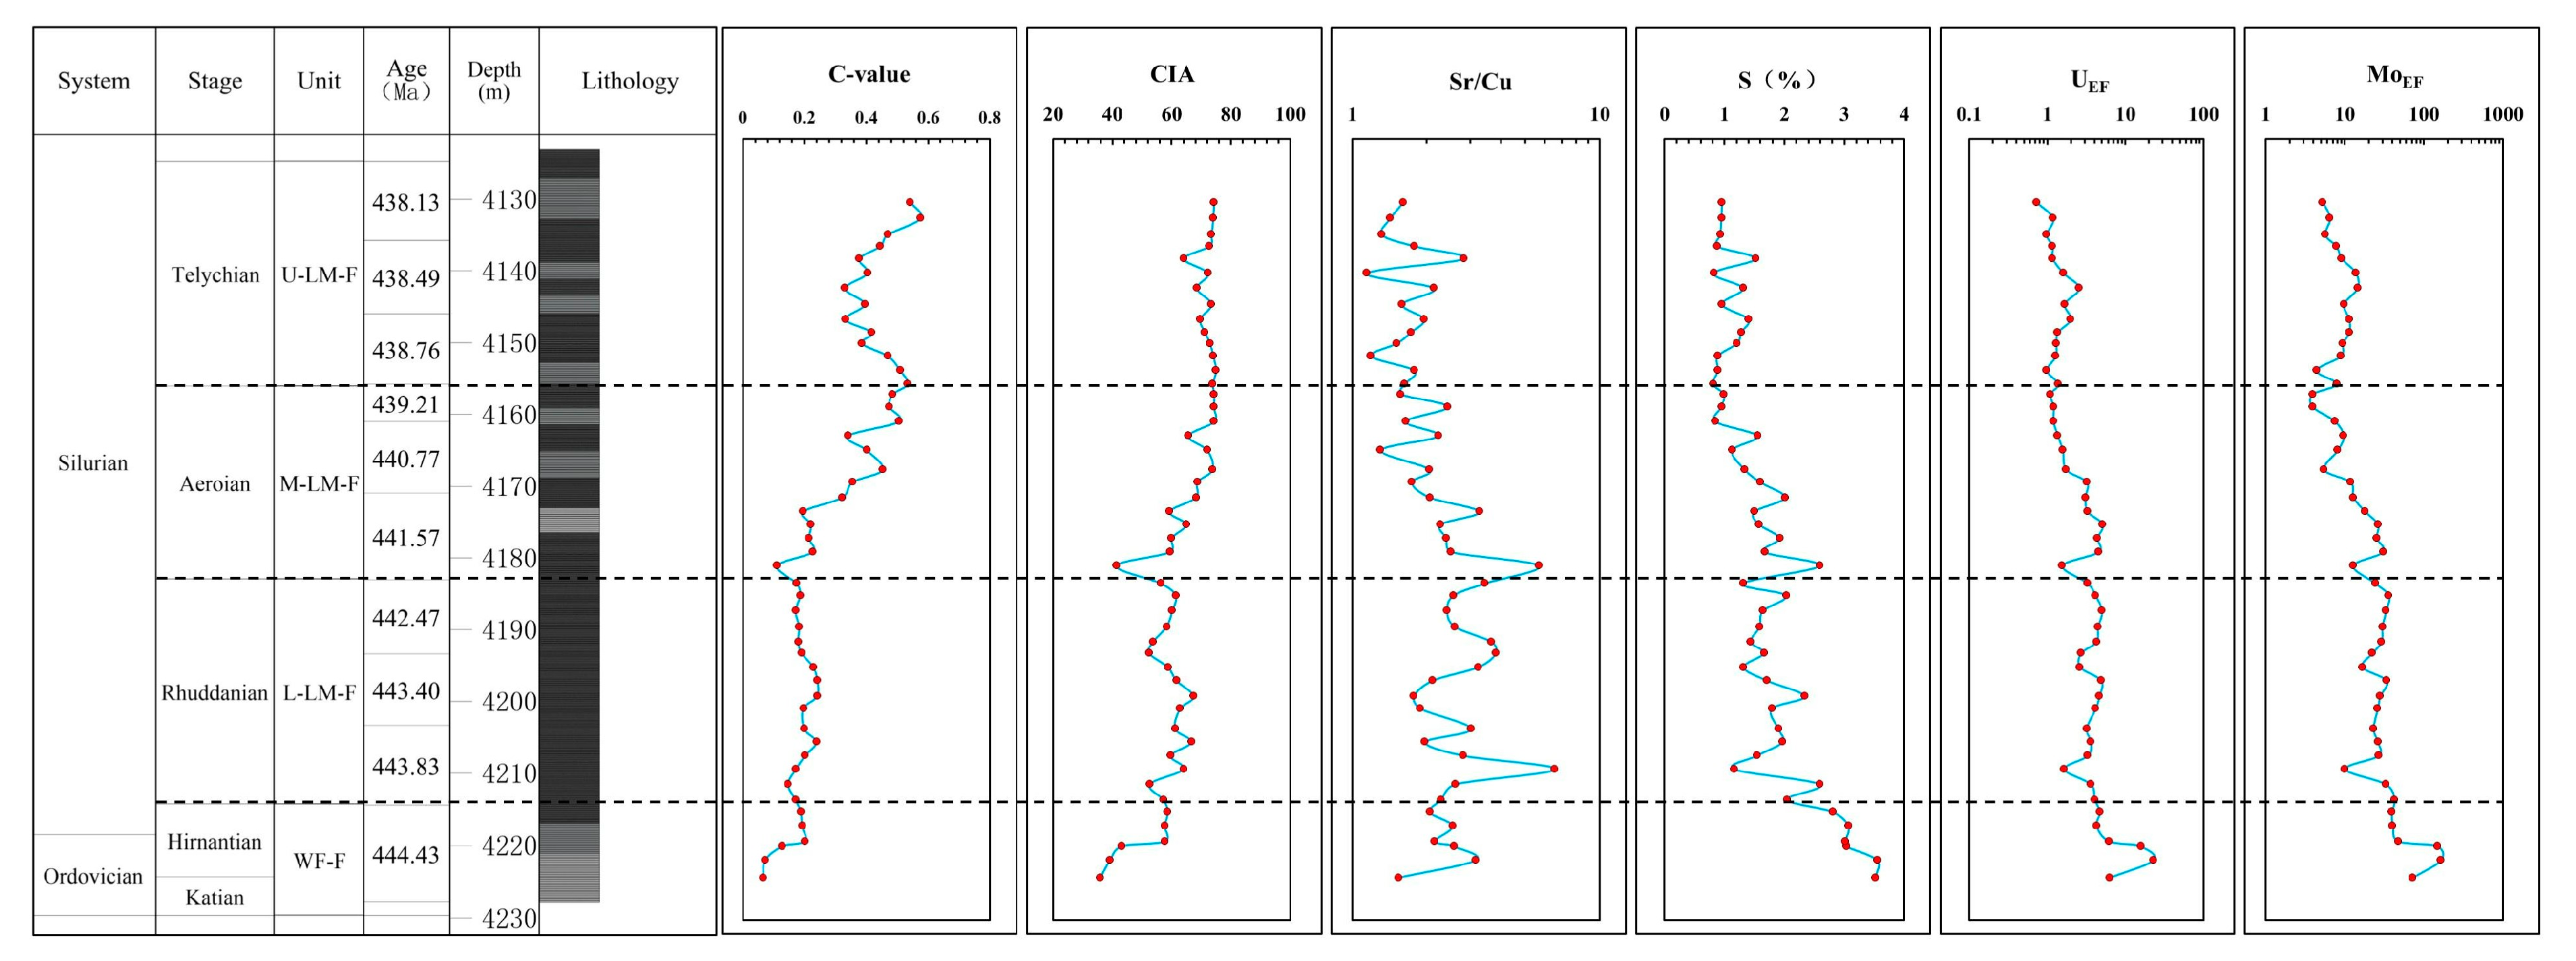
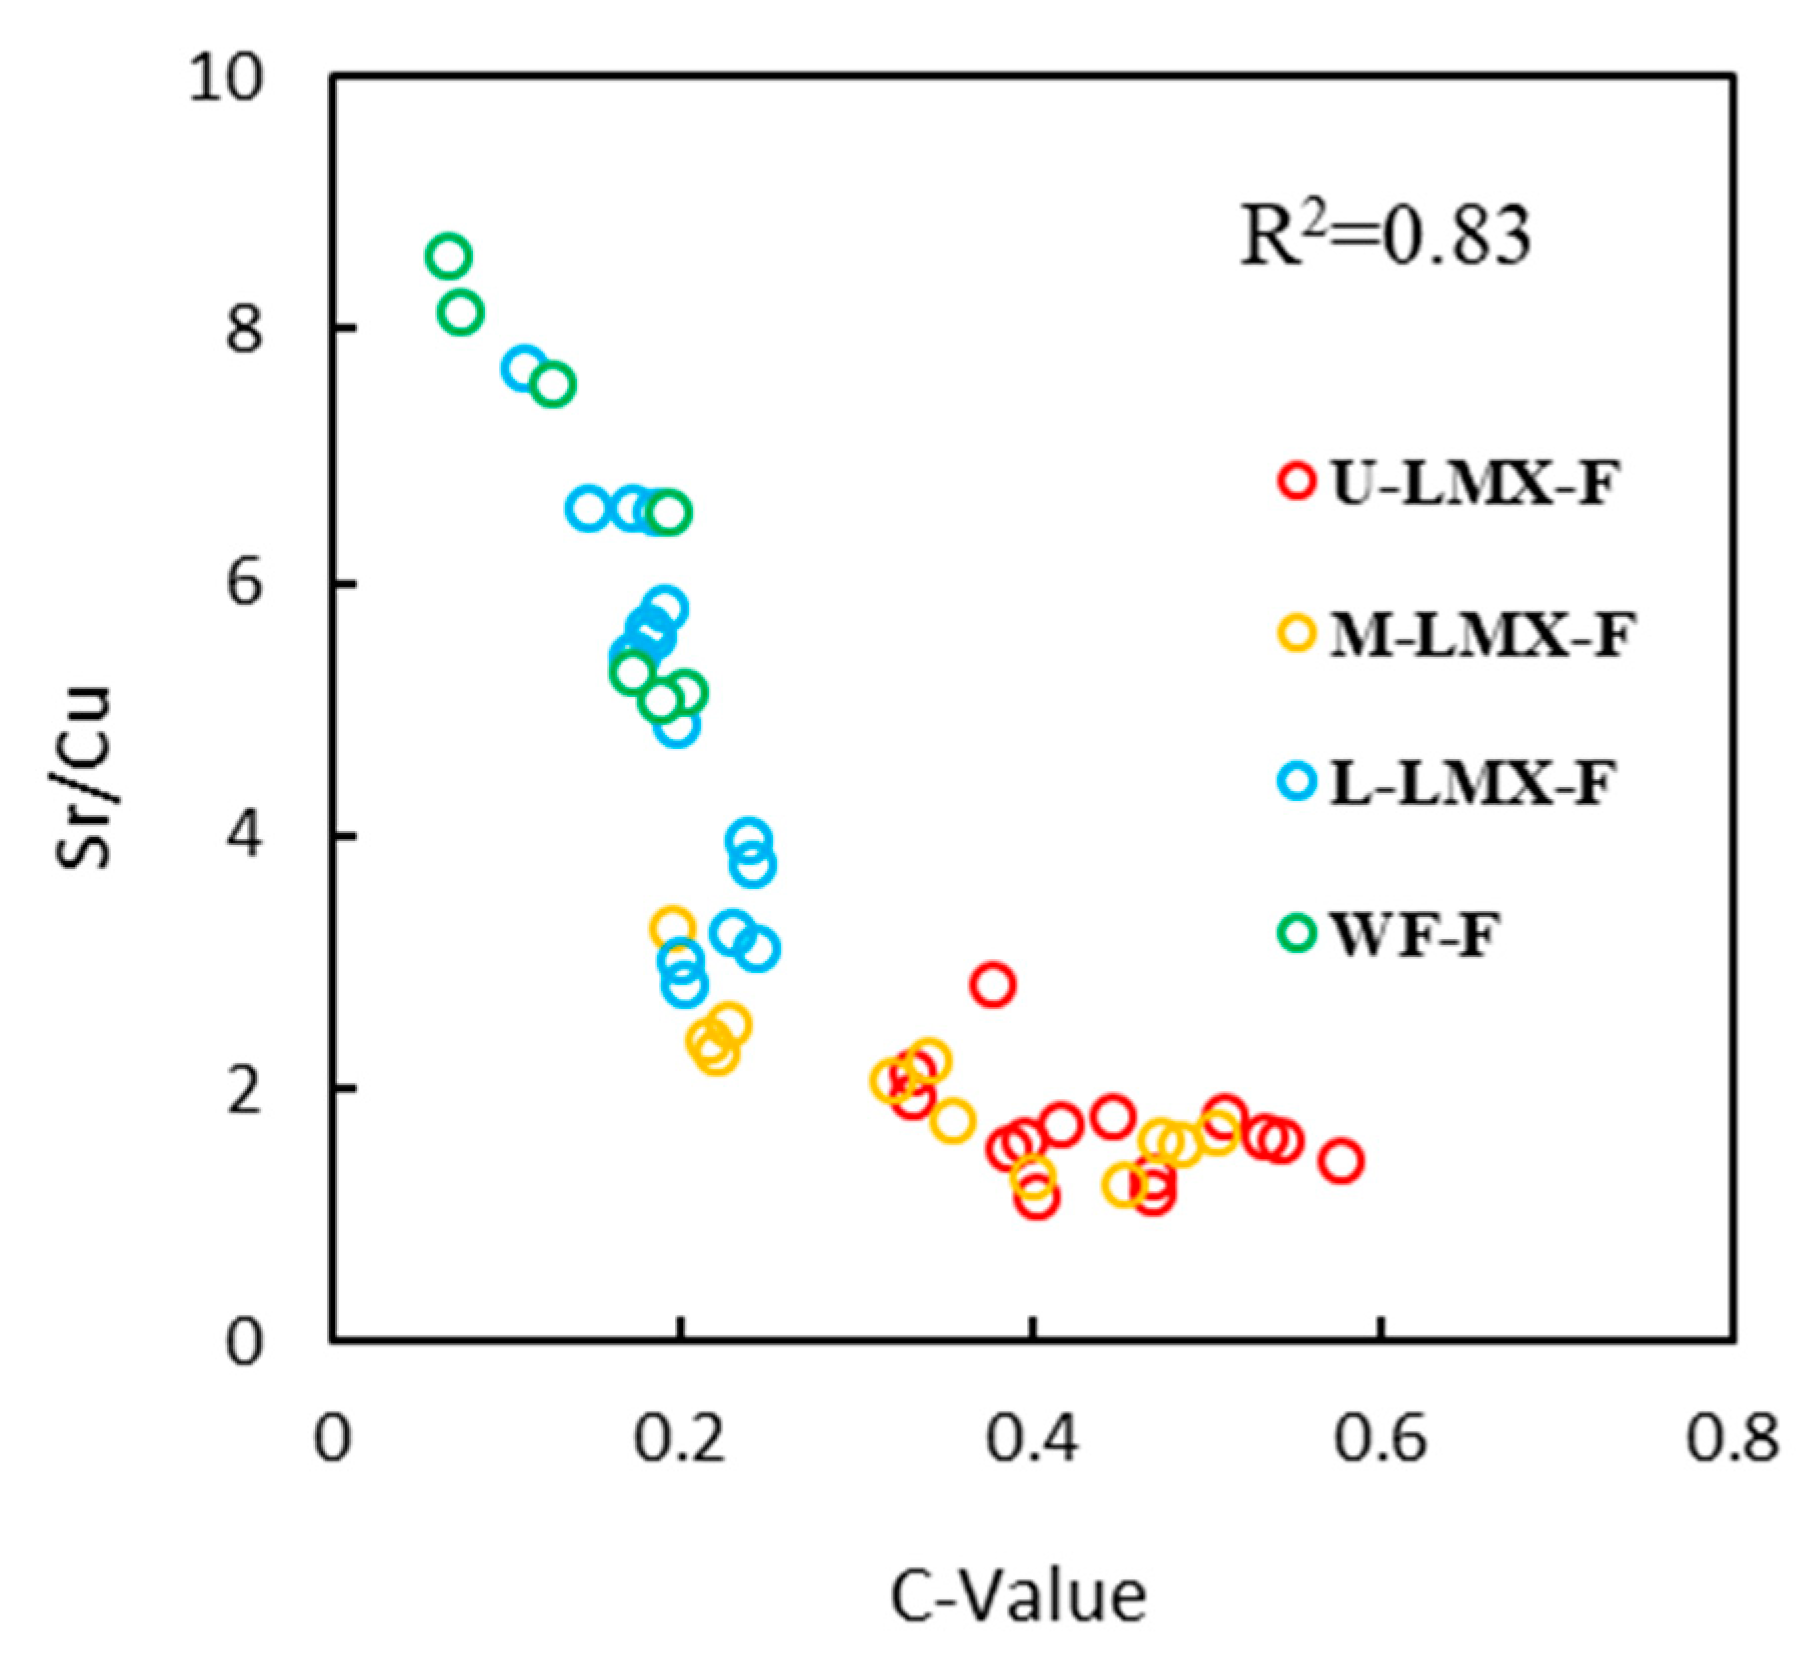
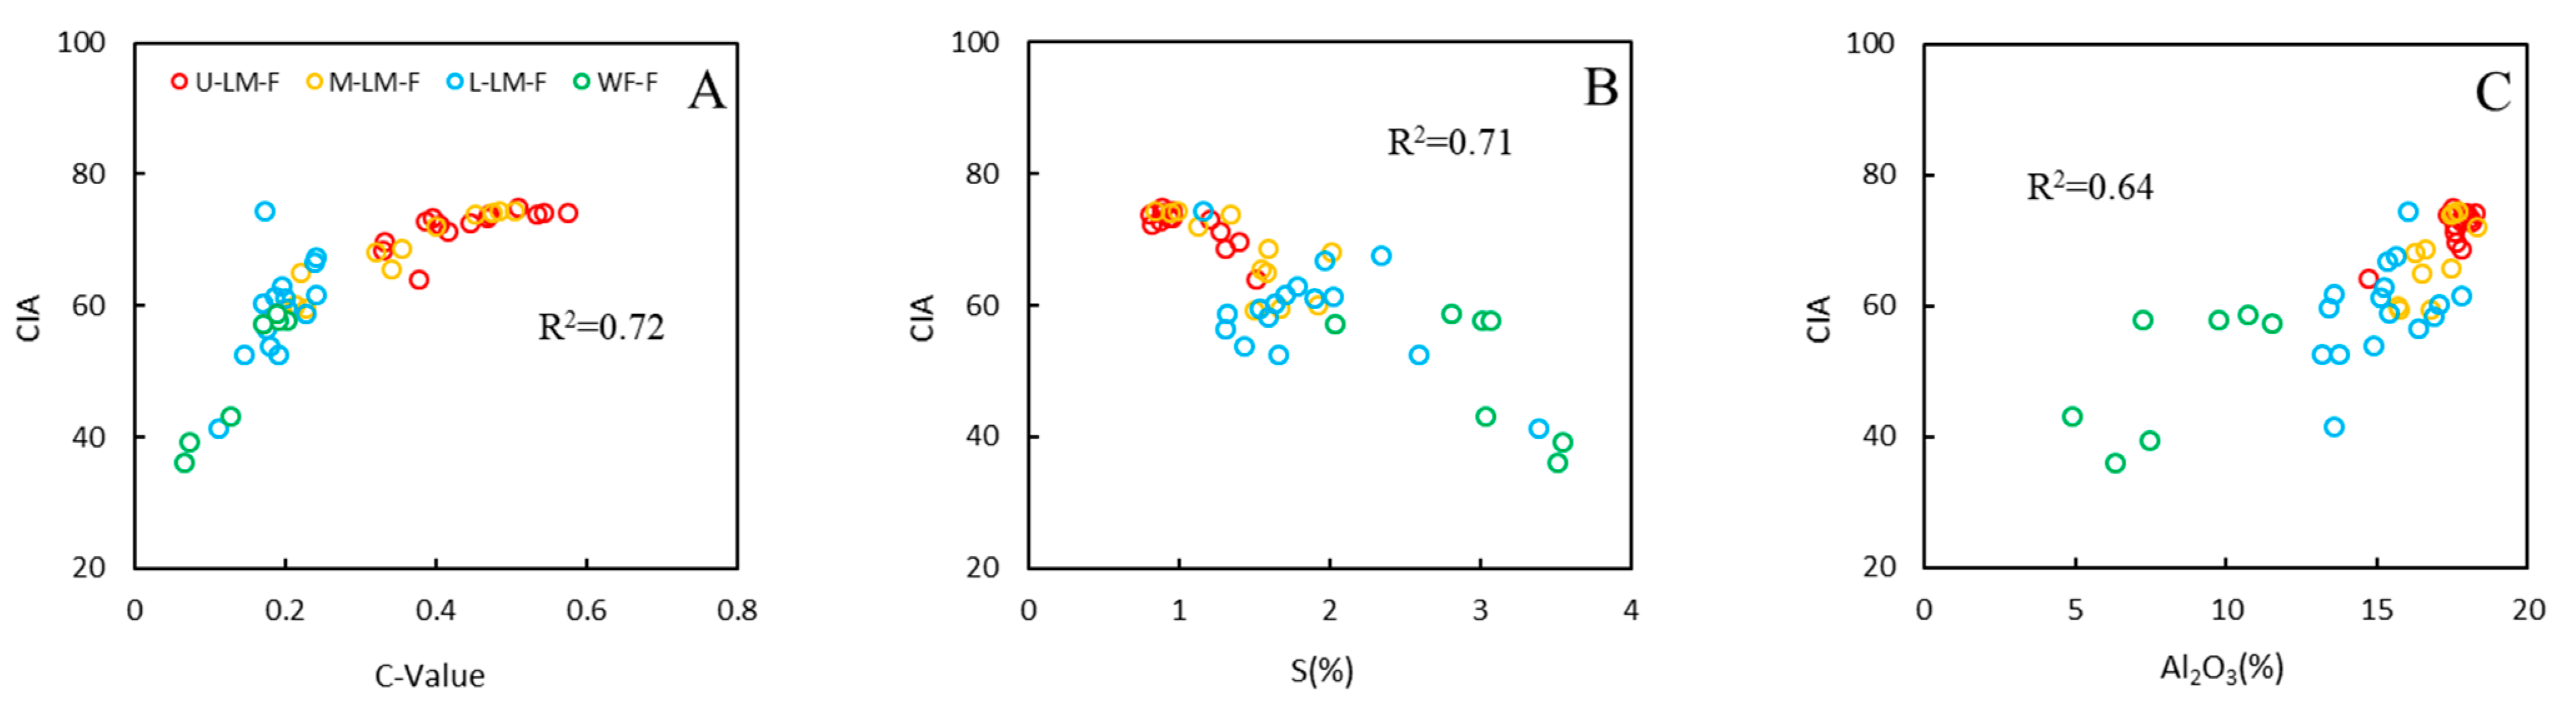
5.1.1. Paleoclimate and Weathering Conditions
5.1.2. Paleosalinity
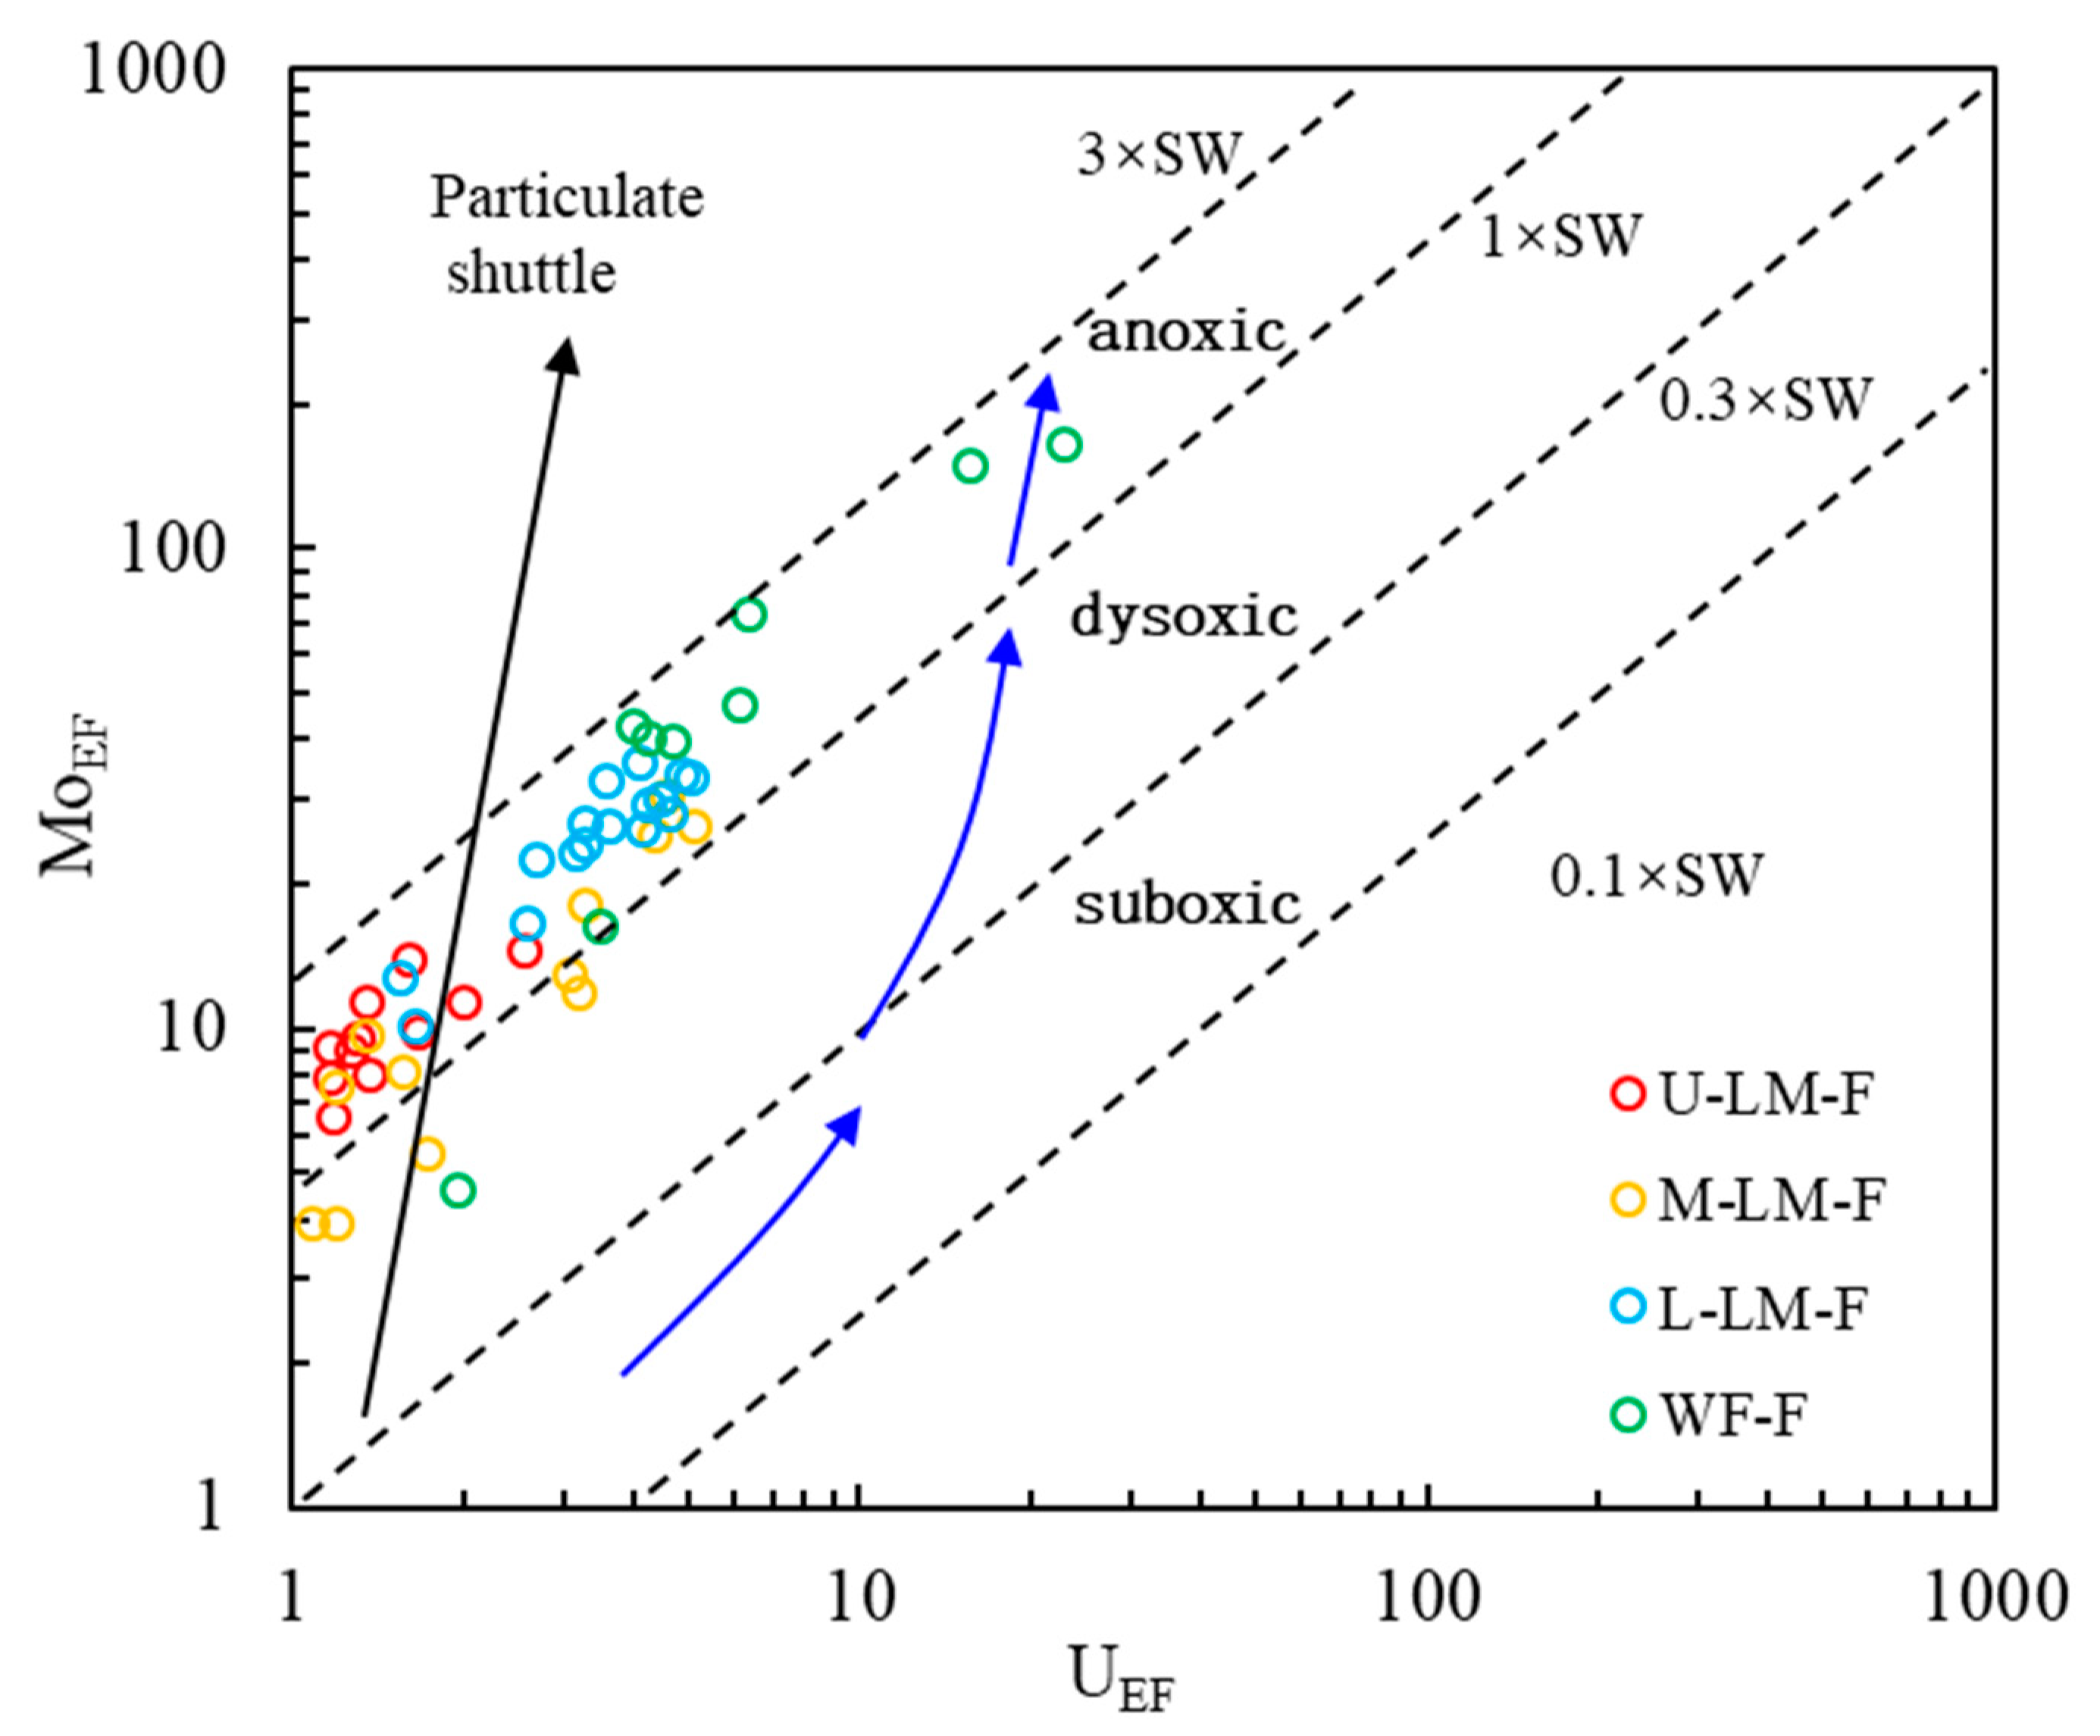
5.1.3. Redox Conditions
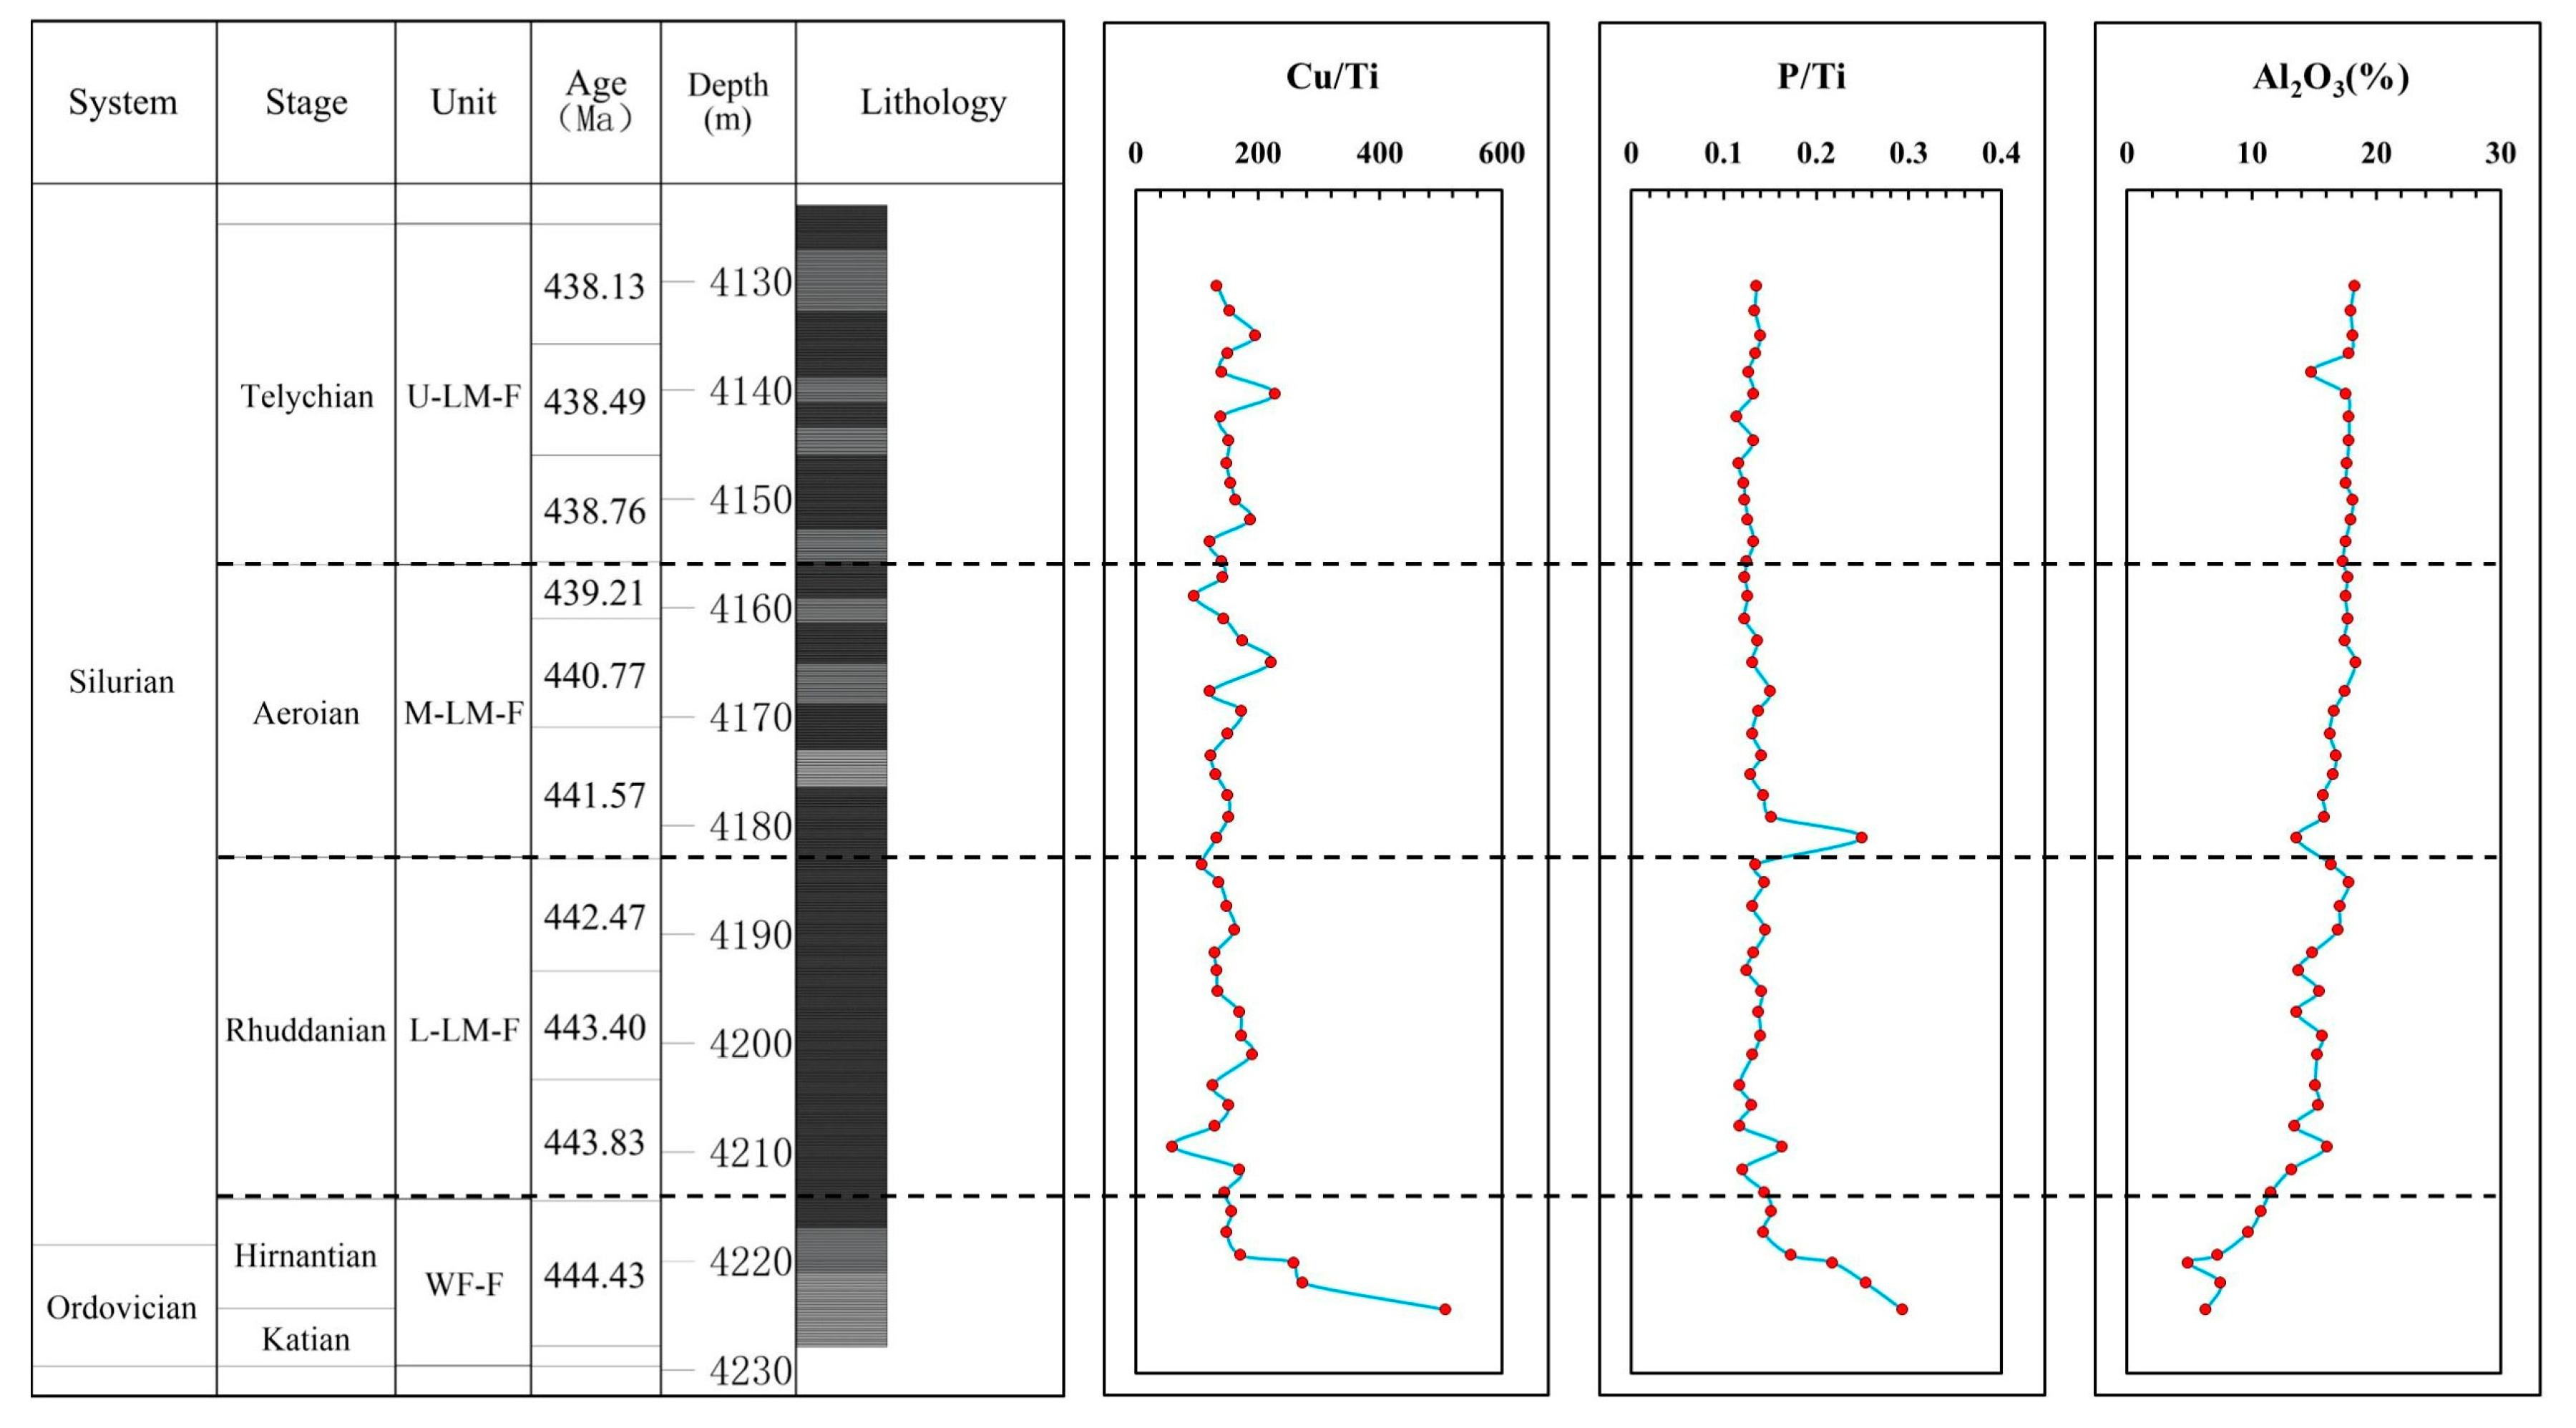
5.1.4. Paleoproductivity
5.1.5. Terrigenous Influx
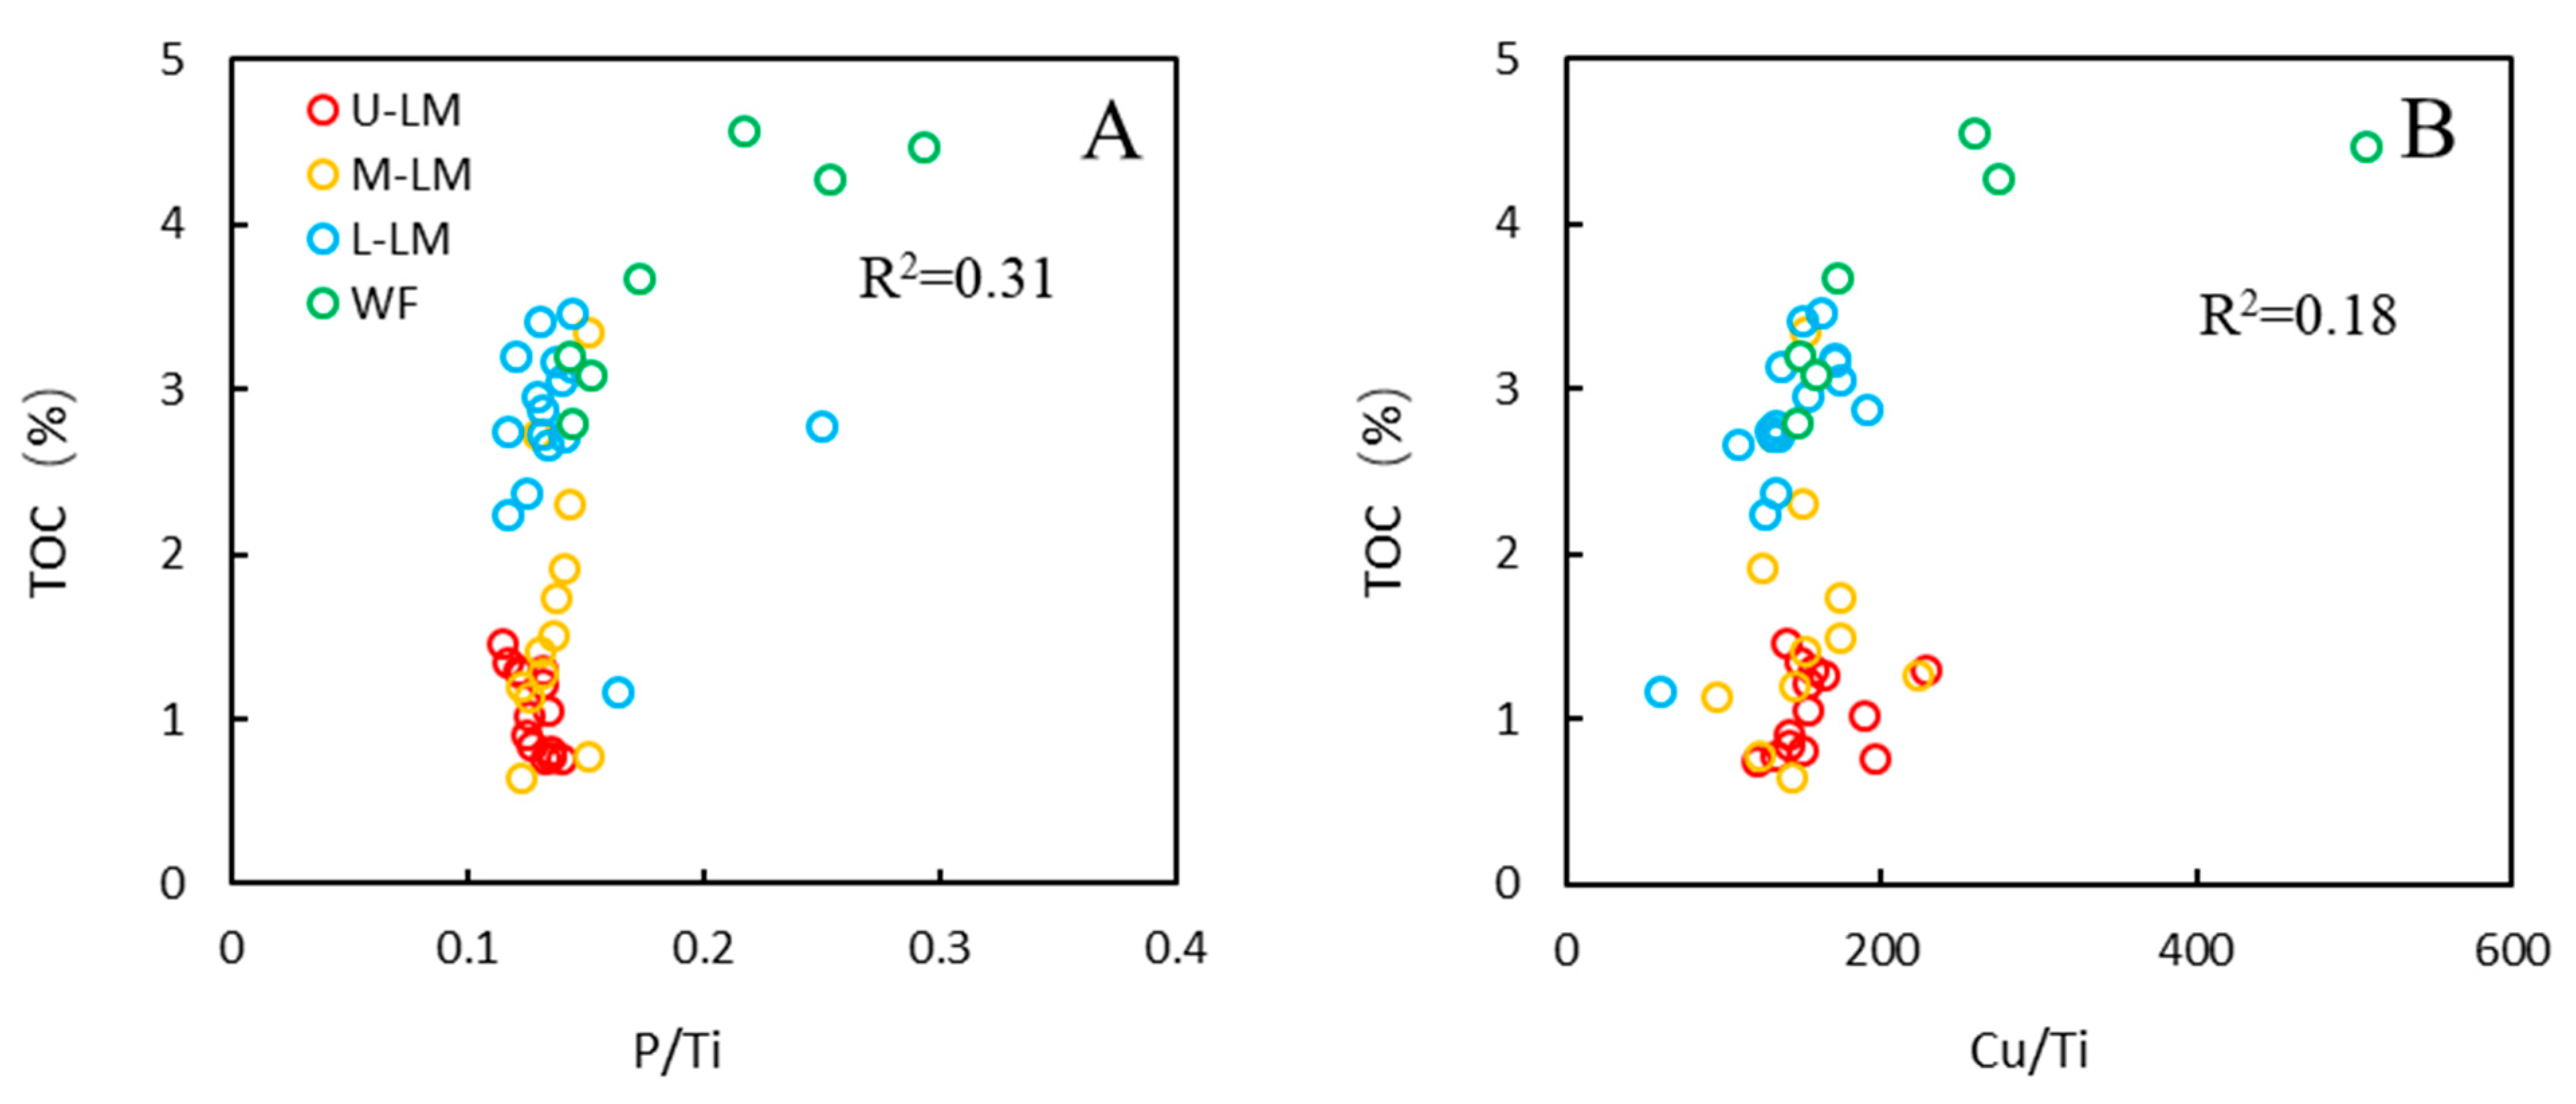
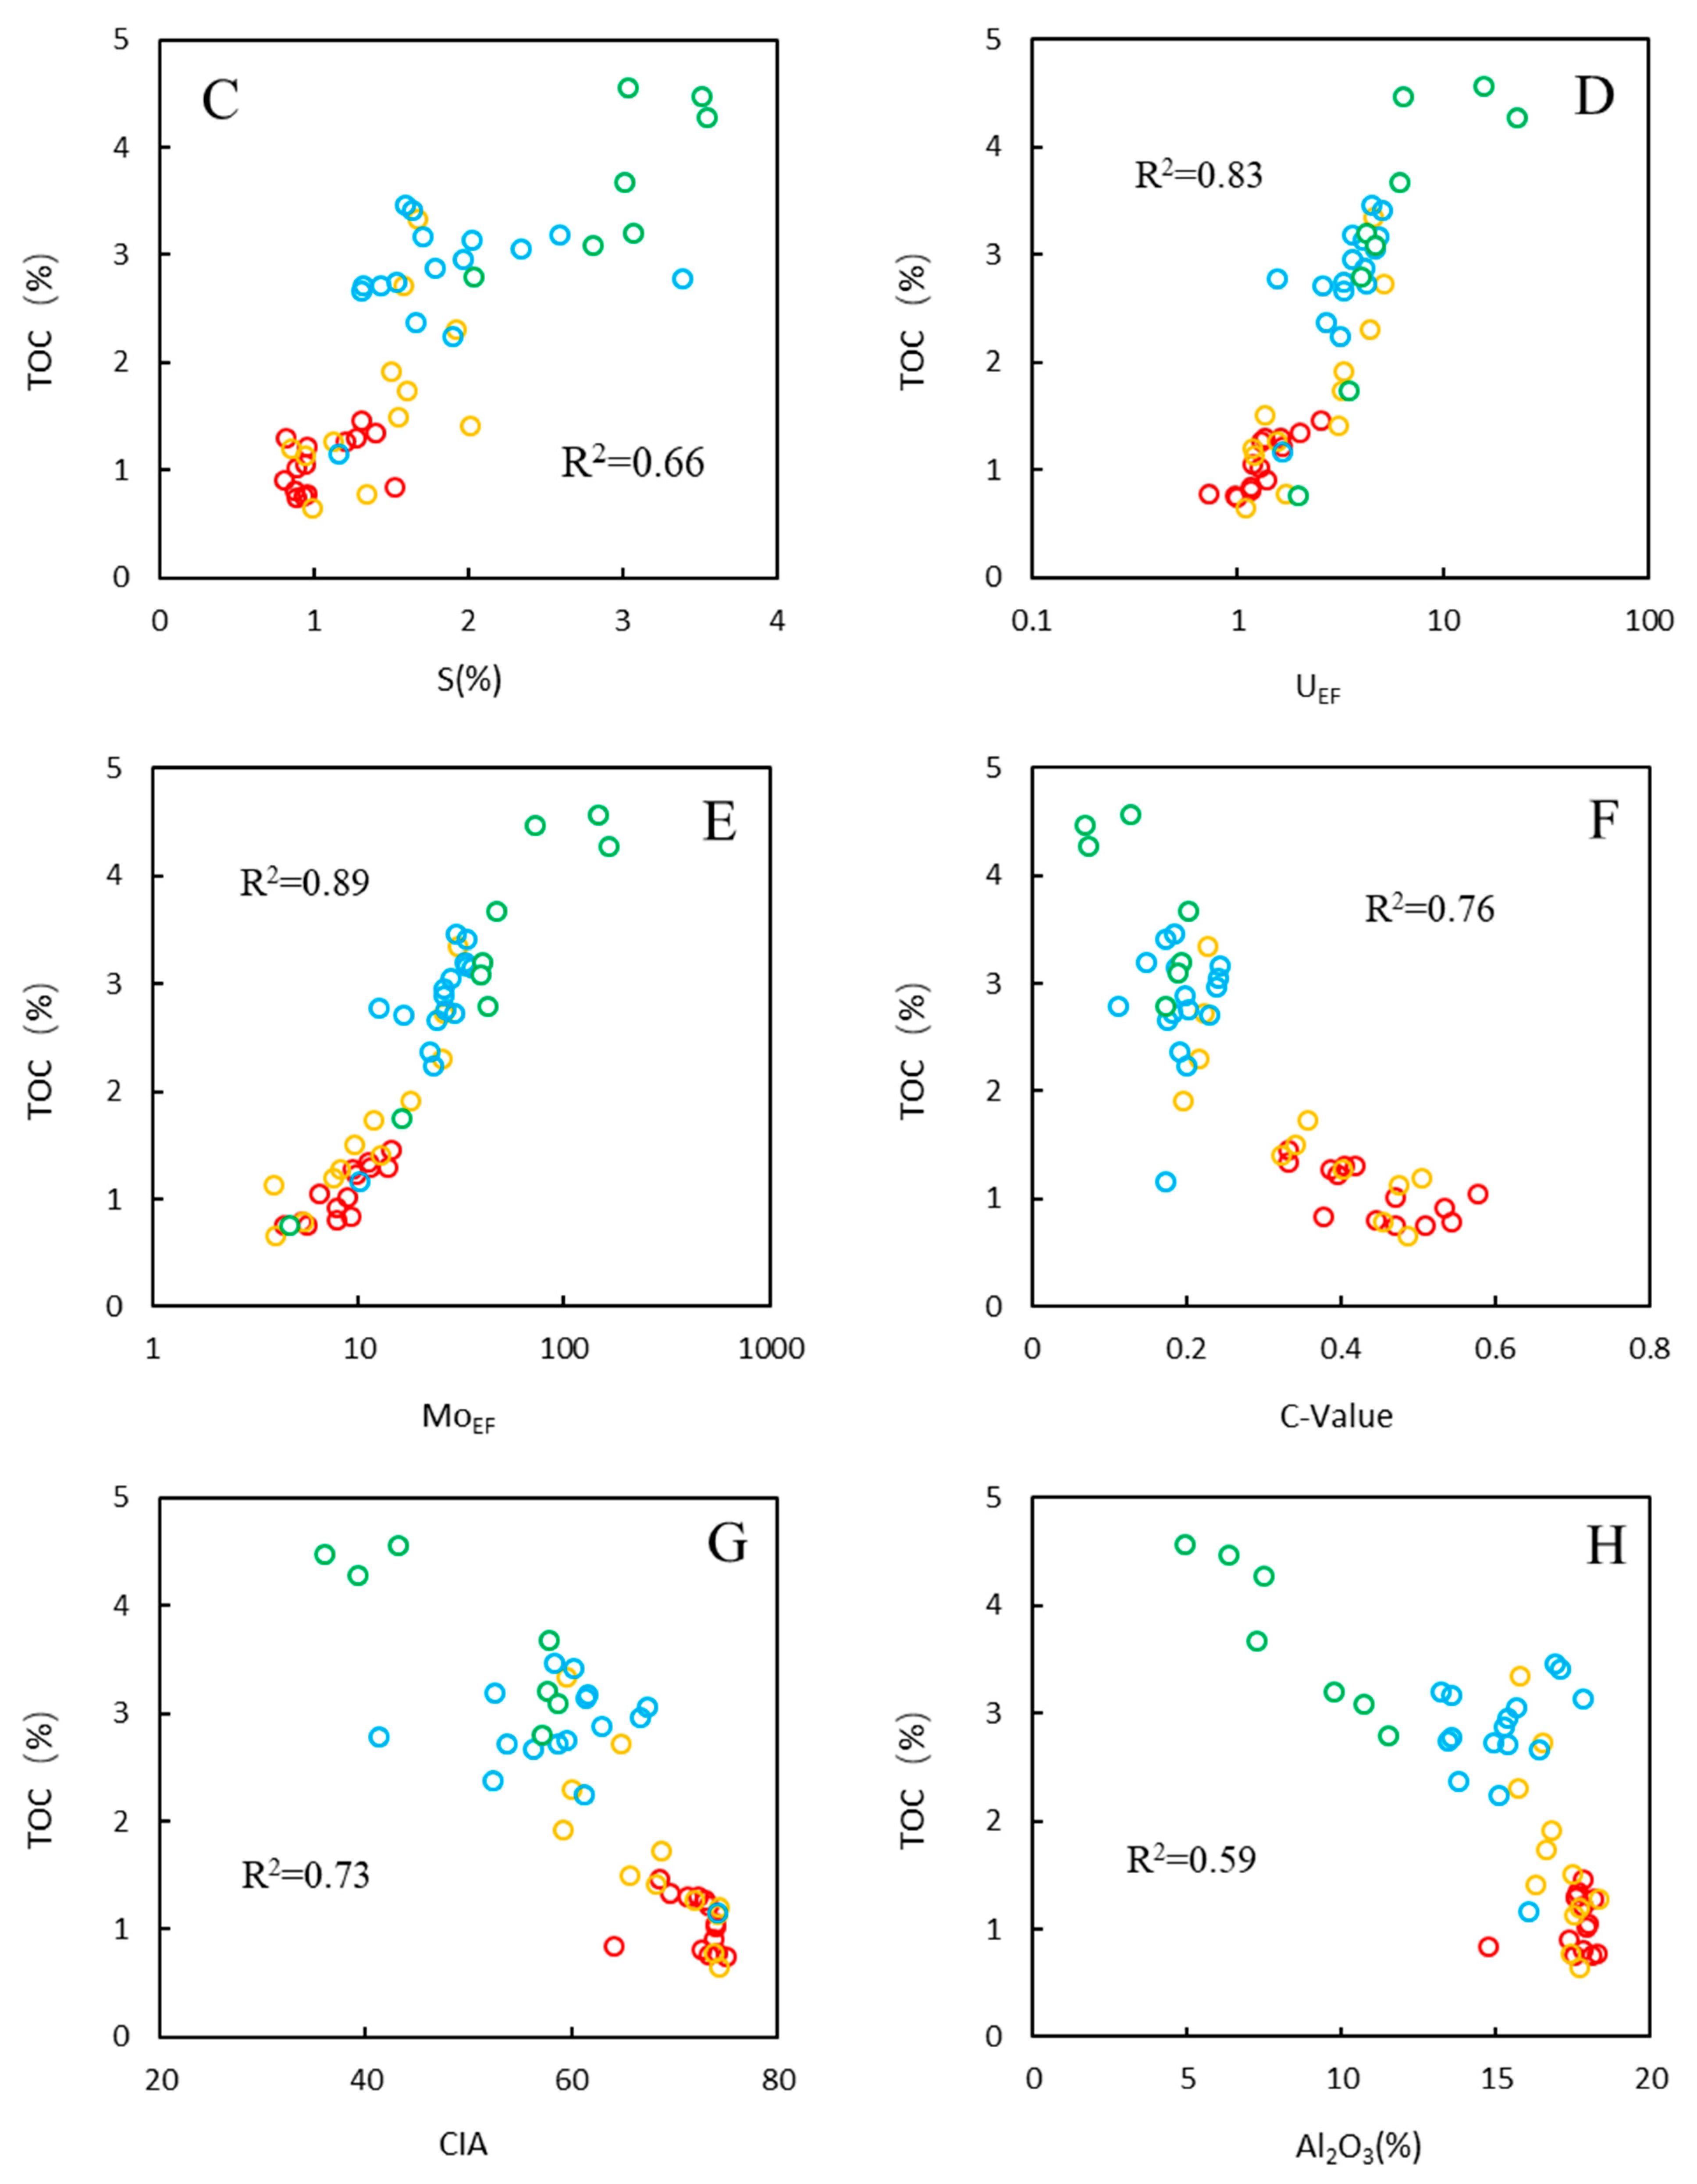
5.2. The Effect of Depositional Environment on OM Accumulation
6. Conclusions
- (1)
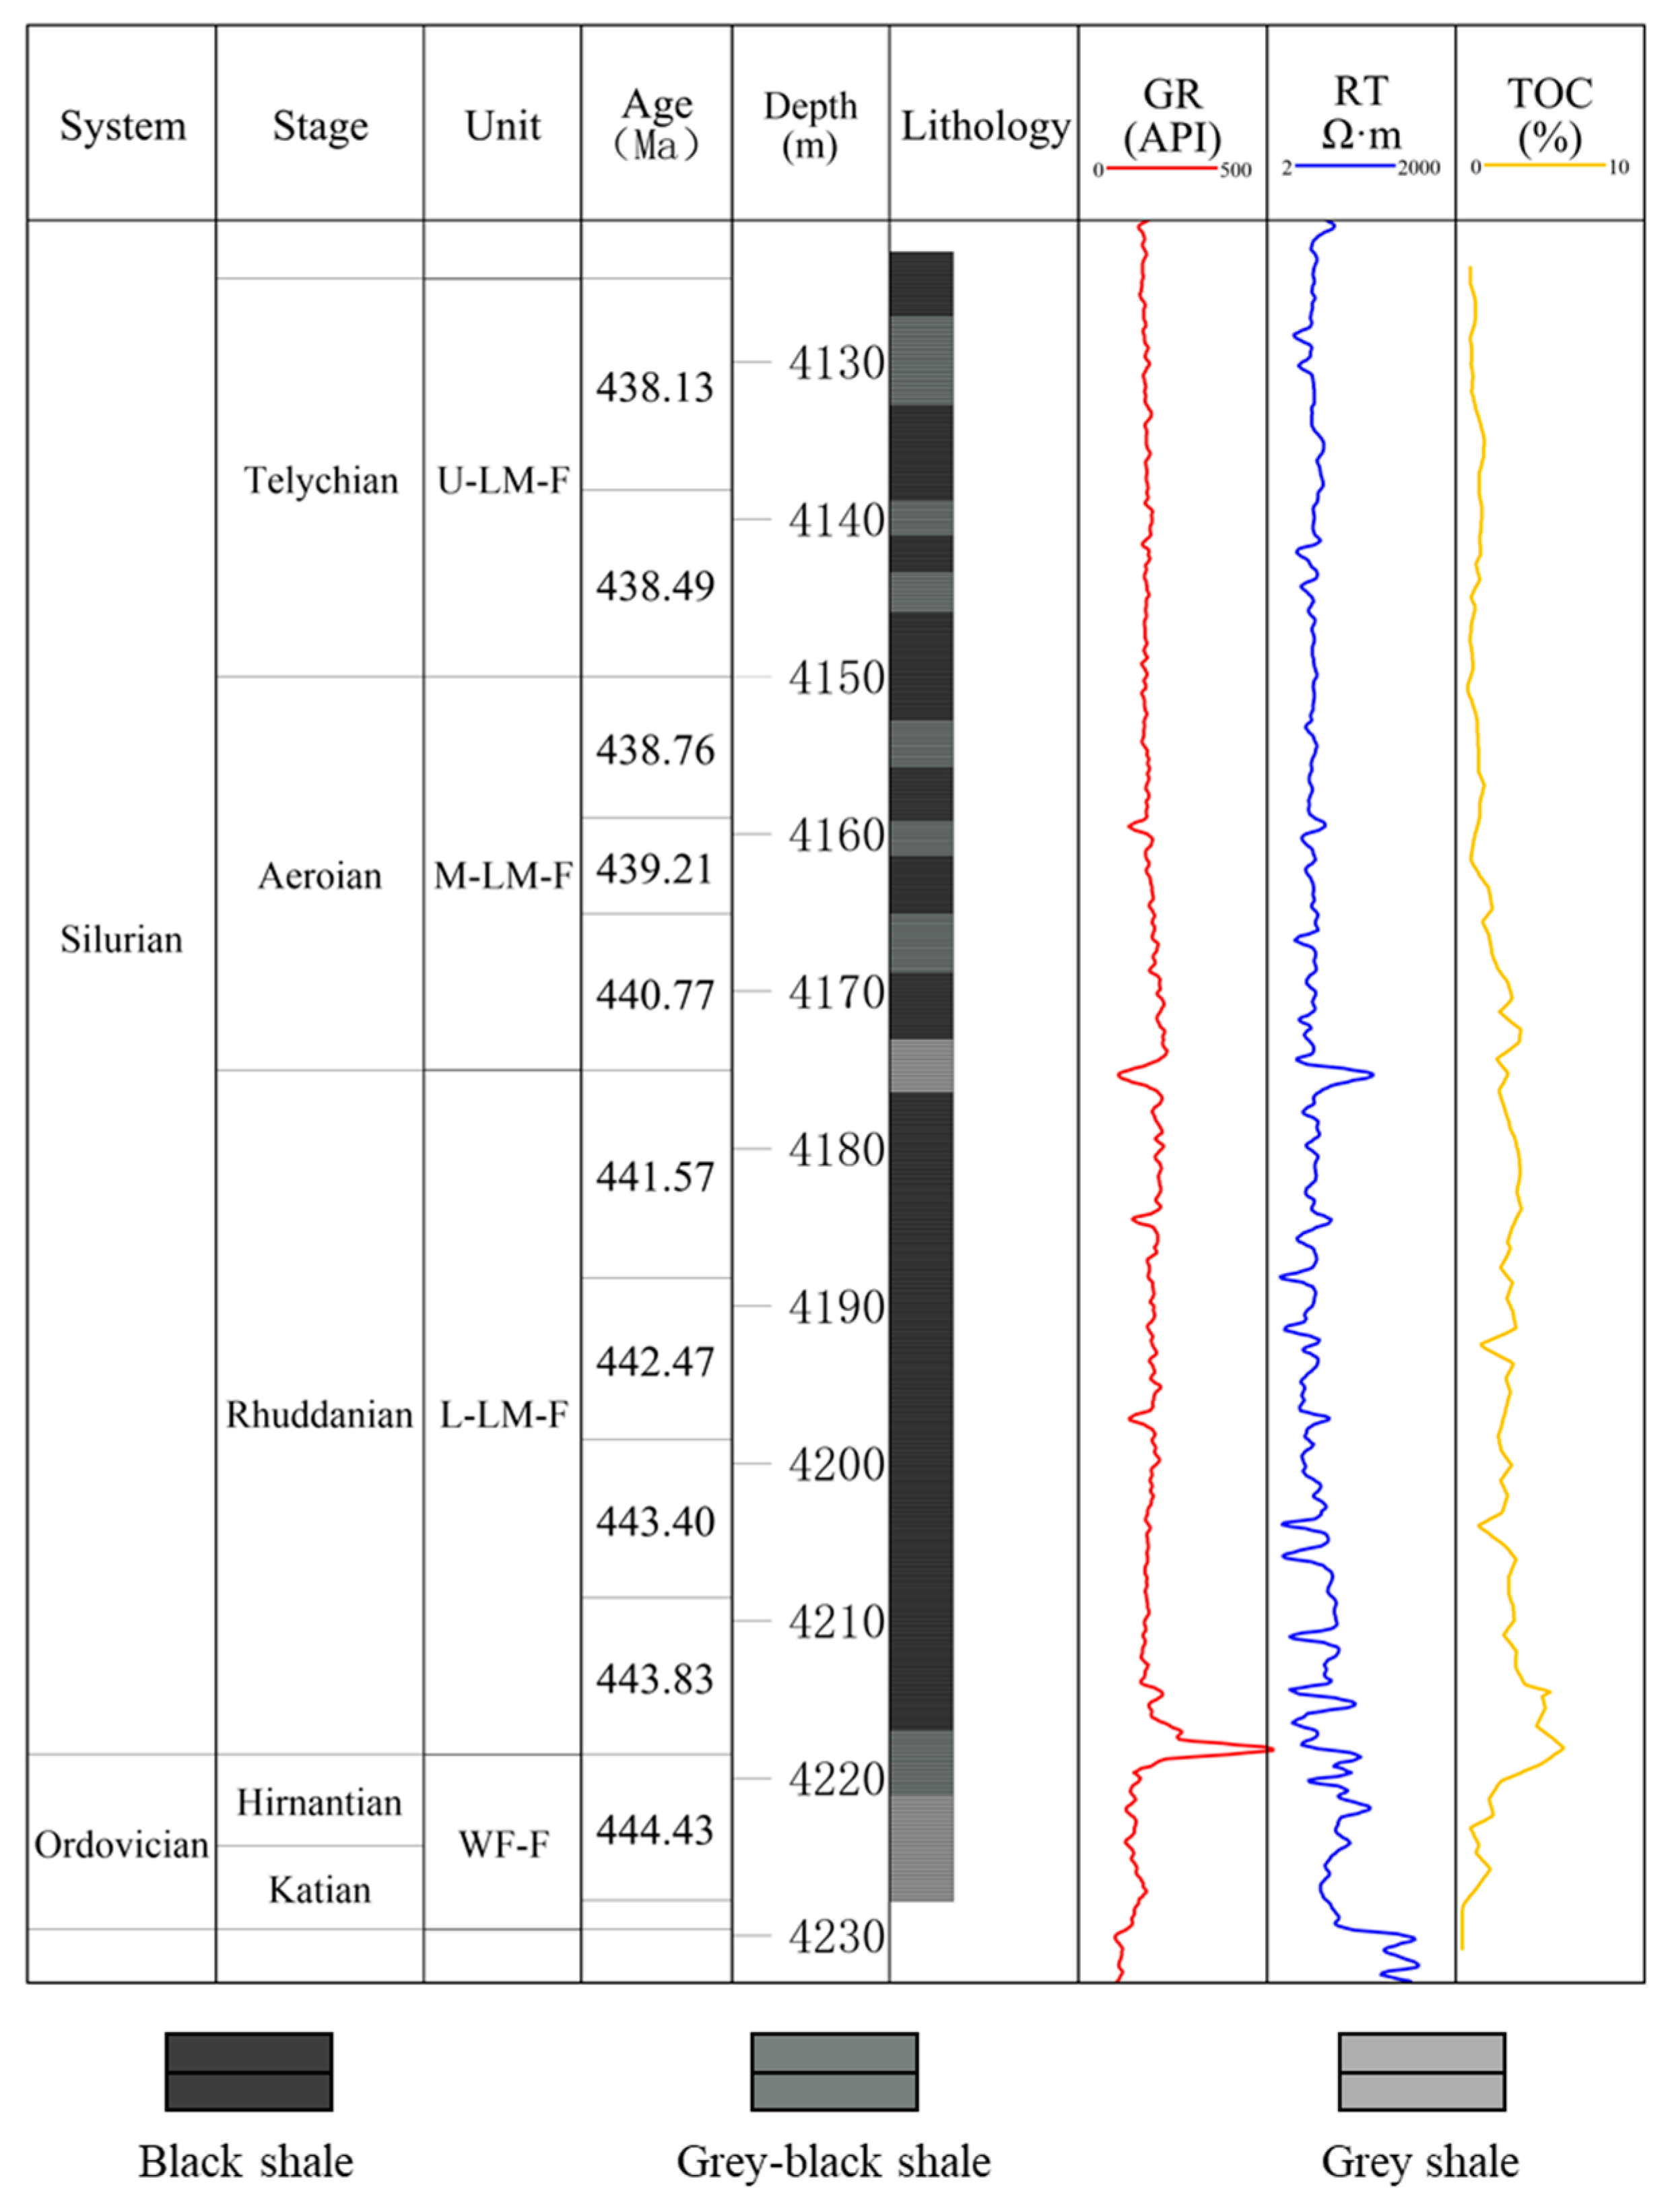
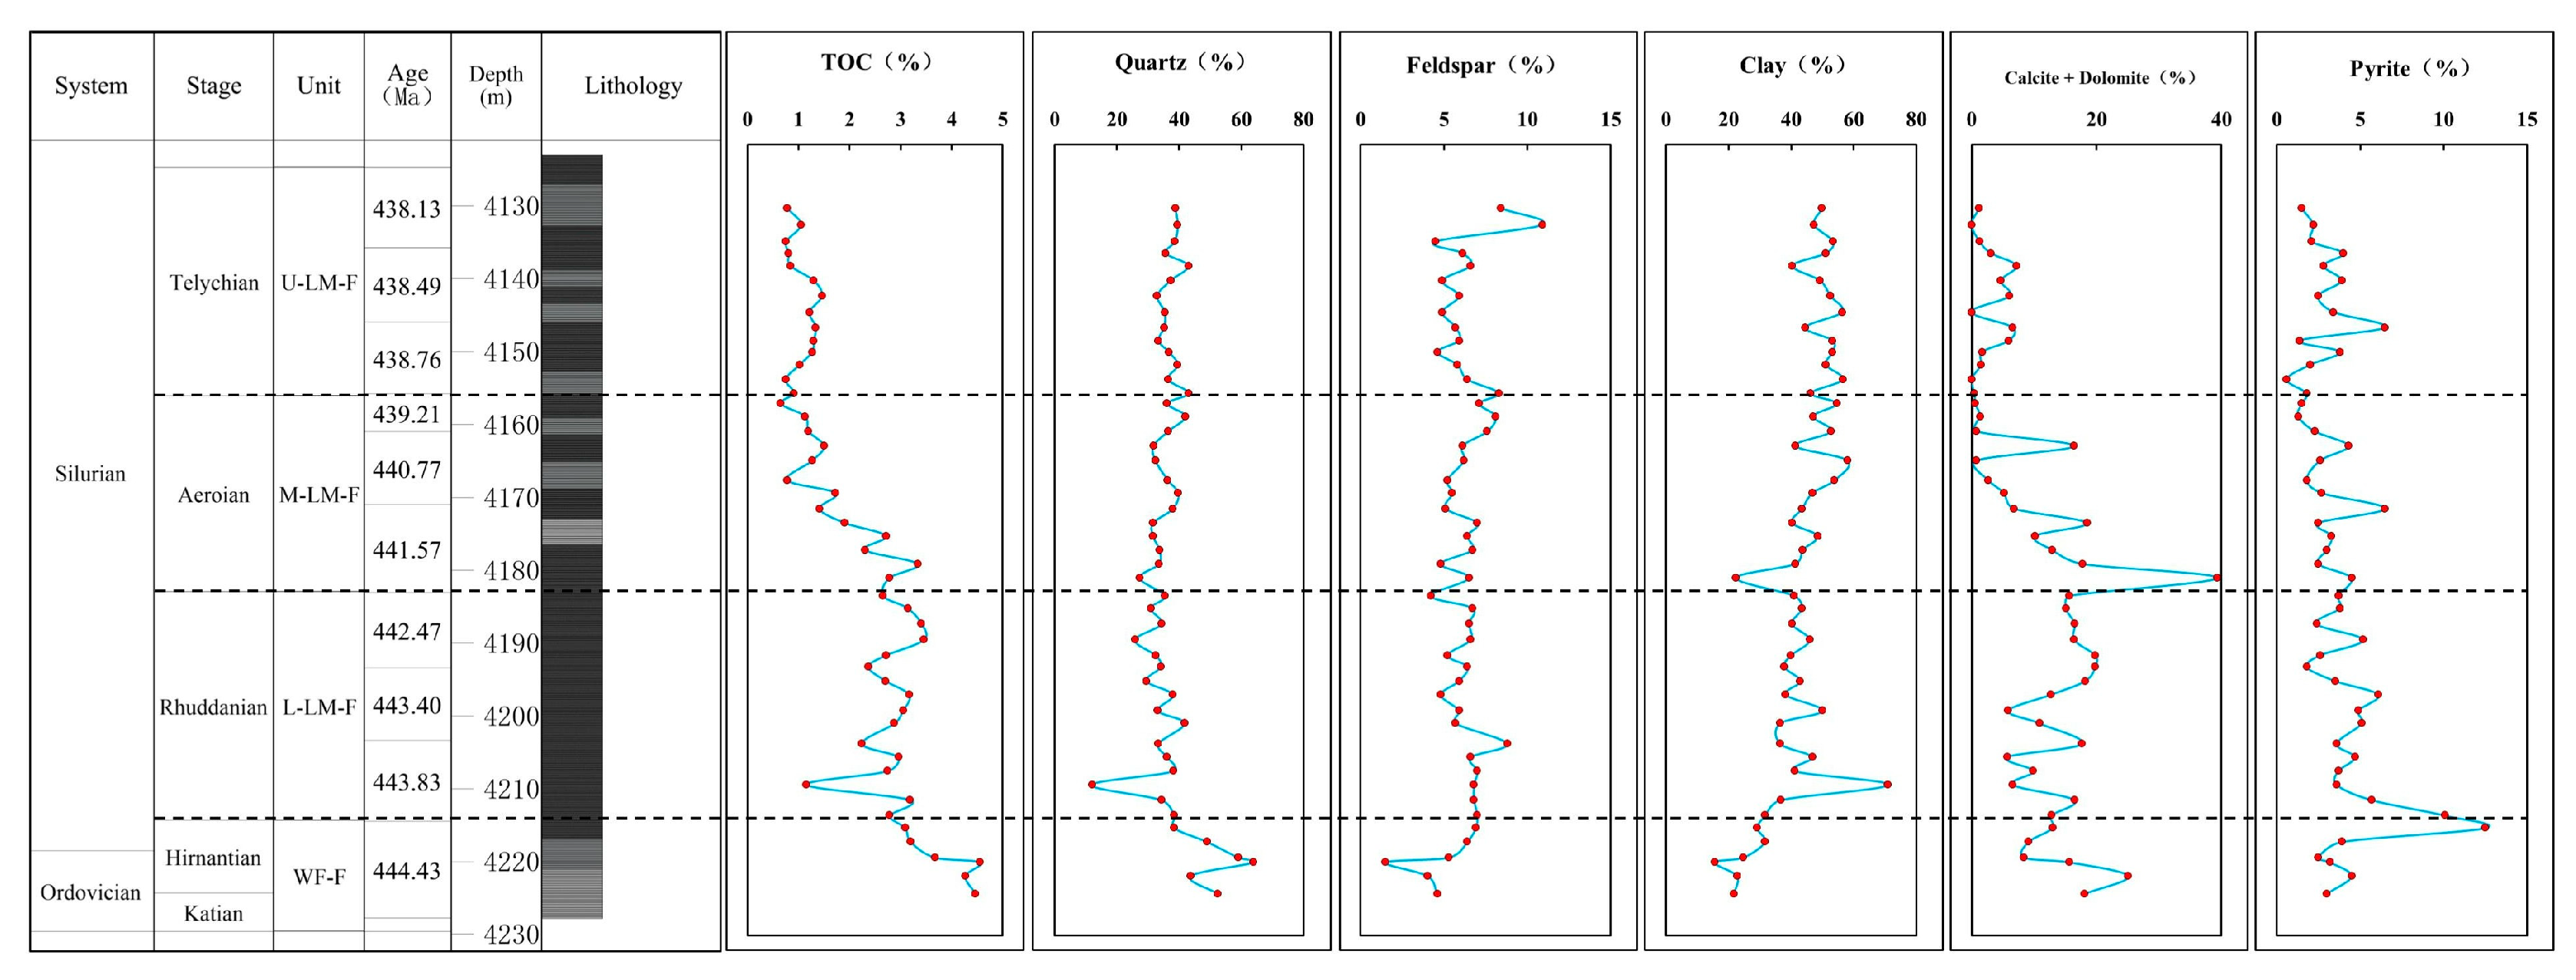
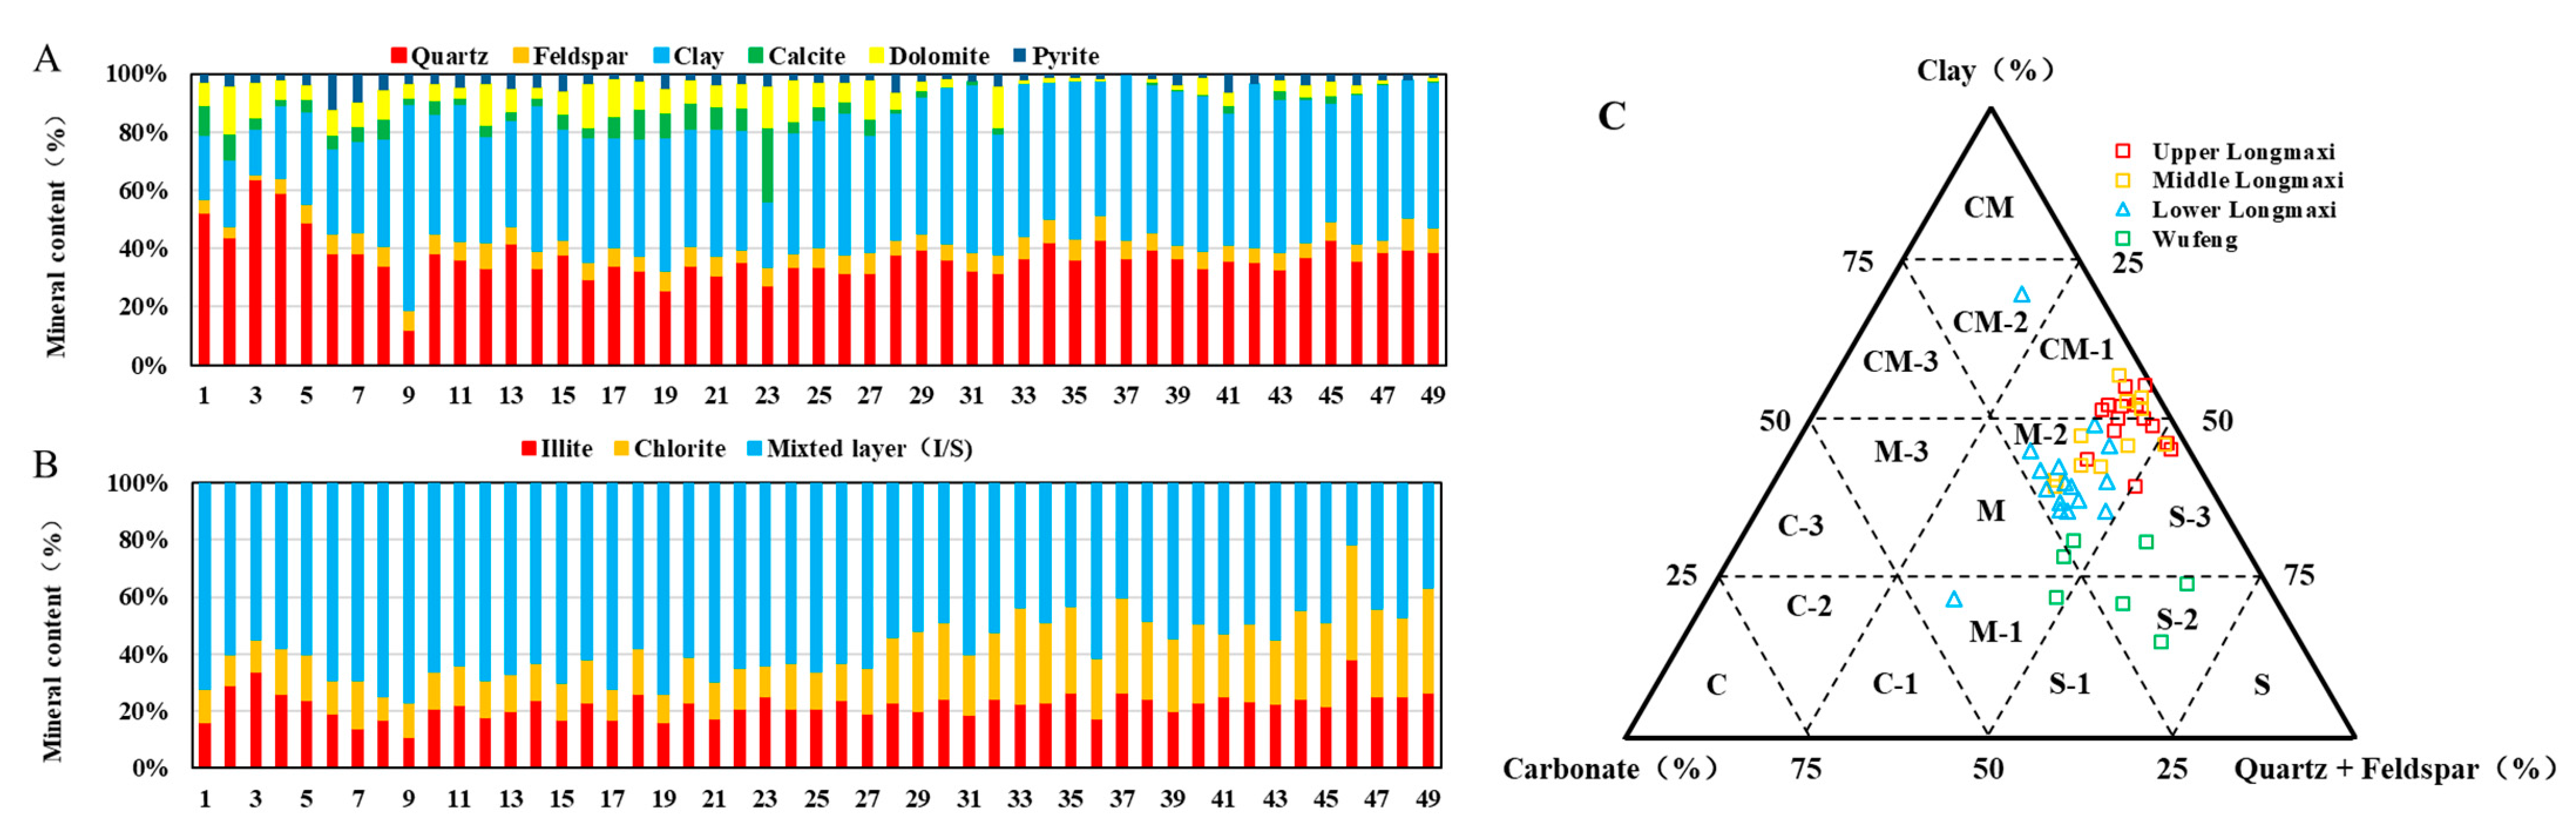
- The Wufeng and Longmaxi Formations in the Zigong area represent high-quality source rock containing type I kerogen; the thermal evolution of the organic matter is in late mature stage. The mineral compositions are dominated by quartz and clay minerals, with subordinated dolomite, feldspar, calcite, and pyrite.
- (2)
- Paleoenvironment indicators suggest that during the sedimentary period of Hirnantian and Rhuddanian, the paleoclimate condition was humid, the weathering condition was weak, anoxic conditions were present, and there was a high paleoproductivity and a low terrigenous detritus influx. During the period of Rhuddanian-Aeroian, the climate became drier and hotter, the intensity of weathering conditions became stronger, redox conditions were relatively reduced, terrigenous detritus influx increased, and paleoproductivity decreased.
- (3)
- The redox conditions were the most critical factor controlling the enrichment of OM. A combination of anoxic bottom water conditions with high primary productivity and low terrigenous input resulted in the greatest enrichment of organic matter in WF-F and L-LMX-F, making this a potential exploration and development target.
Author Contributions
Funding
Institutional Review Board Statement
Informed Consent Statement
Data Availability Statement
Acknowledgments
Conflicts of Interest
References
- Liu, Z.; Yan, D.; Yuan, D. Multiple controls on the organic matter accumulation in early Cambrian marine black shales, middle Yangtze Block, South China. J. Nat. Gas Sci. Eng. 2022, 100, 104454. [Google Scholar] [CrossRef]
- Tang, L.; Song, Y.; Jiang, S.; Jiang, Z.; Li, Z.; Yang, Y.; Li, X.; Xiao, L. Organic matter accumulation of the Wufeng-Longmaxi shales in southern Sichuan Basin: Evidence and insight from volcanism. Mar. Petrol. Geol. 2020, 120, 104564. [Google Scholar] [CrossRef]
- Zhang, L.; Li, B.; Shu, J. Heterogeneity characterization of the lower Silurian Longmaxi marine shale in the Pengshui area, South China. Int. J. Coal Geol. 2018, 195, 250–266. [Google Scholar] [CrossRef]
- Hu, Z.; Li, W.; Zhang, H. Mg isotope evidence for restriction events within the Paleotethys ocean around the Permian-Triassic transition. Earth Planet Sci. Lett. 2021, 556, 116704. [Google Scholar] [CrossRef]
- Lüning, S.; Craig, B.; Loydell, K. Lower Silurian ‘hot shales’ in North Africa and Arabia: Regional distribution and depositional model. Earth Sci. Rev. 2000, 49, 121–200. [Google Scholar] [CrossRef]
- Zou, C.; Dong, D.; Wang, Y.; Li, X.; Huang, J.; Wang, S.; Guan, Q.; Zhang, C.; Wang, H.; Honglin, L.; et al. Shale gas in China: Characteristics, challenges and prospects (II). Pet. Explor. Dev. 2015, 43, 182–196. [Google Scholar] [CrossRef]
- Zhang, L.; Xiao, D.; Lu, S. Effect of sedimentary environment on the formation of organic-rich marine shale: Insights from major/trace elements and shale composition. Int. J. Coal Geol. 2019, 204, 34–50. [Google Scholar] [CrossRef]
- Demaison, G.J.; Moore, G.T. Anoxic environments and oil source bed genesis. AAPG Bull. 1980, 64, 1179–1209. [Google Scholar] [CrossRef]
- Arthur, M.A.; Dean, W.E.; Laarkamp, K.J.C.G. Organic carbon accumulation and preservation in surface sediments on the Peru margin. Chem. Geol. 1998, 152, 273–286. [Google Scholar] [CrossRef]
- Mort, H.; Jacquat, O.; Adatte, T.; Steinmann, P.; Föllmi, K.; Matera, V.; Berner, Z.; Stüben, D. The Cenomanian/Turonian anoxic event at the Bonarelli Level in Italy and Spain: Enhanced productivity and/or better preservation? Cretac. Res. 2007, 28, 597–612. [Google Scholar] [CrossRef]
- Li, Y.; Zhang, T.; Ellis, G.S.; Shao, D. Depositional environment and organic matter accumulation of Upper Ordovician-Lower Silurian marine shale in the Upper Yangtze Platform, South China. Palaeogeogr. Palaeoclimatol. Palaeoecol. 2017, 466, 252–264. [Google Scholar] [CrossRef]
- Pedersen, T.F.; Calvert, S.E.J.A.B. Anoxia vs. productivity: What controls the formation of organic- carbon-rich sediments and sedimentary rocks? AAPG Bull. 1990, 74, 454–466. [Google Scholar]
- Liang, D.; Guo, T.; Chen, J. Some Progresses on Studies of Hydrocarbon Generation and Accumulation in Marine Sedimentary Regions, Southern China(Part 1): Distribution of Four Suits of Regional Marine Source Rocks. Mar. Orig. Pet. Geol. 2008, 13, 1–16. [Google Scholar]
- Cai, Q.; Hu, M.; Kane, O.I. Cyclic variations in paleoenvironment and organic matter accumulation of the Upper Ordovician-Lower Silurian black shale in the Middle Yangtze Region, South China: Implications for tectonic setting, paleoclimate, and sea-level change. Mar. Petrol. Geol. 2022, 136, 105477. [Google Scholar] [CrossRef]
- Taylor, S.R.; McLennan, S.M. The continental crust: Its composition and evolution. Geol. J. 1986, 21, 85–86. [Google Scholar]
- Xia, L.; Cao, J.; Hu, S.; Li, S.; Shi, C. Organic geochemistry, petrology, and conventional and unconventional hydrocarbon resource potential of Paleogene saline source rocks in eastern China: The Biyang Sag of the Nanxiang Basin. Mar. Petrol. Geol. 2019, 101, 343–354. [Google Scholar] [CrossRef]
- Wu, Y.; Lu, Y.; Jiang, S. Pore structure characterization of different lithofacies in marine shale: A case study of the Upper Ordovician Wufeng-Lower Silurian Longmaxi formation in the Sichuan Basin, SW China. J. Nat. Gas Sci. Eng. 2018, 57, 203–215. [Google Scholar] [CrossRef]
- Armstrong-Altrin, J.S.; Yong, I.L.; Kasper-Zubillaga, J.J. Mineralogy and geochemistry of sands along the Manzanillo and El Carrizal beach areas, southern Mexico: Implications for palaeoweathering, provenance and tectonic setting. Geological J. 2017, 52, 559–582. [Google Scholar] [CrossRef]
- Liu, B.; Song, Y.; Zhu, K. Mineralogy and element geochemistry of salinized lacustrine organic-rich shale in the Middle Permian Santanghu Basin: Implications for paleoenvironment, provenance, tectonic setting and shale oil potential. Mar. Petrol. Geol. 2020, 120, 104569. [Google Scholar] [CrossRef]
- Getaneh, W. Geochemistry provenance and depositional tectonic setting of the Adigrat Sandstone northern Ethiopia. J. Afr. Earth Sci. 2002, 35, 185–198. [Google Scholar] [CrossRef]
- Zhao, Z.Y.; Zhao, J.H.; Wang, H.J.; Liao, J.D.; Liu, C.M. Distribution characteristics and applications of trace elements in junggar basin. Natrual Gas Explor. Dev. 2007, 30, 30–32. [Google Scholar]
- Tan, Z.; Lu, S.; Li, W.; Zhang, Y.; He, T.; Jia, W.; Peng, P. Climate-driven variations in the depositional environment and organic matter accumulation of lacustrine mudstones: Evidence from organic and inorganic geochemistry in the Biyang Depression, Nanxiang Basin, China. Energy Fuels 2019, 33, 6946–6960. [Google Scholar] [CrossRef]
- Nesbitt, H.; Young, G. Early Proterozoic climates and plate motions inferred from major element chemistry of lutites. Nature 1982, 299, 715–717. [Google Scholar] [CrossRef]
- Hu, T.; Pang, X.; Jiang, S.; Jiang, S.; Wang, Q.; Xu, T.; Lu, K.; Huang, C.; Chen, Y.; Zheng, X. Impact of Paleosalinity, Dilution, Redox, and Paleoproductivity on Organic Matter Enrichment in a Saline Lacustrine Rift Basin: A Case Study of Paleogene Organic-Rich Shale in Dongpu Depression, Bohai Bay Basin, Eastern China. Energy Fuels 2018, 32, 5045–5061. [Google Scholar] [CrossRef]
- Qian, L.J.; Chen, H.D.; Lin, L.B.; Xu, S.L.; Ou, L.H. Geochemical Characteristics and Environmental Implications of Middle Jurassic Shaximiao Formation, Western Margin of Sichuan Basin. Acta Sedimentol. Sin. 2012, 30, 1061–1071. [Google Scholar]
- Wang, X.; Li, J.; Huang, Y.; Lu, S.; Chen, K.; Wei, Y.; Song, Z.; Zhao, R.; He, T. Influence of Paleosedimentary Environment on Shale Oil Enrichment in the Raoyang Sag, Bohai Bay Basin. Energy Fuels 2022, 36, 13597–13616. [Google Scholar] [CrossRef]
- He, T.; Lu, S.; Li, W.; Tan, Z.; Zhang, X. Effect of Salinity on Source Rock Formation and Its Control on the Oil Content in Shales in the Hetaoyuan Formation from the Biyang Depression, Nanxiang Basin, Central China. Energy Fuels 2018, 32, 6698–6707. [Google Scholar] [CrossRef]
- Li, D.; Li, R.; Zhu, Z.; Wu, X.; Cheng, J.; Liu, F.; Zhao, B. Origin of organic matter and paleo-sedimentary environment reconstruction of the Triassic oil shale in Tongchuan City, southern Ordos Basin (China). Fuel 2017, 208, 223–235. [Google Scholar] [CrossRef]
- Jones, B.; Manning, D.A. Comparison of geochemical indices used for the interpretation of palaeoredox conditions in ancient mudstones. Chem. Geol. 1994, 111, 111–129. [Google Scholar] [CrossRef]
- Tribovillard, N.; Algeo, T.J.; Lyons, T. Trace metals as paleoredox and paleoproductivity proxies: An update. Chem. Geol. 2006, 232, 12–32. [Google Scholar] [CrossRef]
- Algeo, T.J.; Tribovillard, N. Environmental Analysis of Paleoceanographic Systems Based on Molybdenum–Uranium Covariation. Chem. Geol. 2009, 268, 211–225. [Google Scholar] [CrossRef]
- Li, N.; Li, C.; Algeo, T.J.; Cheng, M.; Jin, C.; Zhu, G.; Fan, J.; Sun, Z. Redox changes in the outer Yangtze Sea (South China) through the Hirnantian Glaciation and their implications for the end-Ordovician biocrisis. Earth Sci. Rev. 2021, 212, 103443. [Google Scholar] [CrossRef]
- Goldberg, E.D.; Arrhenius, G.O.S. Chemistry of Pacific pelagic sediments. Geochim. Cosmochim. Ac. 1958, 13, 153–212. [Google Scholar] [CrossRef]
- Jack, D.; Erwin, S.; Mitch, L. Barium in Deep-Sea Sediment: A Geochemical Proxy for Paleoproductivity. Paleoceanography 2010, 7, 163–181. [Google Scholar]
- Robert, W. Nutrient Limitation of Net Primary Production in Marine Ecosystems. Annu. Rev. Ecol. Syst. 1988, 19, 89–110. [Google Scholar]
- Murphy, A.E.; Sageman, B.B.; Hollander, D.J.; Lyons, T.W.; Brett, C.E. Black shale deposition and faunal overturn in the Devonian Appalachian Basin: Clastic starvation, seasonal water-column mixing, and efficient biolimiting nutrient recycling. Paleoceanography 2000, 15, 280–291. [Google Scholar] [CrossRef]
- Hao, F.; Tian, J.; Xu, Q. Paleoenvironment evolution of the lacustrine organic-rich shales in the second member of Kongdian Formation of Cangdong Sag, Bohai Bay Basin, China: Implications for organic matter accumulation. Mar. Petrol. Geol. 2021, 133, 105244. [Google Scholar]


| Sample ID | Depth (m) | Formation | Sapropelinite (%) | Vitrinite (%) | TI | Type | Rb (%) | Roc (%) | Tmax (°C) |
|---|---|---|---|---|---|---|---|---|---|
| Z303-7-① | 4224.72 | Wufeng | 98 | 2 | 96.5 | Ⅰ | 3.2 | 2.4 | 652 |
| Z303-14-③ | 4218.07 | Longmaxi | 93 | 7 | 87.8 | Ⅰ | 3.5 | 2.6 | 651 |
| Z303-16-⑤ | 4215.52 | Longmaxi | 96 | 4 | 93.0 | Ⅰ | 3.0 | 2.3 | 755 |
| Z303-18-⑦ | 4214.52 | Longmaxi | 89 | 11 | 80.8 | Ⅰ | 3.4 | 2.5 | 654 |
| Z303-25-⑨ | 4208.225 | Longmaxi | 98 | 2 | 96.5 | Ⅰ | 3.0 | 2.3 | 755 |
| Z303-35 | 4198.245 | Longmaxi | 96 | 4 | 93.0 | Ⅰ | 3.4 | 2.5 | 663 |
| Z303-43 | 4189.525 | Longmaxi | 97 | 3 | 94.8 | Ⅰ | 3.1 | 2.3 | 652 |
| Z303-53-⑩ | 4179.395 | Longmaxi | 97 | 3 | 94.8 | Ⅰ | 3.2 | 2.4 | 657 |
| Z303-64 | 4168.505 | Longmaxi | 95 | 5 | 91.3 | Ⅰ | 3.1 | 2.3 | 654 |
| Z303-77-⑪ | 4154.86 | Longmaxi | 98 | 2 | 96.5 | Ⅰ | 3.4 | 2.5 | 635 |
| Z303-97-⑫ | 4136.06 | Longmaxi | 96 | 4 | 93.0 | Ⅰ | 3.1 | 2.3 | 650 |
| Sample ID | Major Elements, % | Trace Elements, ppm | ||||||||||||||||||||
|---|---|---|---|---|---|---|---|---|---|---|---|---|---|---|---|---|---|---|---|---|---|---|
| SiO2 | Al2O3 | CaO | K2O | FeO | MgO | Fe2O3 | Na2O | TiO2 | P2O5 | MnO | Ba | V | Sr | Zn | B | Cr | Ni | Cu | Mo | Co | U | |
| Z303-13 | 64.81 | 6.33 | 9.17 | 1.54 | 0.70 | 1.36 | 1.50 | 0.54 | 0.41 | 0.142 | 0.035 | 1555 | 275 | 192 | 327 | 54.3 | 50.8 | 137 | 125 | 24.4 | 7.83 | 6.6 |
| Z303-15-④ | 60.64 | 7.50 | 9.24 | 1.87 | 0.84 | 1.92 | 2.27 | 0.48 | 0.40 | 0.120 | 0.048 | 2018 | 165 | 207 | 80.5 | 50.8 | 40.9 | 110 | 65.7 | 65.1 | 13.8 | 28.1 |
| Z303-17-⑥ | 74.80 | 4.91 | 4.87 | 1.30 | 0.86 | 1.28 | 1.29 | 0.30 | 0.26 | 0.067 | 0.038 | 1666 | 182 | 104 | 210 | 51 | 33.5 | 89.1 | 40.4 | 38.5 | 7.45 | 12.7 |
| Z303-19-⑧ | 74.71 | 7.27 | 2.98 | 1.82 | 1.26 | 1.37 | 1.41 | 0.52 | 0.40 | 0.082 | 0.027 | 2002 | 112 | 88.4 | 130 | 67.5 | 41 | 61.4 | 41.2 | 18.2 | 9.27 | 7.36 |
| Z303-21 | 68.64 | 9.74 | 4.13 | 2.35 | 1.60 | 1.81 | 2.16 | 0.67 | 0.52 | 0.088 | 0.033 | 2430 | 120 | 118 | 92.4 | 97 | 53.8 | 65.8 | 46.4 | 20.8 | 12 | 6.8 |
| Z303-23 | 61.46 | 10.75 | 4.37 | 2.45 | 1.66 | 2.16 | 5.29 | 0.75 | 0.58 | 0.104 | 0.037 | 1146 | 109 | 113 | 66.1 | 77.5 | 62.6 | 70.3 | 55 | 22.4 | 13.3 | 8.27 |
| Z303-25-⑨ | 59.02 | 11.52 | 5.19 | 2.60 | 1.70 | 2.36 | 4.99 | 0.83 | 0.62 | 0.106 | 0.040 | 1316 | 106 | 124 | 63.6 | 93.8 | 61.1 | 68.8 | 54.3 | 25.9 | 14.1 | 7.6 |
| Z303-27 | 53.17 | 13.21 | 7.96 | 3.06 | 2.00 | 3.09 | 2.94 | 0.89 | 0.62 | 0.089 | 0.058 | 2661 | 82.4 | 165 | 43.5 | 89.4 | 60.3 | 37.9 | 63.4 | 23 | 15.4 | 7.79 |
| Z303-29 | 49.86 | 26.04 | 1.84 | 6.02 | 2.08 | 3.15 | 2.32 | 1.16 | 0.62 | 0.120 | 0.026 | 4904 | 75 | 147 | 63.6 | 272 | 30 | 26.7 | 22.3 | 13.9 | 8.84 | 7.02 |
| Z303-31 | 59.92 | 13.44 | 5.07 | 3.17 | 2.22 | 2.71 | 1.97 | 0.87 | 0.64 | 0.089 | 0.038 | 2718 | 129 | 140 | 100 | 94.7 | 65.1 | 70 | 49.8 | 19 | 13.5 | 7.26 |
| Z303-33 | 58.51 | 15.37 | 2.94 | 3.79 | 2.38 | 2.79 | 2.46 | 0.95 | 0.70 | 0.108 | 0.031 | 3260 | 139 | 126 | 75.7 | 147 | 73 | 54.9 | 64.1 | 21.3 | 17.2 | 9.12 |
| Z303-35 | 56.20 | 15.12 | 5.09 | 3.62 | 2.42 | 3.24 | 2.34 | 0.89 | 0.74 | 0.102 | 0.051 | 5121 | 132 | 169 | 76.4 | 110 | 64.2 | 70.7 | 55.9 | 18.4 | 15 | 7.9 |
| Z303-37 | 56.51 | 15.27 | 4.33 | 3.91 | 2.22 | 3.06 | 2.70 | 0.78 | 0.64 | 0.100 | 0.038 | 3430 | 172 | 138 | 88.1 | 124 | 76.3 | 91.2 | 73.3 | 21.1 | 16.5 | 10.4 |
| Z303-39 | 58.84 | 15.65 | 2.76 | 3.95 | 2.38 | 2.89 | 3.09 | 0.84 | 0.68 | 0.112 | 0.028 | 2719 | 141 | 125 | 77.9 | 113 | 80 | 65.1 | 70.6 | 23.3 | 18 | 11.9 |
| Z303-41 | 58.47 | 13.57 | 4.32 | 3.41 | 2.50 | 2.65 | 2.79 | 0.72 | 0.61 | 0.100 | 0.036 | 2051 | 128 | 131 | 68.6 | 108 | 68.5 | 69.4 | 62.1 | 24.2 | 16.4 | 10.9 |
| Z303-43 | 50.45 | 15.40 | 6.19 | 3.82 | 3.10 | 3.92 | 2.17 | 0.81 | 0.62 | 0.104 | 0.062 | 3262 | 162 | 162 | 98.6 | 98.8 | 72.1 | 72.8 | 50.3 | 13.5 | 15.7 | 6.58 |
| Z303-45 | 49.34 | 13.77 | 8.36 | 3.43 | 2.78 | 3.47 | 1.51 | 0.71 | 0.59 | 0.087 | 0.067 | 3287 | 202 | 179 | 134 | 87.9 | 65.2 | 73.2 | 47.1 | 16.3 | 12.7 | 6.13 |
| Z303-47 | 50.08 | 14.91 | 8.38 | 3.65 | 2.66 | 3.25 | 1.91 | 0.78 | 0.65 | 0.102 | 0.053 | 3260 | 195 | 185 | 128 | 98.7 | 70.4 | 88.6 | 50.9 | 23 | 14.8 | 10.4 |
| Z303-49 | 48.66 | 16.94 | 7.08 | 4.13 | 2.65 | 3.54 | 2.74 | 0.92 | 0.70 | 0.120 | 0.043 | 2804 | 127 | 176 | 55.2 | 117 | 73 | 61.5 | 68 | 26.8 | 19.6 | 12.4 |
| Z303-51 | 50.48 | 17.09 | 6.07 | 4.22 | 2.33 | 3.24 | 2.39 | 0.99 | 0.78 | 0.121 | 0.037 | 4162 | 201 | 169 | 102 | 148 | 78.5 | 101 | 70.1 | 30.2 | 18.8 | 14.1 |
| Z303-53-⑩ | 50.82 | 17.81 | 5.88 | 4.33 | 2.52 | 3.22 | 2.59 | 1.00 | 0.78 | 0.133 | 0.037 | 3815 | 188 | 164 | 126 | 140 | 72.1 | 99.4 | 64 | 33.9 | 17.1 | 12 |
| Z303-55 | 50.79 | 16.40 | 7.79 | 3.89 | 2.64 | 3.17 | 1.64 | 1.01 | 0.83 | 0.132 | 0.044 | 6743 | 157 | 185 | 85 | 110 | 73.2 | 81.6 | 53.9 | 21.1 | 16 | 8.8 |
| Z303-57 | 40.02 | 13.57 | 15.28 | 3.01 | 2.28 | 3.51 | 2.11 | 0.95 | 0.69 | 0.204 | 0.066 | 2985 | 71.1 | 312 | 52 | 97.3 | 52.8 | 32.3 | 54.9 | 9.15 | 10.7 | 3.47 |
| Z303-59 | 51.22 | 15.79 | 5.95 | 3.98 | 2.98 | 3.63 | 2.04 | 0.83 | 0.67 | 0.120 | 0.059 | 3645 | 490 | 153 | 211 | 117 | 80.2 | 112 | 61 | 25.6 | 14 | 11.8 |
| Z303-61 | 52.90 | 15.71 | 5.68 | 3.96 | 2.70 | 3.21 | 2.35 | 0.84 | 0.67 | 0.113 | 0.049 | 3608 | 465 | 145 | 147 | 112 | 78.5 | 108 | 60.6 | 21.1 | 14.9 | 11.3 |
| Z303-63 | 56.48 | 16.53 | 3.72 | 4.27 | 2.52 | 3.03 | 2.29 | 0.95 | 0.73 | 0.112 | 0.043 | 5096 | 331 | 131 | 141 | 123 | 85.1 | 98.2 | 57.7 | 22.9 | 15.3 | 13.9 |
| Z303-65 | 50.38 | 16.80 | 6.46 | 4.16 | 2.74 | 3.70 | 2.47 | 0.93 | 0.68 | 0.113 | 0.094 | 4930 | 293 | 165 | 131 | 103 | 78 | 78.6 | 50.6 | 16.1 | 13 | 9 |
| Z303-67 | 58.82 | 16.27 | 2.59 | 4.16 | 3.26 | 3.13 | 2.63 | 0.84 | 0.60 | 0.093 | 0.053 | 3283 | 255 | 112 | 134 | 121 | 83.9 | 80.1 | 54.5 | 11.1 | 15.8 | 8.2 |
| Z303-69 | 57.08 | 16.62 | 2.45 | 4.30 | 3.64 | 3.29 | 2.47 | 0.83 | 0.58 | 0.094 | 0.065 | 3095 | 261 | 105 | 115 | 107 | 87.2 | 76.3 | 60.5 | 10.4 | 16.1 | 8.74 |
| Z303-71 | 60.95 | 17.46 | 0.86 | 4.44 | 4.20 | 3.43 | 2.27 | 0.90 | 0.60 | 0.107 | 0.051 | 3281 | 169 | 90.3 | 136 | 130 | 91.4 | 62.1 | 44 | 5.03 | 18.8 | 4.97 |
| Z303-73 | 57.72 | 18.34 | 1.41 | 4.78 | 4.08 | 3.45 | 2.12 | 0.95 | 0.61 | 0.095 | 0.052 | 3344 | 191 | 106 | 127 | 125 | 95.6 | 65.8 | 81.5 | 7.92 | 16.5 | 4.72 |
| Z303-75 | 51.43 | 17.48 | 3.97 | 4.23 | 4.07 | 3.92 | 3.07 | 0.96 | 0.57 | 0.092 | 0.148 | 3000 | 195 | 133 | 115 | 109 | 87.3 | 76.3 | 59.6 | 8.95 | 18.3 | 3.9 |
| Z303-77-⑪ | 61.63 | 17.72 | 0.57 | 4.49 | 4.60 | 3.33 | 1.81 | 1.06 | 0.58 | 0.084 | 0.050 | 3022 | 178 | 82.7 | 128 | 141 | 95.4 | 60.5 | 50.4 | 7.08 | 17.6 | 3.47 |
| Z303-79 | 60.54 | 17.53 | 0.68 | 4.41 | 4.32 | 3.38 | 2.08 | 1.01 | 0.59 | 0.088 | 0.058 | 3103 | 171 | 82.6 | 73.7 | 106 | 92.3 | 55.2 | 34 | 3.62 | 16.6 | 3.44 |
| Z303-81 | 60.43 | 17.72 | 0.65 | 4.46 | 4.46 | 3.48 | 2.18 | 1.01 | 0.61 | 0.089 | 0.059 | 2962 | 178 | 82.2 | 109 | 128 | 95.8 | 56.4 | 52.4 | 3.69 | 17.8 | 3.16 |
| Z303-83 | 60.38 | 17.35 | 0.76 | 4.37 | 4.86 | 3.39 | 1.60 | 1.01 | 0.61 | 0.090 | 0.064 | 2832 | 220 | 83.8 | 191 | 122 | 94.1 | 60 | 51.6 | 7.3 | 17.3 | 3.91 |
| Z303-85 | 60.36 | 17.54 | 0.41 | 4.45 | 4.52 | 3.37 | 2.08 | 0.99 | 0.58 | 0.091 | 0.052 | 2913 | 174 | 74.8 | 94.4 | 112 | 93.8 | 60 | 42.1 | 4.07 | 17.8 | 2.83 |
| Z303-87 | 60.18 | 17.96 | 0.78 | 4.50 | 4.43 | 3.46 | 2.14 | 1.03 | 0.65 | 0.097 | 0.054 | 3608 | 203 | 87.4 | 130 | 139 | 93.8 | 65.3 | 73.6 | 8.5 | 18.4 | 3.77 |
| Z303-89 | 58.83 | 18.15 | 1.08 | 4.63 | 3.74 | 3.43 | 3.10 | 1.03 | 0.59 | 0.086 | 0.059 | 3054 | 205 | 87.8 | 95.6 | 135 | 93.1 | 71.6 | 58.1 | 9.12 | 18.3 | 3.87 |
| Z303-91 | 58.19 | 17.59 | 1.53 | 4.42 | 4.10 | 3.26 | 2.19 | 1.16 | 0.59 | 0.085 | 0.068 | 2898 | 246 | 95 | 200 | 106 | 93.3 | 74.4 | 55.2 | 10.6 | 17.1 | 3.93 |
| Z303-93 | 56.58 | 17.68 | 2.18 | 4.42 | 3.46 | 3.27 | 3.16 | 1.11 | 0.64 | 0.088 | 0.080 | 3753 | 175 | 111 | 113 | 128 | 89.4 | 76.3 | 57 | 10.6 | 16.9 | 5.81 |
| Z303-95 | 58.08 | 17.82 | 0.85 | 4.53 | 3.68 | 3.24 | 3.16 | 1.07 | 0.57 | 0.089 | 0.050 | 3000 | 155 | 83 | 87.8 | 113 | 92.6 | 66.7 | 52.3 | 9.2 | 17.8 | 4.86 |
| Z303-97-⑫ | 56.35 | 17.83 | 2.57 | 4.45 | 3.56 | 3.17 | 2.69 | 1.18 | 0.64 | 0.087 | 0.069 | 2939 | 133 | 114 | 125 | 106 | 77.4 | 70.9 | 53.4 | 13.7 | 17.1 | 7.49 |
| Z303-99 | 59.48 | 17.59 | 1.21 | 4.39 | 3.82 | 3.13 | 2.84 | 1.16 | 0.57 | 0.089 | 0.057 | 2877 | 147 | 89.3 | 142 | 152 | 89.2 | 77.6 | 78 | 12.9 | 20.2 | 4.64 |
| Z303-101 | 60.16 | 14.77 | 3.71 | 3.64 | 3.90 | 2.94 | 1.94 | 0.94 | 0.50 | 0.075 | 0.144 | 2533 | 111 | 120 | 89.2 | 99.5 | 75.2 | 45.3 | 42.4 | 7.16 | 14.6 | 2.83 |
| Z303-103 | 58.80 | 17.84 | 1.17 | 4.47 | 4.28 | 3.40 | 2.70 | 1.06 | 0.56 | 0.089 | 0.070 | 2812 | 145 | 90.1 | 94.4 | 106 | 94.9 | 65 | 50.5 | 7.39 | 18.2 | 3.41 |
| Z303-105 | 59.54 | 18.12 | 0.85 | 4.66 | 4.48 | 3.36 | 2.06 | 1.06 | 0.56 | 0.092 | 0.058 | 2921 | 138 | 86.8 | 104 | 123 | 92.1 | 53 | 66.1 | 5.42 | 19.2 | 2.91 |
| Z303-107 | 60.02 | 17.98 | 0.59 | 4.48 | 5.32 | 3.28 | 1.26 | 1.24 | 0.57 | 0.090 | 0.053 | 2741 | 148 | 74.7 | 115 | 104 | 95.2 | 58 | 52.5 | 6.18 | 17.5 | 3.48 |
| Z303-109 | 59.62 | 18.28 | 0.54 | 4.65 | 5.06 | 3.34 | 1.52 | 1.16 | 0.58 | 0.093 | 0.054 | 2657 | 142 | 74.6 | 109 | 105 | 97.2 | 54.2 | 46.5 | 5.11 | 18.8 | 2.17 |
| Sample ID | Depth | TOC | Sr/Cu | C-Value | CIA | S | UEF | MoEF | Cu/Ti | P/Ti | Al2O3 | Unit |
|---|---|---|---|---|---|---|---|---|---|---|---|---|
| Z303-13 | 4219.12 | 4.47 | 8.58 | 0.07 | 80.99 | 3.52 | 6.35 | 72.81 | 508.13 | 0.29 | 6.33 | WF-F |
| Z303-15-④ | 4216.65 | 4.27 | 8.15 | 0.07 | 42.45 | 3.55 | 22.83 | 163.96 | 273.75 | 0.25 | 7.50 | |
| Z303-17-⑥ | 4214.74 | 4.56 | 7.57 | 0.13 | 73.79 | 3.04 | 15.76 | 148.11 | 258.97 | 0.22 | 4.91 | |
| Z303-19-⑧ | 4214.06 | 3.67 | 5.15 | 0.20 | 67.94 | 3.02 | 6.17 | 47.29 | 171.67 | 0.17 | 7.27 | |
| Z303-21 | 4211.895 | 3.20 | 6.54 | 0.19 | 54.50 | 3.07 | 4.25 | 40.34 | 148.72 | 0.14 | 9.74 | |
| Z303-23 | 4209.955 | 3.09 | 5.05 | 0.19 | 43.16 | 2.81 | 4.69 | 39.36 | 158.05 | 0.15 | 10.75 | |
| Z303-25-⑨ | 4208.225 | 2.79 | 5.28 | 0.17 | 41.60 | 2.04 | 4.02 | 42.47 | 145.97 | 0.14 | 11.52 | |
| Z303-27 | 4206.065 | 3.19 | 6.60 | 0.15 | 33.62 | 2.59 | 3.59 | 32.89 | 170.43 | 0.12 | 13.21 | L-LM |
| Z303-29 | 4203.935 | 1.16 | 6.59 | 0.17 | 55.74 | 1.16 | 1.64 | 10.08 | 59.95 | 0.16 | 16.04 | |
| Z303-31 | 4202.035 | 2.75 | 2.81 | 0.20 | 53.50 | 1.54 | 3.29 | 26.7 | 129.69 | 0.12 | 13.44 | |
| Z303-33 | 4200.105 | 2.96 | 3.97 | 0.24 | 44.02 | 1.97 | 3.62 | 26.18 | 152.62 | 0.13 | 15.37 | |
| Z303-35 | 4198.245 | 2.24 | 3.02 | 0.20 | 47.15 | 1.90 | 3.18 | 22.99 | 125.90 | 0.12 | 15.12 | |
| Z303-37 | 4195.405 | 2.88 | 4.88 | 0.20 | 47.02 | 1.79 | 4.15 | 26.1 | 190.89 | 0.13 | 15.27 | |
| Z303-39 | 4193.645 | 3.05 | 3.77 | 0.24 | 42.58 | 2.34 | 4.63 | 28.12 | 173.04 | 0.14 | 15.65 | |
| Z303-41 | 4191.425 | 3.17 | 3.11 | 0.24 | 41.98 | 1.71 | 4.89 | 33.69 | 169.67 | 0.14 | 13.57 | |
| Z303-43 | 4189.525 | 2.71 | 3.22 | 0.23 | 52.61 | 1.32 | 2.6 | 16.56 | 135.22 | 0.14 | 15.40 | |
| Z303-45 | 4187.545 | 2.37 | 5.80 | 0.19 | 61.10 | 1.66 | 2.71 | 22.36 | 133.05 | 0.12 | 13.77 | |
| Z303-47 | 4185.945 | 2.72 | 5.63 | 0.18 | 56.88 | 1.44 | 4.25 | 29.14 | 130.51 | 0.13 | 14.91 | |
| Z303-49 | 4183.805 | 3.46 | 5.59 | 0.18 | 35.03 | 1.59 | 4.46 | 29.88 | 161.90 | 0.14 | 16.94 | |
| Z303-51 | 4181.585 | 3.41 | 5.41 | 0.17 | 47.86 | 1.64 | 5.03 | 33.38 | 149.79 | 0.13 | 17.09 | |
| Z303-53-⑩ | 4179.395 | 3.14 | 6.56 | 0.19 | 53.72 | 2.03 | 4.11 | 35.95 | 136.75 | 0.14 | 17.81 | |
| Z303-55 | 4177.695 | 2.66 | 5.43 | 0.17 | 46.52 | 1.31 | 3.27 | 24.3 | 108.23 | 0.13 | 16.40 | |
| Z303-57 | 4175.205 | 2.78 | 7.68 | 0.11 | 43.47 | 2.59 | 1.56 | 12.74 | 132.61 | 0.25 | 13.57 | |
| Z303-59 | 4173.255 | 3.34 | 2.51 | 0.23 | 66.08 | 1.67 | 4.55 | 30.62 | 151.74 | 0.15 | 15.79 | M-LM |
| Z303-61 | 4171.305 | 2.30 | 2.39 | 0.21 | 59.04 | 1.92 | 4.38 | 25.37 | 150.75 | 0.14 | 15.71 | |
| Z303-63 | 4169.365 | 2.72 | 2.27 | 0.22 | 56.11 | 1.58 | 5.12 | 26.17 | 131.74 | 0.13 | 16.53 | |
| Z303-65 | 4167.565 | 1.91 | 3.26 | 0.20 | 57.37 | 1.50 | 3.26 | 18.1 | 124.02 | 0.14 | 16.80 | |
| Z303-67 | 4165.575 | 1.41 | 2.06 | 0.32 | 57.99 | 2.01 | 3.07 | 12.89 | 151.39 | 0.13 | 16.27 | |
| Z303-69 | 4163.415 | 1.73 | 1.74 | 0.36 | 53.65 | 1.60 | 3.2 | 11.82 | 173.85 | 0.14 | 16.62 | |
| Z303-71 | 4161.635 | 0.78 | 1.25 | 0.45 | 58.00 | 1.34 | 1.73 | 5.44 | 122.22 | 0.15 | 17.46 | |
| Z303-73 | 4158.91 | 1.27 | 1.30 | 0.40 | 54.78 | 1.13 | 1.57 | 8.16 | 222.68 | 0.13 | 18.34 | |
| Z303-75 | 4156.88 | 1.50 | 2.23 | 0.34 | 53.87 | 1.55 | 1.36 | 9.67 | 174.27 | 0.14 | 17.48 | |
| Z303-77-⑪ | 4154.86 | 1.20 | 1.64 | 0.51 | 55.14 | 0.85 | 1.19 | 7.55 | 144.83 | 0.12 | 17.72 | |
| Z303-79 | 4152.77 | 1.13 | 1.59 | 0.47 | 42.84 | 0.95 | 1.2 | 3.9 | 96.05 | 0.13 | 17.53 | |
| Z303-81 | 4151 | 0.65 | 1.57 | 0.49 | 51.89 | 0.99 | 1.09 | 3.93 | 143.17 | 0.12 | 17.72 | |
| Z303-83 | 4149.56 | 0.91 | 1.62 | 0.53 | 64.96 | 0.81 | 1.37 | 7.95 | 140.98 | 0.13 | 17.35 | U-LM |
| Z303-85 | 4147.66 | 0.75 | 1.78 | 0.51 | 48.65 | 0.89 | 0.98 | 4.38 | 120.98 | 0.13 | 17.54 | |
| Z303-87 | 4145.63 | 1.02 | 1.19 | 0.47 | 55.68 | 0.89 | 1.28 | 8.94 | 188.72 | 0.13 | 17.96 | |
| Z303-89 | 4143.83 | 1.27 | 1.51 | 0.39 | 47.96 | 1.21 | 1.3 | 9.49 | 164.12 | 0.12 | 18.15 | |
| Z303-91 | 4142.26 | 1.30 | 1.72 | 0.42 | 65.44 | 1.28 | 1.36 | 11.38 | 155.93 | 0.12 | 17.59 | |
| Z303-93 | 4140.43 | 1.34 | 1.95 | 0.33 | 52.57 | 1.40 | 2 | 11.32 | 148.44 | 0.12 | 17.68 | |
| Z303-95 | 4138.29 | 1.22 | 1.59 | 0.40 | 45.92 | 0.96 | 1.66 | 9.75 | 152.92 | 0.13 | 17.82 | |
| Z303-97-⑫ | 4136.06 | 1.46 | 2.13 | 0.33 | 57.28 | 1.31 | 2.56 | 14.51 | 139.06 | 0.11 | 17.83 | |
| Z303-99 | 4133.93 | 1.30 | 1.14 | 0.40 | 57.90 | 0.82 | 1.61 | 13.85 | 228.07 | 0.13 | 17.59 | |
| Z303-101 | 4131.88 | 0.84 | 2.83 | 0.38 | 51.15 | 1.52 | 1.17 | 9.16 | 141.33 | 0.13 | 14.77 | |
| Z303-103 | 4130.13 | 0.81 | 1.78 | 0.45 | 47.56 | 0.88 | 1.16 | 7.82 | 150.30 | 0.13 | 17.84 | |
| Z303-105 | 4128.5 | 0.76 | 1.31 | 0.47 | 51.27 | 0.93 | 0.98 | 5.65 | 196.73 | 0.14 | 18.12 | |
| Z303-107 | 4126.17 | 1.05 | 1.42 | 0.58 | 52.80 | 0.95 | 1.18 | 6.49 | 153.51 | 0.13 | 17.98 | |
| Z303-109 | 4123.91 | 0.78 | 1.60 | 0.54 | 51.19 | 0.96 | 0.72 | 5.28 | 133.62 | 0.14 | 18.28 |
Disclaimer/Publisher’s Note: The statements, opinions and data contained in all publications are solely those of the individual author(s) and contributor(s) and not of MDPI and/or the editor(s). MDPI and/or the editor(s) disclaim responsibility for any injury to people or property resulting from any ideas, methods, instructions or products referred to in the content. |
© 2023 by the authors. Licensee MDPI, Basel, Switzerland. This article is an open access article distributed under the terms and conditions of the Creative Commons Attribution (CC BY) license (https://creativecommons.org/licenses/by/4.0/).
Share and Cite
Li, H.; He, T.; Li, W. Paleoenvironment Change and Organic Matter Accumulation of Marine Shale in the Zigong Area, Southern Sichuan Basin, China: A Case Study of Well Z303. Energies 2023, 16, 4015. https://doi.org/10.3390/en16104015
Li H, He T, Li W. Paleoenvironment Change and Organic Matter Accumulation of Marine Shale in the Zigong Area, Southern Sichuan Basin, China: A Case Study of Well Z303. Energies. 2023; 16(10):4015. https://doi.org/10.3390/en16104015
Chicago/Turabian StyleLi, Huimin, Taohua He, and Weifeng Li. 2023. "Paleoenvironment Change and Organic Matter Accumulation of Marine Shale in the Zigong Area, Southern Sichuan Basin, China: A Case Study of Well Z303" Energies 16, no. 10: 4015. https://doi.org/10.3390/en16104015