
Well-Logging Constraints on Gas Hydrate Saturation in Unconsolidated Fine-Grained Reservoirs in the Northern South China Sea
 ,
,
Abstract
:1. Introduction
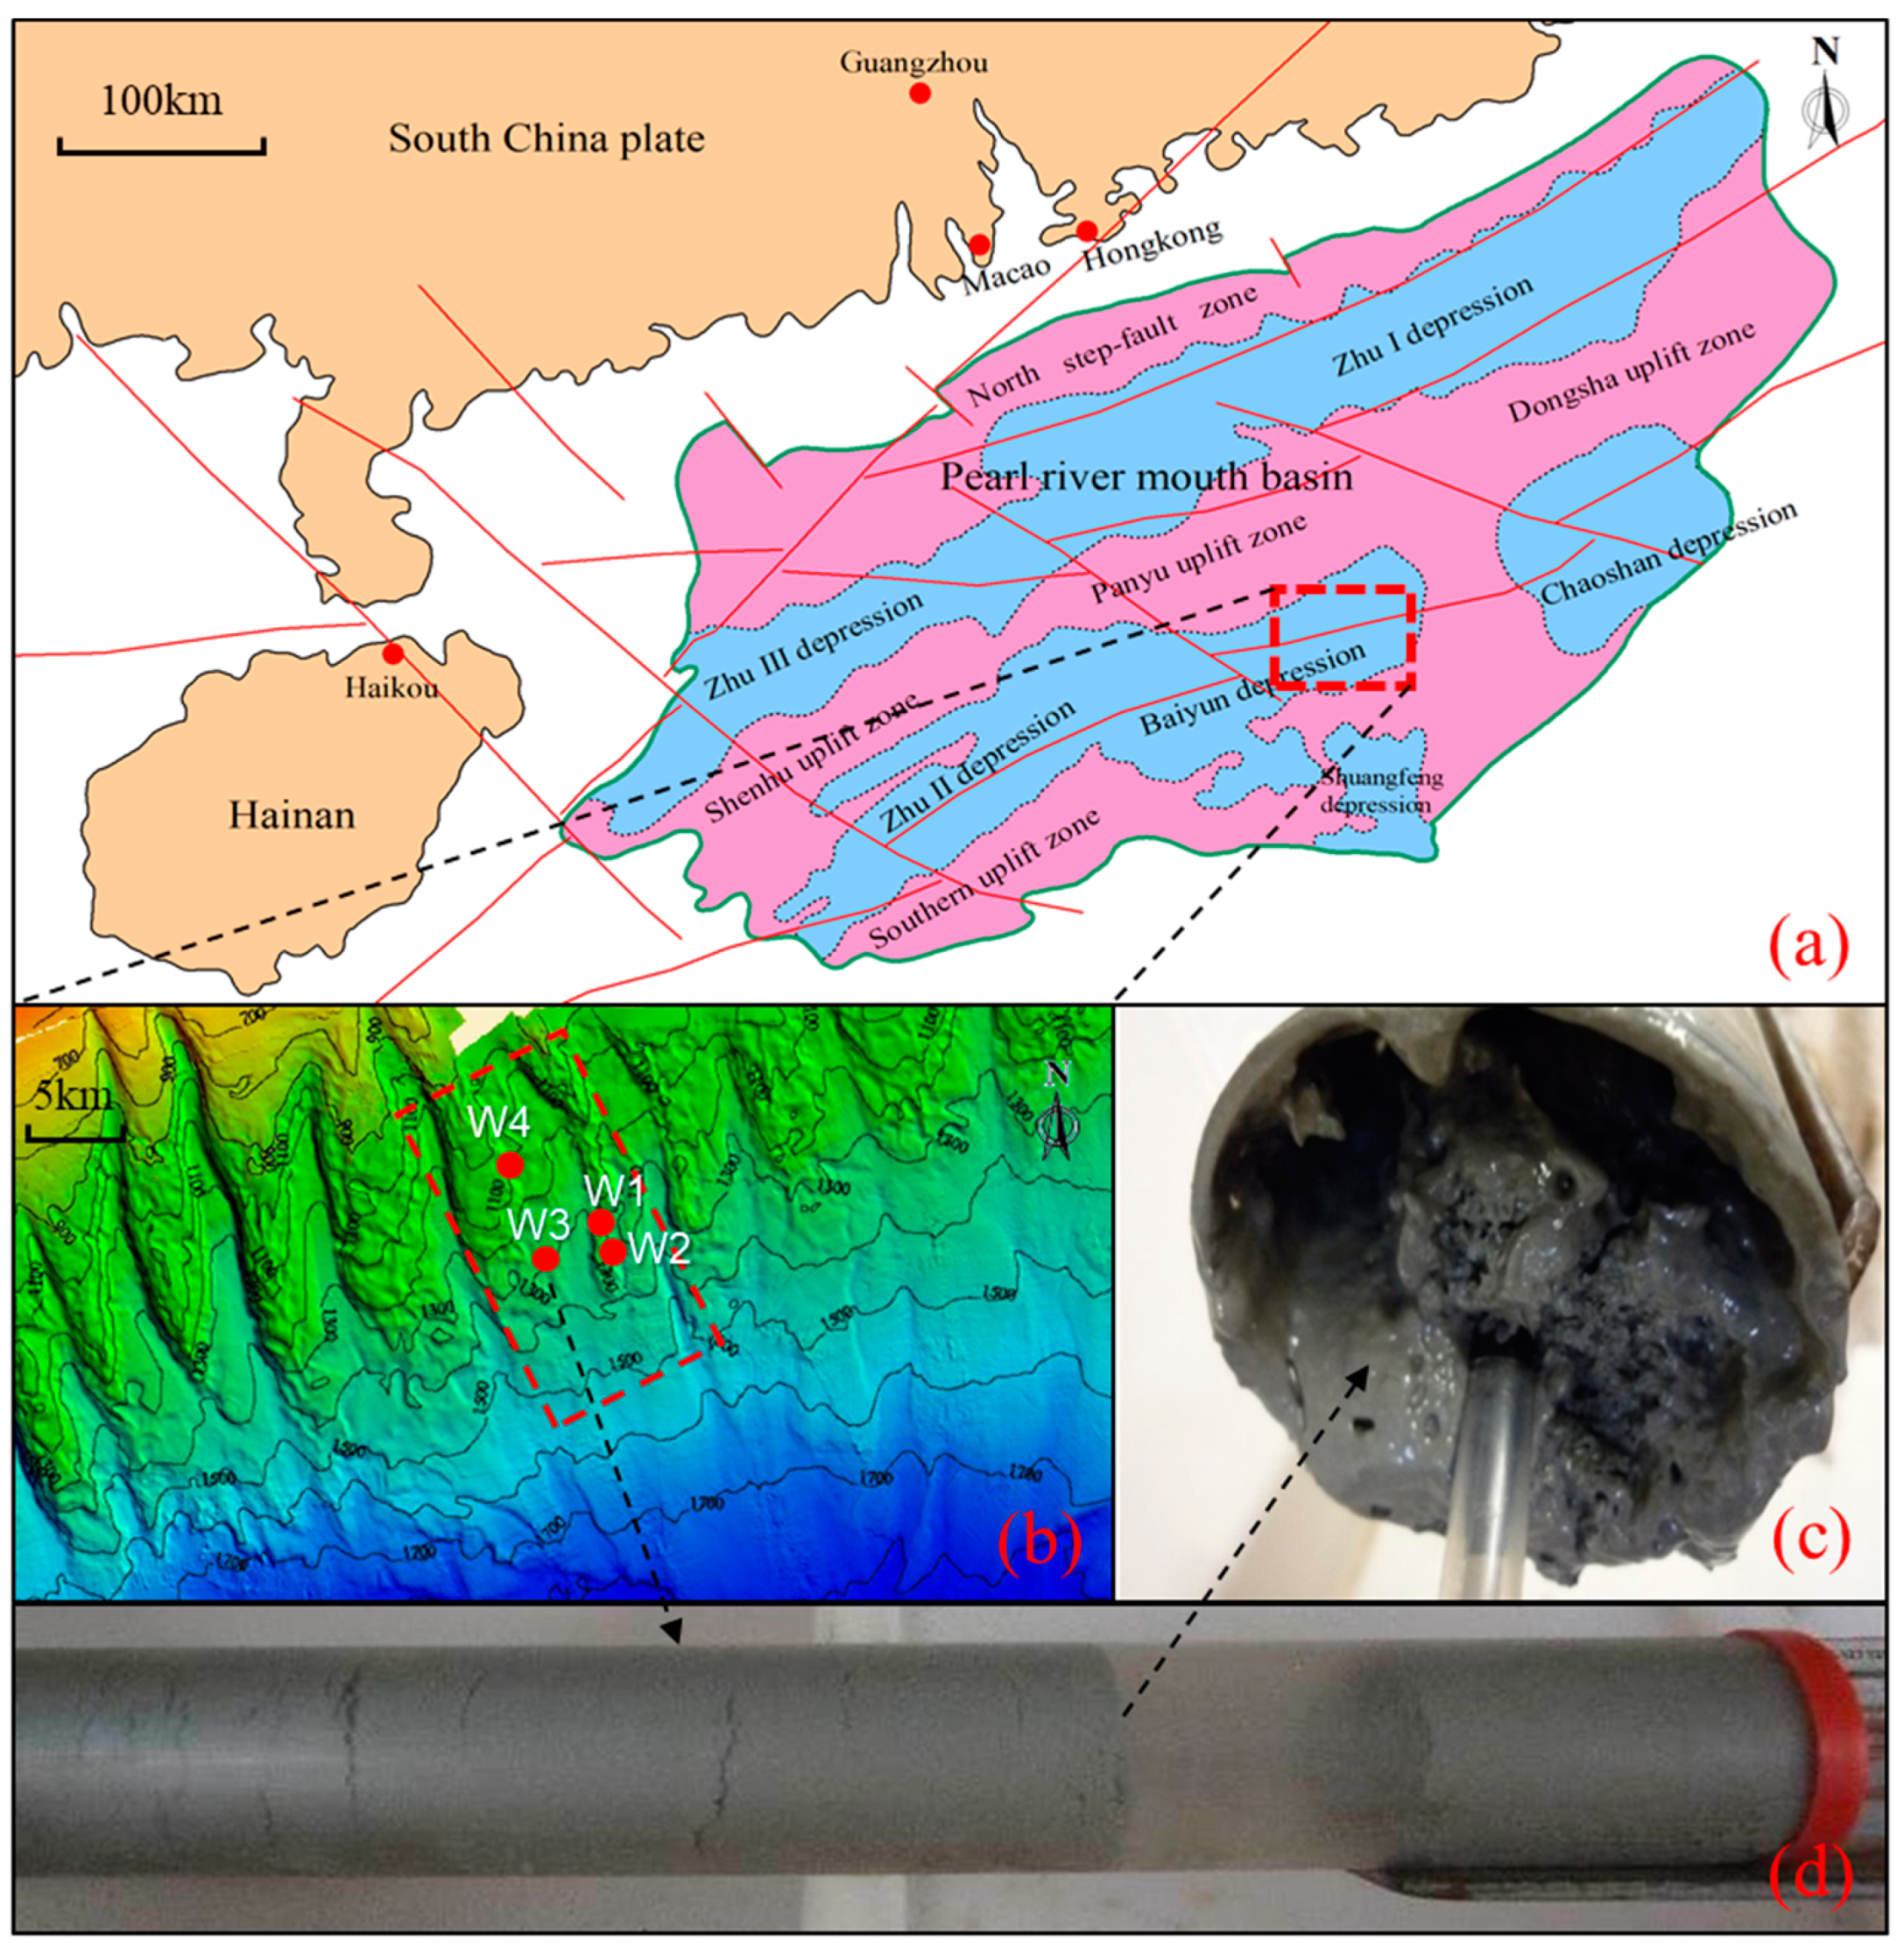
2. Geological Setting
3. Data and Methods
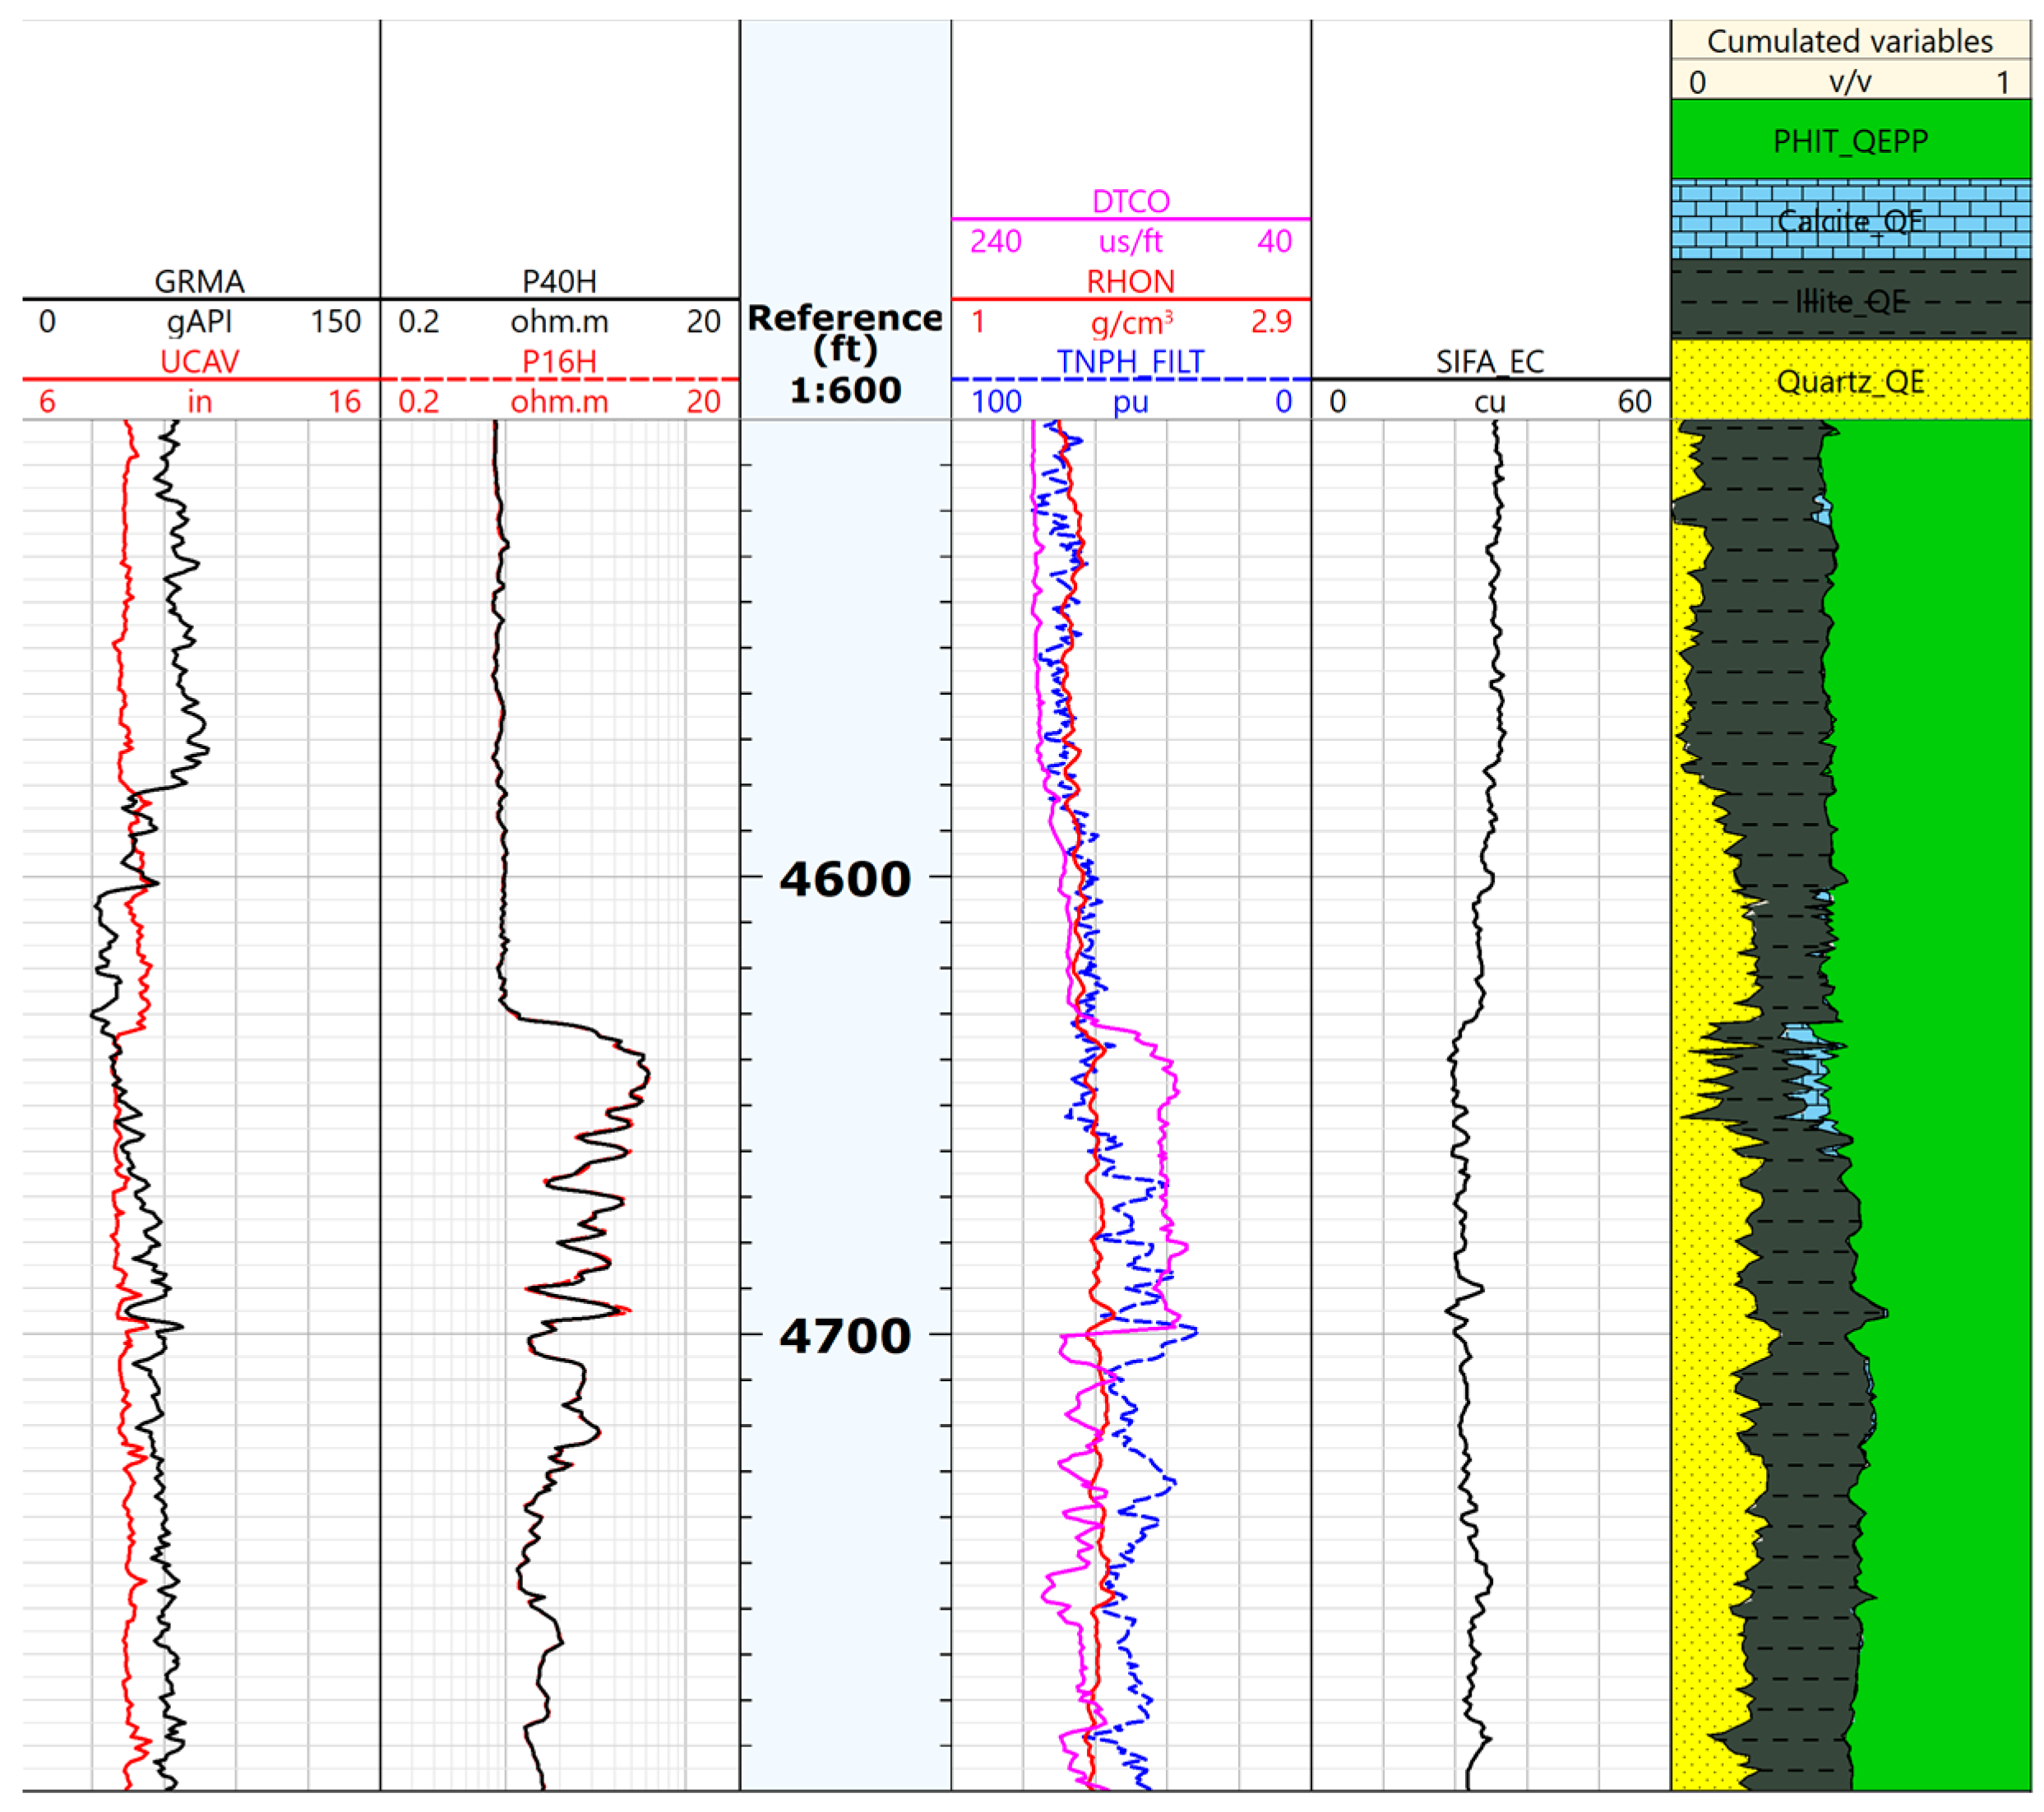
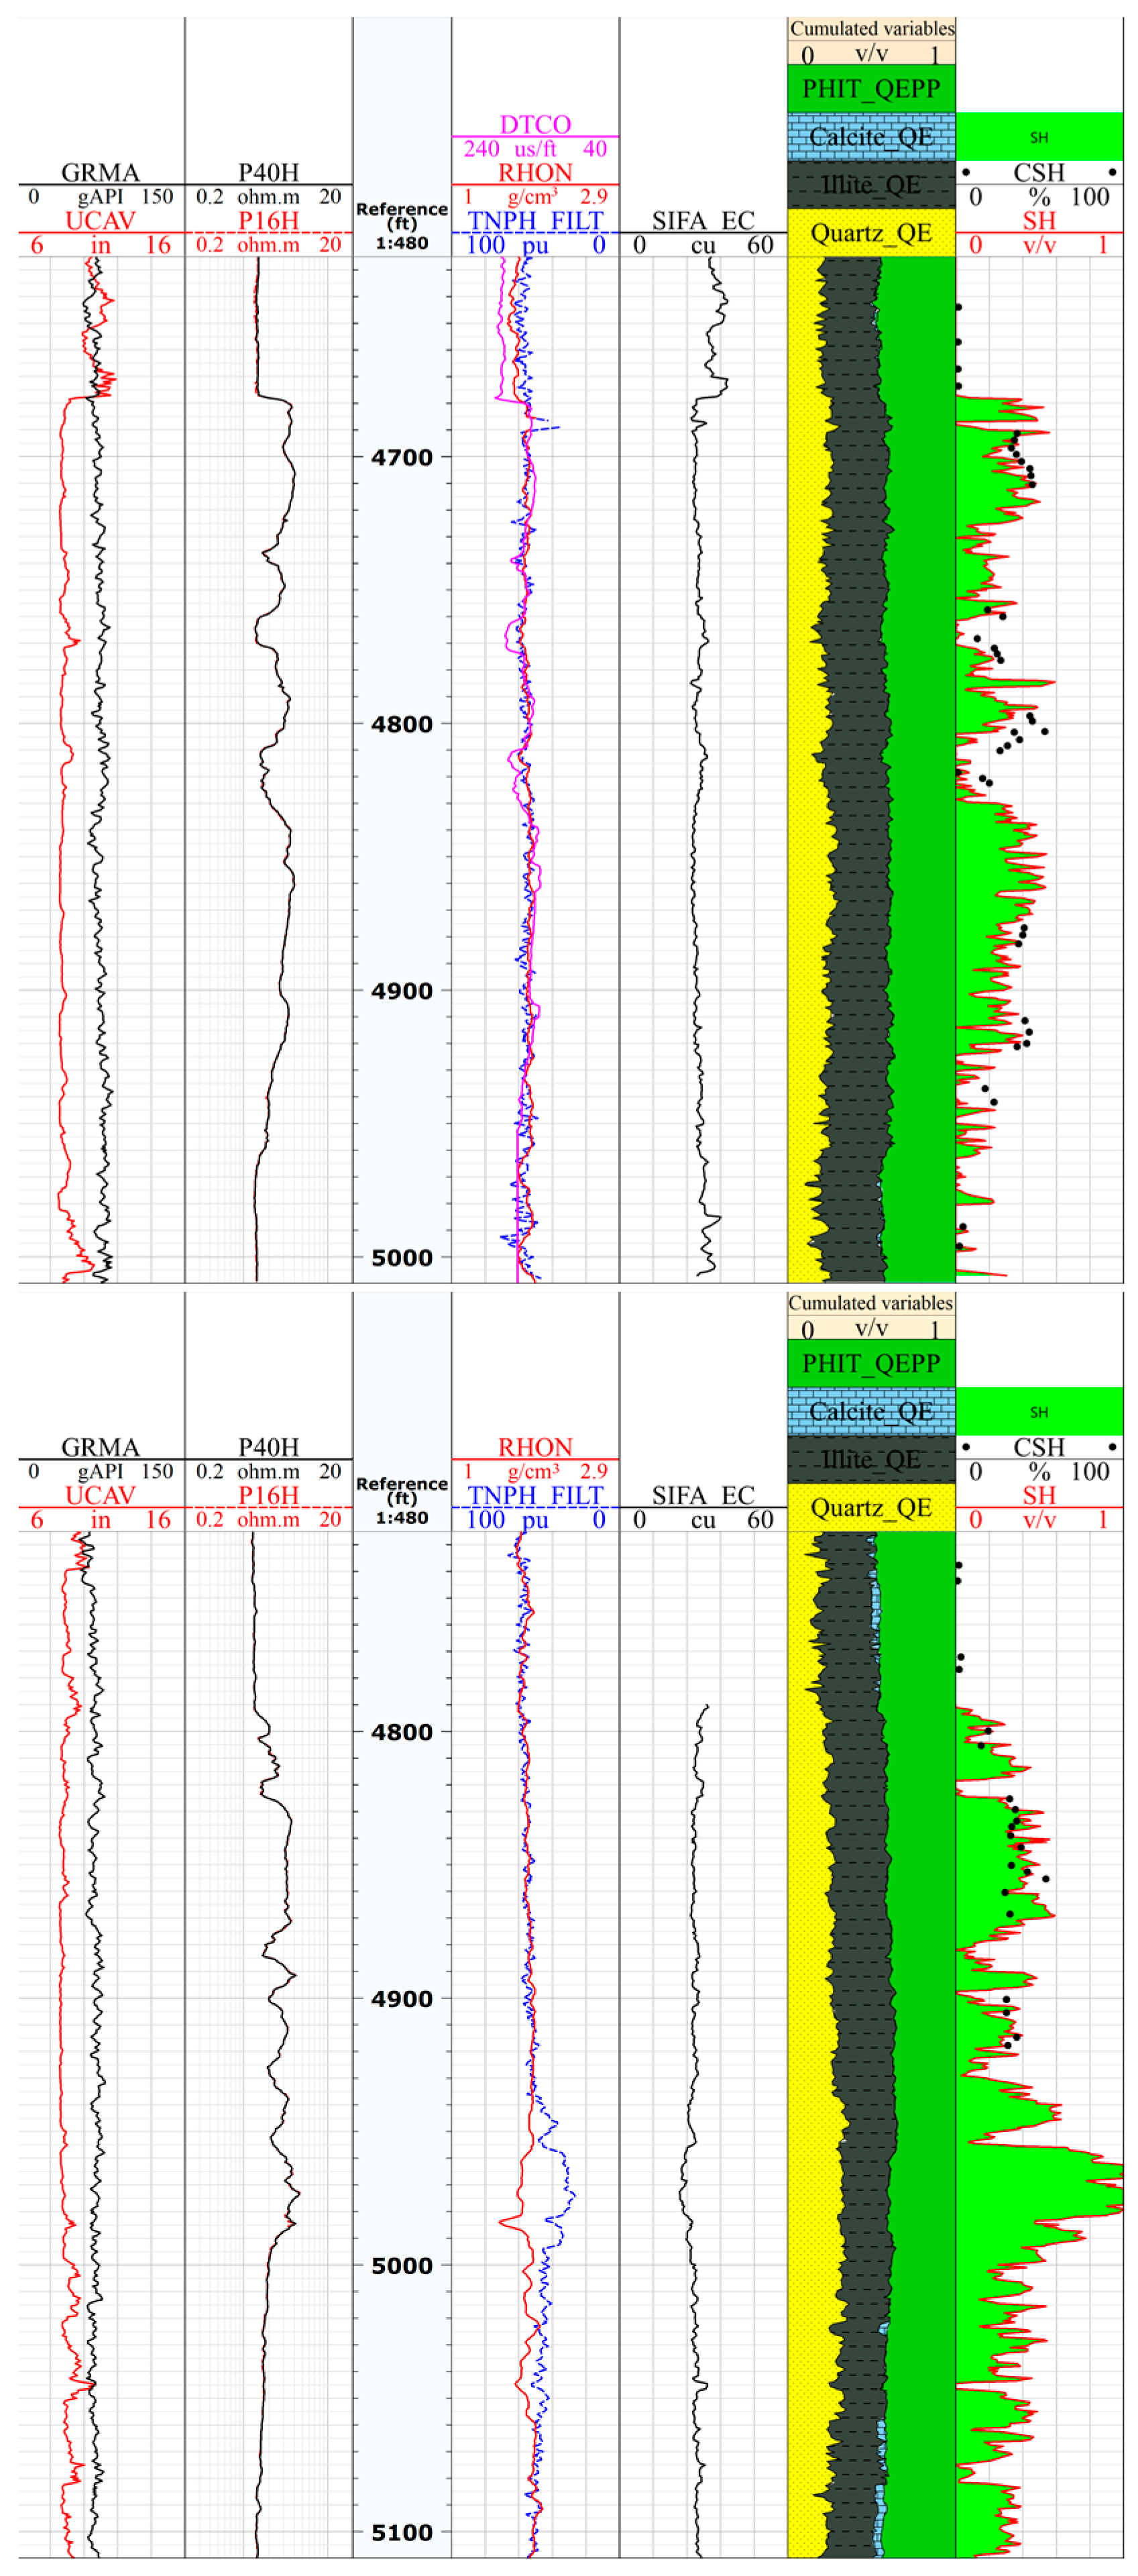
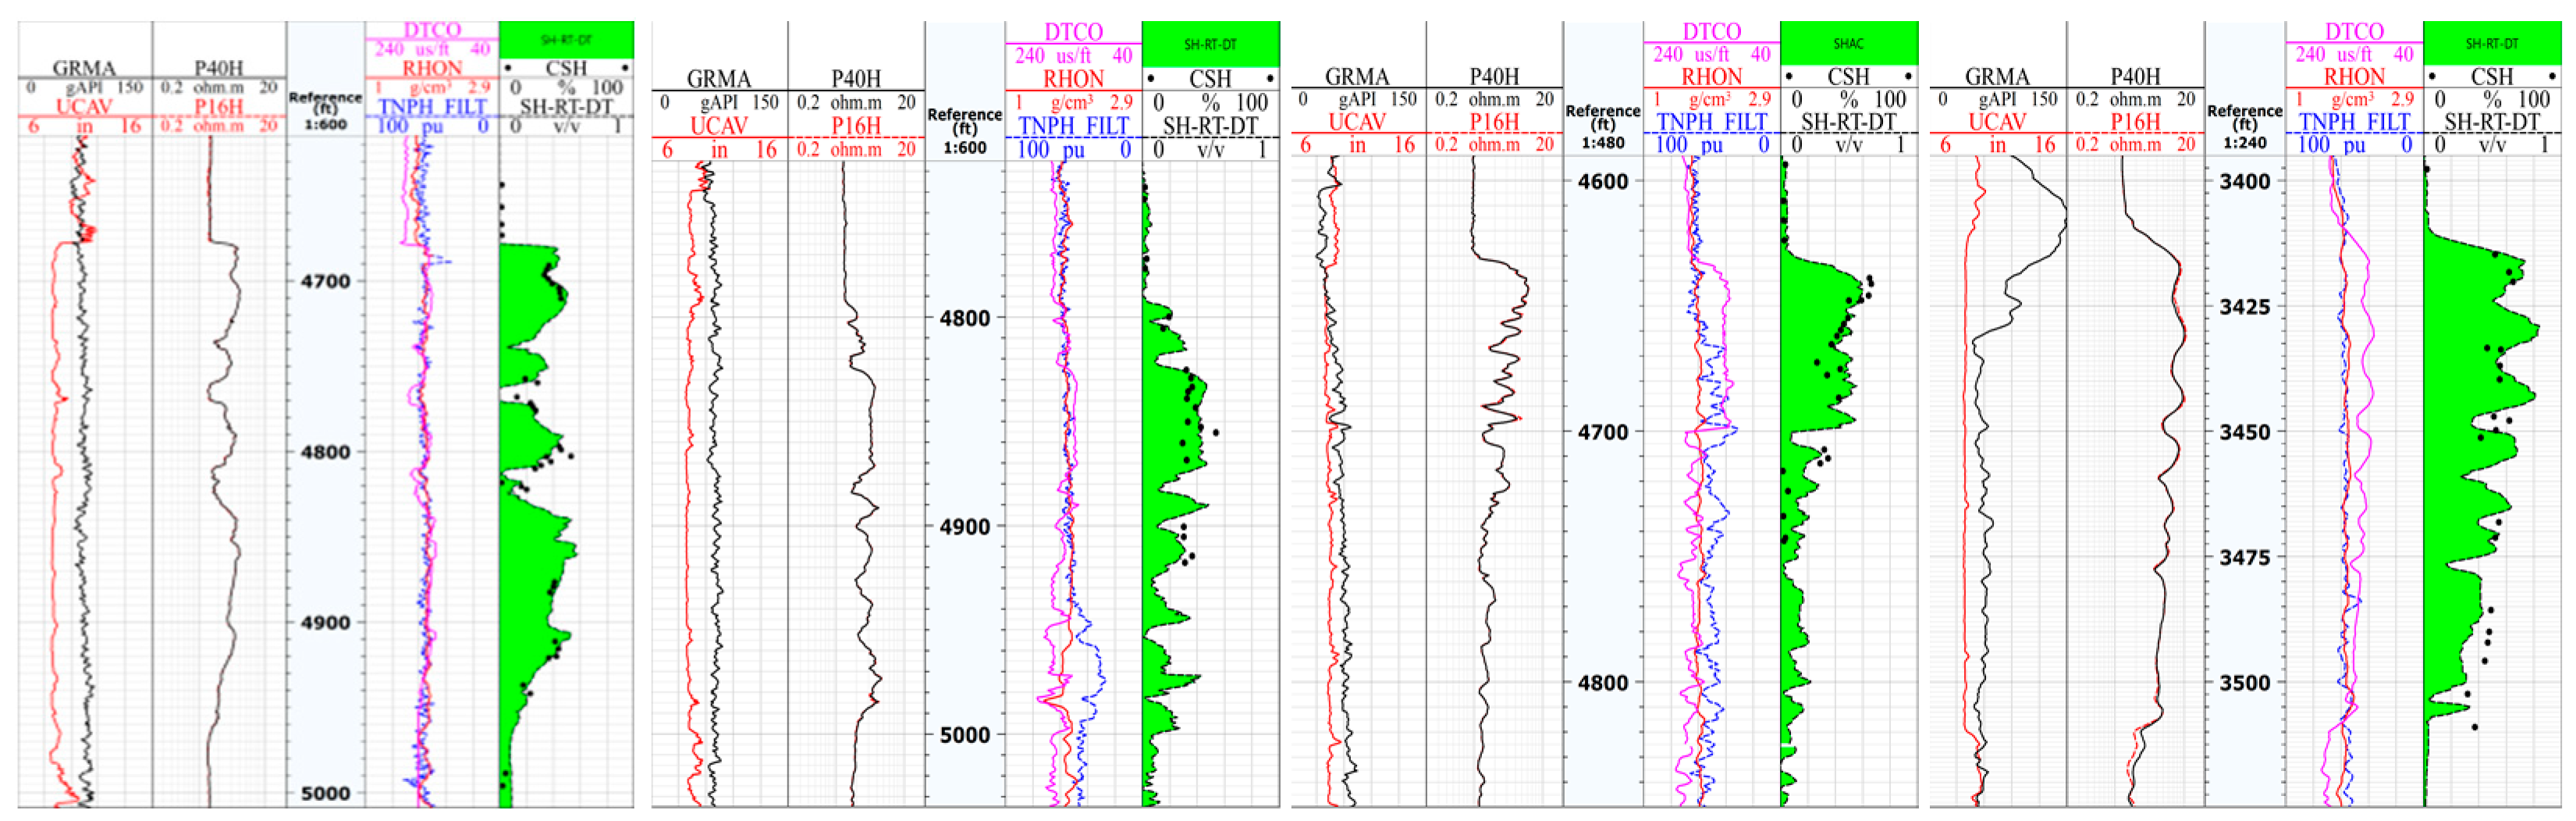
3.1. Data
3.2. Methods
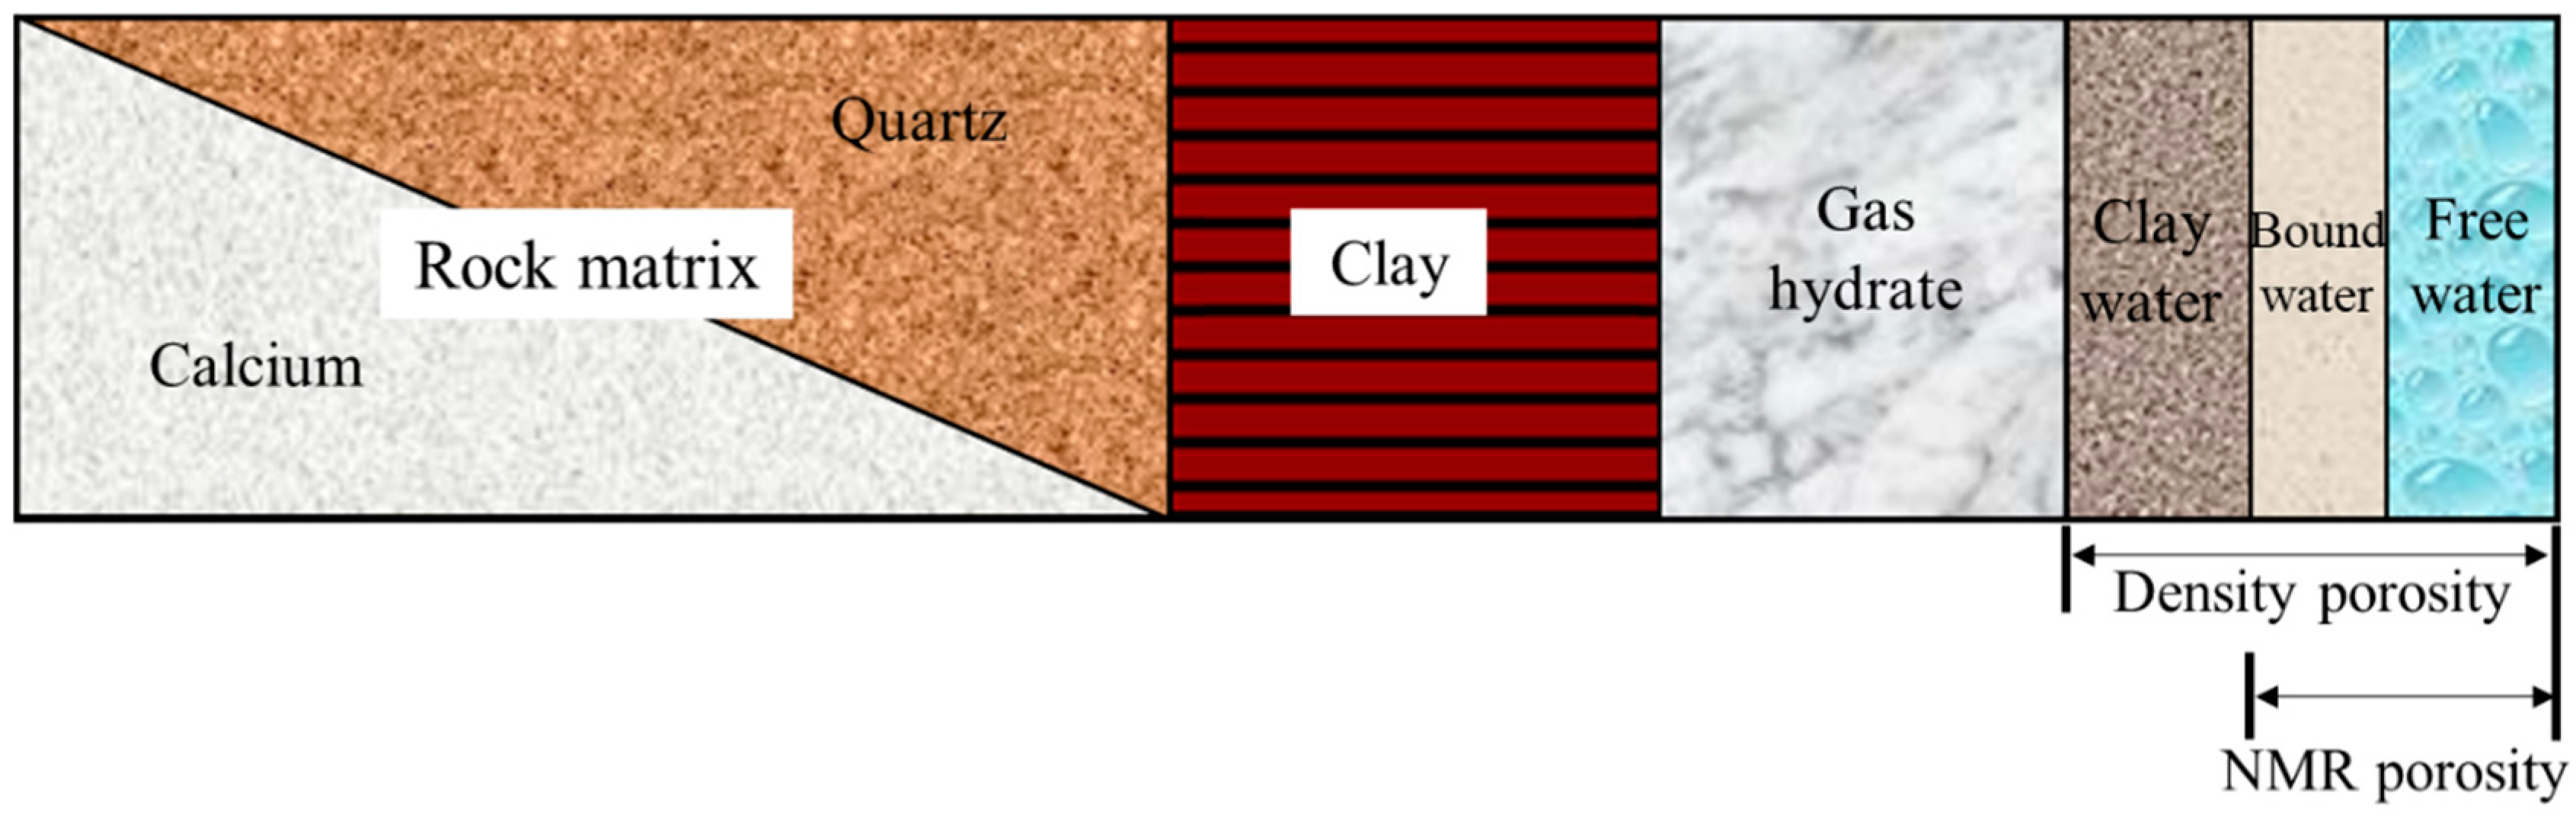
3.2.1. Density NMR Logging Method
3.2.2. Sigma Logging Formula
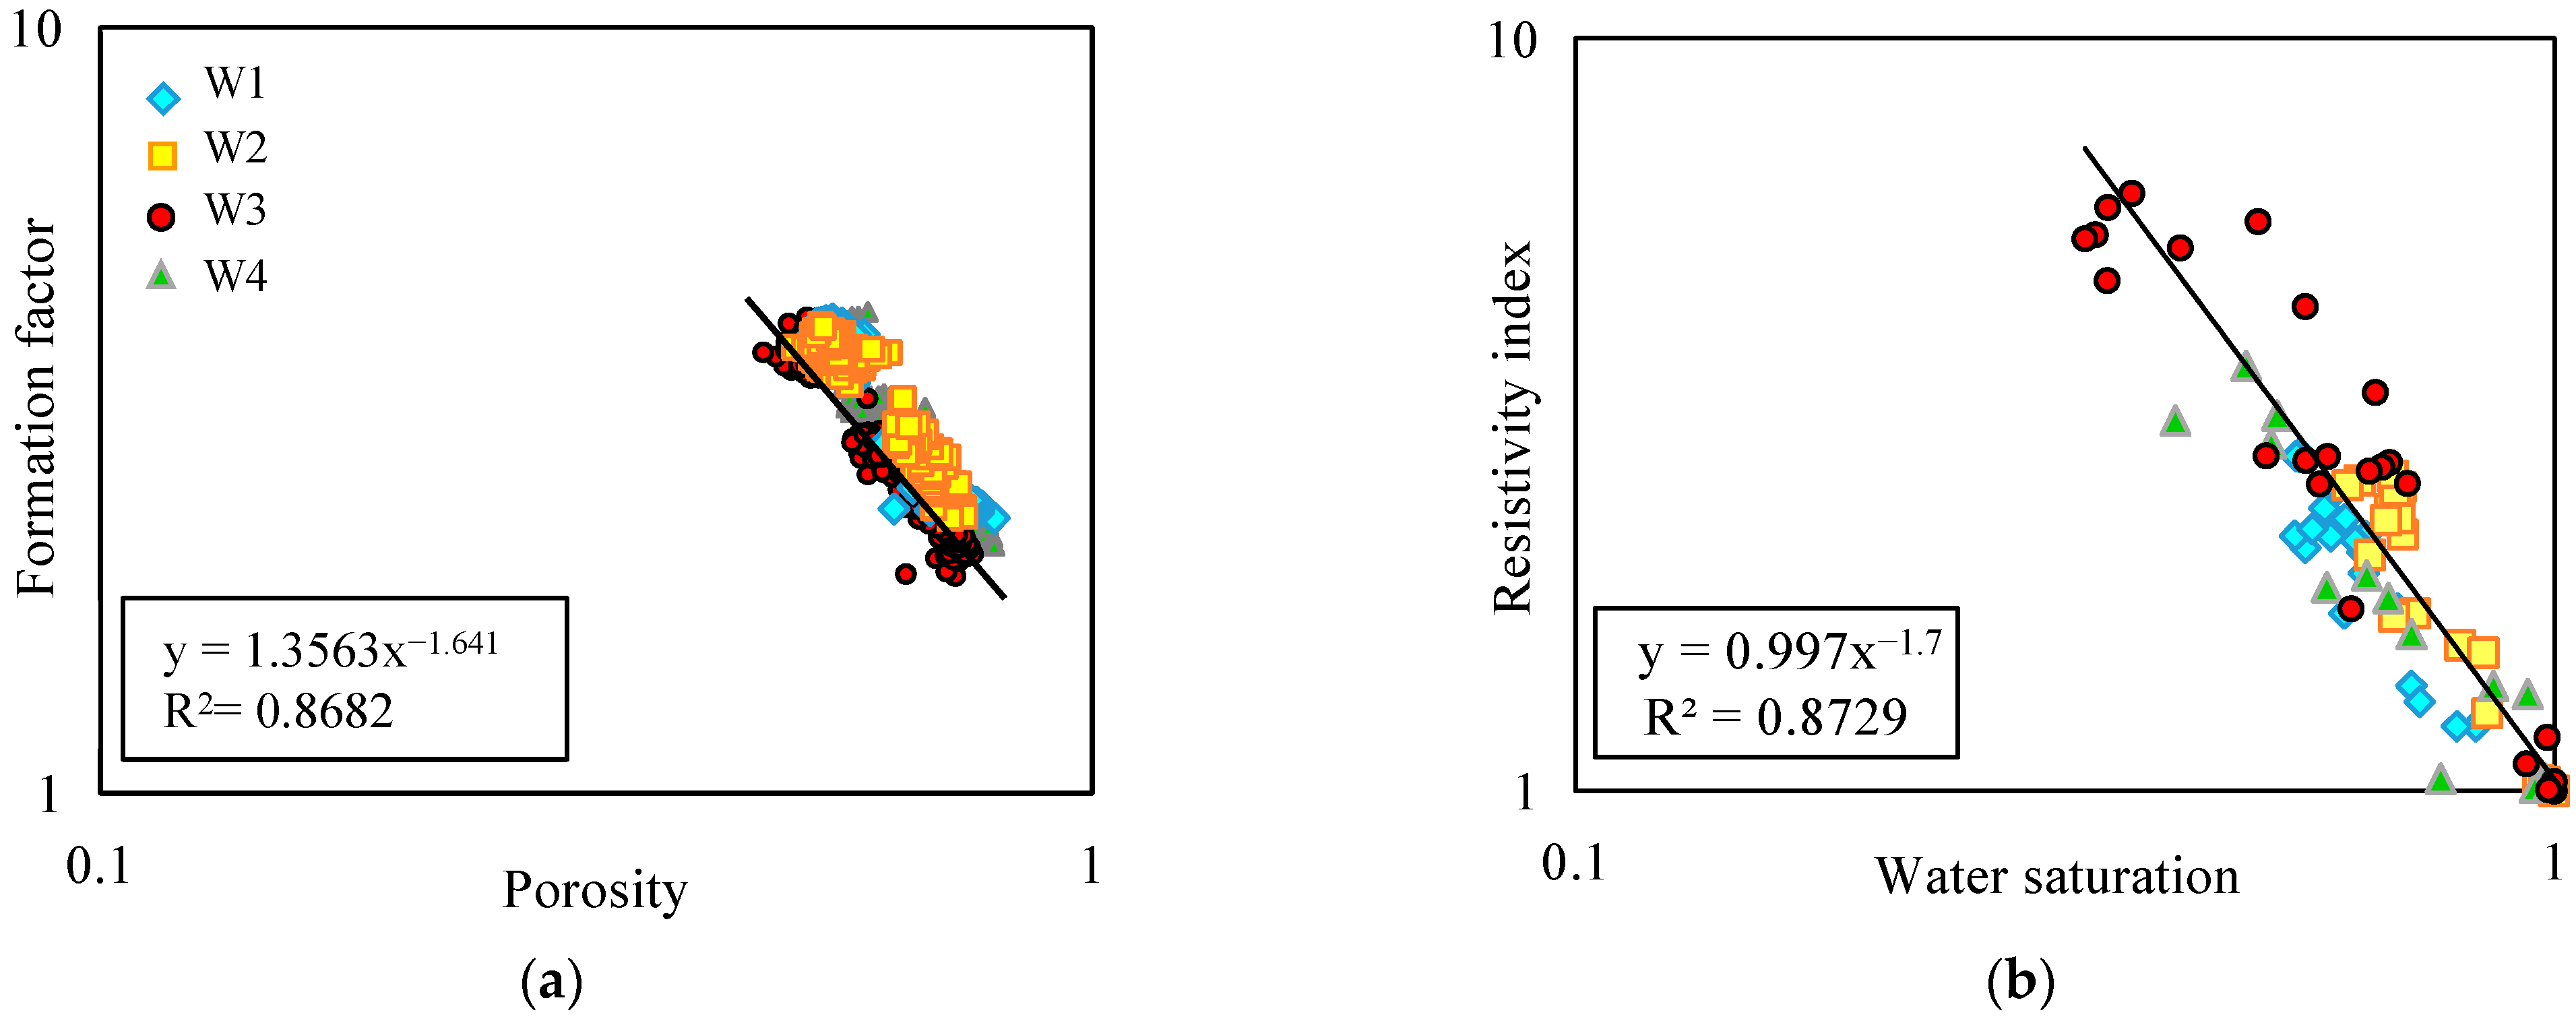
3.2.3. The Archie Formula
3.2.4. Resistivity DT Logging Method
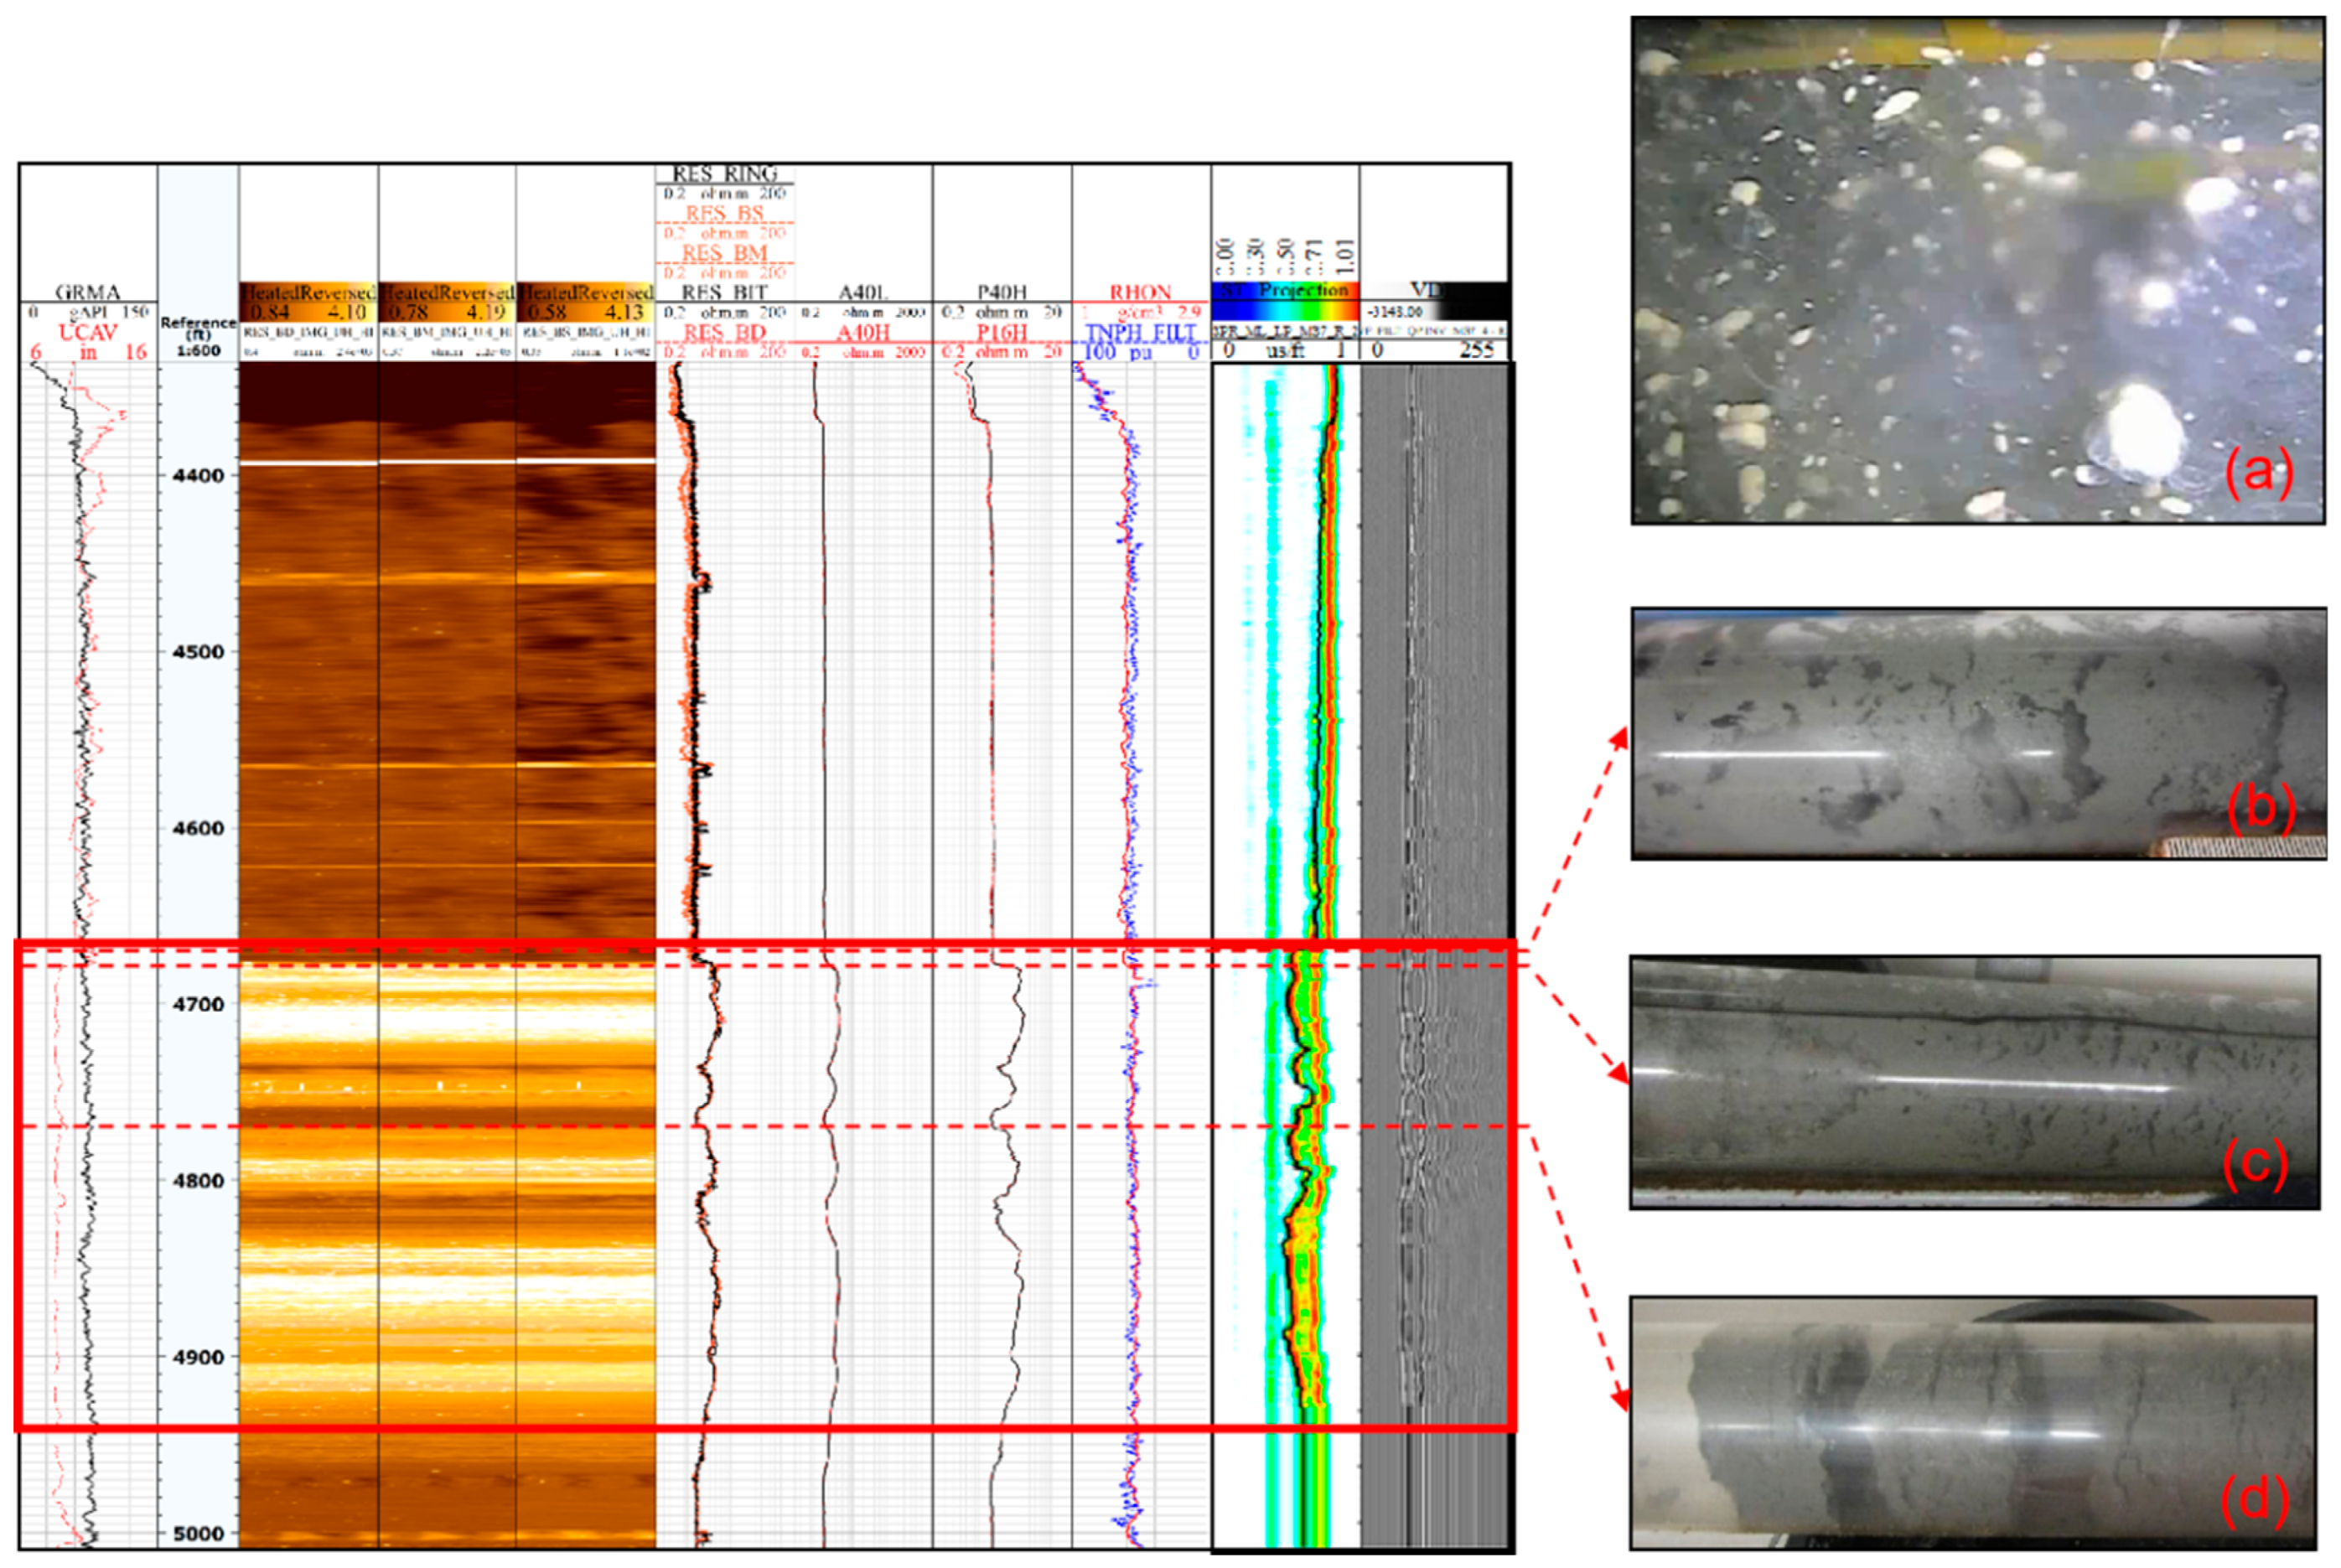
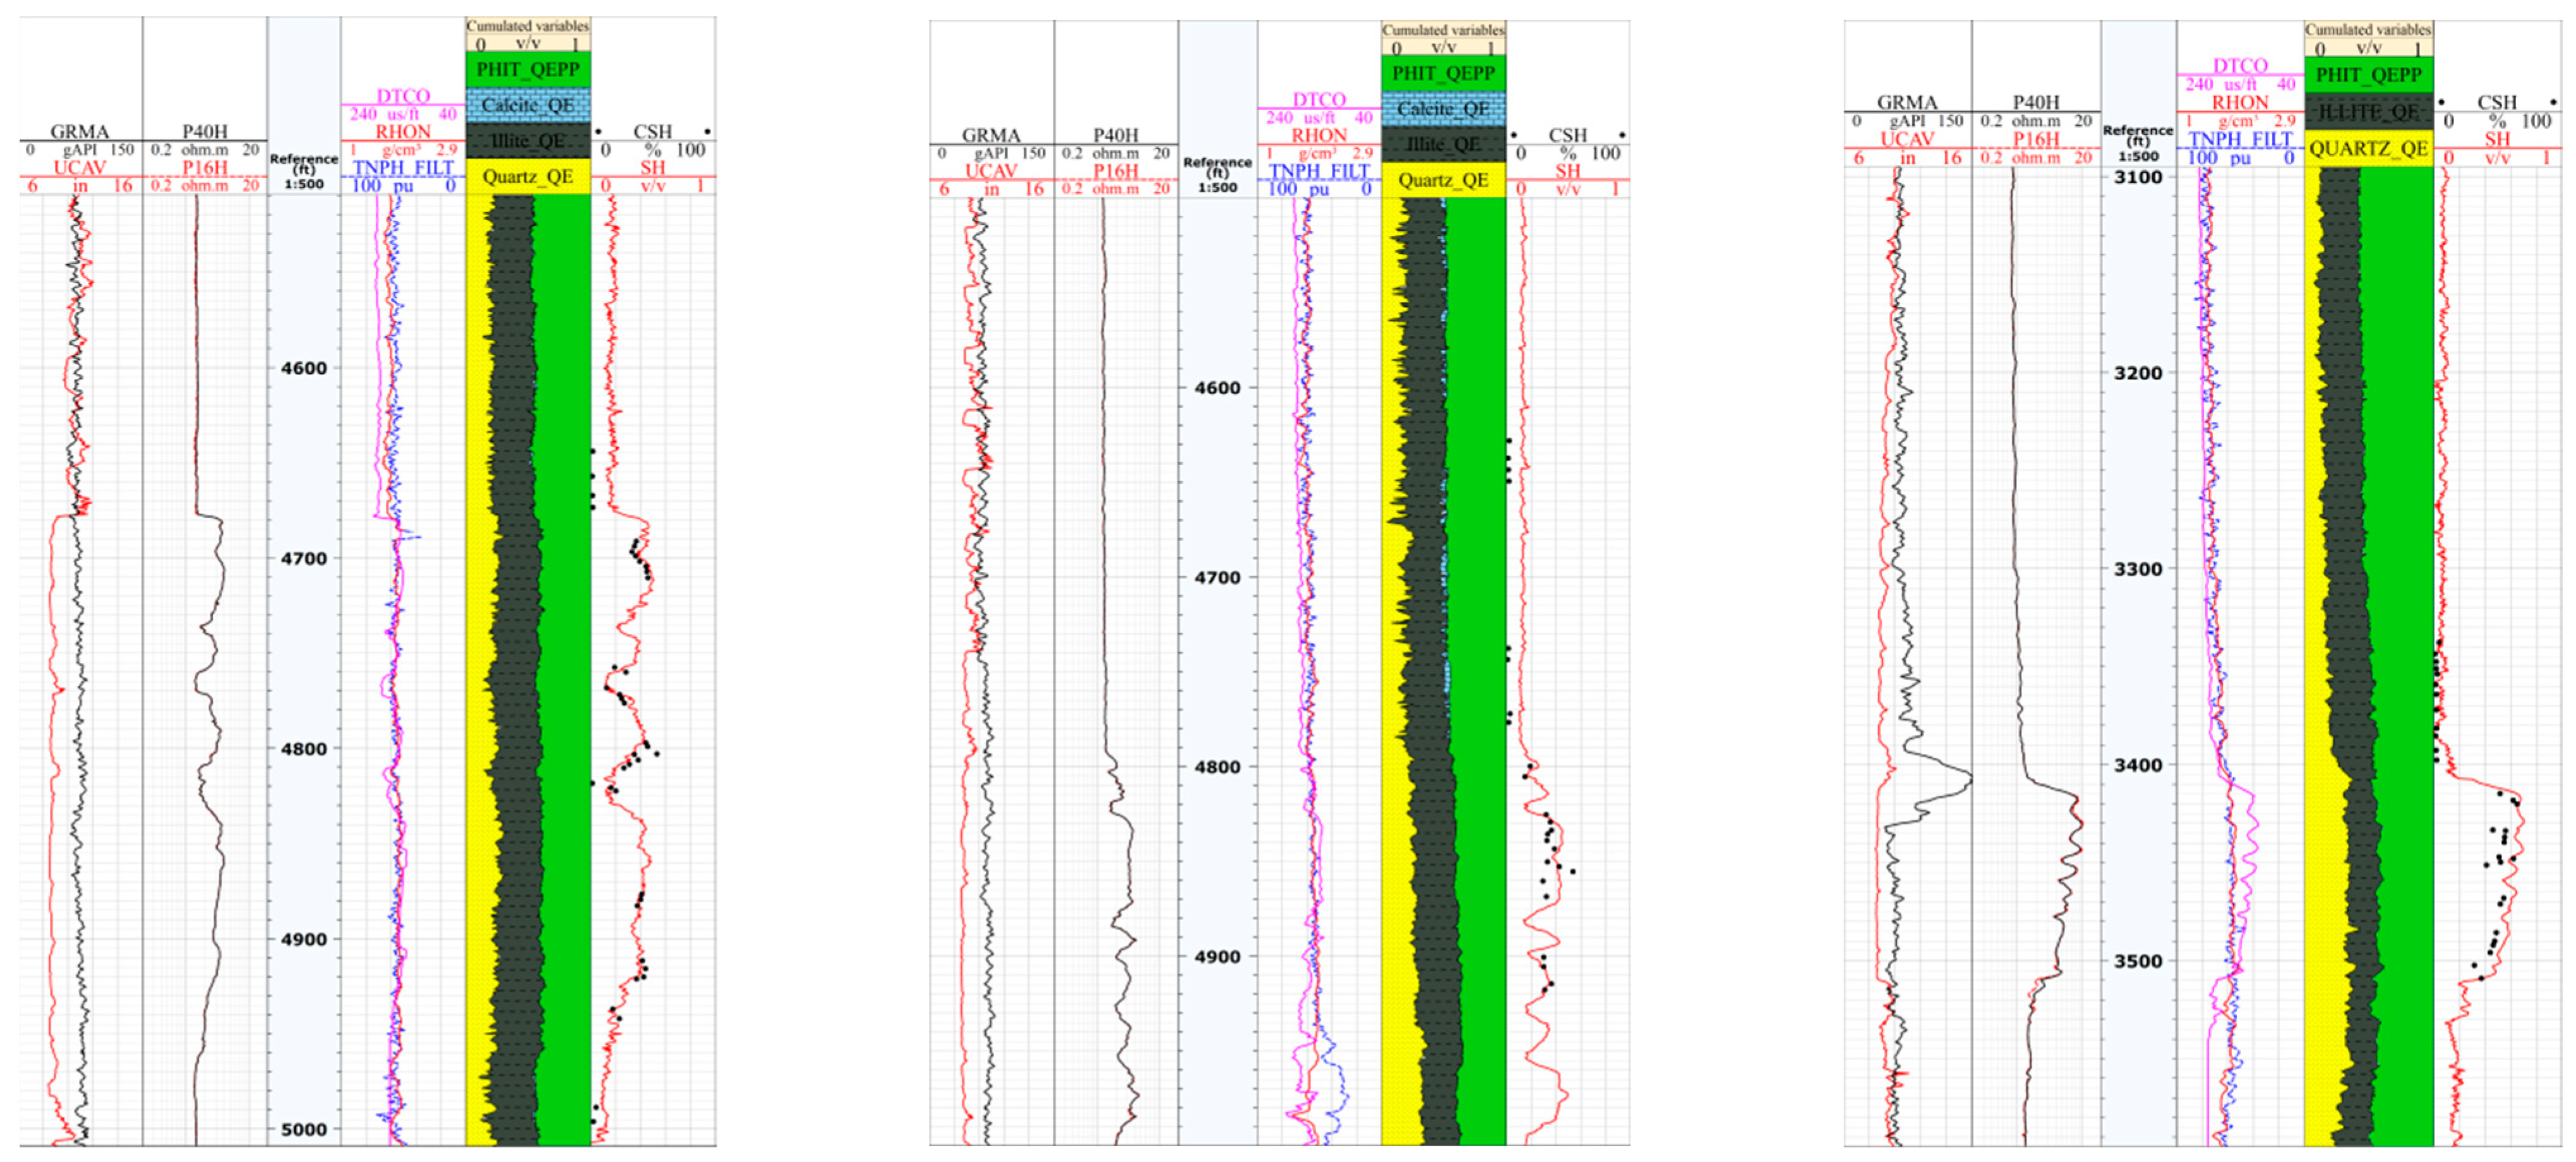
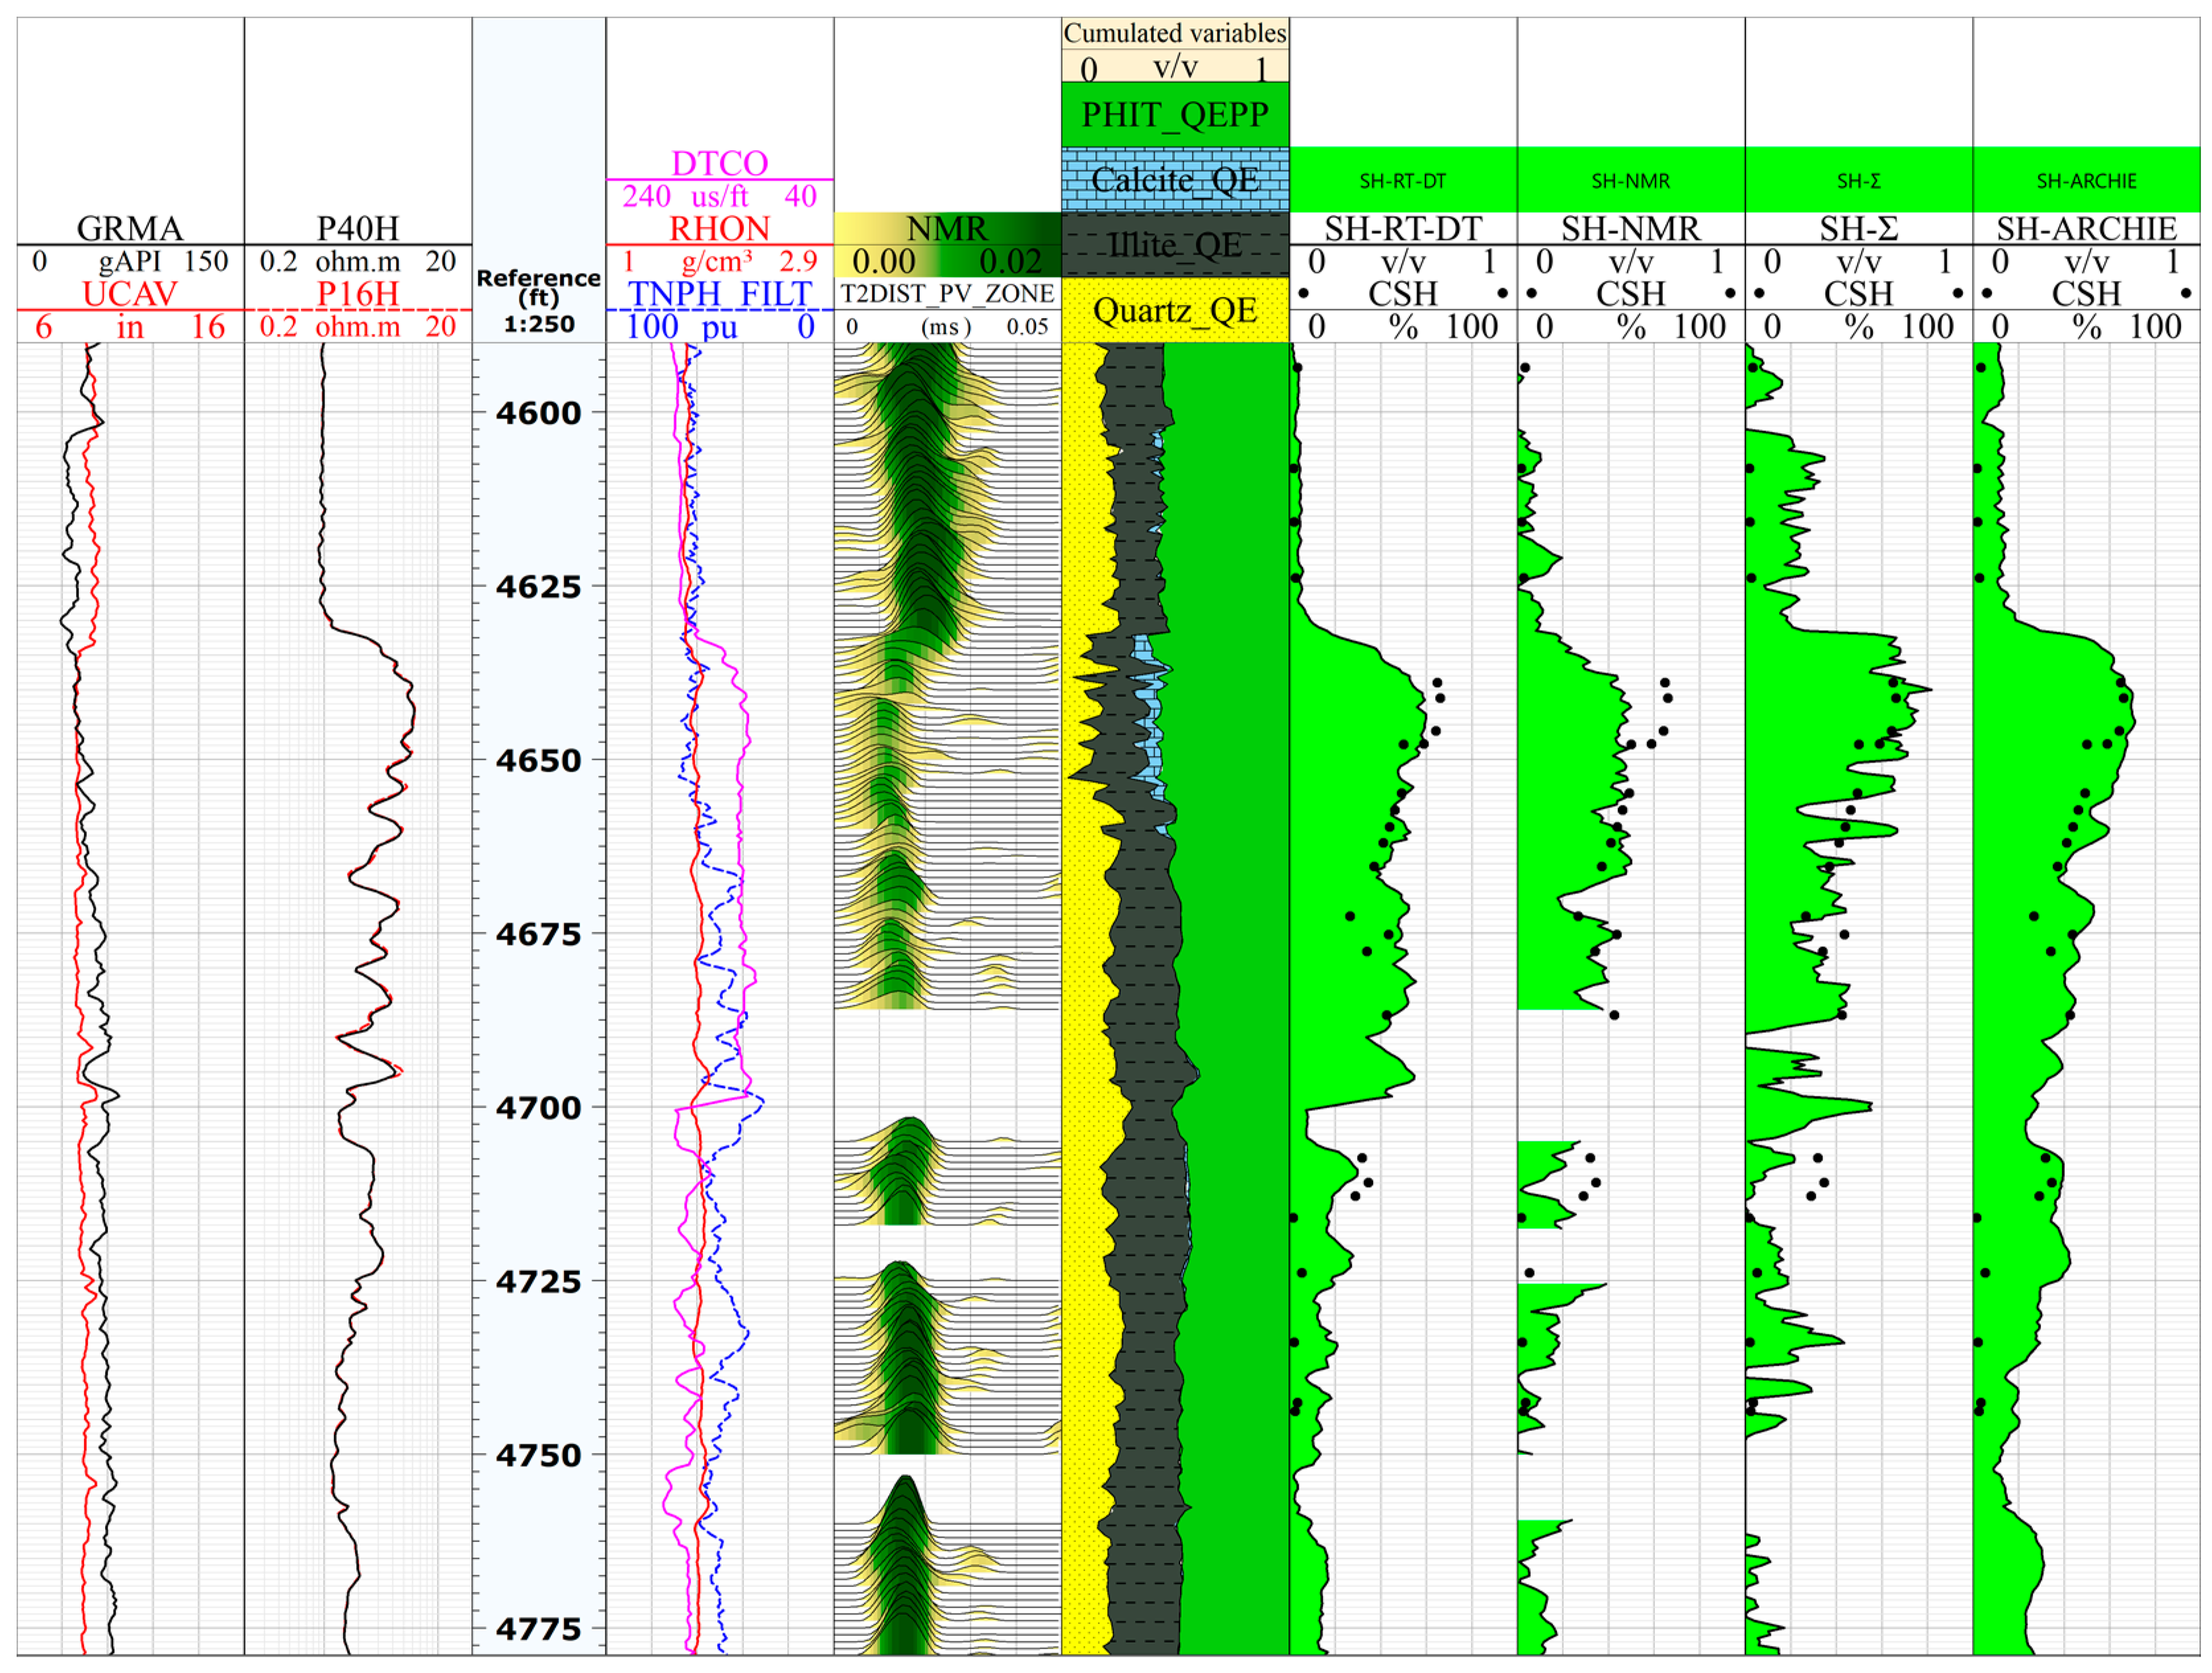
4. Results
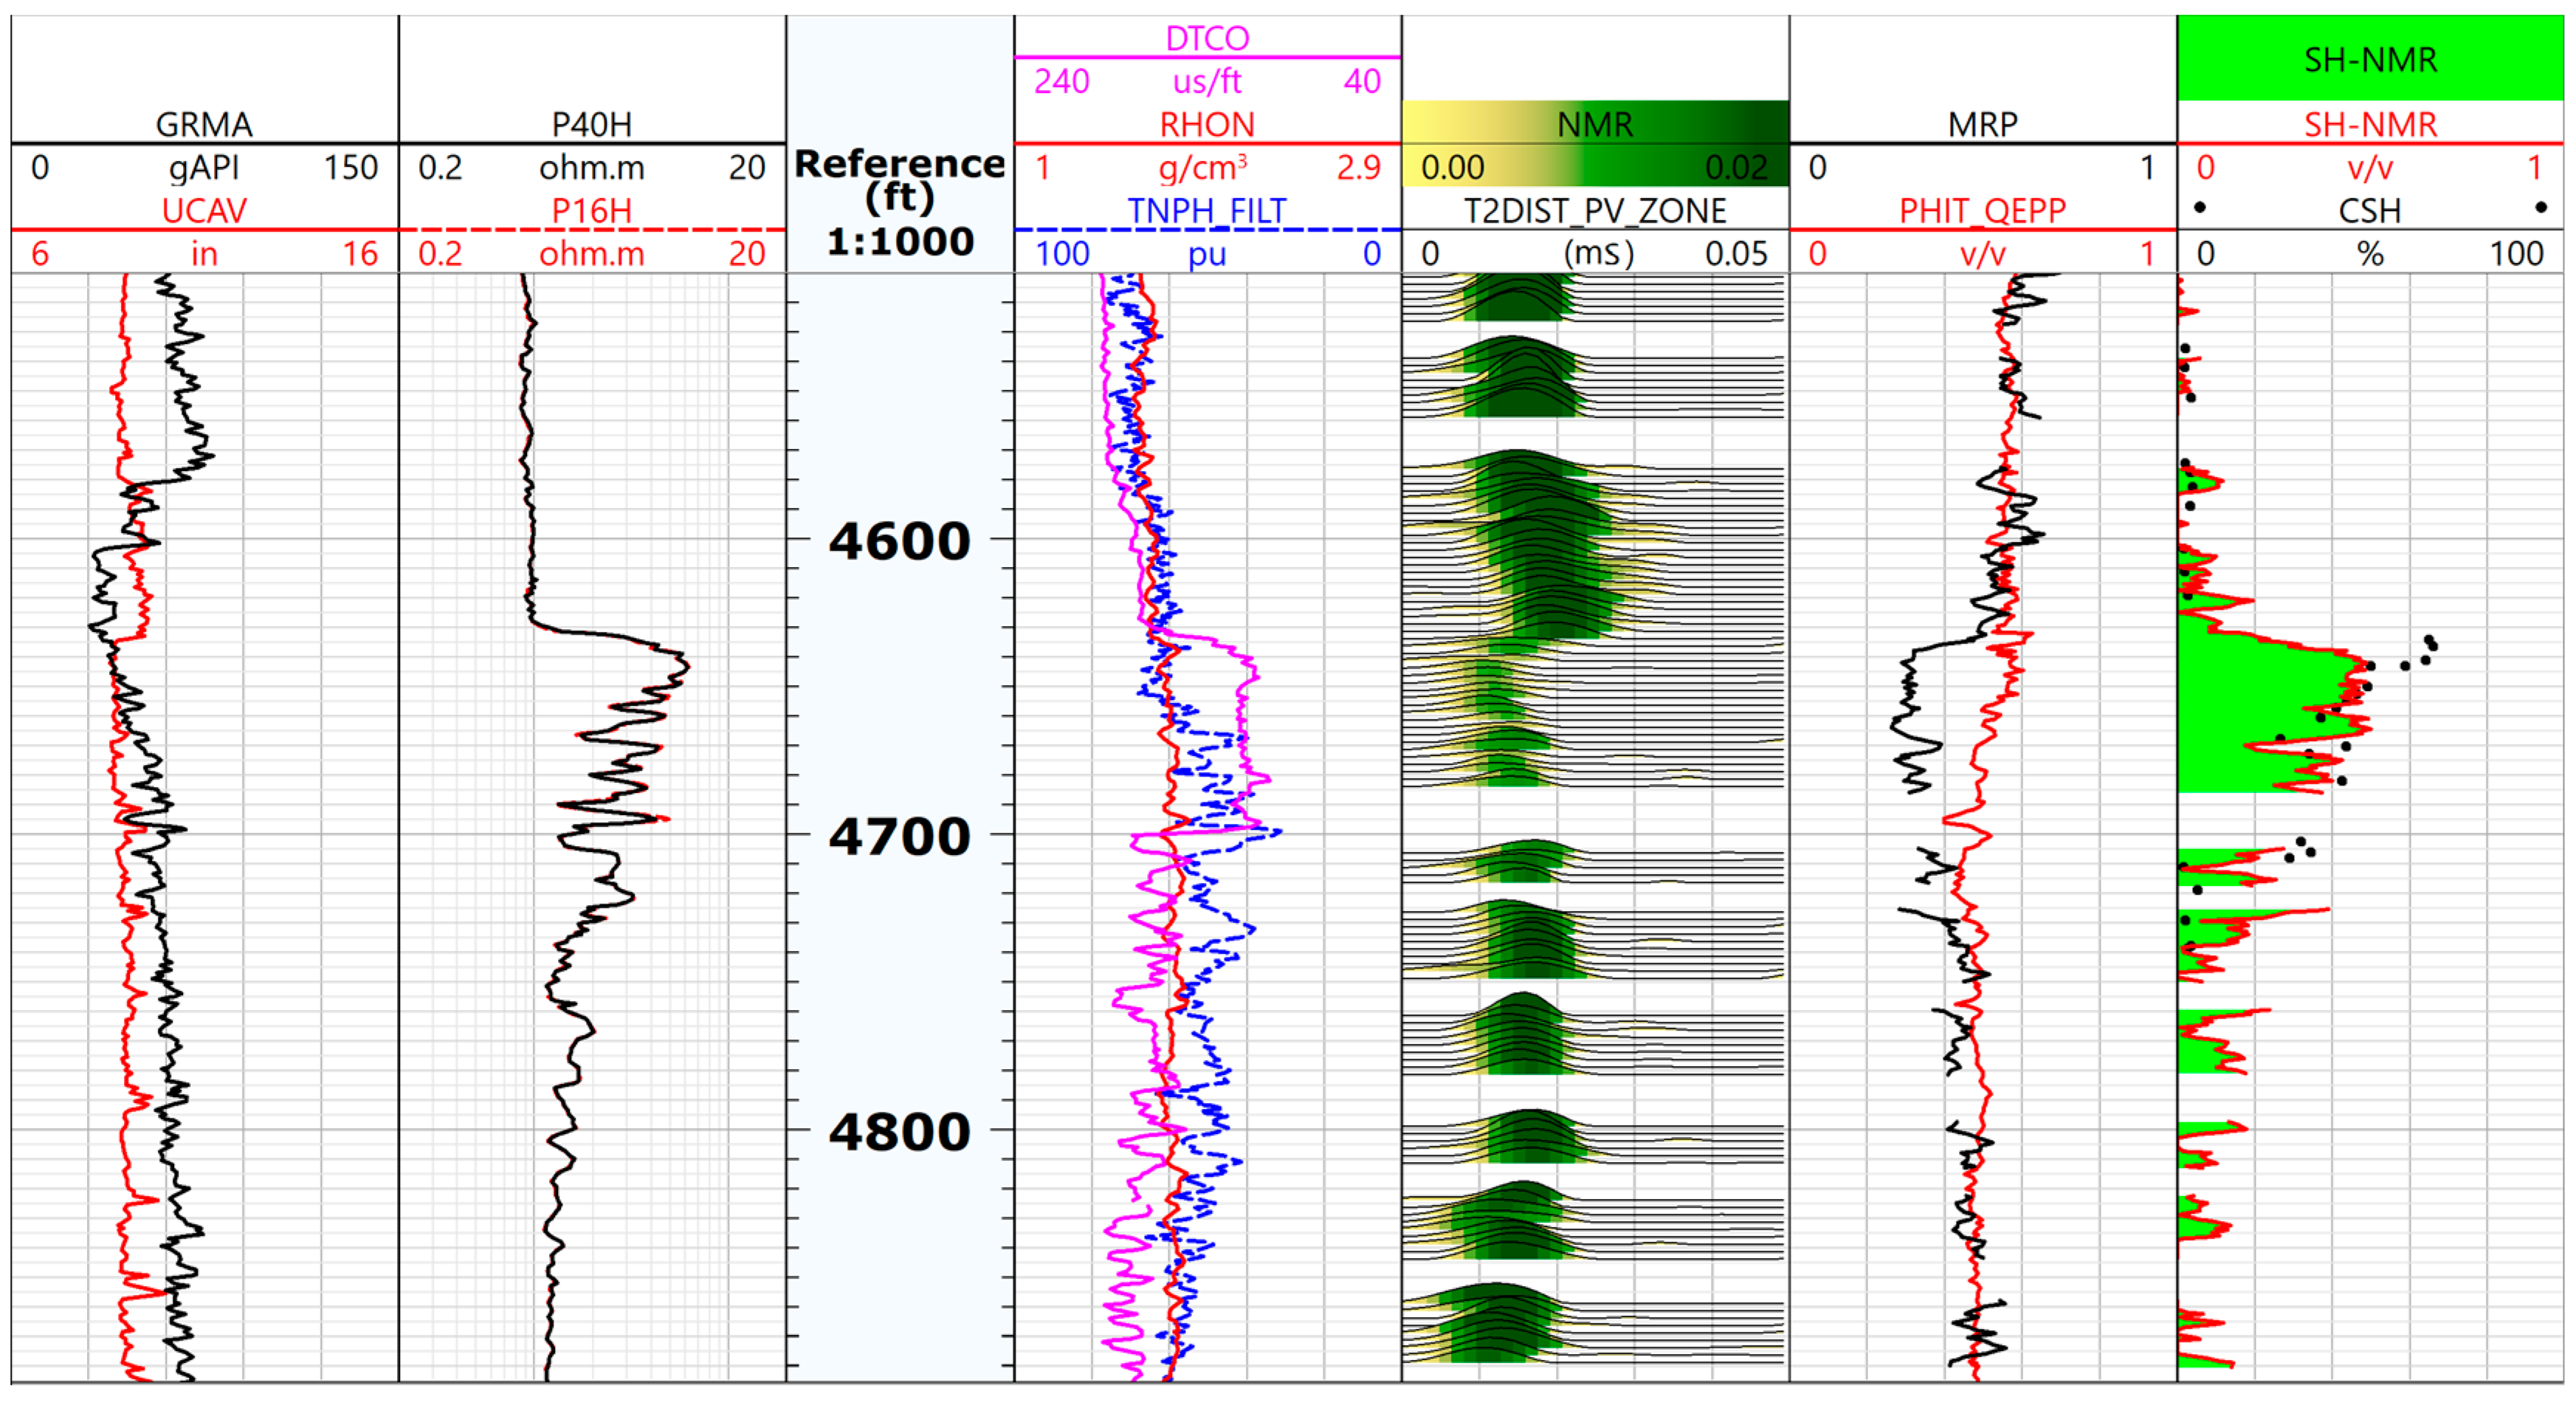
4.1. Density NMR Logging Method
4.2. Sigma Logging Formula
4.3. The Archie Formula
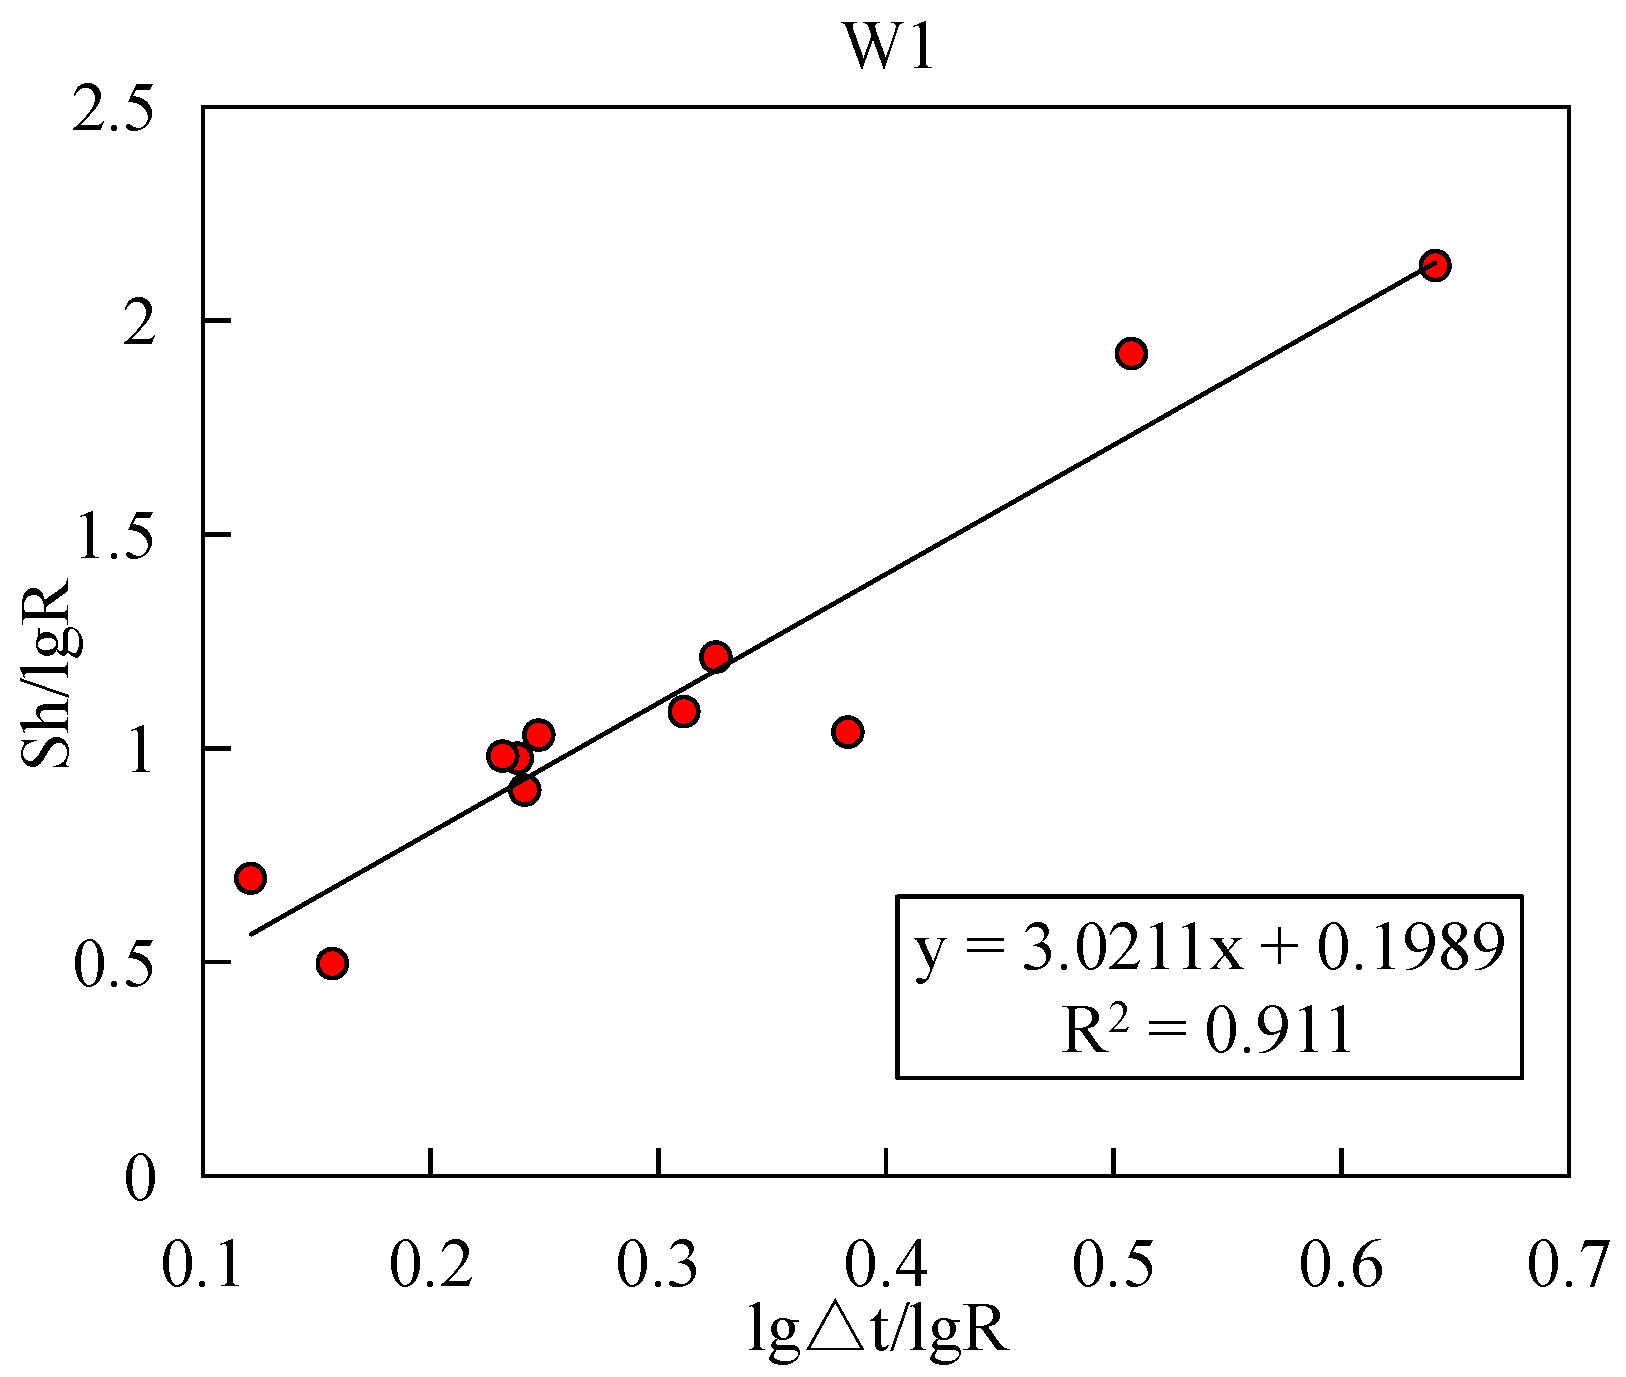
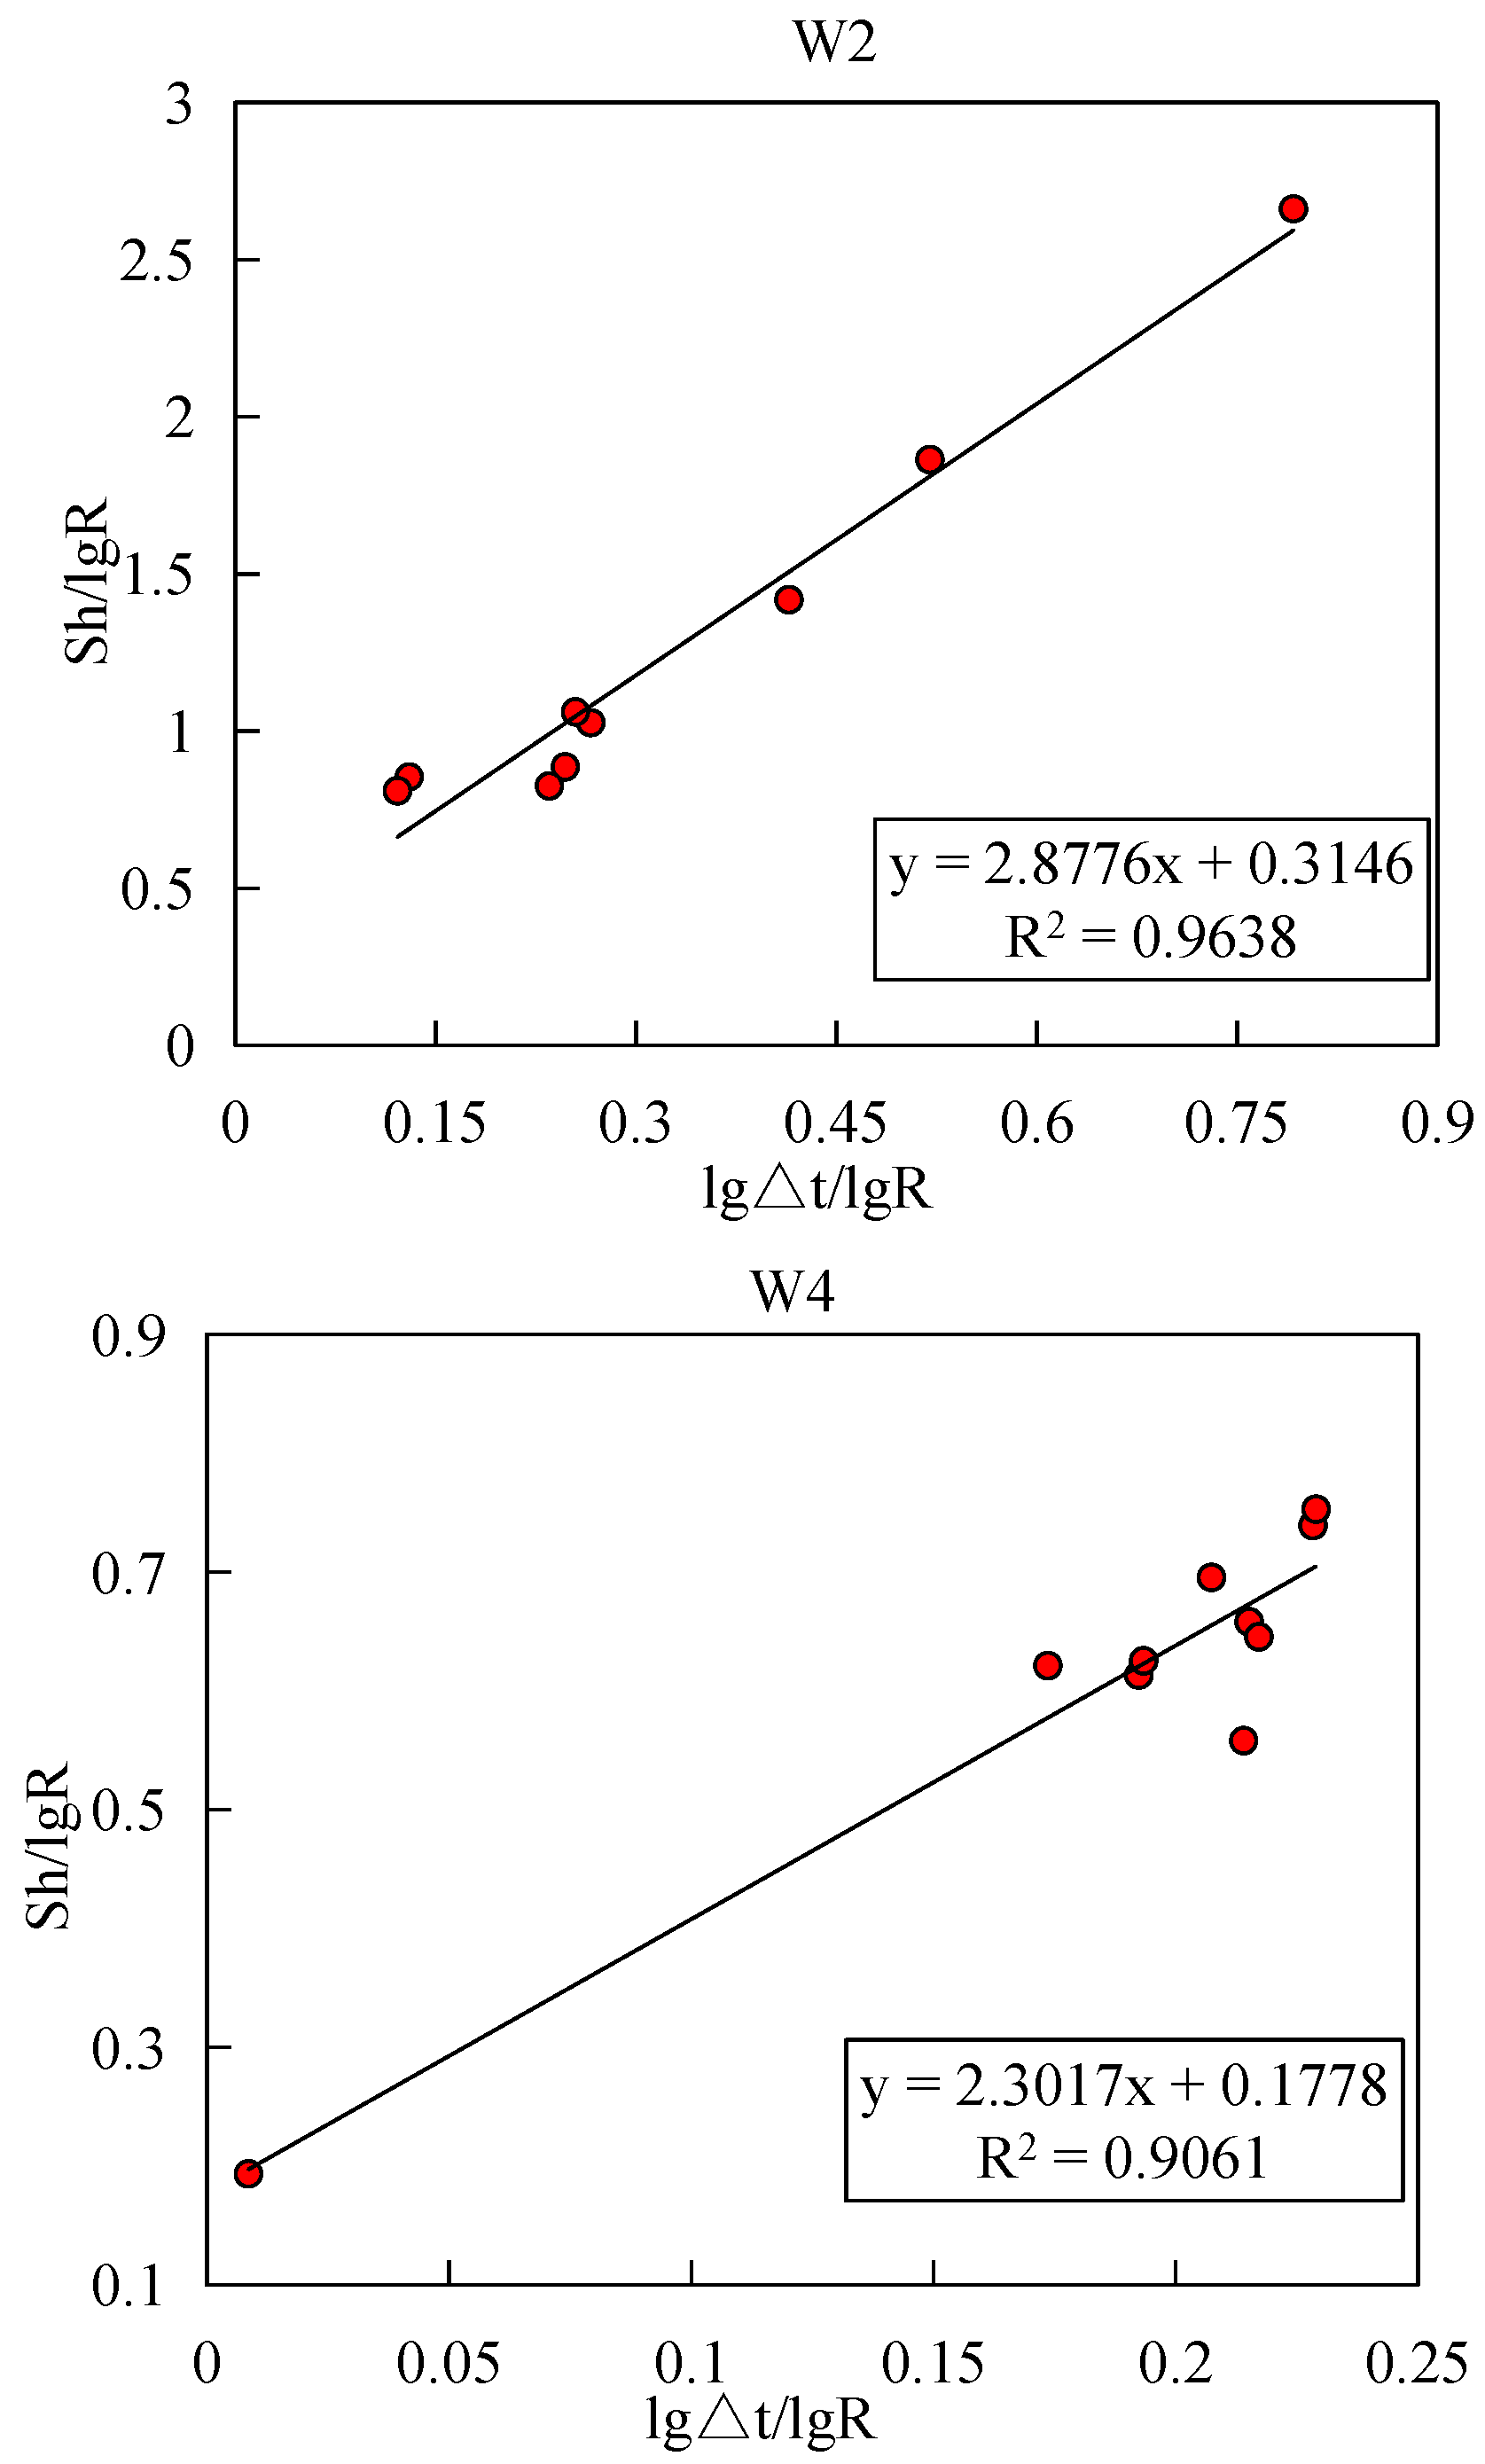
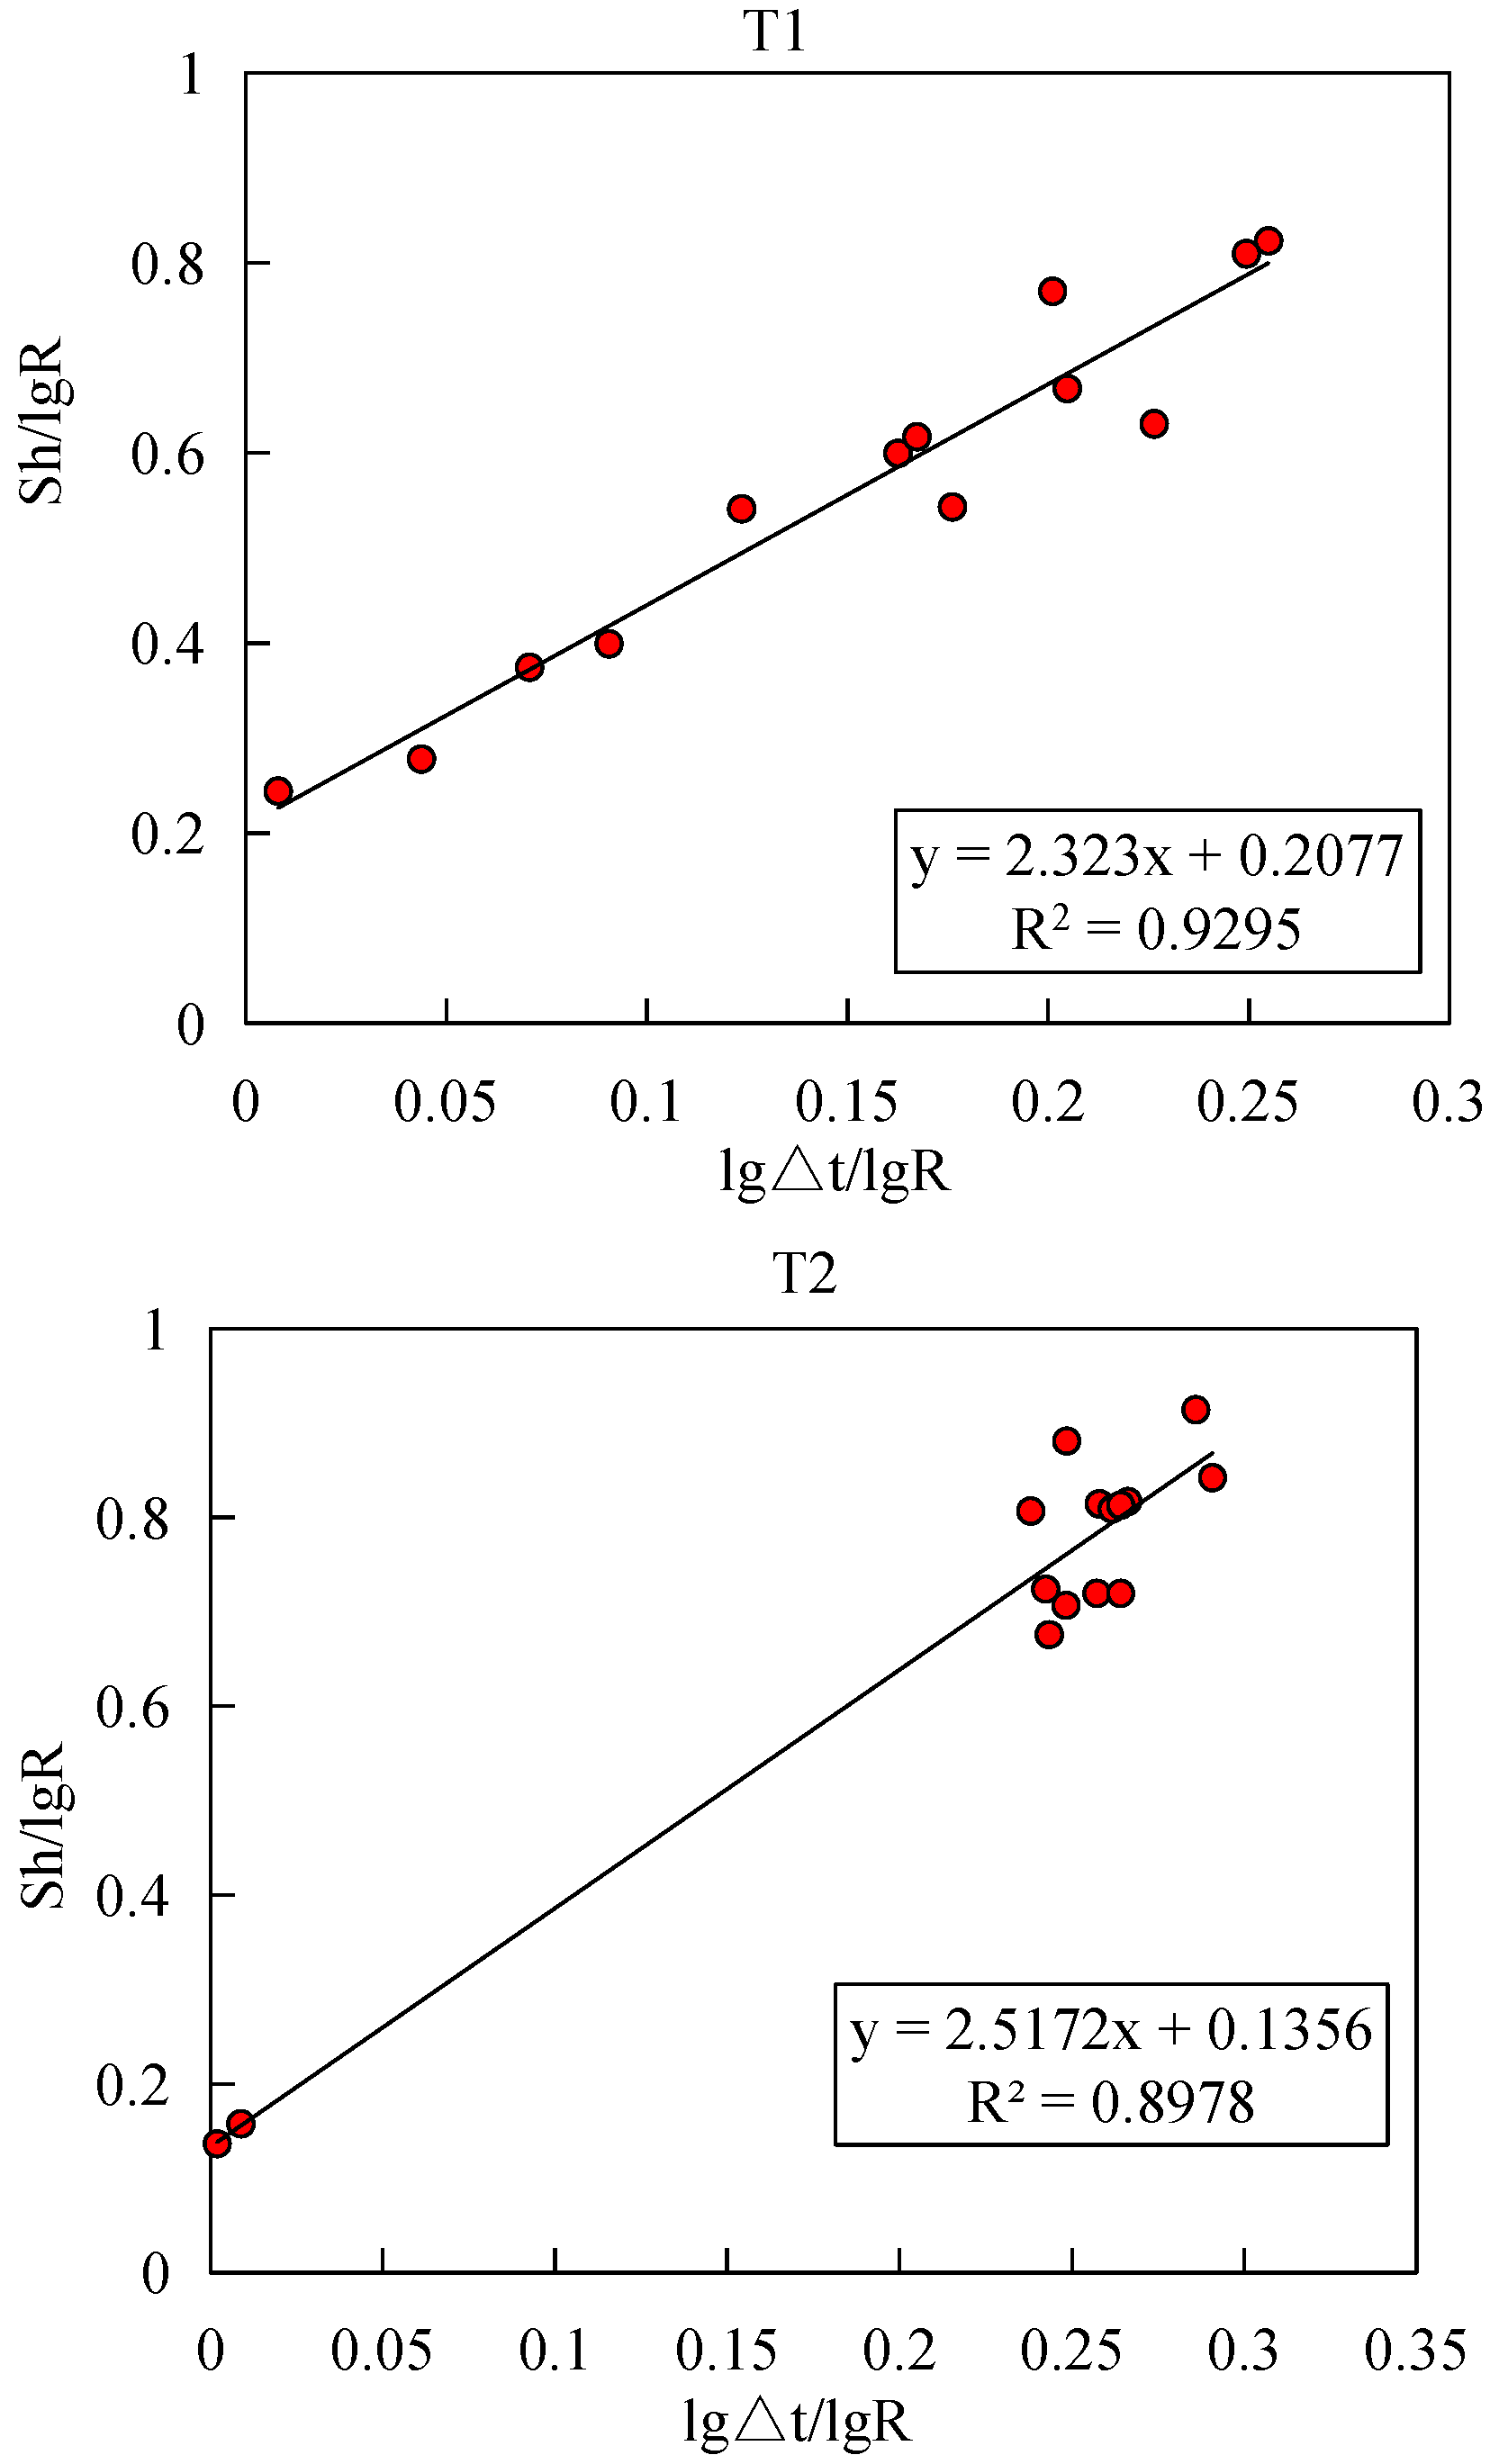
4.4. Resistivity DT Logging Method
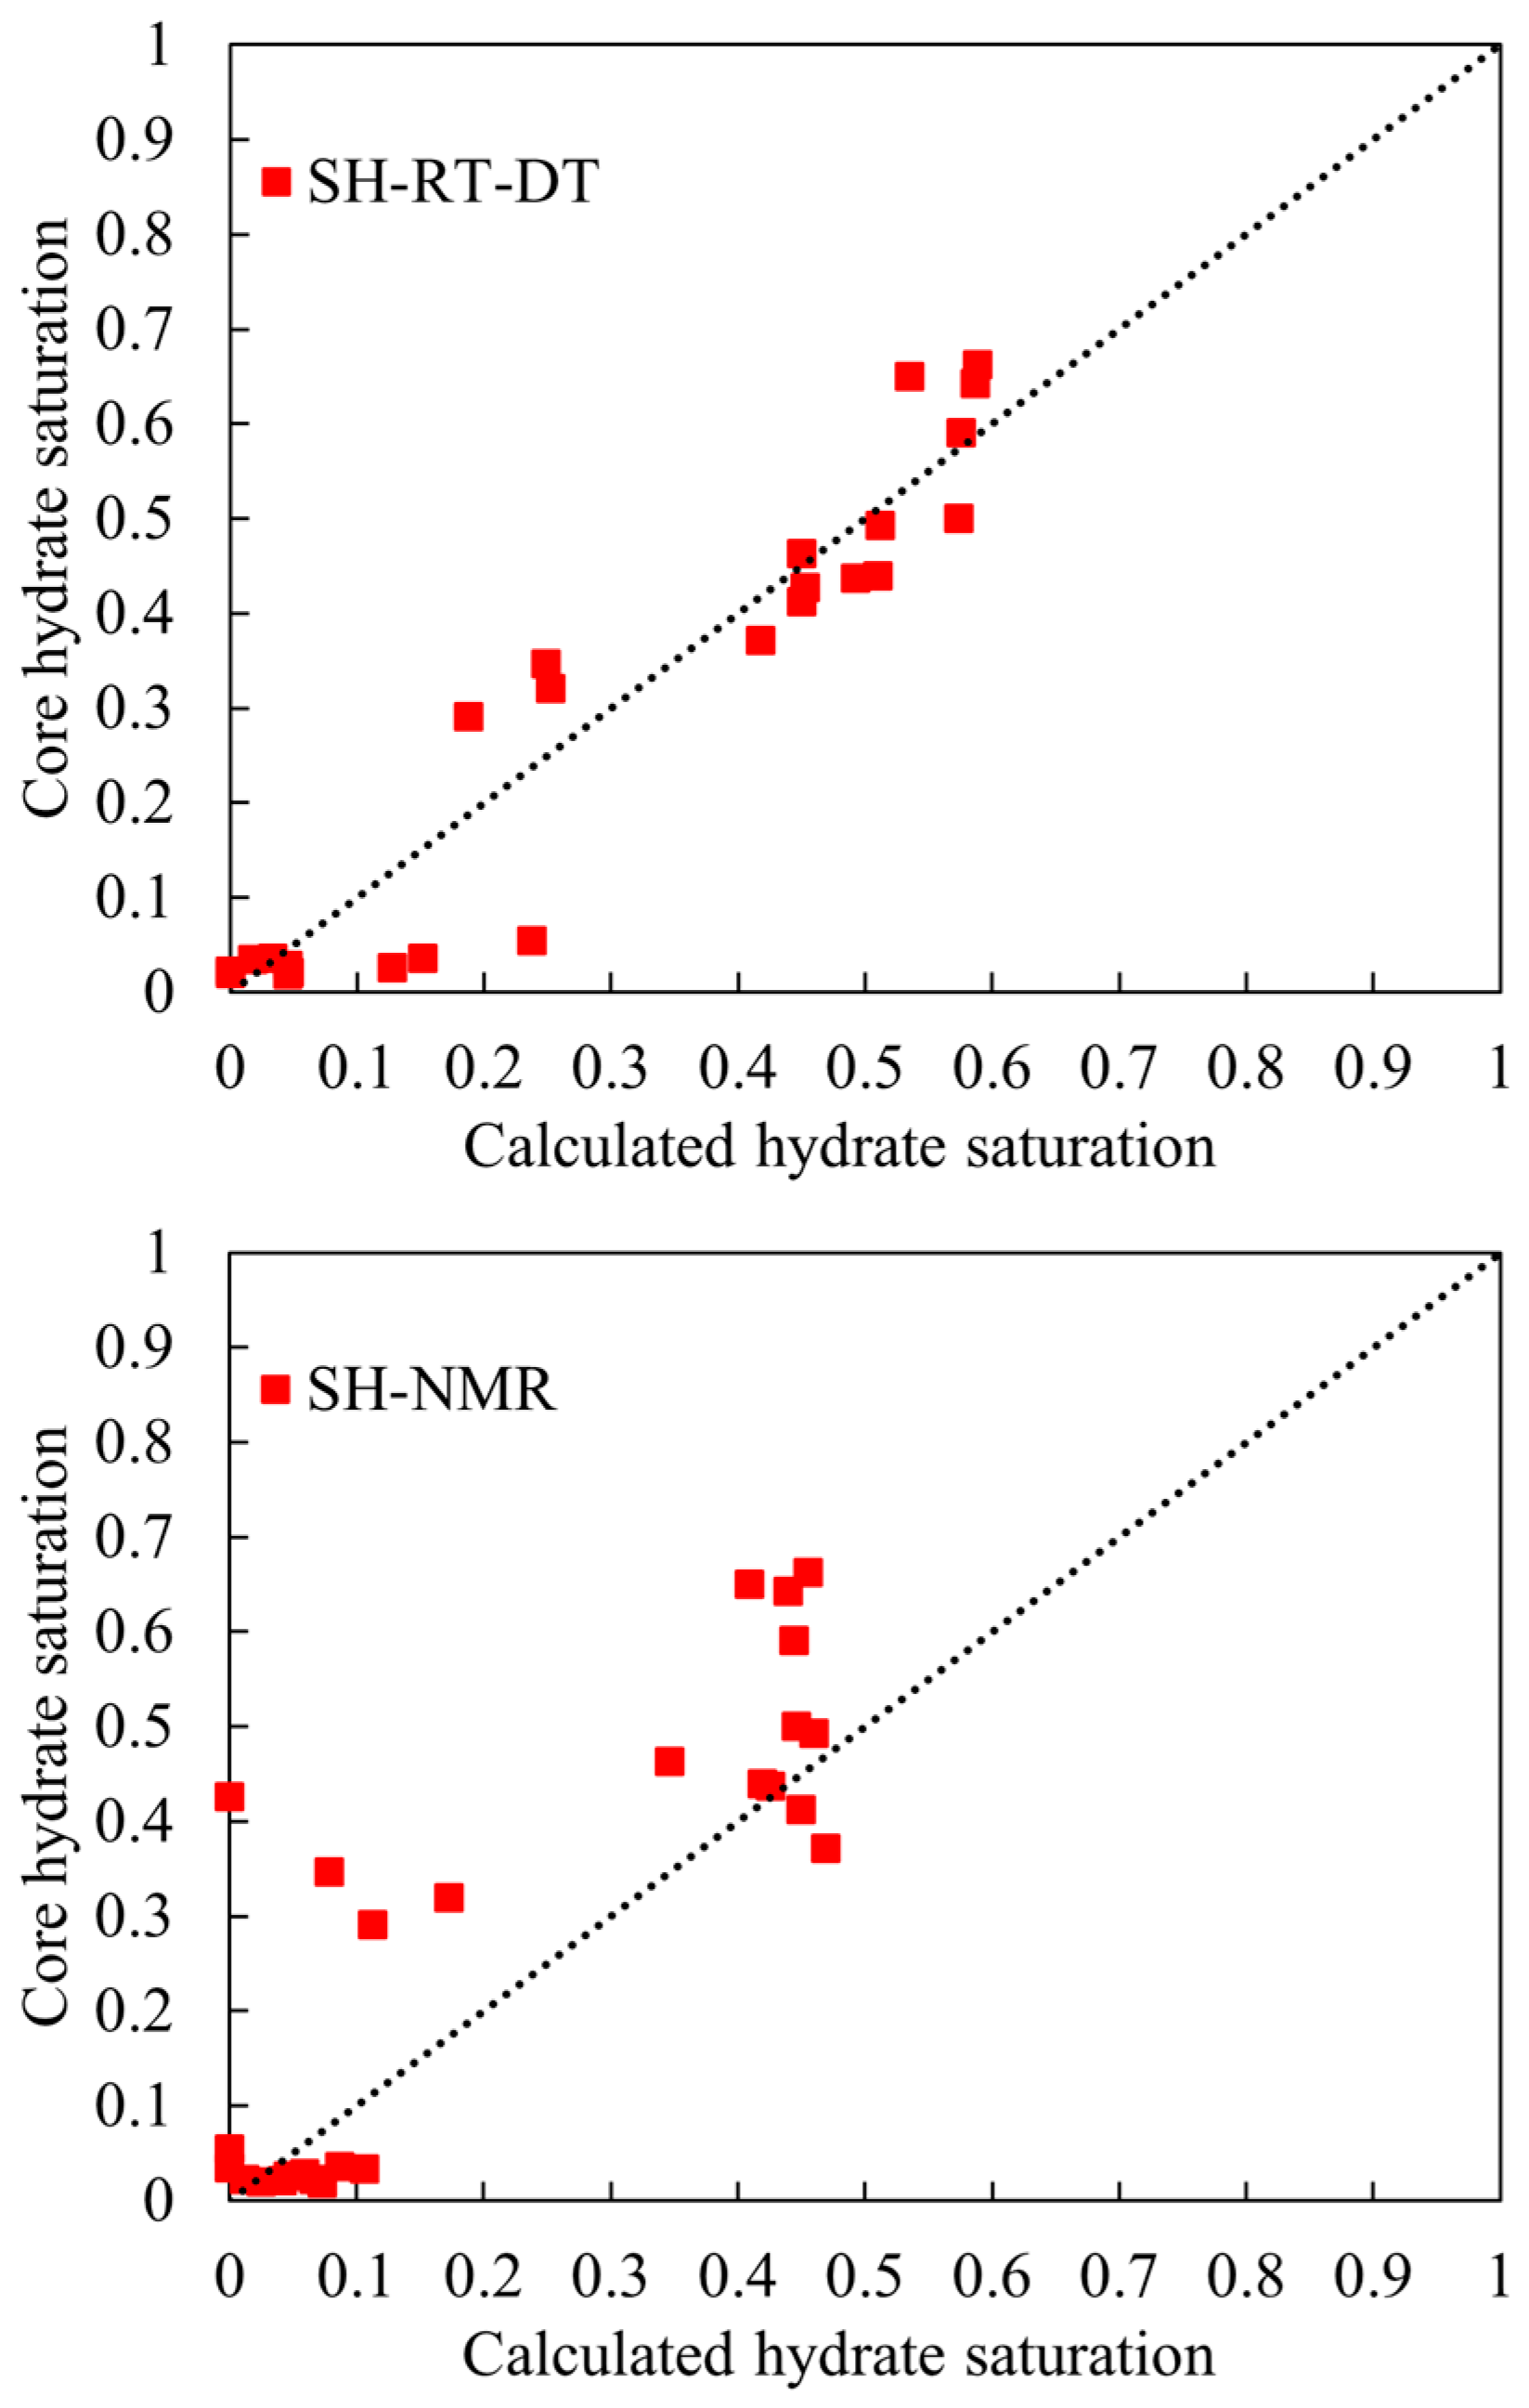
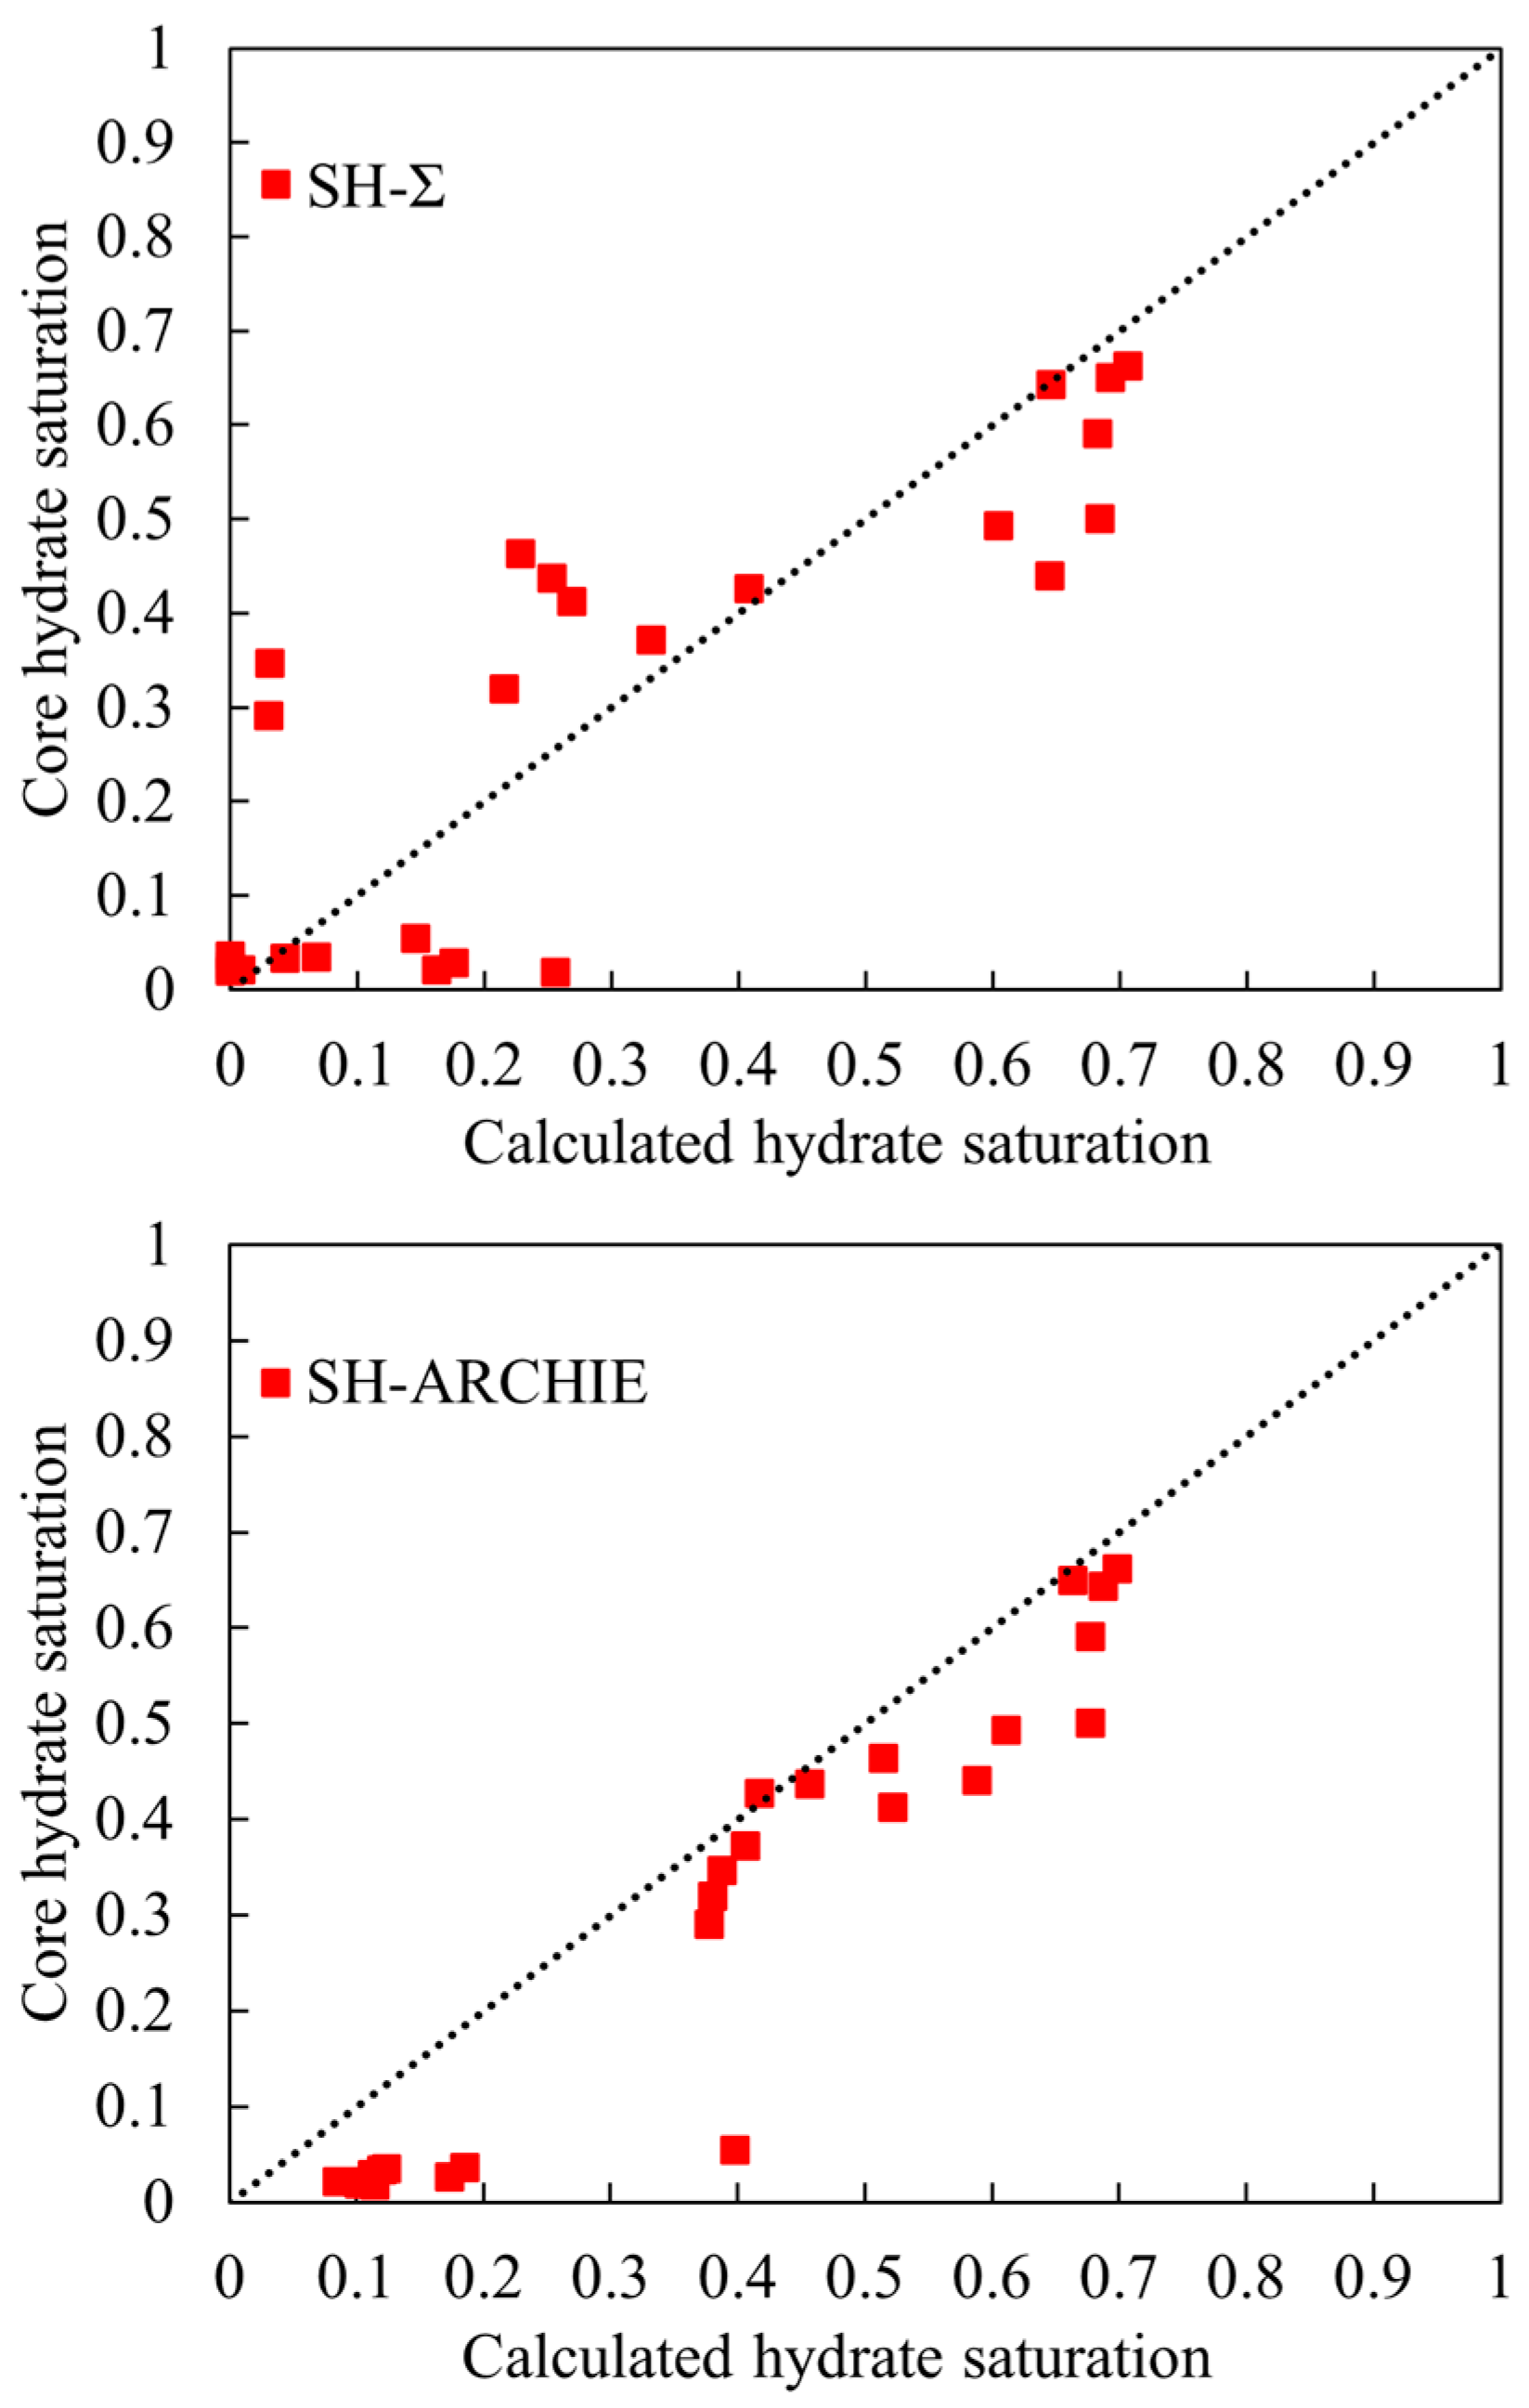
5. Discussion
5.1. Practicability of Each Well-Logging Method
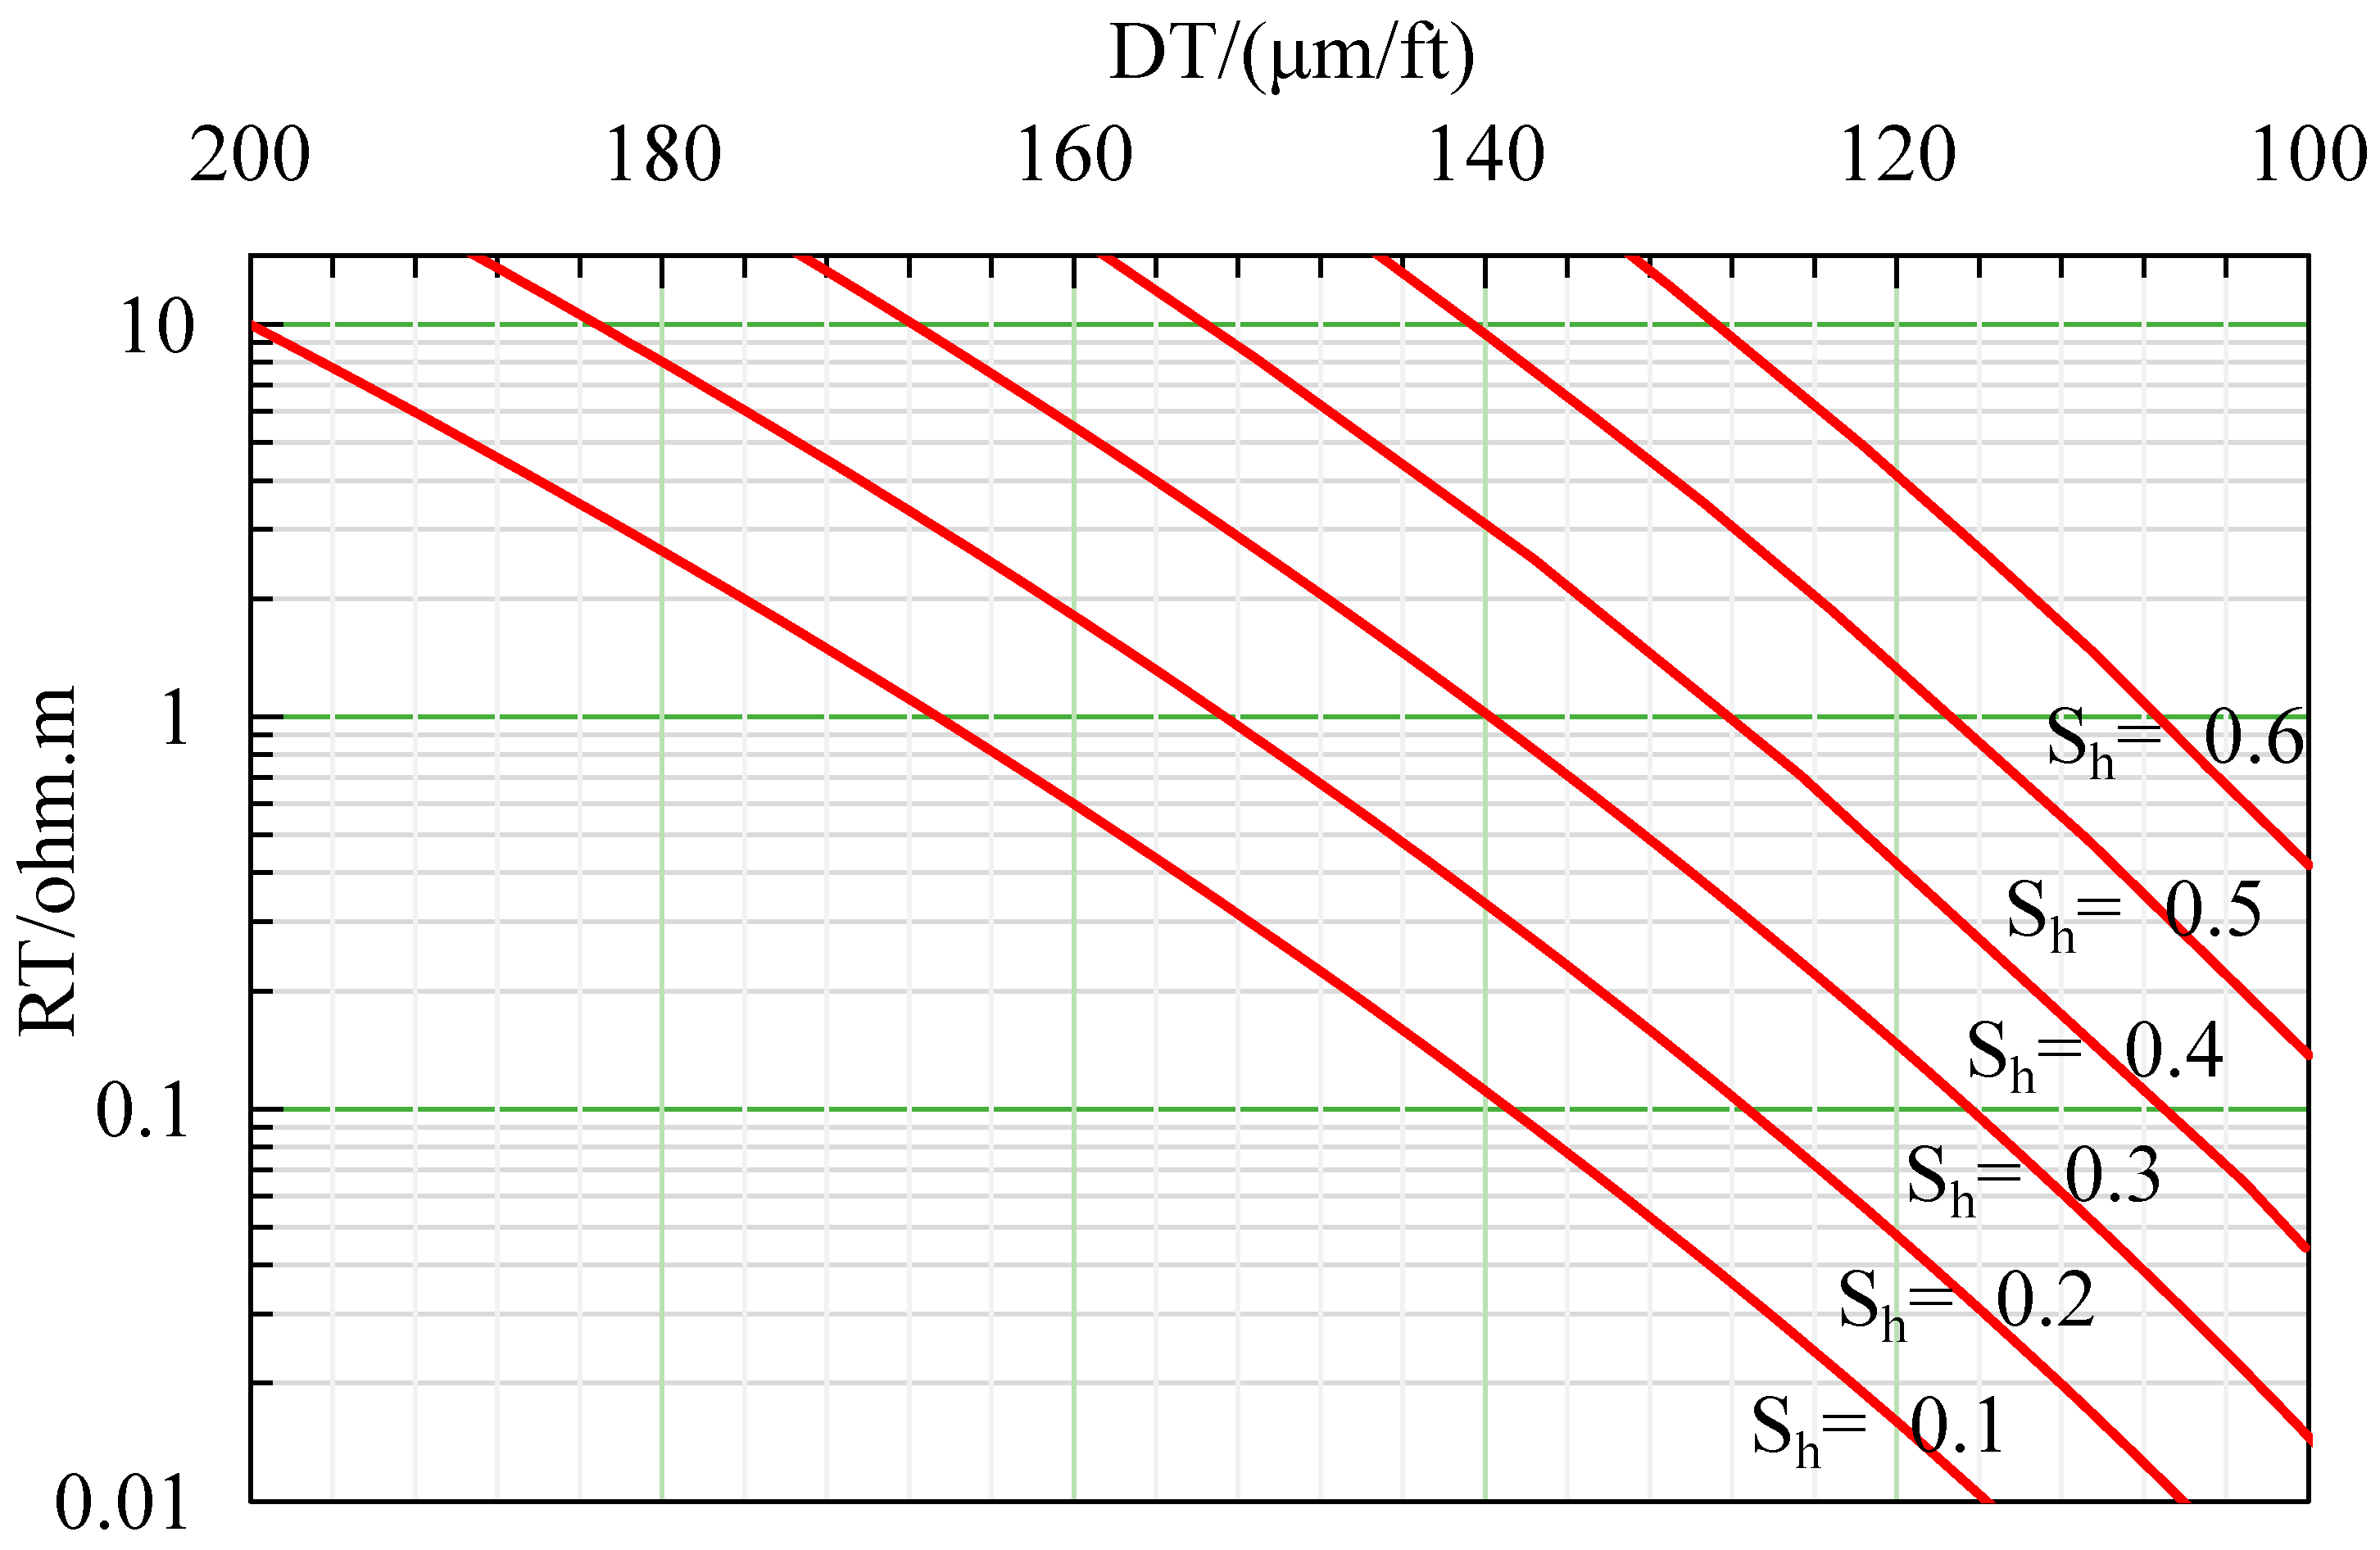
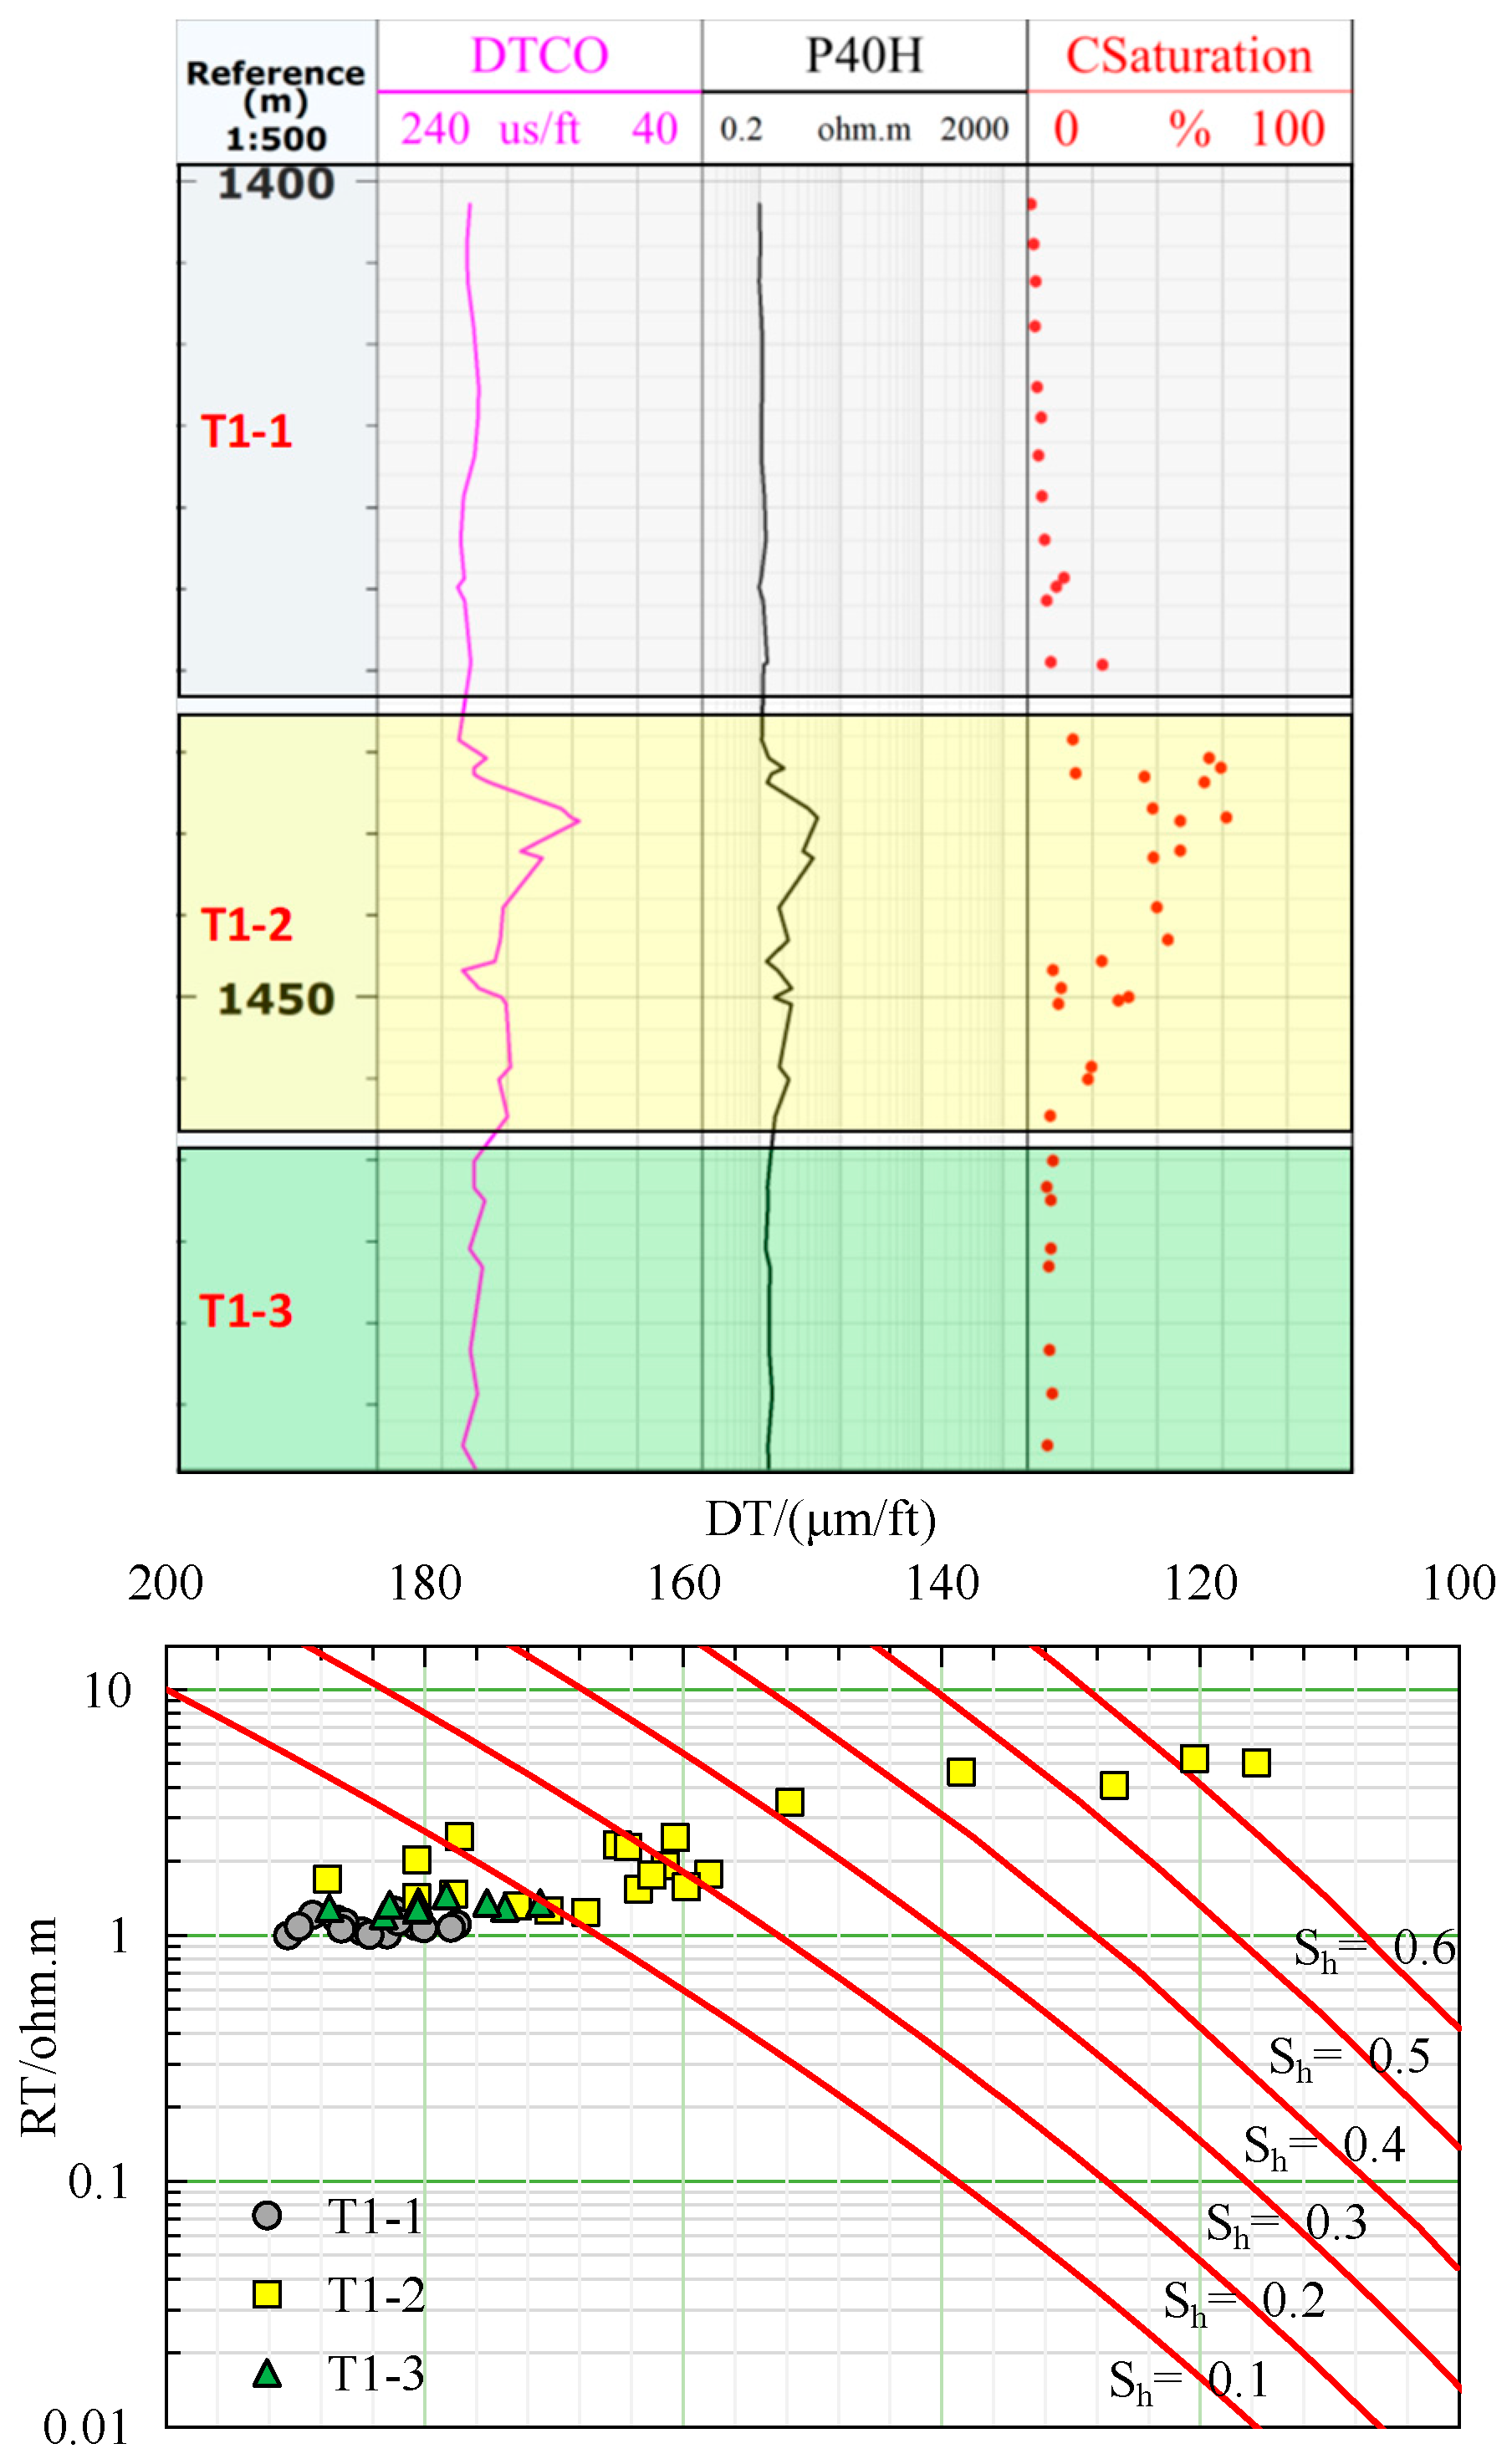
5.2. Rapid Discrimination of Gas Hydrate Saturation in a Resistivity–Acoustic Time Difference Cross Chart
6. Conclusions
Author Contributions
Funding
Data Availability Statement
Conflicts of Interest
References
- Kvenvolden, K.A. Gas hydrates-geological perspective and global change. Rev. Geophys. 1993, 31, 173–187. [Google Scholar] [CrossRef]
- Sloan, E.D. Clathrate Hydrates of Natural Gases, 2nd ed.; Marcel Dekker Inc.: New York, NY, USA, 1998; 628p. [Google Scholar]
- Collett, T.S.; Lee, M.W.; Goldberg, D.S. Data Report: Nuclear Magnetic Resonance Logging while Drilling, ODP Leg 204; College Station, Ocean Drilling Program: Texas, TX, USA, 2006; pp. 1–22. [Google Scholar]
- Zhang, H.Q.; Yang, S.X.; Wu, N.Y.; Xu, X.; Melanie, H.; Peter, S.; Kelly, R.; Heather, B.; Gary, H.; GMGS-1 Science Team. Successful and surprising results for China’s first gas hydrate drilling expedition. In Fire in the Ice. Methane Hydrate Newsletter; National Energy Technology Laboratory, US Department of Energy: Pittsburgh, PA, USA, 2007; Volume 7, pp. 6–9. [Google Scholar]
- Huang, L.; Yin, Z.; Wan, Y.; Li, X.; Lu, C. Evaluation and comparison of the gas production potential of the typical four gas hydrate deposits in Shenhu area, South China sea. Energy 2020, 204, 117955. [Google Scholar]
- Ye, J.; Qin, X.; Xie, W.; Lu, H.; Ma, B.; Qiu, H. The second natural gas hydrate production test in the South China Sea. China Geol. 2020, 2, 197–209. [Google Scholar] [CrossRef]
- Xie, Y.F.; Lu, J.A.; Cai, H.M.; Deng, W.; Kuang, Z.G.; Wang, T.; Kang, D.J.; Zhu, C.Q. The in-situ NMR evidence of gas hydrate forming in micro-pores in the Shenhu area, South China Sea. Energy Rep. 2022, 8, 2936–2946. [Google Scholar] [CrossRef]
- Singh, S.C.; Minshull, T.A.; Spence, G.D. Velocity structure of a gas hydrate reflector. Science 1993, 260, 204–207. [Google Scholar] [CrossRef]
- Holbrook, W.S.; Hoskins, H.; Wood, W.T.; Stephen, R.A.; Lizarralde, D. Methane hydrate and free gas on the Blake Ridge from vertical seismic profiling. Science 1996, 273, 1840–1843. [Google Scholar] [CrossRef]
- Hyndman, R.D.; Spence, G.D. A seismic study of methane hydrate marine bottom simulating reflectors. J. Geophys. Res. Solid Earth 1992, 97, 6683–6698. [Google Scholar] [CrossRef]
- Zhang, W.; Liang, J.Q.; Su, P.B.; Wei, J.G.; Hua, G.Y.; Lin, L.; Jin, L.; Wei, H. Distribution and Characteristics of Mud Diapirs, Gas Chimneys, and Bottom Simulating Reflectors Associated with Hydrocarbon Migration and Gas Hydrate Accumulation in the Qiongdongnan Basin, Northern Slope of the South China Sea. Geol. J. 2019, 54, 3556–3573. [Google Scholar] [CrossRef]
- Dai, J.; Xu, H.; Snyder, F.; Dutta, N. Detection and estimation of gas hydrates using rock physics and seismic inversion: Examples from the northern deep-water Gulf of Mexico. Lead. Edge 2004, 23, 60–66. [Google Scholar] [CrossRef] [Green Version]
- Dai, J.; Snyder, F.; Gillespie, D.; Koesoemadinata, A.; Dutta, N. Exploration for gas hydrates in the deepwater, northern Gulf of Mexico: Part I. A seismic approach based on geological model, inversion, and rock physics principles. Mar. Pet. Geol. 2008, 25, 830–844. [Google Scholar] [CrossRef]
- Zhong, G.; Zhang, D.; Zhao, L. Current states of well-logging evaluation of deep-sea gas hydrate-bearing sediments by the international scientific ocean drilling (DSDP/ODP/IODP) programs. Nat. Gas Ind. B 2021, 8, 128–145. [Google Scholar] [CrossRef]
- Zhu, L.Q.; Ma, Y.S.; Cai, J.C.; Zhang, C.M.; Wu, S.G.; Zhou, X.Q. Key factors of marine shale conductivity in southern china—Part I: The influence factors other than the porosity. J. Pet. Sci. Eng. 2021, 205, 108698. [Google Scholar] [CrossRef]
- Zhu, L.Q.; Ma, Y.S.; Cai, J.C.; Zhang, C.M.; Wu, S.G.; Zhou, X.Q. Key factors of marine shale conductivity in southern China—Part II: The influence of pore space and the development direction of shale gas saturation models. J. Pet. Sci. Eng. 2022, 209, 109516. [Google Scholar] [CrossRef]
- Zhou, X.Q.; Zhang, C.; Zhang, Z.S.; Zhang, R.F.; Zhu, L.Q.; Zhang, C.M. A saturation evaluation method in tight gas sandstones based on diagenetic facies. Mar. Pet. Geol. 2019, 107, 310–325. [Google Scholar] [CrossRef]
- Zhu, L.Q.; Zhang, C.M.; Zhang, Z.S.; Zhou, X.Q. High-precision calculation of gas saturation in organic shale pores using an intelligent fusion algorithm and a multi-mineral model. Adv. Geo-Energy Res. 2020, 4, 135–151. [Google Scholar] [CrossRef]
- Archie, G.E. The electrical resistivity log as an aid in determining some reservoir characteristics. Trans. AIME 1942, 146, 54–62. [Google Scholar] [CrossRef]
- Mungan, N.; Moore, E.J. Certain wettability effects on electrical resistivity in porous media. J. Can. Petrol. Technol. 1968, 7, 20–25. [Google Scholar] [CrossRef]
- Lei, D.W.; Tang, Y.; Chang, Q.S. The deep and relatively high-quality clastic reservoir bodies and favorable exploration areas in the southern margin of junggar basin. Xinjiang Pet. Geol. 2008, 29, 435–438. [Google Scholar]
- Spangenberg, E. Modeling of the influence of gas hydrate content on the electrical properties of porous sediments. J. Geophys. Res. Solid Earth 2001, 106, 6535–6548. [Google Scholar] [CrossRef]
- Chen, Q.; Wu, N.; Liu, C.; Zou, C.; Yang, L.; Sun, J.; Li, Y.; Hu, G. Research Progress on Global Marine Gas Hydrate Resistivity Logging and Electrical Property Experiments. J. Mar. Sci. Eng. 2022, 10, 645. [Google Scholar] [CrossRef]
- Waxman, M.H.; Thomas, E.C. Saturation modeling: Using the Waxman-Smits Model/Equation in saturation determination in dispersed shaly sands. J. Multidiscip. Eng. Sci. Technol. 2016, 3, 4985–4992. [Google Scholar]
- Hu, X.D.; Zou, C.C. Application of HB model in hydrate saturation evaluation in frozen soil area of Qilian Mountain. In Proceedings of the Annual Meeting of China Geoscience Federation, Beijing, China, 15–18 October 2017; pp. 521–522. [Google Scholar]
- Wang, X.J.; Wu, S.G.; Lee, M.; Guo, Y.Q.; Yang, S.X.; Liang, J.Q. Gas hydrate saturation from acoustic impedance and resistivity logs in the Shenhu area, South China Sea. Mar. Pet. Geol. 2011, 28, 1625–1633. [Google Scholar] [CrossRef]
- Zhao, J.; Shi, Z.F.; Li, Y.P.; Xiang, X.R.; Li, J.; Wei, N. Simulation of conductivity characteristics of gas hydrate reservoirs and its saturation calculation. Nat. Gas. Geosci. 2021, 32, 1261–1269. [Google Scholar]
- Kang, D.J.; Liang, J.Q.; Kuang, Z.G.; Lu, J.A.; Guo, Y.Q.; Liang, J.; Cai, H.M.; Qu, C.W. Application of element capture energy spectrum logging in evaluation of natu-ral gas hydrate reservoir in Shenhu sea area. Nat. Gas Ind. 2018, 38, 54–60. [Google Scholar]
- Chen, G.Q.; Li, C.F.; Liu, C.L.; Xing, L.C. Effect of microscopic distribution of methane hydrate on resistivity in porous media. Adv. New Renew. Energy 2019, 7, 493–499. [Google Scholar]
- Lee, M.W.; Hutchinson, D.R.; Dillon, W.P. Method of estimating the amount of in situ gas hydrates in deep marine sediments. Mar. Petrol. Geol. 1993, 10, 493–506. [Google Scholar] [CrossRef]
- Guerin, G.; Goldberg, D.; Meltser, A. Characterization of in situ elastic properties of gas hydrate-bearing sediments on the Blake Ridge. J. Geophys. Res. 1999, 104, 17781–17795. [Google Scholar] [CrossRef]
- Yadav, U.S.; Shukla, K.M.; Ojha, M.; Kumar, P.; Shankar, U. Assessment of gas hydrate accumulations using velocities derived from vertical seismic profiles and acoustic log data in Krishna-Godavari Basin, India. Mar. Petrol. Geol. 2019, 108, 551–561. [Google Scholar] [CrossRef]
- Freedman, R.; Minh, C.C.; Gubelin, G. Combining NMR and density logs for petrophysical analysis in gas-bearing formations. In Proceedings of the Society of Petrophysicists and Well-Log Analysts 39th Annual Logging Symposium, Keystone, CO, USA, 26–28 May 1998. [Google Scholar]
- Li, Y.L.; Liu, L.L.; Jin, Y.R.; Wu, N.Y. Characterization and development of natural gas hydrate in marine clayey-silt reservoirs: A review and discussion. Adv. Geo-Energy Res. 2021, 5, 75–86. [Google Scholar] [CrossRef]
- Sherif, F.; Souvik, S.; Shib, S.G.; Fayez, A.; Mohamed, A.; Khaled, A.K.; Priyantan, G. An integrated petrographical, petrophysical and organic geochemical characterization of the Lower Turonian Abu Roash-F carbonates, Abu Gharadig field, Egypt–Inferences on self-sourced unconventional reservoir potential. Mar. Pet. Geol. 2022, 145, 105885. [Google Scholar]
- Wang, D.D.; Ning, F.L.; Lu, J.A.; Kang, D.J.; Xie, Y.F.; Li, J.; Sun, J.X.; Ou, W.J.; Liu, Z.C.; Fang, B.; et al. Reservoir characteristics and critical influencing factors on gas hydrate accumulations in the Shenhu area, South China Sea. Mar. Pet. Geol. 2021, 133, 105238. [Google Scholar] [CrossRef]
- Sha, Z.B.; Liang, J.Q.; Zhang, G.X.; Yang, S.X.; Lu, J.A.; Zhang, Z.J.; McConnell, D.R.; Humphrey, G. A seepage gas hydrate system in the northern South China Sea: Seismic and well log interpretations. Mar. Geol. 2015, 366, 69–78. [Google Scholar] [CrossRef]
- Yang, S.; Liang, J.; Lu, J.G.; Qu, C.; LiU, B. New understandings on characteristics and controlling factors of gas hydrate reservoirs in Shenhu area on the northern slope of the South China Sea. Earth Sci. Front. 2017, 24, 1–14. [Google Scholar]
- Yang, S.; Zhang, M.; Liang, J. Preliminary results of China’s third gas hydrate drilling expedition: A critical step from discovery to development in the South China Sea. Fire Ice 2015, 15, 1–5. [Google Scholar]
- Ge, X.M.; Zeng, B.D.; Li, N.; Xu, H.J.; Liu, H.T.; Gu, D.N.; Sun, W.M.; Fan, Y.R. NMR saturation index and its application to fluid saturation estimation. J. China Univ. Pet. Ed. Nat. Sci. 2021, 45, 64–72. [Google Scholar]
- Kang, D.J.; Lu, J.A.; Zhang, Z.J.; Liang, J.Q.; Kuang, Z.J.; Lu, C.; Kou, B.B.; Lu, Q.P.; Wang, J.L. Fine-grained gas hydrate reservoir properties estimated from well logs and lab measurements at the Shenhu gas hydrate production test site, the northern slope of the South China Sea. Mar. Pet. Geol. 2020, 122, 104676. [Google Scholar] [CrossRef]


| WELL | Coefficient | Coefficient of Determination | Correlation Coefficient | |
|---|---|---|---|---|
| a | b | R2 | R | |
| W1 | 0.1989 | 3.0211 | 0.9110 | 0.9545 |
| W2 | 0.3146 | 2.8776 | 0.9638 | 0.9817 |
| W4 | 0.1778 | 2.3017 | 0.9061 | 0.9519 |
| T1 | 0.2077 | 2.3230 | 0.9295 | 0.9641 |
| T2 | 0.1356 | 2.5172 | 0.8978 | 0.9475 |
| Arithmetic | 0.2069 | 2.6081 | 0.9216 | 0.9599 |
| Standard deviation | 0.0044 | 0.1067 | / | |
| Variance | 0.0663 | 0.3266 | ||
Publisher’s Note: MDPI stays neutral with regard to jurisdictional claims in published maps and institutional affiliations. |
© 2022 by the authors. Licensee MDPI, Basel, Switzerland. This article is an open access article distributed under the terms and conditions of the Creative Commons Attribution (CC BY) license (https://creativecommons.org/licenses/by/4.0/).
Share and Cite
Wan, X.; Zhou, X.; Liang, J.; Wu, S.; Lu, J.; Wei, C.; Wang, R.; Liu, B. Well-Logging Constraints on Gas Hydrate Saturation in Unconsolidated Fine-Grained Reservoirs in the Northern South China Sea. Energies 2022, 15, 9215. https://doi.org/10.3390/en15239215
Wan X, Zhou X, Liang J, Wu S, Lu J, Wei C, Wang R, Liu B. Well-Logging Constraints on Gas Hydrate Saturation in Unconsolidated Fine-Grained Reservoirs in the Northern South China Sea. Energies. 2022; 15(23):9215. https://doi.org/10.3390/en15239215
Chicago/Turabian StyleWan, Xiaoming, Xueqing Zhou, Jinqiang Liang, Shiguo Wu, Jingan Lu, Chenglong Wei, Rui Wang, and Bo Liu. 2022. "Well-Logging Constraints on Gas Hydrate Saturation in Unconsolidated Fine-Grained Reservoirs in the Northern South China Sea" Energies 15, no. 23: 9215. https://doi.org/10.3390/en15239215