
A Methodology to Estimate High-Resolution Gridded Datasets on Energy Consumption Drivers in Ecuador’s Residential Sector during the 2010–2020 Period
 , , , and
Abstract
:1. Introduction
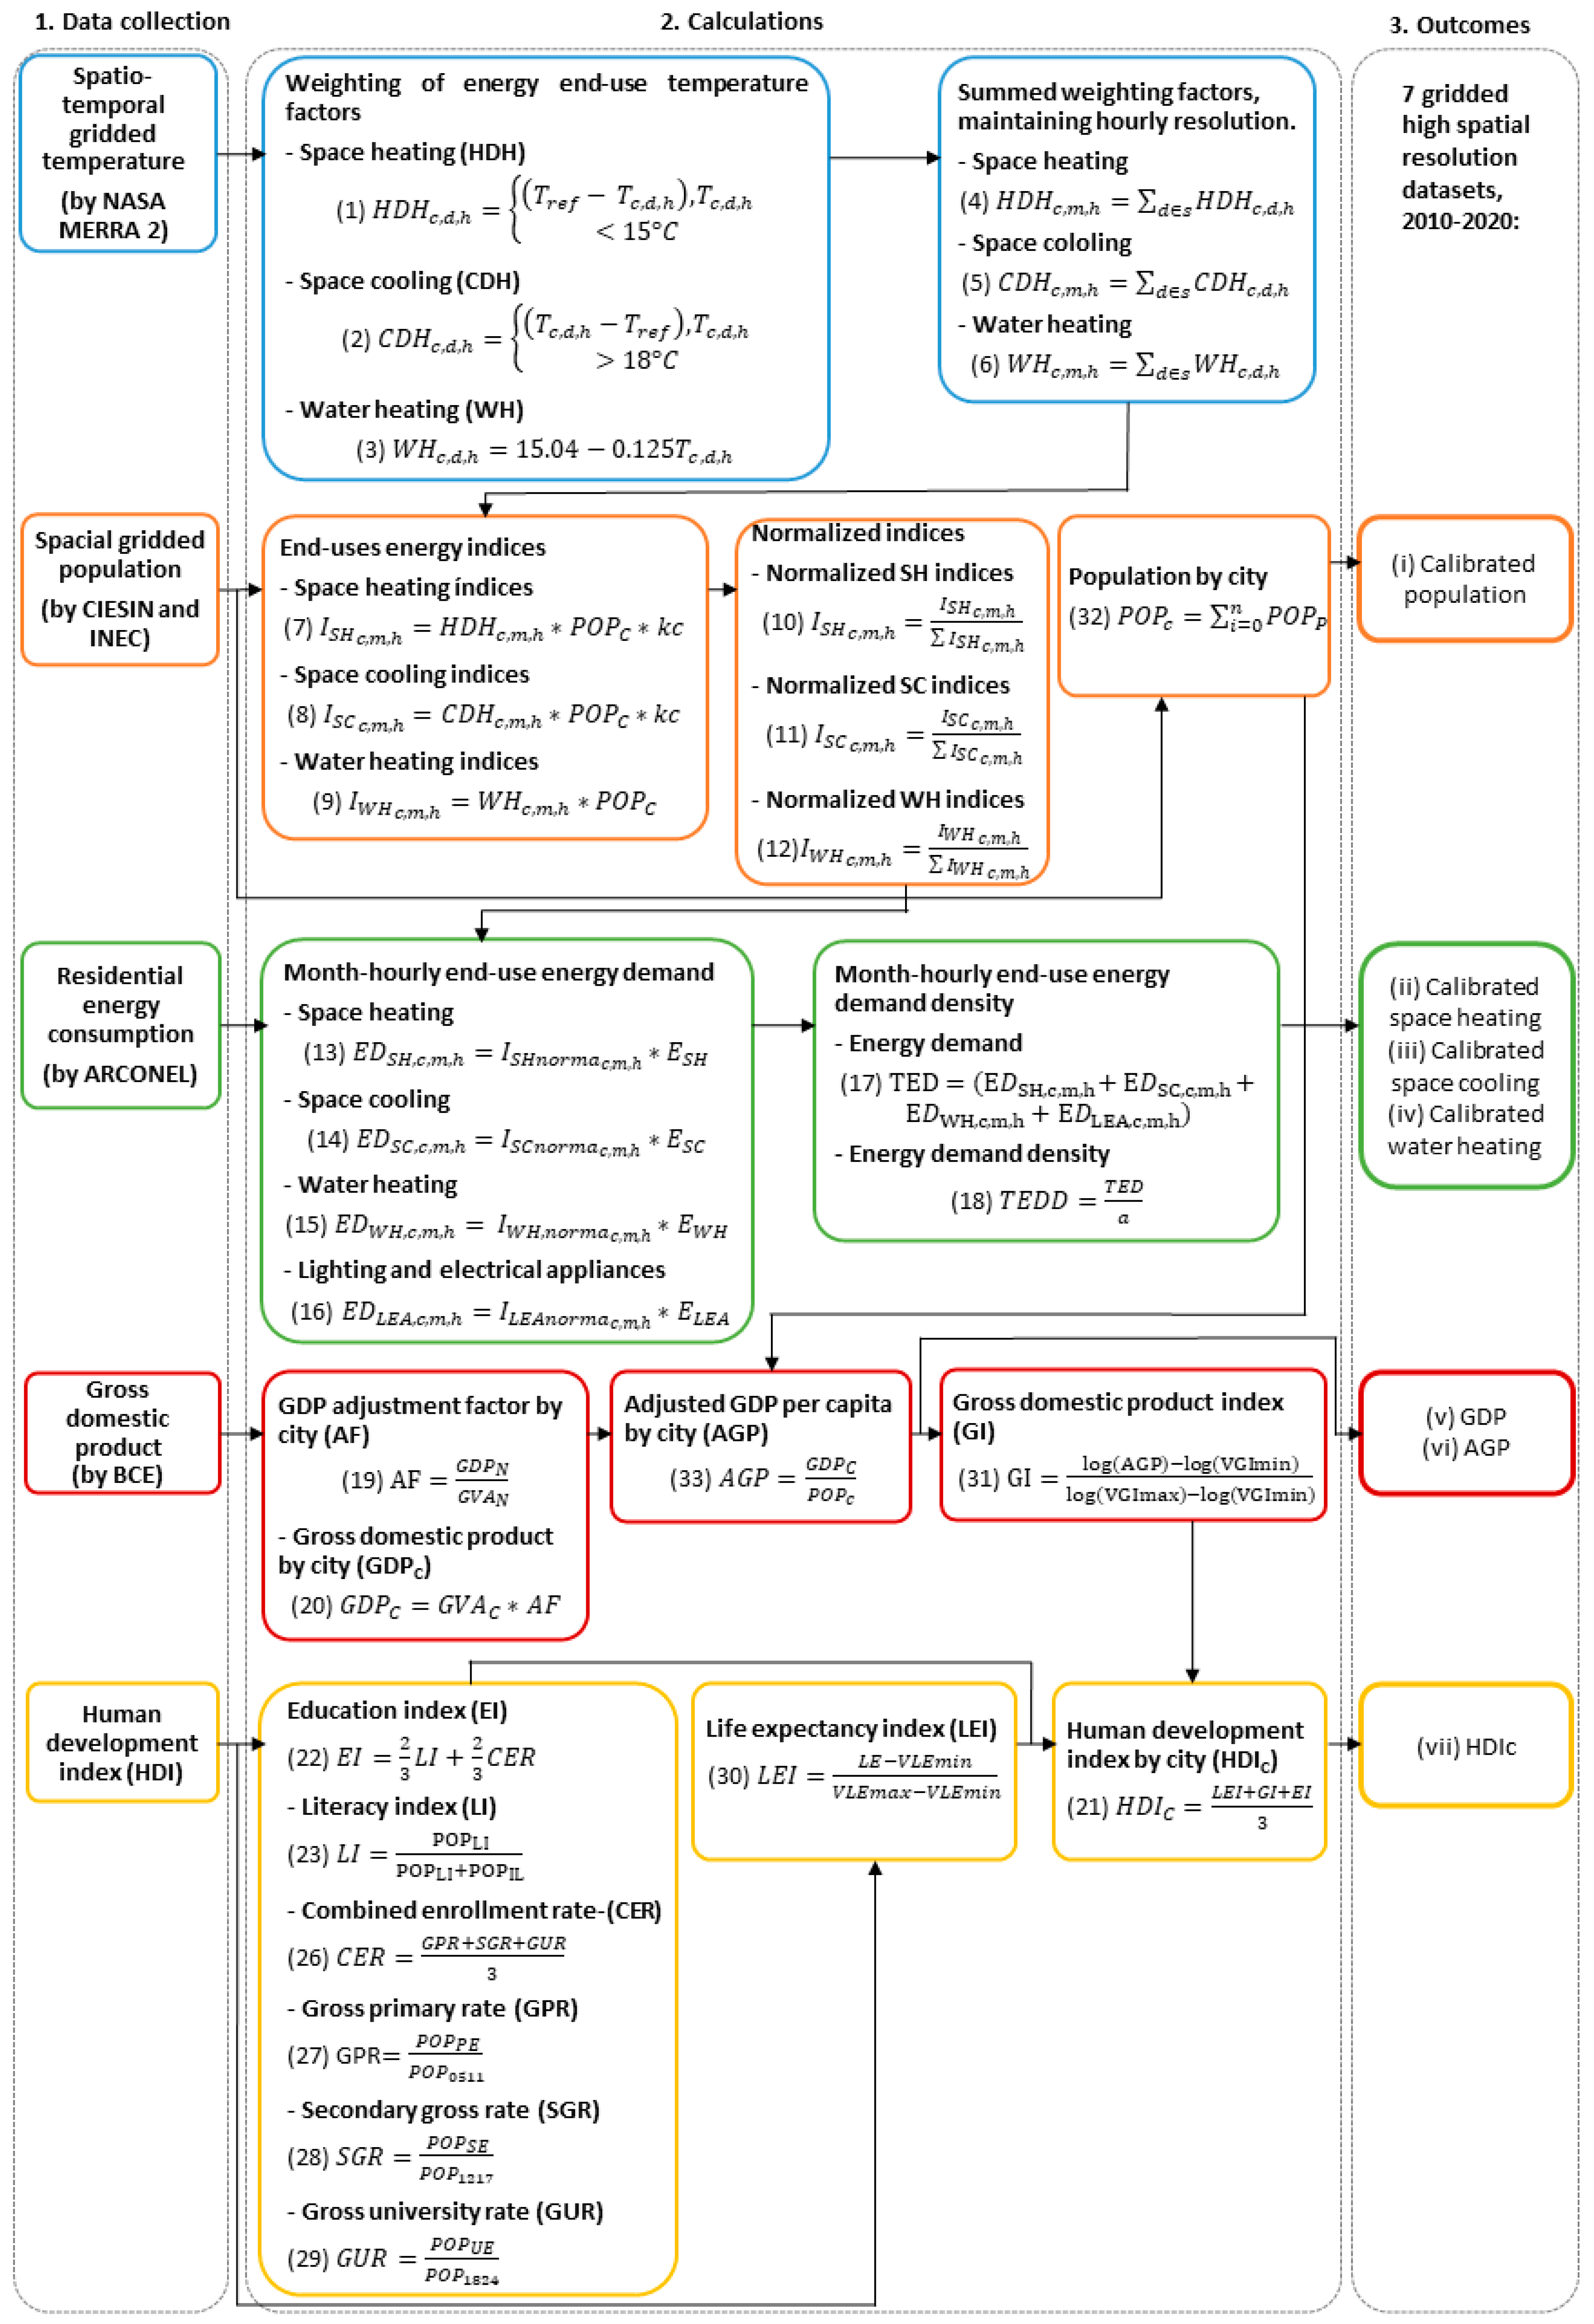
2. Methodology
2.1. Ambient Temperature Factors
2.2. Population
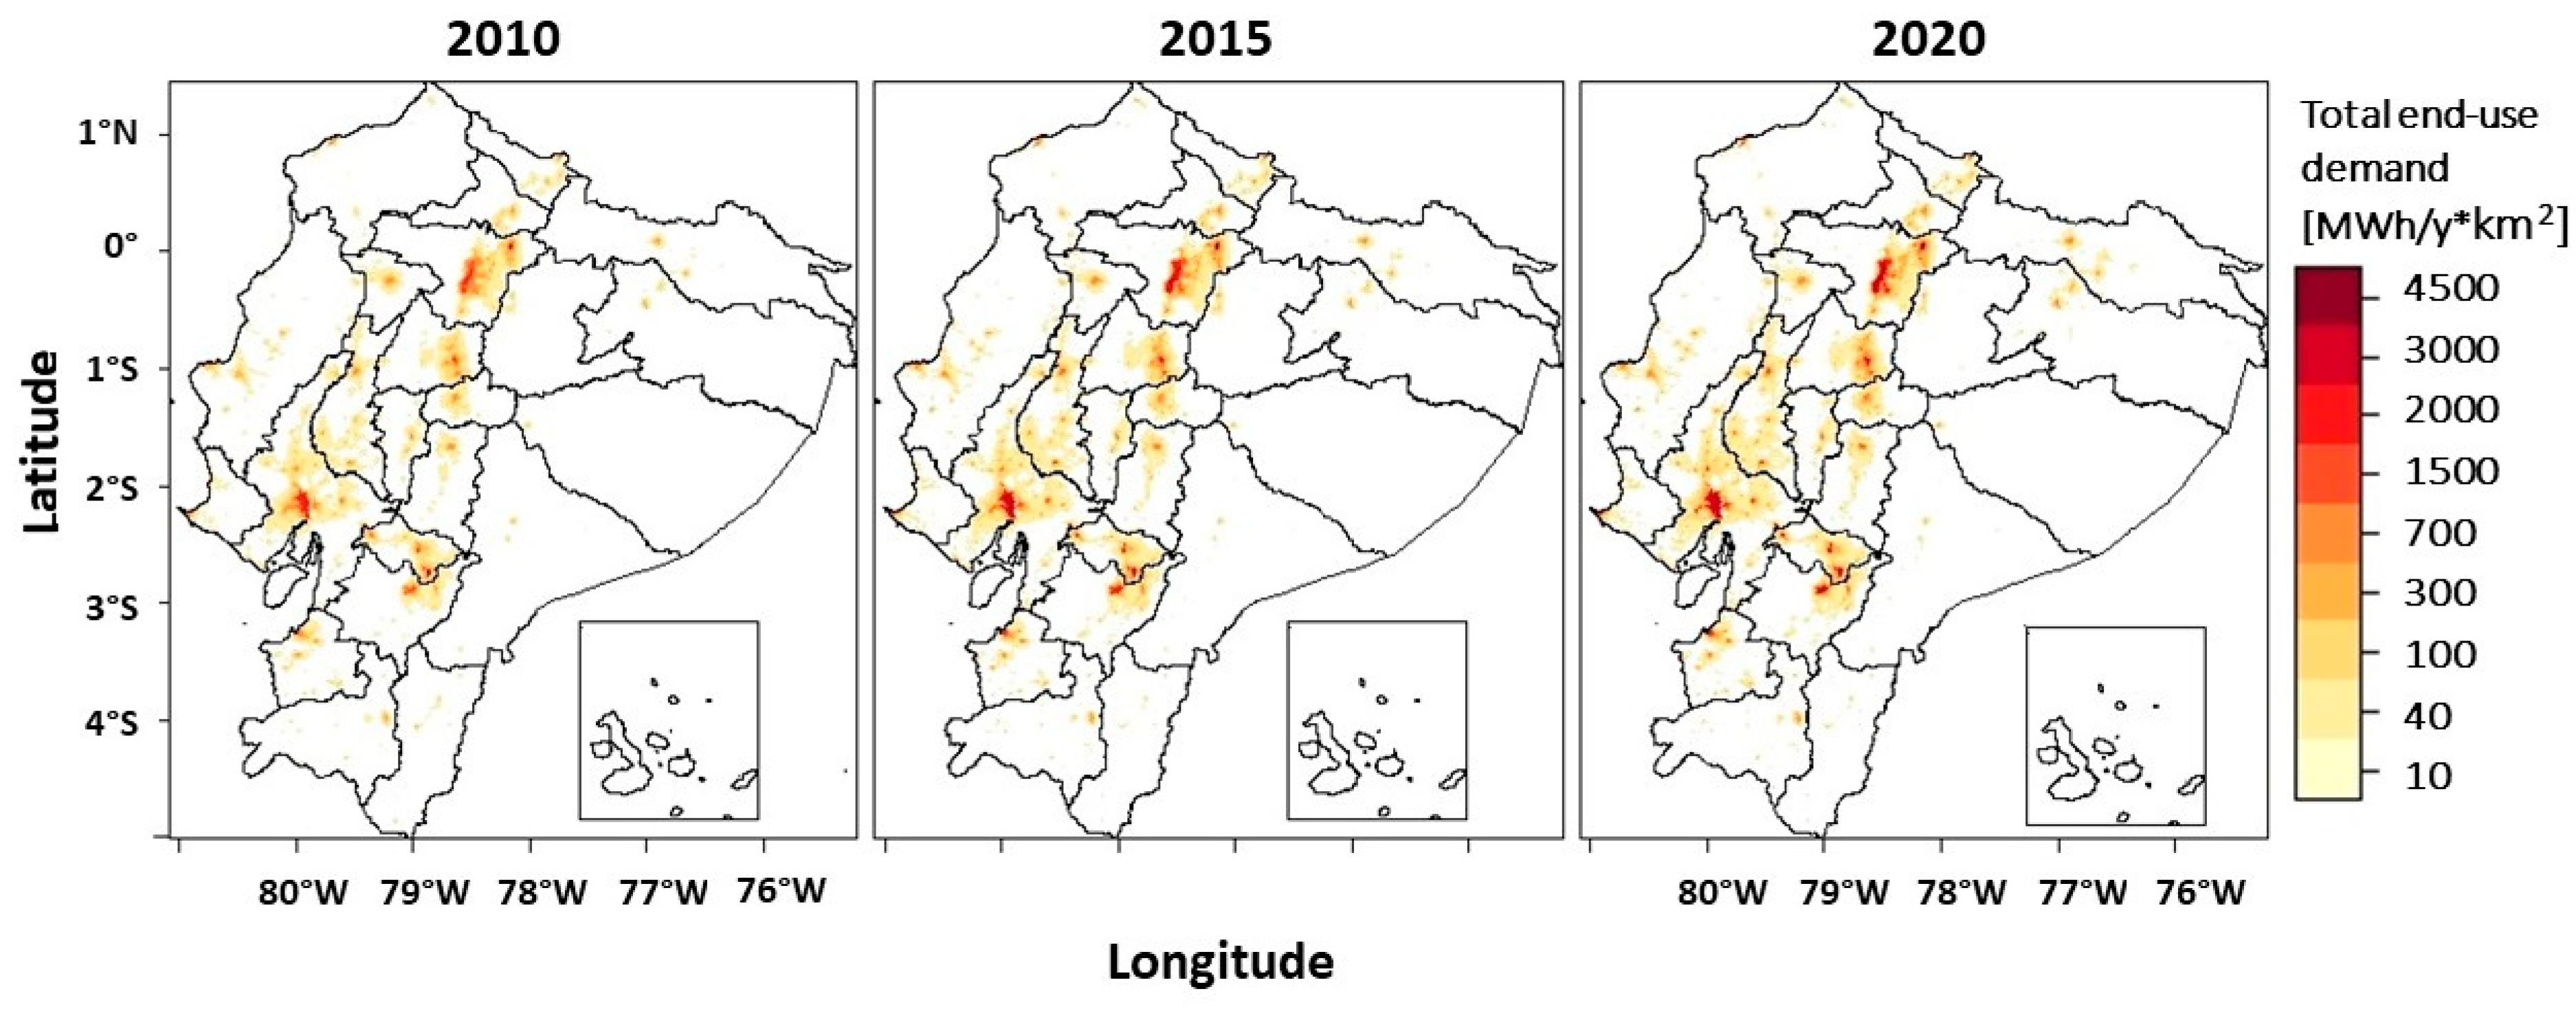
2.3. Energy Demand
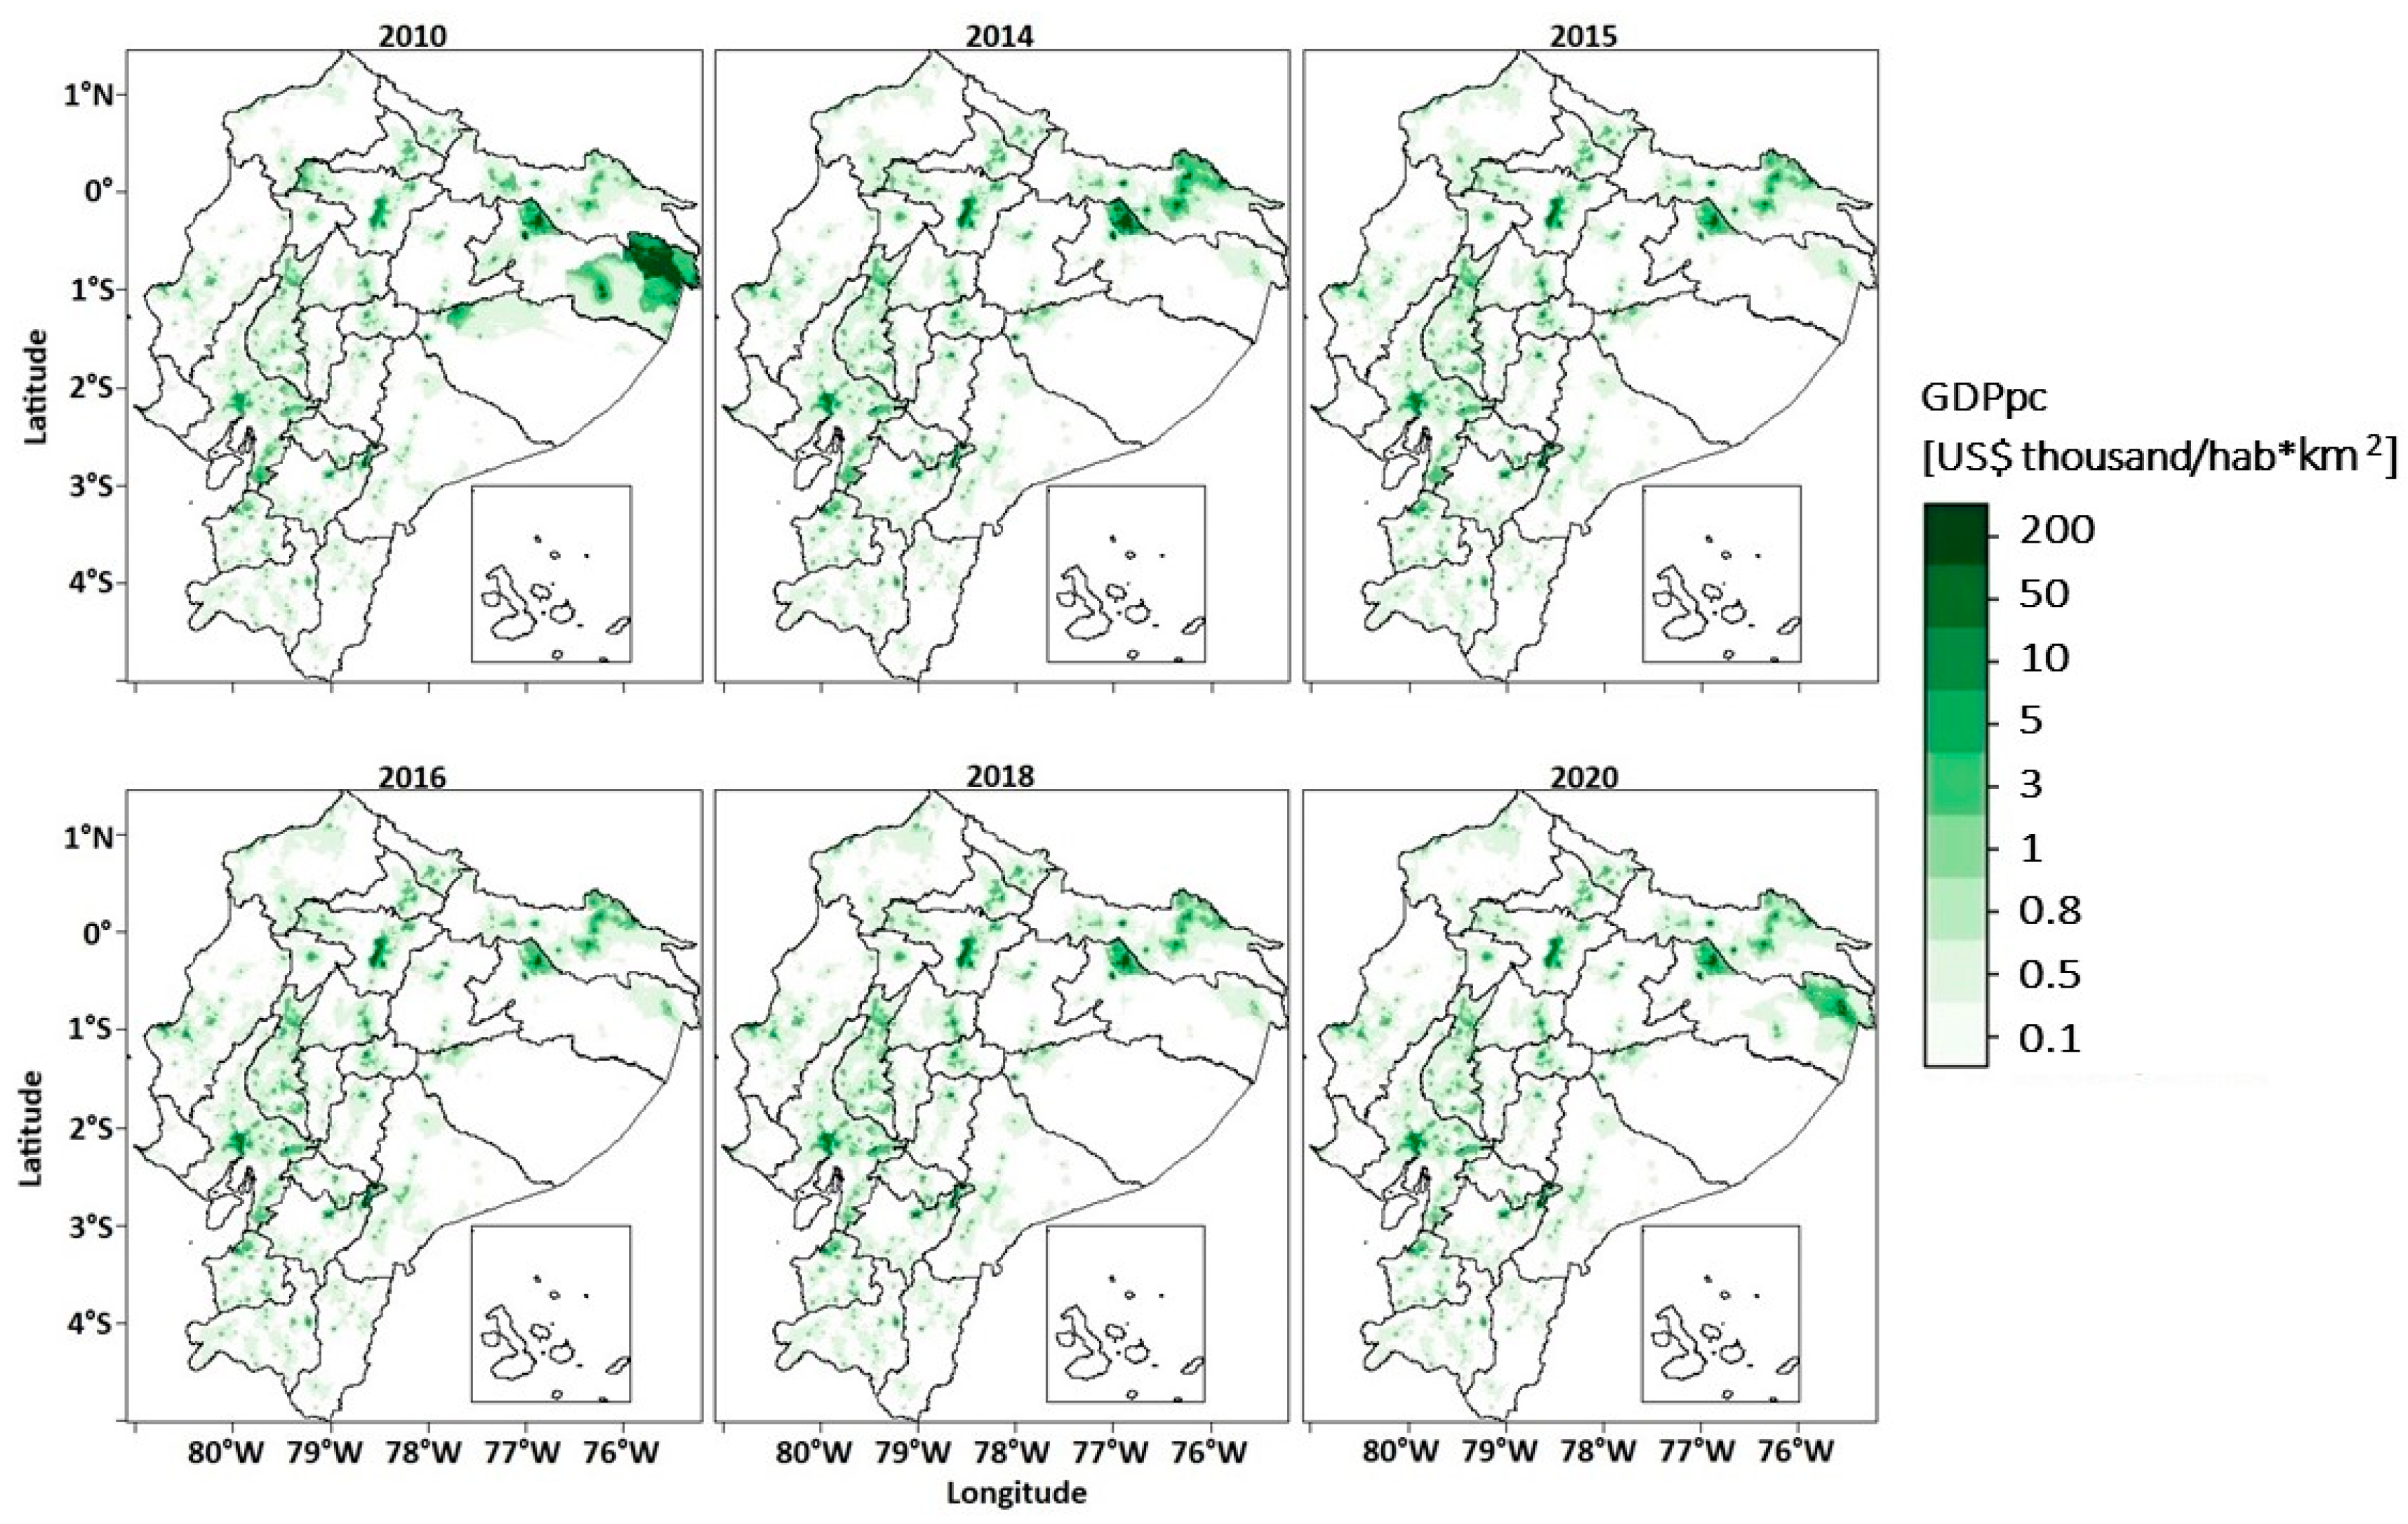
2.4. Gross Domestic Product
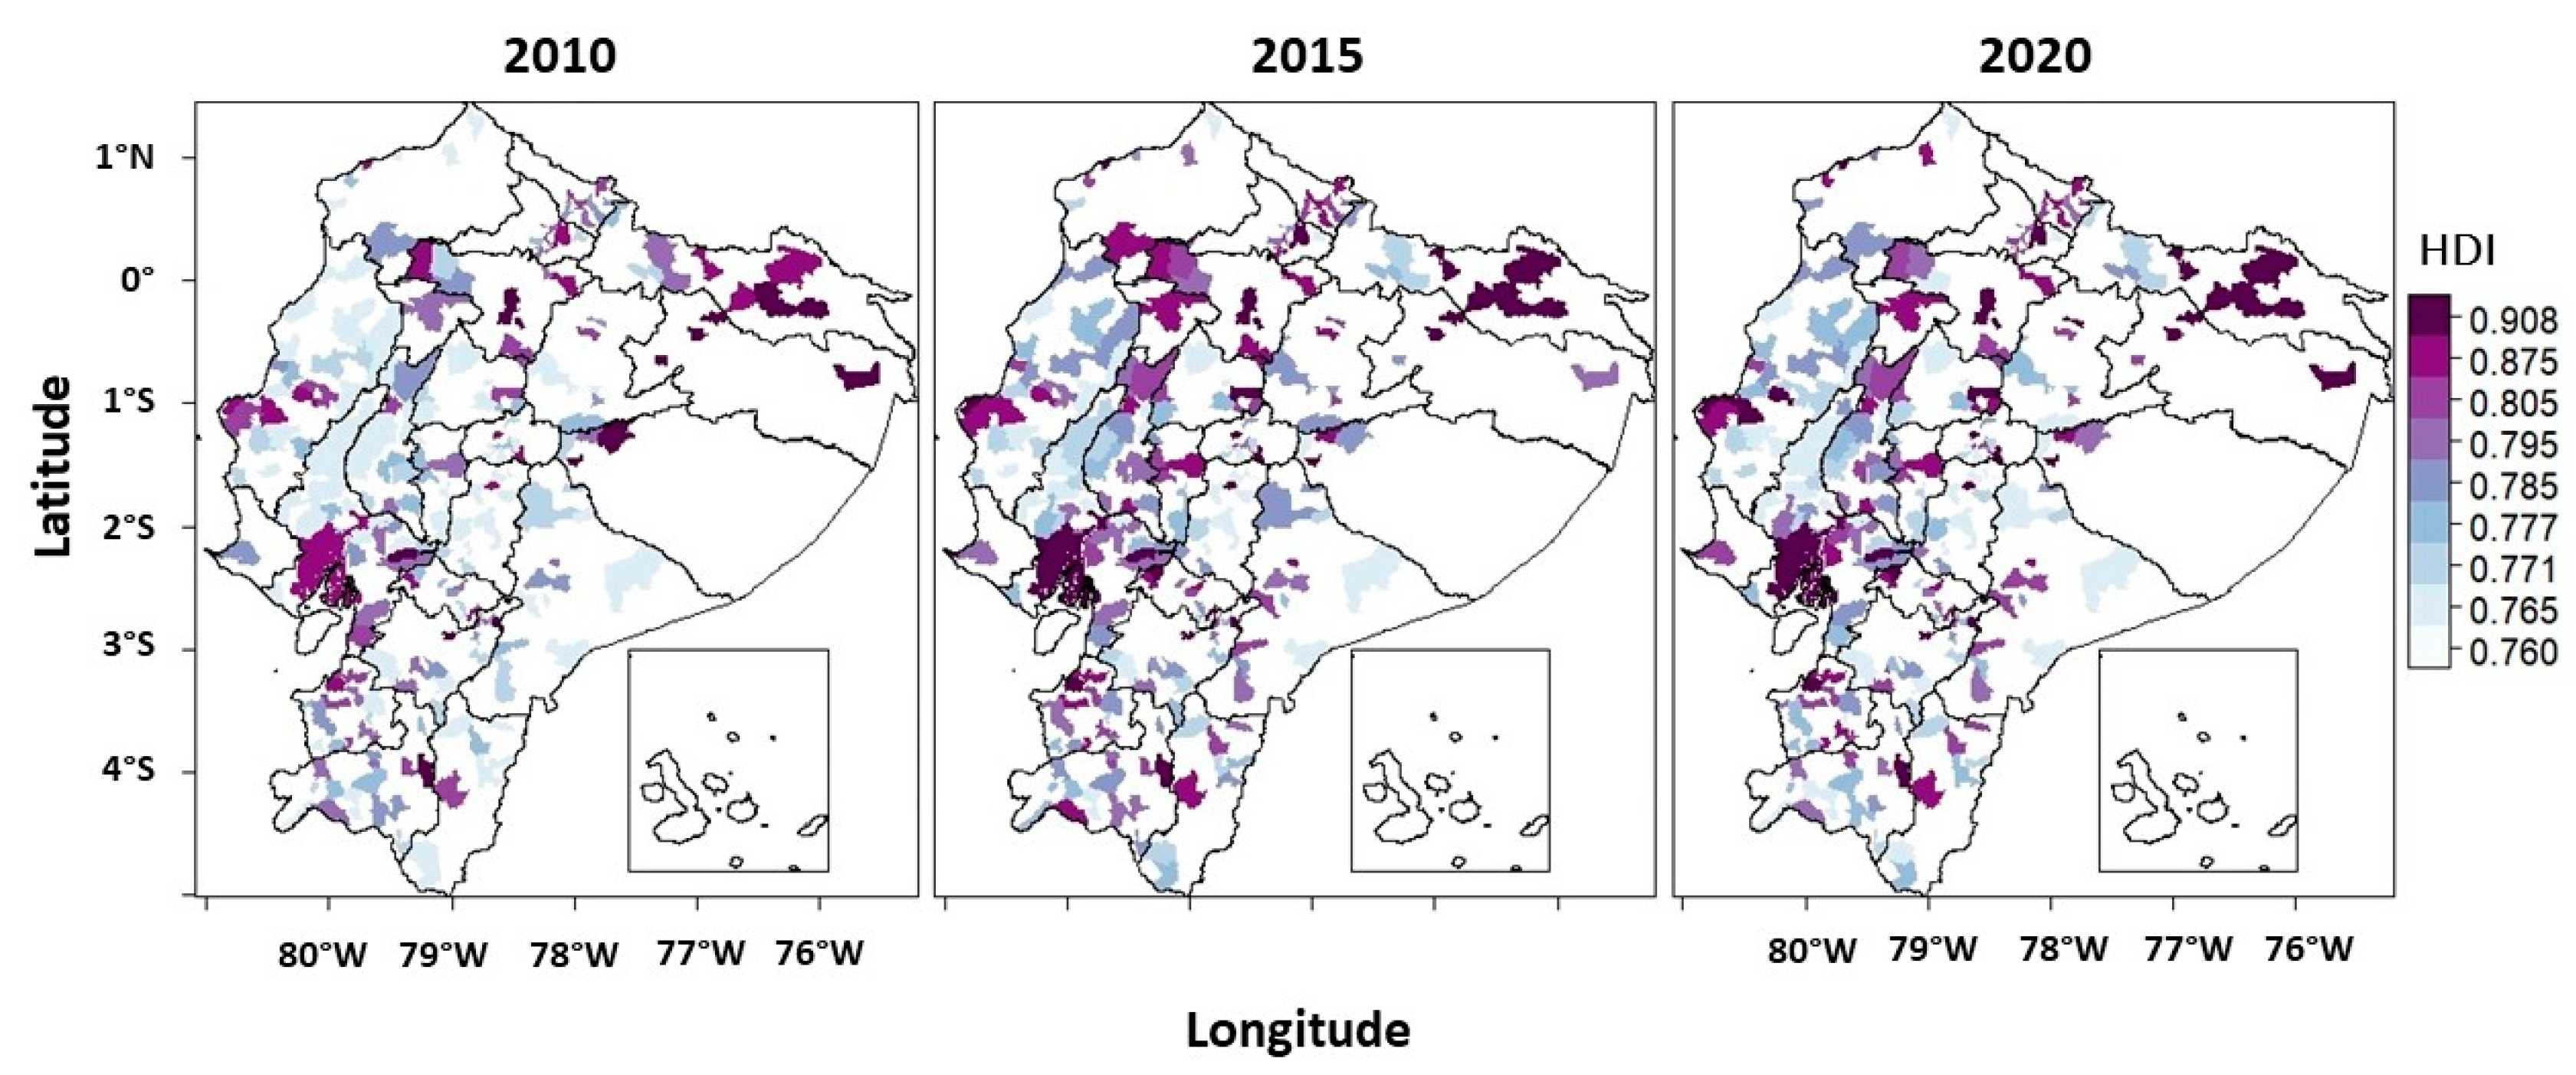
2.5. Human Development Index
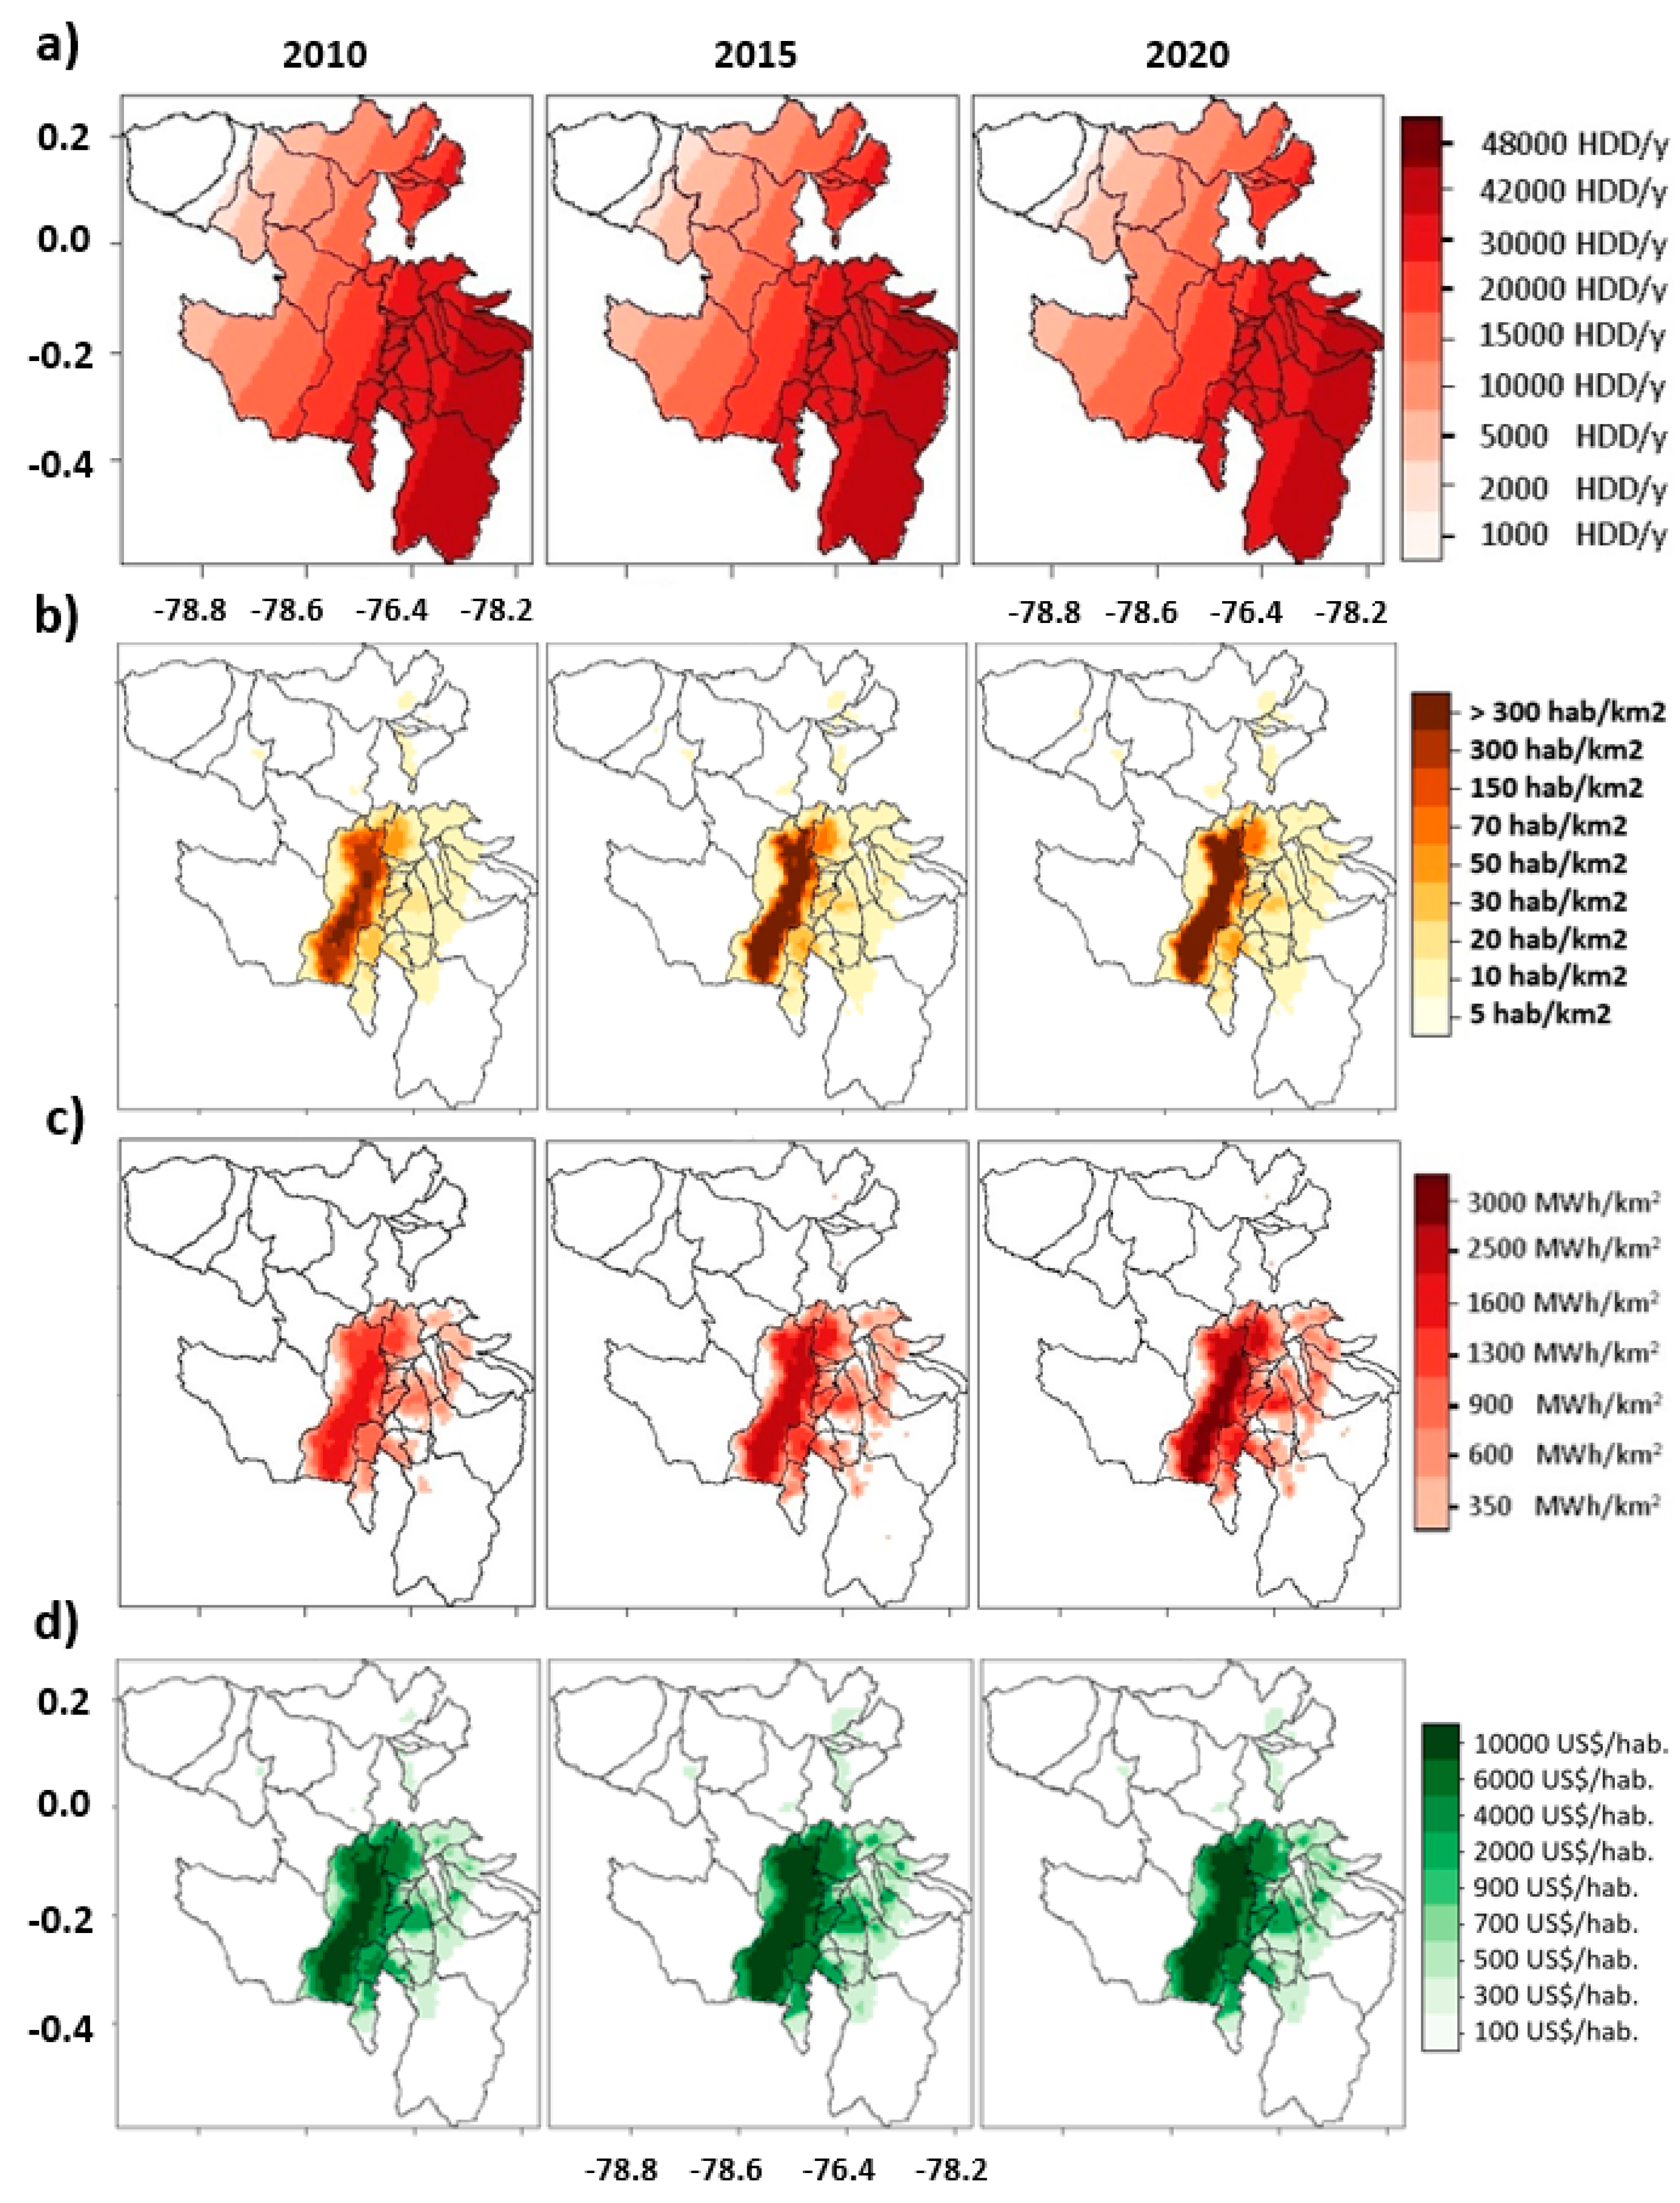
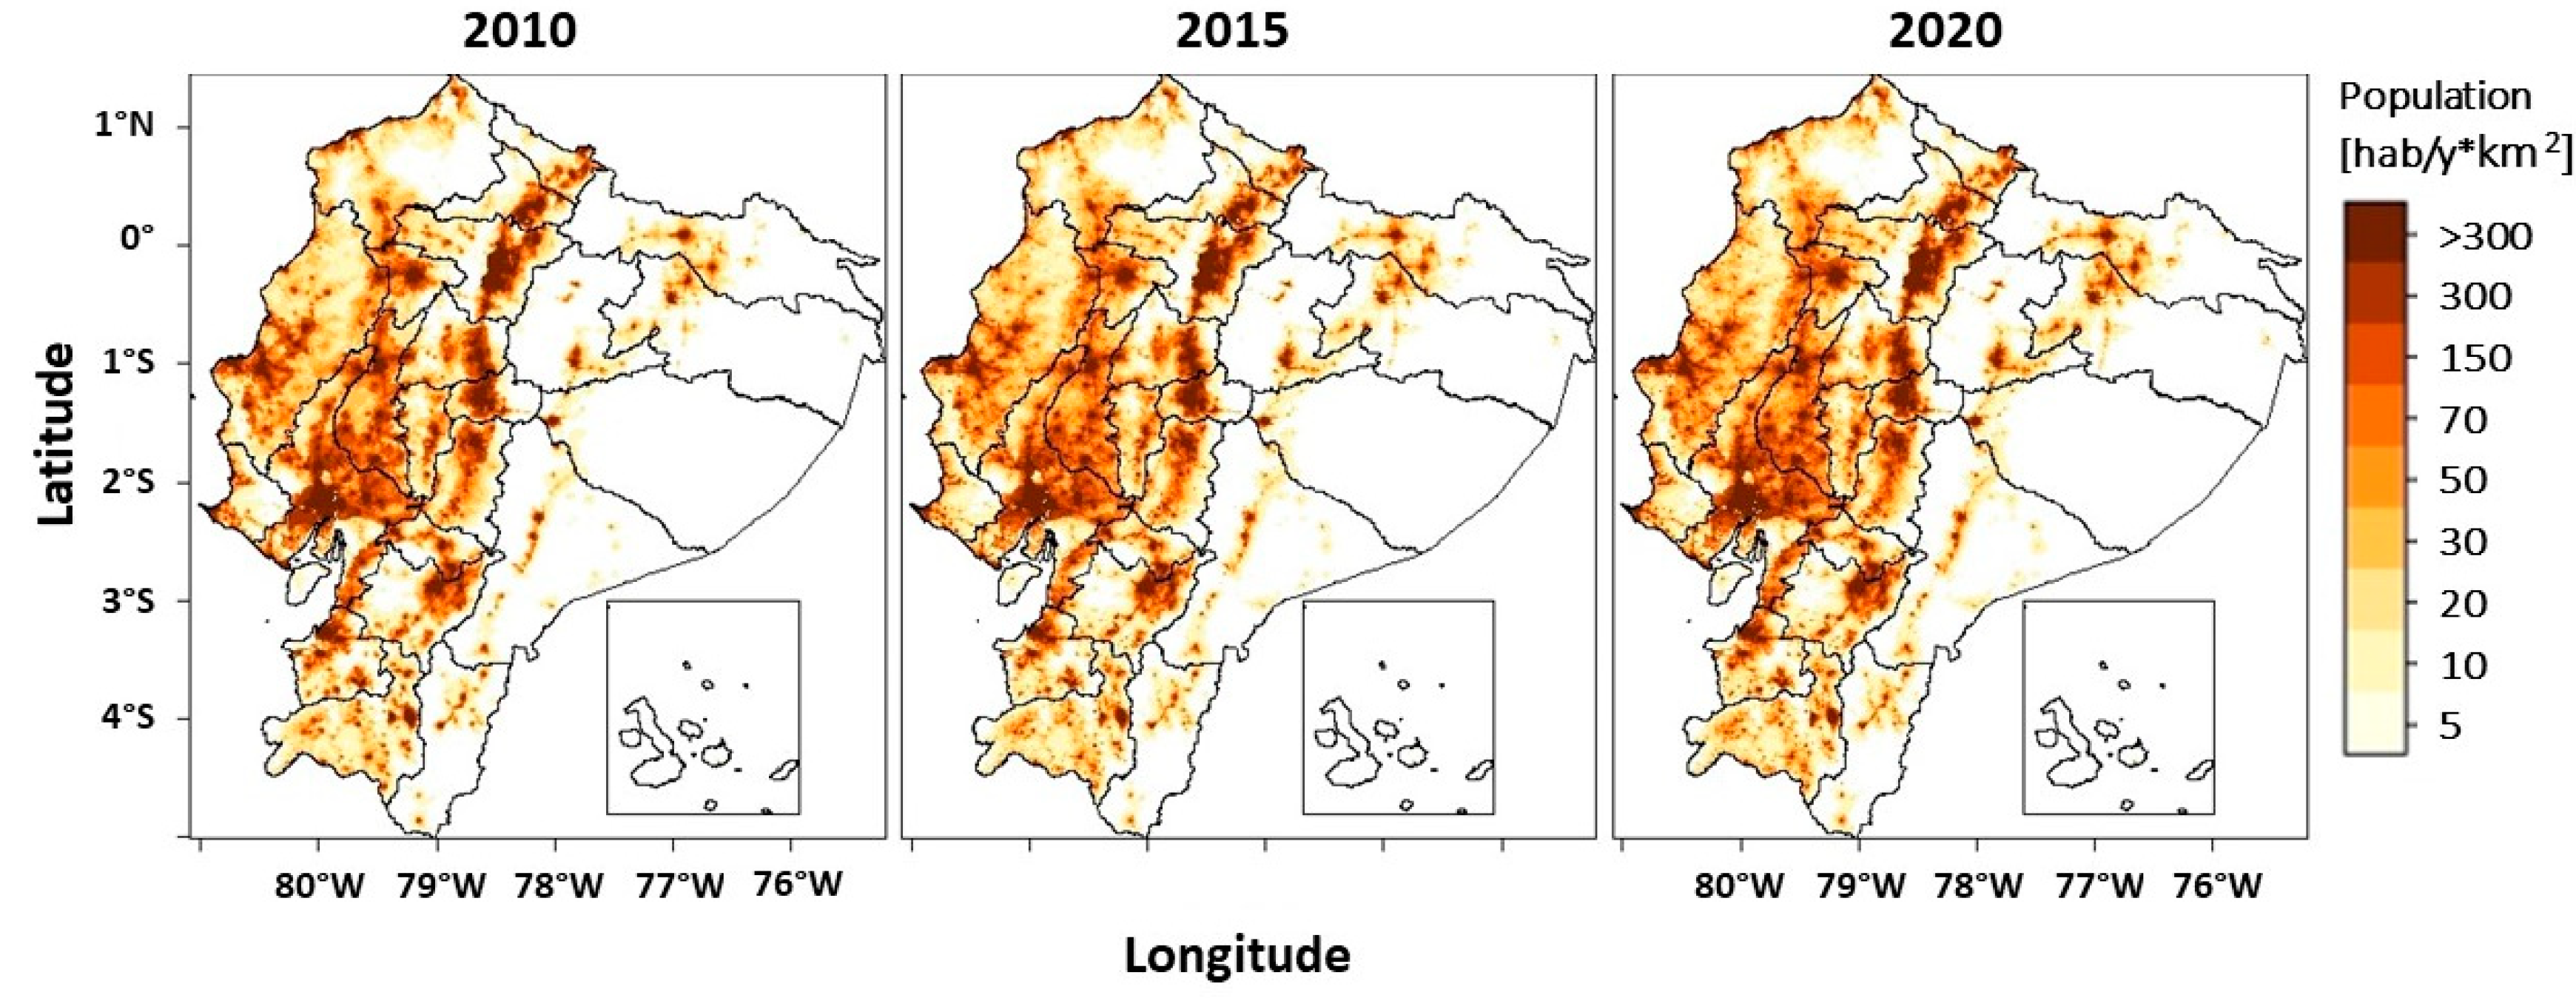
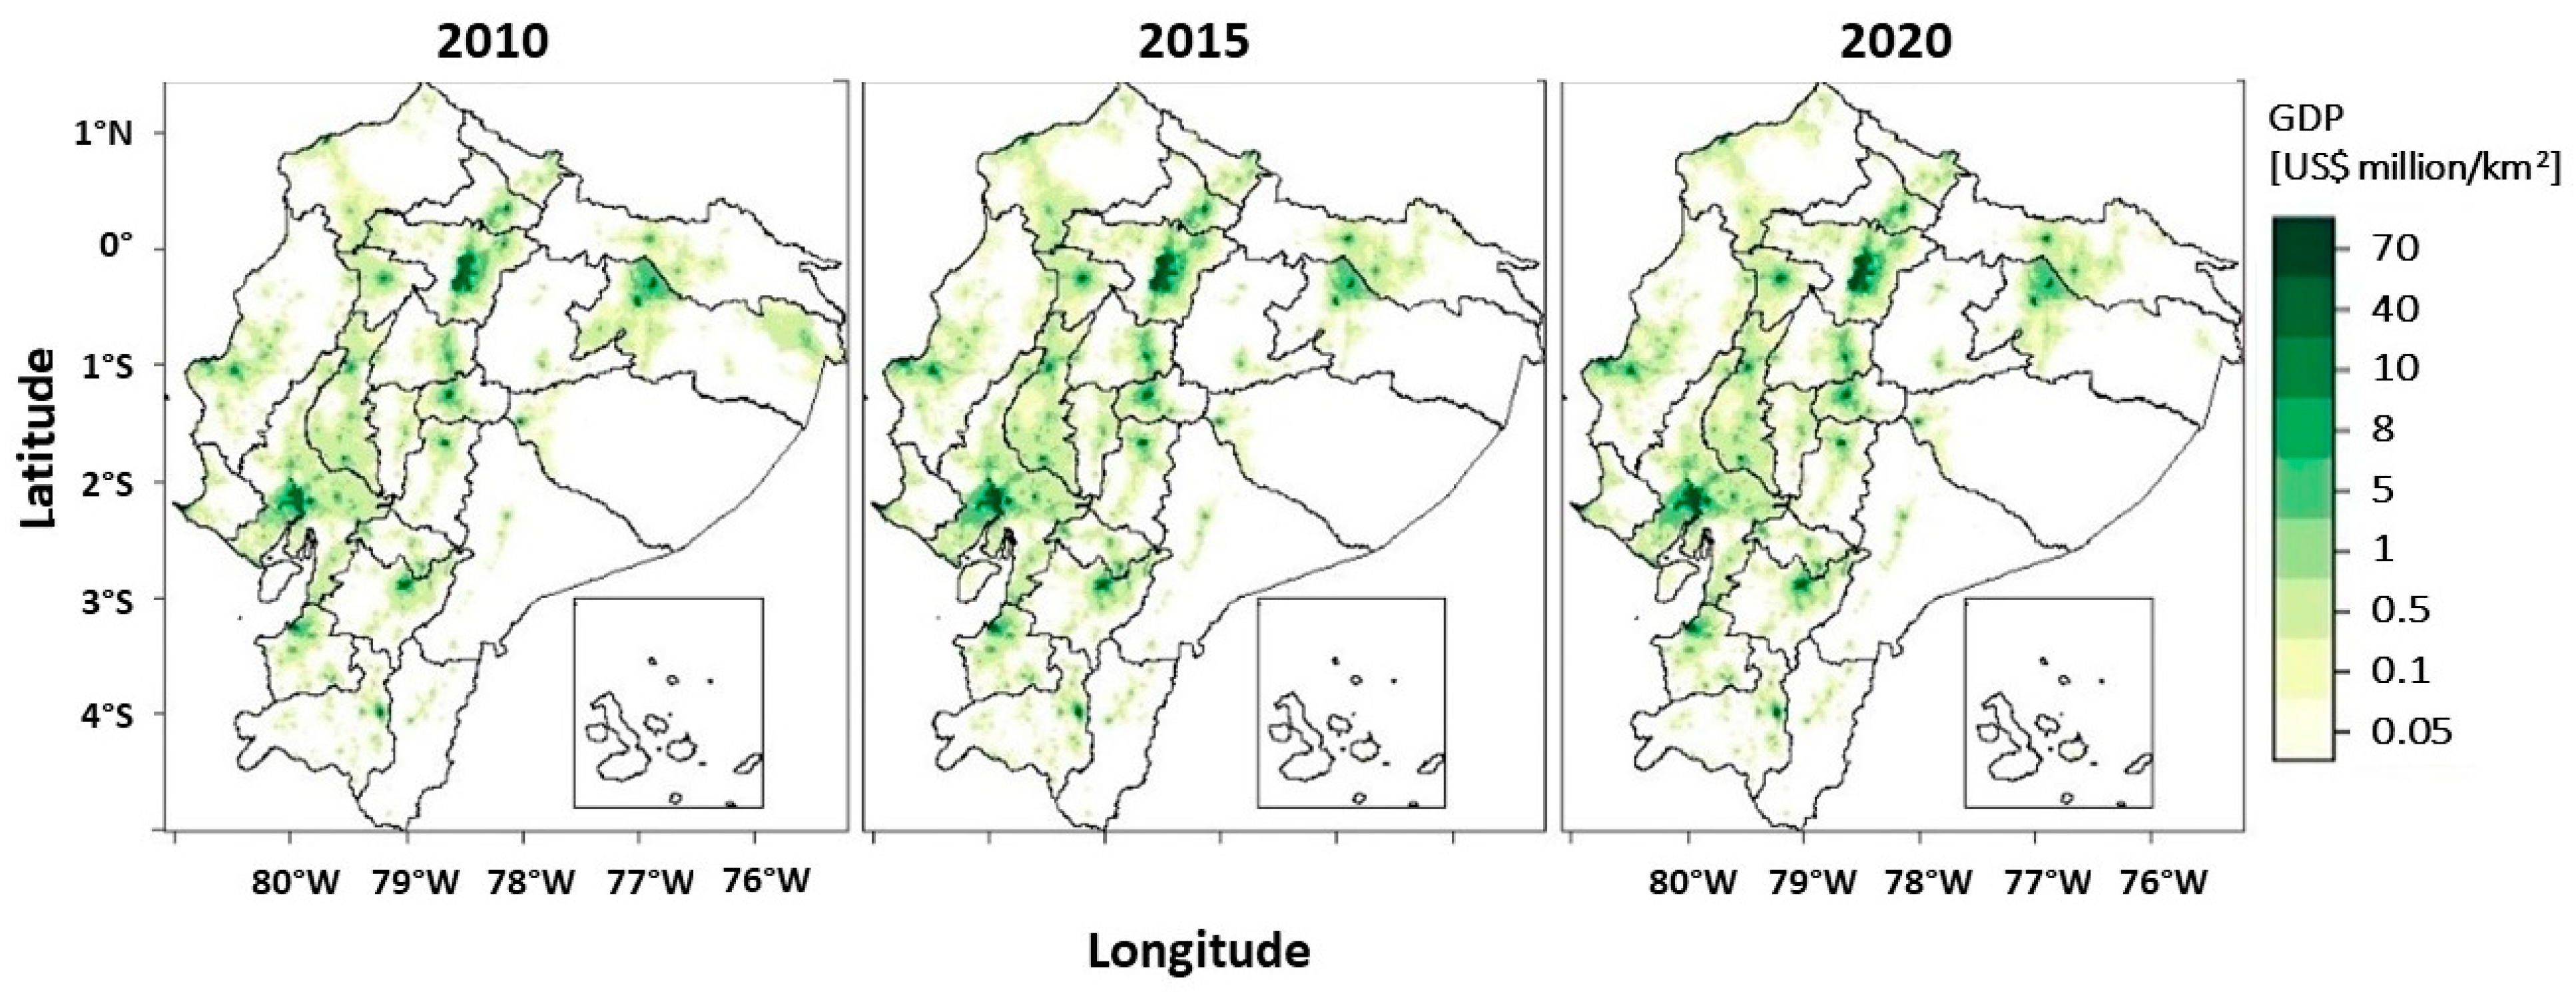
3. Results
4. Conclusions
Author Contributions
Funding
Data Availability Statement
Acknowledgments
Conflicts of Interest
Nomenclature
| HDH | Heating degree hours |
| CDH | Cooling degree hours |
| SH | Space heating |
| SC | Space cooling |
| WH | Water heating |
| c | Cell |
| d | Day |
| h | Hour |
| m | Month |
| Tc,d,h | Temperature in a cell for a specific day and hour |
| Tref | Reference temperature |
| WH | Waiting factor for water heating |
| kc | Scaling factor |
| Population density per cell | |
| Km2 | Square kilometre |
| ISH | Index for space heating |
| ISC | Index for space cooling |
| IWH | Index for water heating |
| IAE | Lighting and electric appliances |
| E | Energy consumed |
| ED | Energy density |
| TED | Total energy demand |
| TEDD | Total energy demand density |
| AF | Gross Domestic Product adjustment factor by city |
| GDPN | Gross Domestic Product national |
| GVAN | Gross value added national |
| GDPC | Gross Domestic Product by city |
| GVAC | Gross value added by city |
| AGP | Adjusted GDP per capita |
| POPC | Population by city |
| POPP | Population by parish |
| GI | Gross Domestic Product index |
| VGImax | World benchmark maximum GI value |
| VGImin | World benchmark minimum GI value |
| HDIC | Human development index by city |
| EI | Education index |
| LI | Literacy index |
| CER | Combined enrolment rate |
| AR | Alphabetization rate |
| VARmax | World benchmark maximum AR value |
| VARmin | World benchmark minimum AR value |
| GPR | Gross primary rate |
| SGR | Secondary gross rate |
| GUR | Gross university rate |
| POPPE | Population attending primary level establishments |
| POP0511 | Total population between 5 and 11 years |
| POPSE | Population attending secondary level establishments |
| POP1217 | Total population between 12 and 17 years |
| POPUE | Population attending higher level establishments |
| POP1824 | Total population between 18 and 24 years |
| POP15 and more | Total population of 15 and more |
| POPL | Population attending literacy establishments |
| LEI | Life expectancy index |
| LE | Real value in years of life expectancy at birth |
| VLEmax | World benchmark maximum LE value |
| VLEmin | World benchmark minimum LE value |
| IR | Illiteracy rate |
| POPLI | Literate population |
| POPIL | Illiterate population |
| POPLI10 | Literate population registered in the 2010 population census |
| POPLI10−n | Literate population from 2010 to n number of years |
References
- Sachs, J.; Moya, D.; Giarola, S.; Hawkes, A. Clustered spatially and temporally resolved global heat and cooling energy demand in the residential sector. Appl. Energy 2019, 250, 48–62. [Google Scholar] [CrossRef]
- Eom, J.; Hyun, M.; Lee, J.; Lee, H. Increase in household energy consumption due to ambient air pollution. Nat. Energy 2020, 5, 976–984. [Google Scholar] [CrossRef]
- Serrano, S.; Ürge-Vorsatz, D.; Barreneche, C.; Palacios, A.; Cabeza, L.F. Heating and cooling energy trends and drivers in Europe. Energy 2017, 119, 425–434. [Google Scholar] [CrossRef]
- Ürge-Vorsatz, D.; Cabeza, L.F.; Serrano, S.; Barreneche, C.; Petrichenko, K. Heating and cooling energy trends and drivers in buildings. Renew. Sustain. Energy Rev. 2015, 41, 85–98. [Google Scholar] [CrossRef]
- Dong, F.; Li, J.; Wang, Y.; Zhang, X.; Zhang, S.; Zhang, S. Drivers of the decoupling indicator between the economic growth and energy-related CO2 in China: A revisit from the perspectives of decomposition and spatiotemporal heterogeneity. Sci. Total Environ. 2019, 685, 631–658. [Google Scholar] [CrossRef] [PubMed]
- Balezentis, T. Shrinking ageing population and other drivers of energy consumption and CO2 emission in the residential sector: A case from Eastern Europe. Energy Policy 2020, 140, 111433. [Google Scholar] [CrossRef]
- Jimenez, R.; Yepez-Garcia, A. Understanding the Drivers of Household Energy Spending: Micro Evidence for Latin America. IDB Working Paper Series. 2017. Available online: https://publications.iadb.org/en/understanding-drivers-household-energy-spending-micro-evidence-latin-america (accessed on 1 November 2022).
- Sorichetta, A.; Hornby, G.M.; Stevens, F.R.; Gaughan, A.E.; Linard, C.; Tatem, A.J. High-resolution gridded population datasets for Latin America and the Caribbean in 2010, 2015, and 2020. Sci. Data 2015, 2, 1–12. [Google Scholar] [CrossRef] [PubMed]
- Bosilovich, M.G.; Akella, S.; Coy, L.; Cullather, R.; Draper, C.; Gelaro, R.; Kovach, R.; Liu, Q.; Molod, A.; Norris, P.; et al. MERRA-2: Initial Evaluation of the Climate. 2015. Available online: https://gmao.gsfc.nasa.gov/reanalysis/MERRA-2/ (accessed on 15 November 2022).
- Center for International Earth Science Information Network-CIESIN-Columbia University. Gridded Population of the World, Version 4 (GPWv4): Administrative Unit Center Points with Population Estimates, NASA Socioeconomic Data and Applications Center (SEDAC), 20210719. Available online: https://sedac.ciesin.columbia.edu/data/collection/gpw-v4 (accessed on 16 November 2022).
- Instituto Nacional de Estadística y Censos INEC. Compendio Estadístico. Available online: https://www.ecuadorencifras.gob.ec/estadisticas/ (accessed on 15 June 2021).
- ARCONEL. Estadística del Sector Eléctrico. Available online: https://www.regulacionelectrica.gob.ec/estadistica-del-sector-electrico/ (accessed on 15 June 2021).
- BCE. Información Estadística Mensual No. 2032-Junio 2021. Available online: https://www.bce.fin.ec/index.php/informacioneconomica (accessed on 15 June 2021).
- Campaña, F.; Illinworth, J. Informe Sobre Desarrollo Humano del Ecuador (IDH de los 221 Cantones del Ecuador); Fundación Ecuador: Guayaquil, Ecuador, 2019. [Google Scholar]
- Werner, S. European space cooling demands. Energy 2016, 110, 148–156. [Google Scholar] [CrossRef]
- Moya, D.; Castro, C.; Arroba, C.; Pérez, C.; Copara, D.; Borja, A. Geospatial Datasets of Energy Consumption Drivers in the Ecuador’s Residential Sector, Mendeley Data. Available online: https://data.mendeley.com/datasets/bmfh63cc74 (accessed on 16 November 2022).
- Moya, D.; Giarola, S.; Hawkes, A. Geospatial Big Data analytics to model the long-term sustainable transition of residential heating worldwide. In Proceedings of the 2021 IEEE International Conference on Big Data (Big Data), Orlando, FL, USA, 15–18 December 2021; pp. 4035–4046. [Google Scholar] [CrossRef]
- Moya, D.; Copara, D.; Borja, A.; Pérez, C.; Kaparaju, P.; Pérez-Navarro, Á.; Giarola, S.; Hawkes, A. Geospatial and temporal estimation of climatic, end-use demands, and socioeconomic drivers of energy consumption in the residential sector in Ecuador. Energy Convers. Manag. 2022, 261, 115629. [Google Scholar] [CrossRef]


| More specific subject area | Energy drivers in the residential sector |
| Method name | Spatiotemporal method to estimate energy consumption drivers in the residential sector |
| Resource availability | Six databases are required to reproduce this methodology:
|
| Data accessibility | Moya, Diego; Castro, Cristian; Arroba, César; Pérez, Cristian; Copara, Dennis; Borja, Rodrigo (2022), “Geospatial datasets of energy consumption drivers in the Ecuador’s residential sector”, Mendeley Data, V1, https://data.mendeley.com/datasets/bmfh63cc74, (accessed on 1 February 2023). doi: 10.17632/bmfh63cc74.1, in [16]. |
| Subject | Energy |
| Specific subject area | Gridded energy consumption drivers of the residential sector |
| Type of data | Raster data (geospatial dataset) |
| Data format | Gridded data in .tif format. High-resolution. |
| How the data were acquired | Custom-built scripts written in R Statistic software and packages. QGIS was also used where needed. |
| Description of data collection | Data were collected from national and international institutions. Five national institutions were identified as key data providers: (1) the National Institute of Statistics and Censuses, INEC; (2) the Central Bank of Ecuador, BCE; (3) Ministry of Education, MINEDU; (4) Secretary of Higher Education, SENESCYT; and (5) the Agency for the Regulation and Control of Energy and Non-Renewable Natural Resources, ARCONEL. Two International institutions provide relevant data: the Centre for International Earth Science Information Network, CIESIN, and the NASA-MERRA2 program. |
| Data source location | INEC, Juan Larrea N15-36 y José Riofrío Código Postal: 170402, Quito, Ecuador BCE, Av. 10 de Agosto N11-409 y Briceño, Quito, Ecuador MINEDU, Av. Amazonas N34-451 y Av. Atahualpa, Quito, Ecuador SENESCYT, Av. 24 de Mayo y Che Guevara, Quito, Ecuador ARCONEL, Av. Naciones Unidas 7-71 y, Quito 170506, Ecuador CIESIN, 61 Rte 9W, Palisades, NY 10964, USA NASA-MERRA2, NASA Headquarters, 300 E. Street SW, Suite 5R30 Washington, DC 20546, USA |
| Related research article | Moya, D., Copara, D., Borja, A., Pérez, C., Kaparaju, P., Pérez-Navarro, Á., Giarola, S., Hawkes, A. (2022). Geospatial and temporal estimation of climatic, technical, and socioeconomic drivers of energy consumption in the residential sector in Ecuador Energy Conversion & Management [18]. |
| Folder | Driver | File Name: Explanation Example | Description of Example |
|---|---|---|---|
| 01 | Population density | country_driver_year_resolution.tif ecu_pd_2010_1km.tif | Ecuador = ecu Population density = pd Year = 2010 1 km2 Resolution = 1 km |
| 02 | Population count | country_driver_year_resolution_total.tif ecu_ppp_2010_1km_Aggregated.tif | Ecuador = ecu Population count = ppp Year = 2010 1 km2 Total population = aggregated |
| 03 | Space heating | country_year_month_hour_driver.tif ecu_2010_01_01_CH.tif | Ecuador = ecu Year = 2010 January = 01 Hour = 01 CH = space heating demand |
| 04 | Space cooling | country_year_month_hour_driver.tif ecu_2010_01_01_DVH.tif | Ecuador = ecu Year = 2010 January = 01 Hour = 01 DVH = space cooling demand |
| 05 | Water heating | country_year_month_hour_driver.tif ecu_2010_01_01_DCA.tif | Ecuador = ecu Year = 2010 January = 01 Hour = 01 DCA = water heating demand |
| 06 | Total end-use energy demand | country_year_month_hour_driver.tif ecu_2010_01_01_TDE.tif | Ecuador = ecu Year = 2010 January = 01 Hour = 01 TDE = total energy demand |
| 07 | GDP | country_driver_year_resolution.tif ecu_gdp_2010_1km.tif | Ecuador = ecu GDP = gdp Year = 2010 1 km2 Resolution = 1 km |
| 08 | GDPpc | country_driver_year_resolution.tif ecu_gdp_pc_2010_1km.tif | Ecuador = ecu GDPpc = gdp_pc Year = 2010 1 km2 Resolution = 1 km |
| 09 | HDI Provided at 1 km2 at city level | country_driver_year_resolution.tif ecu_hdi_2010_1km.tif | Ecuador = ecu HDI = hdi Year = 2010 1 km2 Resolution = 1 km |
Disclaimer/Publisher’s Note: The statements, opinions and data contained in all publications are solely those of the individual author(s) and contributor(s) and not of MDPI and/or the editor(s). MDPI and/or the editor(s) disclaim responsibility for any injury to people or property resulting from any ideas, methods, instructions or products referred to in the content. |
© 2023 by the authors. Licensee MDPI, Basel, Switzerland. This article is an open access article distributed under the terms and conditions of the Creative Commons Attribution (CC BY) license (https://creativecommons.org/licenses/by/4.0/).
Share and Cite
Moya, D.; Arroba, C.; Castro, C.; Pérez, C.; Giarola, S.; Kaparaju, P.; Pérez-Navarro, Á.; Hawkes, A. A Methodology to Estimate High-Resolution Gridded Datasets on Energy Consumption Drivers in Ecuador’s Residential Sector during the 2010–2020 Period. Energies 2023, 16, 3973. https://doi.org/10.3390/en16103973
Moya D, Arroba C, Castro C, Pérez C, Giarola S, Kaparaju P, Pérez-Navarro Á, Hawkes A. A Methodology to Estimate High-Resolution Gridded Datasets on Energy Consumption Drivers in Ecuador’s Residential Sector during the 2010–2020 Period. Energies. 2023; 16(10):3973. https://doi.org/10.3390/en16103973
Chicago/Turabian StyleMoya, Diego, César Arroba, Christian Castro, Cristian Pérez, Sara Giarola, Prasad Kaparaju, Ángel Pérez-Navarro, and Adam Hawkes. 2023. "A Methodology to Estimate High-Resolution Gridded Datasets on Energy Consumption Drivers in Ecuador’s Residential Sector during the 2010–2020 Period" Energies 16, no. 10: 3973. https://doi.org/10.3390/en16103973