Article

Pore-Scale Numerical Simulation of CO2–Oil Two-Phase Flow: A Multiple-Parameter Analysis Based on Phase-Field Method

1
School of Geoscience and Technology, Southwest Petroleum University, Chengdu 610500, China
2
State Key Laboratory of Geomechanics and Geotechnical Engineering, Institute of Rock and Soil Mechanics, Chinese Academy of Sciences, Wuhan 430071, China
3
School of Civil Engineering and Architecture, Southwest University of Science and Technology, Mianyang 621010, China
4
School of Civil Engineering and Geomatics, Southwest Petroleum University, Chengdu 610500, China
*
Authors to whom correspondence should be addressed.
Energies 2023, 16(1), 82; https://doi.org/10.3390/en16010082
Submission received: 2 November 2022 / Revised: 11 December 2022 / Accepted: 17 December 2022 / Published: 21 December 2022

Abstract

:
A deep understanding of the pore-scale fluid flow mechanism during the CO2 flooding process is essential to enhanced oil recovery (EOR) and subsurface CO2 sequestration. Two-phase flow simulations were performed to simulate the CO2 flooding process based on the phase-field method in this study. Two-dimensional models with random positions and sizes of grains of circular shape were constructed to reproduce the topology of porous media with heterogeneous pore size distributions in the reservoir rock. A multiple-parameter analysis was performed to investigate the effects of capillary number, viscosity ratio, wettability, density, gravity, interfacial tension, and absolute permeability on the two-phase fluid flow characteristics. The results indicated that when the capillary number and viscosity ratio were large enough, i.e., log Ca = −3.62 and log M = −1.00, the fingering phenomenon was not obvious, which could be regarded as a stable displacement process. CO2 saturation increased with the increase in the PV value of the injected CO2. Once the injected CO2 broke through at the outlet, the oil recovery efficiency approached stability. Two types of broken behaviors of the fluids were observed during the wettability alternation, i.e., snap-off and viscous breakup. Snap-off occurred when capillary forces dominated the fluid flow process, while viscous breakup occurred with a low viscosity ratio. With a low capillary number, the flooding process of the injected CO2 was mainly controlled by the capillary force and gravity. With the decrease in the interfacial tension between the fluids and the increase in the permeability of the porous media, the recovery of the displaced phase could be enhanced effectively. In the mixed-wet model, with the increase in the percentage of the nonoil-wetted grains, the intersecting point of the relative permeability curve moved to the right and led to a higher oil recovery.

1. Introduction

Carbon dioxide (CO2) capture, utilization, and storage (CCUS) technology is regarded as the most effective approach to deal with the greenhouse effect in recent years [1,2]. As one of the most effective and promising utilization methods, CO2 flooding can not only achieve geological storage, but also greatly enhance the oil recovery of low-permeability reservoirs [3,4,5]. The aforementioned CO2-EOR technology is a win-win approach which not only considers the economic benefits, but also the social benefits [6,7,8]. In 1972, the CO2-EOR application was used for the first time in Texas, which utilized CO2 to enhance oil recovery in a crude oil reservoir [9]. Since then, the CO2-EOR technology has attracted more and more attention both in academic and industrial fields.
Varying based on the injected pressure and temperature conditions, the CO2 flooding can be divided into three categories: CO2-miscible flooding, CO2-immiscible flooding, and CO2-near-miscible flooding [10,11]. The difference among these three flooding forms lies in whether the injected pressure of CO2 reaches the minimum miscible pressure. When the injected pressure is greater than the minimum miscible pressure, CO2-miscible flooding can be achieved; in the absence of these pressure conditions, immiscible or near-miscible flooding is obtained instead. Miscible CO2 flooding contributes to EOR, benefiting from two aspects. On the one hand, with the CO2 injected, parts of the oil and water are dissolved, which increases the driving force and improves the flooding efficiency. On the other hand, the injected CO2 can form a miscible oil zone with crude oil [12]. In the miscible oil zone, the viscosity and density of crude oil are reduced significantly, and the interfacial tension decreases as well, which effectively favors the improvement of the flow capacity of the crude oil [13].
In pursuit of the desirable double carbon policy and the great potential of CO2-EOR technology, research on the mechanism of CO2 flooding has attracted more and more attention in recent years. Desch et al. [14] conducted a CO2-miscible flooding experiment at the core scale, and the results showed that parts of the crude oil and water were dissolved by CO2 during the alternate water–gas flooding process, which resulted in the phenomenon of dissolved gas flooding and improved the oil–water flow ratio at the same time. During the miscible flooding process, the interfacial tension between the CO2 and the oil was significantly reduced. Xiao et al. [15] conducted water flooding and CO2-miscible flooding experiments using low-permeability cores, and the results showed that the recovery ratio of CO2-miscible flooding was higher than water flooding. Feng et al. [16] obtained similar conclusions from the field experiments. Zhu et al. [17] studied the effect of the injection rate on CO2-miscible flooding performance through a core-scale experiment. Ding et al. [18] studied the influence of core-scale fracture density and miscibility on CO2 flooding recovery in fractured reservoirs. Gao et al. [19] conducted supercritical CO2 (scCO2) and non-supercritical CO2 huff-puff simulations under the reservoir conditions of tight conglomerate formation (formation pressure 37 MPa, temperature 362.15 K). The results indicated that scCO2 was helpful for improving the recovery of the crude oil of a tight conglomerate reservoir. Li et al. [20] conducted scCO2 flooding experiments through core-scale experiments, and the results showed that increasing the displacement pressure or the interaction time between crude oil and CO2 could effectively improve oil recovery. Li et al. [21] used three cores with different permeability to conduct CO2 flooding experiments and investigated the effect of the pore structure and injection pressure on the recovery ratio of tight oil reservoirs. The results showed that both the total surface recovery efficiency and recovery efficiency of small pores increased with the increase in injection pressure.
Due to the complex structure and opacity of the reservoir rocks, the mechanism and influencing factors of CO2 flooding contributing to the enhancement of the oil recovery ratio remain unclear. With the help of experimental high-resolution visualization technologies (e.g., micro-CT and NMR), researchers investigated the pore-scale mechanism of fluid interactions during CO2 flooding. Kun et al. [22] used NMR technology to study the effect of different CO2 injection methods on residual oil distribution and found that CO2 injection after water flooding has a significant effect on improving the recovery efficiency of low-permeability reservoirs. Al-bayati et al. [23] conducted CO2-miscible flooding experiments at the core scale and evaluated the influence of heterogeneity on CO2-miscible flooding performance with the help of micro-CT scanning. The results showed that higher heterogeneity leads to lower recovery, and the CO2 flooding effect was better in the miscible secondary recovery mode, which promoted the effective contact between CO2 and oil. Pu et al. [24] used NMR technology to analyze the pore-scale CO2 displacement mechanism of low-permeability reservoirs from different dimensions, and the results showed that the miscibility of CO2 and crude oil formed a stable displacement front, in which case the crude oil could be effectively displaced, especially in large and medium pores. Wei et al. [25] carried out a comprehensive visualization study on the CO2 dissolution and miscibility process by using a high-pressure temperature unit. The results showed that the CO2 solubility would decrease with the increase in temperature and oil density. During the mixing process, the components of the CO2 phase and oil phase were quite close. Yang et al. [26] used micro-CT imaging technology to scan porous media with high water content and classified the patterns of residual oil in pores using shape factor and Eulerian number. It was found that the distribution of the remaining oil was constantly changing in the process of water flooding. Zhang et al. [27] studied the pore throat heterogeneity of tight sandstone using NMR technology, and the results showed that the complexity of pore structure and surface roughness hindered the migration of two-phase fluid and the swept area of single-phase fluid. Chung et al. [28], combined with micro-CT imaging technology, used a new method to quickly estimate absolute permeability from micro-CT images of rocks. Cao et al. [29] conducted a series of pore-scale simulations of gas reservoirs with increasing injection pressure using tight sandstone cores and studied the fluid phase distribution, gas mass characteristics, and gas reservoir change rules of gas reservoirs using micro-CT technology. The results showed that with the increase in gas injection pressure, the gas saturation was increased, the number and volume of gas reservoirs increased, the shape deviated from the spherical shape, and the connectivity improved. Wang et al. [30] used micro-CT imaging technology to scan and image four kinds of rocks and used these CT images to generate a grid structure model to conduct a two-phase flow numerical simulation, studying the immiscible oil displacement process in the oilfield development process. The results show that wettability has an important impact on recovery efficiency. The existing high-resolution visualization experiment system is expensive and time-consuming. Due to the strong heterogeneity of natural cores and the destructive nature of most fluid displacement experiments, it is difficult to carry out parallel experiments under the same pore structure and physical properties.
Therefore, the pore-scale numerical simulation of CO2 flooding in porous media is very important as an important supplement to laboratory experiments. Zhang et al. [31] numerically simulated the process of liquid CO2 flooding through two heterogeneous pore network models with different permeation zones. The study found that at a low injection rate, displacement changed from capillary fingering to viscous fingering with the increase in injection flow rate. Liu et al. [32] carried out the numerical simulation of liquid CO2 flooding in the dual-permeability pore network model using the Lattice Boltzmann method (LBM). The results indicated that the preferential flow channel and flow behavior of liquid CO2 depended on the number of capillaries. Amiri et al. [33] studied the immiscible water flooding process through a homogeneous model. The results show that the pore-scale displacement mechanisms that affect the displacement efficiency are different under water-wet and oil-wet conditions. Shi et al. [34] studied the factors affecting the flow behavior of non-Newtonian fluids in porous media using LBM. These factors include capillary number, viscosity, wettability, and gravity. Zhu et al. [35] used the phase-field method to numerically simulate the immiscible CO2 oil displacement process through a homogeneous porous media model. The research found that after CO2 broke through the outlet, the pressure on the CO2 main channel decreased significantly, and the oil phase began to flow back into the pores previously occupied by CO2. Basirat et al. [36] used the phase-field method to simulate the two-phase flow of CO2 brine in the real pore structure through a two-dimensional core real pore model and studied the factors affecting the geological storage of CO2 in the deep saline aquifer. The study showed that the saturation of the saturated phase and the normalized interface area increased with the decrease in the contact angle. Rokhforouz et al. [37] studied the effect of pore structure approximation on water flooding by using the phase-field method through the real core pore model and its simplified model. The results show that the change in small particle size can lead to different displacement profiles, especially under low capillary numbers and oil moisture conditions. Ma et al. [38] studied the mechanism of CO2 flooding to enhance oil recovery through a heterogeneous porous media model and immiscible flooding and near-miscible flooding. The results show that, compared with immiscible flooding, near-miscible flooding increases the CO2 sweep area to a certain extent, but the oil displacement efficiency is still low in the small hole throat.
In the process of CO2 displacement of crude oil, there are often pore-scale displacement phenomena such as fingering, preferential flow channel, swept range, oil phase trap, and jamming; the existence of these phenomena is unfavorable for improving oil recovery [2,31,32], and the numerical simulation study provides a very convenient condition for observing the formation process of the pore-scale displacement phenomenon during CO2 flooding. To study the two-phase flow phenomenon during CO2 displacement of crude oil, a currently available and better method is the pore-scale visual numerical simulation [33,34,35,36,37,38]. At present, there are mainly two kinds of porous media models used in pore-scale visualization of numerical simulation: one is an artificially created pore network model [31,32,33,34,35,38], and another one is 2D or 3D images of the rock core made by using various scanning techniques to scan the real rock core [30,36,37,39]. The method for obtaining these images is not easy, as it is limited by experimental conditions. Therefore, based on the artificial pore-scale models, the numerical solution of the N-S equation to obtain the fluid flow state in porous media provides a new research method for the simulation of CO2 flooding [40,41,42,43,44,45]. However, the mechanism of CO2 displacement of crude oil in the pore-scale models with heterogeneous and mixed wettability conditions has rarely been investigated. Zhang [31], Liu [32], and Basirat et al. [36] carried out numerical simulation research on the process of CO2 displacement of water. Therefore, further research on the process of CO2 displacing oil is needed. Amiri [33] and Shi et al. [34] studied the effects of capillary number, viscosity, wettability, and gravity on fluid flow but did not consider the effects of interfacial tension, absolute permeability, and mixed wettability on fluid flow in heterogeneous porous media. Zhu et al. [35] conducted a numerical simulation study on the process of CO2 displacing oil using the phase-field method in a homogeneous porous medium model, which cannot truly reflect the heterogeneity of natural rocks. Rokhforouz et al. [37] studied the influence of pore structure on water flooding by using the phase-field method in the simplified model of natural rock. Ma et al. [38] conducted a simulation of CO2 flooding in the heterogenous pore model and analyzed oil recovery using immiscible flooding, near-miscible flooding, and miscible flooding, without considering the impact of mixed wettability. However, most natural rocks are mixed-wetted, which was rarely studied in these studies. This paper presents a comprehensive study on the CO2 flooding process in the heterogeneous and mixed-wetted pore models based on phase-field method.
In this paper, 2D grain (of circular shape) models with random position and size distribution were constructed to reproduce the topology and morphology characteristics of the pore structure with heterogeneous wettability in the reservoir rocks. Pore-scale two-phase flow simulations were carried out to simulate the CO2 flooding process considering multiple influencing factors, and the phase-field method was used to capture the phase interface during the two-phase flow simulations. The effects of capillary number, viscosity ratio, wettability, density, gravity, interfacial tension, absolute permeability, and other factors on the performance of CO2 flooding were investigated comprehensively, and the two-phase flow mechanism was studied and analyzed.

2. Theory and Mathematical Model

2.1. Two-Phase Flow Model

In porous media, the fluid flow process can be described by the Navier–Stokes (N-S) equation. The momentum equation and mass conservation equation are listed as follows [40,46,47,48]:
Momentum equation:
ρ u t + ρ u u = p I + μ u + u T + F s t
Mass conservation equation:
u = 0
where ρ represents the density of the fluid (kg/m3), u is the velocity (m/s), I is the unit vector, t is the time (s), μ is the viscosity of the fluid (Pa·s), Fst is the term representing interfacial tension force (N/m).
For an incompressible fluid, the equations of motion and continuity of CO2/oil two-phase fluid flow in porous media are Equations (1) and (2), respectively.

2.2. Phase-Field Model

The phase-field method is used to capture the interface of two different fluids. Describing the generation and dynamic changes of physical properties such as density and viscosity at the phase interface between two fluids is the most critical point in this method. The auxiliary functions are generally used to describe the interface of two fluids on a fixed grid. This method considers not only the difference in density and viscosity between fluids, but also the influence of interfacial tension and gravity. The diffusion interface separating two phases is realized by the convection–diffusion equation (Cahn–Hilliard equation) [40,43,49,50]. The phase-field method is suitable to simulate the interface broken, coalescence, and contact line dynamics.
(1)
Representation of a two-phase flow interface
On the interface of two-phase fluid, the Cahn–Hilliard equation is generally used to describe the generation and dynamic change of the interface. The Cahn–Hilliard equation is used to calculate the convection and diffusion at the phase interface. In the process of solving, it is decomposed into two equations to participate in the calculation:
φ t + u φ = γ λ ε 2 ψ
ψ = ε 2 φ + φ 2 1 φ
where γ is the mobility, which denotes the moving velocity of the interface under a unit driving force (m3·s/kg), λ is the magnitude of the mixing energy (N), ε is the interface thickness (m), and φ is the phase-field variable, used to distinguish phases and the interface.
(2)
Interfacial tension
Convection and diffusion in the phase interface region of two-phase fluid will cause the change of interface free energy. Therefore, with the help of the diffusion interface representation, the interfacial tension can be calculated by the following expression:
F s t = G φ
where G is the chemical potential (J/m3). The chemical potential is calculated as follows:
G = λ 2 φ + φ φ 2 1 ε 2 = λ ε 2 ψ
In the phase-field method, the interfacial tension is calculated by the phase-field variable gradient and the phase-field auxiliary variable (ψ), and the interfacial tension is continuously distributed on the phase interface. The hybrid energy density parameter (λ) and the interface thickness control parameter (ε) are related to the interfacial tension (σ) coefficient, and they are connected by Equation (7). When the phase interface is in equilibrium, the hybrid free energy of the phase interface region is minimum, and the interfacial tension is obtained by integrating the energy on the interface curve per unit length [41,49,51].
σ = 2 2 3 λ ε
In general, the interface thickness control parameter (ε = hc/2) hc represents the size of the feature grid. During the calculation, mobility parameters (γ) are obtained by the interface thickness (ε); γ = ε2 is generally considered the most appropriate value. The mobility parameter determines the diffusion coefficient of the phase field to some extent. It must consider two aspects: keeping the interface thickness constant and not excessively suppressing the convection term [52].
(3)
Wetting angle
The fluid–rock interface is defined as the non-slip boundary, and there is a certain wetting angle [42,53,54].
u = u w
n γ λ ε 2 ψ = 0
n ε 2 φ = ε 2 cos θ φ
where uw represents the slip velocity of the particle surface (m/s); Equation (9) indicates that the normal flow rate of the phase-field variable is 0, and n indicates the unit vector perpendicular to the particle wall; Equation (10) represents the wetting angle of the particle surface, which can be given by the phase-field variable.
(4)
Density and viscosity
During the CO2 flooding process, fluid 1 and fluid 2 are defined as CO2 and oil, respectively. At the same time, under the condition of multi-physical field coupling, the density and viscosity of a two-phase fluid are defined as functions related to the phase-field variables, expressed, respectively, as:
ρ = ρ c 1 + φ 2 + ρ o 1 φ 2
μ = μ c 1 + φ 2 + μ o 1 φ 2
where the subscripts c and o denote the CO2 phase and the oil phase, respectively.
Equations (1)–(4) constitute the governing equations in the numerical simulation of micro-scale CO2 flooding.

3. Results and Discussion

At first, the model is verified by a single-phase flow simulation of CO2. At the pore scale, the influencing factors of CO2 flooding are discussed through a heterogeneous porous medium model.

3.1. Validation of the Numerical Model

A uniform porous medium model was reconstructed to verify the reliability of the numerical model proposed in this study, and the related parameters used in the validation model are shown in Table 1.
The schematic diagram of the verification model and its boundary conditions are shown in Figure 1; the white circle represents the simplified solid particles inside the rock. The left side of the model is the velocity inlet, and CO2 is injected from the left side, with an injection velocity of 0.01 m/s; the right side is the pressure outlet, the outlet pressure is 0 Pa, and the grain surface and the upper and lower boundaries of the model are defined as non-slip boundaries.
The obtained velocity and pressure fields are shown in Figure 2, in which the white indicates the solid particles. Since the single-phase flow simulation ignores the influence of gravity, the velocity and pressure fields are symmetrically distributed, which verifies the numerical models.

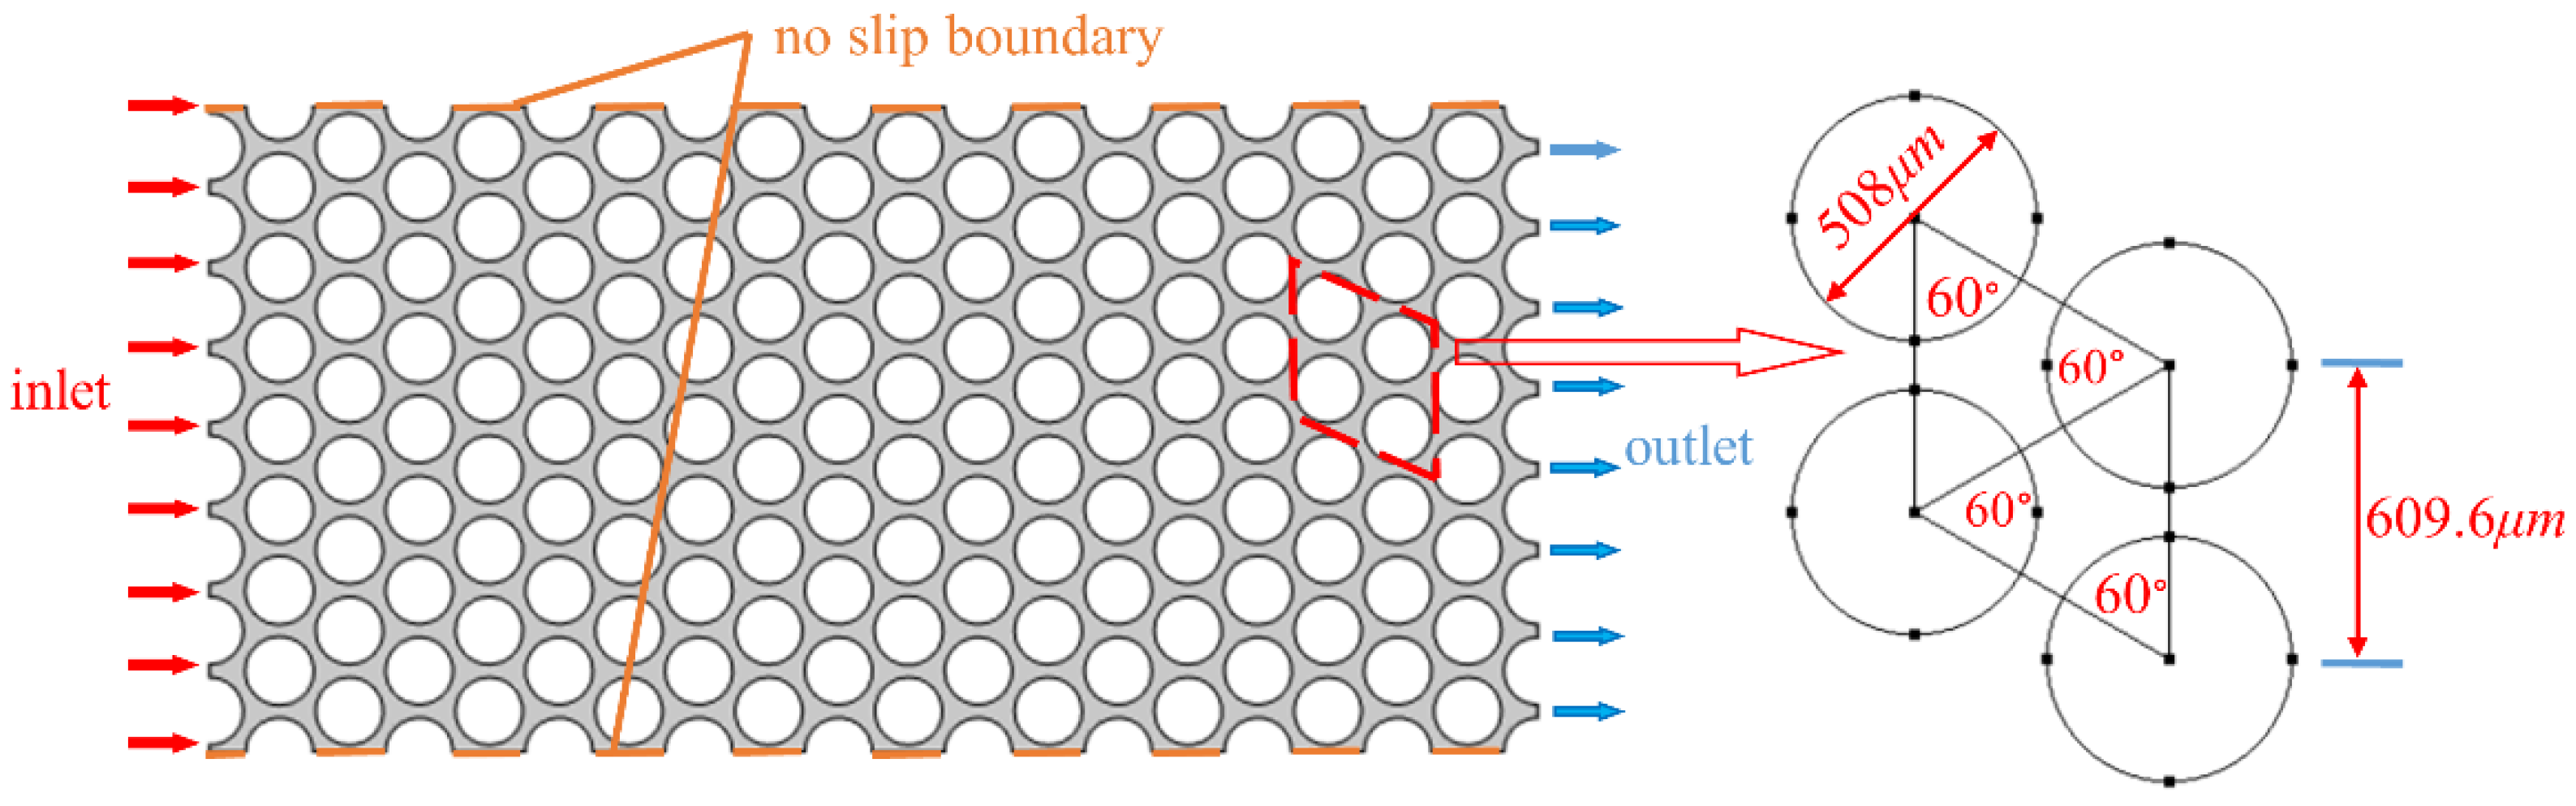
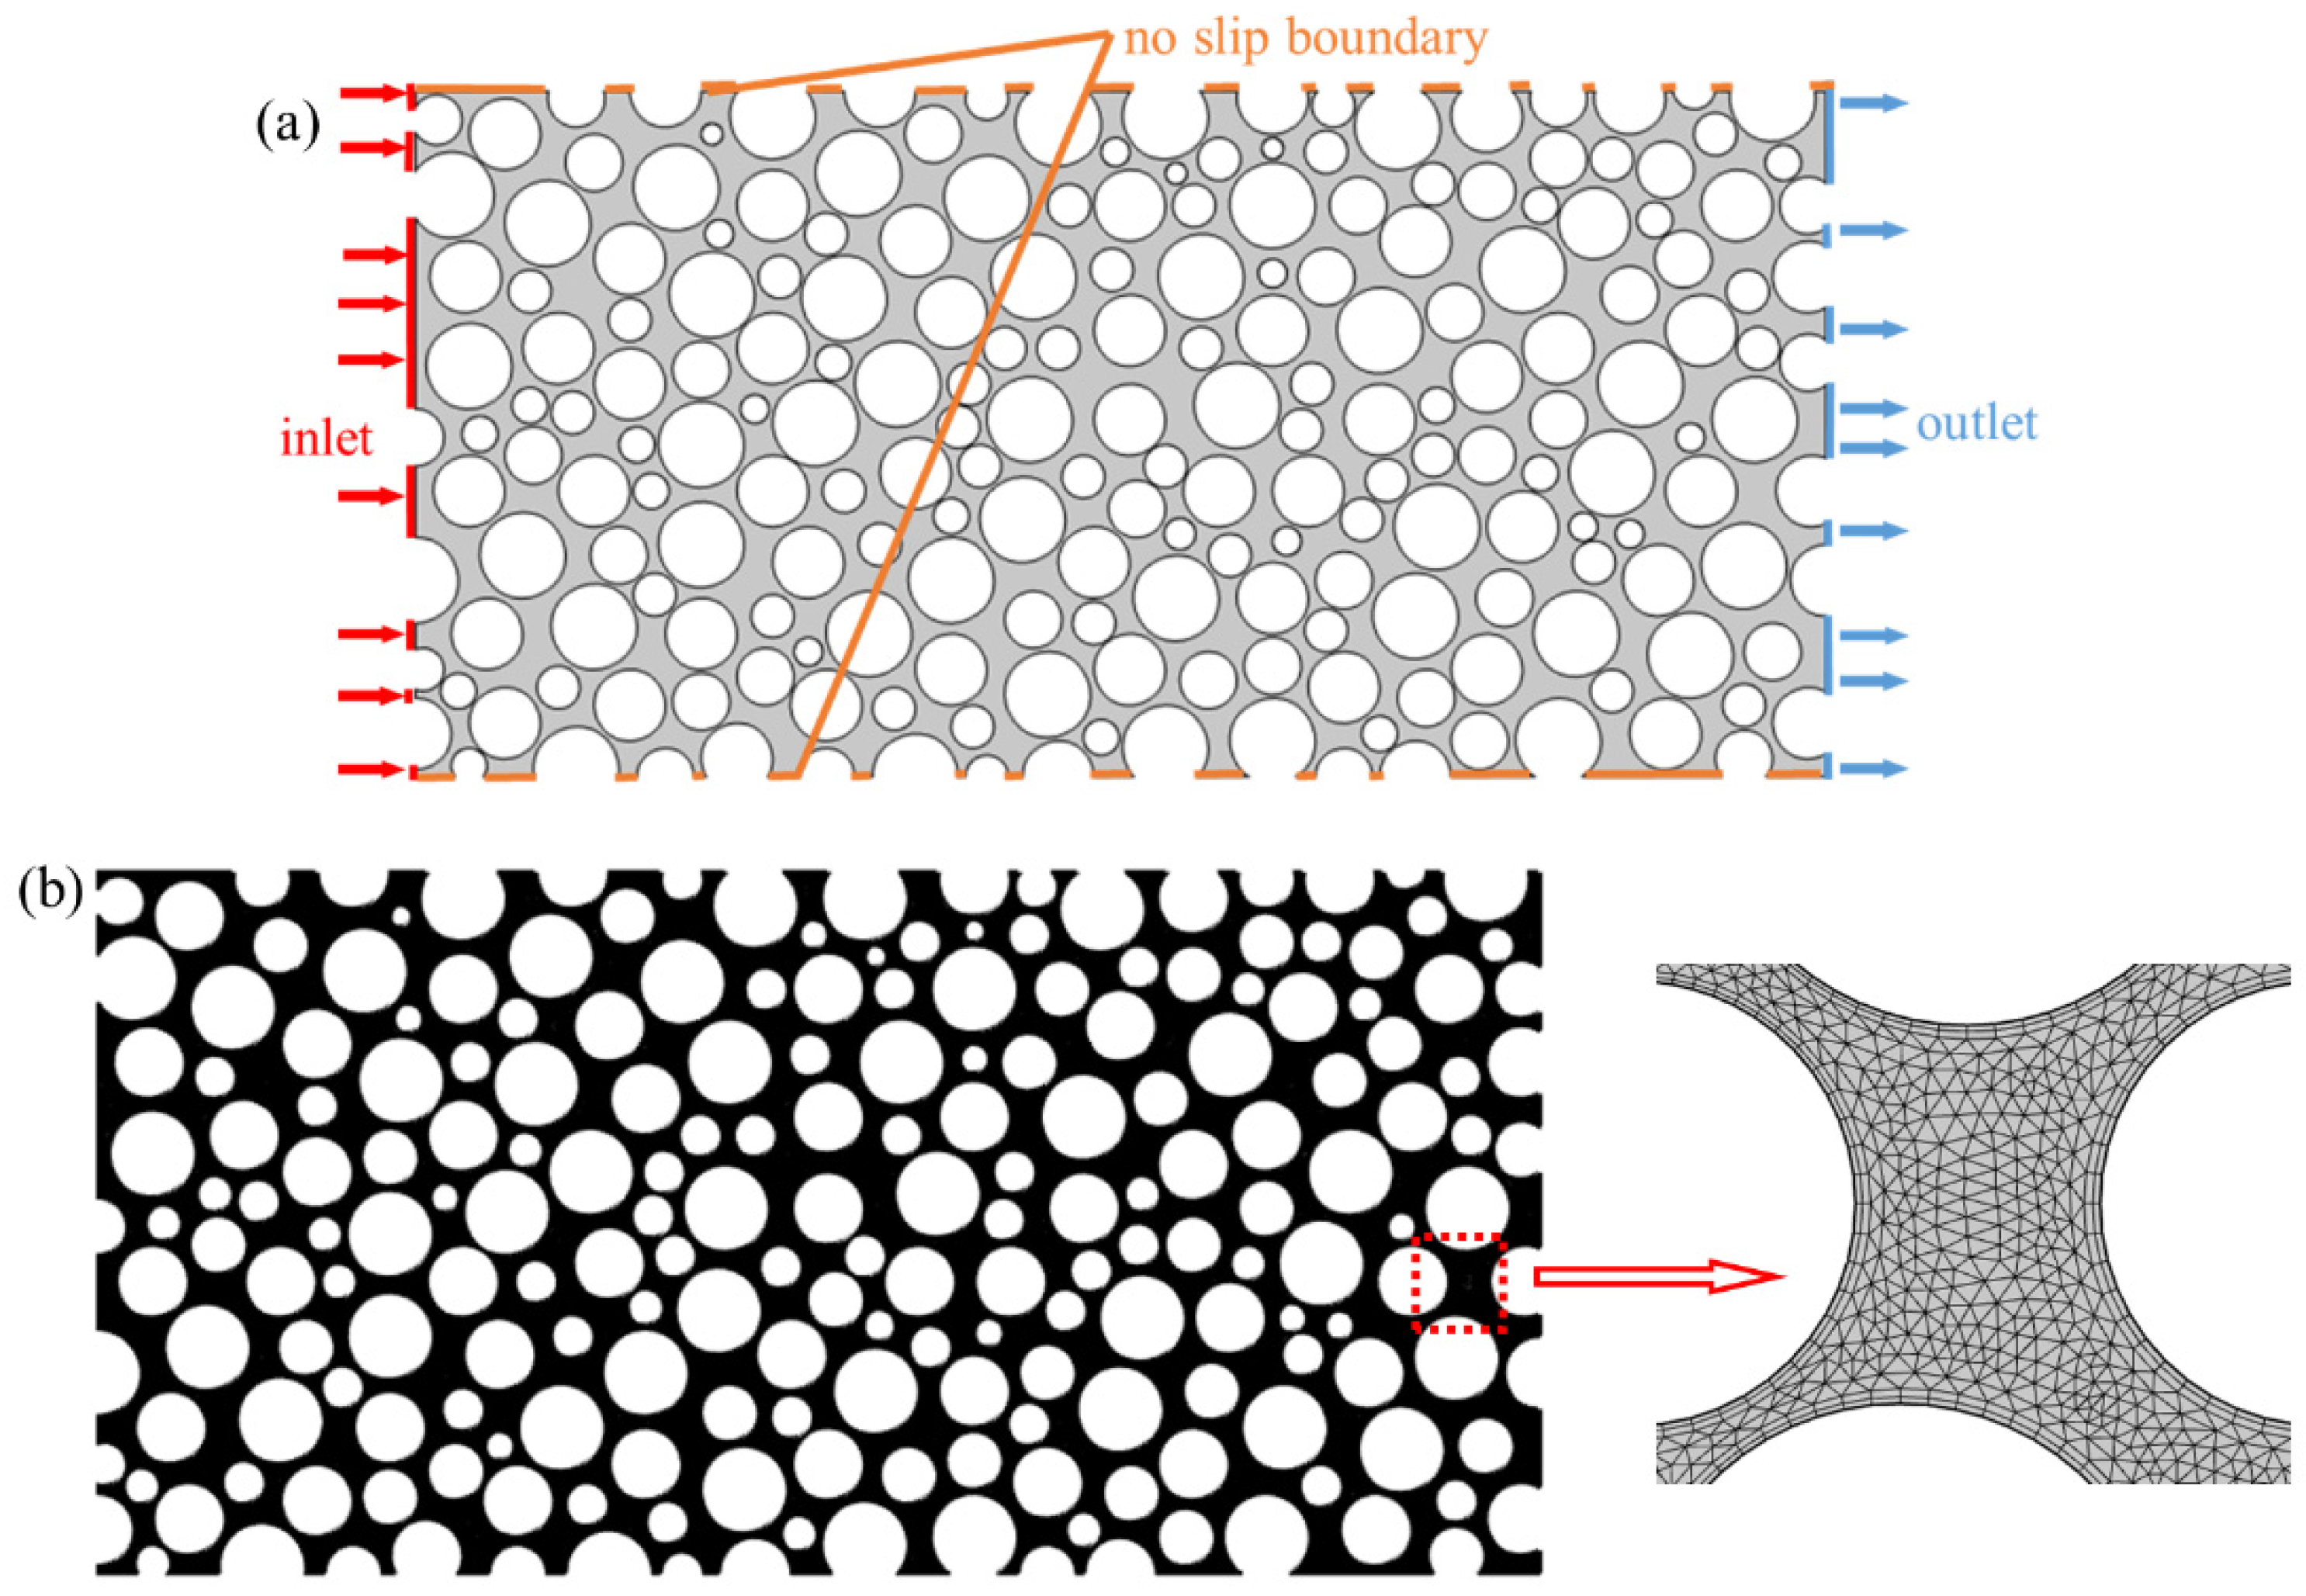
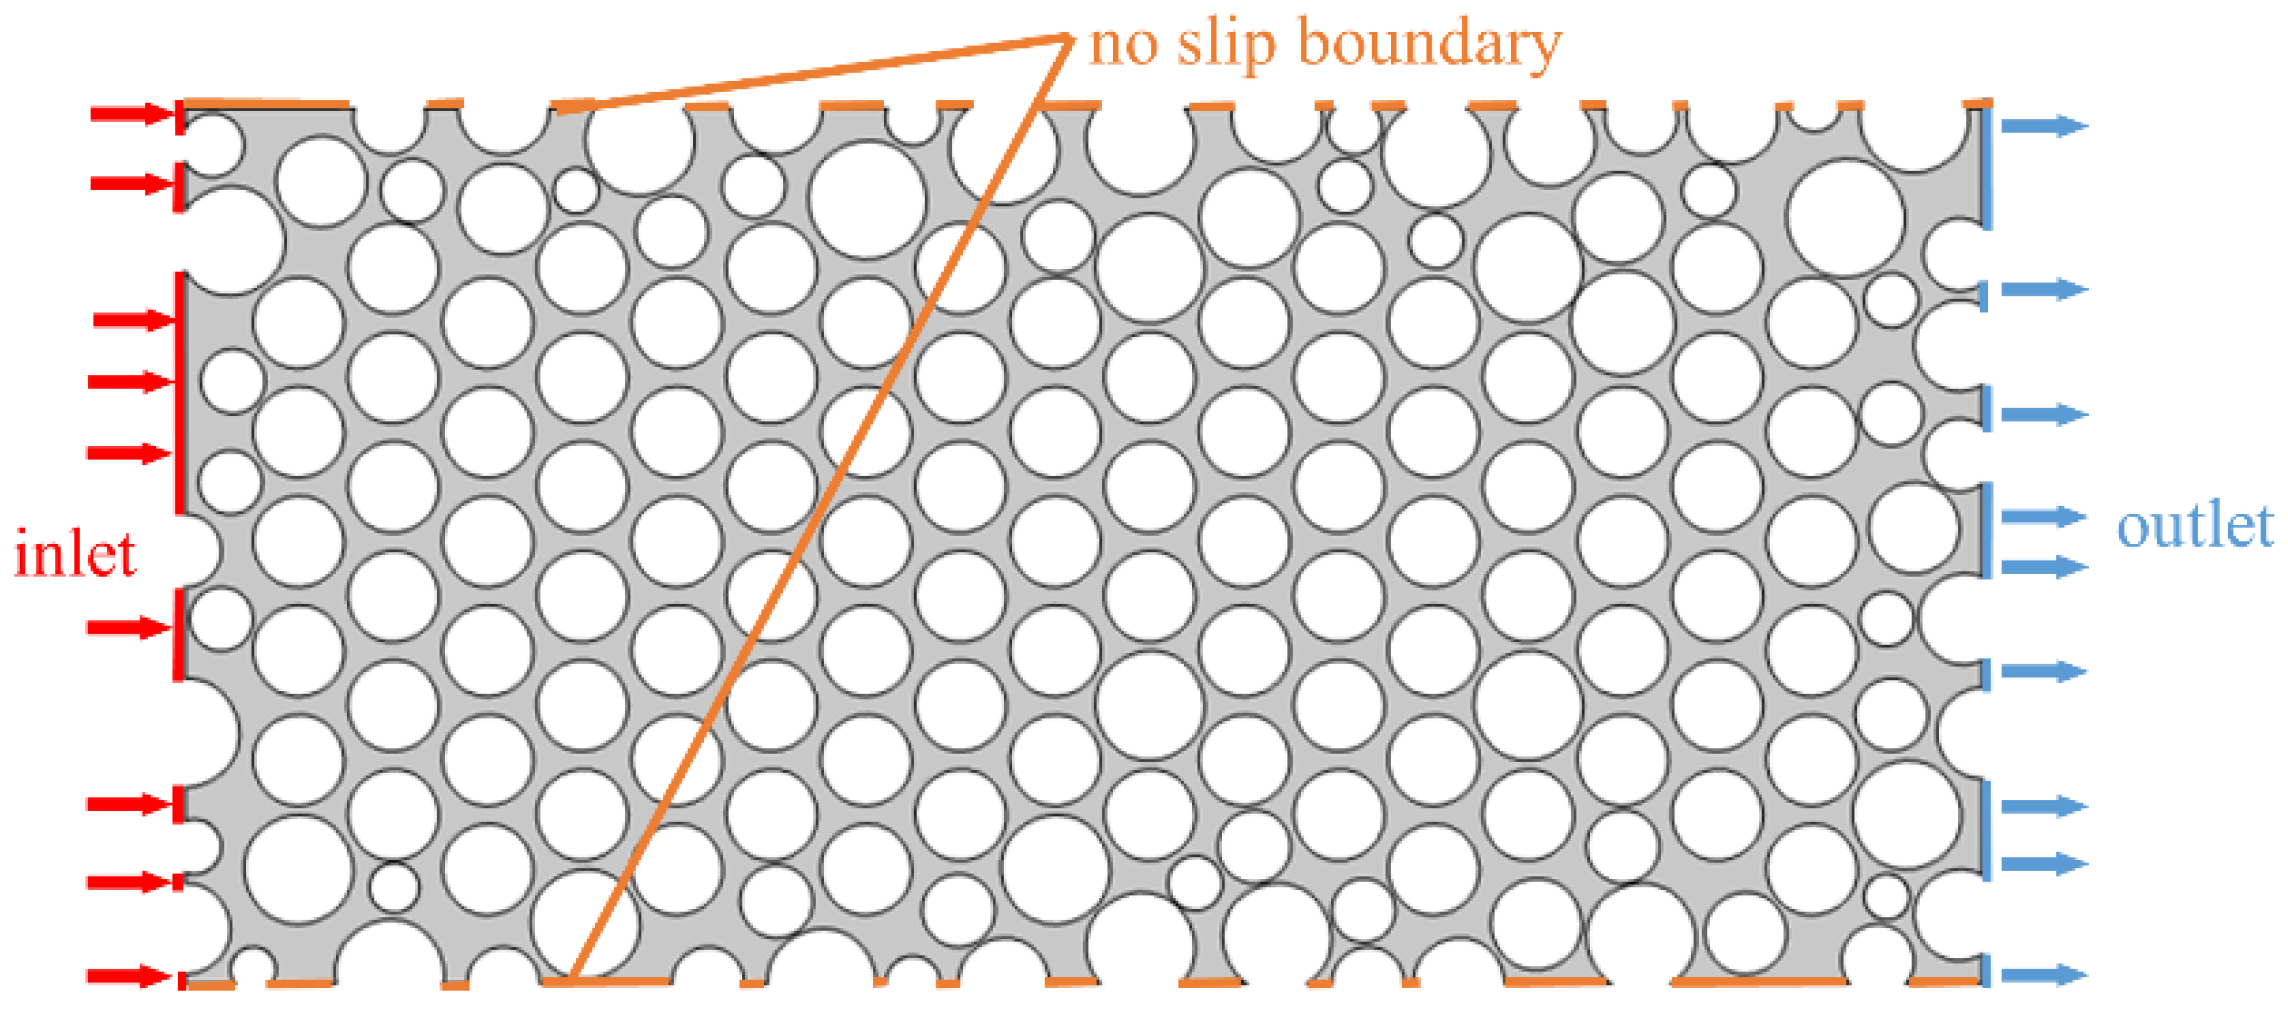
3.2. Geometry Setup of the 2D Heterogeneous Model and Input Parameters of the Two-Phase Flow

To study the microscopic displacement mechanism of CO2 flooding, a two-dimensional heterogeneous porous media model was constructed, as shown in Figure 3a. This model is in a rectangular shape 10,030.65 μm in length and 4876.80 μm in width. The circles of various sizes are arranged randomly in the 2D heterogeneous model. The maximum and minimum diameters of the circles are 609.60 μm and 152.40 μm, respectively. The grey areas indicate pores, and the porosity of the two-dimensional model is 36.36%.
The schematic diagram of the grid model is shown in Figure 3b. The number of elements included in the grid in the two-dimensional model is 83,771, the maximum and minimum grid cell sizes are 63.50 μm and 0.73 μm, respectively. The maximum unit growth rate is 1.08 and the curvature factor is 0.25.
The boundary conditions of the model are set as: (1) The inlet on the left side of the model is the velocity inlet, and CO2 is injected from the left side; (2) The outlet on the right side of the model is a pressure outlet with a size level of 0 Pa; (3) The surface of circular solid particles is a neutral wetting boundary, contact angle = 90° (the solid particle surface is neither oil-wetted state nor nonoil-wetted state); (4) The upper and lower boundaries of the model and the circular particle surface are non-slip boundaries; (5) CO2 and oil are considered incompressible Newtonian fluids due to the small scale of the model and the small variation in fluid pressure; (6) Without taking into account the effects of gravity and temperature. The initial state of the model is saturated with oil, and the simulation is terminated after injecting 2 PV of CO2 into the inlet. The basic physical parameters of oil and CO2 are shown in Table 2. In the process of simulation calculation, the size of the time step is controlled by a numerical solver, the initial time step is set to 10−9 s, the discretization of the equations is in backward differential format, and the solver is PARDISO.

3.3. Multiple-Parameter Analysis

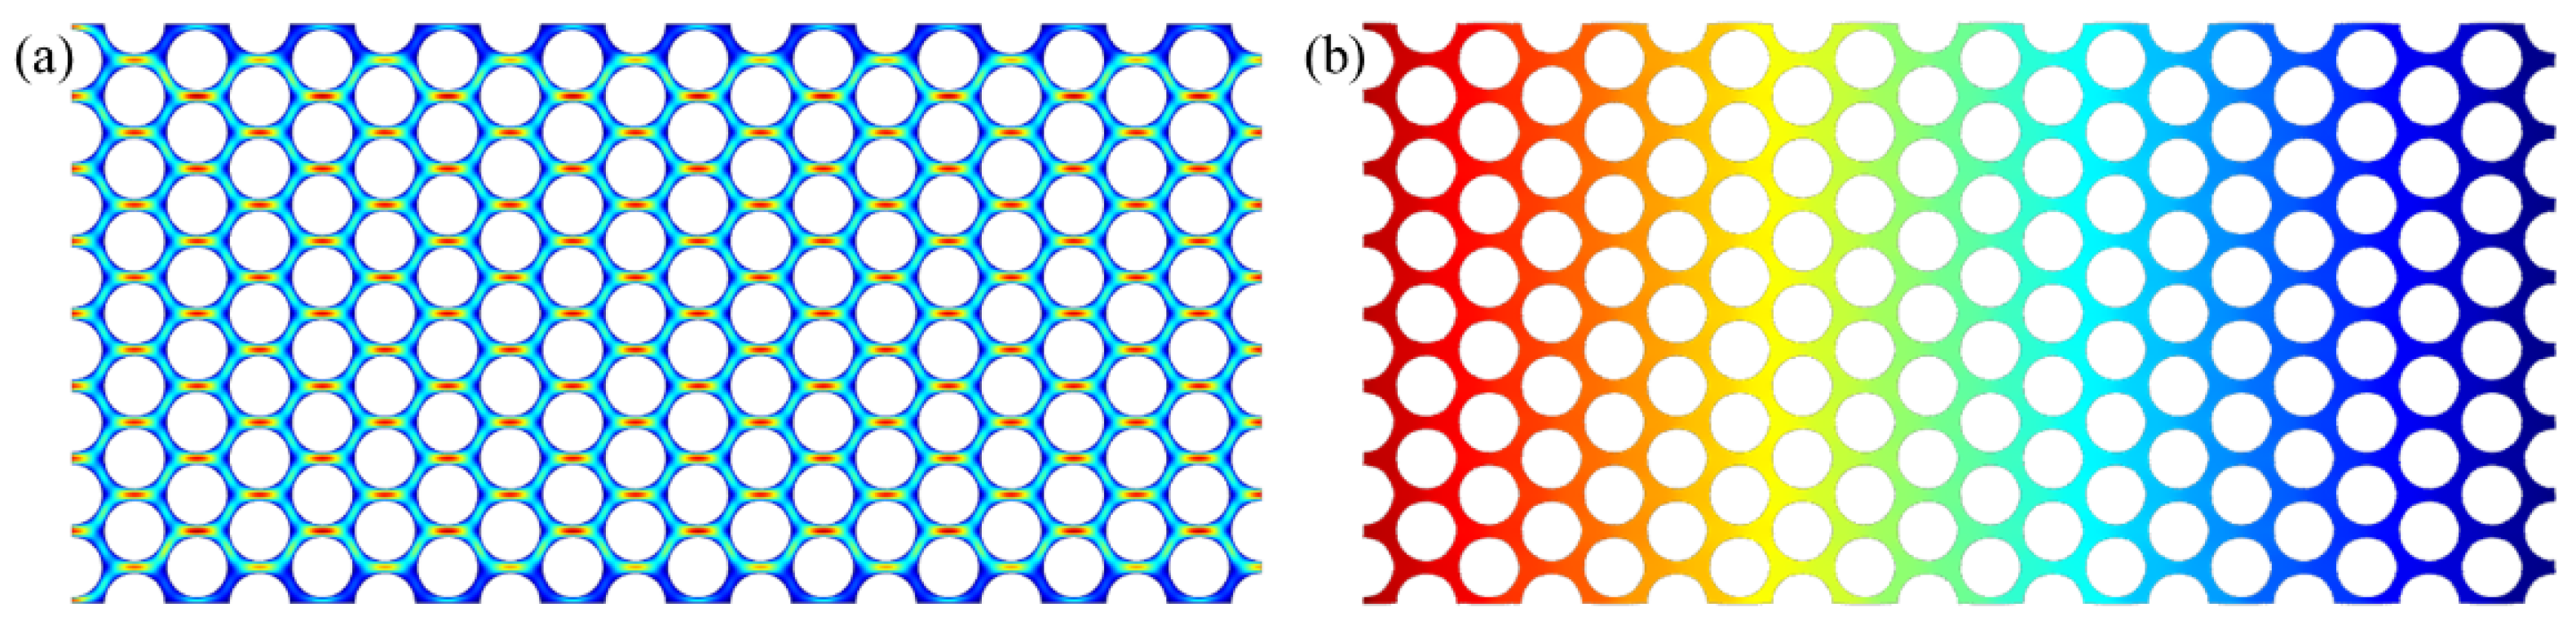
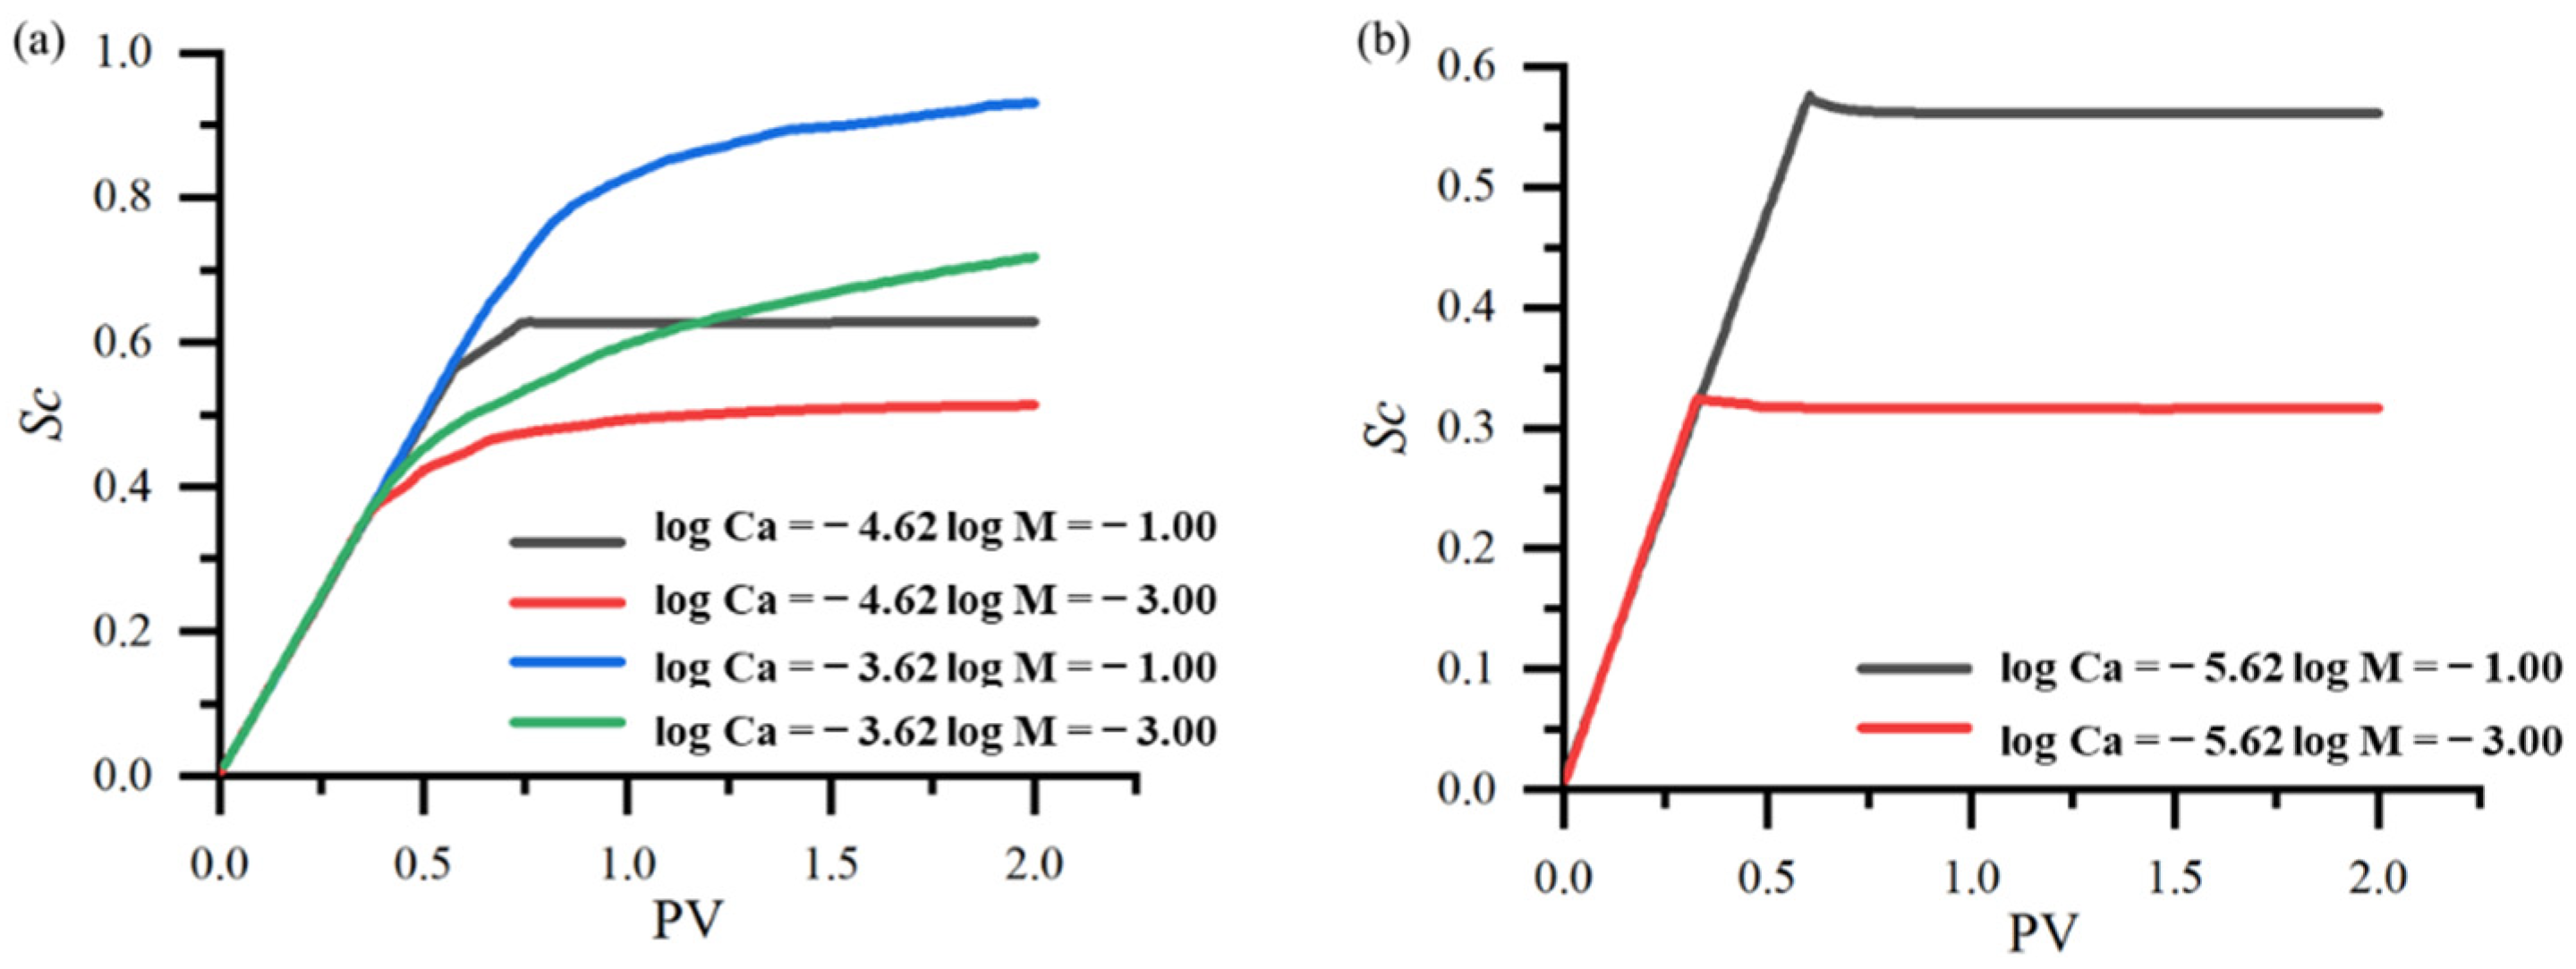
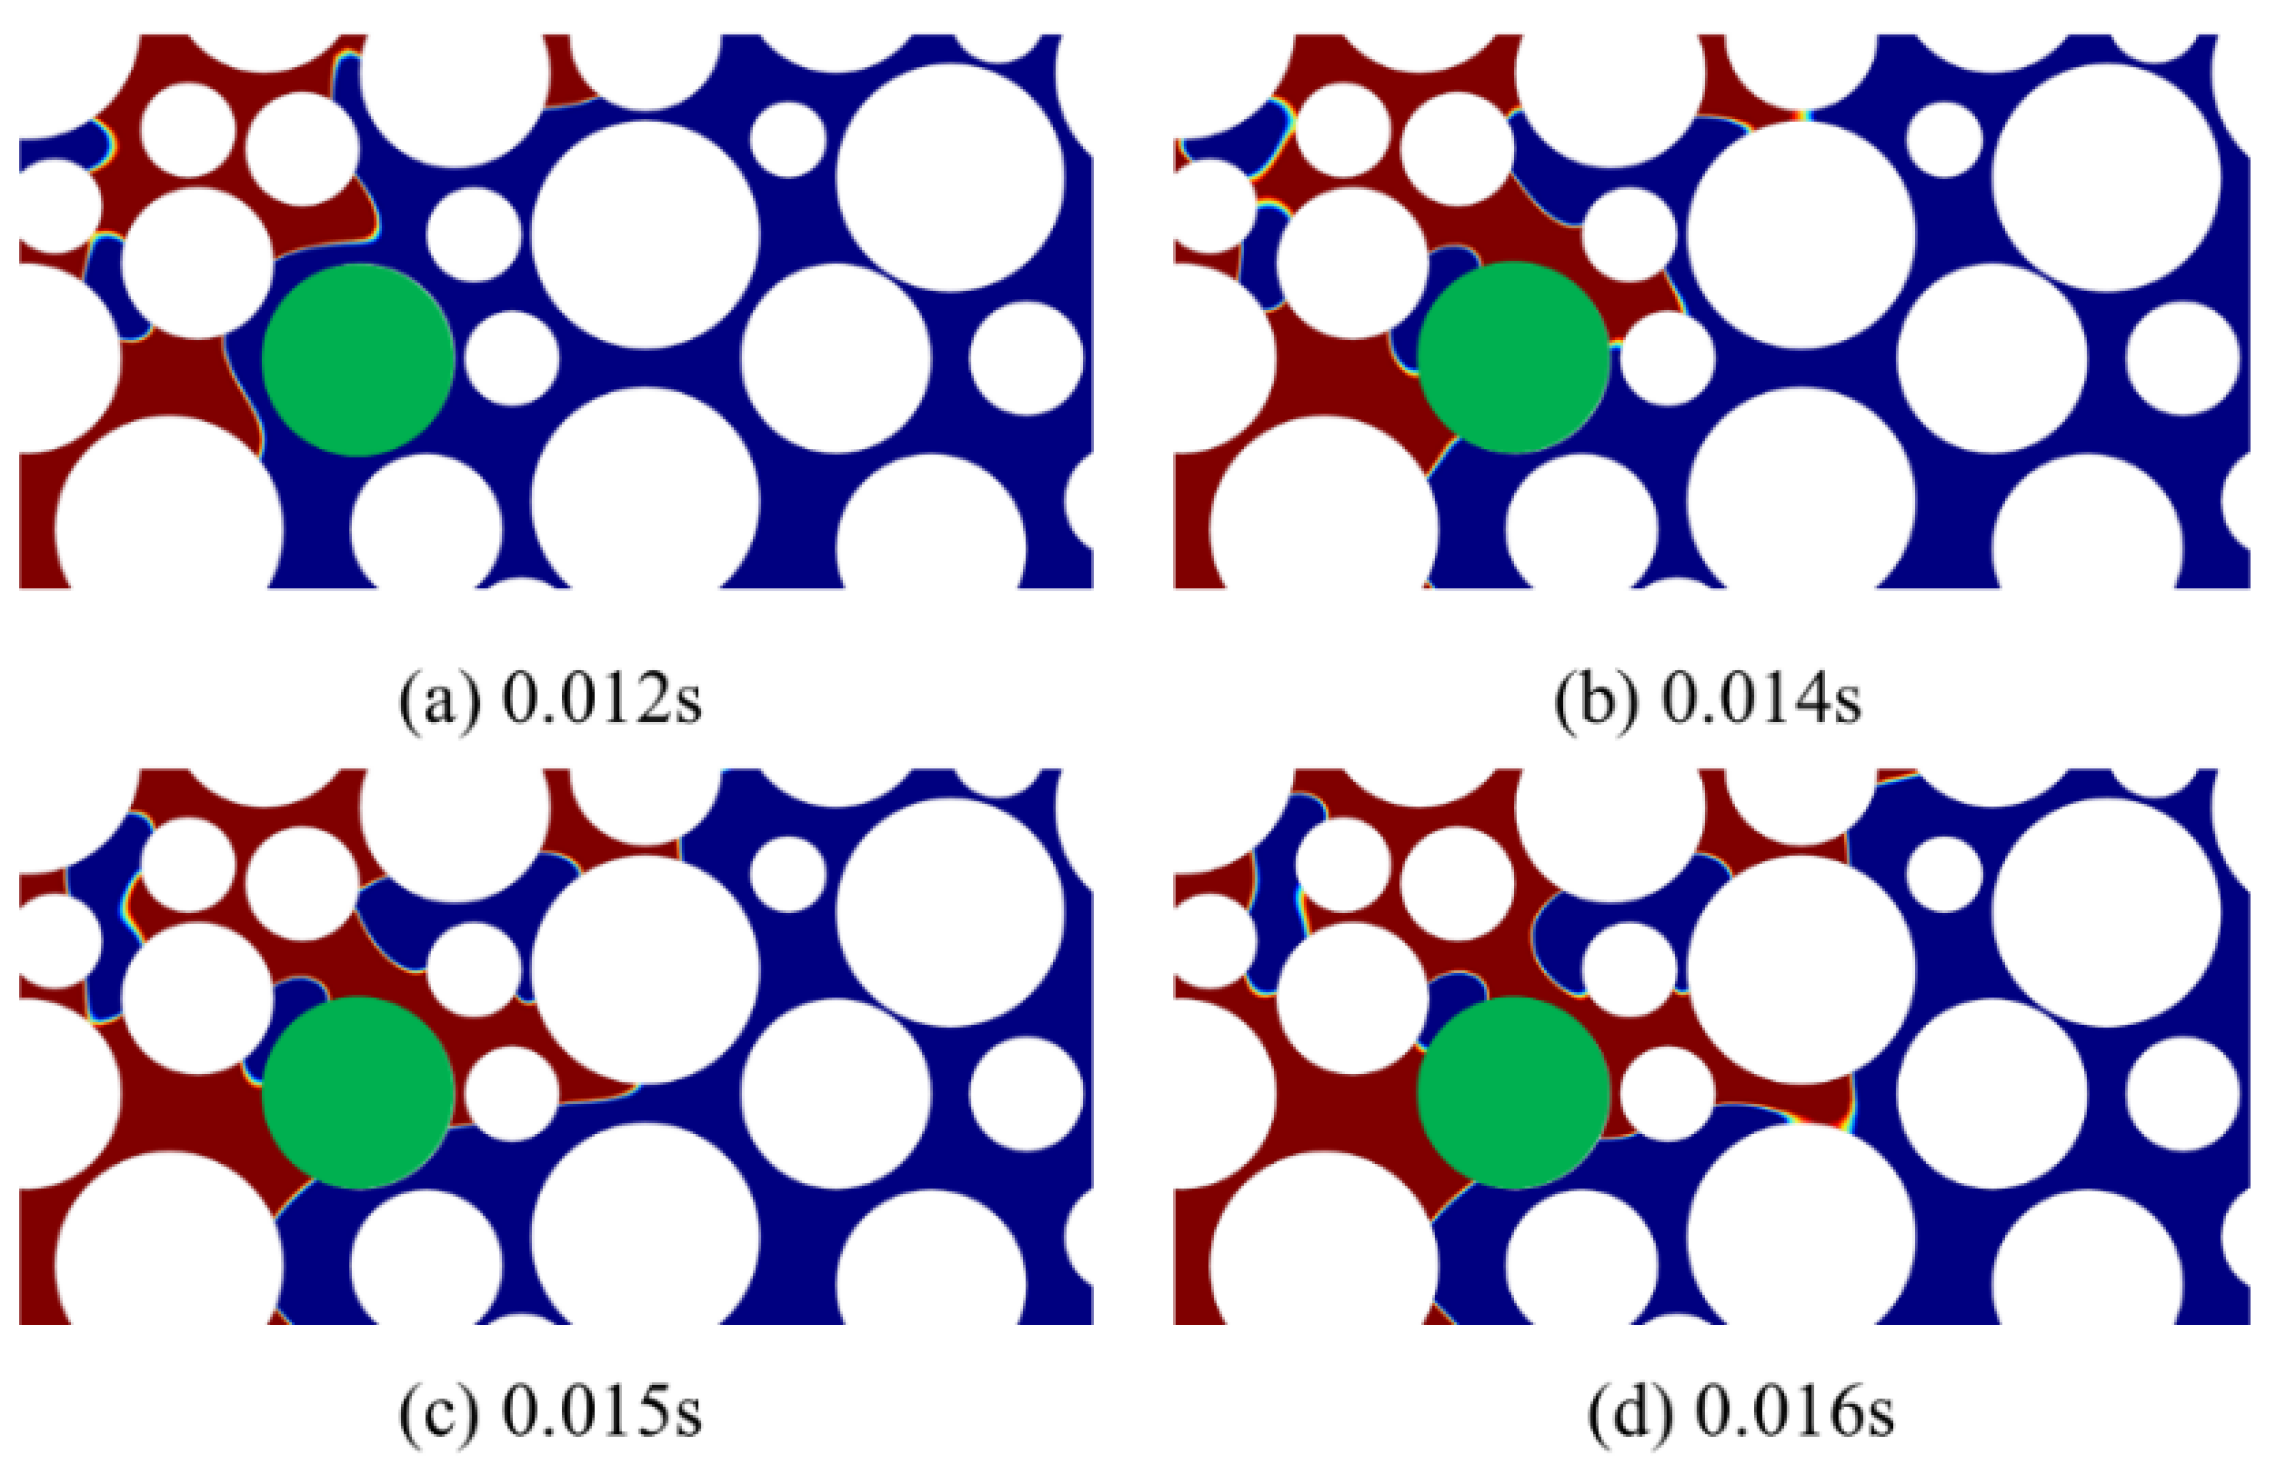
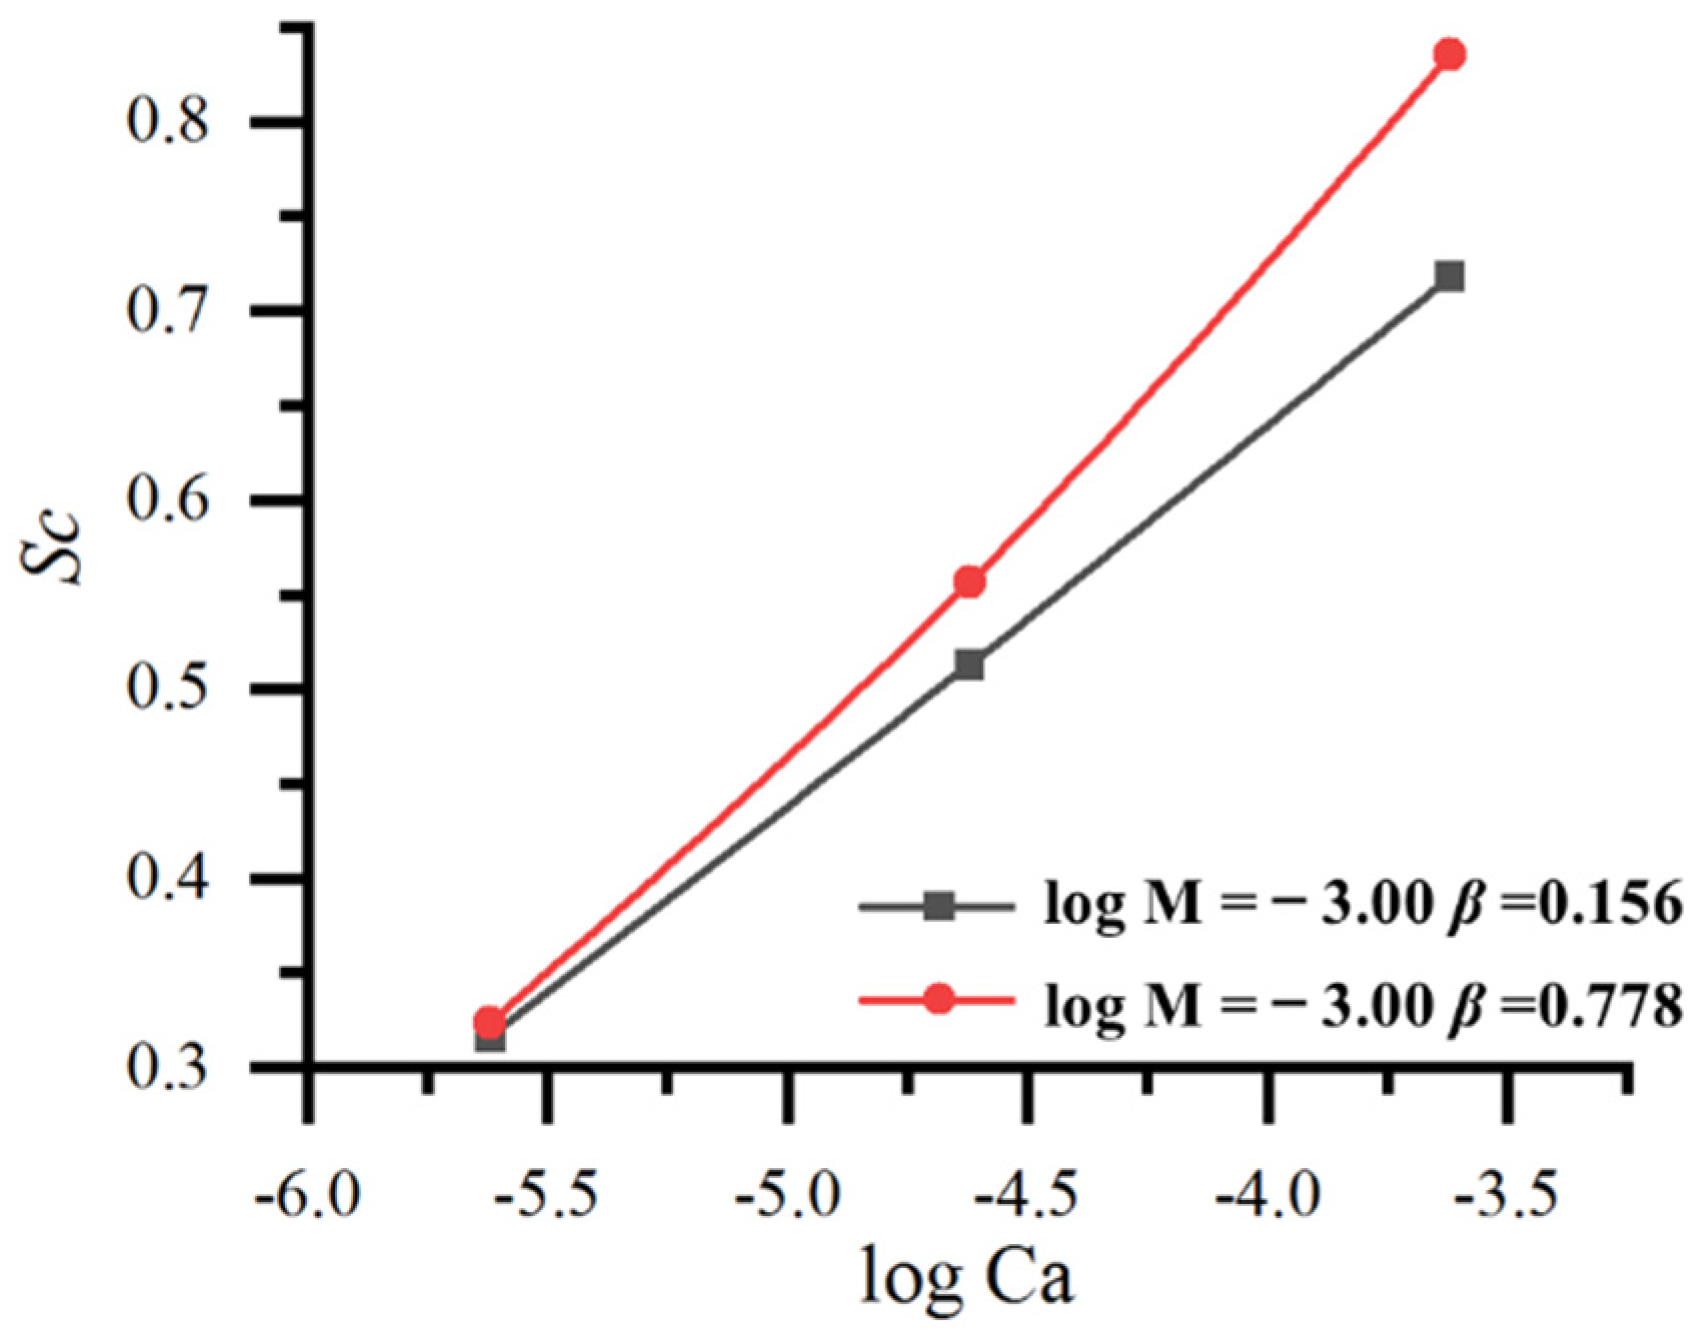
3.3.1. Effect of Capillary Number and Viscosity Ratio on Fluid Flow

When CO2 is used to displace oil, CO2 will displace the oil in the pores in a gaseous or liquid state under the influence of temperature and pressure. In the process of CO2 flooding, the different injection velocities will lead to different dominant forces of displacement, which may be a viscous force or capillary force. It is precisely because of the different dominant forces that the state and distribution of fluid flow in pores are different. Capillary number and viscosity ratio are the two most important factors, and their variations lead to changes in the fingering state during displacement. Next, the effect of capillary number and viscosity ratio on the CO2 flooding effect is studied by numerical simulation. The capillary number is a dimensionless value which represents the ratio of the viscous force to the capillary force of the fluid; the mathematical expression is as follows [55,56]:
Ca = u i n j μ c σ
where uinj is the average injection velocity at the inlet (m/s), μc is the viscosity of CO2 (Pa·s), and σ is the interfacial tension coefficient (N/m).
The viscosity ratio is also dimensionless and represents the ratio of the viscosity of CO2 to the viscosity of the oil. The mathematical expression is [55,56]:
M = μ c μ o
where the subscripts c and o denote the CO2 phase and the oil phase, respectively.
The physical parameters of CO2 are kept constant, while the physical parameters of the oil are changed so that the number of capillaries and the viscosity ratio change. According to different capillary numbers and viscosity ratios, six groups of control models are set up to study the effect of the change in capillary number and viscosity ratio on CO2 flooding. The specific parameter settings of each simulation group are shown in Table 3.
Under the conditions of different capillary numbers and viscosity ratios, the distribution of CO2 saturation corresponding to CO2 breaking through the outlet is shown in Figure 4; the red and blue areas represent CO2 and oil, respectively. Figure 4 shows that the injected CO2 forms a continuous flow channel throughout the porous medium model regardless of the conditions, due to the injected CO2 overcoming the inlet pressure. In the CO2 flooding process, the fingering phenomenon can be observed in most models. Only in the case of a large capillary number (log Ca = −3.62) and large viscosity ratio (log M = −1.00) (Figure 4f) is there no obvious fingering phenomenon in the displacement process, so it can be regarded as a stable displacement process.
At a low capillary number (log Ca = −5.62) and a low viscosity ratio (log M = −3.00), the CO2 saturation distribution is shown in Figure 4a. It shows a thin and long CO2 main channel, which shows an obvious fingering phenomenon. This phenomenon is a capillary fingering phenomenon, which is an unstable displacement situation. In this case, the influence of viscous force can be ignored due to the small injection speed, and the dominant force of displacement is the capillary force.
At a low capillary number (log Ca = −5.62) and a high viscosity ratio (log M = −1.00), the CO2 saturation distribution is shown in Figure 4d. It shows a larger CO2 main channel compared with the CO2 saturation distribution in Figure 4a, and the distribution of CO2 is also increased significantly when it breaks through the outlet, which is also recognized as a capillary fingering phenomenon and an unstable displacement. By comparing Figure 4a with Figure 4d, it can be seen that under the low capillary number condition, a higher viscosity ratio contributes to displacement and oil extraction.
In this heterogeneous two-dimensional porous medium model, the CO2 saturation (Sc) in the pores can reflect the oil recovery ratio. In the simulation, CO2 of two pore volume (PV) is injected, and the relationship between the final CO2 saturation (Sc) and the capillary number and viscosity ratio is shown in Figure 5. It can be seen from Figure 5a that CO2 saturation increases with the increase in capillary number when the viscosity ratio is the same. It can be seen from Figure 5b that CO2 saturation increases with the increase in viscosity ratio when the capillary number is constant.
A total of 2 PV of CO2 is injected into the model; the relationship between the CO2 saturation and the PV number of the injected CO2 is shown in Figure 6. It can be seen that the CO2 saturation increased sharply during the period when 1 PV of CO2 was injected into the pore. However, with the injection volume’s continuous increase, the increase rate of CO2 saturation decreased rapidly. At the early stages of CO2 flooding, the injected CO2 broke through along the highly permeable zone with lower resistance. Once the CO2 breaks through, it is difficult to sweep other regions, which results in a lower increase in recovery.
It can be seen from Figure 6b that at a low capillary number (log Ca = −5.62) and a high viscosity ratio (log M = −1.00), once the CO2 breaks through the outlet, there is a slight decrease in the CO2 saturation, and then it reaches a stable value.
Figure 7 shows the typical change in the CO2 main channel during CO2 flooding. Around the yellow grain, the interface of the CO2 main channel shrinks after CO2 breaks through the outlet (0.77 s). Figure 8 shows the pressure changes at point P near the outlet, which steadily increases until the frontier of CO2 flooding reaches point P. When the CO2 passes through point P (t = 0.66 s), the pressure noticeably increases, and the maximum pressure appears at 0.67 s. We denote the pressure in the CO2 plume as pc, the pressure in the oil phase as po, and the capillary pressure as p. When CO2 displaces crude oil in pores (0.61−0.67 s), the pressure in the CO2 plume is greater than the sum of the pressure in the oil phase and the capillary pressure (pc > po + p). After the CO2 flooding front passes point P, the pressure (pc) of the main channel drops rapidly, as shown in Figure 8. At this time, the pressure in the CO2 plume is significantly less than the sum of the pressure in the oil phase and the capillary pressure (pc < po + p). After the CO2 plume breaks through the outlet (0.77 s), the pressure at point P decreases to a minimum and then remains almost constant, and oil begins to flow back into the pores previously occupied by CO2. The oil reflow process leads to the contraction of the CO2 main channel, as shown in Figure 7. When the pressure reaches equilibrium (pc = po + p), the flow state becomes stable, as shown in Figure 7d. It can be seen that the CO2 saturation curve decreases in the opposite direction during the CO2 injection, which is caused by the oil flows back into the previously occupied pores, and the oil reflux process is caused by the outlet effect; this phenomenon also appeared in the study of Zhu et al. [35].
The breakups of non-wetting fluids are generally caused by the mechanisms of snap-off and viscous breakup. The snap-off occurs when the capillary force dominates the fluid flow behavior, which is an interface instability phenomenon. According to the previous description, there is no breakup of the CO2 plume to be observed (in Figure 4a,d, log Ca = −5.62) when the capillary force dominates the flow behavior. This indicates that although the dominant force of displacement is the capillary force, the capillary force is not large enough, which is consistent with the study of Zhu et al. [35]. When the capillary force is relatively weak (log Ca= −4.62), there is no snap-off. Therefore, the fracture of the CO2 plume in Figure 9 belongs to viscous breakup. At the same time, it is shown that the effect of low-viscosity CO2 to displace high-viscosity oil is not satisfactory in the case of too small a viscosity ratio, and the low-viscosity CO2 cannot sweep the high-viscosity oil. Viscous breakup indicates that the viscous force plays an important role in the CO2 displacement of oil, which is detrimental to oil recovery.

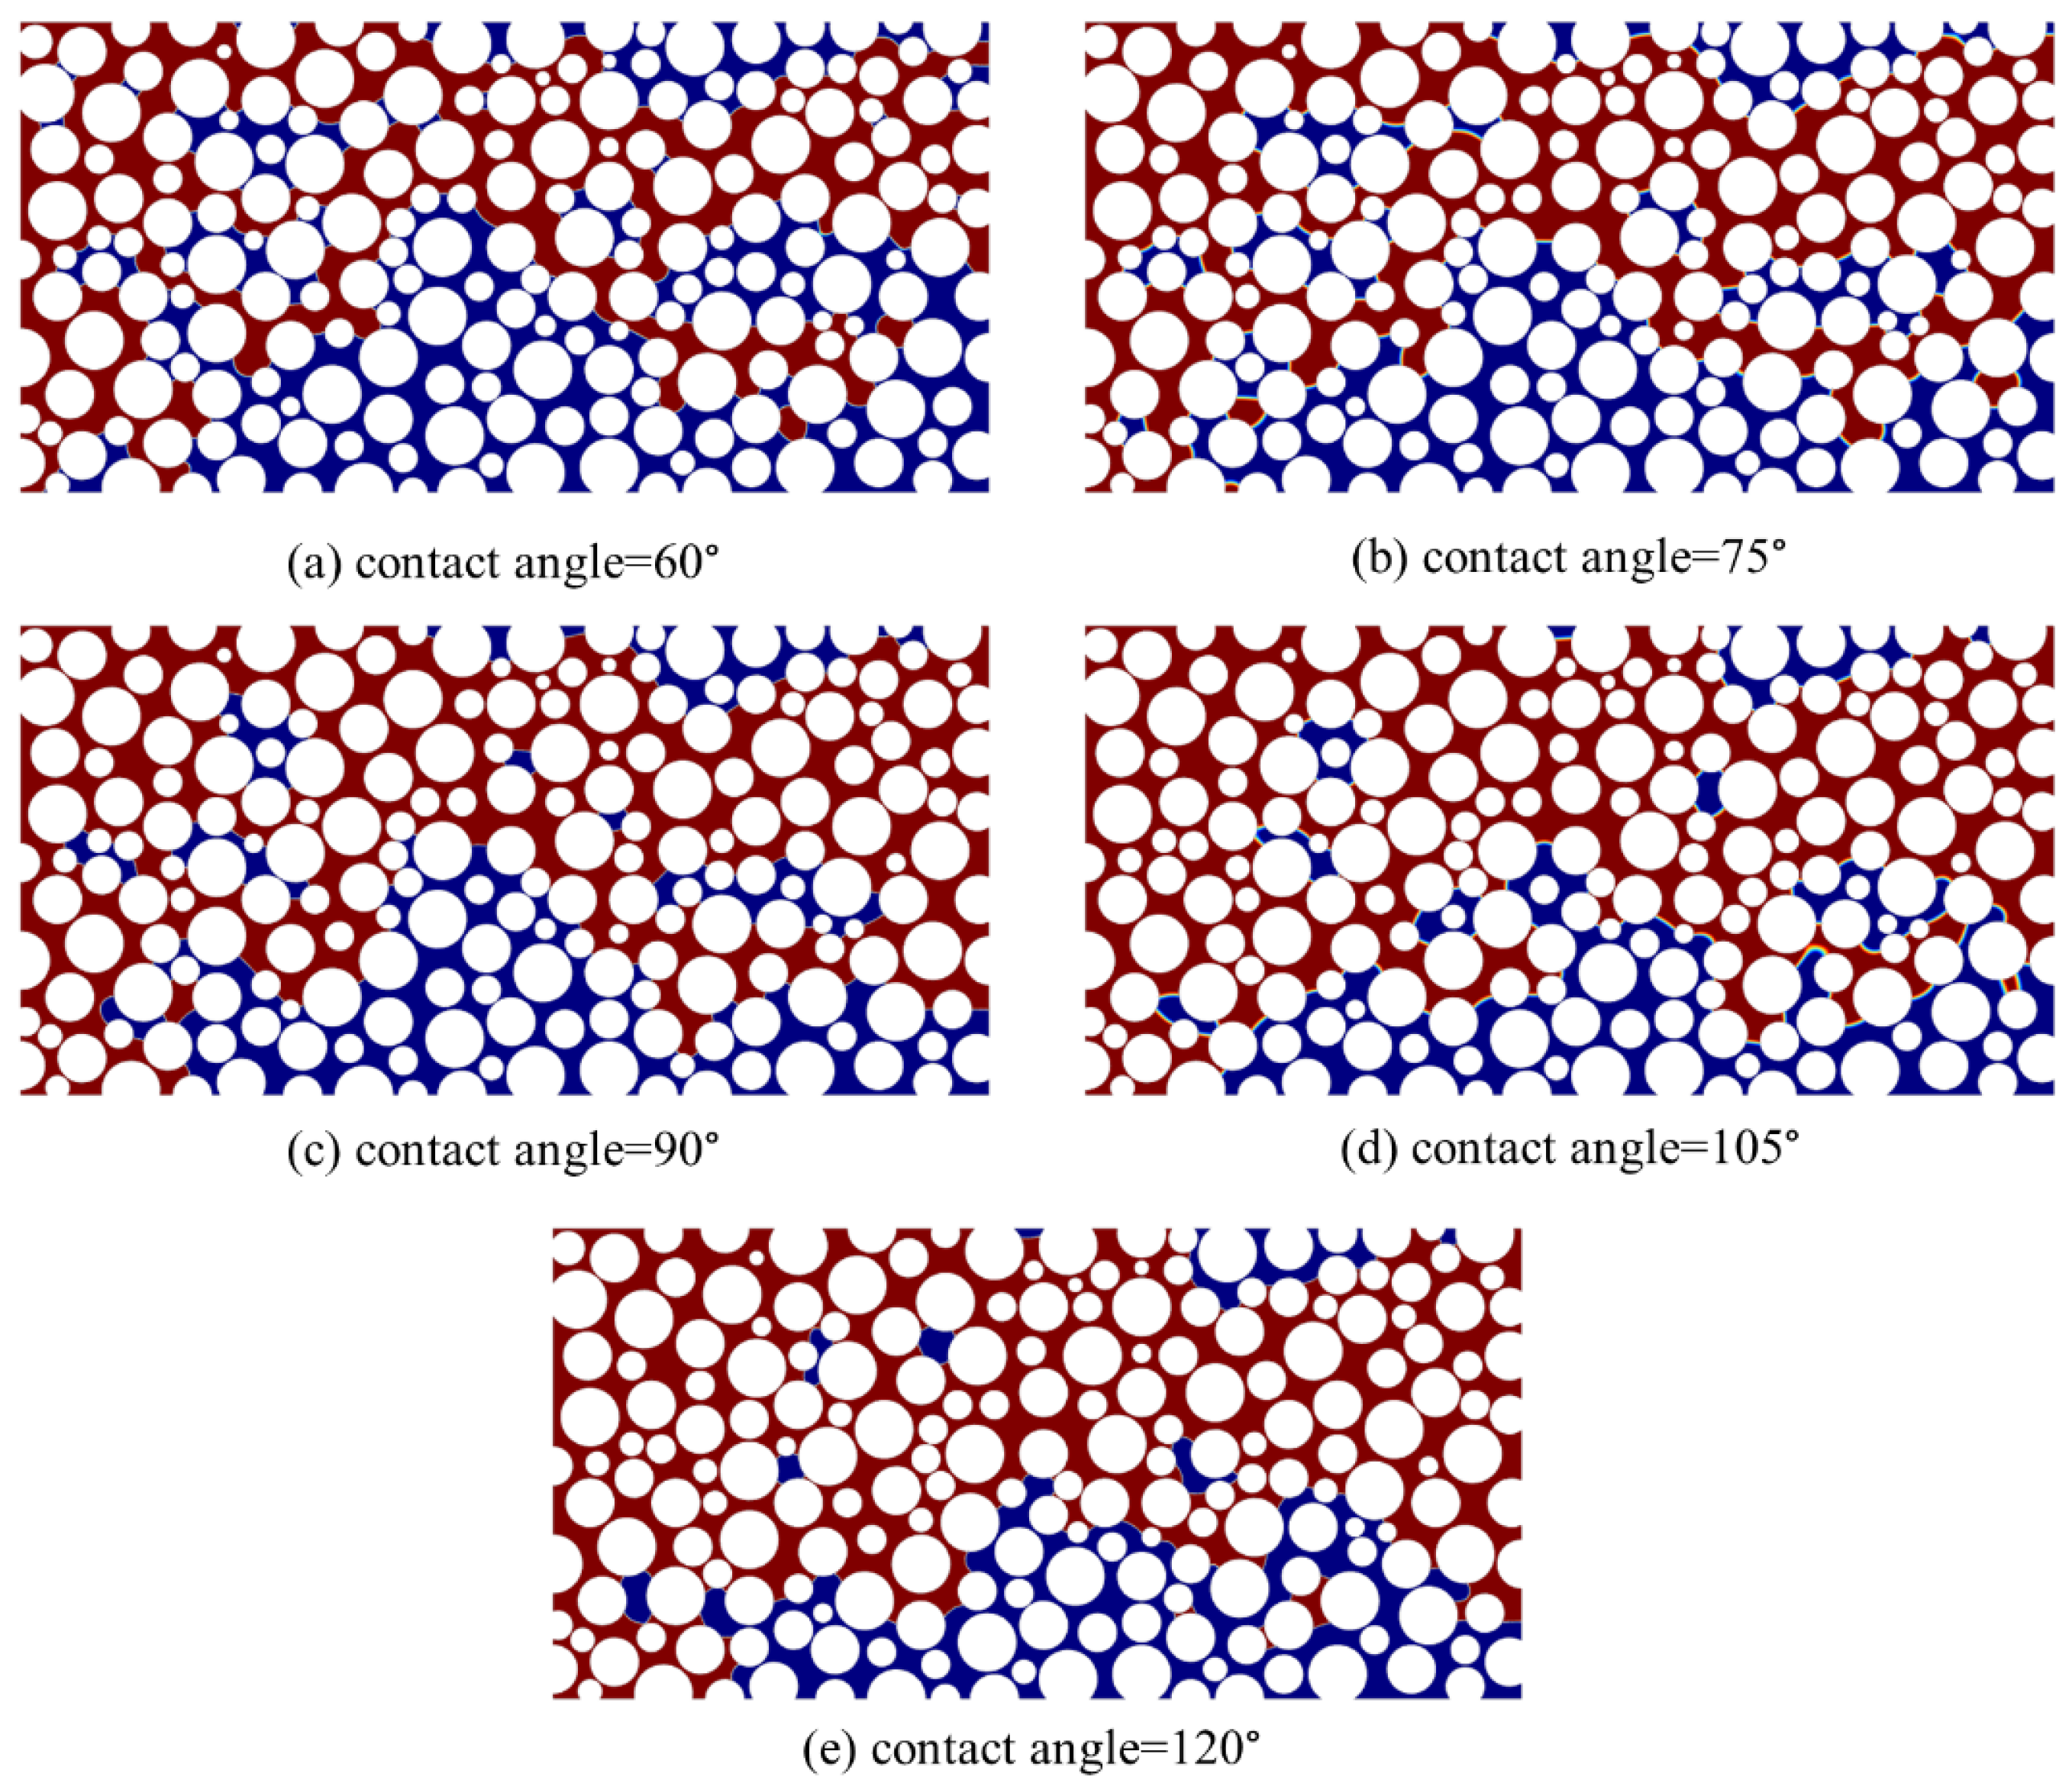
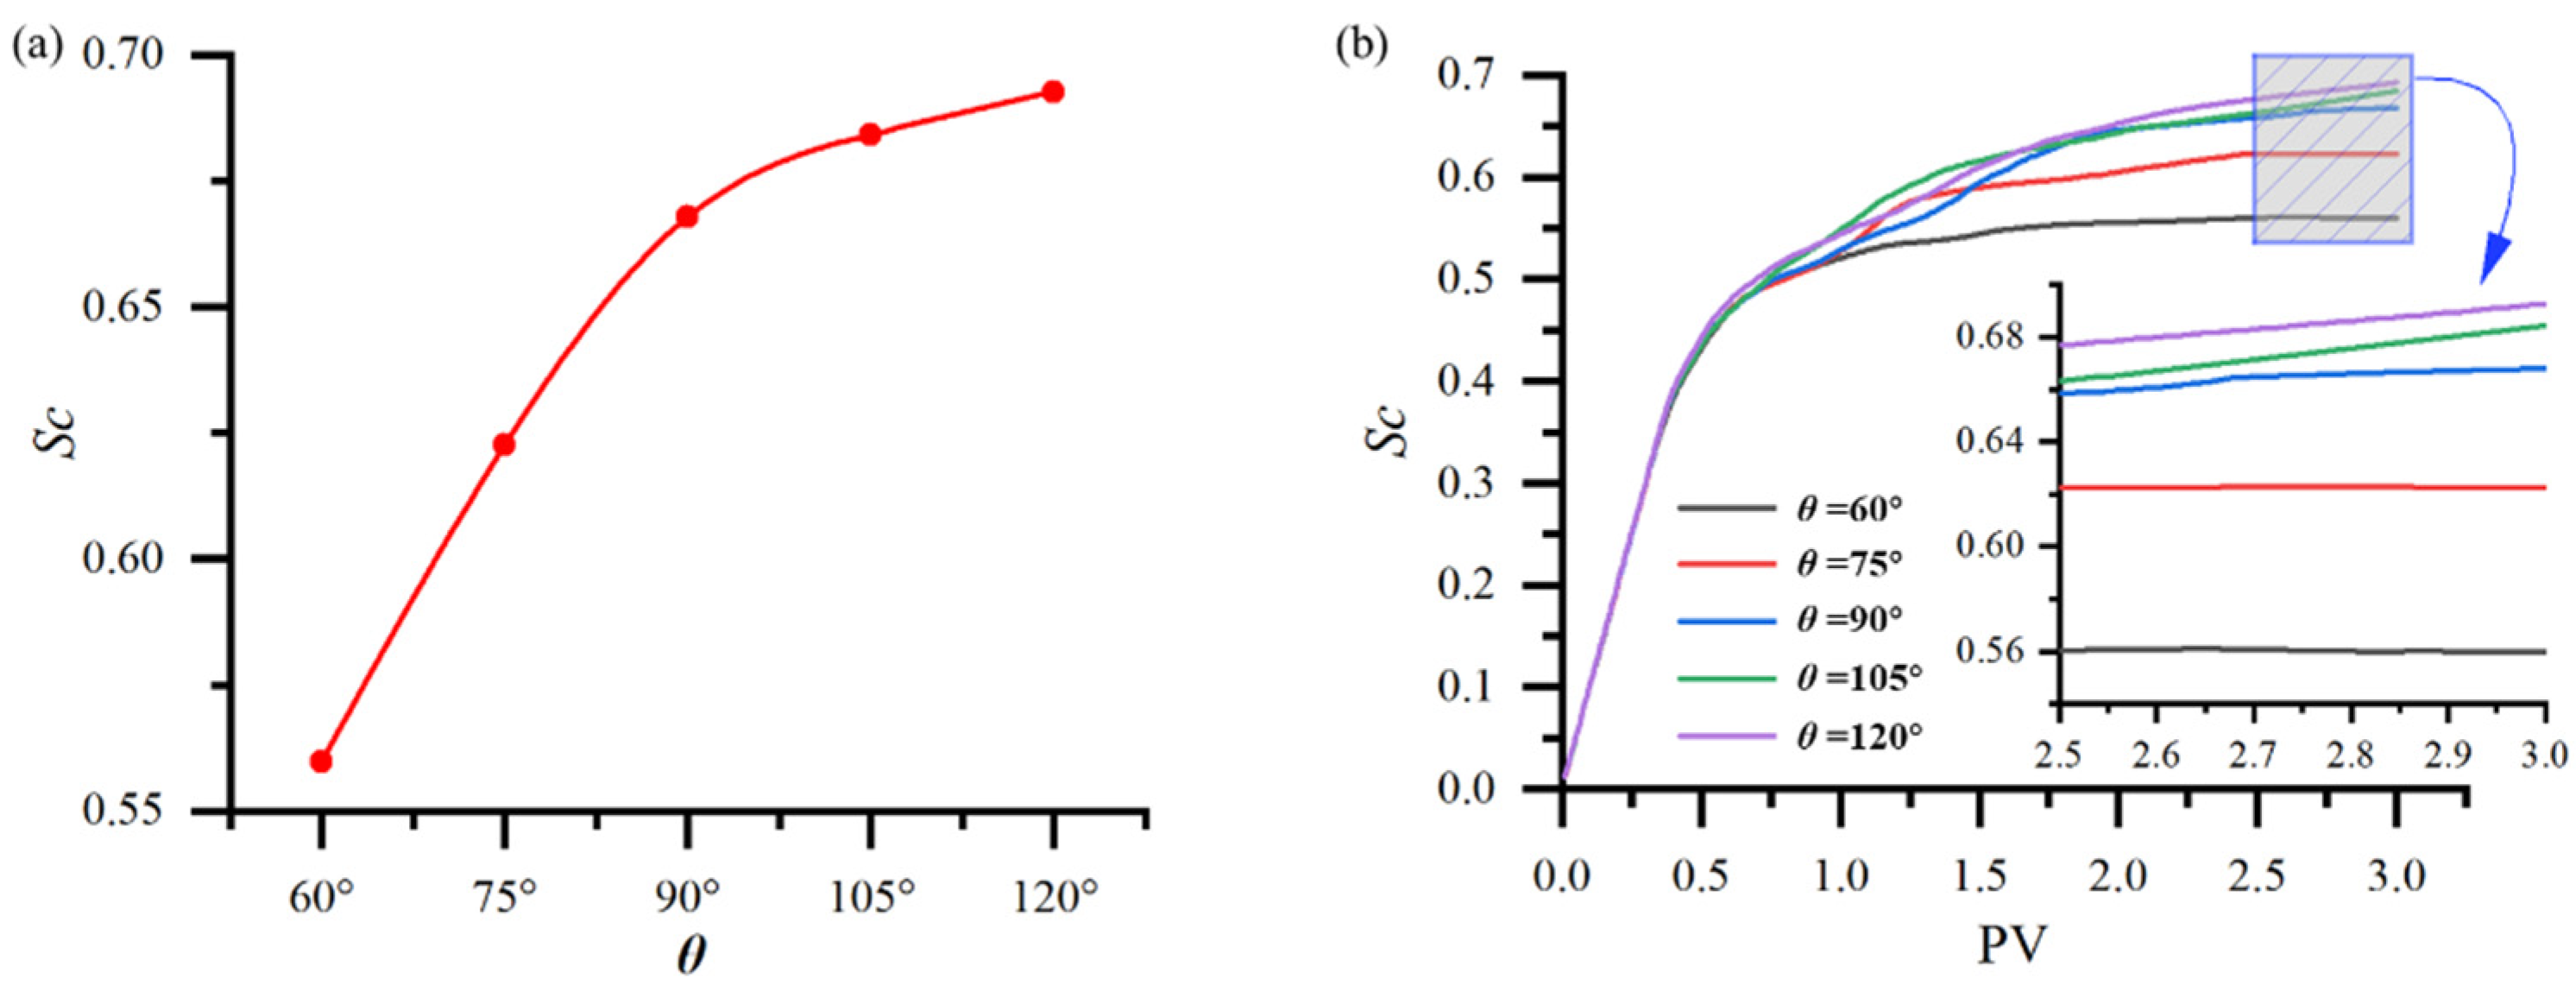
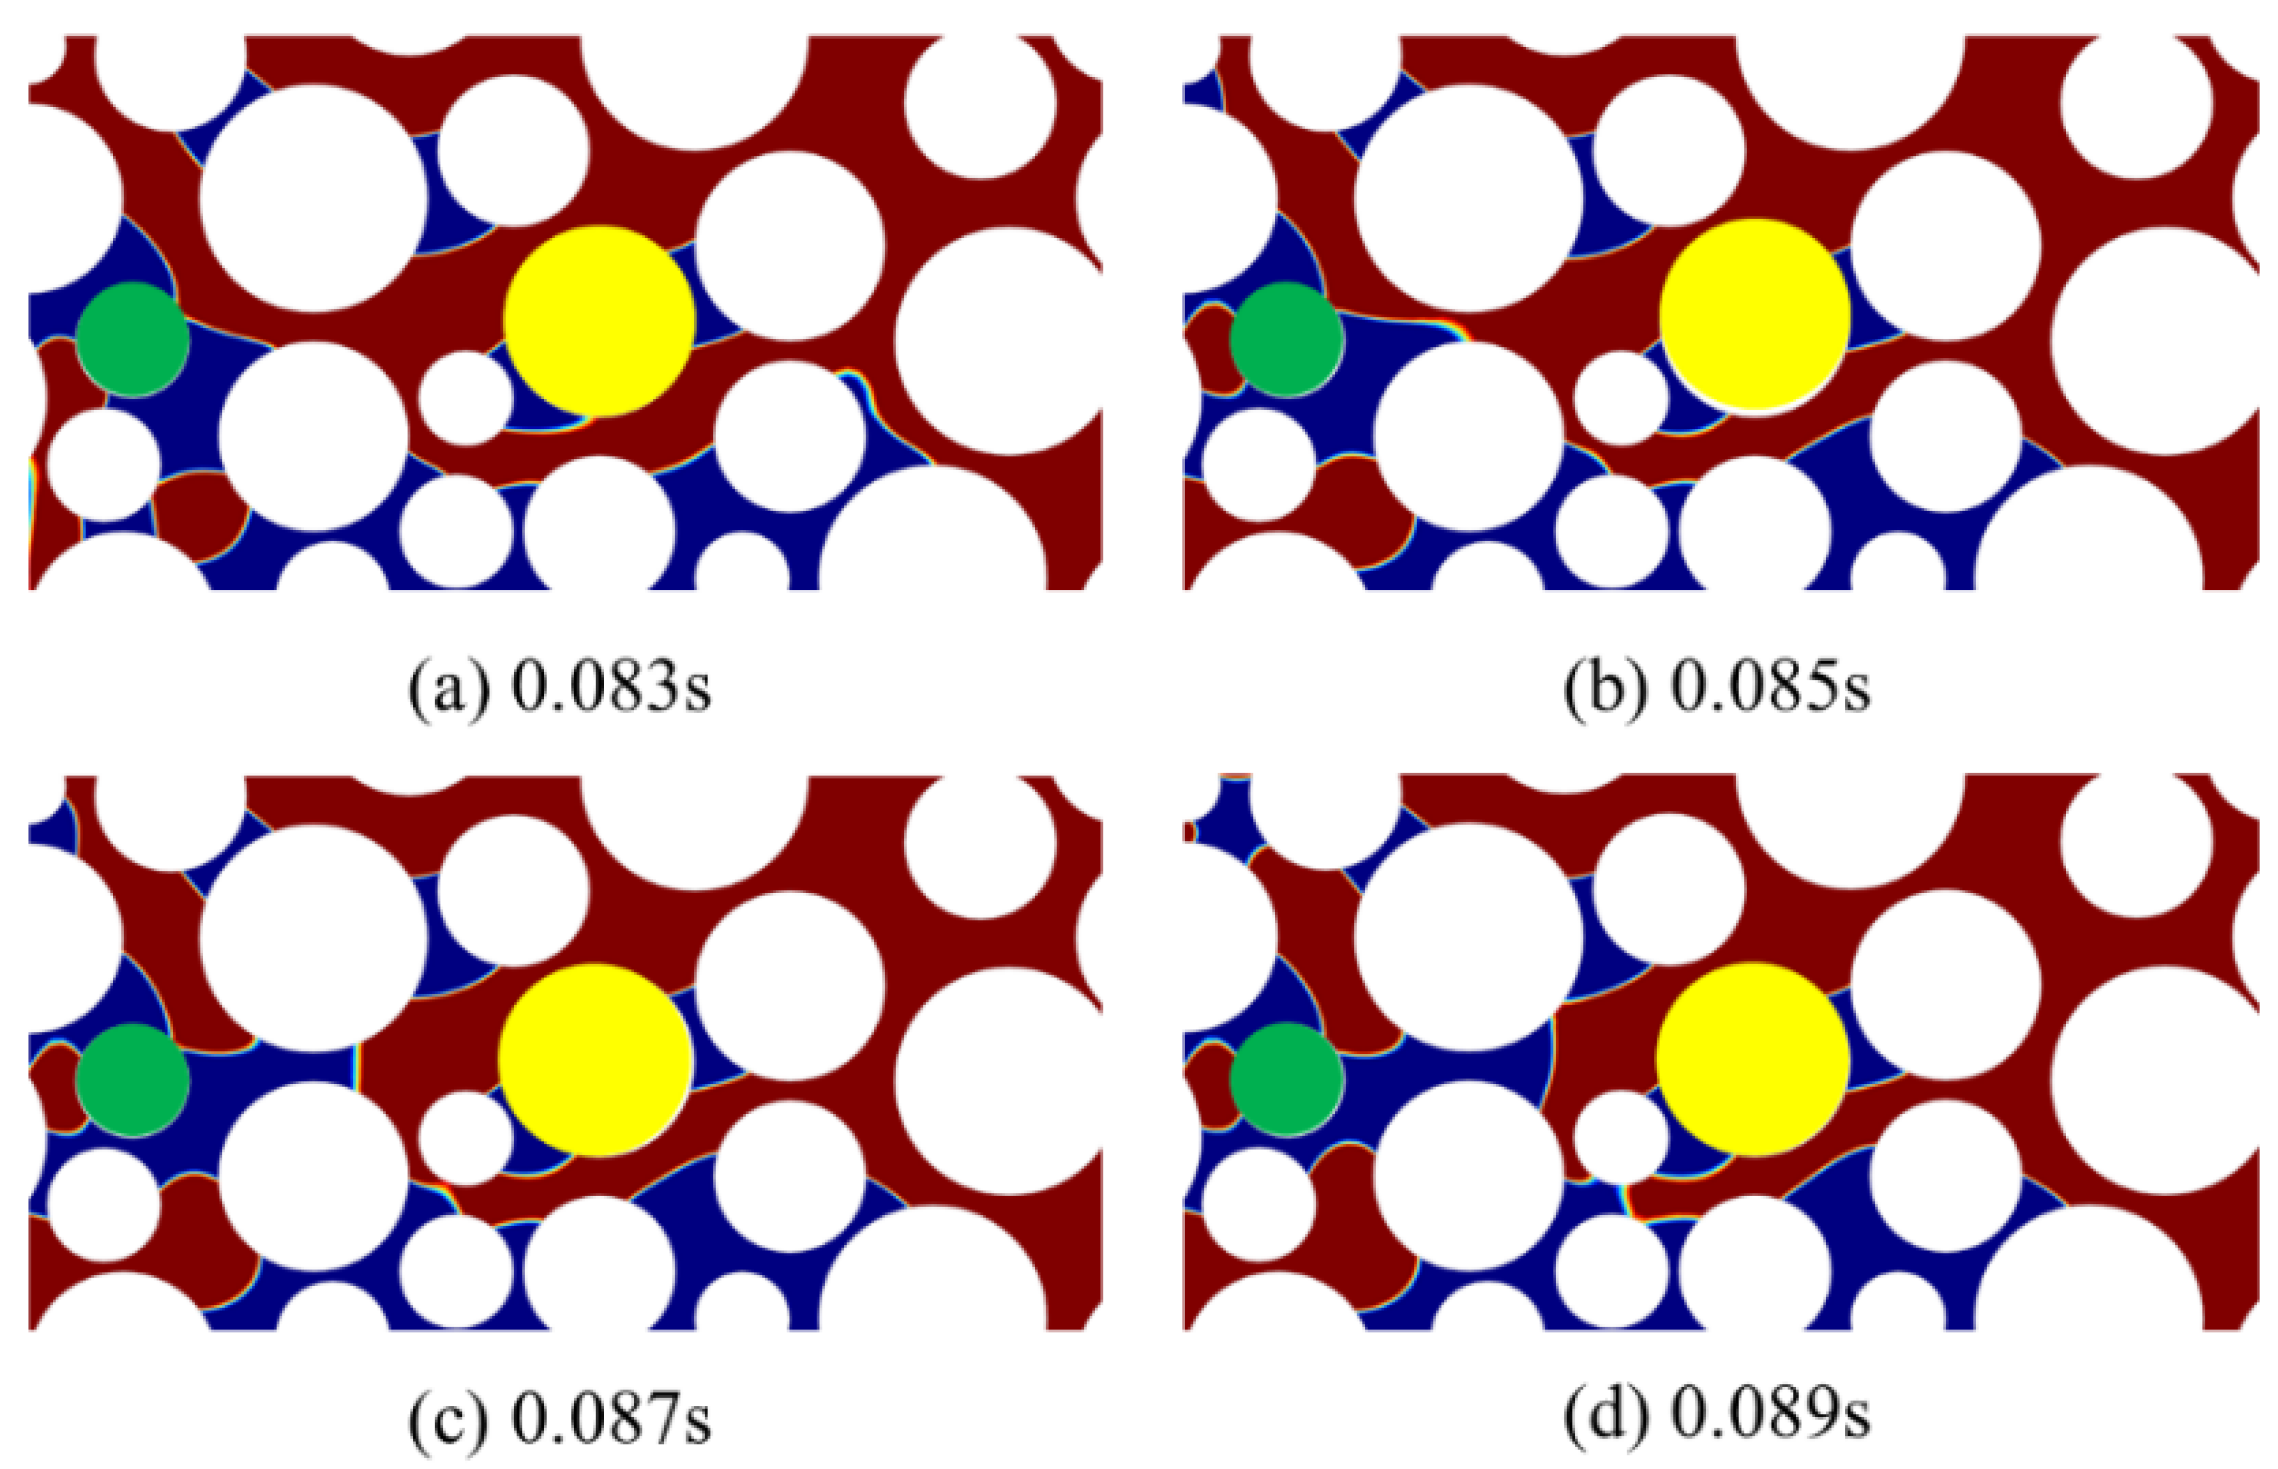
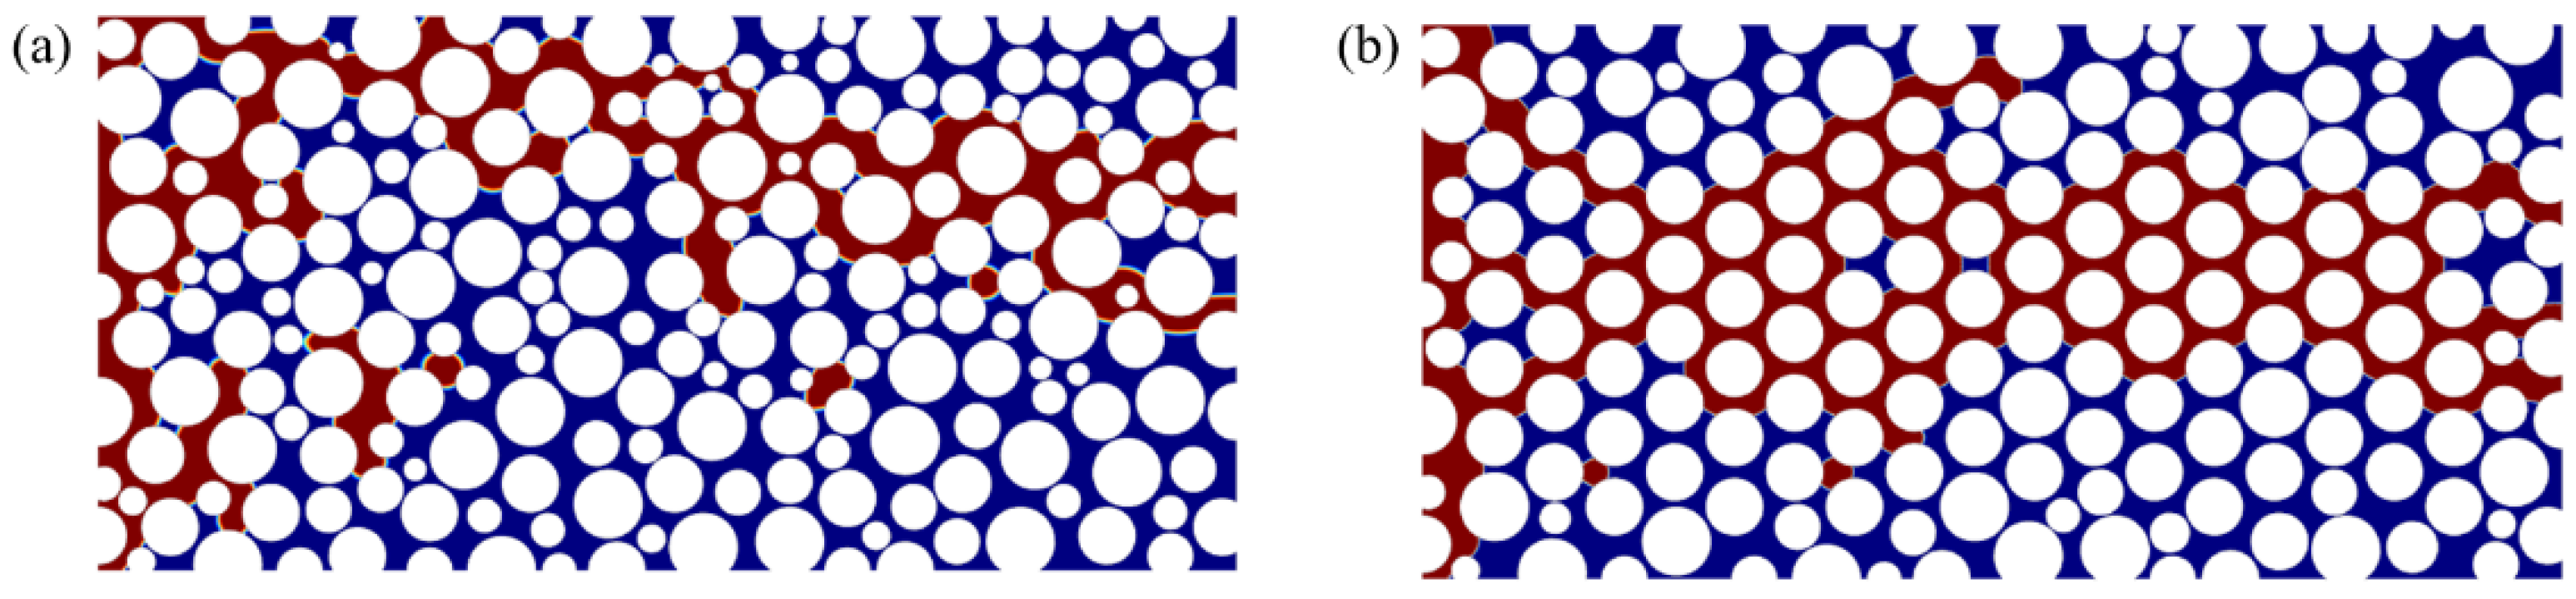
3.3.2. Effect of Wettability on Fluid Distribution

The wettability of a rock wall is one of the important factors affecting the fluid flow in pores, the residual oil saturation, and the capillary force. In the simulation, the contact angle is defined for the oil phase. Thus, the rock surface is oil-wetted if θ < π/2 and nonoil-wetted if θ > π/2.Under the conditions of log Ca = −4.25 and log M = −3.00, the effect of wall wettability on CO2 flooding is studied. When the medium is oil-wetted (θ < π/2), CO2 injection is a drainage process; otherwise, it is an imbibition process when the medium is nonoil-wetted (θ > π/2).
The pore-scale displacement mechanisms in the strong nonoil- and oil-wetted models were investigated in our previous study [57]. Therefore, the contact angle parameters adopted in this section are shown in Table 4, corresponding to strong oil-wetted, relatively strong oil-wetted, middle wettability, weak nonoil-wetted, and strong nonoil-wetted, respectively.
When the contact angles are 60°, 75°, 90°, 105°, and 120°, the distribution of CO2 saturation after stable displacement is shown in Figure 10. It can be seen that with the increase in oil phase contact angle, the wettability of the circular particle surfaces gradually becomes strong nonoil-wetted, and the distribution range of CO2 in porous media increases significantly. When the surfaces of circular particles in the porous medium are strong oil-wetted (Figure 10a, contact angle = 60°) in the process of CO2 flooding, the CO2 plume will bypass a large area of oil saturation, so there is significantly more residual oil in the pores, and the recovery efficiency is obviously low. When the surfaces of circular particles are strongly nonoil-wetted (Figure 10e, contact angle = 120°) in the process of CO2 flooding, the CO2 plume can occupy more oil-saturated areas, and the recovery efficiency is improved compared with Figure 10a.
According to the equation Pc = 2σ·cosθ/r, when θ < π/2, the wall is in an oil-wetted state, and the capillary force increases with the decrease in the contact angle; CO2 is a non-wetting phase, and the capillary force increases with the same displacement force, which leads to the decrease in displacement force and a lower recovery efficiency.
The relationship between contact angle, PV number of CO2 injection, and CO2 saturation is shown in Figure 11. As can be seen from Figure 11a, when the wettability of the surface of circular particles in the porous medium changes from strong oil-wetted (contact angle = 60°) to strong nonoil-wetted (contact angle = 120°), the CO2 saturation in the porous medium increases significantly; the CO2 saturation increases from about 0.56 for strong oil-wetted (contact angle = 60°) to about 0.70 for strong nonoil-wetted (contact angle = 120°), an increase of nearly 25%. It should be noted that with the increase in the wetting degree of the circular oil particles in porous media, the CO2 breakthrough will occur earlier. For example, when the wetting angle is 60° and 120°, the CO2 breakthrough time is 0.357 PV and 0.377 PV, respectively. As can be seen in Figure 11b, the CO2 saturation generally increases with the increase in the number of PV injected by CO2, regardless of the wettability conditions of the medium. It can also be seen from Figure 11b that CO2 saturation is at a maximum when the wettability of the medium is strong nonoil-wetted (contact angle = 120°).
Figure 12 and Figure 13 show four amplified instantaneous fluid profiles during CO2 flooding in strong oil-wetted (contact angle = 60°) and strong nonoil-wetted (contact angle = 120°) media, respectively. Under the condition of strong oil-wetted (contact angle = 60°), the remaining oil in the pores mainly exists in three forms: cluster-like heterogeneous residual oil occupying multiple pore bodies, pore throat residual oil, and blind-end residual oil. The thinning of the CO2 plume and the trapping of the CO2 plume are found in strong oil-wetted media. As shown in Figure 12, at contact angle = 60°, the CO2 plume on the right side of the green-marked circular particle narrows in the pores due to the growth of the oil film around the particle (Figure 12a), the CO2 plume is divided into several parts (Figure 12b,c), and the CO2 plume splits to form two CO2 gas masses trapped in the pore body (Figure 12d). This phenomenon is also observed below the yellow-marked particles. In an oil-wetted medium, the thinning and fracturing of the CO2 plume and the trapping of the CO2 plume reduce the oil displacement efficiency.
Three mechanisms of oil film thinning and fracture, including CO2 oil contact line movement and oil droplet formation and detachment, are observed under strong nonoil-wetted conditions. It can be seen from Figure 13a,b that when CO2 approaches the green-labeled particles, the oil film on the surface of the labeled particles gradually thins until it breaks. After forming the CO2–oil particle contact line, the oil droplets move on the particle surface (Figure 13c,d). The wetting phase adsorbs into the porous medium and invades the pore network. Thus, the oil displacement efficiency under strong nonoil-wetted conditions is significantly higher than that under strong oil-wetted conditions.

3.3.3. Effect of Density Ratio on Fluid Flow

Due to the influence of formation temperature and pressure, CO2 may be in a gaseous, liquid, or supercritical state, and the density of CO2 will change greatly. This section studies the effect of density ratio on CO2 flooding by numerical simulation. The density ratio, which is defined as the density of CO2 compared with the density of the oil phase, is dimensionless. The expression of the density ratio is as follows:
β = ρ c ρ o
where the subscripts c and o denote the CO2 phase and the oil phase, respectively.
From the expression of the density ratio, it can be seen that the density ratio is determined by the density of CO2 and the density of oil. Since the density of oil is less affected by temperature and pressure, the change in density ratio is mainly caused by the CO2 density. This section is still based on the previous model, in order to study the effect of density ratio on CO2 flooding. In the case of log M = −3.00, the density ratio is set to 0.156 and 0.778, respectively. Based on the above model, a series of numerical simulation studies were carried out by changing the density of CO2 and maintaining the same density of the oil phase.
After CO2 flooding is stable, the relationship between CO2 saturation and density ratio is shown in Figure 14. It can be seen from Figure 14 that the CO2 saturation obtained under the condition of a high-density ratio is greater than that of a low-density ratio with the same capillary number; this shows that under the same viscosity ratio and capillary number, CO2 flooding with high density can achieve better oil recovery efficiency. With the increase in the capillary number, the oil recovery increases significantly. According to Equation (13) (Ca = u·μ/σ), Ca refers to the ratio of the viscous force to the capillary force of the fluids. Thus, a higher injection rate and viscosity of the CO2 will contribute to EOR.

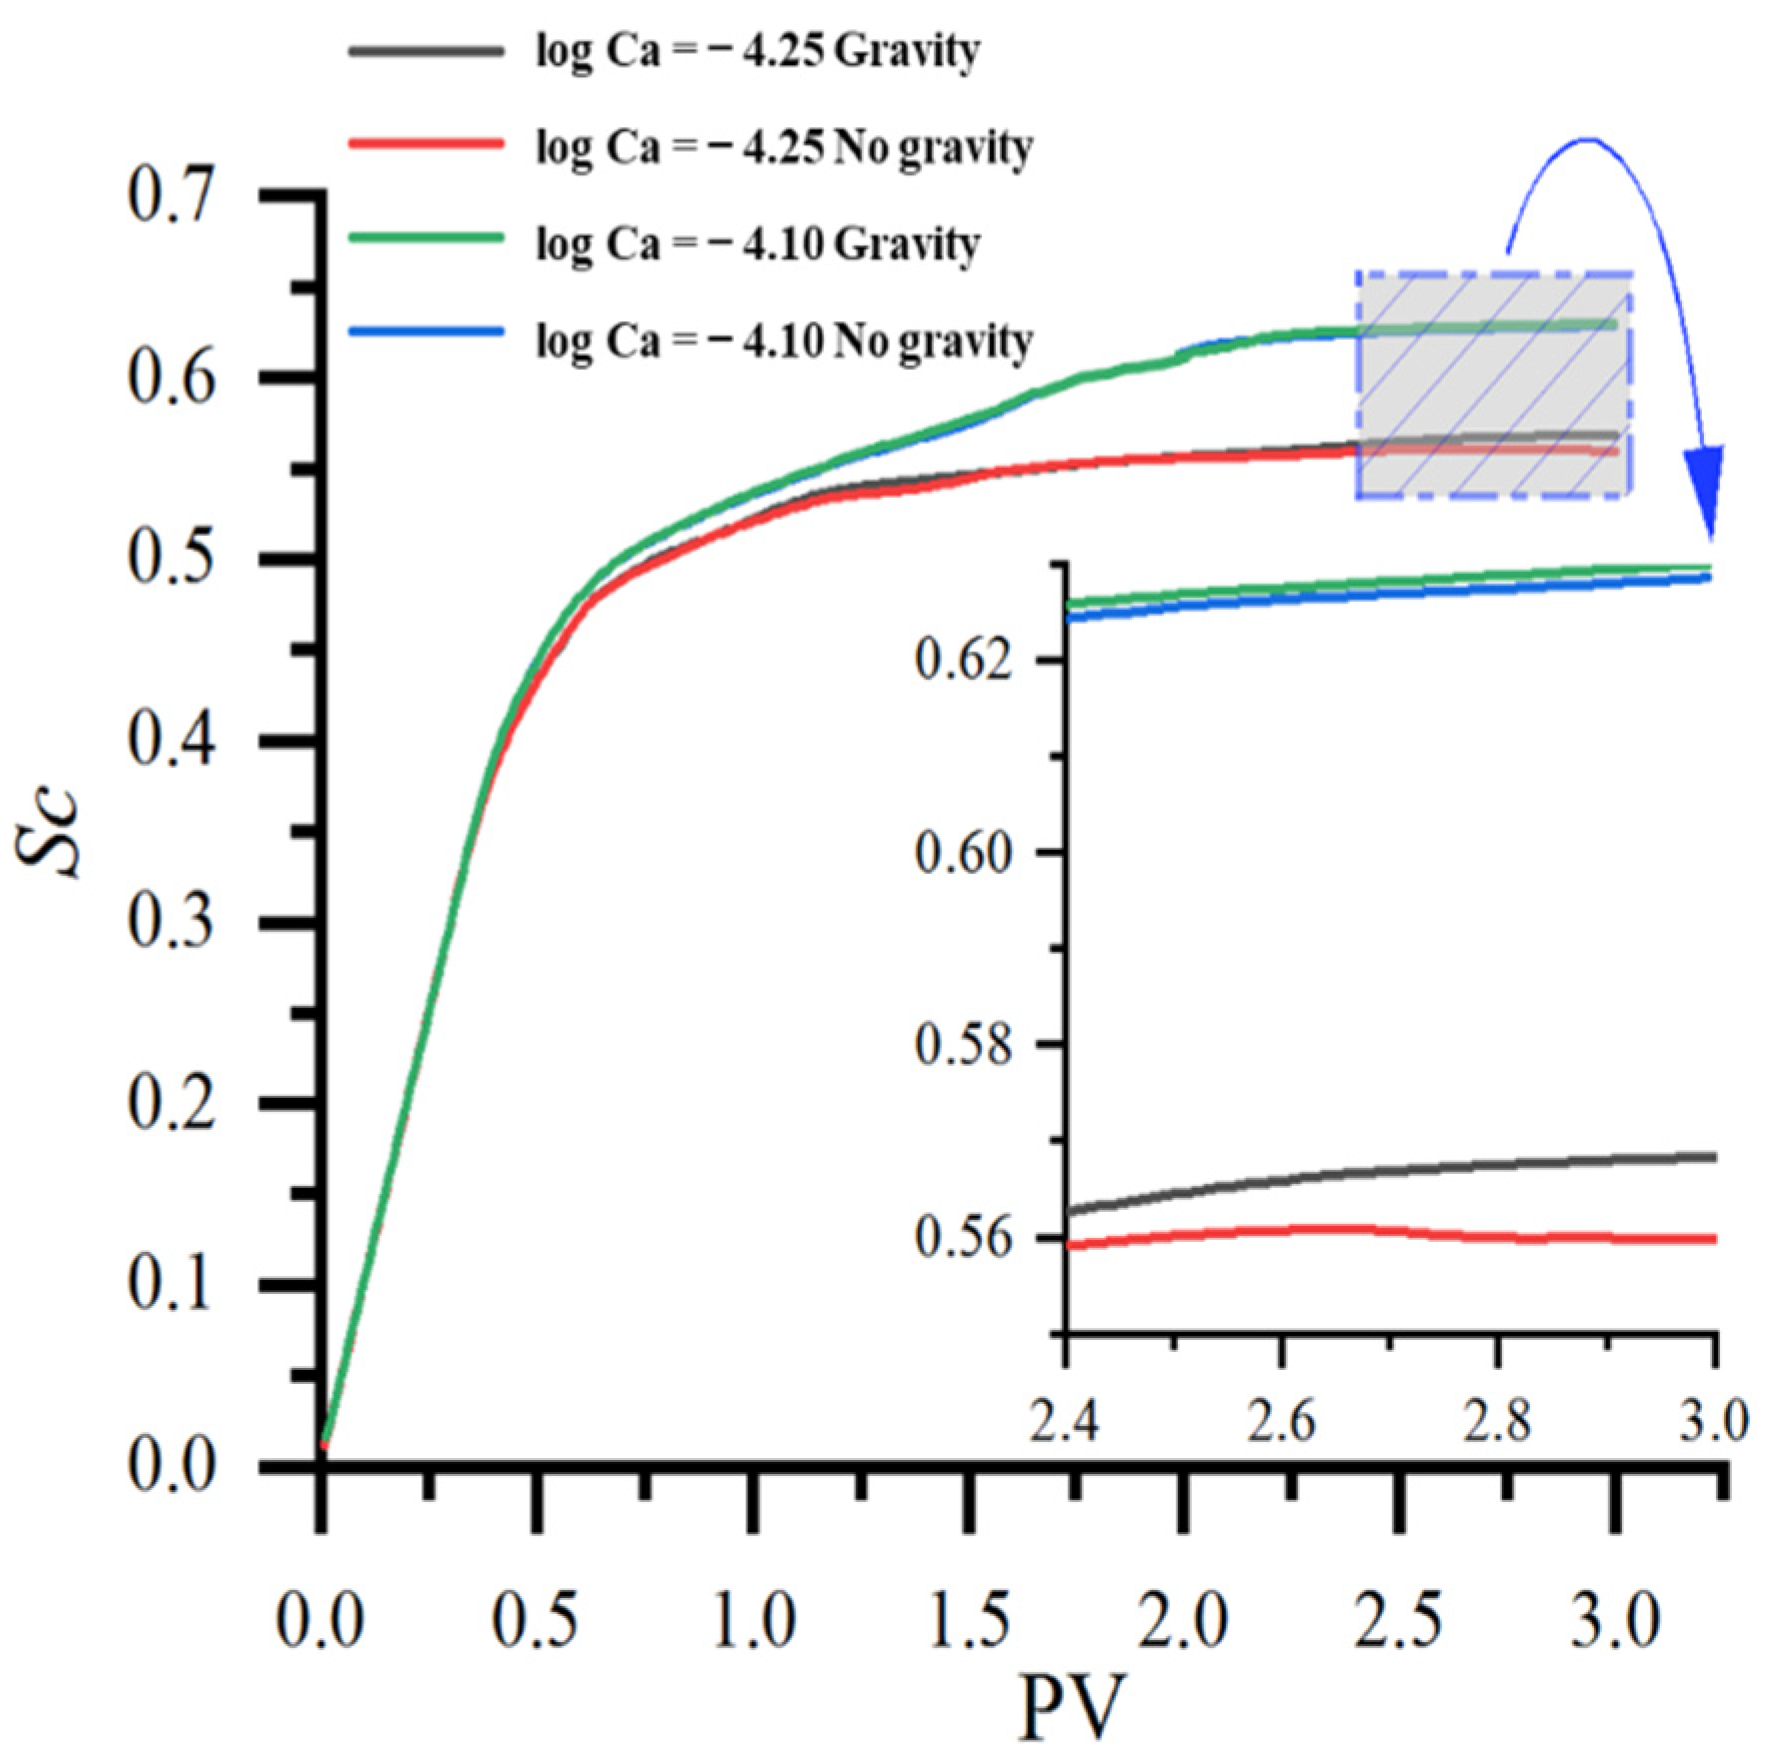
3.3.4. Effect of Gravity on Fluid Flow

Gravity is an important factor affecting multiphase flow in porous media. The effect of gravity on CO2 flooding is studied under the condition of low capillary number and the same viscosity ratio in this section. The boundary conditions of the model are set as: (1) The inlet on the left side of the model is the speed inlet; (2) The outlet on the right side of the model is a pressure outlet with a size of 0 Pa; (3) The surfaces of circular solid particles are oil-wetted with a contact angle of 60°; (4) The upper and lower boundaries of the model and the circular particle surfaces are no-slip boundaries; (5) The initial state of the model is saturated with oil at a constant temperature.
Figure 15 shows the effect of gravity on the final CO2 saturation. When the capillary number is log Ca = −4.25, the CO2 saturation of the model considering the gravity factor is significantly higher than that without considering the gravity factor; this shows that gravity improves the sweep range of CO2. When the capillary number is log Ca = −4.10, the CO2 saturation of the model considering the gravity factor is also higher than that without considering the gravity factor. In general, under the condition of low capillary number, the flow behavior of the injected CO2 is mainly controlled by capillary force and gravity; when the viscosity ratios are the same, the gravity increases the final saturation in pores of CO2, which indicates that gravity has a positive effect on oil displacement efficiency. Since gravity is set along the Y direction of the model, CO2 will migrate upward by buoyancy in the Y direction of the model, which increases the sweeping efficiency as well as the oil recovery efficiency.

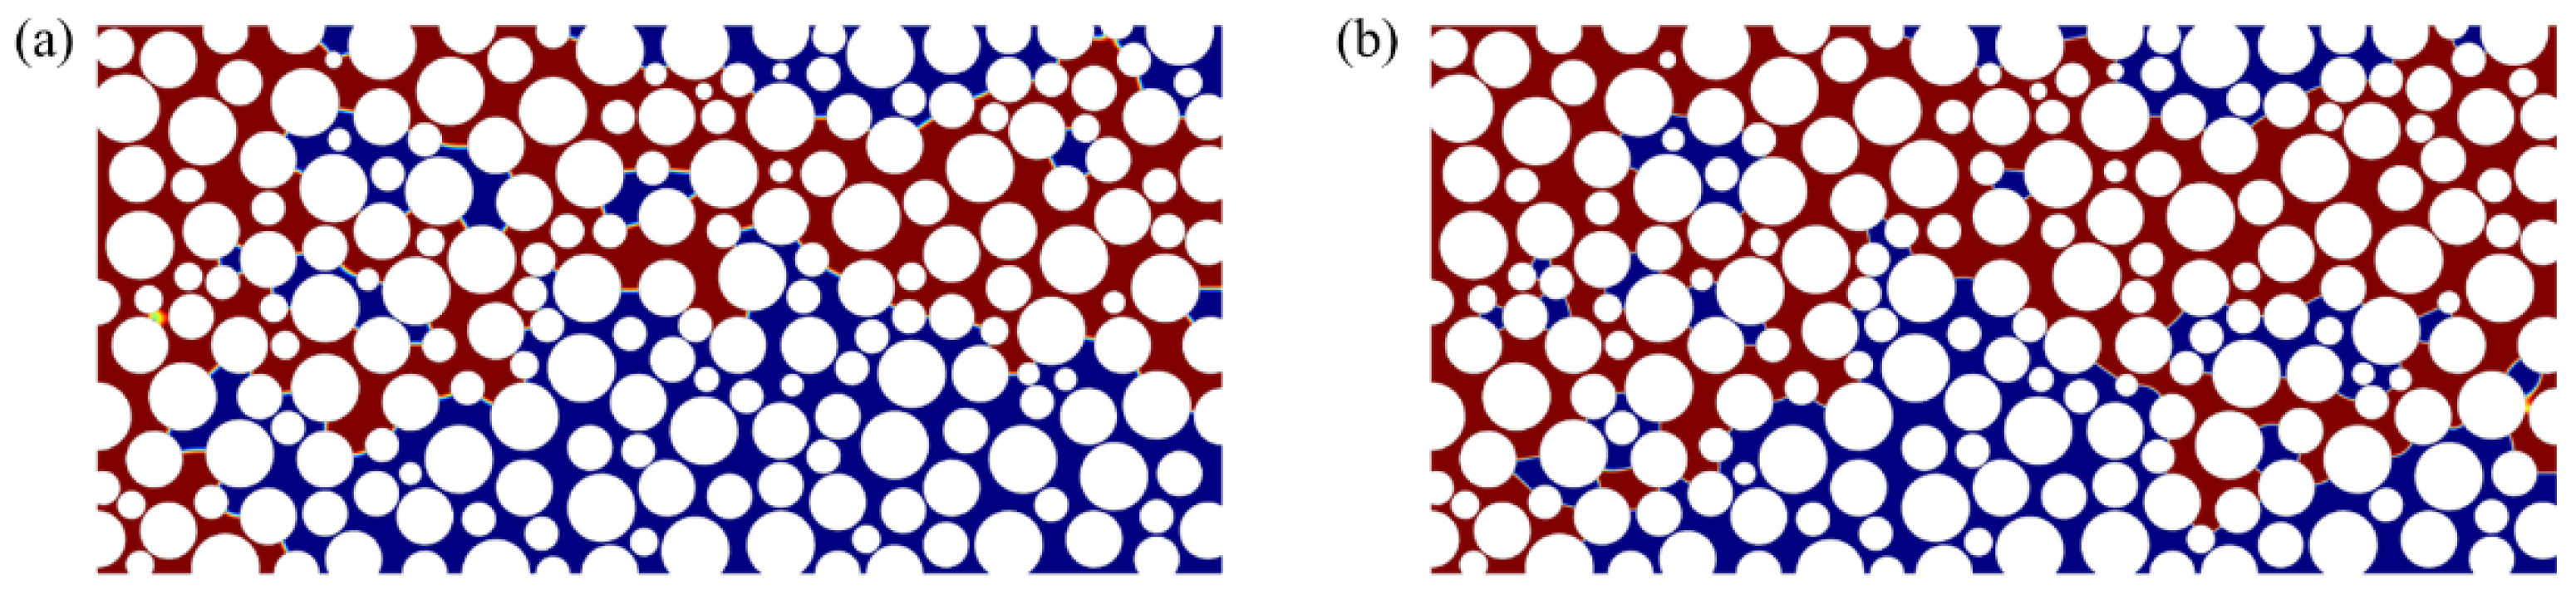
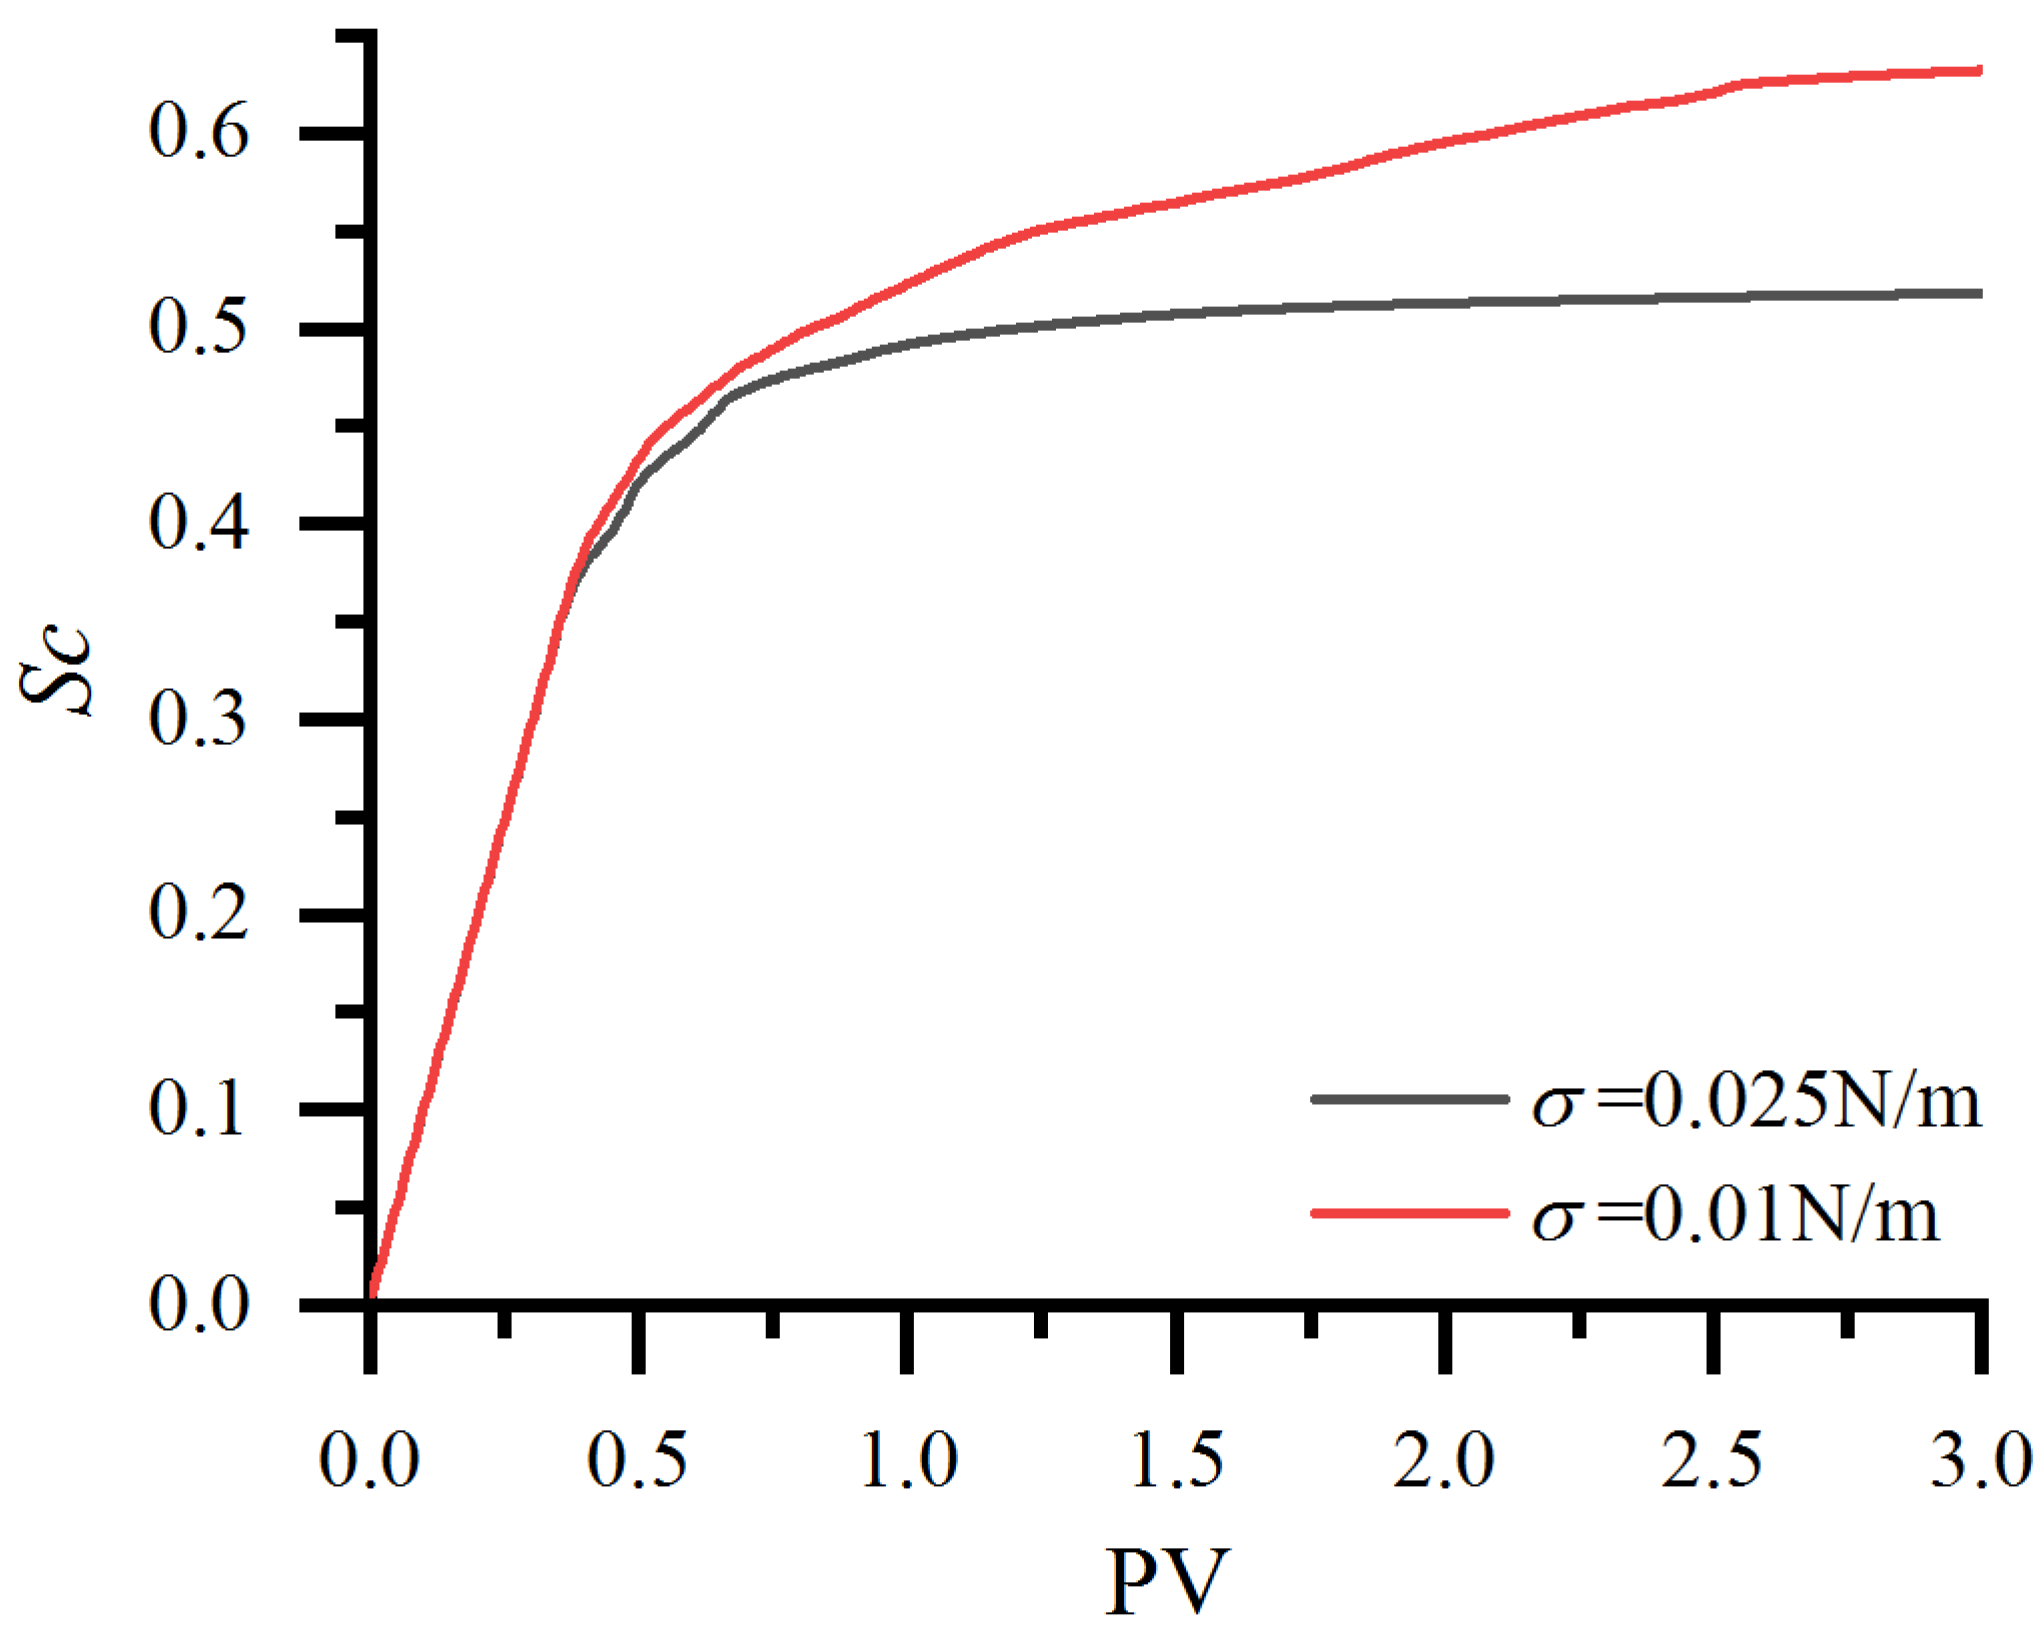
3.3.5. Effect of Interfacial Tension on Fluid Flow

Reducing the interfacial tension between oil and CO2 by adding surfactants is another way to improve the oil recovery ratio. With log M = −3.00, by reducing the interfacial tension between oil and CO2 from 0.025 N/m to 0.01 N/m with the same injection rate, the CO2 saturation profile after stabilization of CO2 flooding is observed. As can be seen from Figure 16, the CO2 distribution range is significantly larger at low interfacial tension. The capillary force is reduced at low interfacial tension when the same volume of CO2 is injected. Figure 17 shows the relationship between the PV number of CO2 injection and CO2 saturation under different interfacial tension; as can be seen from the figure, the CO2 saturation is 63.20% when the interfacial tension is 0.01 N/m, while the CO2 saturation is only 51.80% when the interfacial tension is 0.025 N/m. The final CO2 saturation also shows that low interfacial tension is more conducive to oil recovery. In practice, compared to water flooding, the injection of CO2 or chemical reagents is usually adopted to decrease the interfacial tension between the displacing fluids and oil for EOR.

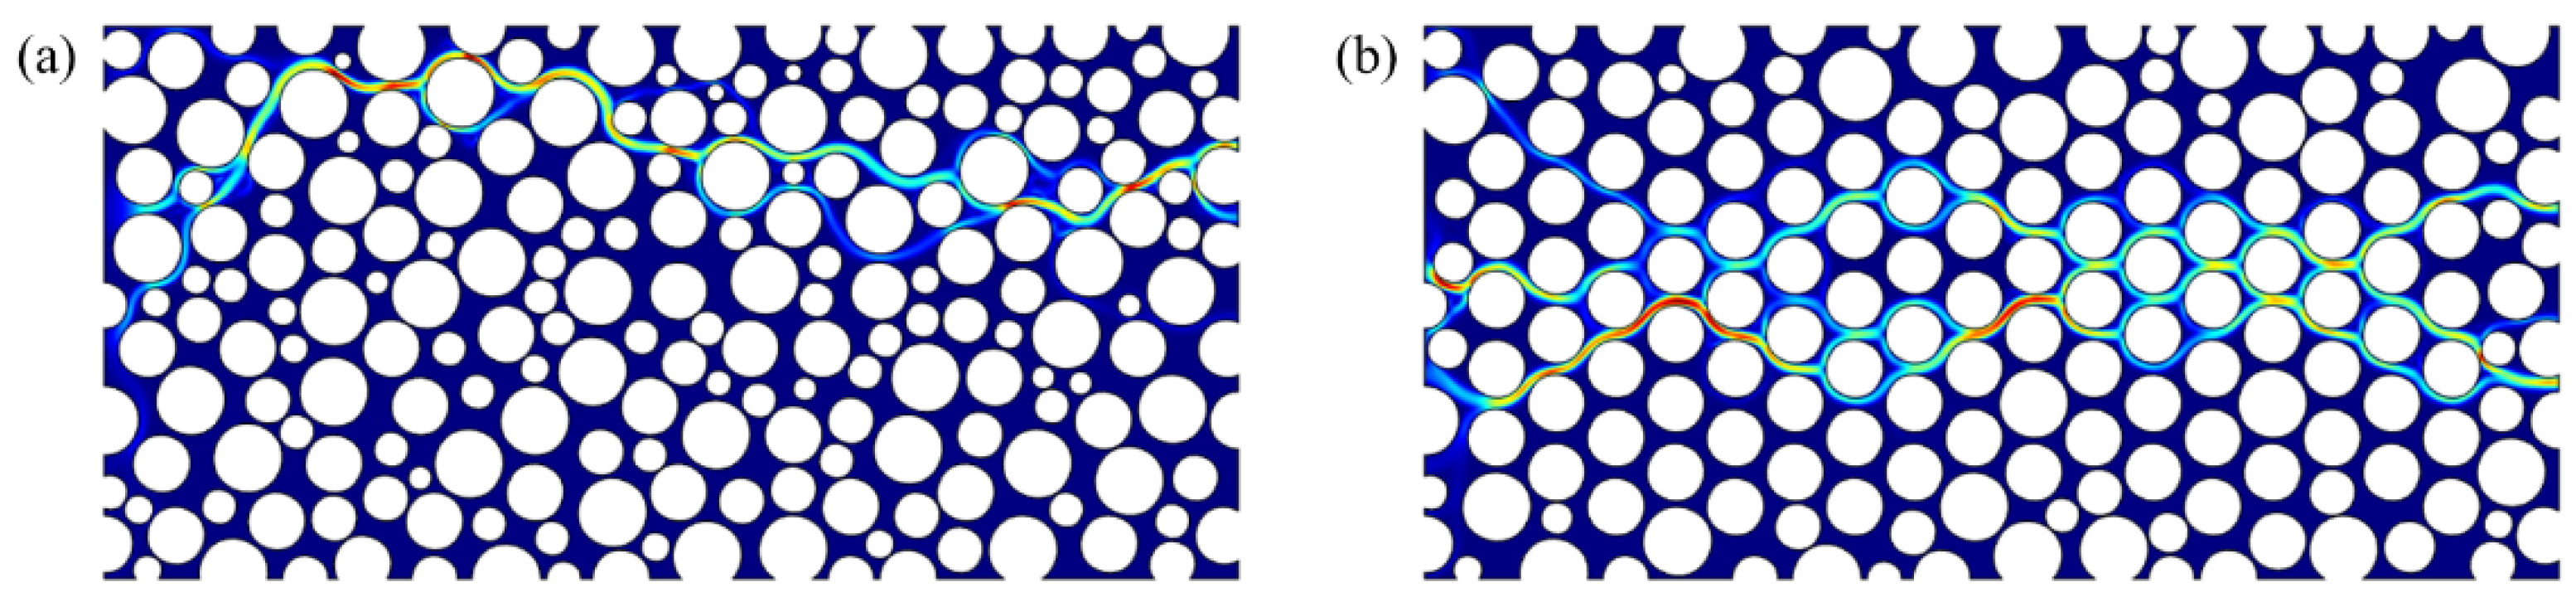
3.3.6. Effect of Absolute Permeability on Fluid Flow

The absolute permeability is an important physical parameter that affects the two-phase flow in porous media. A two-dimensional model with larger absolute permeability is set up based on the aforementioned model of circular random distribution, which keeps the same porosity as the previous model, as shown in Figure 18. The inlet, outlet, and upper and lower boundaries of the model adopt the same circular particle distribution as the previous model, except that the inner circles are arranged in a relatively uniform way.
In this two-dimensional model, porosity is the ratio of the pore area to the two-dimensional rectangular area. The expression is as follows:
φ = A p A b × 100 % = A p A p + A s × 100 %
where φ is the porosity (%); Ab is the rectangular area in the two-dimensional model (m2); Ap is the pore area (m2); As is the area of round particles (m2).
The absolute permeability is obtained using numerical calculation software with Darcy’s law in the case of single-phase flow:
u = K μ p
where u is the Darcy speed (m/s); K is the permeability(m2); μ is the viscosity of the fluid (Pa·s); p is the pressure gradient. According to the above equation, the specific parameters of porosity and absolute permeability obtained are shown in Table 5.
The boundary conditions of the model are set up as: (1) The inlet on the left side of the model is the velocity inlet with a size of 0.03 m/s; (2) The outlet on the right side of the model is a pressure outlet with a size of 0 Pa; (3) The surface of circular solid particles is oil-wetted, and the contact angle is 60°; (4) The upper and lower boundaries of the model and the circular particle surface are non-slip boundaries; (5) CO2 and oil are considered to be incompressible Newtonian fluids due to the small scale of the model and small change in fluid pressure. Regardless of the influence of temperature and gravity, the initial state of the model is saturated with oil.
In Figure 19, the CO2 distribution range in the two-dimensional model with large absolute permeability (Figure 19b) is significantly larger; after CO2 flooding is stable, the CO2 saturation in pores corresponding to Figure 19a,b is 38.23% and 45.15%, respectively. Figure 20 shows the velocity field cloud diagram corresponding to the injected CO2 of 3 PV number. The velocity cloud diagram shown in Figure 20 is in good correspondence with Figure 19, which shows that the two-dimensional model with larger absolute permeability has a better oil recovery efficiency under the same porosity.

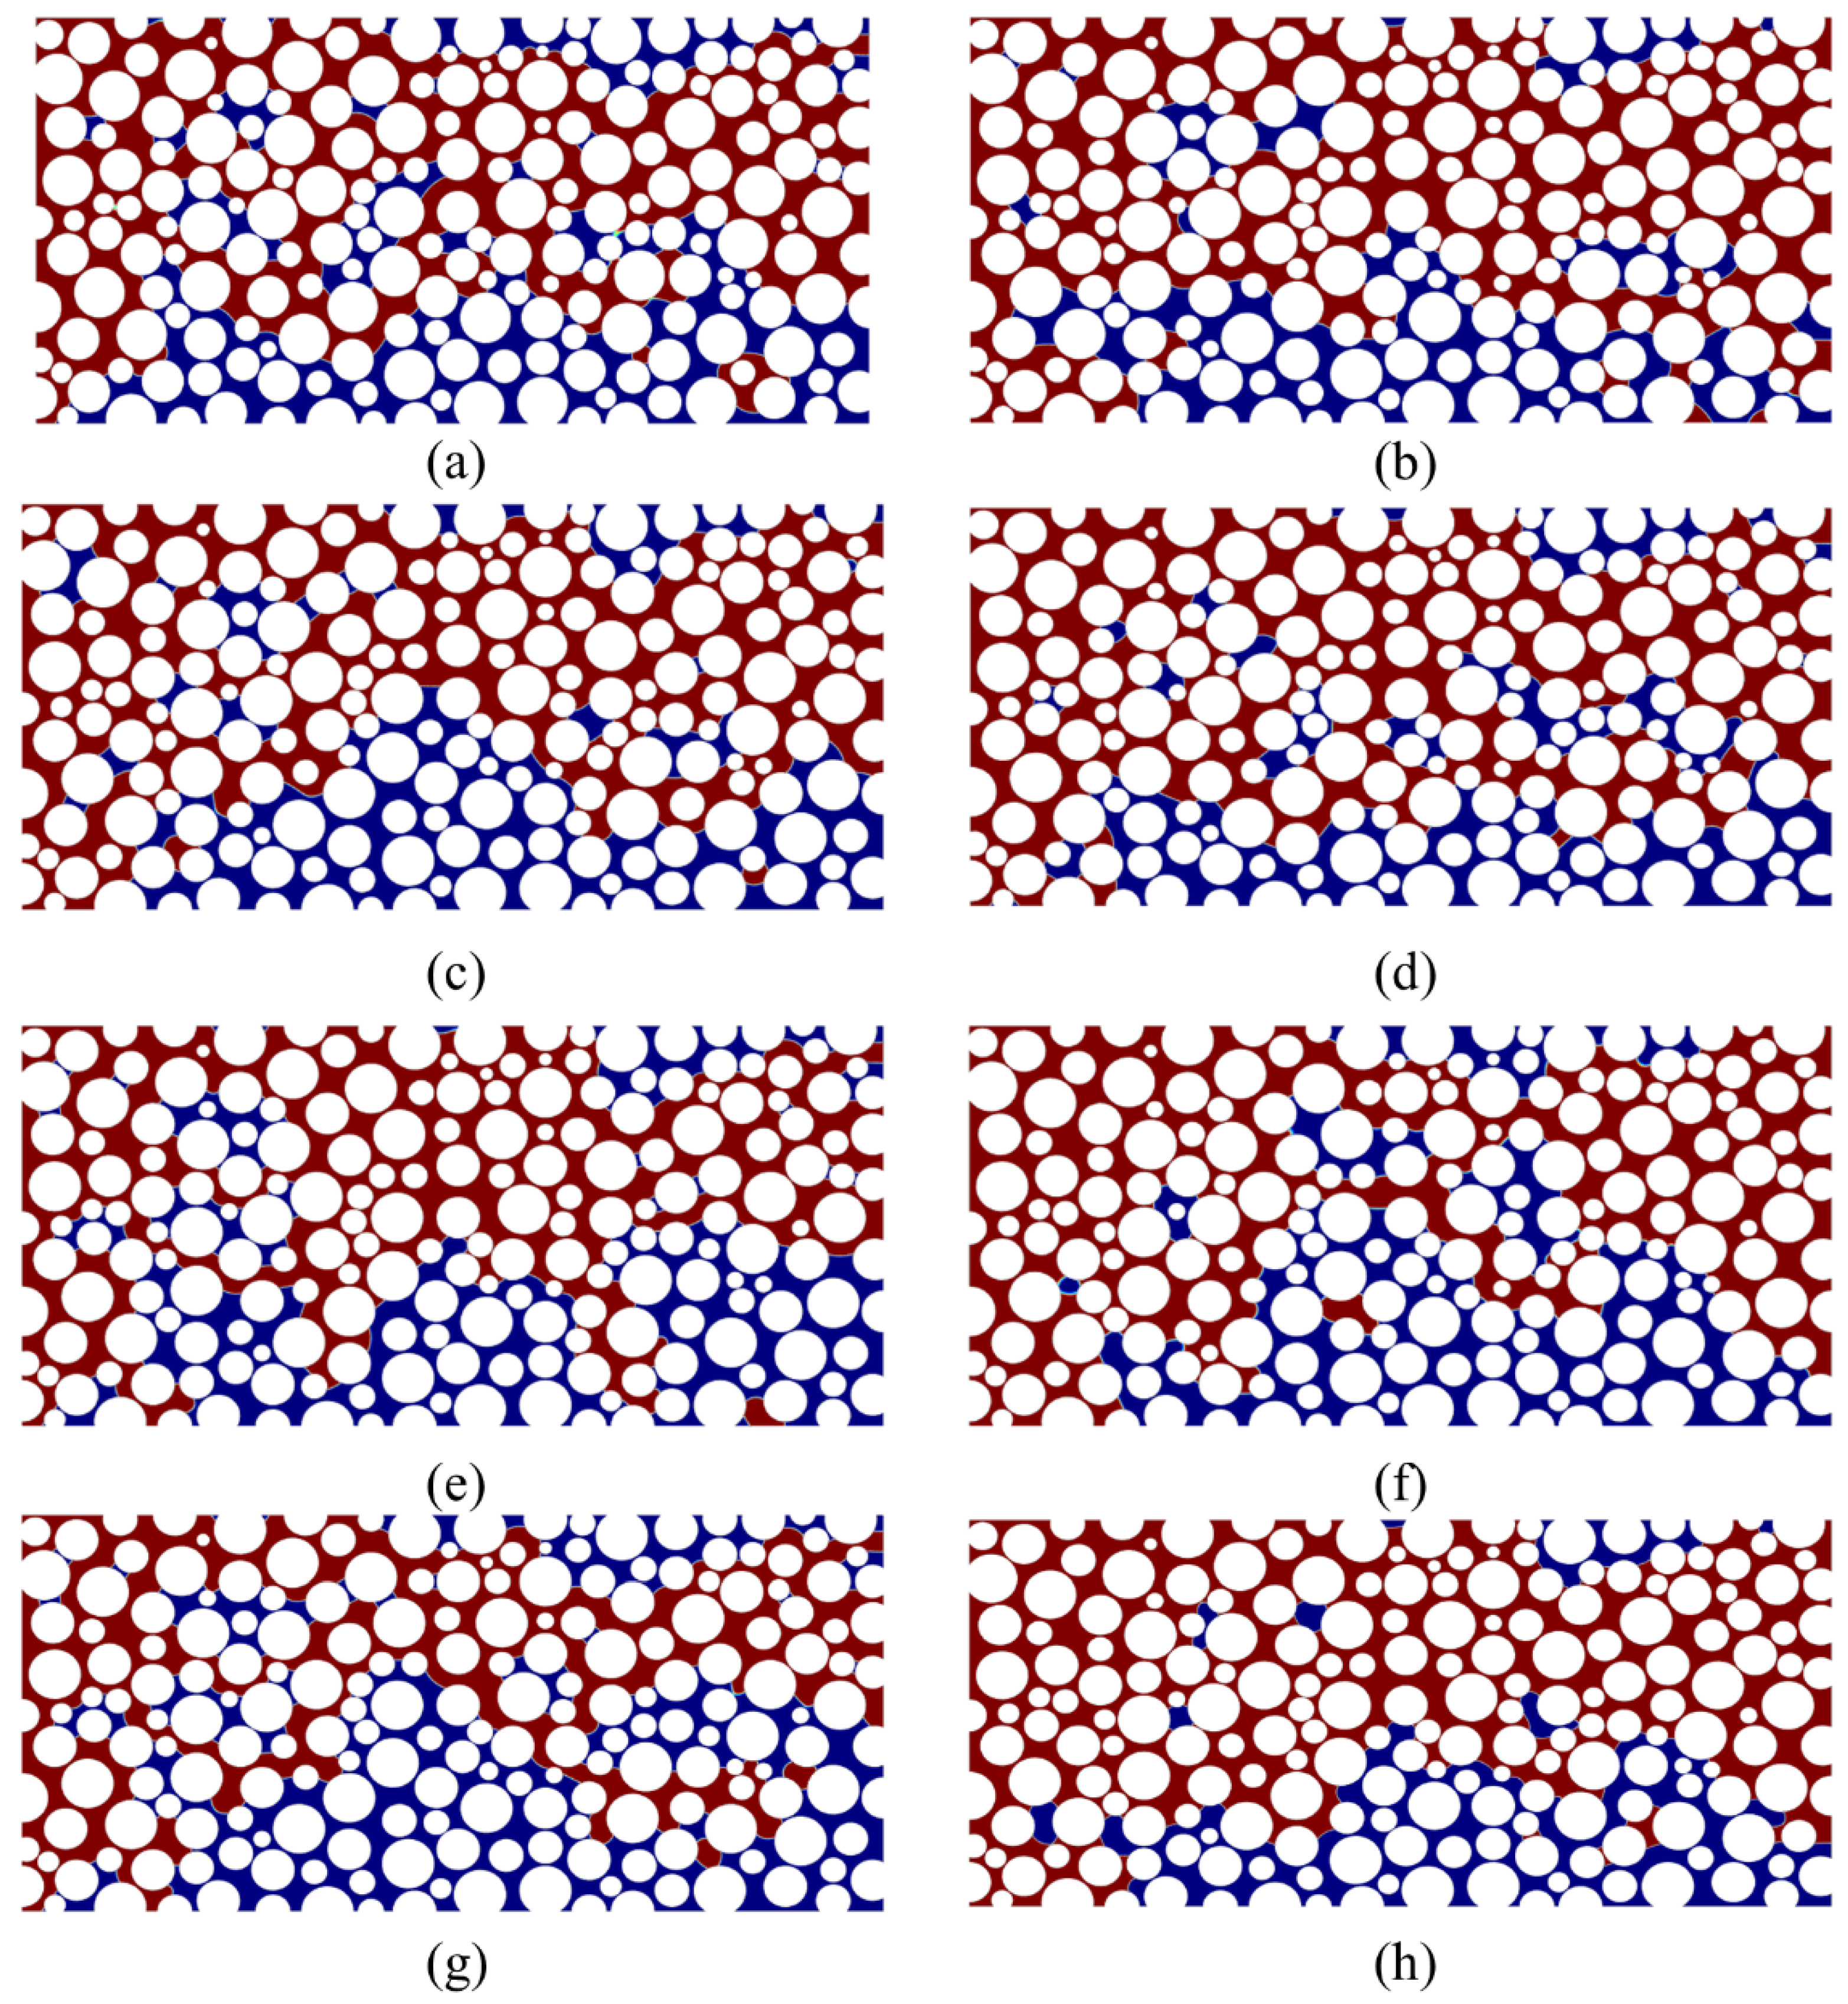
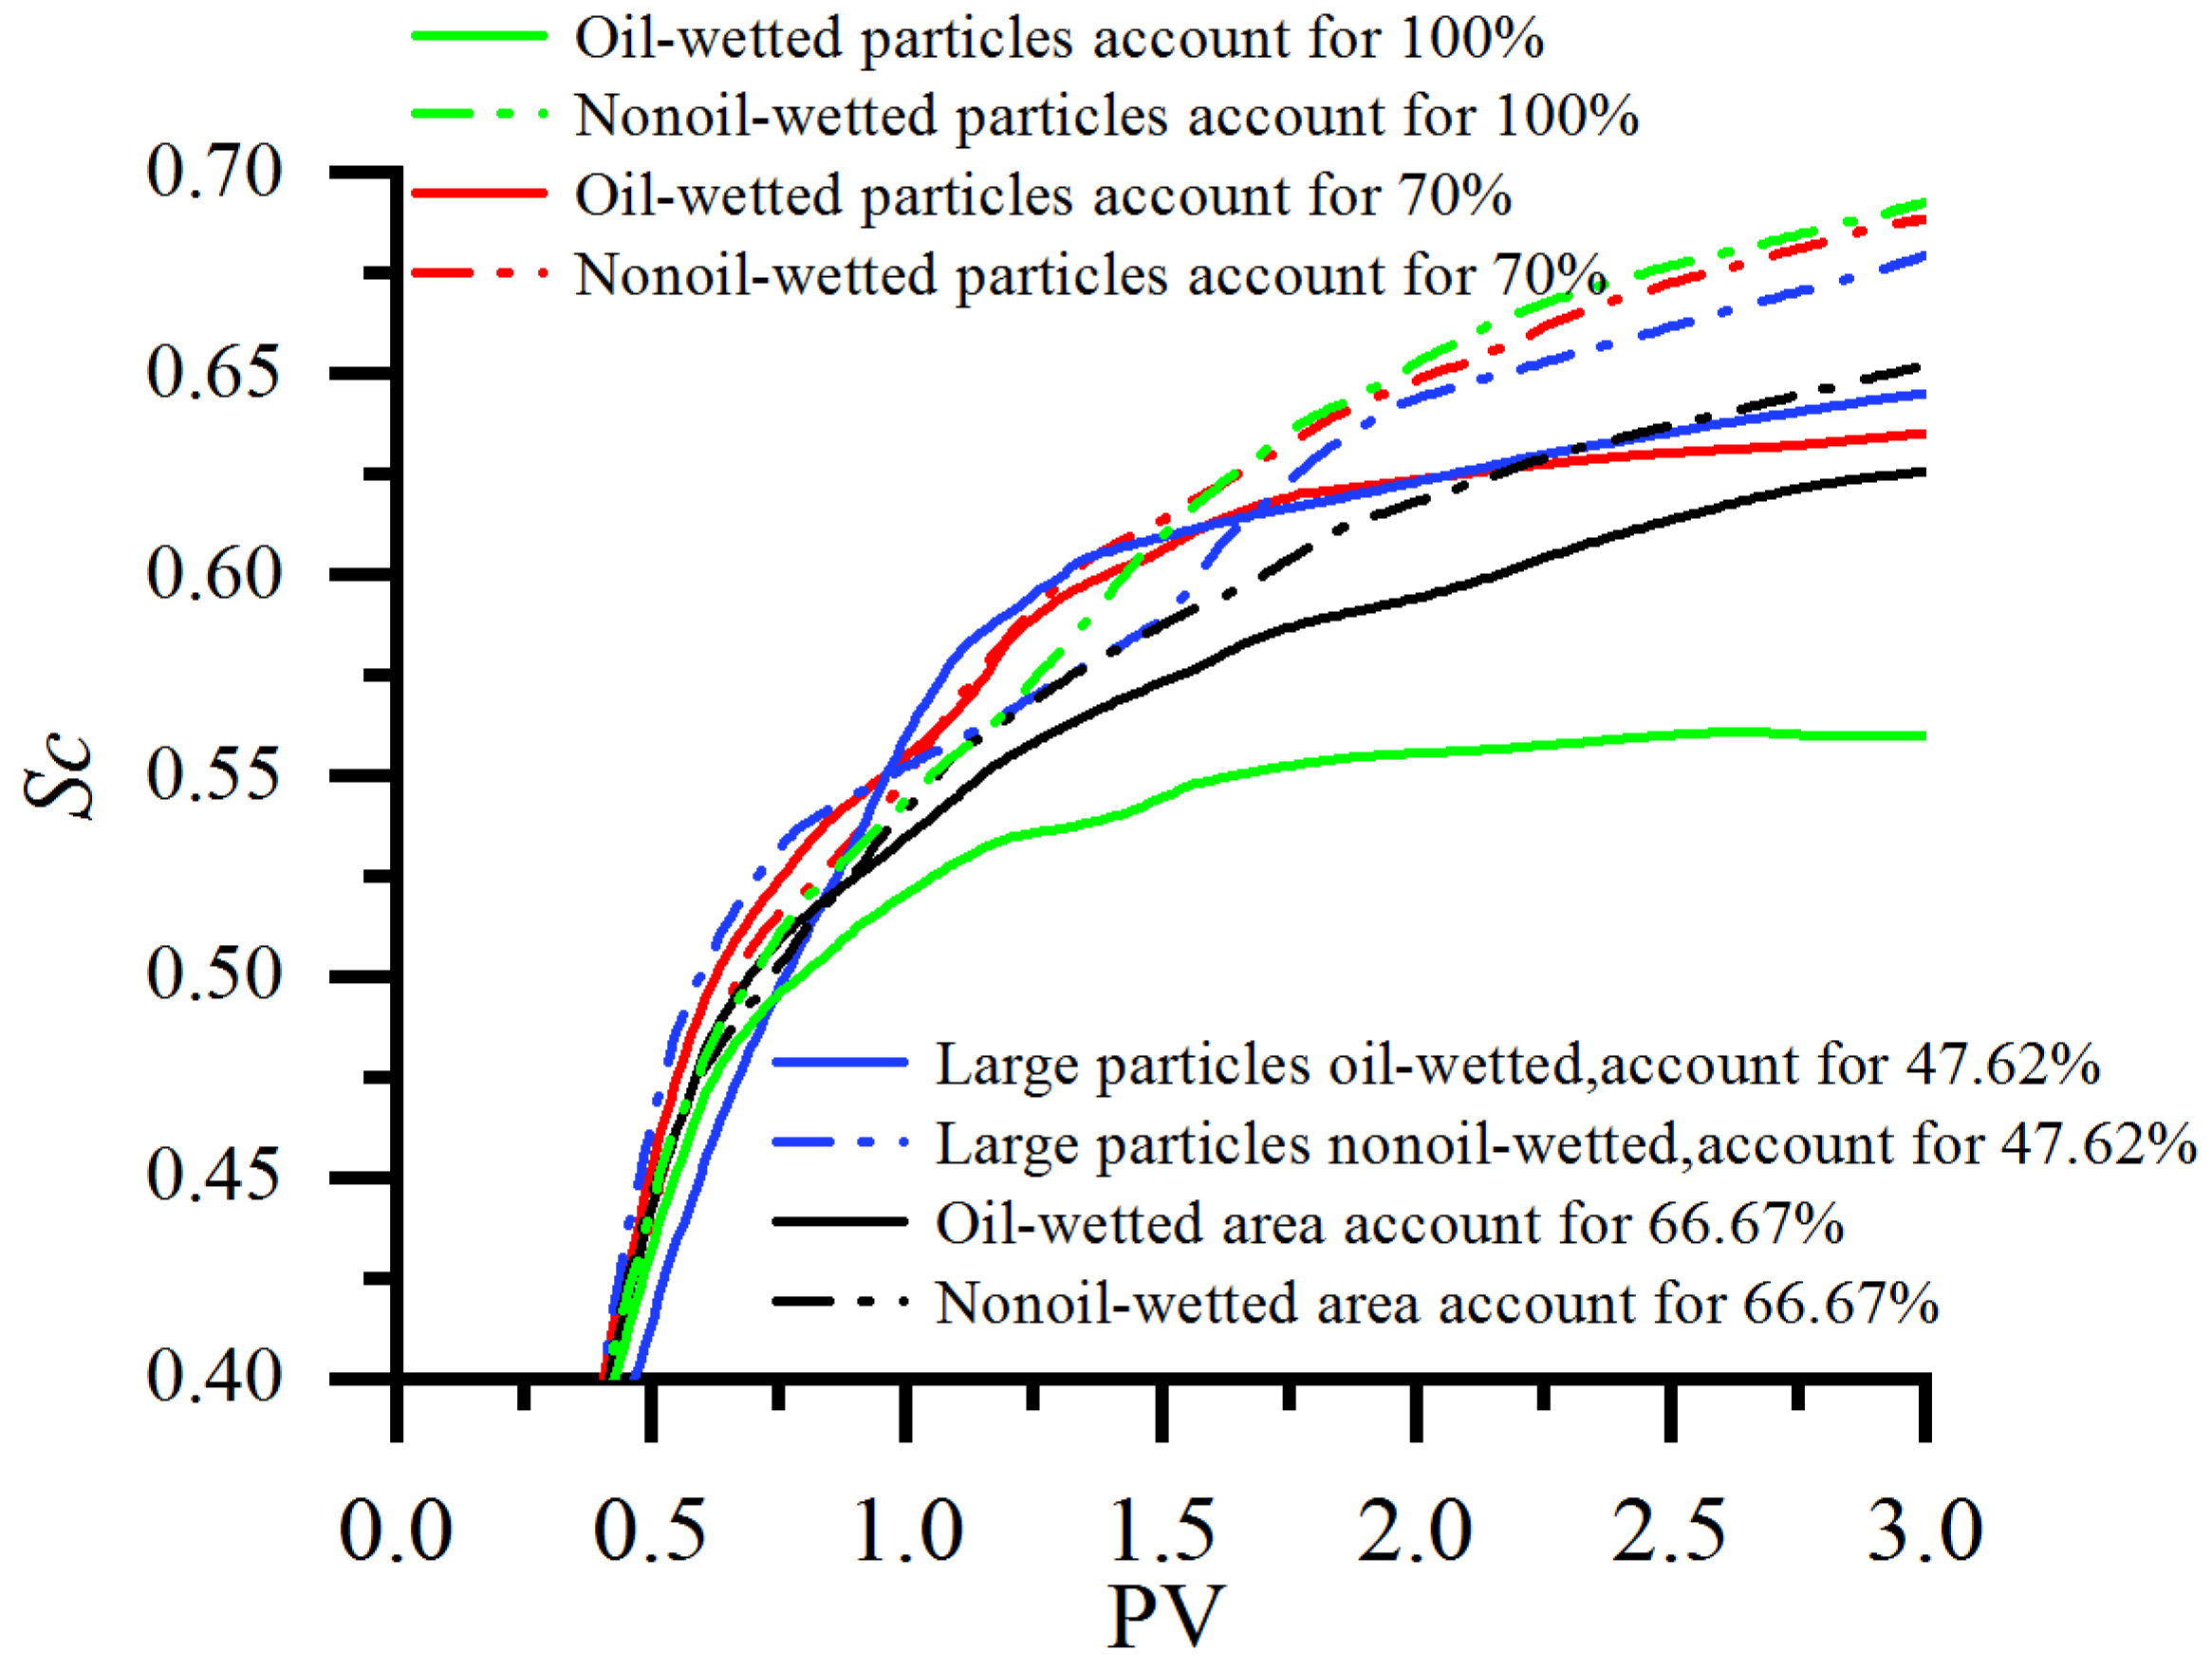
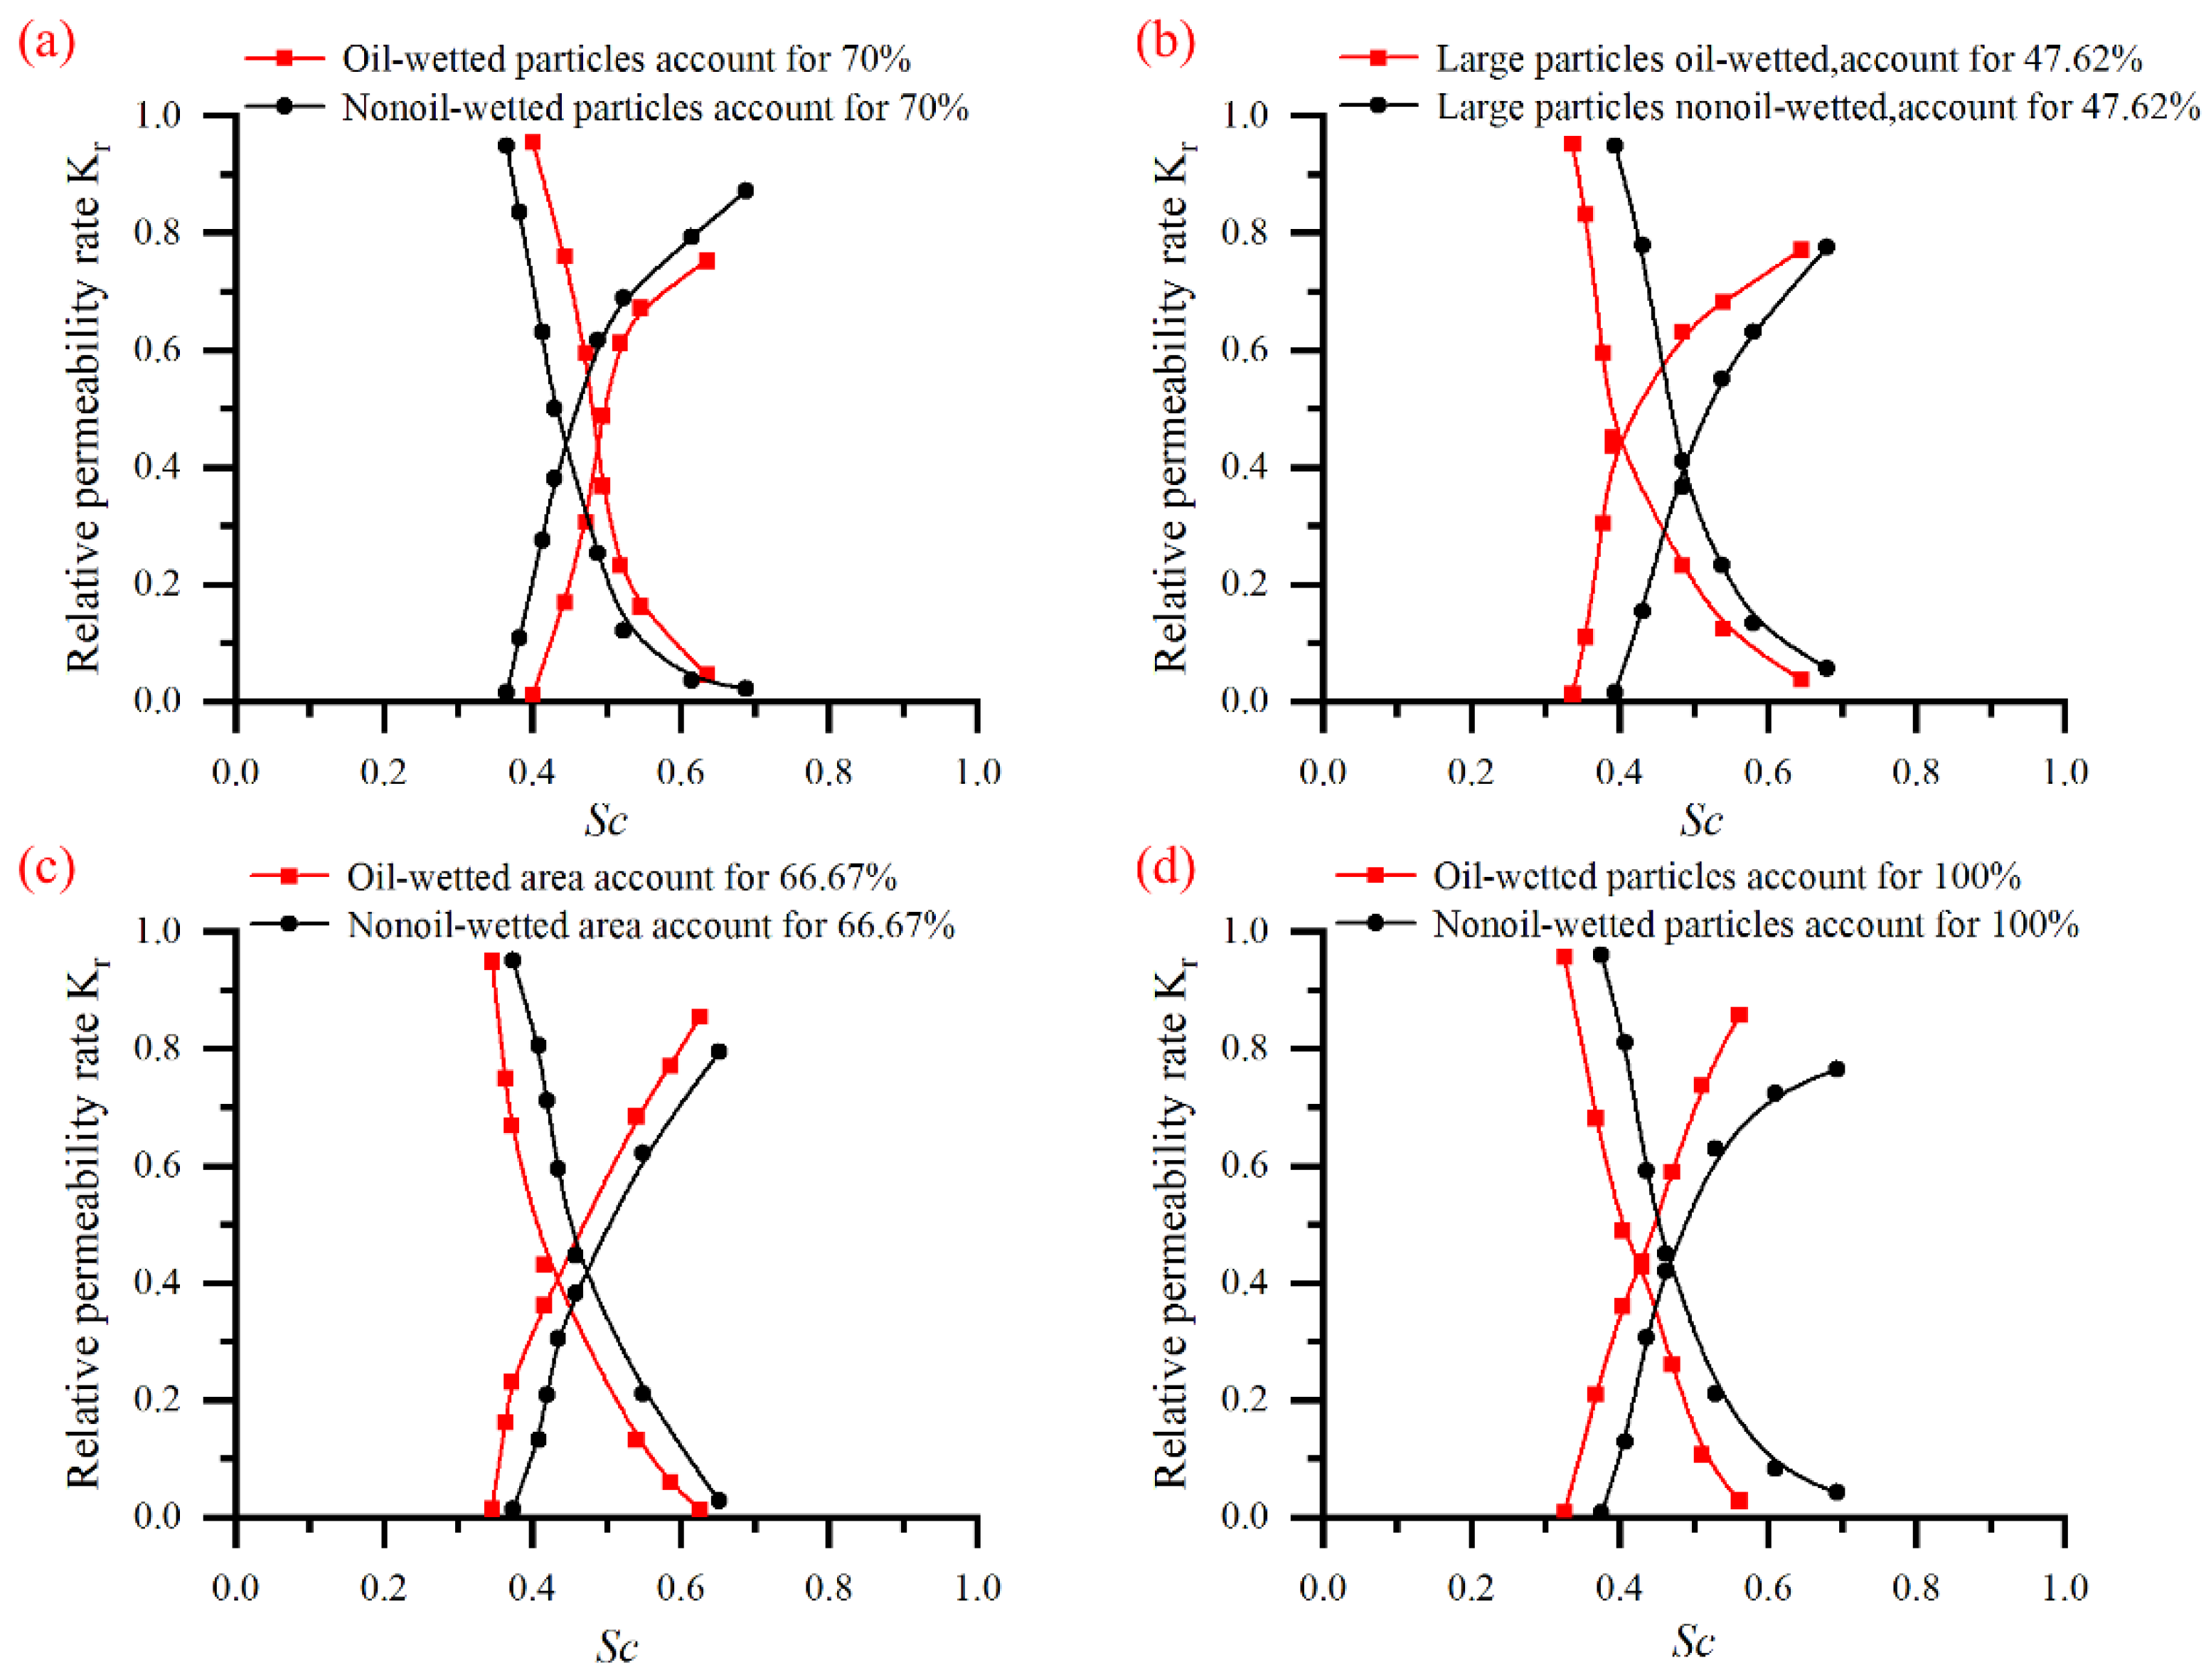
3.3.7. Effect of Mixed Wettability on Fluid Flow

The wettability of the natural rocks is often mixed. In other words, there are both oil-wetted and nonoil-wetted substances on the surface of rock particles, rather than a single case. This section adopts the model in Section 3.3.2. At log Ca = −4.25 and log M = −3.00, three groups of experimental models are set up by changing the wetting angle distribution of the circular particle wall, which are as follows: (1) The oil-wetted particles account for 70% of all particles (Figure 21a), the nonoil-wetted particles account for 70% (Figure 21b), and the particles are selected randomly in this process; (2) Particles with a diameter greater than or equal to 508 μm are set as oil-wetted, accounting for 47.62% (Figure 21c), and particles with a diameter greater than or equal to 508 μm are set as nonoil-wetted, accounting for 47.62% (Figure 21d); (3) The porous media model is divided equally into three areas in the vertical direction. The wettability of round particles in the three areas is set as oil-wetted, nonoil-wetted, and oil-wetted (the oil-wetted area accounts for 66.67%; Figure 21e) and nonoil-wetted, oil-wetted, and nonoil-wetted (the nonoil-wetted area accounts for 66.67%; Figure 21f), respectively. The contact angle is set to 60° (the oil-wetted particles account for 100%; Figure 21g) and 120° (the nonoil-wetted particles account for 100%; Figure 21h); these models, in Section 3.3.2, are set as the control model.
Figure 21 shows that under mixed wettability conditions, the final CO2 saturation profiles are significantly different after injecting 3 PV of CO2, which indicates that mixed wettability is an important factor for the oil recovery. It can be seen that the distribution of CO2 in Figure 21b is more than that in Figure 21a (the same situation exists in Figure 21c–h), indicating that the more nonoil-wetted particles, the more conducive to CO2 flooding. This is because the more nonoil-wetted particles, the more likely it is for the capillary force to be in the same direction as the driving force of displacement. By comparing Figure 21c,d, it can be seen that CO2 flooding is more favorable when the walls of large particles are in the nonoil-wetted state, which is due to the wider distribution and influence of large particles. By comparing Figure 21e,f, it can be seen that the CO2 distribution in the middle region of Figure 21e is significantly larger than that in Figure 21f. This is because, in the middle region of the model, Figure 21e is set as a nonoil-wetted region, while Figure 21f is an oil-wetted region. The result indicates that under the same injection condition, the occurrence of the nonoil-wetted region is conducive to expanding the sweep efficiency of CO2 flooding.
As shown in Figure 22, the relationship between the number of PV and CO2 saturation is presented. At the later stage of CO2 flooding (2.5–3.0 PV), the CO2 saturation curves of the model in Figure 21g,h are located at the top and bottom. When the particles are completely oil-wetted, the CO2 saturation is 55.99%, while when the particles are completely nonoil-wetted, the CO2 saturation is 69.26%, and the CO2 saturation curves of other numerical models fall in the range of the above two saturation curves. In the same group of experimental models, after injecting 3 PV CO2, the data represented by dotted lines in the figure are larger than those represented by solid lines, while the dotted line represents that the state of the model is that the nonoil-wetted area is larger.
Figure 23 shows the curve of oil/CO2 relative permeability during CO2 flooding in mixed-wetted models. It can be seen from Figure 23b–d that the isotonic point of the model is larger when the nonoil-wetted region is larger. However, Figure 23a shows the opposite situation, which is caused by the wettability setting of 70% of particles randomly selected in the process of setting the wettability of this group of model particles. As can be seen from Figure 23d, as the wettability of the model changes from strong oil-wetted to strong nonoil-wetted, the intersection points of the curve between the oil phase and CO2 phase move to the right. When the model is strong oil-wetted, the CO2 saturation at the intersection point is less than 0.45, while when the model is strong nonoil-wetted, it is greater than 0.45. The mixed wettability can better reflect the real situation of the oil reservoir, so the numerical simulation results are closer to the real situation under the mixed wettability condition. With the rising of the nonoil-wetted area in the pores, CO2 can occupy a larger volume of the pores, which will improve the oil recovery.

4. Conclusions

In this study, the two-phase flow of CO2 flooding was simulated by the phase-field method in a 2D heterogeneous model with random distribution and sizes of grains. A multiple-parameter analysis was performed to investigate the effects of capillary number, viscosity ratio, wettability, density, gravity, interfacial tension, and absolute permeability on the pore-scale mechanism of the CO2 flooding. The trapping and mobilization mechanisms of the residual oil were also analyzed. The following conclusions can be drawn:
(1)
A higher capillary number and viscosity ratio contribute to EOR. Furthermore, with the increase in the capillary number and viscosity ratio, the fingering phenomenon becomes less obvious and shows a stable displacement process. Viscosity fingering is the main pattern that occurred in the CO2 flooding.
(2)
When the wettability alternates from strong oil-wetted to nonoil-wetted, the recovery efficiency keeps constant at the initial stage and then increases slightly. For the mixed wettability scenario, the higher the proportions of the nonoil-wetted area in the model, the higher the oil recovery will be achieved. The patterns of residual fluids trapped after CO2 breaks through are mainly oil film, oil cluster, and blind-end types in oil-wetted pores, while they are mainly pore-cluster and blind-end types in nonoil-wetted pores.
(3)
The model of larger absolute permeability has a better oil recovery efficiency by CO2 flooding under the same porosity.
(4)
A higher density ratio and lower interfacial tension contribute to a higher oil recovery efficiency, which indicates that the scCO2 injection combined with surfactant flooding is an effective way to enhance the oil recovery. The gravity contributes to increase the sweeping efficiency by enhancing the CO2 migration in the vertical direction and enhancing the ultimate oil recovery efficiency.

Author Contributions

Conceptualization, R.S.; Formal analysis, Y.T. and R.X.; Funding acquisition, R.S. and Y.W.; Investigation, Y.T.; Writing—original draft, Y.T.; Writing—review and editing, R.S., Y.W., and J.L. All authors have read and agreed to the published version of the manuscript.

Funding

This work was financially funded by National Natural Science Foundation of China, grant number [51909225]; Knowledge Innovation Program of Wuhan-Basic Research, grant number [2022010801010158]; and Natural Science Foundation of Sichuan, grant number [2022NSFSC1161]. The APC was funded by [51909225].

Data Availability Statement

All the data and materials used in this paper are available from the corresponding authors upon request.

Conflicts of Interest

The authors declare that there are no competing financial interest with any other people or groups regarding the publication of this manuscript.

References

  1. Hoegh-Guldberg, O.; Bruno, J. The impact of climate change on the world’s marine ecosystems. Science 2010, 328, 1523–1528. [Google Scholar] [CrossRef] [PubMed]
  2. Song, R.; Wang, Y.; Tang, Y.; Liu, J.; Yang, C. 3D Printing of natural sandstone at pore scale and comparative analysis on micro-structure and single/two-phase flow properties. Energy 2022, 261, 125226. [Google Scholar] [CrossRef]
  3. Song, R.; Liu, J.; Cui, M. A new method to reconstruct structured mesh model from micro-computed tomography images of porous media and its application. Int. J. Heat. Mass Trans. 2017, 109, 705–715. [Google Scholar] [CrossRef]
  4. Bode, S.; Jung, M. Carbon dioxide capture and storage—liability for non-permanence under the UNFCCC. Int. Environ. Agreem. Politics Law Econ. 2006, 6, 173–186. [Google Scholar] [CrossRef]
  5. Cao, S.; Dai, S.; Jung, J. Supercritical CO2 and brine displacement in geological carbon sequestration: Micromodel and pore network simulation studies. Int. J. Green. Gas Control. 2016, 44, 104–114. [Google Scholar] [CrossRef]
  6. Song, R.; Liu, J.; Yang, C.; Sun, S. Study on the multiphase heat and mass transfer mechanism in the dissociation of methane hydrate in reconstructed real-shape porous sediments. Energy 2022, 254, 124421. [Google Scholar] [CrossRef]
  7. Blunt, M.; Fayers, F.J.; Orr, F.M., Jr. Carbon dioxide in enhanced oil recovery. Energy Convers. Manag. 1993, 34, 1197–1204. [Google Scholar] [CrossRef]
  8. Alvarado, V.; Manrique, E. Enhanced oil recovery: An update review. Energies 2010, 3, 1529–1575. [Google Scholar] [CrossRef]
  9. Parker, M.E.; Meyer, J.P.; Meadows, S.R. Carbon dioxide enhanced oil recovery injection operations technologies. Energy Procedia 2009, 1, 3141–3148. [Google Scholar] [CrossRef] [Green Version]
  10. Wang, X.Q.; Gu, Y.A. Oil recovery and permeability reduction of a tight sandstone reservoir in immiscible and miscible CO2 flooding processes. Ind. Eng. Chem. Res. 2011, 50, 2388–2399. [Google Scholar] [CrossRef]
  11. Song, R.; Sun, S.; Liu, J.; Yang, C. Pore scale modeling on dissociation and transportation of methane hydrate in porous sediments. Energy 2021, 237, 121630. [Google Scholar] [CrossRef]
  12. Song, R.; Wang, Y.; Liu, J.; Cui, M.; Lei, Y. Comparative analysis on pore-scale permeability prediction on micro-CT images of rock using numerical and empirical approaches. Energy Sci. Eng. 2019, 7, 2842–2854. [Google Scholar] [CrossRef] [Green Version]
  13. Peng, X.; Wang, Y.; Diao, Y.; Zhang, L.; Yazid, I.M.; Ren, S. Experimental investigation on the operation parameters of carbon dioxide huff-n-puff process in ultralow permeability oil reservoirs. J. Pet. Sci. Eng. 2019, 174, 903–912. [Google Scholar] [CrossRef]
  14. Desch, J.B.; Larsen, W.K.; Lindsay, R.F.; Nettle, R.L. Enhanced oil recovery by CO2 miscible displacement in the Little Knife field, Billings County, North Dakota. J. Pet. Technol. 1984, 36, 1592–1602. [Google Scholar] [CrossRef]
  15. Xiao, P.; Yang, Z.; Wang, X.; Xiao, H.; Wang, X. Experimental investigation on CO2 injection in the Daqing extra/ultra-low permeability reservoir. J. Pet. Sci. Eng. 2017, 149, 765–771. [Google Scholar] [CrossRef]
  16. Feng, H.; Haidong, H.; Yanqing, W.; Liang, Z.; Bo, R. Assessment of miscibility effect for CO2 flooding EOR in a low permeability reservoir. J. Pet. Sci. Eng. 2016, 145, 328–335. [Google Scholar] [CrossRef]
  17. Zhu, C.; Li, Y.; Zhao, Q.; Gong, H.; Sang, Q.; Zou, H. Experimental study and simulation of CO2 transfer processes in shale oil reservoir. Int. J. Coal Geol. 2018, 191, 24–36. [Google Scholar] [CrossRef]
  18. Ding, M.; Gao, M.; Wang, Y.; Qu, Z.; Chen, X. Experimental study on CO2-EOR in fractured reservoirs: Influence of fracture density, miscibility and production scheme. J. Pet. Sci. Eng. 2019, 174, 476–485. [Google Scholar] [CrossRef]
  19. Gao, H.; Pu, W. Experimental Study on Supercritical CO2 Huff and Puff in Tight Conglomerate Reservoirs. ACS Omega 2021, 6, 24545–24552. [Google Scholar] [CrossRef]
  20. Li, H.; Yang, Z.; Li, R. Mechanism of CO2 enhanced oil recovery in shale reservoirs. Petro. Sci. 2021, 18, 1788–1796. [Google Scholar] [CrossRef]
  21. Li, X.; Xue, J.; Wang, Y.; Yang, W.; Lu, J. Experimental study of oil recovery from pore of different sizes in tight sandstone reservoirs during CO2 flooding. J. Pet. Sci. Eng. 2022, 208, 109740. [Google Scholar] [CrossRef]
  22. Kun, Q.; Sheng, L.; Hong, E. Microscopic characteristics of oil displacement with different CO2 injection modes in extra-low permeability reservoirs. Xinjiang Pet. Geol. 2020, 41, 204. [Google Scholar]
  23. Al-Bayati, D.; Saeedi, A.; Xie, Q.; Myers, M.B.; White, C. Influence of permeability heterogeneity on miscible CO2 flooding efficiency in sandstone reservoirs: An experimental investigation. Transp. Porous Med. 2018, 125, 341–356. [Google Scholar] [CrossRef]
  24. Pu, W.; Gao, H.; Zhao, S.; Gao, X. Microscopic Oil Displacement Mechanism of CO2 in Low-Permeability Heterogeneous Glutenite Reservoirs in the Junggar Basin. ACS Omega 2022, 7, 4420–4428. [Google Scholar] [CrossRef]
  25. Wei, B.; Gao, H.; Pu, W.; Zhao, F.; Li, Y. Interactions and phase behaviors between oleic phase and CO2 from swelling to miscibility in CO2-based enhanced oil recovery (EOR) process: A comprehensive visualization study. J. Mol. Liquids. 2017, 232, 277–284. [Google Scholar] [CrossRef]
  26. Yang, Y.; Yang, H.; Tao, L. Microscopic determination of remaining oil distribution in sandstones with different permeability scales using computed tomography scanning. J. Energy Resour. Technol. 2019, 141, 092903. [Google Scholar] [CrossRef]
  27. Zhang, F.; Jiang, Z.; Sun, W. Effect of microscopic pore-throat heterogeneity on gas-phase percolation capacity of tight sandstone reservoirs. Energy Fuels 2020, 34, 12399–12416. [Google Scholar] [CrossRef]
  28. Chung, T.; Da, W.; Armstrong, R.; Mostaghimi, P. Voxel agglomeration for accelerated estimation of permeability from micro-CT images. J. Pet. Sci. Eng. 2020, 184, 106577. [Google Scholar] [CrossRef]
  29. Cao, Q.; Gong, Y.; Fan, T. Pore-scale simulations of gas storage in tight sandstone reservoirs for a sequence of increasing injection pressure based on micro-CT. J. Nat. Gas Sci. Eng. 2019, 64, 15–27. [Google Scholar] [CrossRef]
  30. Wang, Y.; Song, R.; Liu, J.; Cui, M.; Ranjith, P. Pore scale investigation on scaling-up micro-macro capillary number and wettability on trapping and mobilization of residual fluid. J. Contam. Hydrol. 2019, 225, 103499. [Google Scholar] [CrossRef]
  31. Zhang, C.; Oostrom, M.; Grate, J. Liquid CO2 displacement of water in a dual-permeability pore network micromodel. Environ. Sci. Technol. 2011, 45, 7581–7588. [Google Scholar] [CrossRef] [PubMed]
  32. Liu, H.; Valocchi, A.; Werth, C.; Kang, Q.; Oostrom, M. Pore-scale simulation of liquid CO2 displacement of water using a two-phase lattice Boltzmann model. Adv. Water Resour. 2014, 73, 144–158. [Google Scholar] [CrossRef] [Green Version]
  33. Amiri, H.; Hamouda, A. Pore-scale modeling of non-isothermal two phase flow in 2D porous media: Influences of viscosity, capillarity, wettability and heterogeneity. Int. J. Multiphase Flow. 2014, 61, 14–27. [Google Scholar] [CrossRef]
  34. Shi, Y.; Tang, G. Non-Newtonian rheology property for two-phase flow on fingering phenomenon in porous media using the lattice Boltzmann method. J. Non-Newtonian Fluid Mech. 2016, 229, 86–95. [Google Scholar] [CrossRef]
  35. Zhu, G.P.; Yao, J.; Li, A.E.; Sun, H.; Zhang, L. Pore-scale investigation of carbon dioxide-enhanced oil recovery. Energy Fuel 2017, 31, 5324–5332. [Google Scholar] [CrossRef]
  36. Basirat, F.; Yang, Z.; Niemi, A. Pore-scale modeling of wettability effects on CO2–brine displacement during geological storage. Adv. Water Resour. 2017, 109, 181–195. [Google Scholar] [CrossRef]
  37. Rokhforouz, M.R.; Amiri, H.A. Effects of grain size and shape distribution on pore-scale numerical simulation of two-phase flow in a heterogeneous porous medium. Adv. Water Resour. 2019, 124, 84–95. [Google Scholar] [CrossRef]
  38. Ma, Q.; Zheng, Z.; Fan, J.; Jia, J.; Bi, j. Pore-scale simulations of CO2/oil flow behavior in heterogeneous porous media under various conditions. Energies 2021, 14, 533. [Google Scholar] [CrossRef]
  39. Zhang, L.; Kang, Q.; Yao, J.; Gao, Y.; Sun, Z. Pore scale simulation of liquid and gas two-phase flow based on digital core technology. Sci. China Technol. Sci. 2015, 58, 1375–1384. [Google Scholar] [CrossRef]
  40. Yue, P.T.; Feng, J.J.; Liu, C.; Shen, J. A diffuse-interface method for simulating two-phase flows of complex fluids. J. Fluid Mech 2004, 515, 293–317. [Google Scholar] [CrossRef] [Green Version]
  41. Yue, P.T.; Zhou, C.F.; Feng, J.J.; Olliveier-Gooch, C.E.; Hu, H.H. Phase-field simulations of interfacial dynamics in viscoelastic fluids using finite elements with adaptive meshing. J. Comput. Phys. 2006, 219, 47–67. [Google Scholar] [CrossRef]
  42. Shen, J.; Yang, X. Decoupled, energy stable schemes for phase-field models of two-phase incompressible flows. SIAM J. Numer. Anal. 2015, 53, 279–296. [Google Scholar] [CrossRef] [Green Version]
  43. Jacqmin, D. Calculation of two-phase Navier–Stokes flows using phase-field modeling. J. Comput. Phys. 1999, 155, 96–127. [Google Scholar] [CrossRef]
  44. Chaudhary, K.; Bayani, C.; Wolfe, W. Pore-scale trapping of supercritical CO2 and the role of grain wettability and shape. Geophys. Res. Lett. 2013, 40, 3878–3882. [Google Scholar] [CrossRef]
  45. Chen, H.; Li, B.; Duncan, I.; Elkhider, M.; Liu, X. Empirical correlations for prediction of minimum miscible pressure and near-miscible pressure interval for oil and CO2 systems. Fuel 2020, 278, 118272. [Google Scholar] [CrossRef]
  46. Tryggvason, G.; Bunner, B.; Esmaeeli, A. A front-tracking method for the computations of multiphase flow. J. Comput Phys. 2001, 169, 708–759. [Google Scholar] [CrossRef] [Green Version]
  47. Gunde, A.C.; Bera, B.; Mitra, S.K. Investigation of water and CO2 (carbon dioxide) flooding using micro-CT (micro-computed tomography) images of Berea sandstone core using finite element simulations. Energy 2010, 35, 5209–5216. [Google Scholar] [CrossRef]
  48. Liu, P.; Yao, J.; Couples, G.D.; Ma, J.; Huang, Z.; Sun, H. Modeling and simulation of wormhole formation during acidization of fractured carbonate rocks. J. Pet. Sci. Eng. 2017, 154, 284–301. [Google Scholar] [CrossRef]
  49. Villanueva, W.; Amberg, G. Some generic capillary-driven flows. Int. J. Multiphase Flow. 2006, 32, 1072–1086. [Google Scholar] [CrossRef]
  50. Zhu, G.; Yao, J.; Zhang, L.; Sun, H.; Li, A.; Shams, B. Investigation of the dynamic contact angle using a direct numerical simulation method. Langmuir 2016, 32, 11736–11744. [Google Scholar] [CrossRef]
  51. Boyer, F.; Lapuerta, C.; Minjeaud, S.; Piar, B.; Quintard, M. Cahn–Hilliard/Navier–Stokes model for the simulation of three-phase flows. Transp. Porous Med. 2010, 82, 463–483. [Google Scholar] [CrossRef]
  52. COMSOL, A. CFD Module User’s Guide; COMSOL Inc.: Stockholm, Sweden, 2020. [Google Scholar]
  53. Zhou, C.; Yue, P.; Feng, J.J.; Ollivier-Gooch, C.F.; Hu, H.H. 3D phase-field simulations of interfacial dynamics in Newtonian and viscoelastic fluids. J. Comput. Phys. 2010, 229, 498–511. [Google Scholar] [CrossRef] [Green Version]
  54. Shen, J. Modeling and numerical approximation of two-phase incompressible flows by a phase-field approach. Multiscale Modeling Anal. Mater. Simul. 2012, 9, 147–195. [Google Scholar]
  55. Or, D. Scaling of capillary, gravity and viscous forces affecting flow morphology in unsaturated porous media. Adv. Water Resour. 2008, 31, 1129–1136. [Google Scholar] [CrossRef]
  56. Hizir, F.E.; Hardt, D.E. Phase-field modeling of liquids splitting between separating surfaces and its application to high-resolution roll-based printing technologies. Phys. Fluids 2017, 29, 052007. [Google Scholar] [CrossRef] [Green Version]
  57. Peng, J.; Song, R.; Wang, Y.; Xiao, H. Comparative study of VOF, LS, and VOSET on pore-scale immiscible waterflooding modeling. Petroleum 2021, 7, 314–324. [Google Scholar] [CrossRef]
Figure 1. Schematic diagram of the pore-scale model and its boundary conditions.
Energies 16 00082 g001
Figure 2. Simulation results of single-phase flow. (a) Velocity distribution; (b) Pressure distribution.
Energies 16 00082 g002
Figure 3. Schematic diagram of the 2D geometric model and its mesh model. (a) Schematic diagram of the geometric model and initial and boundary conditions for numerical simulations; (b) Schematic diagram of mesh model.
Energies 16 00082 g003
Figure 4. CO2 saturation distribution during CO2 breakthrough for different capillary number and viscosity ratio (red and blue regions represent CO2 and oil, respectively).
Energies 16 00082 g004
Figure 5. Relationship between CO2 saturation (SC) and log Ca and log M. (a) CO2 saturation (SC) as a function of log Ca; (b) CO2 saturation (SC) as a function of log M.
Energies 16 00082 g005
Figure 6. CO2 saturation (SC) vs. PV number for different Ca and M (a) CO2 saturation (SC) as a function of PV (log Ca = −3.62 and −4.62); (b) CO2 saturation (SC) as a function of PV (log Ca = −5.62).
Energies 16 00082 g006
Figure 7. Variations of the CO2 main channel at different times (log Ca = −5.62, log M = −3.00; red and blue regions represent CO2 and oil, respectively).
Energies 16 00082 g007
Figure 8. Pressure vs. time at point P near the outlet.
Energies 16 00082 g008
Figure 9. Fracture of the CO2 plume during the displacement process (log Ca = −4.62, log M = −3.00; red and blue regions represent CO2 and oil, respectively).
Energies 16 00082 g009
Figure 10. CO2 saturation distribution after CO2 flooding for different contact angles (Red and blue regions represent CO2 and oil, respectively).
Energies 16 00082 g010
Figure 11. CO2 saturation (SC) vs. contact angle (a) and PV number of CO2 injection (b).
Energies 16 00082 g011
Figure 12. Under strong oil-wetted conditions, snapshots of fluid distributions in an enlarged section of the medium at four instants (contact angle = 60°, log Ca = −4.25, log M = −3.00). Red and blue regions represent CO2 and oil, respectively.
Energies 16 00082 g012
Figure 13. Under strong nonoil-wetted conditions, snapshots of fluid distributions in an enlarged section of the medium at four instants (contact angle = 120°, log Ca = −4.25, log M = −3.00). Red and blue regions represent CO2 and oil, respectively.
Energies 16 00082 g013
Figure 14. CO2 saturation (Sc) vs. log Ca for same log M.
Energies 16 00082 g014
Figure 15. Influence of gravity on final CO2 saturation (Sc) after CO2 flooding.
Energies 16 00082 g015
Figure 16. CO2 saturation distribution under different interfacial tension. Red and blue regions represent CO2 and oil, respectively. (a) σ = 0.025 N/m; (b) σ = 0.01 N/m.
Energies 16 00082 g016
Figure 17. Saturation (SC) vs. PV for different interfacial tension.
Energies 16 00082 g017
Figure 18. Schematic diagram of the 2D model with larger absolute permeability.
Energies 16 00082 g018
Figure 19. CO2 saturation distribution after 2 PV CO2 injection (red and blue regions represent CO2 and oil, respectively). (a) K = 7.7192 × 10⁻¹¹m2; (b) K = 1.5487 × 10⁻¹⁰ m2.
Energies 16 00082 g019
Figure 20. Under different absolute permeability conditions, cloud diagram of velocity field corresponding to injected 2 PV CO2. (a) K = 7.7192 × 10⁻¹¹ m2; (b) K = 1.5487 × 10⁻¹⁰ m2.
Energies 16 00082 g020
Figure 21. CO2 saturation distribution corresponding to 3 PV number of CO2 injected under mixed wettability conditions. (a) Oil-wetted particles account for 70%; (b) Nonoil-wetted particles account for 70%; (c) Large particles, oil-wetted, account for 47.62%; (d) Large particles, nonoil-wetted, account for 47.62%; (e) Oil-wetted area accounts for 66.67%; (f) Nonoil-wetted area accounts for 66.67%; (g) Oil-wetted particles account for 100%; (h) Nonoil-wetted particles account for 100%; red and blue regions represent CO2 and oil, respectively.
Energies 16 00082 g021
Figure 22. Relationship between PV number and CO2 saturation (SC) under the condition of mixed wettability.
Energies 16 00082 g022
Figure 23. Oil/CO2 relative permeability curve during CO2 flooding under mixed wettability. (a) Random distribution of mixed wettability; (b) Large particles, oil-wetted/nonoil-wetted; (c) Oil-wetted/nonoil-wetted area account for 66.67%; (d) All particles are oil-wetted/nonoil-wetted.
Energies 16 00082 g023
Table 1. Basic parameters of the pore-scale model.
ParameterNumerical Value
Length of fluids domain (μm)10,030.65
Height of fluids domain (μm)4876.80
Particle diameter (μm)508.00
P (MPa)5.00
T(K)293.15
ρCO2(kg/m3)140.65
μCO2 (Pa·s)1.648 × 10⁻⁵
Table 2. Parameters of oil and CO2.
ParameterNumerical Value
T (K)293.15
P (MPa)5.00
ρCO2 (kg/m3)140.65
ρoil (kg/m3)900.00
σ (N/m)0.025
Contact angles (θ)90°
Table 3. Capillary number and viscosity ratio used in the simulation.
ModelLog MLog CaContact Angle (θ)
a−3.00−5.6290°
b−3.00−4.6290°
c−3.00−3.6290°
d−1.00−5.6290°
e−1.00−4.6290°
f−1.00−3.6290°
Table 4. Simulation parameters of different contact angles.
ModelNumerical Value
a60°
b75°
c90°
d105°
e120°
Table 5. Porosity and absolute permeability parameters.
ModelPorosity (%)Absolute Permeability (m2)
a36.367.7192 × 10−11
b36.361.5487 × 10−10
Disclaimer/Publisher’s Note: The statements, opinions and data contained in all publications are solely those of the individual author(s) and contributor(s) and not of MDPI and/or the editor(s). MDPI and/or the editor(s) disclaim responsibility for any injury to people or property resulting from any ideas, methods, instructions or products referred to in the content.

