Article

Focus on Climate Action: What Level of Synergy and Trade-Off Is There between SDG 13; Climate Action and Other SDGs in Nepal?

1
School for the Future of Innovation in Society, Arizona State University, Tempe, AZ 85281, USA
2
Department of Built Environment and Energy Technology, Linnaeus University, 35195 Växjö, Sweden
3
Department of Energy, Environment and Climate Change, Asian Institute of Technology, Khlong Luang 12120, Pathum Thani, Thailand
*
Author to whom correspondence should be addressed.
Energies 2023, 16(1), 566; https://doi.org/10.3390/en16010566
Submission received: 3 December 2022 / Revised: 23 December 2022 / Accepted: 28 December 2022 / Published: 3 January 2023
(This article belongs to the Special Issue Energy Transitions: Low-Carbon Pathways for Sustainability)

Abstract

:
The Sixth Assessment Report of Inter-Governmental Panel on Climate Change (IPCC) has highlighted the urgency of accelerated climate actions harnessing synergies and minimizing trade-offs with various SDG. This calls for a clear understanding of linkages between climate goals and other SDGs at national level for formulating synergistic policies and strategies and developing different sectoral programs and coherent cross-sectoral policies. This is even more important for least developed countries such as Nepal where these linkages are less understood and development challenges are multifaceted. In this context, this paper aims to evaluate potential synergies and trade-offs among selected SDGs and their associated targets in Nepal in a linear pairwise comparison. Synergies and trade-offs related to climate action (SDG 13), access to energy (SDG 7), sustainable consumption and production (SDG 12), and life on land (SDG 15) have been evaluated using historical data for the period from 1990 to 2018 employing a mixed methods approach. Network analysis to map the conceptual linkages between the SDGs and their targets was combined with the advance sustainability analysis (ASA) to quantitatively evaluate the synergy and trade-offs between SDGs. The results illustrate the presences of a continual trade-off between emission reductions targets of SDG 13 with per capita energy consumption and share of renewable energy of SDG 7, land use for agricultural production target of SDG 12, and forest area target of SDG 15. This indicates that climate action is strongly interlinked with GHG emissions from economic activities and energy consumption. The results of the study represent a valuable input for the policy makers, supporting coherent and sustainable development planning as Nepal plans to graduate to a middle-income country.

1. Introduction

The Sustainable Development Agenda to 2030 includes 17 interlinked goals and 169 targets aiming to provide direction towards a sustainable future. Ending poverty, protecting the planet, providing access to affordable, reliable, sustainable, modern energy, and ensuring the universal prosperity; fostering global peace with inclusive societies and enhancing global partnerships are key SDG agenda [1,2,3]. Understanding the interlinkages and integrated nature of the SDGs is crucial to realize the targets set by the agenda 2030 [4,5]. Synergy and trade-off among different developmental goals shall be reflected in designing coherent policies among different sectors [6,7], for the achievement of sustainable development. However, climate change is considered as one of the eminent perils to sustainable development worldwide [8], as it causes extensive and unprecedented effects and unduly burdens the poorest and most highly susceptible countries [9].
The least developed countries (LDCs) are highly vulnerable to the impacts of climate change and are on the front lines of the climate crisis [10], despite barely contributing to climate change. The ability of LDCs to meet the SDGs regarding poverty, hunger, health, water, growth, infrastructure, cities, water resources, and ecosystems will be severely hampered by climate change due to their low capacity to adapt to the changes [11]. It might also make it harder for LDCs to achieve their goals in terms of implementation, peace, sustainable consumption and production, gender equality, and education [12]. The Special Report on Global warming of 1.5 °C [13] states limiting global warming to 1.5 °C rather than 2 °C above the pre-industrial level would brand it evidently easier to accomplish various features of sustainable development [14]. The two lines of defense against climate change, i.e., climate change adaptation and climate change mitigation, have been found to have various levels of synergy with other SDGs, such food security, poverty, equity, energy, water, and nutrient input in agriculture [15]. As such, it becomes crucial to properly address SDG 13, which concerns urgent action to combat climate change and its impacts through coherent policy building as it can effectively lead to accomplishing other SDGs [16].
Like many LDCs, Nepal is particularly vulnerable to the worst impacts of climate change due to the melting of the Himalayas, flooding of the plains, degradation of the land, loss of biodiversity, and increased frequency of natural catastrophes due to the population’s limited capacity for adaptation [17]. As a party to the UNFCCC, Kyoto Protocol, and the Paris Agreement, the Government of Nepal (GoN) is active in various UN and other regional organizations linked to the climate change issue [18]. It has made significant progress in developing and implementing various adaptation programs and policies over the last decade, including the National Adaptation Programme of Action (NAPA), National Framework on Local Adaptation Plans for Action (LAPA), climate change policy, second national communications through the UNFCCC Secretariat, and so on [19]. However, it faces limited understanding in making such policies coherent among various sectors [20], such as energy, consumption and production, forest, and others, hindering effective climate action and the achievement of the SDGs. After the federalization of Nepal, the country began the process of formulating various policy transformation across its three tiers of governance (federal, state, and local) in order to empower the local government to achieve sustainable development [21]. Having policy coherency across the different tiers of the government and across different sectors requires evidentiary support. This study helps to understand and evaluate the synergy and trade-off across different SDGs.
Well-informed policy making can help in formulating coherent sectoral and cross-sectoral policies [22]. As unsupportive policies, instruments, and practices in one sector can render supportive polices in another ineffective, it is crucial to understand if the policies share the common goal or are contradictory [23,24]. There have been few studies in this direction in Nepal. In this backdrop, this paper aims to evaluate synergy and tradeoff among various SDGs in Nepal to provide evidence for climate informed development practices and policy making which can reduce the impacts of climate change whilst remaining on to attain the SDGs. This can help in increasing sectoral policy coherence between various national priorities and minimizing the trade-offs between climate action and sustainable development. Therefore, this paper has two objectives
(I)
Analyze and identify the extent and direction of interlinkages between SDGs and their targets,
(II)
Evaluate the potential synergies and trade-offs among the SDGs and their targets.
The analytical framework developed here is applied to identify interlinkages and evaluate synergies and trade-offs between four of the 17 SDGs that impact climate change to get a deeper understanding on the linkages. Central to our analysis is climate action (SDG 13), and its interactions with energy access (SDG7), sustainable consumption and production (SDG 12), and life on land (SDG 15) (Figure 1) separately from the perspective of Nepal. The latter three goals have a dynamic role in combating climate change, SDG 7; energy access has overarching benefits in addressing the various dimension of climate change, development, and poverty reduction. Along with the potential to mitigate the GHG emission, it has an interactive relation with climate change adaptation through lowering vulnerability and building resilience to climate change and climate variability [25,26]. SDG 12 regarding sustainable consumption and production is closely linked to climate impact as modes of consumption and production represent the main drivers of GHG emission [27], and the overall rate of consumption needs to be abridged to achieve the Paris agreement. Lastly, SDG 15; life on land has an active role in addressing SDG 13; regulating ecosystem, playing a fundamental part in the carbon cycle, to support livelihoods, supply goods and services that can lead to direct to sustainable growth. It can act both as a cause of GHG emission through deforestation and solution to GHG emissions through its potential to sequester carbon.
This paper is organized as follows. After this introductory section, the methodology adopted in the study, data sources used for the analysis, and the specific methodology applied are discussed in Section 2. The qualitative analysis of interlinkages between the SDGs and their target is discussed in Section 3. The quantitative analysis to evaluate the potential synergies and trade-offs among the SDGs/targets and their related policies is presented in Section 4. A conclusion is drawn in Section 5.

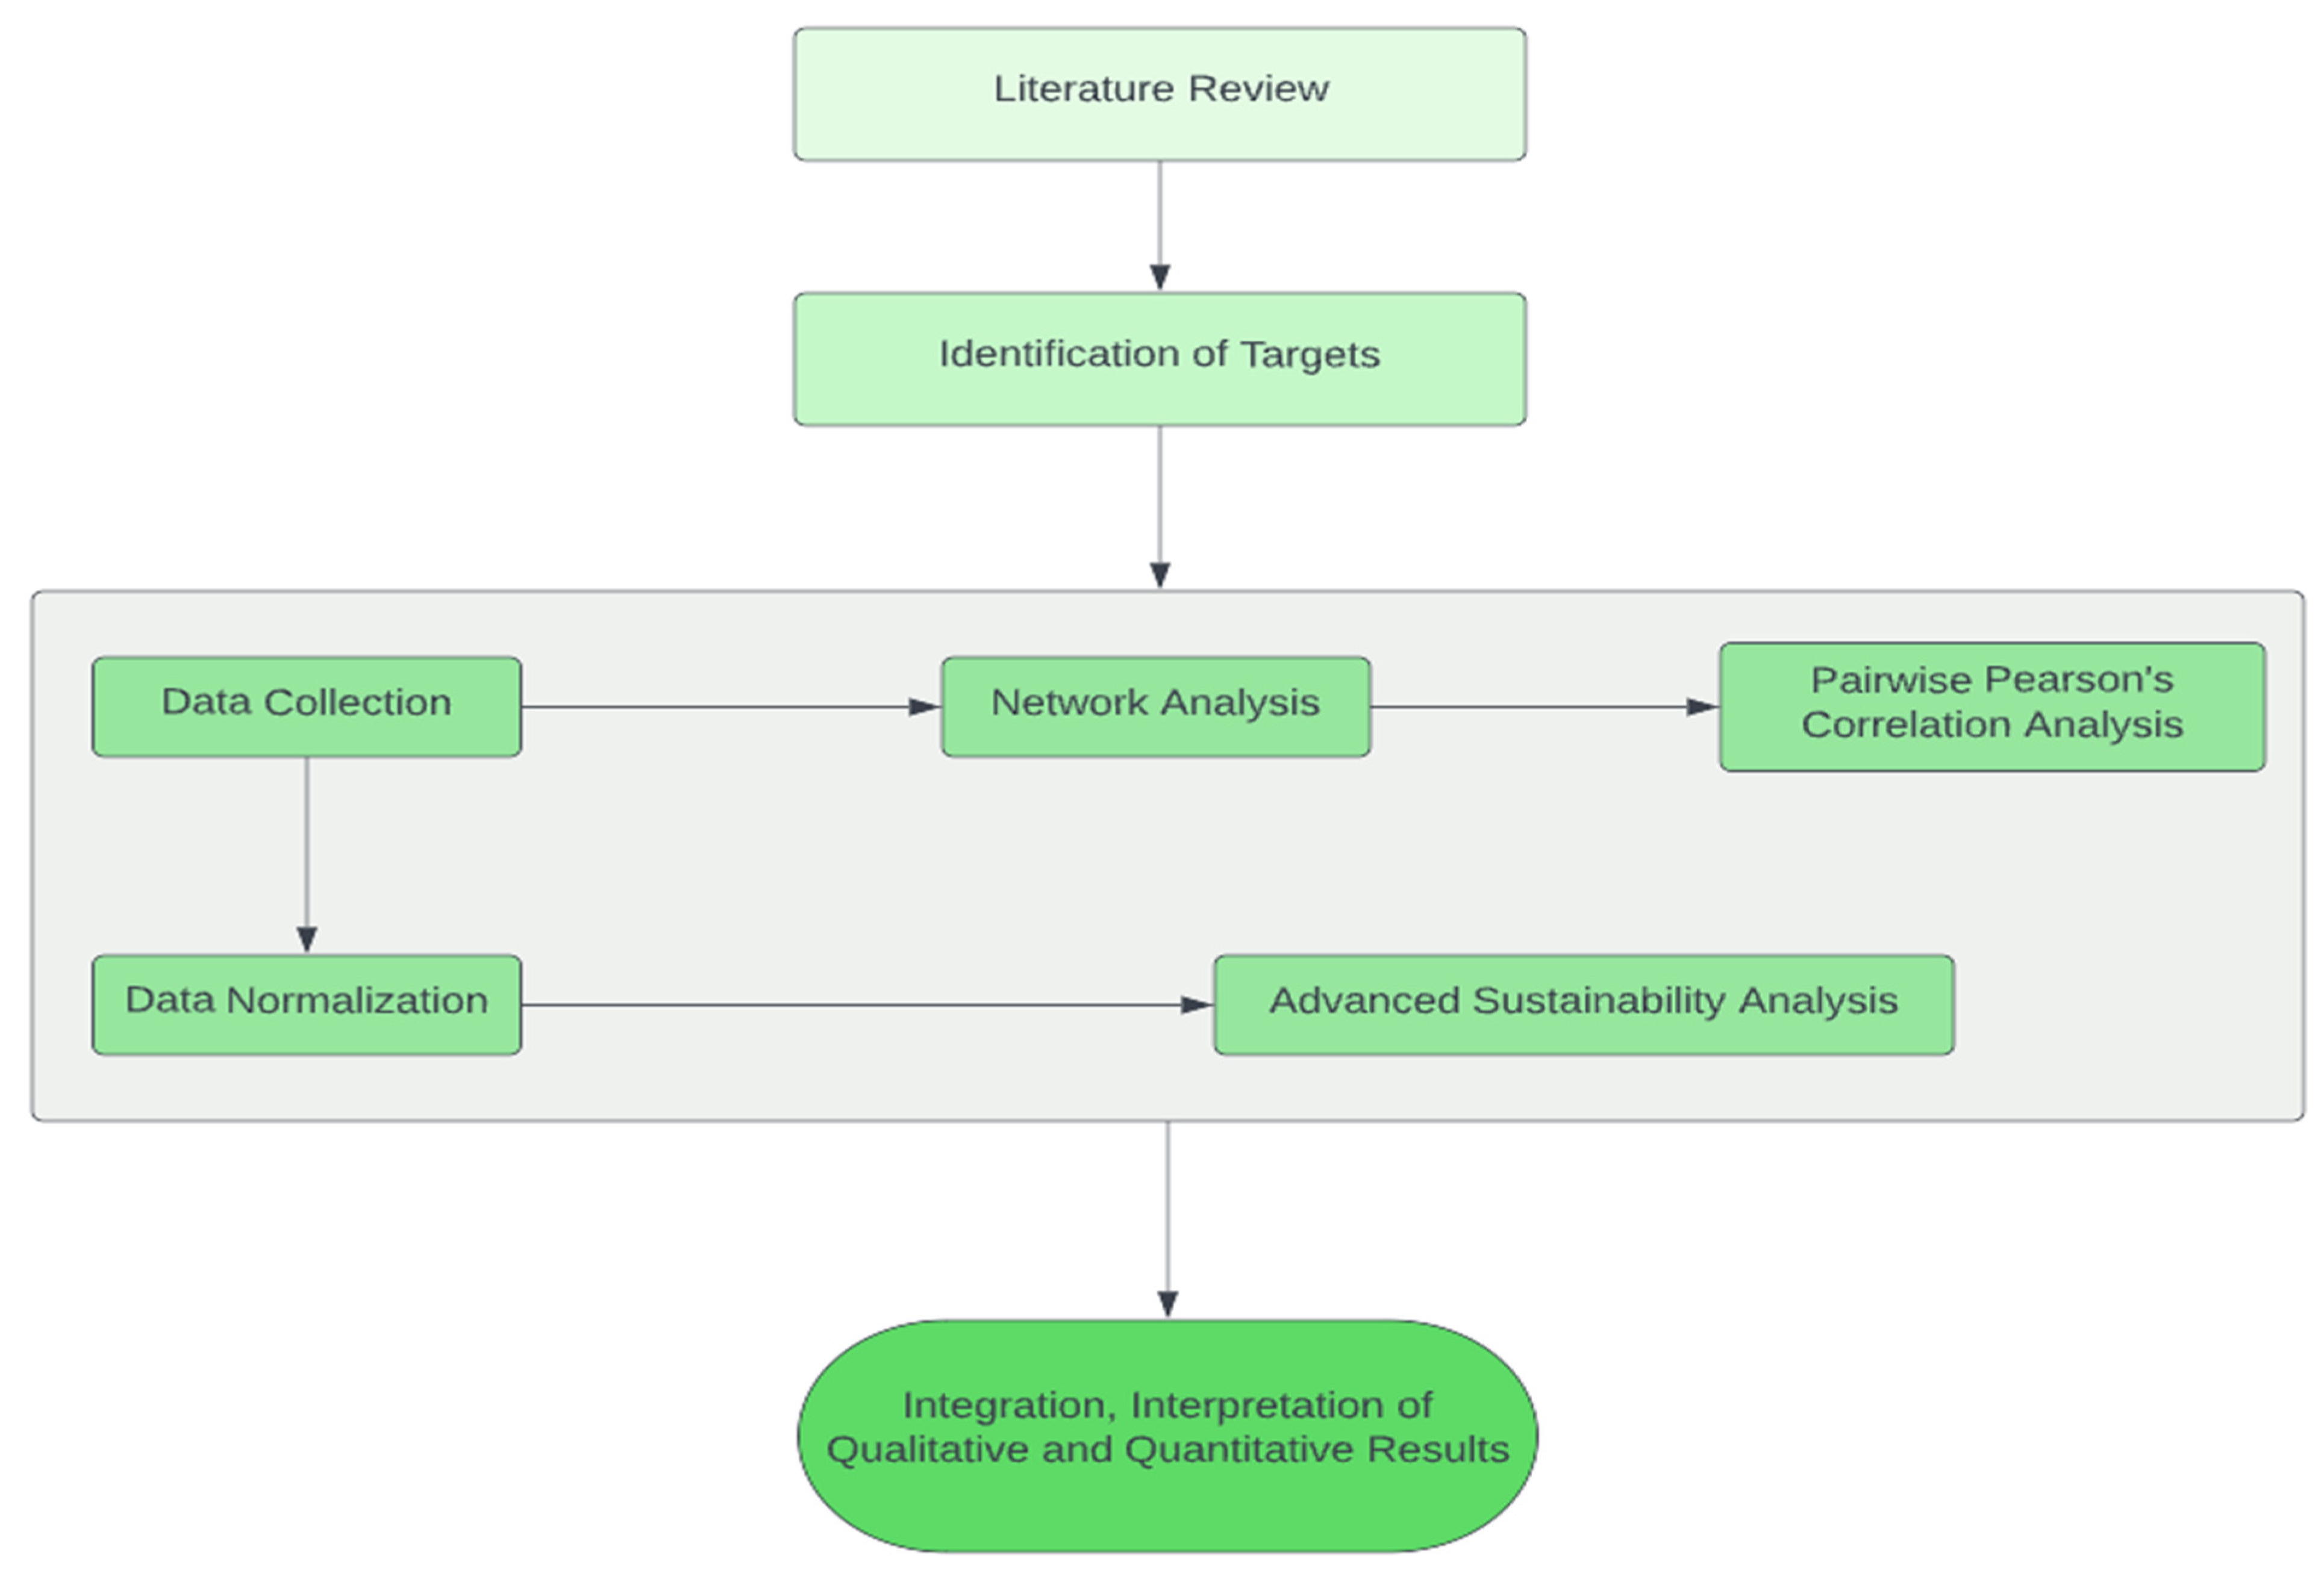
2. Materials and Methods

This study is based on the analytical framework using both qualitative and quantitative methods as presented in Figure 2. The goals and the targets with their description analyzed in this study are explained in the Section 2.1. The methodological framework is explained in detail in Section 2.2 and Section 2.3.

2.1. Selection of Goals, Targets, and Indicators

Table 1 presents the four SDGs and their targets as presented by GoN’s National Planning Commission (NPC) under analysis, i.e., SDGs 7, 12, 13, and 15, representing; access to energy, sustainable consumption and production, climate action, and life on land, with some specific associated targets and respective descriptions [28]. We assessed the synergy and trade-offs between the goals and their targets between 1990 to 2014 for each five years’ time span i.e., (1990–1994, 1995–1999, 2000–2004, 2005–2009, and 2010–2014) due to constraints on the data availability for the most recent period. In developing countries such as Nepal, data availability and their accuracy represent a major issue [6,29,30,31]. Moreover, not all targets defined under SDGs are quantitative in nature and well defined in terms of measurability and indicators. Due to data constraints, not all desired sets of indicators (as listed in Table 1) could be included in the analysis. Here, we have sourced data from national and international publications, databases, reports, and surveys, viz. CAIT, World Bank database, FAO-AQUASTAT, Economic Survey Nepal 18/19.

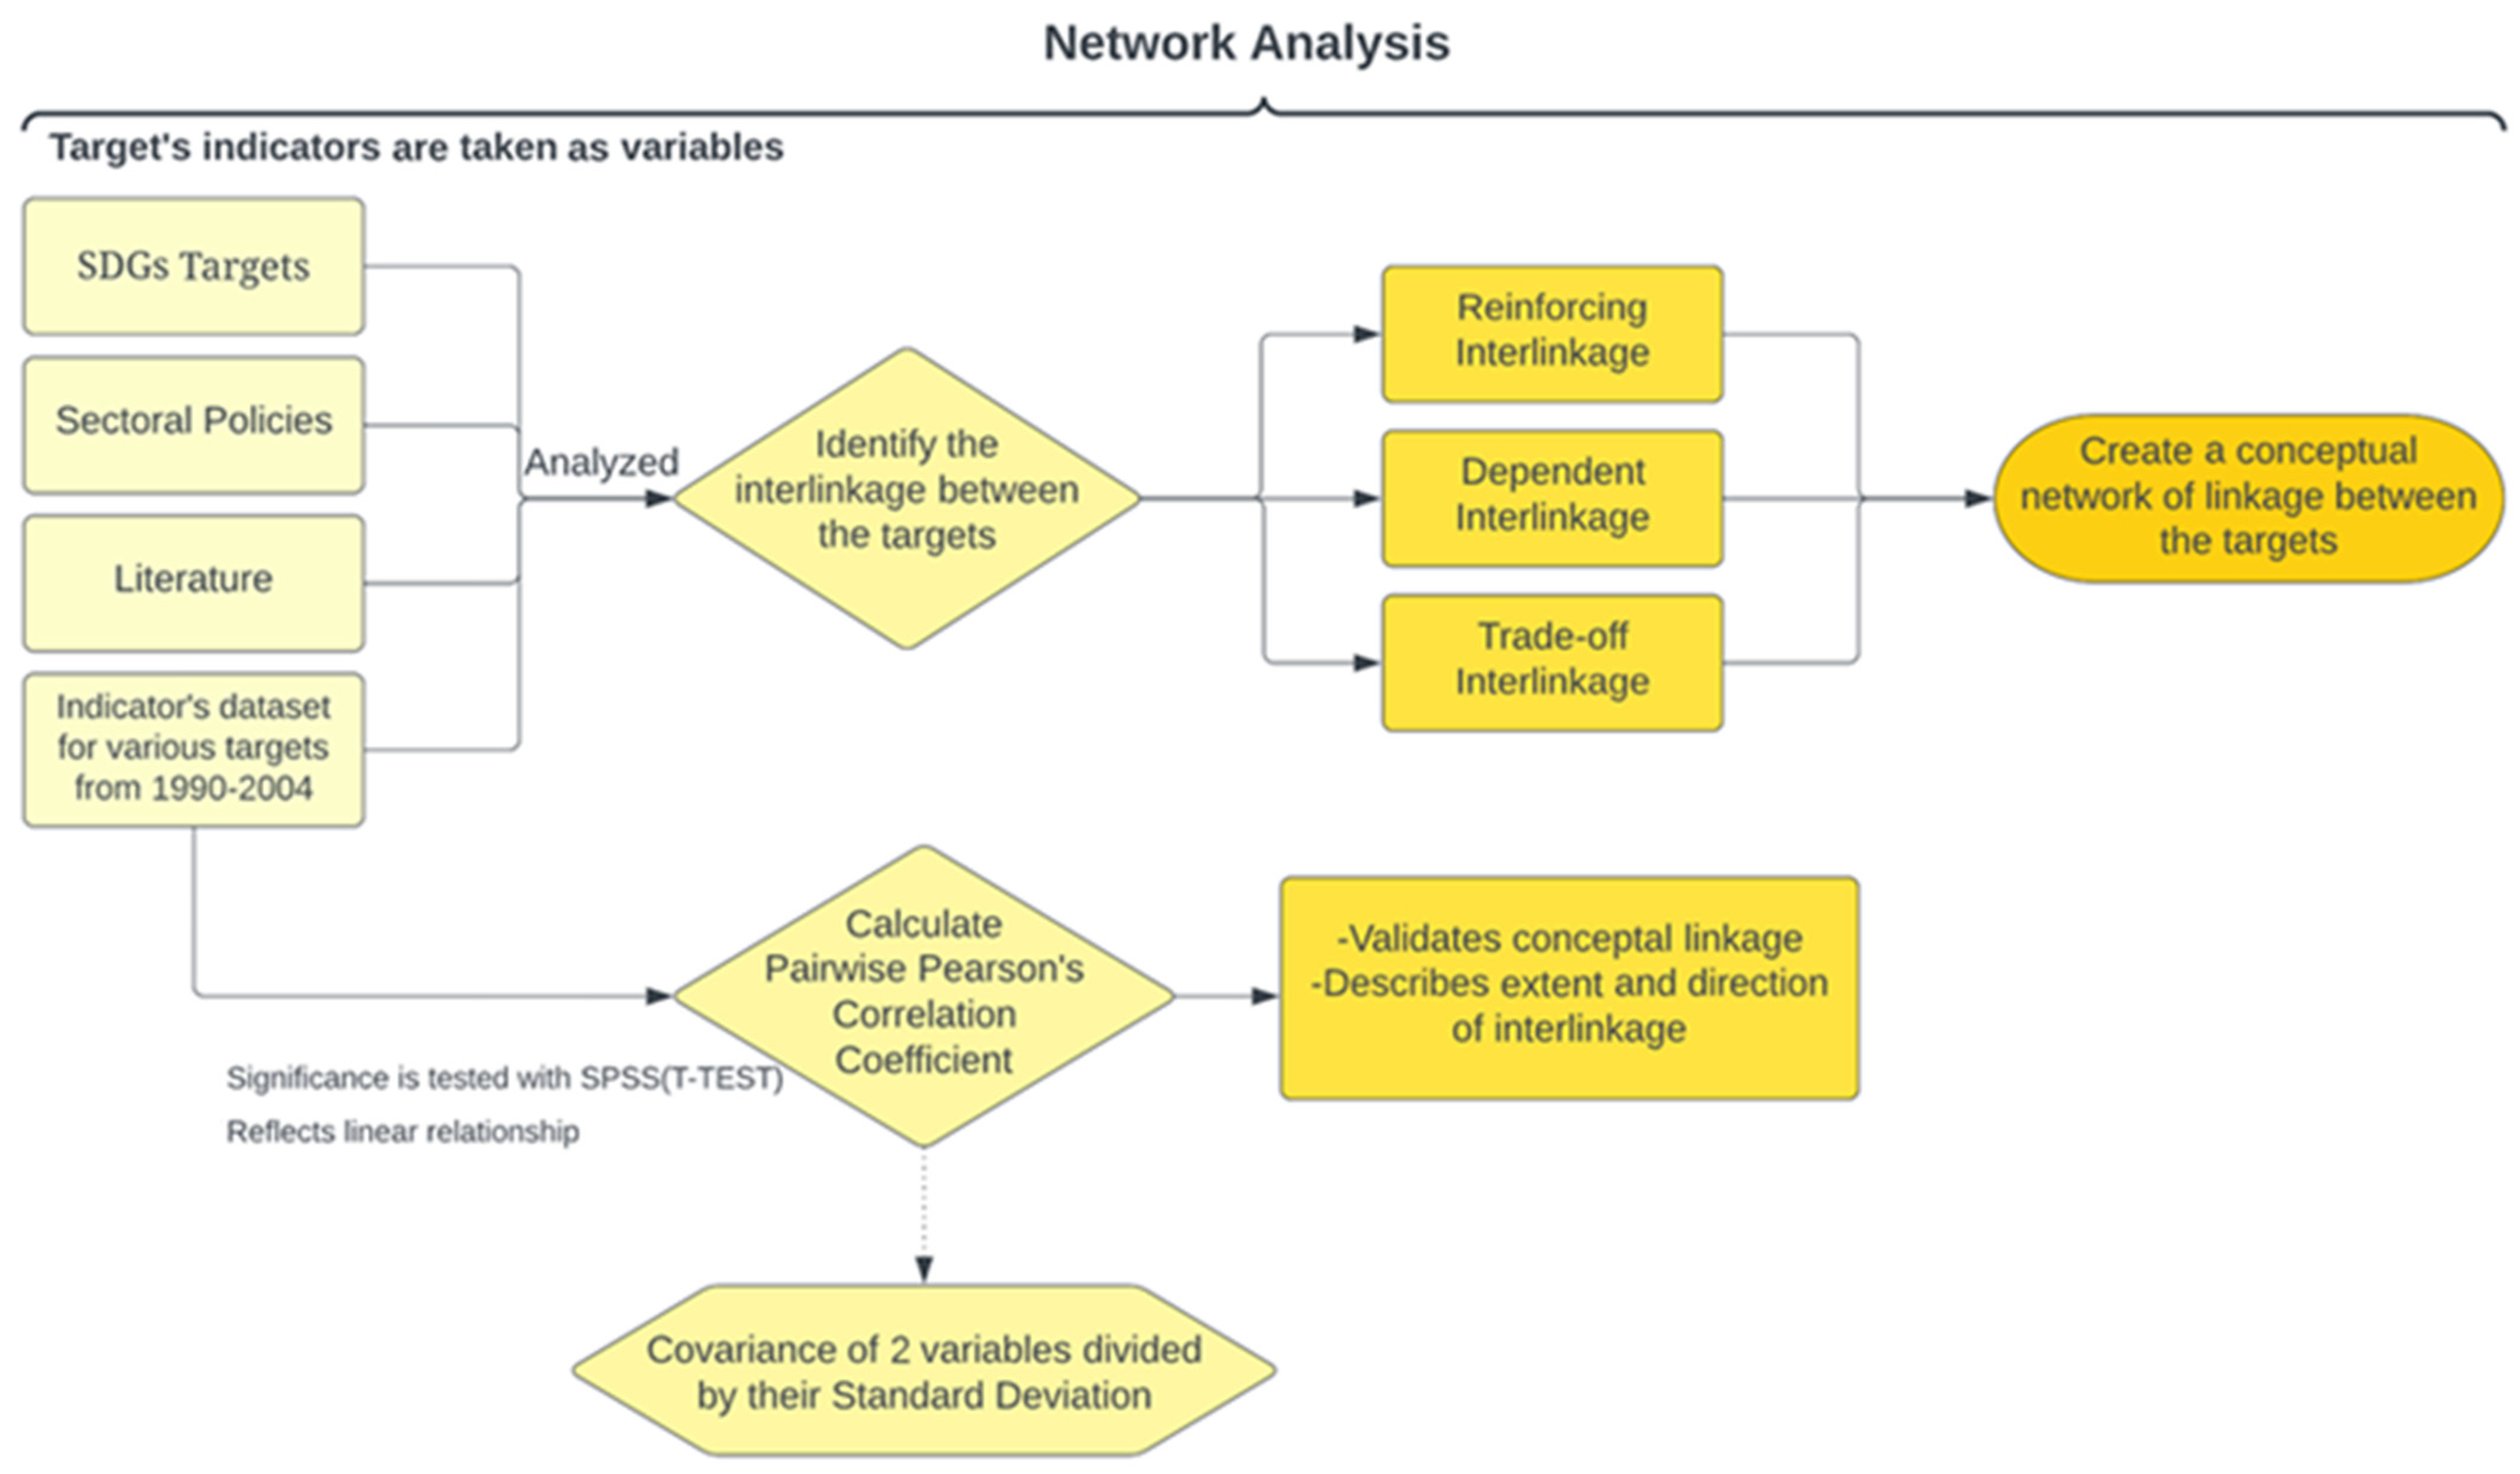
2.2. Network Analysis: Analysis of Extent and Direction of Interlinkages between the SDGs

This study adopts Weitz et al. and Le Blanc’s network analysis with pairwise Pearson’s correlation coefficient to analyze the extent and direction of interlinkages between the SDGs [32,33,34]. This method enables us to identify and examine the type of interaction among SDGs. The qualitative method focused on data collection of indicators for various targets related to SDGs and a literature review concerning linkages between various targets, national and sectoral policies. The description of network analysis carried out in this research is presented in Figure 3. It is based on reflexive iteration of the analysis of data, indication from literature, and understanding corresponding to the theoretical framework [35,36], subjective perceptions, and intuitive field understandings of the authors and internal review.
The nature of interaction is categorized according to reinforcing, dependent, and lastly, trade-off condition. The interaction between two targets that enables or creates additional resources for the achievement of other targets is categorized as reinforcing. Dependent interactions are those where the process taken to reach one target relies on other targets. However, if the interactions between two targets or actions taken to achieve any target create a constraining situation for the achievement of another target or for other developmental action, it is referred to as a trade-off [34]. The linkage identified was then validated with Pearson correlation coefficient, which was attained through pairwise comparison of the indicator data with their statistical significance. This indicates the extent to which the targets among the goal are linearly linked. The extent of correlation coefficient ranges from −1 to +1, where − and + indicate the direction and the number indicates the scope of interaction. The historical datasets for the indicator of the targets between 1990 to 2014 are listed in Appendix A.

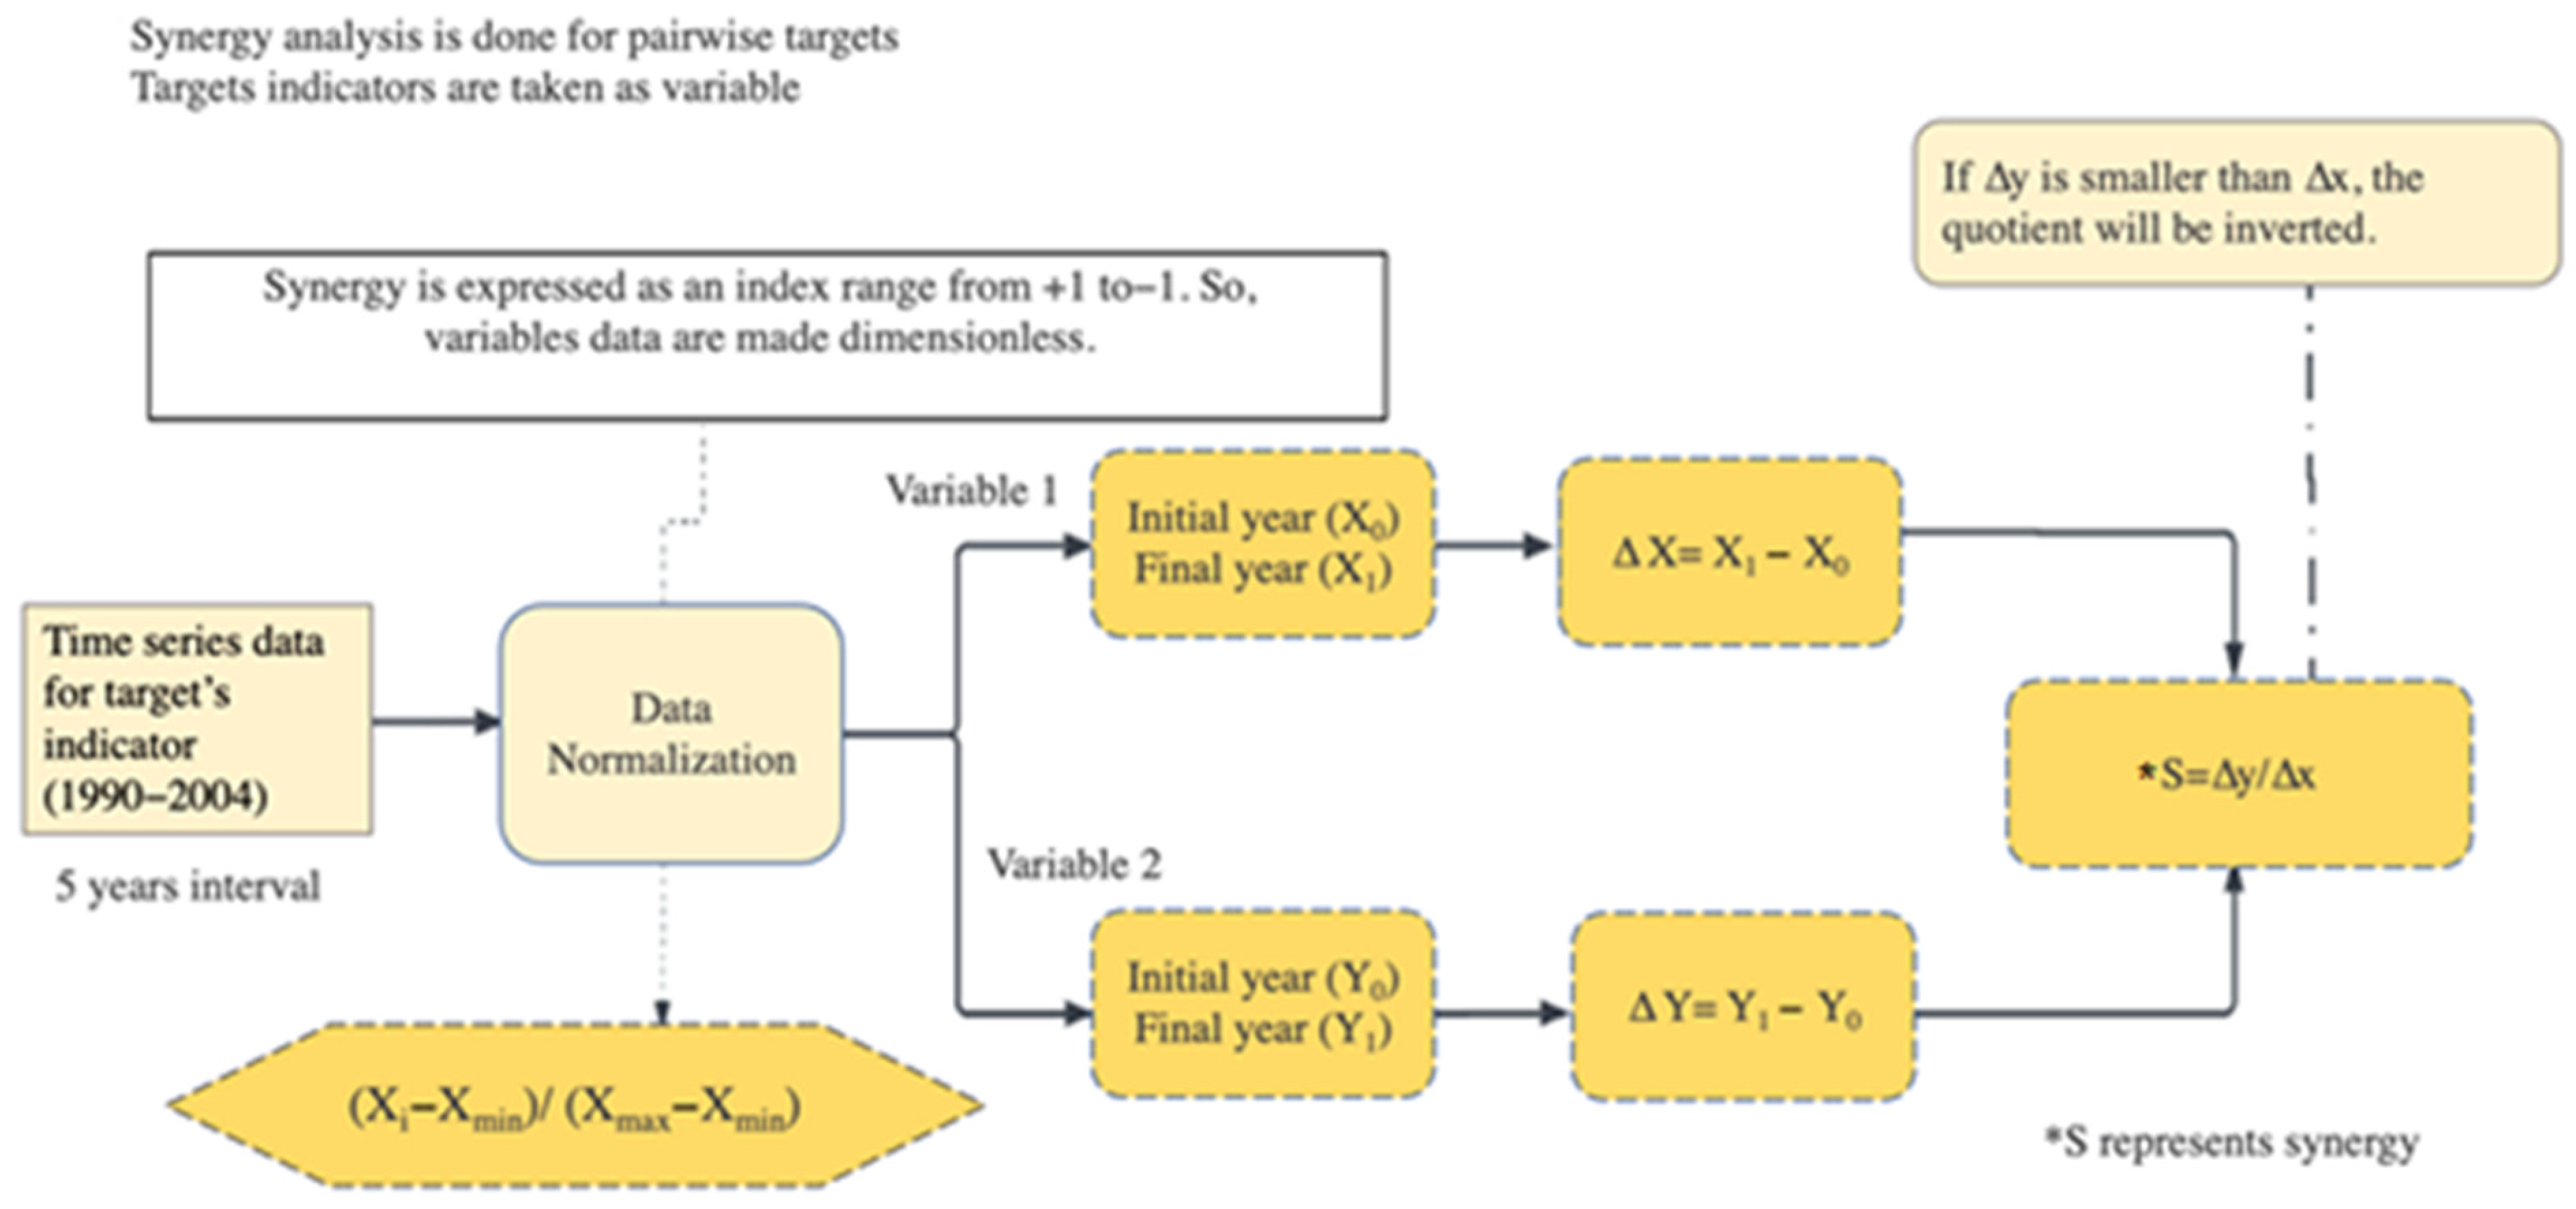
2.3. Advance Sustainability Analysis: Evaluation of Synergy and Trade-Offs between SDGs

This study analyzes the synergy and trade-offs between the SDGs and their associated targets with the application of advance sustainability analysis (ASA) approach. The ASA approach was developed under the European framework programmes (FP6 and FP&) [6] and has been used in various studies for the quantification of synergy and trade-offs [6,37,38,39]. ASA emphasizes the application of an explorative approach that explains the presence of synergy (positive or negative) between two variables. The description of evaluating the synergy and trade-off between SDGs applying ASA is presented in Figure 4. The estimate here is obtained by calculating the ratio between the changes in these trends. This method estimates the possible synergy among the accomplished trends that depicts patterns of development which are in different dimensions of sustainable development [6,38,40]. Here, targets under observation are analyzed to evaluate synergy/trade-off between the two variables representing statistical interaction and is measured by the ratio of relative changes between the two variables in each specific time-period. The variables are normalized in the calculation and the synergy is expressed as an index range from +1 to −1. Minus (−) sign represents a trade-off situation. Synergies have been evaluated for each five-year time span (1990–1994, 1995–1999, 2000–2004, 2005–2009, and 2010–2014). The historical datasets for the indicator of the targets between 1990 to 2014 are listed in Appendix A.

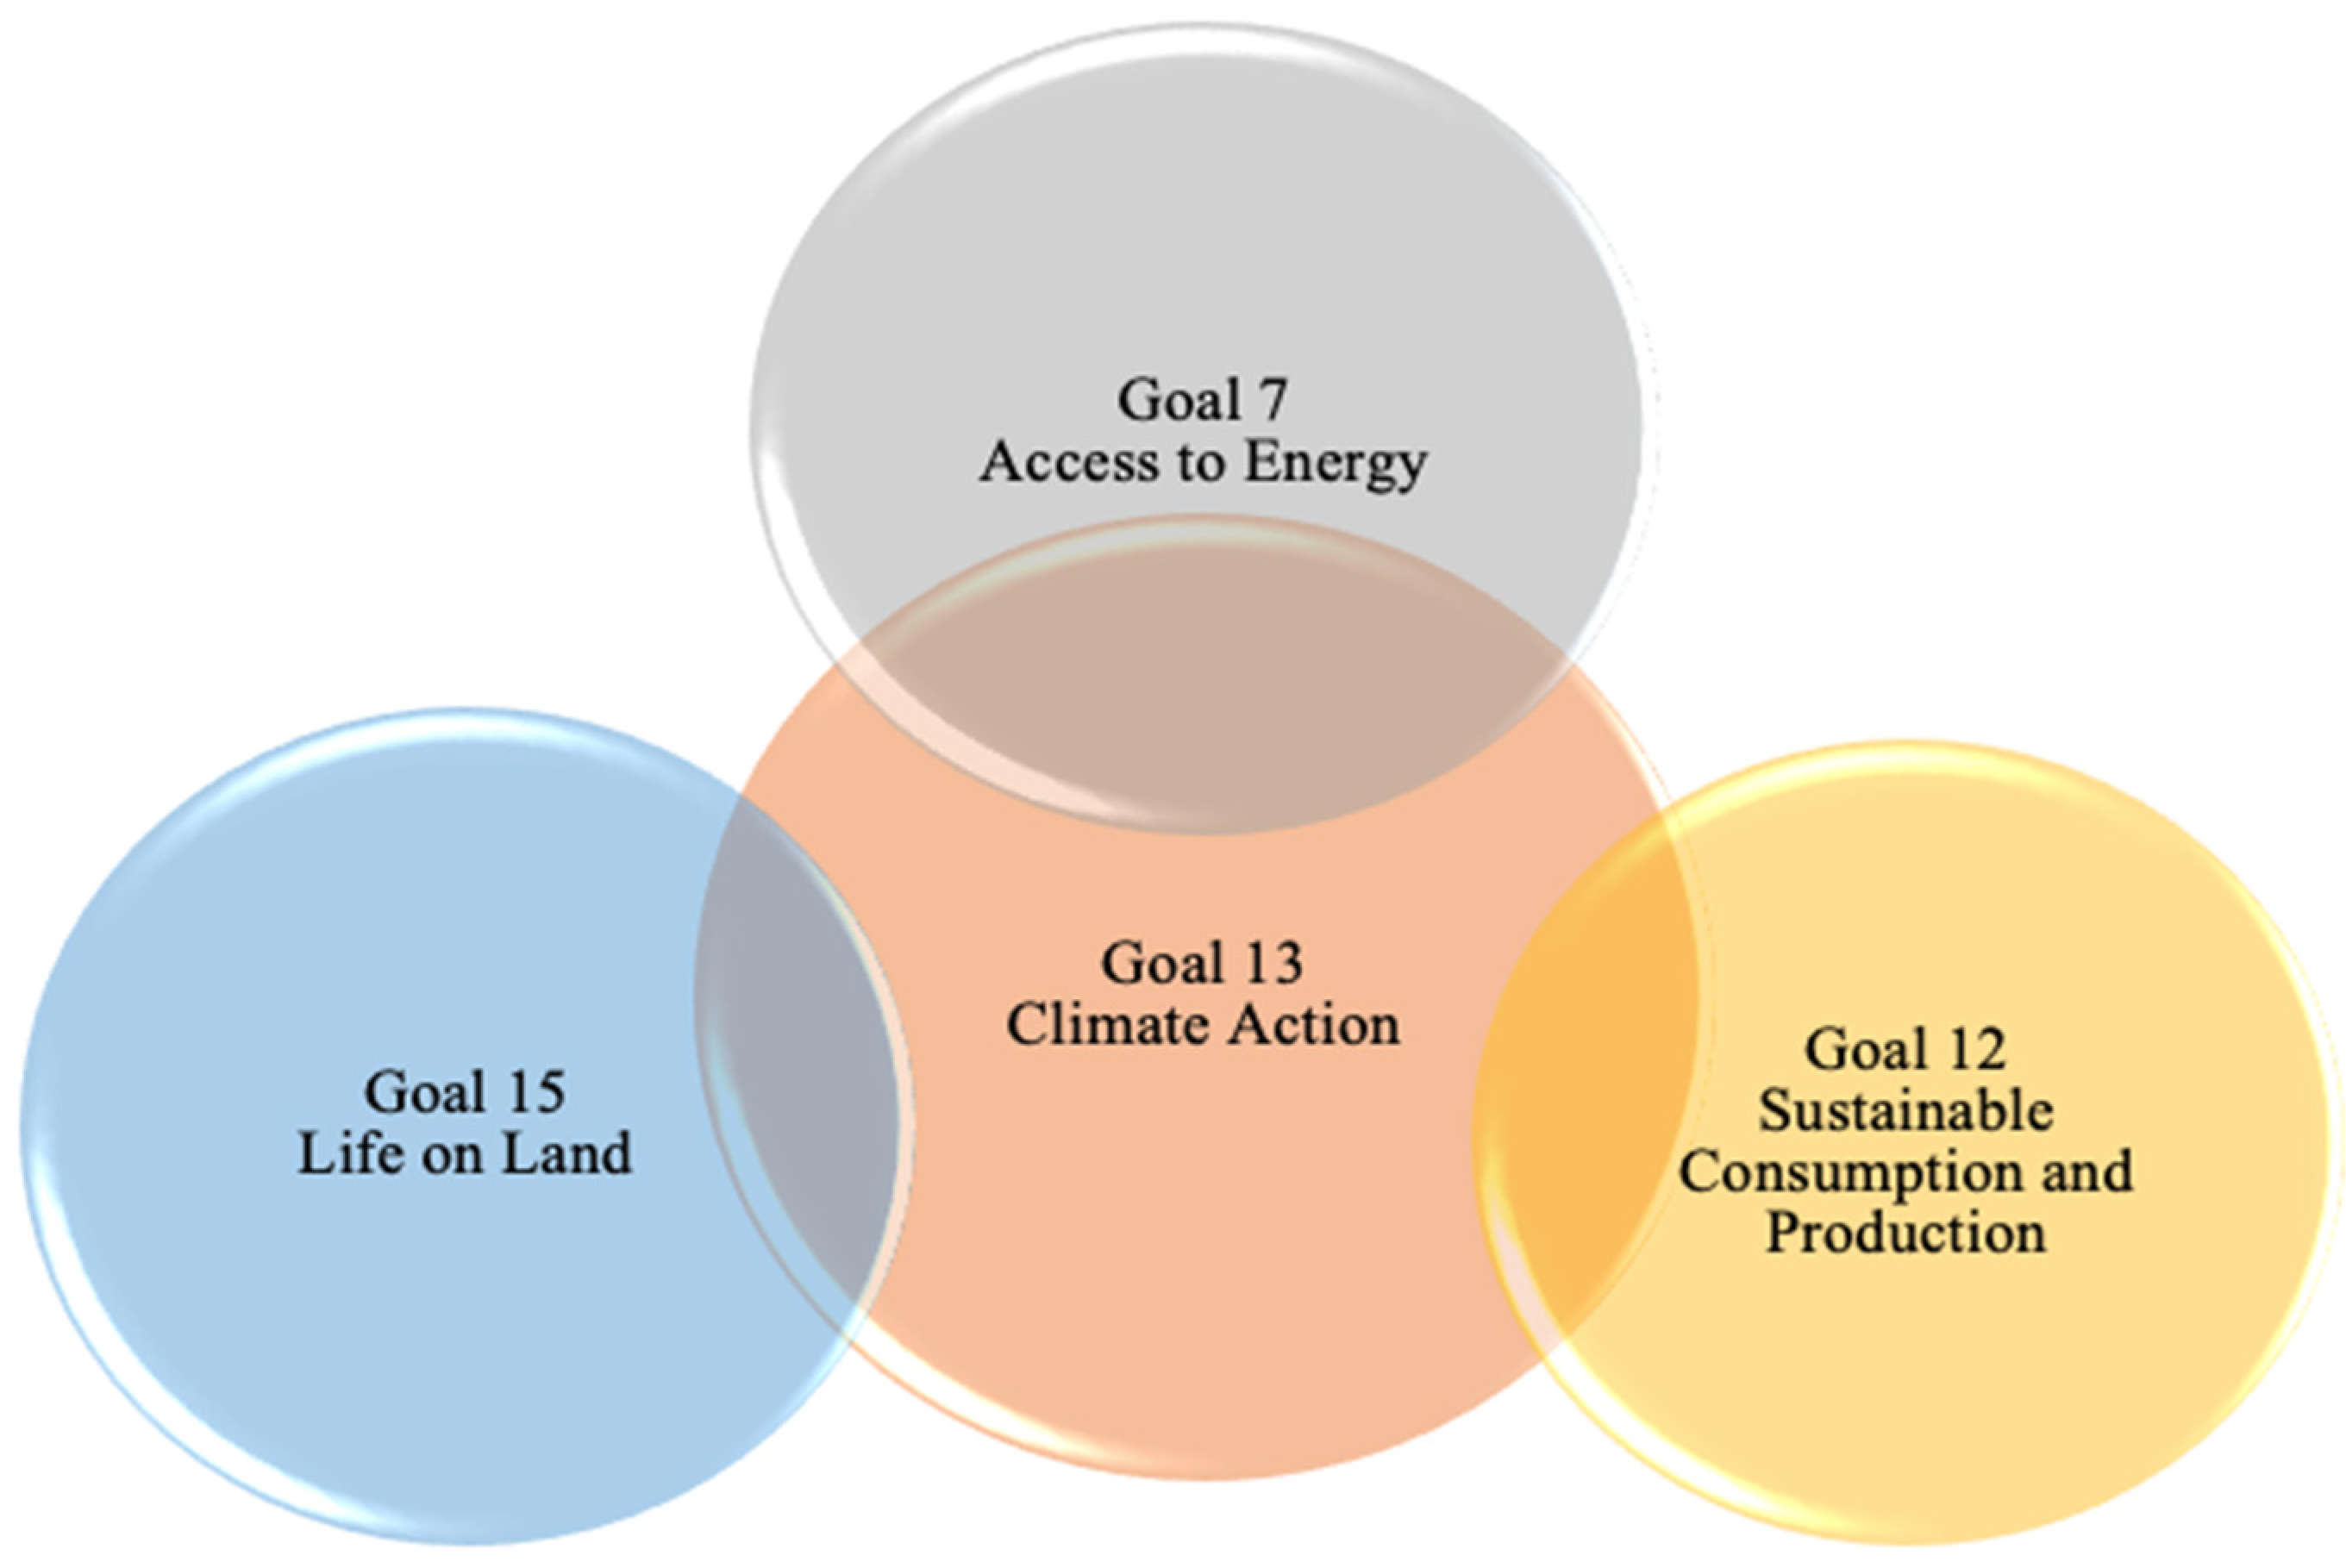
3. Analysis of Interlinkages between the SDGs

Using network analysis with pair-wise Pearson’s correlation coefficient, the four SDGs have been analyzed observing how the targets associated with each of them impact targets of other SDGs (Section 3.1, Section 3.2 and Section 3.3). Based on these analyses, a network of various targets within the four SDGs was plotted, illustrating the linkages (see Section 3.4).

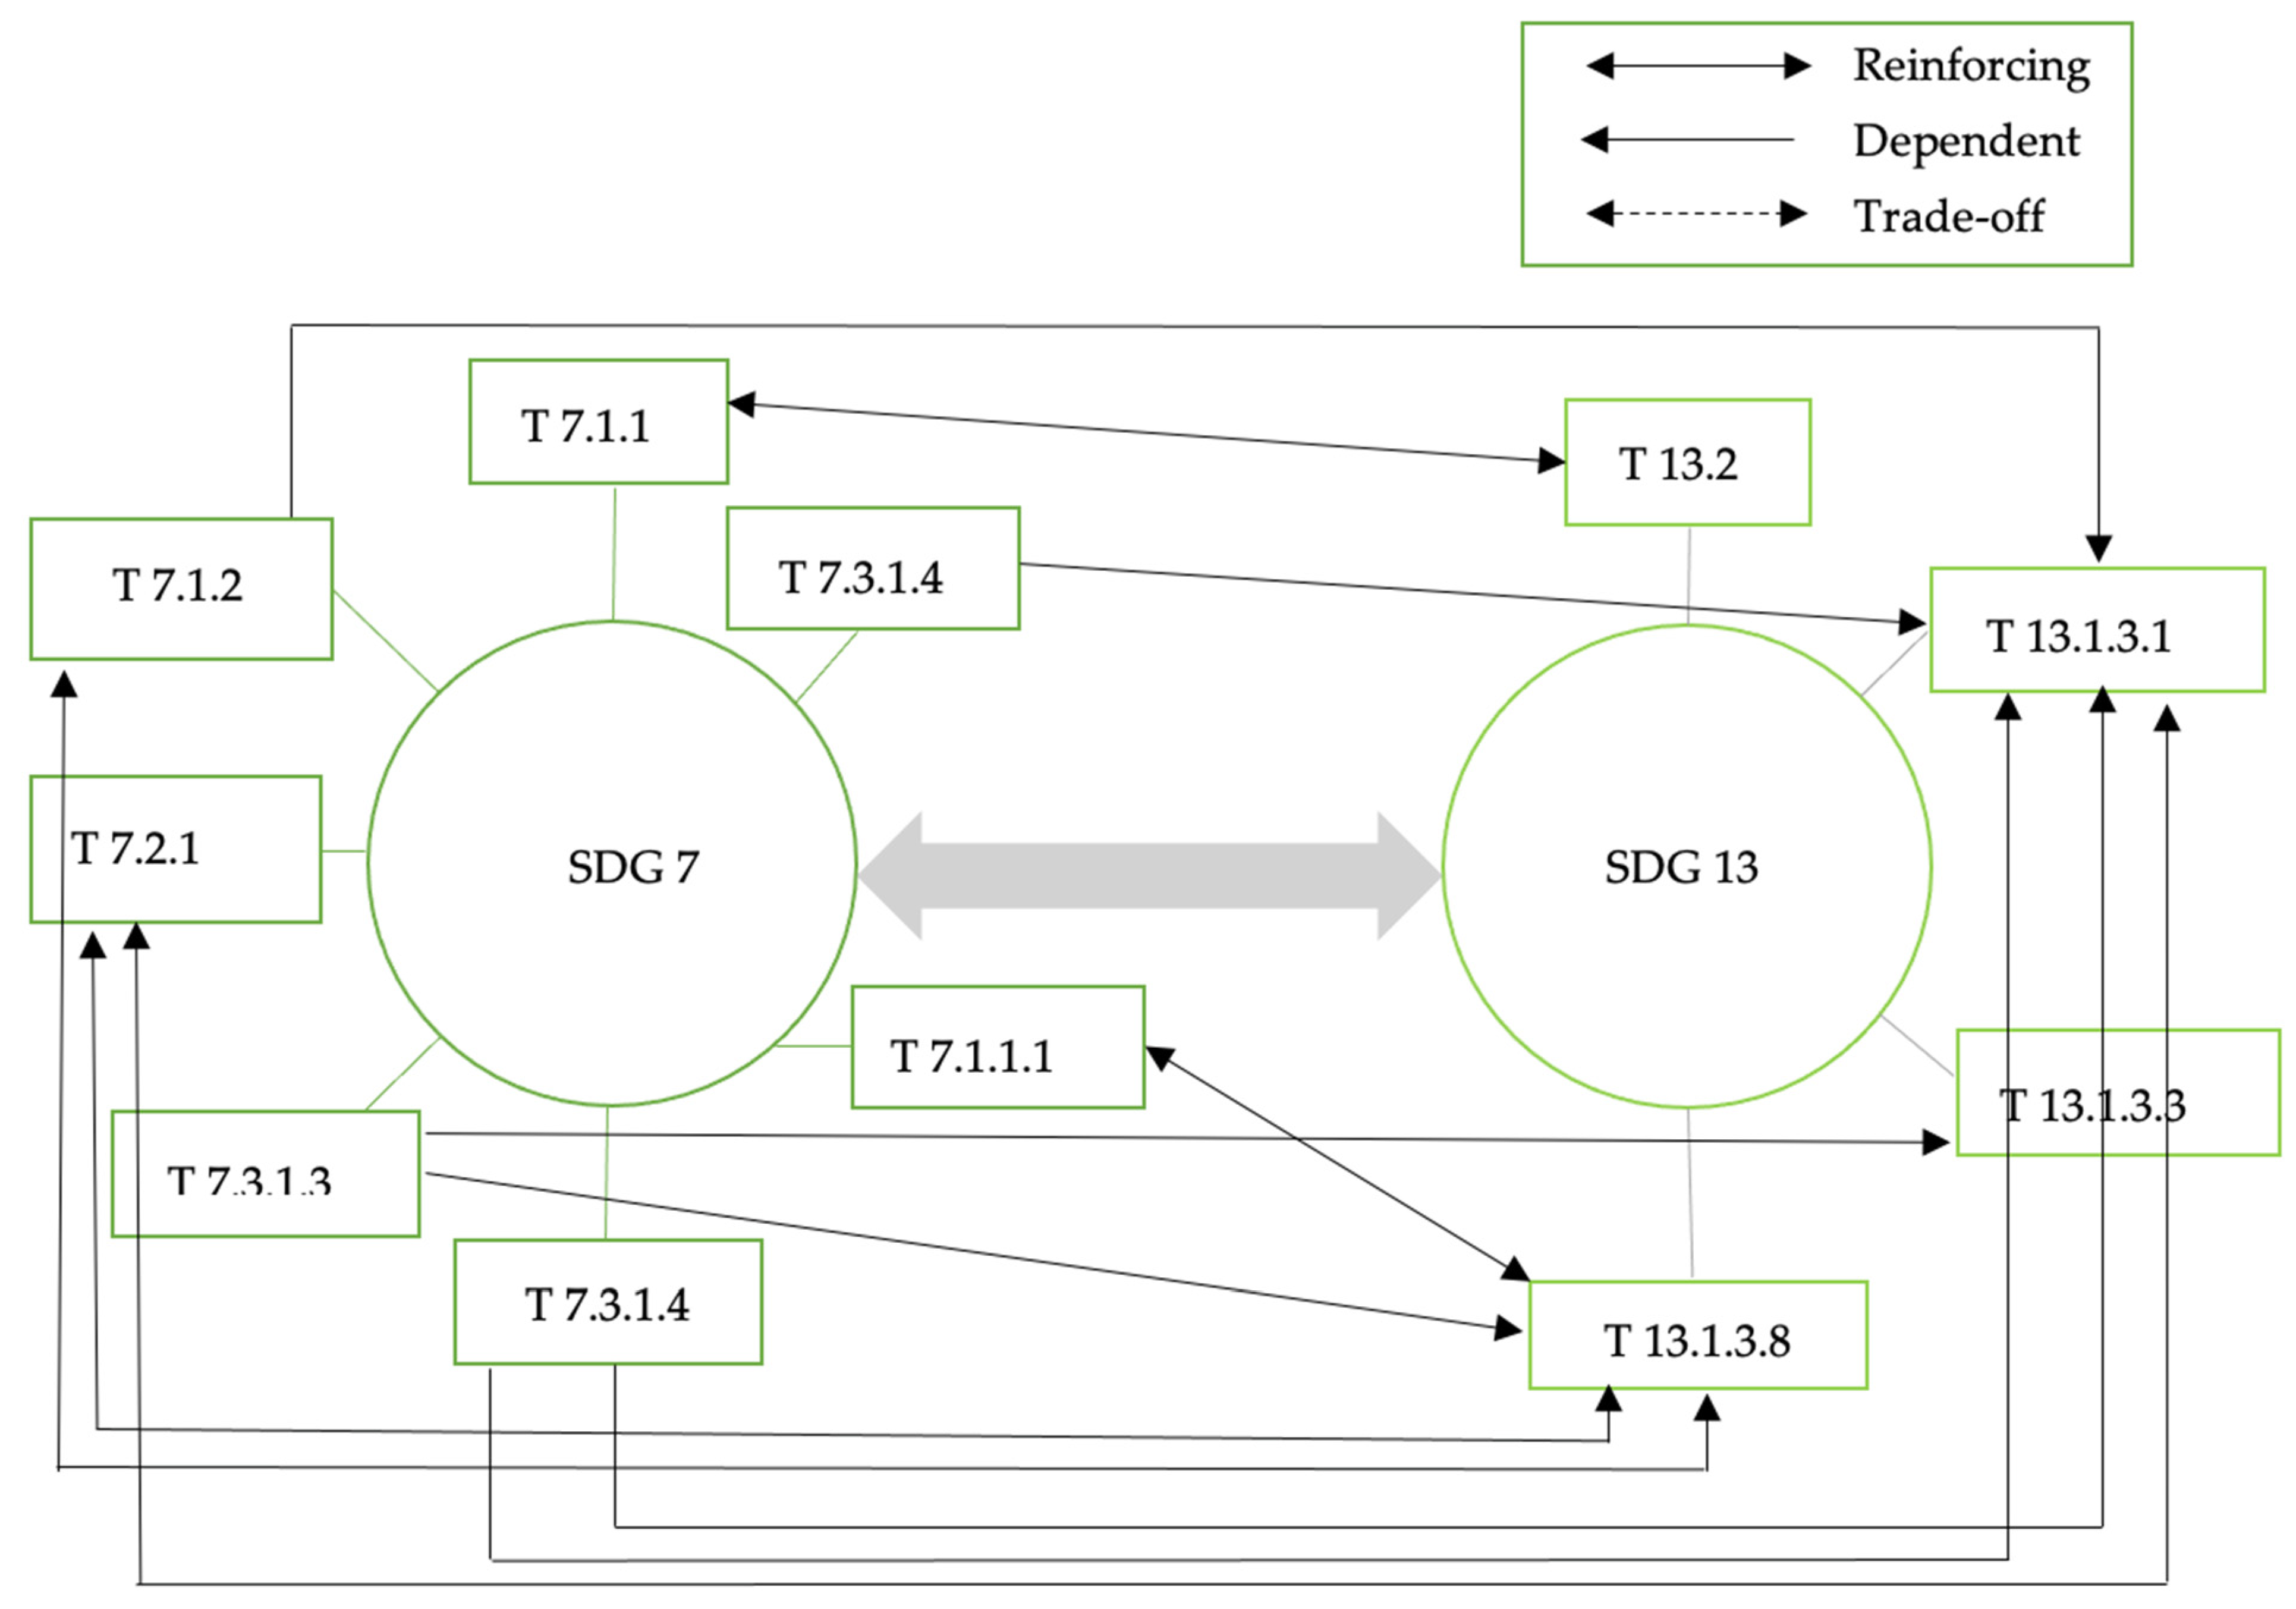
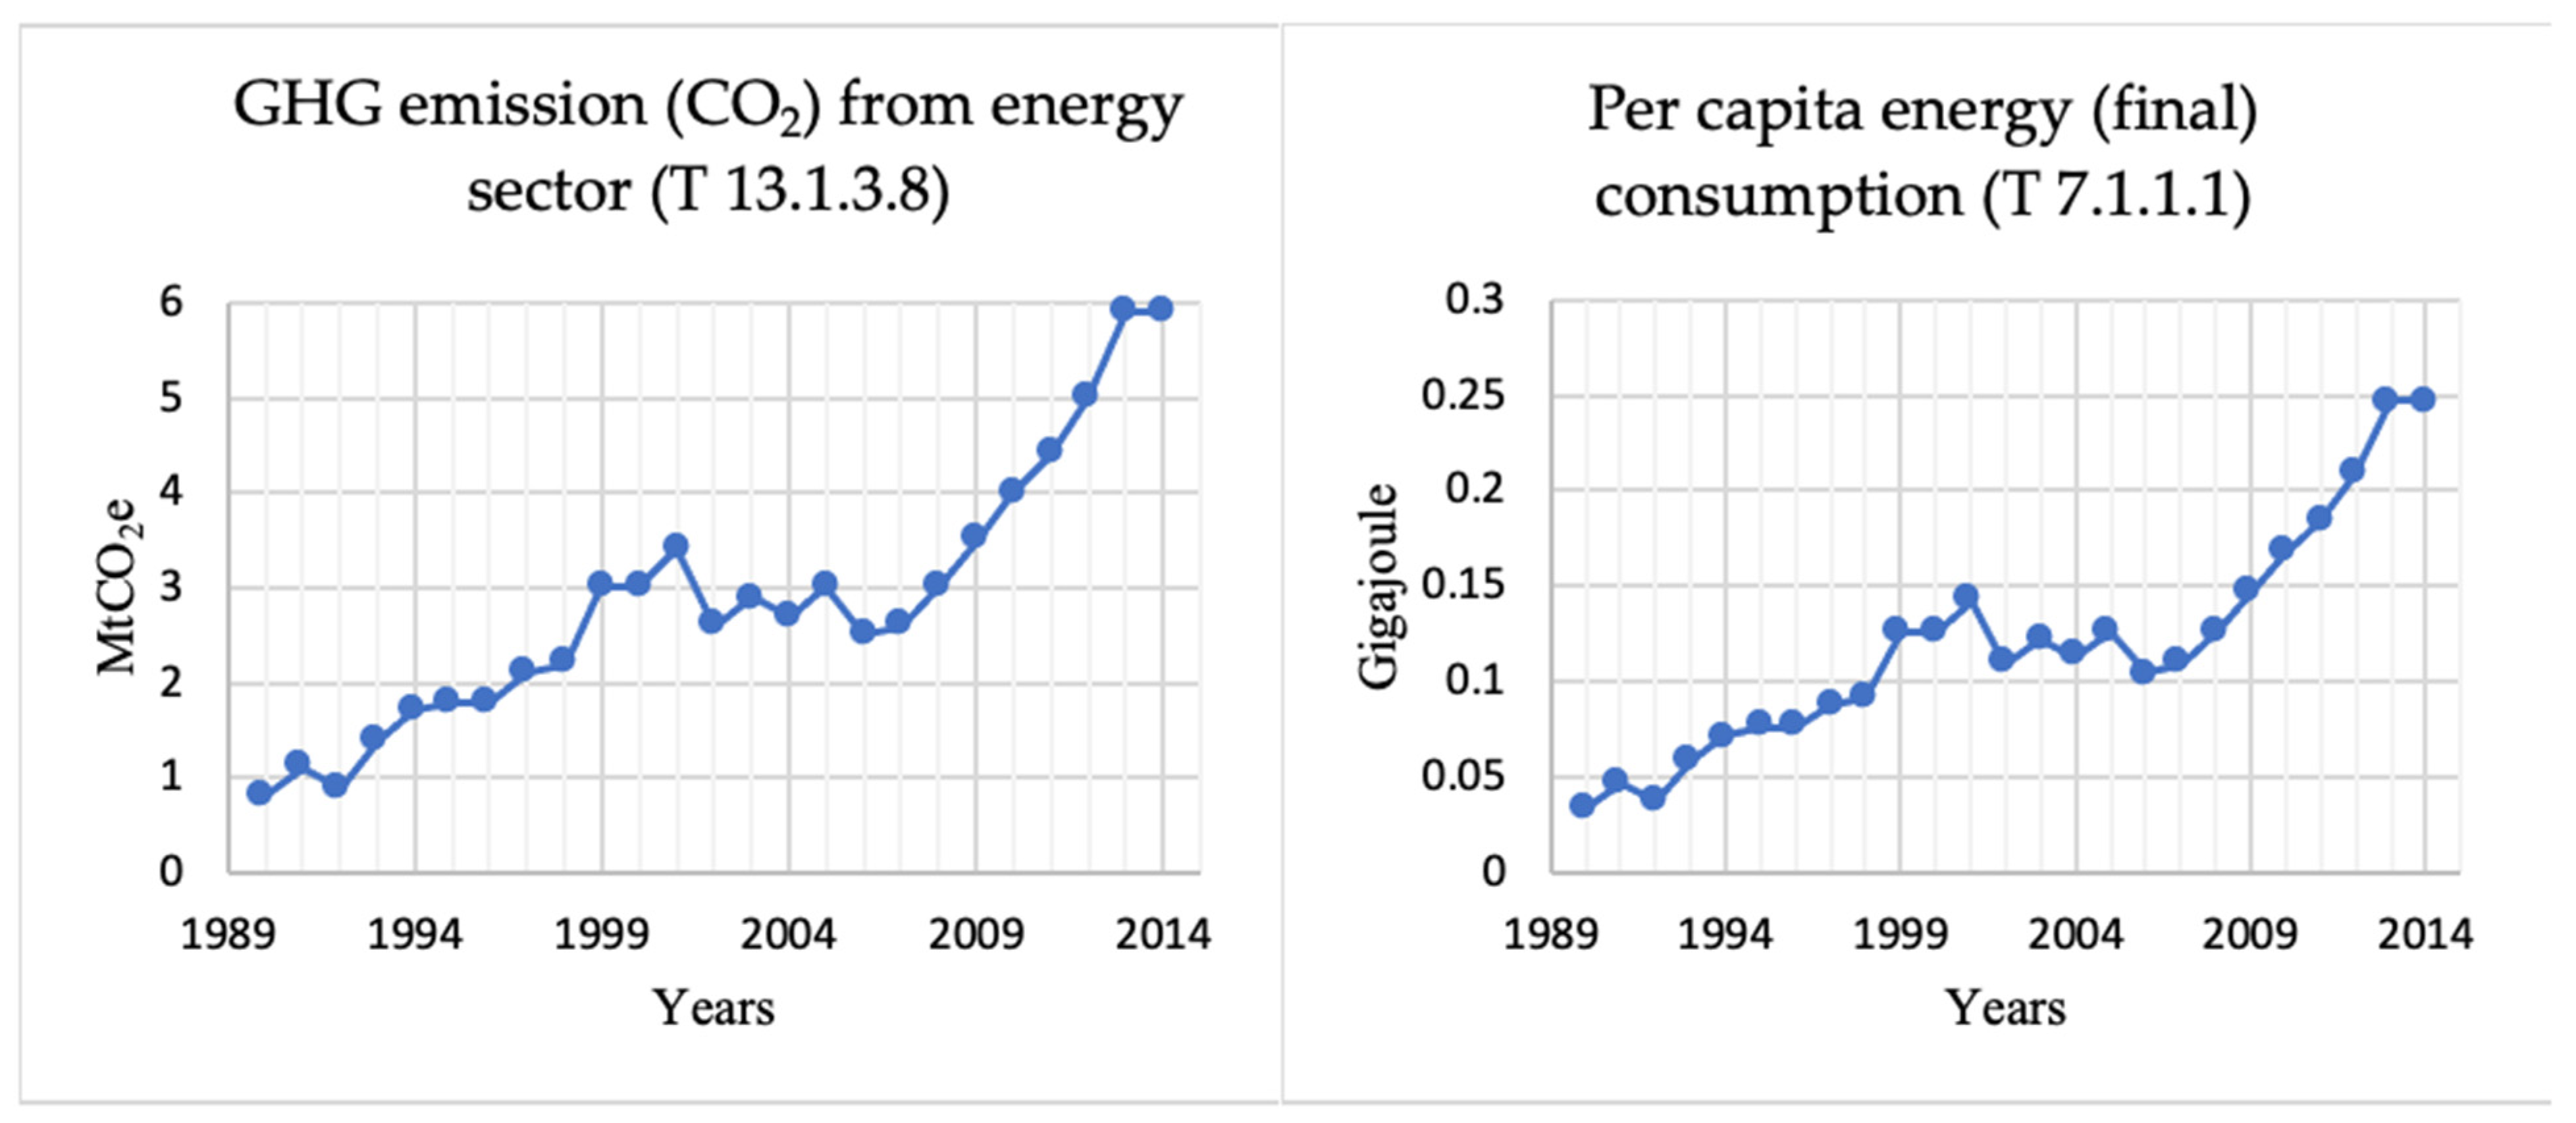
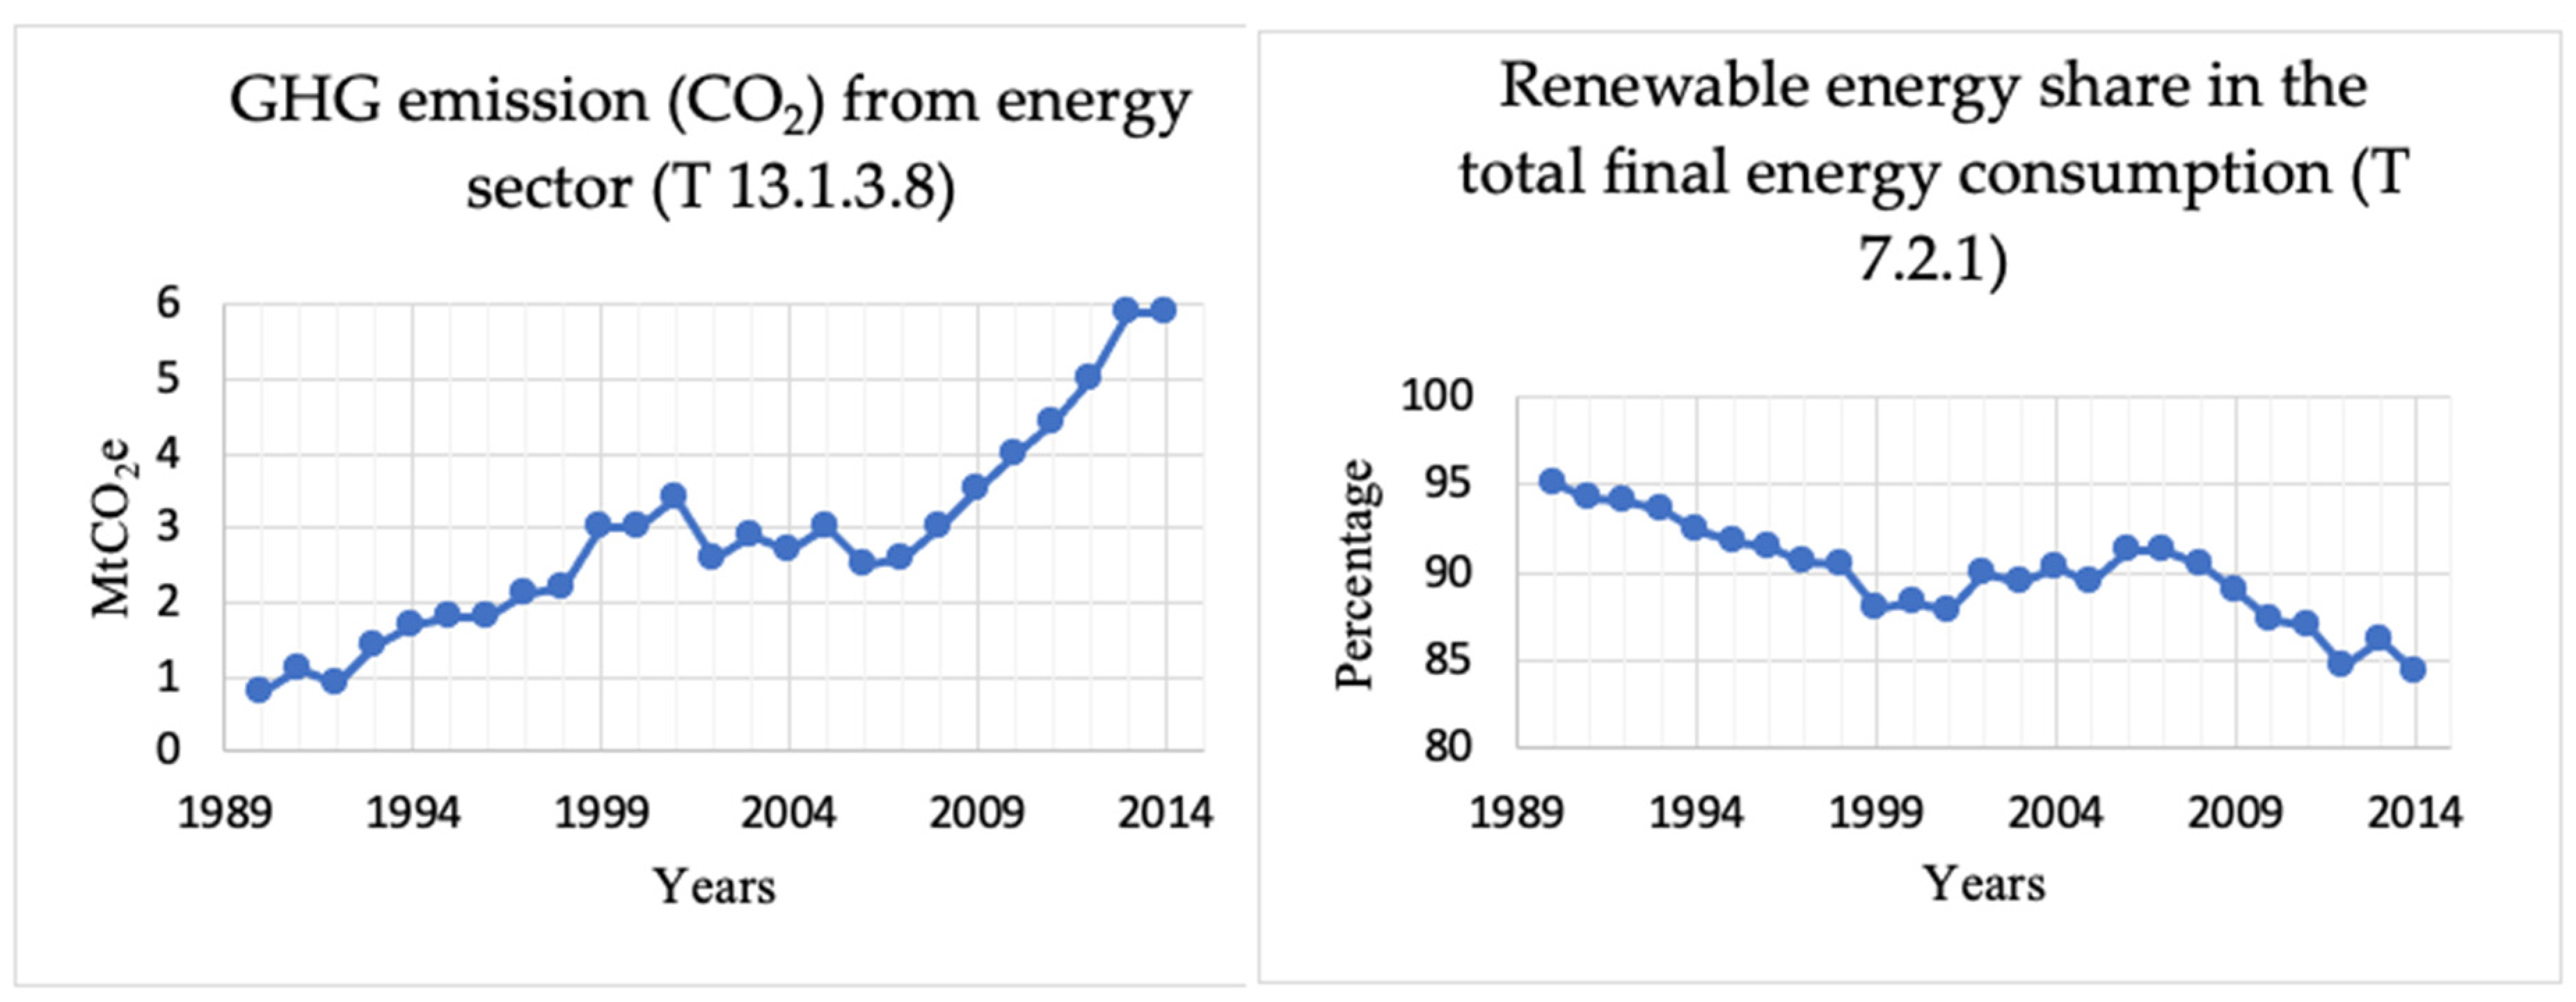
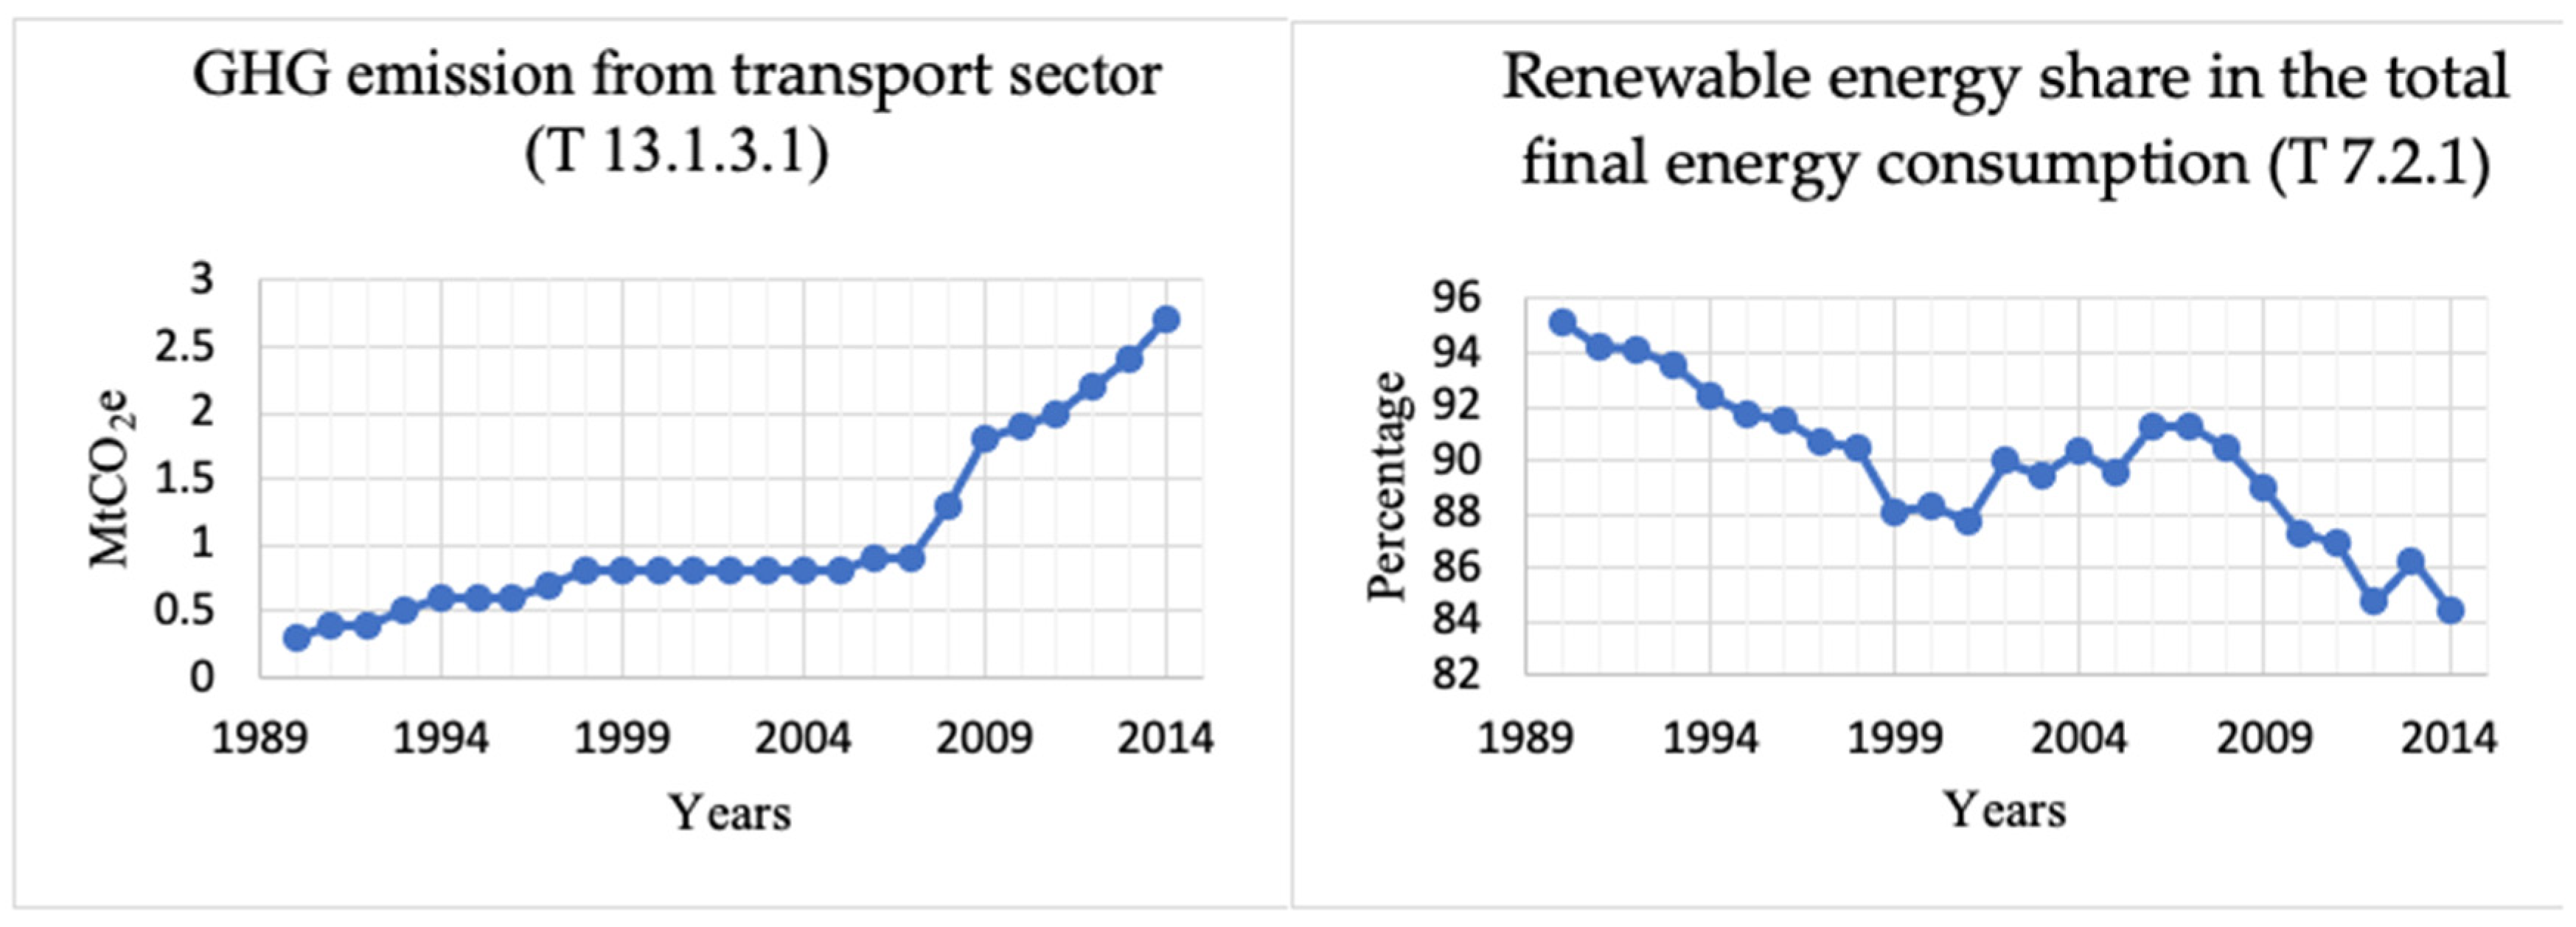
3.1. Linkage between SDG 13 and SDG 7

Our findings show that SDG 7 has an important dimensional linkage with the targets associated to reduction of GHG emission under SDG 13.1; T 13.1.3.2, T 13.1.3.3, and T 13.1.3.8 viz. GHG emission from industrial, commercial, and energy sectors by complementing the growing energy demand with renewable and clean sources of energy (Figure 5). The pair-wise Pearson’s correlation coefficient (presented in Appendix B) among the targets of the goals 13 and 7 was found to be both positive and negative. The emission targets of SDG 13, i.e., T 13.1.3.1 and T 13.1.3.8, were. positively and strongly correlated to the per capita energy consumption target of SDG 7, i.e., T 7.1.1.1, meaning that the use of traditional biomass to meet the primary energy needs and heavy dependence on (imported) fossil fuel for operationalizing the Nepalese transport sector during the time period under analysis contributed significantly to the sectoral emission rate. Thus, as the mode of consumption moves towards renewable energy sources, this presents great potential to reduce the emissions substantially. However, the emission targets of SDG 13 were found to be negatively and strongly correlated to the renewable energy share target of SDG 7, i.e., T 7.2.1, meaning that the input of renewable energy share is not enough to affect the reduction in GHG emission from energy sector.
As Nepal graduates from its LDC status to become a middle-income developing country, approvable by the United Nations General Assembly in 2026, the energy demand in all sectors (e.g., industrial, commercial, residential, transportation, and agricultural) is projected to significantly increase to meet the demand of economic activities [41,42,43]. The GoN in recent years has adopted sustainable energy targets in its nationally determined contributions and other policies as well as strategies emphasizing the importance of access to affordable, reliable, and renewable energy for the overall low carbon development of its economy [44].
Nepal’s target to reach 99% of population with access to electricity (T 7.1.1) by 2030 when put into productive end use can significantly improve the opportunities for income generation, uplifting the livelihood of the people. This can enable vulnerable populations to respond to and recover from stress and shock, thus enhancing the adaptive capacity of the people. The access to electricity if achieved through harvesting clean energy technology can contribute to limiting the rate of GHG emission [45]. As the primary energy need was met through traditional biomass during the time under analysis [46,47,48,49], infiltration of non-emission energy source, such as acceleration of hydropower and other renewable energy sources, such as solar and wind, can aid in limiting the emission from the Nepalese energy sector. Hence, this can have a reinforcing linkage with increasing the ability to adapt to climate change impacts (T 13.2). As electricity is a clean source of energy via hydropower in context of Nepal [46], per capita energy consumption (T 7.1.1.1) is seen to also have a reinforcing linkage with the emission reduction target from energy (T 13.1.3.8). As energy consumption can cause an increase in GHG emission (in short term), an increase in energy consumption can lead to an increase of emissions (in the long run). Furthermore, as Nepalese economic activities start to grow to meets its goal of becoming a middle-income country, the reinforcing linkage can be seen in the long run due to the acceleration of economic activities and demand to increase energy consumption related to the rise in emission [50].
During the time-period of analysis under the study (1990–2018), traditional biomass, such as firewood and agricultural residue, was heavily used in the rural areas to meet the energy demand [47,48]. Even though biomass is considered a renewable source of energy, its usage through low efficient technology, such as traditional biomass-fired stoves, led to substantial GHG emissions due to the formation of biproducts of incomplete combustion [49]. The traditional biomass accounted for 49% of energy consumption for cooking where only 6% of the cooking service demand was met by modern fuel, e.g., electricity, LPG, and biogas, in 2017 [51]. The extensive use of traditional biomass fuels also adds daily financial burden in rural areas and contributes to deforestation (which makes it harder to find firewood and raises the cost and collection time) and increases GHG emissions in poor and developing nations such as Nepal where access to clean energy is limited and unreliable [52]. Further, 90% of primary energy consumption of Nepal was delivered by biomass resources, making forests the major source. The sustainable fuelwood yield of Nepal’s forest was found to be far less than the total consumption, which has caused severe forest degradation [48,49]. Therefore, target to increase the proportion of population with primary reliance on clean fuels and technology (T 7.1.2) can be seen to have a reinforcing linkage with the reduction of GHG emission from the energy sector (T 13.1.3.8). Similarly, the target to increase the share of renewable energy in the total final energy consumption (T 7.2.1) to 50% by 2030 has reinforcing linkages with the target associated to emission reduction from the energy sector (T 13.1.3.8). It has been widely accepted that the increase in economic activities though the usage of traditional energy sources, e.g., fossil fuel consumption, biomass, and subsequent deforestation represent the major factor increasing GHG emissions from the energy sector [53]. Substituting the emission intensive energy sources with renewable technology can thus aid in reducing the sectoral emission.
The expansion of renewable energy share in total final consumption (T 7.2.1) for the electrification of transport sector can be beneficial in reducing the GHG emission from transport sector (T 13.1.3.1), as bridging the gap between transport and energy is crucial for low GHG emission, sustainable electric mobility. The deployment of other renewable energy technologies (RETs) besides hydropower, such as solar and biofuels, holds vast potential through the expansion of the energy mix. The diffusion of electric vehicles (EVs) in the current transport system (T 7.3.1.4) can play a crucial role in the realization of target T 13.1.3.1 [52] as EVs can offer environmentally friendly, emission-free urban mobility. When it comes to energy, EVs can provide a clean, sustainable, and balanced energy alternative that is economic and environmentally beneficial, significantly more so with the use of renewable energy sources [54]. Therefore, T 7.2.1 is seen to have reinforcing link with T 13.1.3.1 as it can aid in reducing the sectoral emissions, whereas T 7.3.1.4 that aims to increase the share of EVs in public transport is seen to have a dependent linkage with T 13.1.3.1 as EVs in public transport can aid in reducing the emissions from the transport system and emission reduction relies on the attainment of the T 7.3.1.4.
In regard to residential and commercial energy use, GoN’s energy policies, strategies, and action plans are supply side oriented and fail to incorporate the loss in terms of distribution, transmission, and equipment on the demand side [55]. This has resulted in the loss of unaccounted energy, especially electricity through a lack of prioritization based on efficiency. Therefore, energy conservation through efficiency and fossil fuel switching can further enhance the track change of emission rate from the business-as-usual scenario, which is based on consuming an emission intensive energy source. Hence, the target to increase the energy efficiency in both residential and commercial sectors (T 7.3.1.3) can benefit the achievement of GHG emission reduction targets from industrial, commercial, and energy sector, i.e., T 13.1.3.3 and T 13.1.3.8. Therefore, the linkage between these targets is dependent in nature as the achievement of the energy efficiency target can complement the emission reduction targets.

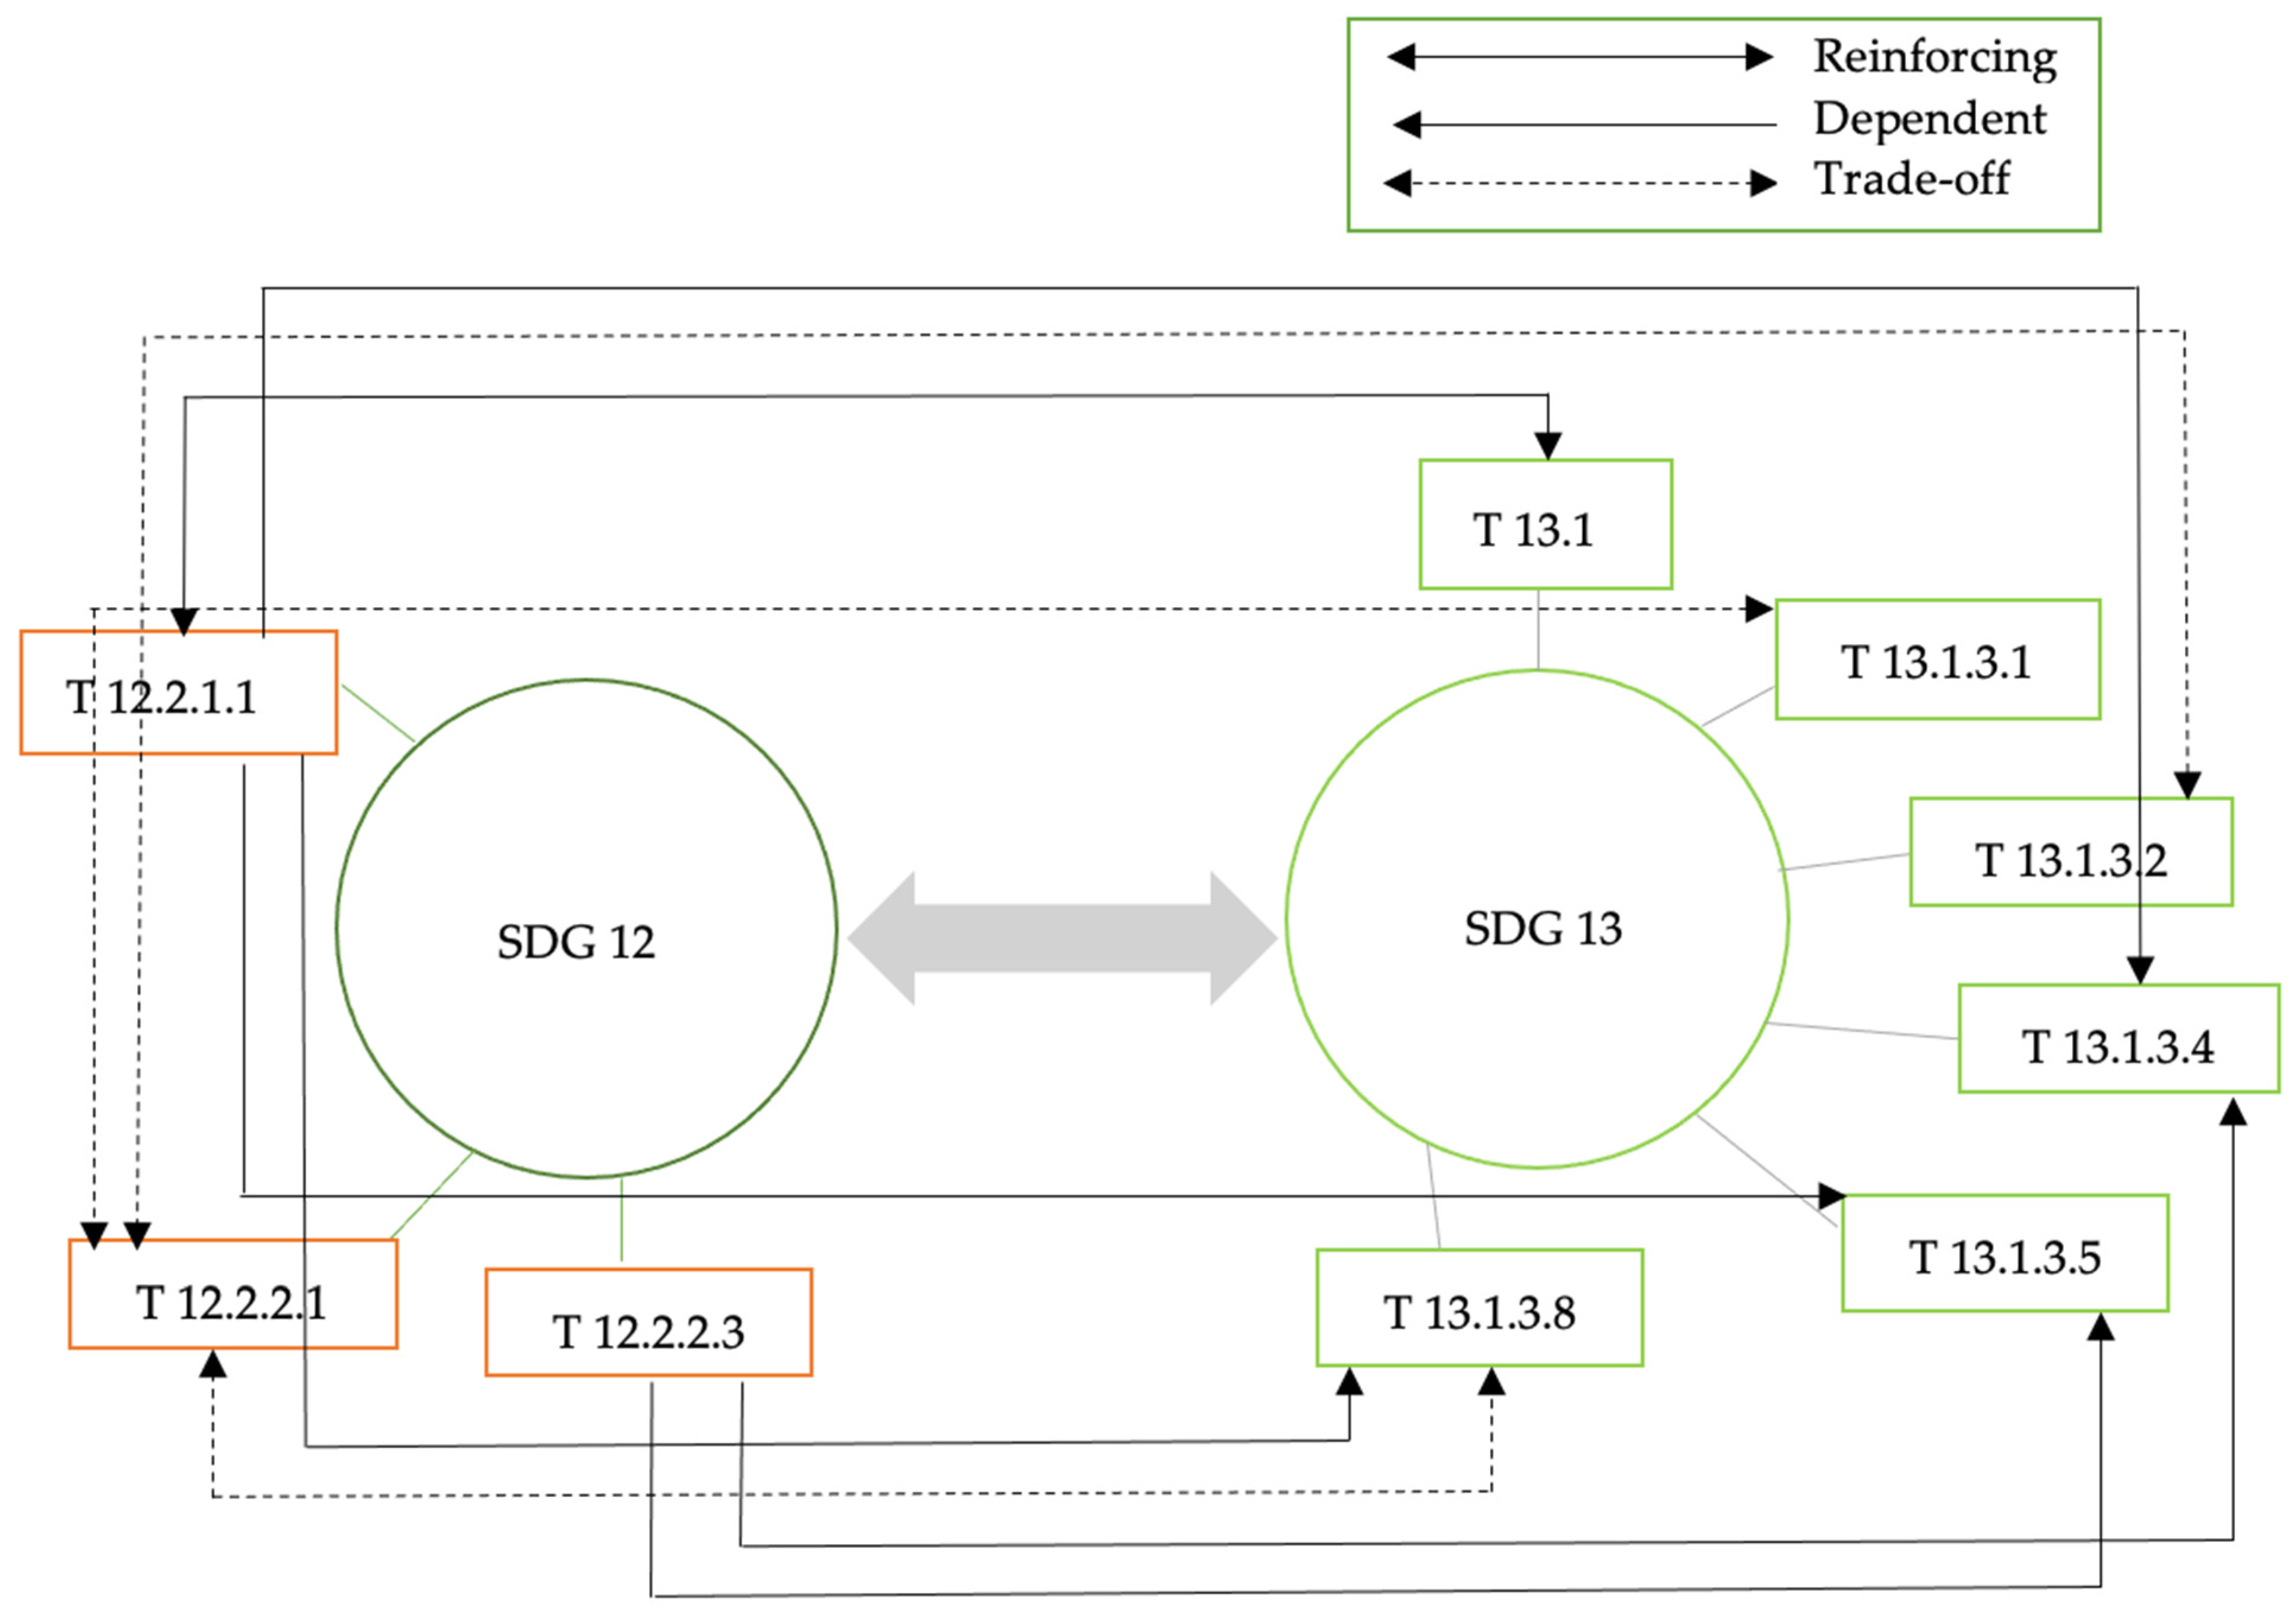
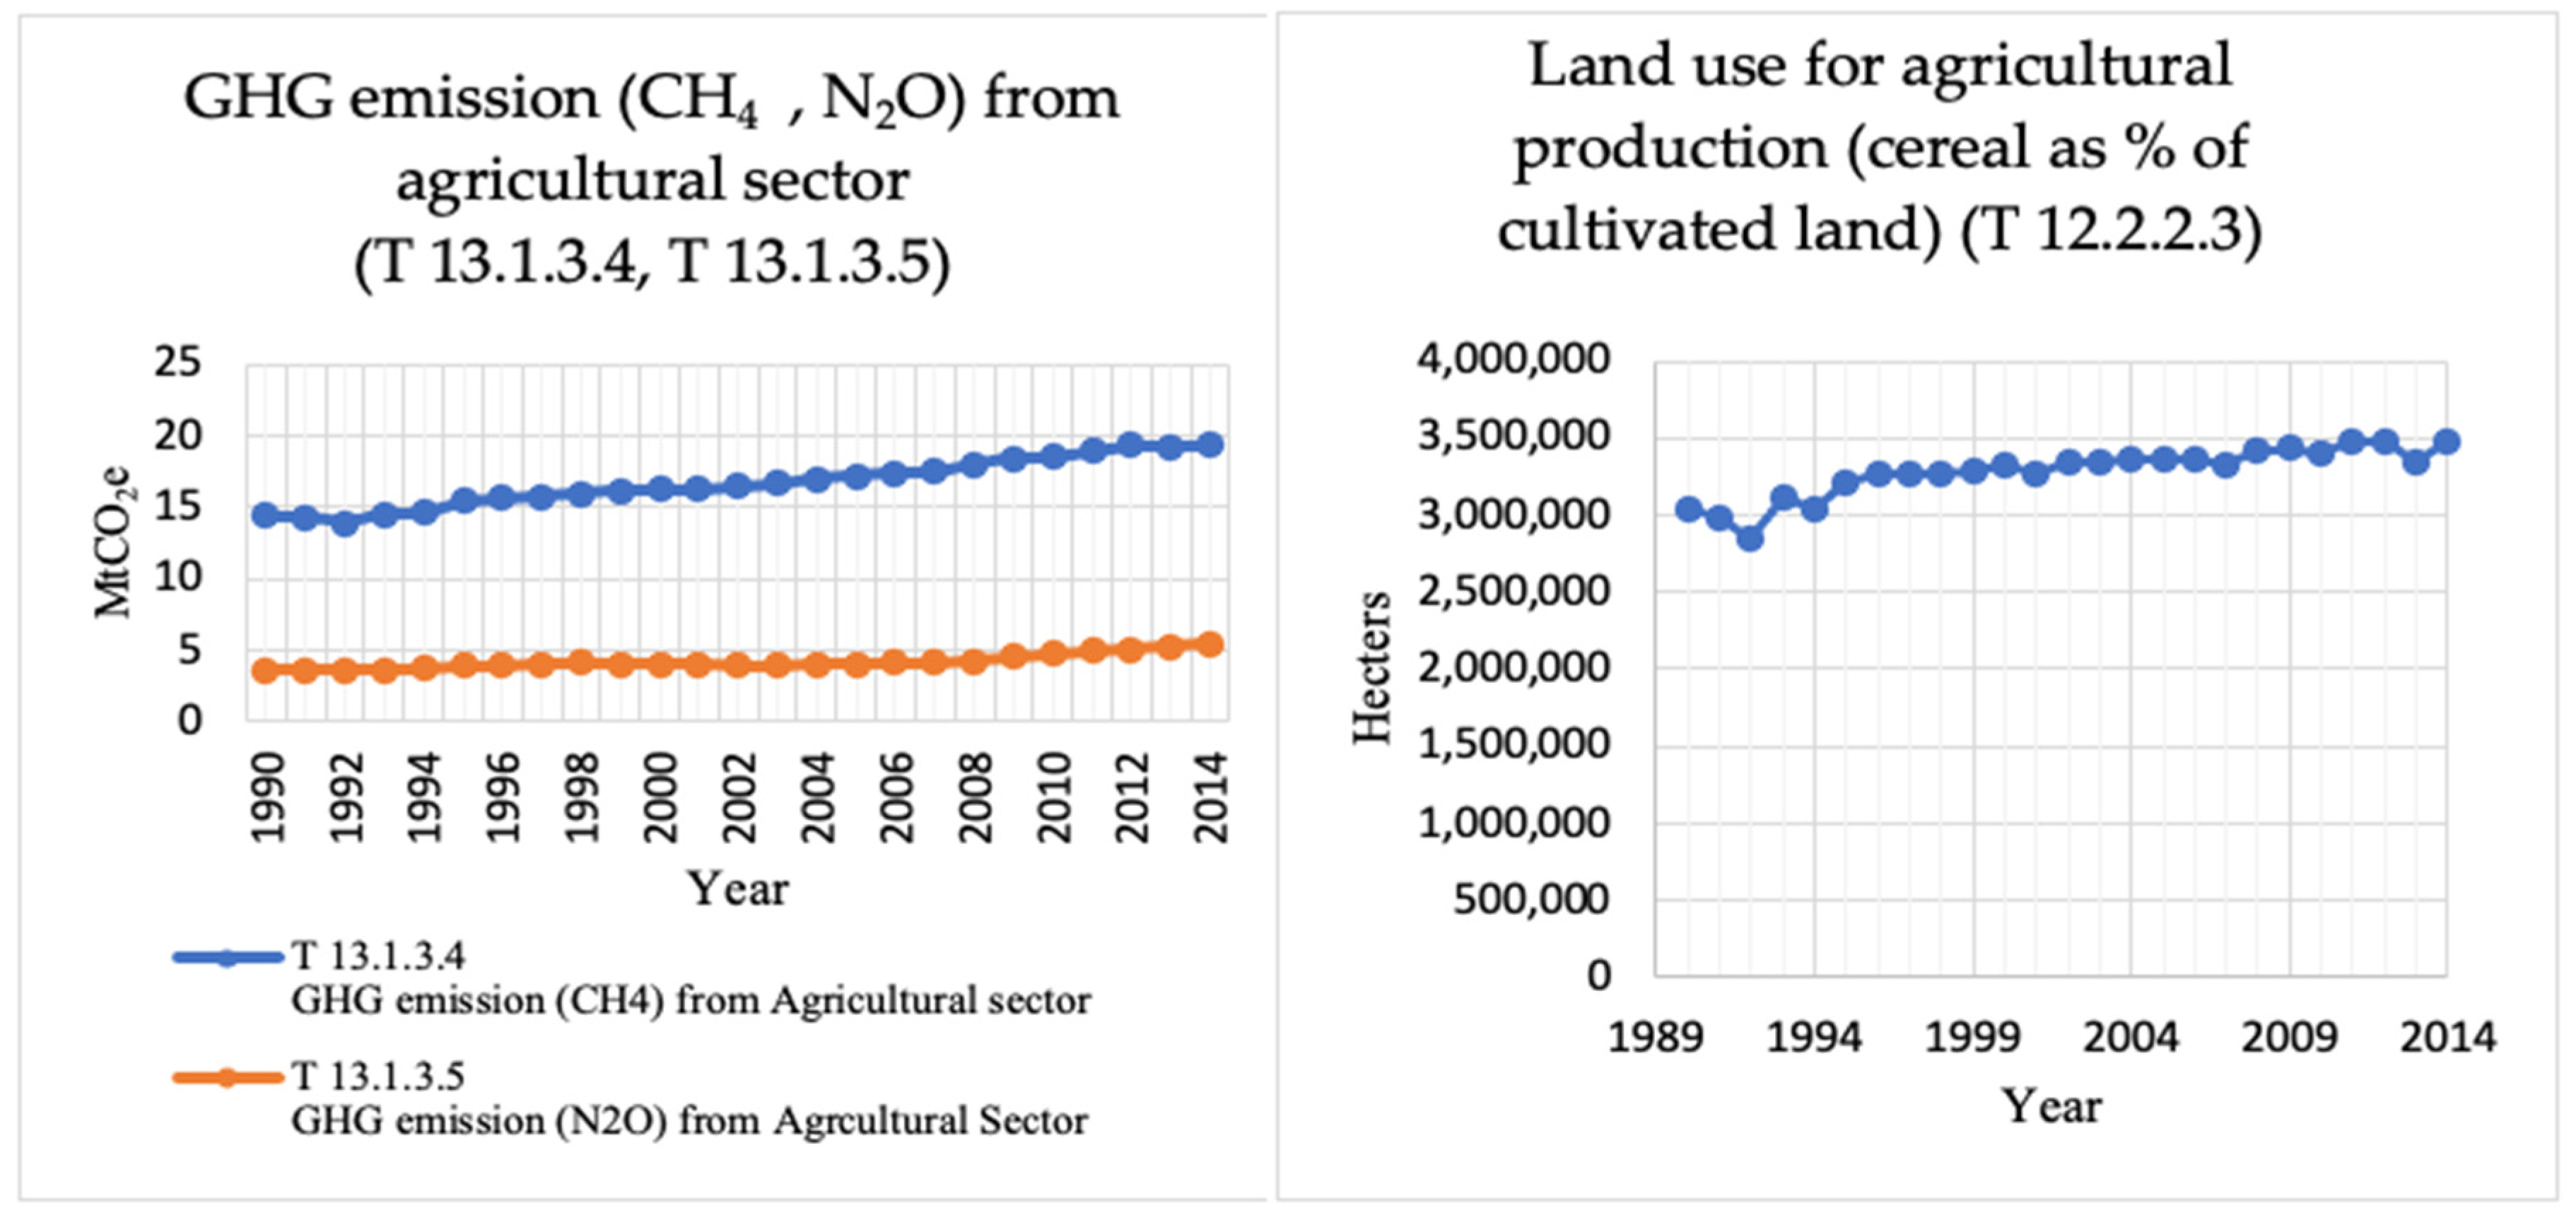
3.2. Linkage between SDG 13 and SDG 12

Our findings show that SDG 12 which stresses the reduction of ecological footprint in the current way of consumption and production of resources [55] has a crucial linkage with SDG 13 via two pillars of addressing climate change, mitigation, and adaptation, through changing patterns of consumption and production (Figure 6). The pair-wise Pearson’s correlation coefficients (presented in Appendix B) among the targets of the goals 13 and 12 were found to be mainly positive and strongly correlated to each other. The emission reduction targets of SDG 13, i.e., T 13.1.3.1, and T 13.1.3.8, were positively and strongly correlated to the fossil fuel consumption target, i.e., T 12.2.2.1, meaning that an increase in one can cause an increase in other. Therefore, to achieve climate action, the use of fossil fuel energy consumption must decrease. The land use for agricultural (cereal) production target i.e., T 12.2.2.3 was strongly and positive linked to T 13.1.3.4, T 13.1.3.5, meaning that despite limiting the land use for cereal production, there has been an increase in the emission of CH4 and N2O from the agricultural sector.
With the 13th Periodic Plan (2013/2014–2015/2016), GoN targets to graduate from LDC status. This implies maintaining a threshold level of gross national income (GNI) per capita, thus creating enormous pressure in sustaining the balance between environmental conservation and socio-economic development [56]. Nepal has doubled its domestic material consumption in the past two decades [57], which positions Nepal in a challenging situation where achieving economic objectives might endanger SDGs, including a reduction in consumption [57,58,59].
Despite high annual rainfall, Nepal faces challenges in ensuring water security [60] as it uses 98.2% of all freshwater withdrawal just for agricultural purposes [61]. Water security has been one of the major problems in Nepal to meet the requirement of access to safe drinking water, irrigation, and generating energy without compromising the water-dependent ecosystem [60]. With advancing impacts of climate change, it can increase uncertainties, complexities, stress, and the potential for conflicts within water management in countries such as Nepal [11,12]. Water security in the context of climate change and the threats posed by climate change to water security call for the concept and implications of adaptive governance as a possible solution [62]. Therefore, the target set for T 12.2.1.1, i.e., water resource use has reinforcing linkage with strengthening resilience and adaptive capacity to climate change (T 13.1). Furthermore, T 12.2.1.1 has a dependent linkage with GHG emission reduction targets from agriculture and the energy sector (T 13.1.3.4, T 13.1.3.5 and T 13.1.3.8) as the excessive use of water pumping for energy production contributes to an increase in GHG emission and wastewater which can hinder the health, agricultural production, and the overall adaptive capacity of people [59,63]. As Nepal plans to accelerate its economic activities, it requires a higher supply of water, for which energy is consumed, and a higher supply of energy, which is produced through water. The interconnected between the water and energy with the economic development should be well addressed to allow for a systematic policy simulation in the economic system [64].
The agricultural production, especially cereal productions, are major contributors to the emission of CH4 and N2O [65,66]. Hence, the target on GHG emission reduction targets under SDG 13 from agricultural sector (T 13.1.3.4 and T 13.1.3.5) could be benefited by the decrease in the land use for the cereal cultivation (i.e., T 12.2.2.3). However, limiting the land area used for cereal production but intensifying its production through amplified use of fertilizers can cause an increase in emissions from the agriculture sector [67]. Therefore, dependent linkage can be seen between the targets.
The target set for the use of fossil fuel energy consumption (T 12.2.2.1) can be seen to have a trade-off linkage with the GHG emission reduction target from transport, industrial and energy sector (T 13.1.3.1, T 13.1.3.2 and T 13.1.3.8). Despite having large hydroelectricity potential, Nepal presently meets its energy demands using fossil fuels, accounting for 82% of the total consumption in 2018 [68]. Petroleum usages is ranked as the second largest source of energy after firewood. The Nepalese transport sector depends on fossil fuel and significantly lacks alternative modes of transports. Hence, the consequential transportation related emission accounts for a major share in country’s national emission scenario. As Nepal does not have any sources of fossil fuel, petroleum products are imported from India. Out of all the imported petroleum products, 63% of total imported petroleum fuels is used by the transport sector and the rest by the industrial sector [69,70,71,72]. According to a statistical review of world energy, 44% of Nepal’s annual energy consumption is imported from India, which produces electricity from fossil fuel [54]. This has made the transport sector to be most GHG emission intensive. Furthermore, as Nepal plans to accelerate its economic activities, with a rise in urbanization and related increase in transportation needs and industrial operation, Nepal will see an increase in the GHG emission which does not relate to its commitment to a nationally determined contribution and second nationally determined contribution [73] to reduce the GHG emission. The rise in the domestic demand for petroleum products imported in a rising international market price can take a toll on the Nepal’s foreign currency reserve. This can have major implication on the potential trade deficit seen due to the low efficiency of the transport sector and high rate of import of fossil fuel. This can further hamper the economic growth of Nepal. This is in direct conflict with the national ambition to graduate from LDC. There are various sectors that contribute to the emissions from and demand for high fossil fuel energy, such as residential buildings, commercial and public services, manufacturing industries and construction, and transportation. They are also some of the major sources of CO2 emissions, with average shares of 34%, 31%, and 27% of total fuel combustion during 2000–2008, respectively [70]. With escalating urbanization and increased use of transportation, the figures are expected to rise in future [74]. The exploration of other sustainable and affordable alternatives beside the fossil imbedded technology and lock-in infrastructure can benefit the emission reduction from this sector. The condition between the two targets can be benefited. Hence, T 12.2.2.1 can be seen to have a trade-off linkage with T 13.1.3.8; GHG emission (CO2) from energy sector as well.

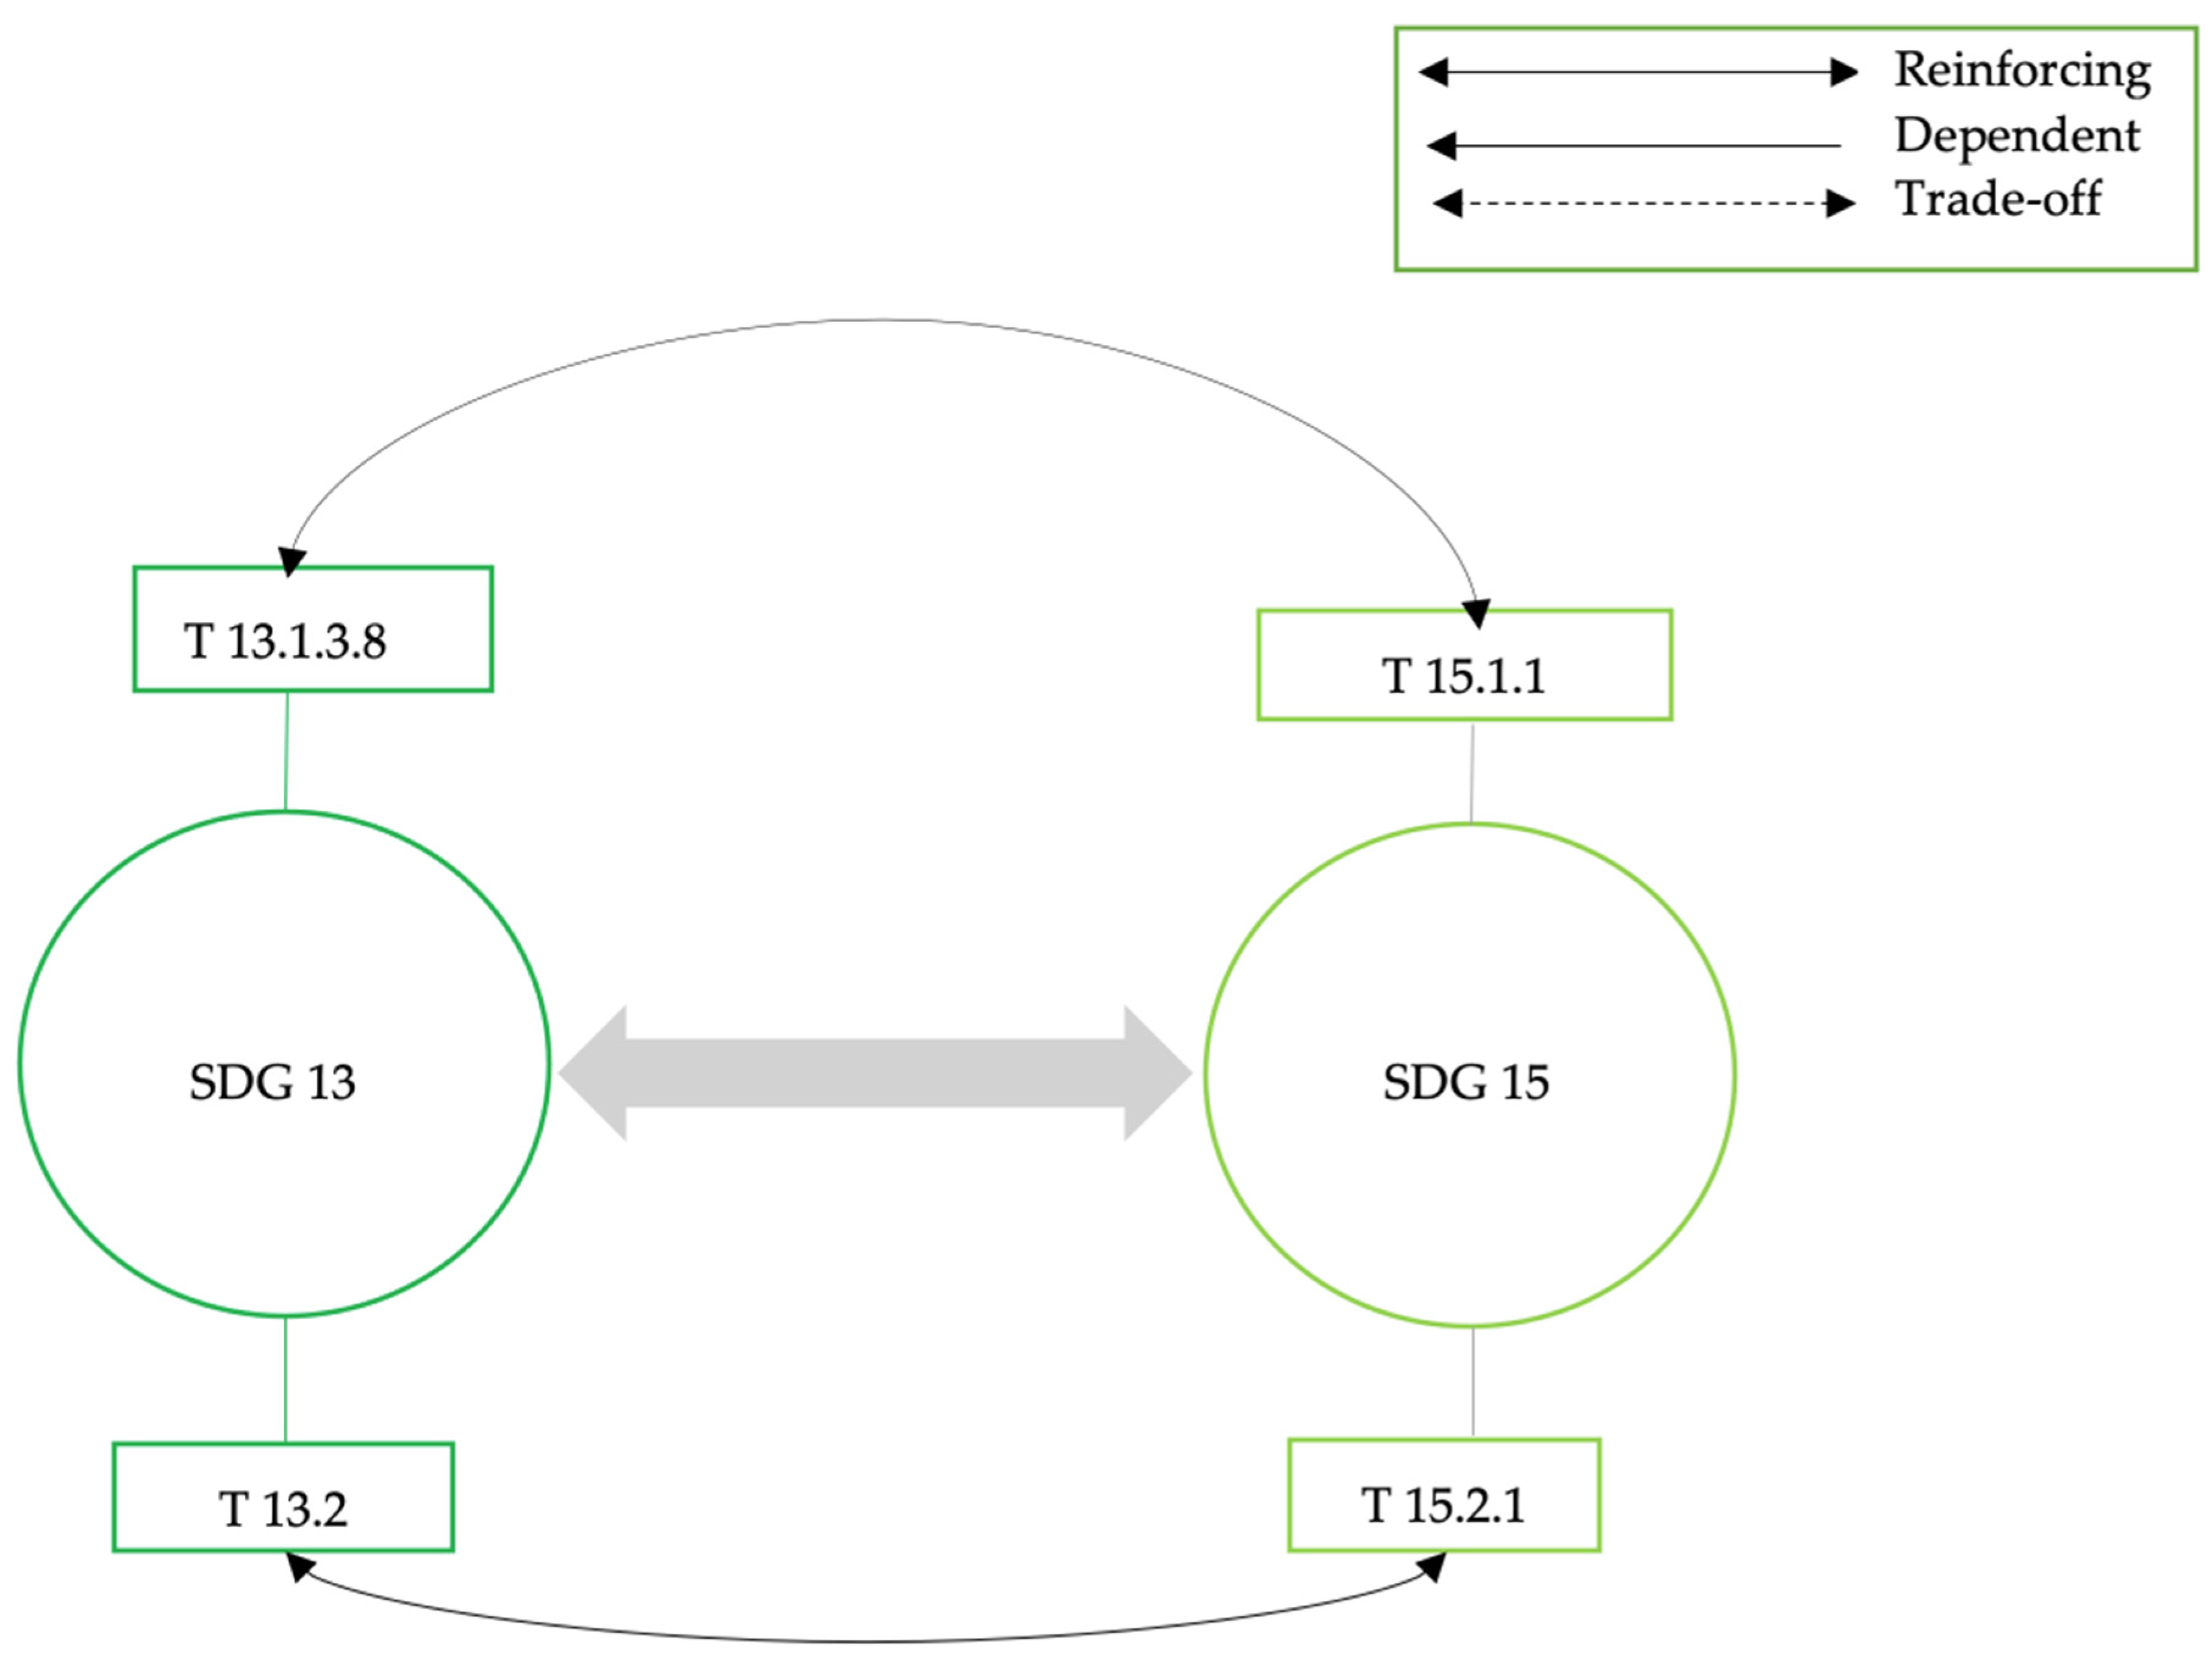
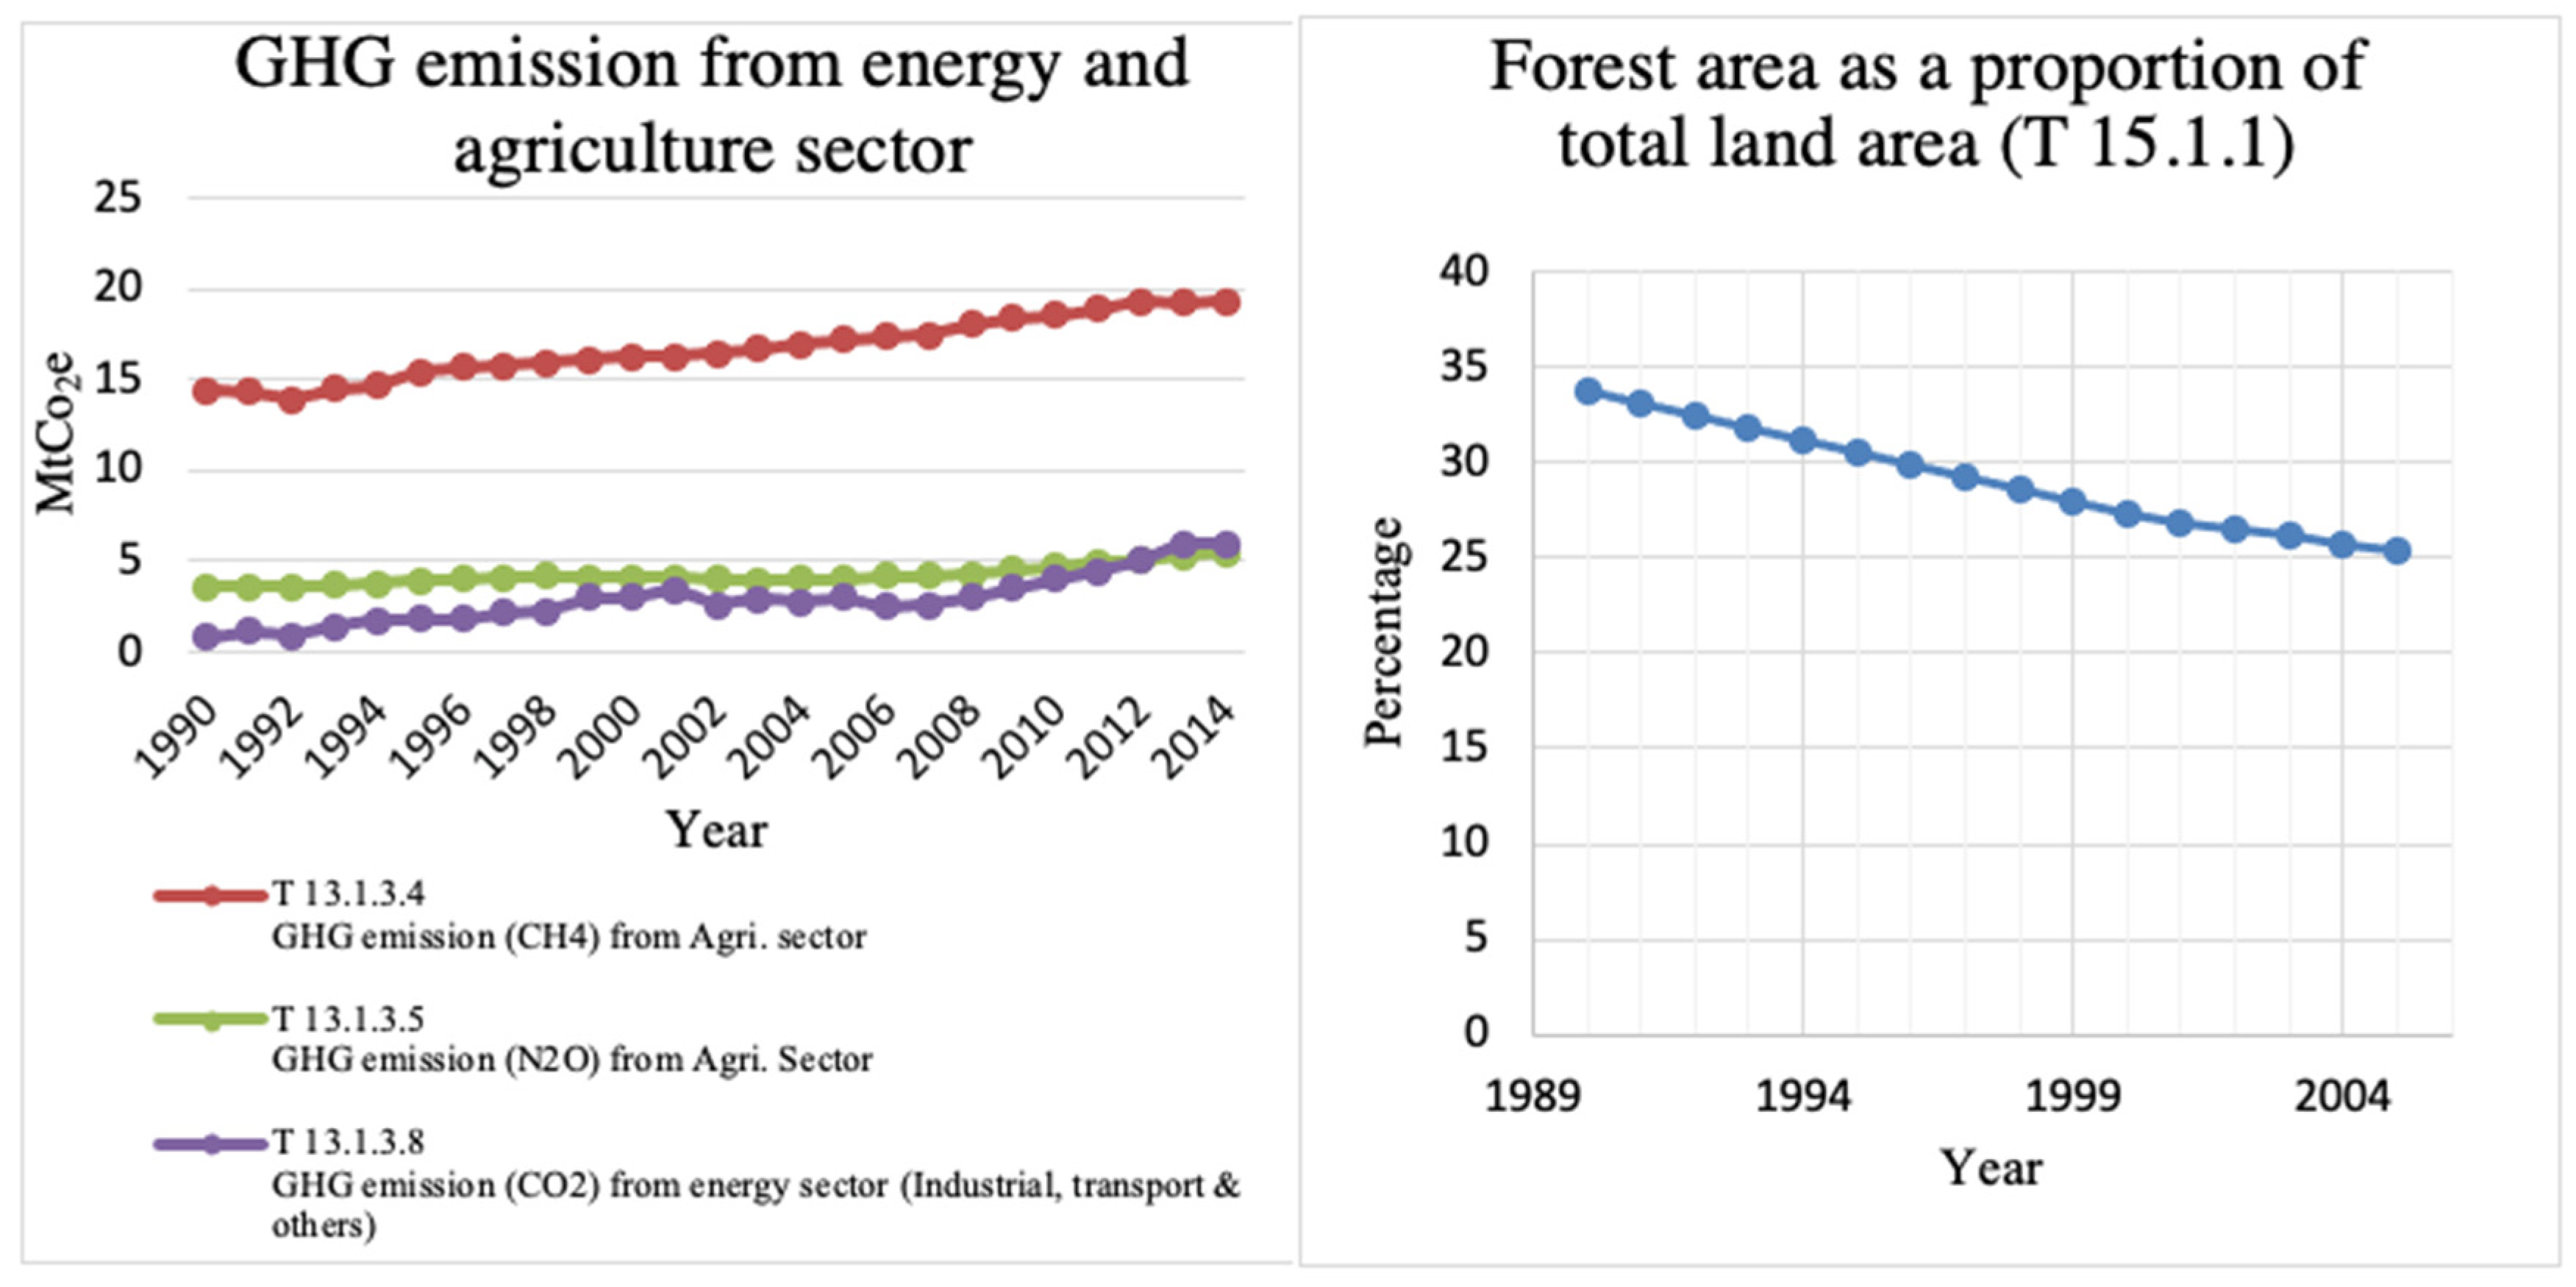
3.3. Linkage between SDG 13 and SDG 15

Our findings show that SDG 15 which focuses on halting forest loss, land degradation, and biodiversity loss has immense potential in mitigating and adapting to climate change, hence addressing SDG 13 (Figure 7). The pair-wise Pearson’s correlation coefficient (presented in Appendix B) among the targets of goals 13 and 15 was found to be negative. The emission targets of SDG 13, i.e., T 13.1.3.1, T 13.1.3.4, T 13.1.3.5, and T 13.1.3.8, were negatively and strongly correlated to forest area target of SDG 15, i.e., T 15.1.1, meaning that the forest area is insufficient to provide its carbon sequestration capacity to affect the emission rate.
Forests are critical components of conservation and sustainable development and forest-dependent communities have always played an important role in environmental stability and economic progress [75]. Similarly, forest resources support rural livelihood, income generation and poverty reduction, food and fiber production, carbon sequestration, water management, climate regulation, biodiversity protection, and other diverse ecosystem services. As a result, forests could contribute to the SDGs’ vision of sustainable development [76,77,78,79]. During the time period under analysis, Nepal was highly dependent on biomass for to fulfill its basic energy demand (as mentioned in Section 3.1). Its primary source of energy at the time for the purpose of cooking, heating, and lighting was firewood and due to overuse of the raw material, there was depletion in the forest area, making it difficult to access the resource [80]. As the demand had been met through unsustainable practices, it contributed to a rise in GHG emissions and led to degradation and loss of forest area [81].
Therefore, the target set to increase the proportion of forest area (T 15.1.1) can have a two-fold reinforcing linkage with the emission reduction target from the energy sector (T 13.1.3.8), namely by increasing the forest area and sustainable harvesting of fuel wood, which is considered carbon neutral, and thus does not add to the emission rate, and with the increase in the forest area, which contributes to the potential of the forest to sequester carbon, thus reducing the overall emission of the country. Hence, recognizing the importance of forest under SDG 15, Nepal has also prepared the National Adaptation Program of Action (NAPA) and Local Adaptation Plans of Action (LAPAs) to address the requirements of the UNFCCC. The strategies and actions of the NAPA seek to increase community adaptive capacity through livelihood support, improved environmental resource governance, collective responses, improved service delivery, and access to green technology and finance [76].
The forest sector contributes significantly to the accumulation of GHG emission in the earth’s atmosphere and has the potential to contribute even more by reducing GHG emissions and/or boosting carbon dioxide (CO2) sequestration in vegetation, detritus, soils, and biomass-based products [82]. As Nepal plans to graduate from its LDC status, economic activities are expected to accelerate, which can increase the demand of the forest products and cause over consumption. However, forests can also play a major role in absorbing atmospheric carbon. There is a large capacity for forest ecosystems to sequester carbon by increasing biomass density in existing forest lands through natural and enhanced regeneration, as well as expanding carbon stocks by the conversion of non-forest land. Therefore, understanding climate change adaptation and forest management is critical in mitigating and minimizing the effects of climate change [83]. Forests and forest products have been a source of income for Nepal’s growing population. With forest degradation and deforestation increasing, it has become even more necessary to have a reliable climate resilient forest management system [83,84].
In recent years, GoN has signed agreement with World Bank’s Forest carbon partnership facility that provides up to $45 million to support Nepal to decrease carbon emissions from deforestation and forest degradation through 2025. The program aims to cut rates of deforestation and forest degradation across 2.4 million hectares of land rich in natural resources, including 20% of the country’s forest cover. This effort will also work to improve community-based forest management, transfer user rights for national forests to local people, improve integrated land use planning, promote alternative energy sources, and boost protected area management competence. GoN has also employed a climate resilient forest management system to enhance decision-making by providing more precise and scientific information on climate change vulnerability and the degradation of forest ecosystems. This can help Nepal to increase its forest area through proper management and tackle climate change. Therefore, the achievement of T 15.2.1 is reinforcing in nature with respect to the T 13.2 as target 15.2.1 deals with the progress towards sustainable forest management which can help in mitigating the emission from over exploitation of fuel wood. At the same time, it can enhance the adaptive capacity of vulnerable people under T 13.2; integrate climate change measures into national policies, strategies, and planning.

3.4. Network of Targets Showing Interlinkages between SDGs

The analysis in Section 3.1, Section 3.2 and Section 3.3 shows the interaction among the targets within the SDGs under investigation. Some of the linkages are reinforcing (achievement of one target helps on other), some are dependent (achievement of one target rely on others), and others present a trade-off (achievement of one target imposes constraints on other). Below, a network of targets is summarized in light of the discussion above. Figure 8 represents an integrated form of network within the targets.
Figure 8 shows the overall interlinkages between the climate goal and other SDGs, namely energy access (SDG 7), responsible consumption and production (SDG 12), and life on land (SDG 15). Network analysis showed five reinforcing linkages and three dependent linkages between SDG 13 and SDG 7: one reinforcing, five dependent, and three trade-off linkages between SDG 13 and SDG 12. Lastly, it showed two reinforcing linkages between SDG 13 and 15.

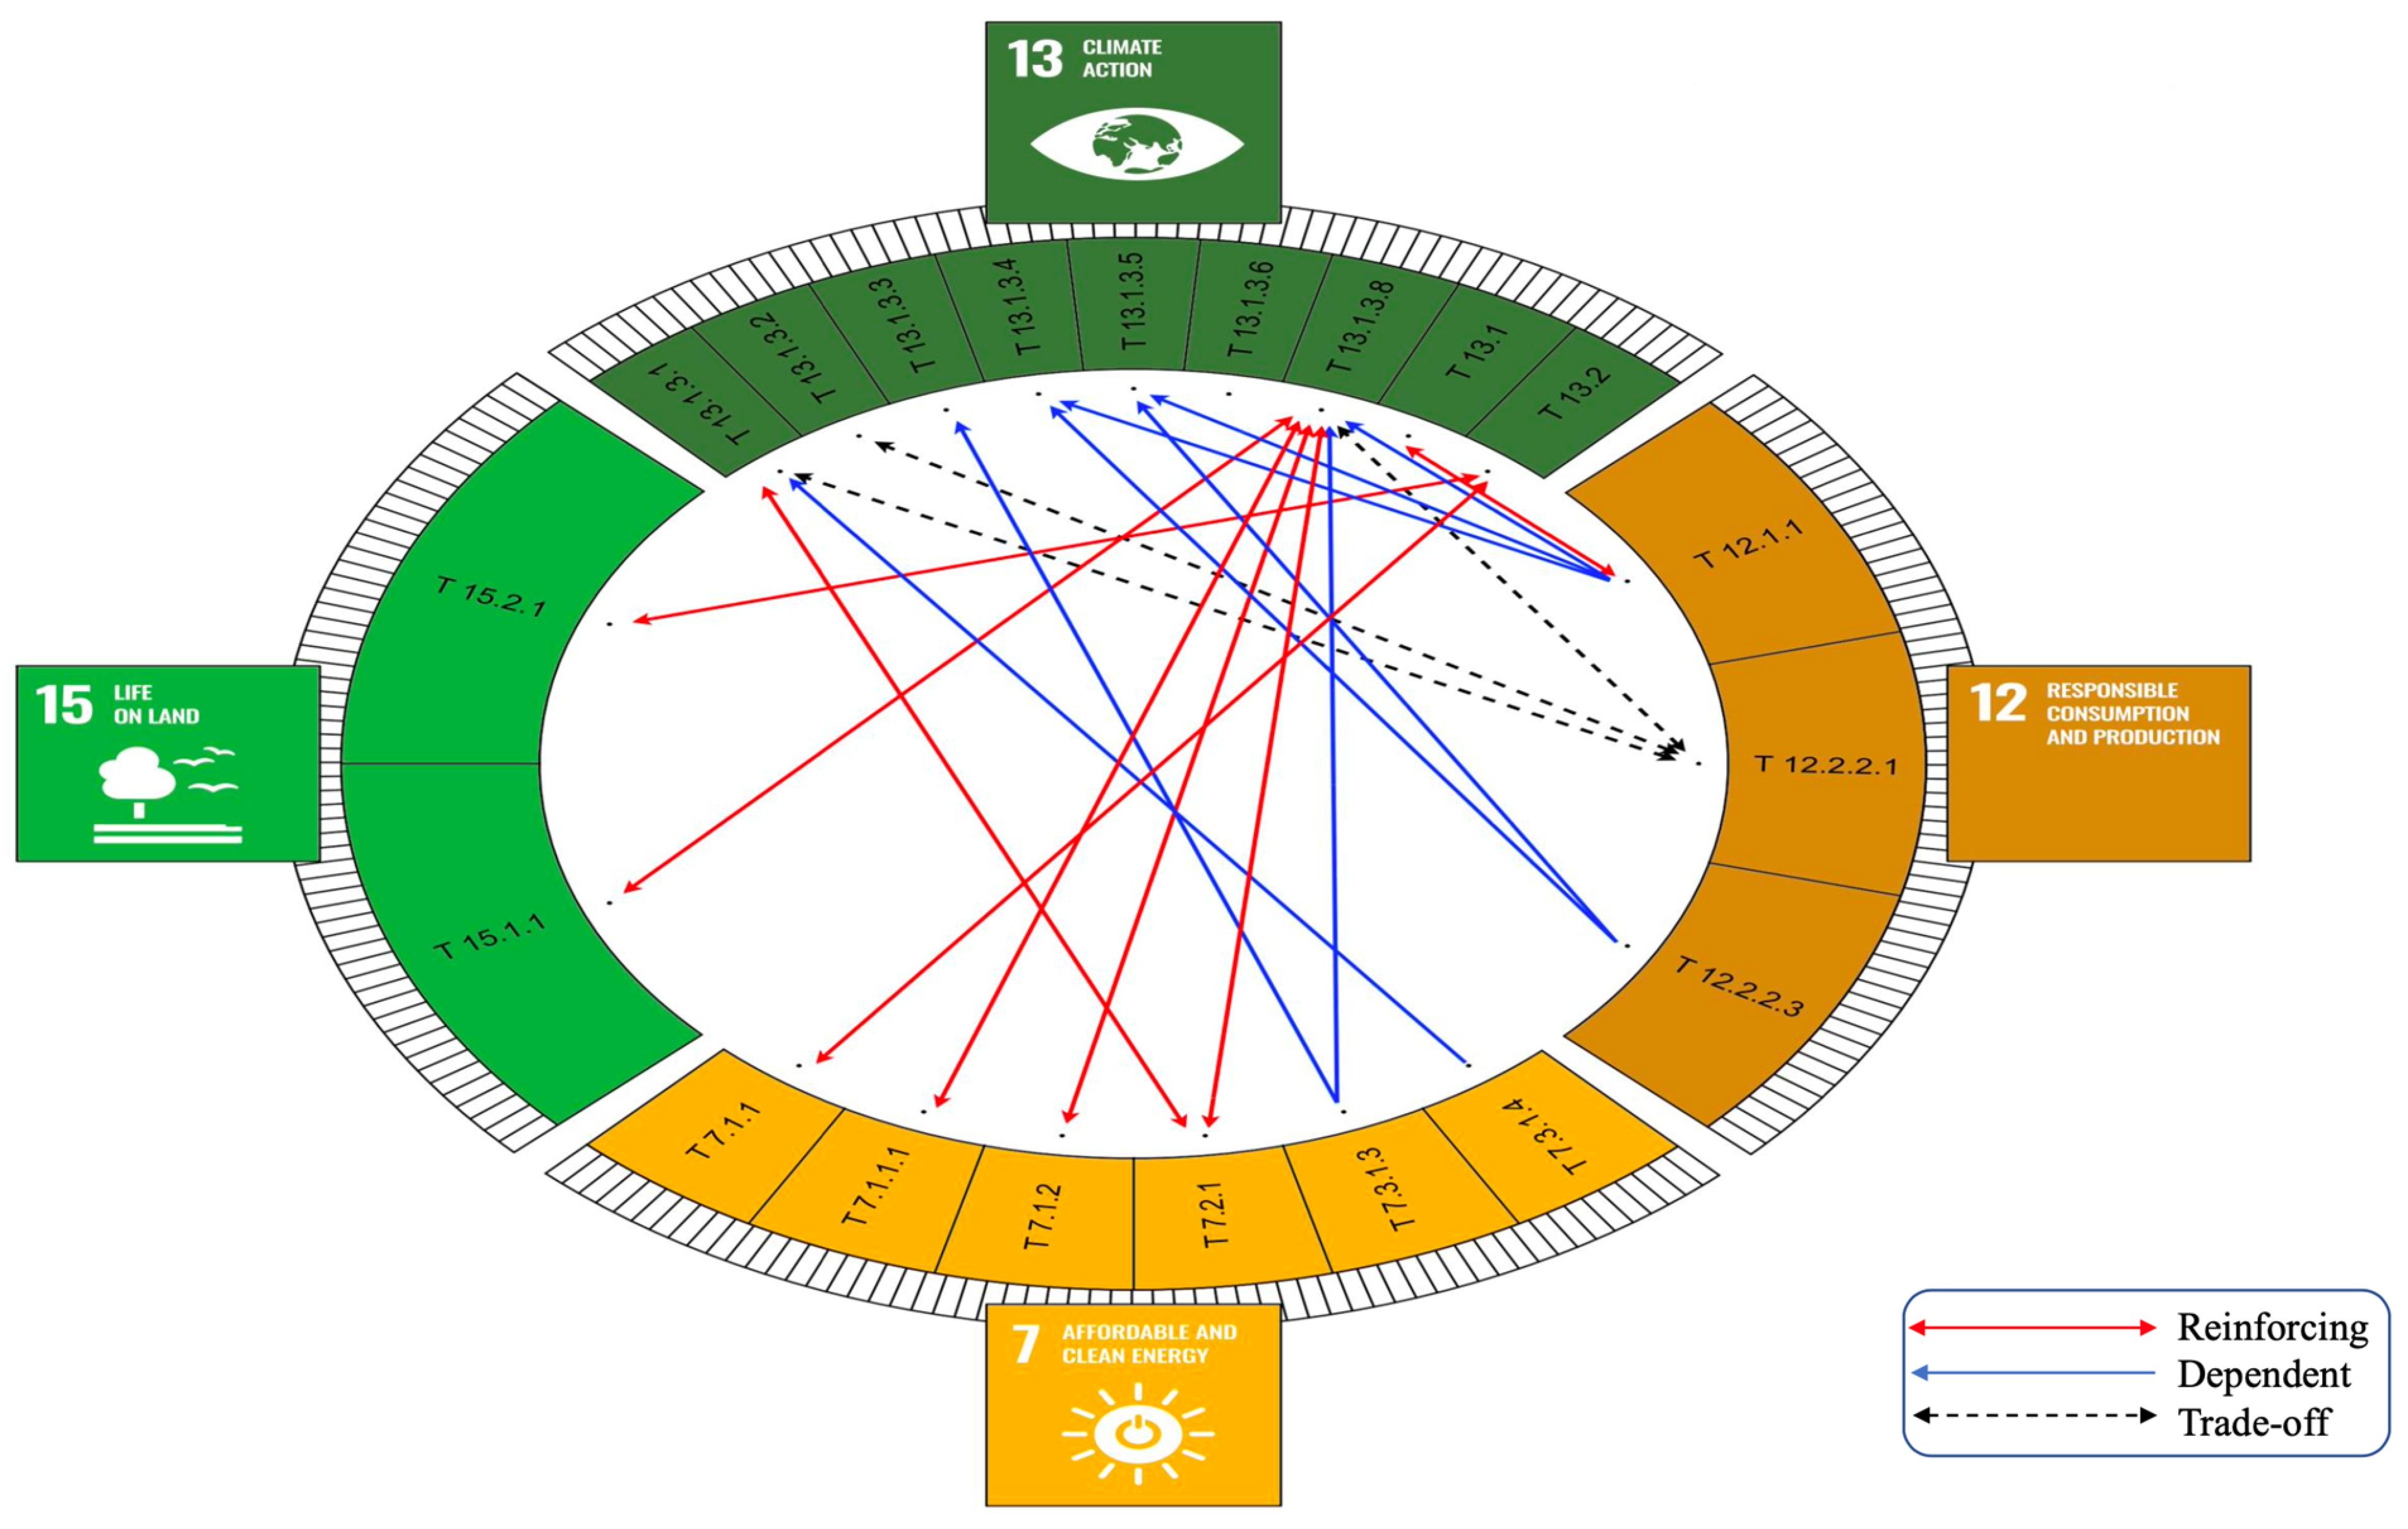
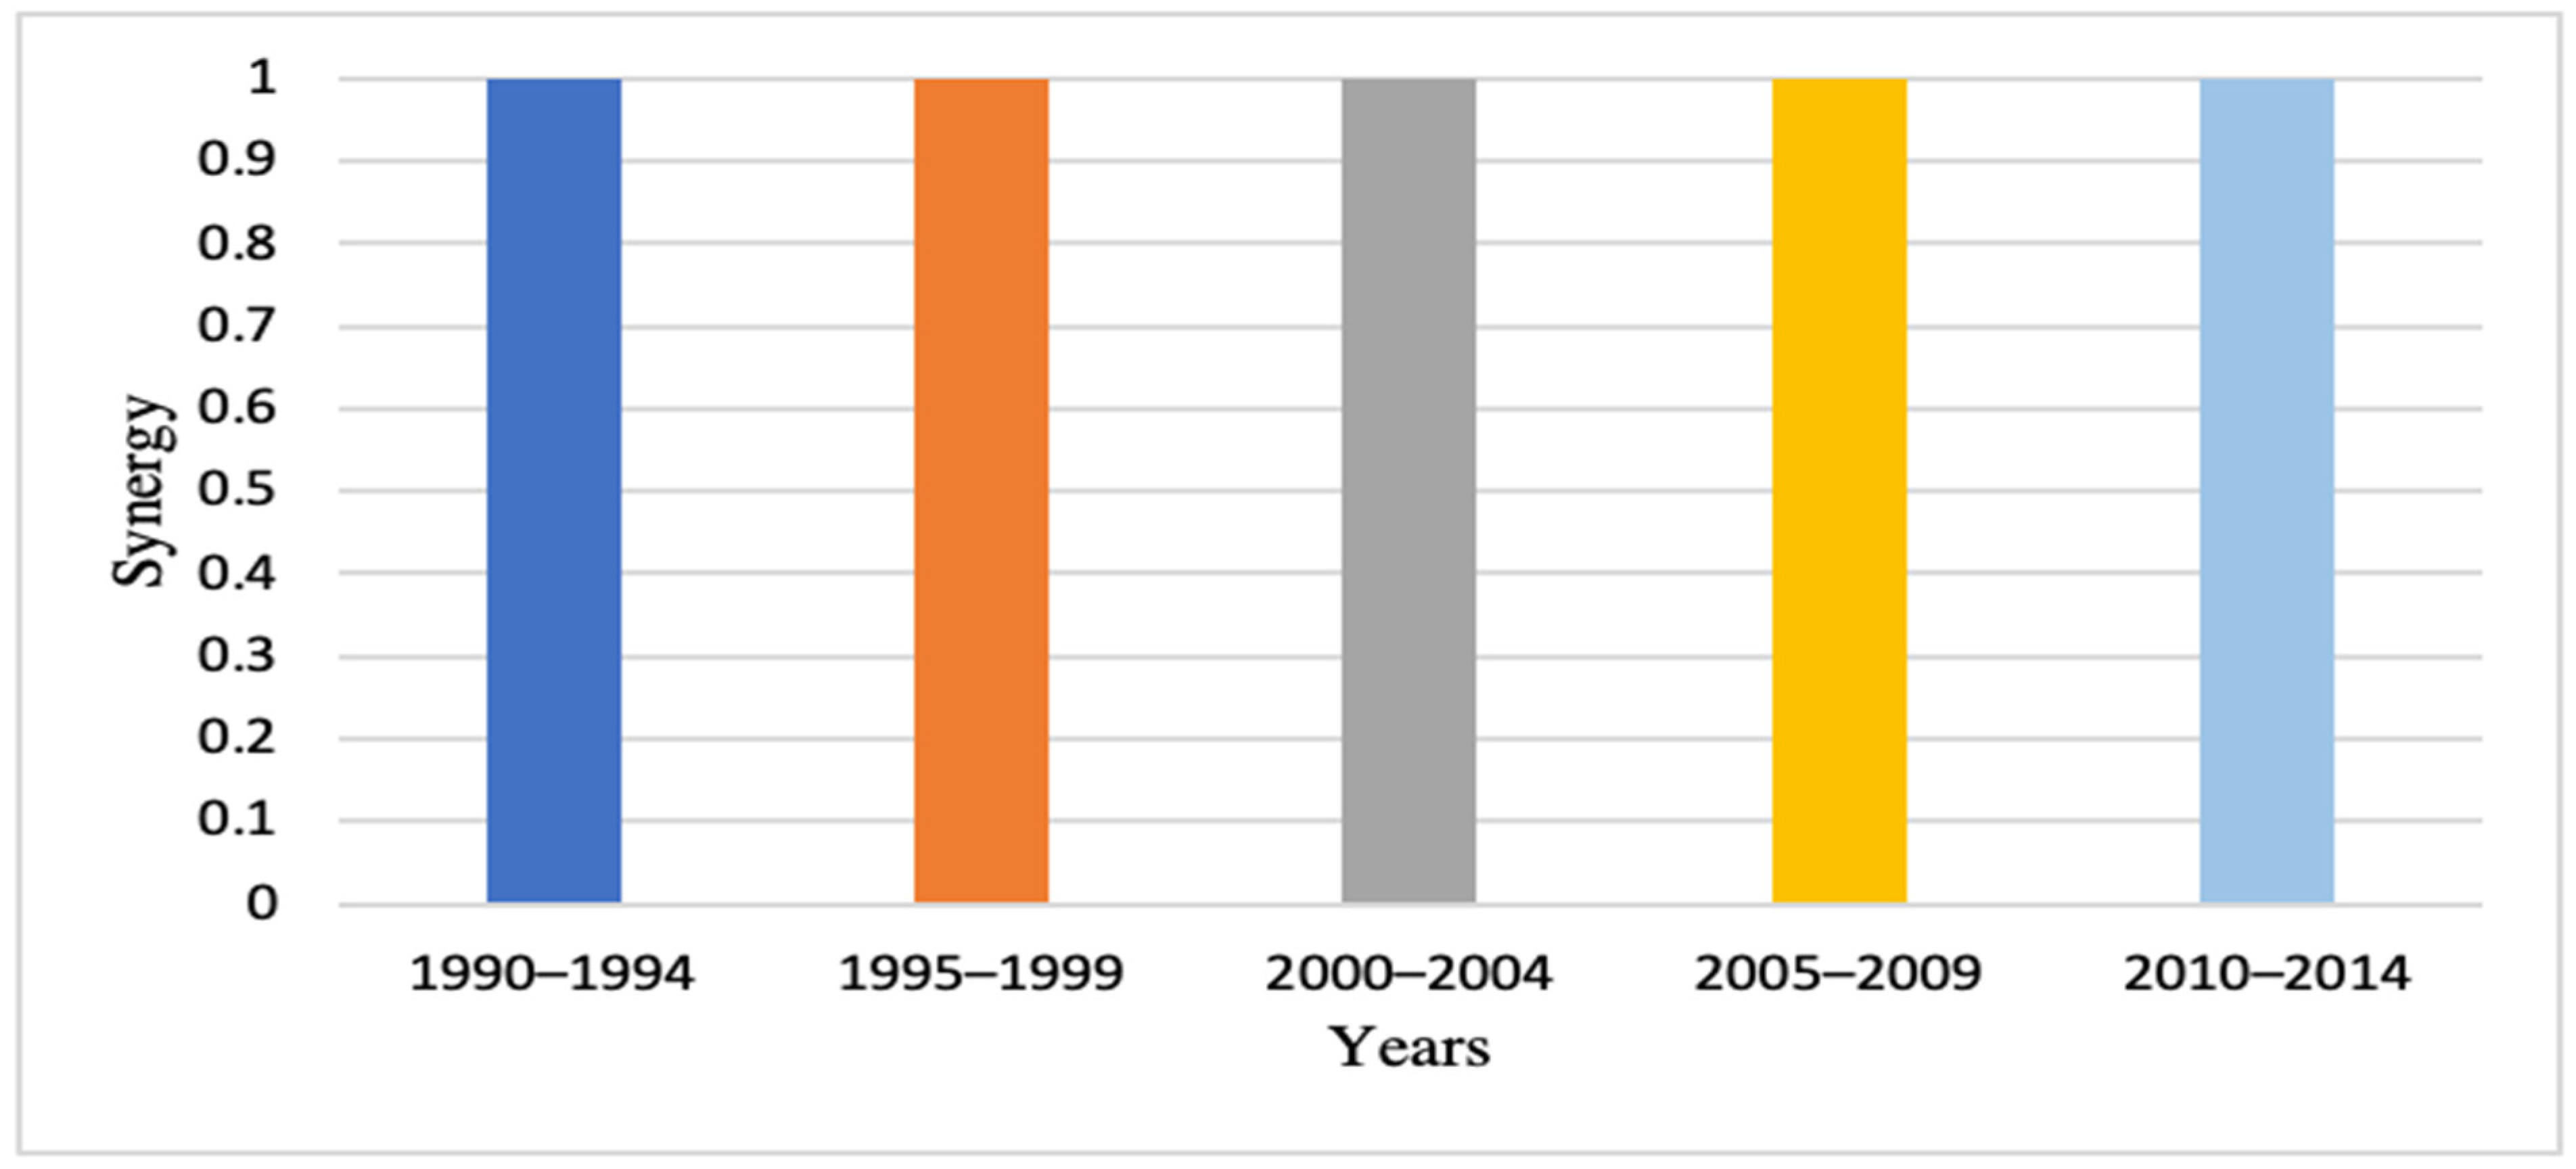
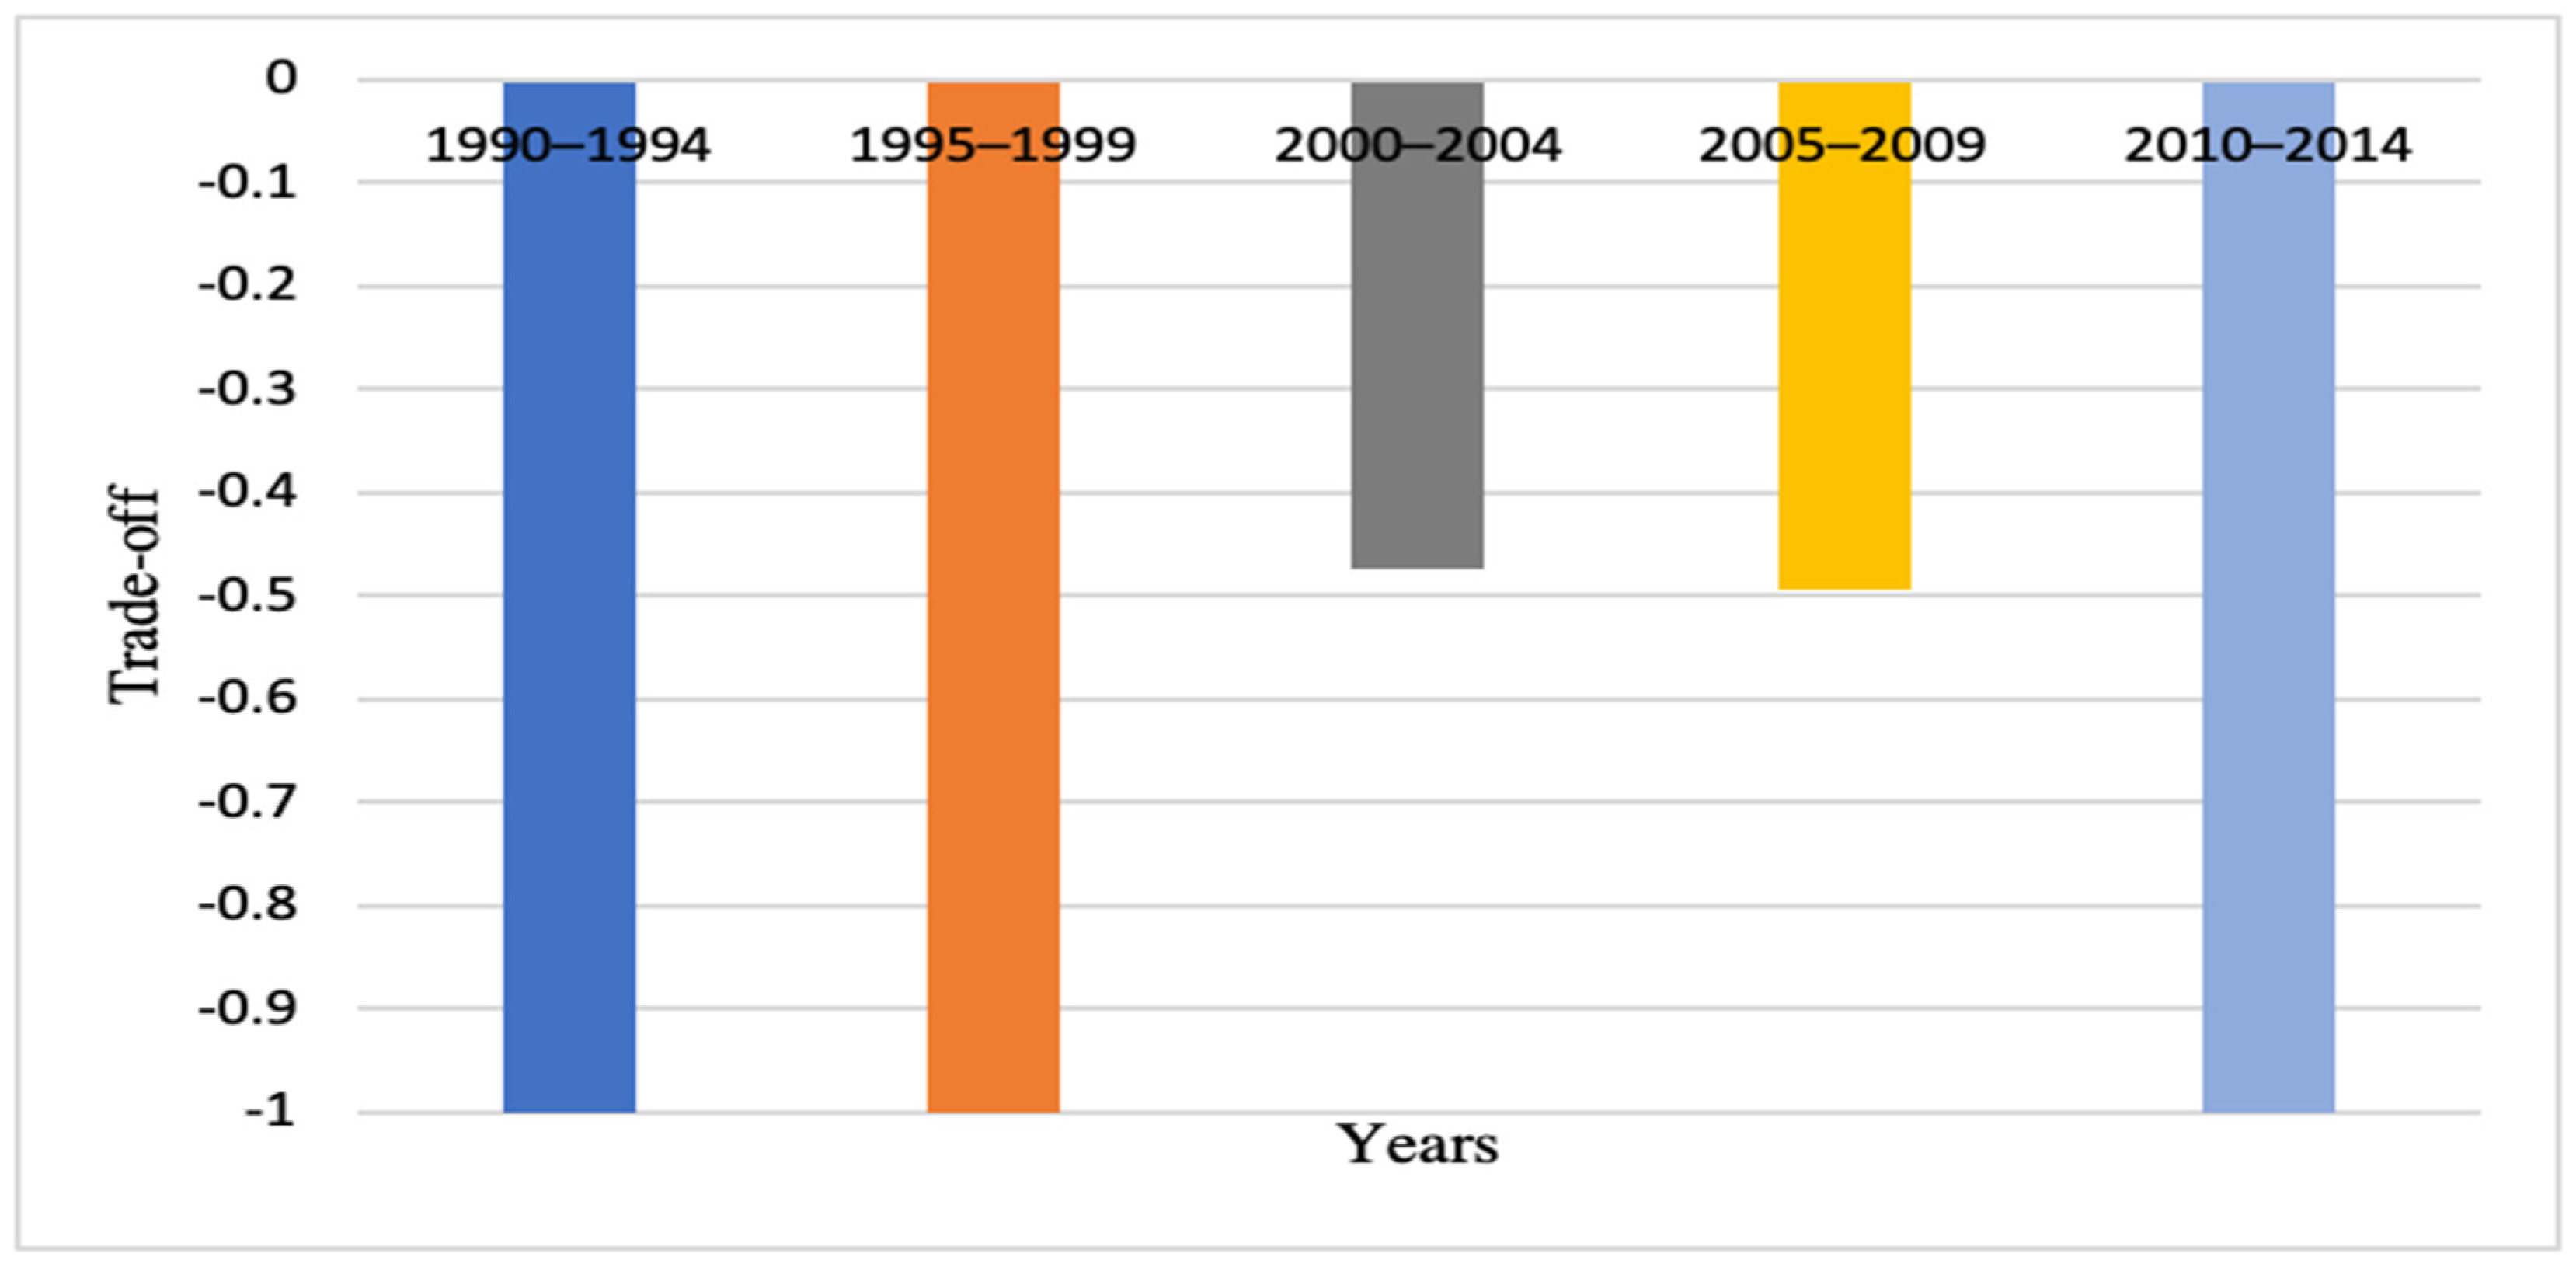
4. Evaluation of Synergies and Trade-Offs between SDGs

Using the ASA approach, the quantitative analysis of synergy and trade-offs among the four goals and their targets is carried out for comparative purposes. The variables are normalized to the previous year in the calculation and the synergy is expressed as an index range from +1 to −1 using the method as described previously in methodology section. Minus (−) sign represents trade-off situation. Synergies have been evaluated for each five-year time span (1990–1994, 1995–1999, 2000–2004, 2005–2009, and 2010–2014) due to constraints on the data availability for the most recent period. The degree of the potential synergy and trade-off are dependent and vary depending on geographical settings, resources that are available, development stage, and the policy instruments and measures implemented by the nations or state.

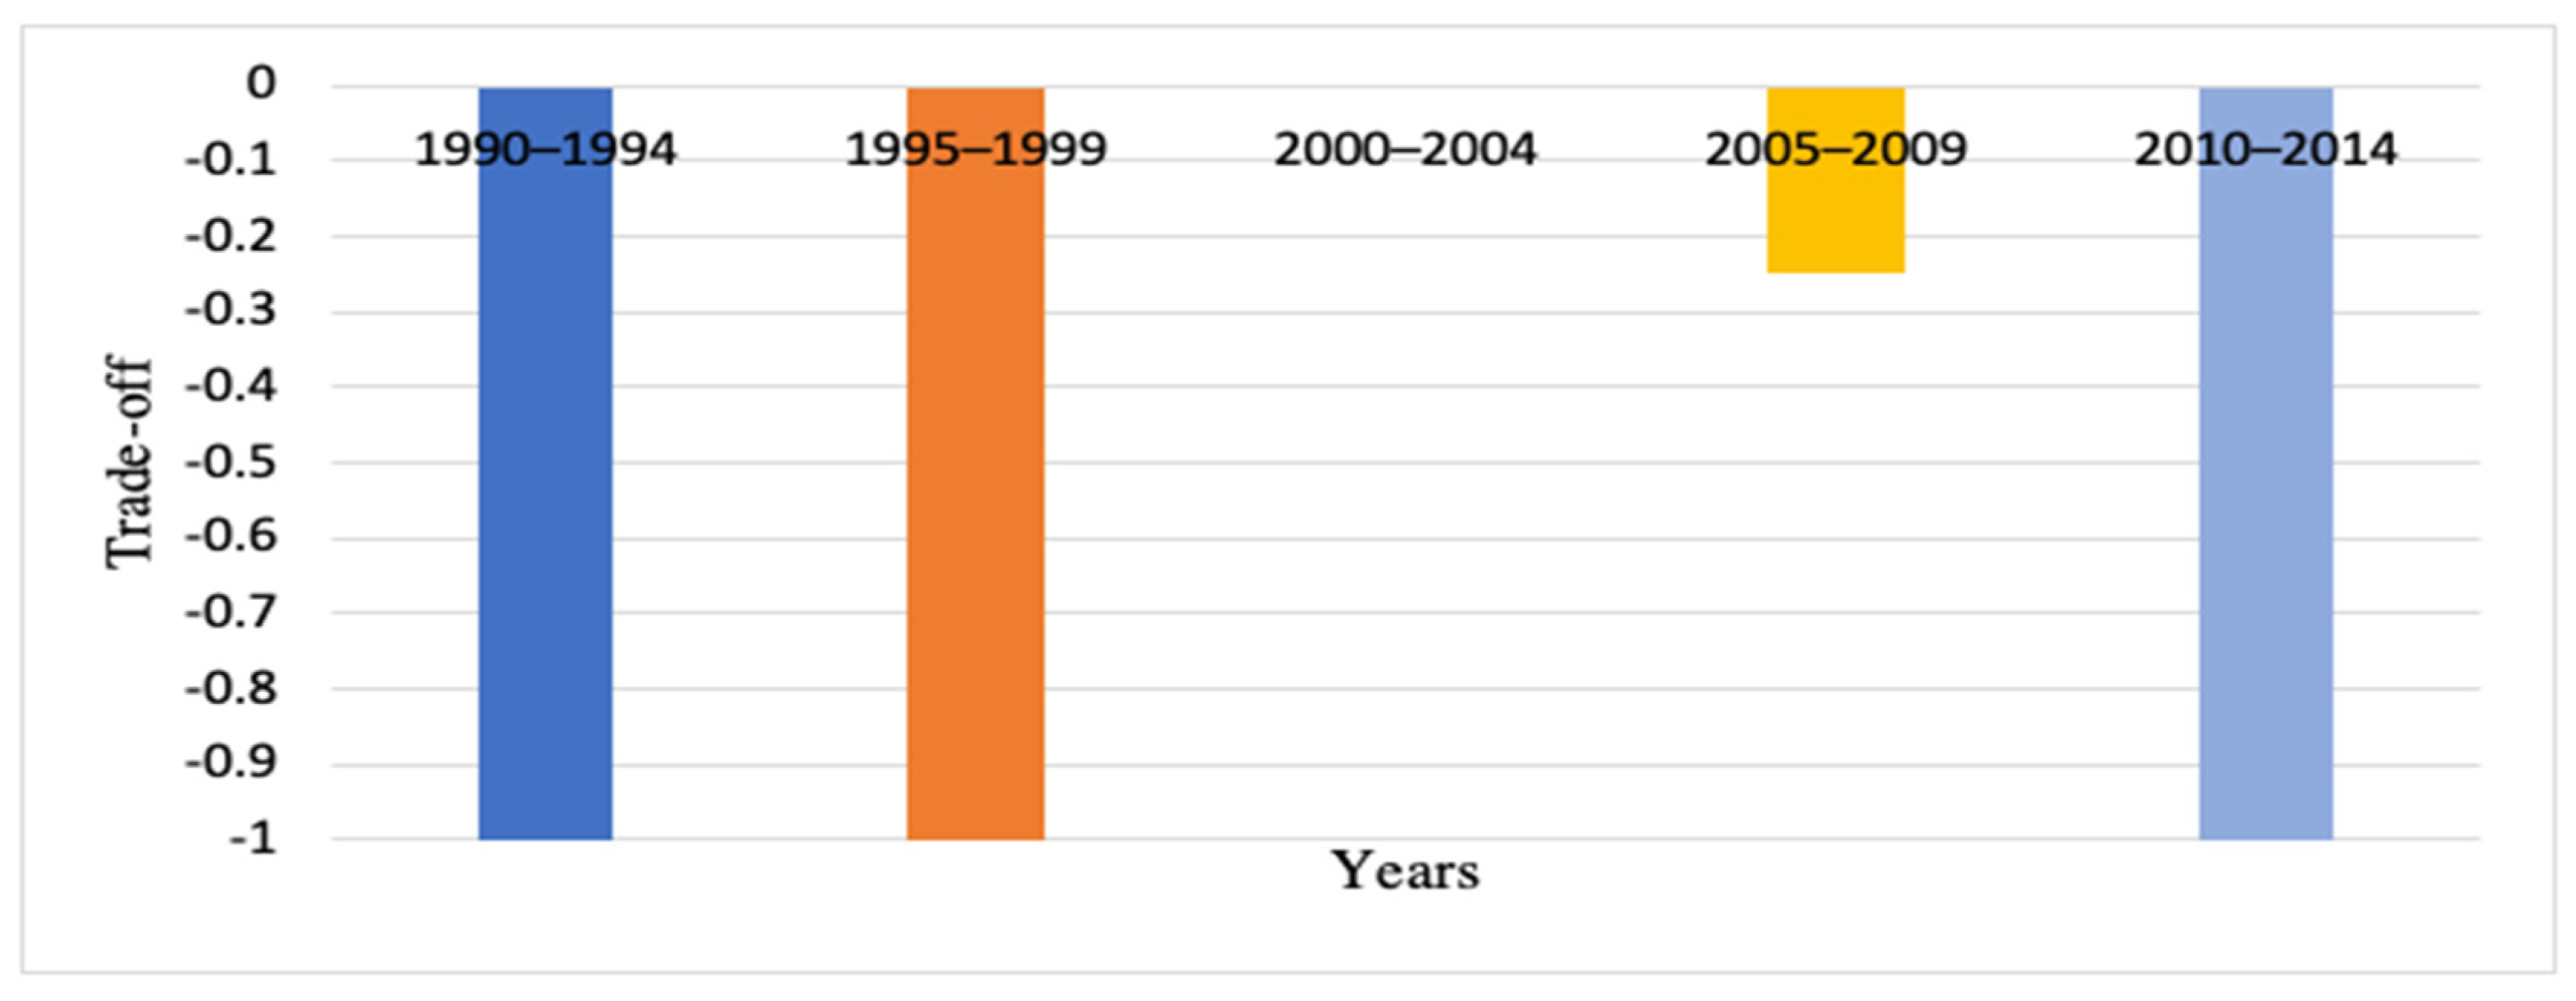
4.1. Synergy between SDG 13 and SDG 7

Figure 9 shows the share of GHG emission (CO2) from the energy sector (Industrial, transport and others) (left) and the per capita energy consumption in Nepal (right) from 1990 to 2014.
The GHG (CO2) emission from the energy sector gradually increased from 0.8 MtCO2e in 1990 to 5.9 MtCO2e in 2014. Similarly, the per capita energy consumption also progressively increased from 0.033 Gj in 1990 to 0.24 Gj in 2014. Comparing Figure 9 above, the increase in the GHG (CO2) emission from energy sector in the year 2000 is simultaneous to the increase in the per capita energy use the same year. Likewise, in the year 2006, there is a synchronized drop in both GHG (CO2) emission from energy sector and per capita energy consumption. This signifies that there is a positive relation between the two variables.
Figure 10 shows the strength of explorative analysis in synergy evaluation among GHG emission (CO2) from the energy sector (industrial, transport, others) and per capita energy consumption. Bars above the axis represents positive synergy while the bars below the axis represents negative synergy (trade-off) condition. Figure 10 shows that there exists a positive synergy between the two variables observed over the time span (1990–2014) in the five-year gap. Therefore, the two variables are interdependent and any increment in one variable has a synergetic impact on the others.
In regard to achievement of the SDGs targets; the target 13.1.3.8 is to reduce in GHG emissions from the energy sector and target 7.1.1.1 is to increase in the per capita energy uses (in Nepal). Thus, this scale in terms of the target could be read as negative, showing a tradeoff between these emission reduction and per capita energy consumption. This can be attributed to the primary energy sources of Nepal; with high dependency on biomass and petroleum products to meet its energy demand. In this mix, hydroelectricity and renewable sources of energy are much less (during the time-period of study 1990–2014). All the primary source of energy are polluting factors that emit CO2; with the limited access of electricity, low per capita consumption of electricity, and lack of modern energy playing a crucial role. As mentioned earlier (see Section 3.1), biomass was one of the most important primary sources of energy and has maximum coverage. In the context of Nepal, biomass in the form of firewood, agricultural residue, and dung harvested unsustainably represent high GHGs emitting products [51,85]. More than 80% of Nepal’s population reside in rural communities heavily depend on traditional sources of energy [86] and in most cases lack the access to improved or clean technology. As energy use and pollution emission are interconnected, the significance of the under-consumption of energy extends to addressing climate change and sustainable development [82,86].
The GoN initiated Rural Energy Policy, 2006 aims at increasing the installation of improved biomass technologies, off-grid, micro-hydro systems for rural electrification, and PV-based solar lights to reduce emission from the energy sector and aid in building resilience to impacts of climate change. Among several other RETs, biogas has been proven viable and emerged as a promising technology, especially for rural households, primarily due to low cost and easy adaptability of the technology [87]. However, the infiltration of RETs in energy production and consumption was insufficient to aid the decrease of emission from energy sector (during the period of analysis). GoN has formulated and implemented several strategies and policies to derail emission intensive development, such as the low carbon emission development strategy, to envision Nepal’s future, to promote economic development through low carbon emission. It has paid focus to: (a) energy, (b) agriculture and livestock, (c) forests, (d) industry, (e) human settlements and wastes, (f) transport, and (g) commercial sectors.
Nepal’s energy policy prioritizes on meeting the domestic demand of energy through maximum application of hydropower potential. Along with that, Nepal’s climate policy focuses on the reduction of GHG emission by promoting the use of renewable energy. To improve access to power, the GoN, in collaboration with donors and the private sector, have actively promoted off-grid solar photovoltaic (PV) technologies. So far, stand-alone solar PV systems in Nepal’s rural areas have provided energy to over 900,000 families [88]. However, enhancing the efficiency of solar PV technology in rural Nepal requires the use of adaptable financial instruments, financial innovations, the bundling of PV systems for concentrating energy loads, adoption of standards processes, building local capacity, and combining technological, financial, and institutional aspects [88]. The low carbon emission development strategy in Nepal also promotes the use of renewable energy and emphases the cross-sectoral approaches for the minimization of GHG emission. The full potential of these policies and harmonization between them could help in the reduction of the emissions from this sector.
Figure 11 shows the share of GHG emission (CO2) from the energy sector (industrial, transport, and others) and the renewable energy share in the total final energy consumption of Nepal from 1990 to 2014.
The GHG (CO2) emission from energy sector has gradually increased from 0.8 MtCO2e in 1990 to 5.9 MtCO2e in 2014. There can be seen a sudden drop in the emission from 3.4 MtCO2e in 2001 to 2.6 MtCO2e in 2002, but after that it continued to increase steadily, whereas the share of renewable energy in total final energy consumption was seen to slowly decrease. The renewable energy share in total final energy consumption can be seen to gradually decrease from 95.11% in 1990 to 84.38% in 2014. There was an increase in the share of renewable energy in total final energy consumption between the years 2003 and 2007 from 89.44% to 91.31%, however it continued to decline after that. The GHG emission (CO2) from energy sector and the share of renewable energy in total final energy consumption show a negative correlation (from pair-wise Pearson’s correlation in Appendix B).
The strength of the explorative analysis in synergy evaluation among the two variables can be seen in Figure 12. Here, a trade-off was found to exist between the two variables over the years under observation.
The trade-offs between GHG emission (CO2) from the energy sector and renewable energy share target was attributed to insufficient infiltration of renewable energy and RETs in Nepal’s energy production and inability to tap into the full potential of hydroelectricity power generation along with substantial dependence on traditional sources of energy and petroleum import consumption of the nation (during the year under observation). SDGs target 13.1.3.8 is to reduce the GHG emission from energy sector and target 7.2.1 is to increase the renewable energy share in the total final energy consumption (in Nepal). Thus, in terms of targets, there is also a tradeoff condition between emissions reduction and renewable energy share in the context of the final energy consumption targets.
In the year 2013, only 15.5% of the population had access to electricity through renewable energy source [30]. Recognizing the need of share of renewable energy in final energy consumption, Nepal implemented Renewable energy subsidy policy, 2013 that aimed at the delivery of better-quality renewable energy services using various technologies. Hydropower Development Policy 1992 and 2001, Ten Years Hydropower Development Plan 2009 was also formulated for the advancement of the energy sector. It positioned specified governing rules for the hydropower sector along with generation, transmission, and distribution function for the conception of an independent power system operation (also see Section 3.1). Along with that, to fulfill the household as well as industrial demand for energy, various policies were formulated, e.g., Water Resource Act 1992, Electricity Act 1992, Forest Sector Policies and Forest Act 1993, Water Resources Strategy 2002, National Water Plan 2005, Rural Energy Policy 2006, and National Electricity Crisis Resolution Action Plan 2008. The main objective of these policies is to reduce the reliance on the imported energy and to encourage renewable, alternative energy sources which can also aid in reducing the emissions from the energy sector.
Micro and mini hydropower, solar, wind, and biomass are some examples of RETs that are not only economically sound solutions, but also ideal energy source alternatives for rural and isolated places in developing nations such as Nepal as 33% of homes in Nepal’s rural areas lack access to electricity [89]. Although Nepal could employ numerous renewable energies beyond hydroelectricity, several barriers, including technological, social, regulatory, and political, economic, and institutional issues, make it difficult to do so [7] and development in this aspect is not possible if these barriers are not effectively removed. Such barriers and limitations are important to address for developing economies to use renewable energy more extensively and to improve energy access and security [90]. Moreover, this presents the potential to reduce the tradeoff condition between the targets.
Figure 13 shows the share of GHG emission from transport sector and renewable energy share in the final energy consumption of Nepal from 1990 to 2014.
The GHG emission from transport sector progressively increased from 0.3 MtCO2e in 1990 to 2.7 MtCO2e in 2014. There is a sharp rise in the emission between 2007 and 2009 from 0.9 MtCO2e to 1.8 MtCO2e, respectively, after which there is a steady increase. While the share of renewable energy in total final energy consumption is seen to decrease over time from 95.11% in 1990 to 84.37% in 2014, there was a small increase in the share of renewable energy in total final energy consumption between the years 2003 and 2007 from 89.44% to 91.31%. However, it continued to decline after that. Figure 13 shows the indirect relationship between the two variables, i.e., GHG emission from transport sector shows an exponential growth over time, whereas the share of renewable energy in the final energy consumption can be seen to decline with some cases of increment over time.
The explorative analysis shown in Figure 14 reveals the existence of negative synergy, i.e., trade-offs between the GHG emissions from the transport sector and renewable energy share in the final energy consumption. SDGs target 13.1.3.1 is to reduce the GHG emission from transport sector and target 7.2.1 is to increase the renewable energy share in the total final energy consumption (in Nepal). Thus, in terms of target, there is also a trade-off condition between emission reduction and renewable energy share in terms of final energy consumption. Due to the lack of authentic data for 2000–2004, the analysis was carried out for the four time slots.
The trade-off observed can be attributed to Nepal’s heavy dependence on imported petroleum products for transportation and lack of renewable energy use in the transport sector [91]. As explained above in Section 3.1 and Section 3.2, Nepal’s transport sector is predominantly fossil fuel intensive, making the ensuing emissions one of the major contributors in its emission scenario [92]. GoN proposed a plan for promoting and accelerating alternative means of transportation to reduce the dependency on fossil fuel in its 6th five-year plan, which conducted a feasibility study to electricity its transport sector. In 1993, battery-powered Safa tempos (clean three-wheeler) were in the public transport domain, with seven tempo manufacturing plants and 38 charging station installed and running [70]. However, myriad reasons, such as crippling power shortage, lack of institutional capacity, created major impediments for the intervention. Hence, the transport sector still relies on emission intensive fuels which can be understood in light of the trade-off observed between the two targets.
In recent years, Nepal has launched several policies with the aim of reducing emission from transportation sector, such as the environment friendly transport policy 2015 and national action plan for electric mobility which focuses on the reduction of emission from transport sector and subsequent increase in the share of electric vehicles. Nepal has aimed to increase the share of electric vehicles in public transport sector by up to 20%. Along with that, a subsidy has been provided for the promotion of electric and non-motorizes vehicles. Fossil fuel powered vehicles incur up to 261%, while private EV vehicles are taxed only 23% (10% import tax and 13% VAT). Moreover, there is a provision that the public EVs with the capacity to seat more than 14 passengers are levied only 14% (1% import tax and 13% VAT). This can encourage the conversion of regular vehicles to electric vehicle. In recent years, Nepal has controlled the use of vehicles which are more than 20 years old as they produce more GHGs [69]. This has caused the electric transport landscape of Nepal to change dramatically. For instance, in the year 2017, there were 21,000 EVs, including both private vehicles and public vehicles as per Electric vehicles association of Nepal (EVAN).
As Nepal plans to graduate from its LDC status, Nepal is going to observe an accelerated economic growth that can lead to overall demand in the vehicles. To achieve the required rate of economic growth of 9.2%, NPC has pointed some new policy options, such as change in resource allocation pattern, increase in the absorption capacity of economy, ensuring development friendly policy, and so forth. NPC has also estimated the need for investment to achieve this goal. The estimated growth rate of investment is 19% per annum [93]. The transport sector is identified as a major sector for the investment [28]. GoN has also identified transport development as one of its core strategies. However, due to Nepal’s geographical complexity, current settlement pattern, and slower development process, people from some parts of the country are still struggling to achieve the minimum access to the services and economic activities. Furthermore, looking at the past policies previous national periodic plans, we find that some effective policies were introduced but not implemented. For instance, in the first national plan (1956–61) the concept of ‘value capture’ was introduced for “the land whose value is increased due to construction of road should be taxed”, but never implemented [85]. This can be detrimental if it continues to follow the same trend. With a lack of renewable energy to meet Nepal’s growing transport need, emissions from the sector can be expected to grow exponentially.

4.2. Synergy between SDG 13 and SDG 12

Figure 15 shows the share of GHG emission (CH4, N2O) from agricultural sector and the land use for agricultural production (cereal as % of cultivated land) in Nepal from the year 1990 to 2014.
The share of N2O is less than that of CH4, however, there is a steady increase in the GHG emission from agriculture sector. In the year 1990, 14.35 MtCO2e and 3.58 MtCO2e can be compared to the year 2014, where 19.33 MtCO2e and 5.47 MtCO2e of CH4 and N2O were emitted, respectively, from agricultural production. There has been a variation in emission of N2O rather than in the emission of CH4 production from agricultural production. This stipulates that there has been a substantial rise in the usage of fertilizer to enhance the agricultural production over the years. Due to this fluctuation, even though there has not been a significant rise in the land area used for cereal production as shown in the Figure 15, a rise and fall in the emission are seen. The two variables under observation, GHG emission (CH4, N2O) from agricultural sector and land use for agricultural production, show positive correlation (from pair-wise Pearson’s correlation in Appendix B) over the years in observation.
The strength of the explorative analysis in synergy analysis between the two variables can be seen in Figure 16.
The SDGs targets 13.1.3.4, 13.1.3.5 aim to reduce in GHG emissions from agricultural sector and target 12.2.2.3 to decrease the land use for agricultural production (cereal cultivation) (in Nepal). Thus, this scale in terms of the target could be read as negative, showing a tradeoff between emission reduction and land use for agriculture production. This can be attributed to the intensification of agricultural practice through the application of fertilizer to increase the yield while maintaining the land use under agriculture production post 1994. In Nepal, 75% of the population mostly residing in the rural areas depend on agriculture which is heavily impacted by climate change. On the contrary, agriculture related emission accounts for more than half of Nepal’s GHG emission scenario (50.1%) [94,95]. The effects of climate change related externalities, such as rise in temperature and erratic rainfall, have caused several impacts on the agriculture sector, such as loss of useful growing land to drought or flood, but also has some positive impacts, such as warming previously unusable lands, allowing farmers to plant crops that would not have survived [96]. However, the impact varies depending on the locality and geographical positioning of the area.
Given the population rise, the population’s engagement, and economic implication of agriculture in Nepalese economy (28% to its GDP) [70], the corresponding food demand are surging in tandem. Hence, it is essential for Nepal to enhance its level of crop productivity. Rice, wheat, and maize are the most important staple food crops in Nepal. However, they are also very emission intensive. Flooded rice is one of the major biogenic methane sources [93] and methane in the paddy soil is directly released to the atmosphere through rice plants. To meet the food demand, Nepal’s agricultural practices has been dependent on the excessive use of fertilizers [97]. However, the use of fertilizers has resulted in the increased emission of nitrous oxide. In Nepal, cereal cultivation was the second largest source of agriculture emission following the emissions from enteric fermentation, manure left on pasture, and manure management [93,98]. With the GoN’s aim to limit the land use for agricultural production (cereal), the use of fertilizer to increase the yield can be detrimental in terms of the other goal to limit the emission from agricultural sector. A decline in the land area used for crop production purposes could trigger higher emissions of GHG both in the short and long run [99].
The Agriculture Perspective Plan (1995–2015) focused on agriculture development through increased factor productivity and emphasized the technology-based green revolution in agriculture, ensuring regional balance [96]. Similarly, the National Agriculture Policy, 2004 also emphasized enabling an environment for agriculture led rural development. The policy aimed at achieving high and sustainable economic growth through a commercial agriculture system contributing to food security and poverty reduction. However, despite the effort, we find that policies have not been effective as the emission from the agriculture sector is still rising even with efforts to maintain the land area under cultivation.
In recent years, Nepal has placed several policies to reduce the emission from agriculture and to enhance the productivity. For example, the Agricultural Development Strategy (2015–2035) includes a 10-year action plan and roadmap that aims for lower carbon emission. Its 14th plan of Nepal (2016/17–2018/19) which falls in the time frame under analysis has further given high priority for the entire agricultural and rural development spectrum as well as related rural development topics, including the environment [100]. The full potential of these policies along with the adoption of modern agricultural technologies and practices could help in the reduction of the emission from this sector while meeting the agricultural demand and securing food security.

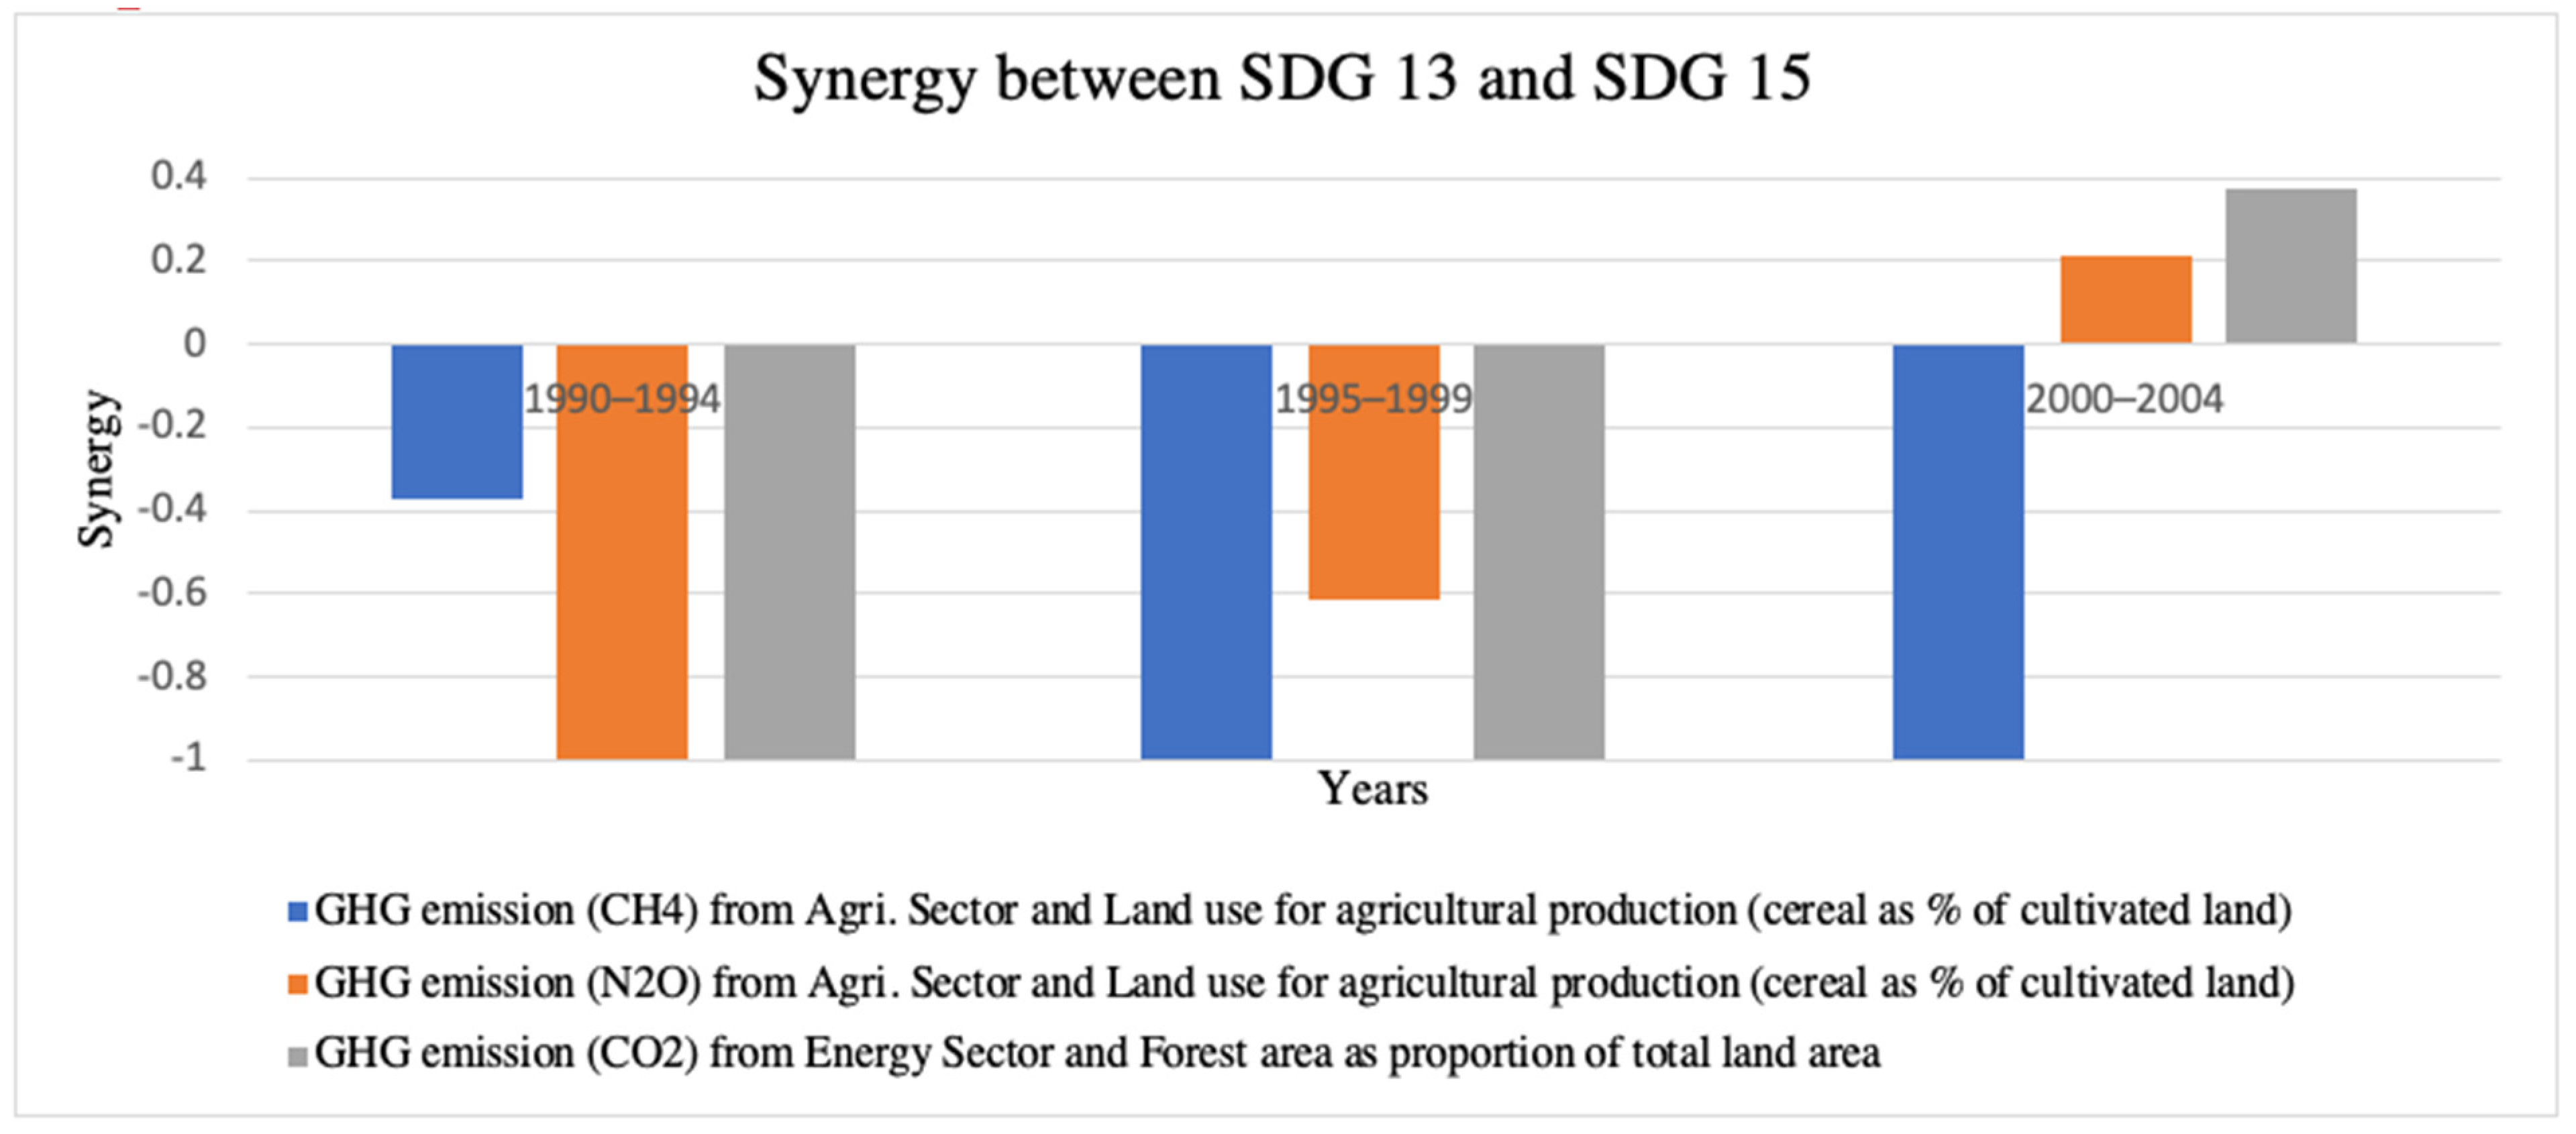
4.3. Synergy between SDG 13 and SDG 15

Figure 17 shows the share of overall GHG emission (Agricultural, Energy Sector) representing three targets under SDG 13 and forest area (% of Land Area) from SDG 15.
The GHG emission from transport sector has progressively increased from 0.3 MtCO2e in 1990 to 2.7 MtCO2e in 2014, where there was a sharp rise in the emissions between 2007 to 2009 from 0.9 MtCO2e to 1.8 MtCO2e, after which it increases steadily as shown in Figure 17. The GHG (CO2) emission from energy sector was found to gradually increase from 0.8 MtCO2e in 1990 to 5.6 MtCO2e in 2015. Moreover, a certain drop can be seen in the emission from 3.4 MtCO2e in 2001 to 2.6 MtCO2e in 2002, but after that it continued to increase steadily. Lastly, there is a steady increase in the GHG emission from agriculture sector. In the year 1990, 14.35 MtCo2e and 3.58 MtCO2e can be compared to the year 2014, where 19.33 MtCO2e and 5.47 MtCO2e of CH4 and N2O were emitted respectively from cereal cultivation. The rapid decline in the forest area over time can also be seen, from covering 33.69% of total land area in 1990 to 25.37% of total land area in 2005. Comparing Figure 17 for the time span of 1990–2005, the emission from various sector is seen to be increasing whereas the rate of forest area is declining, indicating a negative relation between the variables.
Here, explorative analysis in Figure 18 was carried out between the 1990 to 2005 due to unavailability of the data and the interpretation of the results was carried out considering that time frame. SDG targets 13.1.3.1, 13.1.3.4, 13.1.3.5, and 13.1.3.8 aim to reduce the GHG emission and target 15.1.1 to increase the forest area as a proportion of total land area (in Nepal). Thus, in terms of targets, there is also a majority trade-off condition with exception in the later time slot.
The tradeoff observed can be attributed to the significant loss of forest in Nepal due to the expansion of farmlands, government revenue, as well as uncontrolled and unsustainable use of forests and forest products. Forest area, quality, quantity, and density have decreased considerably as a result of the uncontrolled and unsustainable use of forests and forest products to meet the demand for timber, pole, fuel wood, fodder, grass, leaf litter, other non-timber forest products, and biomass for a growing population with huge demand from growing urban centers [20,82,83]. The tradeoff observed from 1990 to 2000 in Figure 18 can be attributed to such practices as 75% of Nepal’s energy requirement was met by fuelwood in 1997 and approximately 80% by fuelwood, fodder, and small timber requirements of the people living in the rural areas was met from forestry sources, resulting in a deficit in national biomass balance [101]. The extensive use of traditional biomass fuels also adds a daily financial burden in rural areas and contributes to deforestation (which makes it harder to find firewood and raises the cost and collection time) and increases greenhouse gas (GHG) emissions in poor and developing nations such as Nepal where access to clean energy is limited and unreliable [82,83,84,85]. Further, 90% of primary energy consumption of Nepal was delivered by biomass resources, making forests the major source. The sustainable fuelwood yield of Nepal’s forest was found to be far less than the total consumption, which caused severe forest degradation [49] in Nepal during the time-period under examination (i.e., 1990–2018) [48,49].
To tackle this issue, GoN first revised its forest act, overturned the nationalization of its forests, and handed over the forest to community for a community forest program. It implemented a nationwide program of decentralized forest management which resulted in significant long-term, permanent enhancement of forest biomass, particularly managed by community forest users’ groups and similar local level bodies. This has helped in reducing the GHG emission through deforestation and upon maturing of the forest has acted a pool to sequester carbon. This is signified in Figure 18 as in 2000 onwards synergy is seen between the two targets. As mentioned earlier, agriculture is one of the major contributors to Nepalese economic, employing nearly two third of its population. Nepal plans to increase its agricultural productively to meet its growing demand for food. Hence, agricultural land expansion and intensification are eminent. This can further degrade and reduce the forest area if good governance is not practiced as it is closely linked [102] and could hamper the attainment of both targets, with a reduction in emission from the agricultural sector and increase in forest area.
In recent years, to combat the issue growing of deforestation and forest degradation, GoN has adopted strategies centered around 1976 National Forest Plan, which promotes community participation in a sustainable forest management approach. This approach has been successful in both ecological restoration and sustainable livelihood enhancement [103]. Nepal has made significant improvements in forest management with the launch of second national workshop on community forests that focused on issues related to the organizational structure of the Department of Forests, bottom-up planning, and involvement of NGOs as a key to the success of community forestry program. The 9th five-year plan further emphasized the appropriate management and utilization of forest resources through maintaining a balance between the environment and development. Moreover, it has also implemented landscape programs, such as Tarai Arc Landscape (TAL), Kailash Sacred Landscape Conservation and Development Initiative (KSLCDI), Kangchenjunga Landscape Conservation and Development Initiative (KLCDI), and Chitwan Annapurna Landscape (CHAL), in line with its SDG 15 commitment [104,105,106]. As a result, there can be seen synergy among the targets in the later time slot (2000–2004) with the increase in forest area. Furthermore, forest sector policy and the forest decade program 2015–2025 have also been implemented to prescribe a handover of the barren and isolated forestlands as a community forest, with the harvesting of forest products regulated and sectoral strategies which aim for sustainable production and supply of forest products and increased contribution to national economic development. However, despite the mentioned policies and effort by the GoN, we find that the anticipated outcome of an increase in forest area has not been achieved and the forests of Nepal are still exposed to threats from different drivers, such as population growth, unsustainable harvesting of forest products, and unsystematic development activities.

5. Conclusions and Way Forward

This study applied a mixed methodology framework to analyze and evaluate the synergies and trade-offs among SDGs related to climate action, energy share, consumption and production, and forest management. We find that the GHG emission, economic activities and energy consumption are strongly interlinked. Hence, the achievement of SDGs calls for a synergistic approach to tackle the constant trade-offs observed between the SDGs. We find that even though Nepal has introduced some effective policies, their implementation has not been carried out, which has resulted in a continual trade-off condition between its sustainable development aspirations.
This is particularly important for Nepal to become a middle-income country in the near future. The constant trade-off observed through the years between climate action and energy uses and GHG emission from energy and transport sectors with the per capita energy consumption; the increased emissions in comparison to the renewable energy share in total final consumption are some prime challenges that need to be addressed. These challenges will be accelerated further with the increase in economic activities with the continued usage of traditional energy sources such as fossil fuel (for transport), inefficient use of biomass, and subsequent deforestation for fuel woods. These are major factors increasing GHG emissions from the energy sector in Nepal. Thus, substituting the emission intensive energy sources with renewable technology can aid in reducing the emission from the energy sector. This implies that Nepal should build policies relating to a reduction of energy consumption, through the integration of more renewable energy in its energy mix, along with an improvement in energy efficiency, followed by investigating new possible energy sources, specifically how they could reduce the level of GHG emissions without affecting the country’s economic growth [54].
Furthermore, this study found a continual trade-off condition between climate action; reduction of GHG emission from energy and agricultural sectors with land use for agricultural production and forest area over the years under observation. As, the GHG emission induced climate can further depress the prospects of ensuring the sustainability of the Nepalese agricultural sector and its whole economy. Forests and forest products have been a source of income for Nepal’s growing population and represent a major contributor to its economy. Consequently, with forest degradation and deforestation increasing due to agricultural expansion and reliance on traditional sources of energy such as biomass and fuel wood [48], it has become even more necessary to have a reliable climate resilient forest management system [84]. Therefore, it becomes crucial for Nepal to understand forest management as it is critical in mitigating and minimizing the effects of climate change and enhancing the adaptive capacity of its people. Furthermore, the agriculture sector is a major contributor to Nepal’s employment and economic growth levels. However, this study finds that it is associated with rising GHG emissions in Nepal’s emission scenario. So, considering the trade-off condition between climate action and rising emission from Nepal’s agricultural sector, this study recommends an adoption of policies that can enhance its agricultural productivity via stimulating green agricultural practices that minimize the use of chemical fertilizers to reduce the possible emissions from this sector [97].

Limitations and Future Research Direction

The framework applied in this study has some limitations, as synergy/trade-off analysis is limited to a linear relation between the sustainable development goals (i.e., SDG 13 to SDG 7, SDG 12, and SDG 15 separately) due to data unavailability and to reduce complexity. However, the framework can be applied with extended boundaries, including more SDGs, and interpreted to analyze the dual interaction, e.g., making the analysis in three dimensions. Synergy between the three variables can be calculated as a ratio of the volume of the cube ΔxΔyΔz (z being the third dimension) to the maximum volume as explained by Luukkanen et al. [37]. However, the interpretation of the three-dimensional calculation results is a bit complex, especially when working with limited sets of data. Thus, our analysis within this study is limited to the synergy/trade-off analysis of pairwise targets. Still, the method proposed here may be used to illustrate the connections between the SDGs and track sustainable development in a more integrated way. The evaluation of synergy/trade-off proposed in this paper indicates possible (potential) causality rather than inferring a causal relationship between the variables, and the precision of synergy analysis increases with improved and long-term data. The framework used in this study can be useful in strategic nexus analyses. These evaluations could help to analyze if applied sectoral and cross-sectoral policies result in synergetic development of the different sustainability goals. The lessons learnt can be reflected in policy improvements and greater coherency.

Author Contributions

P.T. (first author) collected the data, performed literature review, assisted in building the conceptual framework, analysis, and structure of the paper. The first author built the conceptual framework with the support from B.M. (second author). The second author also helped to review and revise the draft. S.D. (third author) supervised the execution of the research. Further, all the authors contributed to the interpretation of the results and conclusions drawn. All authors have read and agreed to the published version of the manuscript.

Funding

This research received no external funding.

Data Availability Statement

The authors confirm that the data supporting the findings of this study are available within the article.

Acknowledgments

The authors would like to acknowledge Subina Shrestha from Asian Institute of Technology for the internal review and Ahmad Mazaheri from Linnaeus University for helping us to construct the graphical abstract.

Conflicts of Interest

The authors declare no conflict of interest.

Appendix A

Table A1. Historical dataset for SDG13 and percent change calculation.
YearsT 13.1.3.1 GHG
Emission from Transport Sector MtCO2e Source: CAIT
%
Change in GHG
Emission from Transport Sector
T 13.1.3.4 GHG
Emission (CH4)
from Agri. Sector MtCO2e Source: CAIT
%
Change in GHG Emission (CH4)
from Agri. Sector
T 13.1.3.5 GHG
Emission (N2O)
from Agri. Sector MtCO2e Source: CAIT
%
Change in GHG Emission (N2O)
from Agri. Sector
T 13.1.3.8 GHG
Emission (CO2)from Energy Sector (Industrial, Transport and Others) MtCO2e Source:
CAIT
%
Change in GHG Emission (CO2)
from Energy Sector
19900.3-14.38-3.58-0.8-
19910.40.3333314.3−0.00563.610.008381.10.375
19920.4013.93−0.02593.59−0.00550.9−0.1818
19930.50.2514.450.037333.630.011141.40.55556
19940.60.214.650.013843.750.033061.70.21429
19950.6015.40.051193.90.041.80.05882
19960.6015.630.014943.990.023081.80
19970.70.1666715.770.008964.050.015042.10.16667
19980.80.1428615.920.009514.160.027162.20.04762
19990.8016.110.011934.06−0.02430.36364
20000.8016.240.008074.05−0.002530
20010.8016.280.002464.070.004943.40.13333
20020.8016.470.011673.96-0.0272.6−0.2353
20030.8016.70.013963.93−0.00762.90.11538
20040.8016.960.015574.020.02292.7−0.069
20050.8017.150.01124.040.0049830.11111
20060.90.12517.390.013994.130.022282.5−0.1667
20070.9017.440.002884.160.007262.6−0.04
20081.30.44444180.032114.290.0312530.15385
20091.80.3846218.420.023334.550.060613.50.16667
20101.90.0555618.530.005974.710.0351640.14286
201120.0526318.890.019434.960.053084.40.1
20122.20.119.270.020125.040.0161350.13636
20132.40.0909119.22−0.00265.270.045635.90.18
20142.70.12519.330.005725.470.037955.90
Table A2. Historical dataset for SDG 7 and percent change calculation.
YearsT 7.1.1.1
per Capita Energy (Final) Consumption (Gj) Source: World
Bank Database
% of Change in Energy Use per CapitaT 7.2.1
Renewable Energy Consumption (% of Final Energy Consumption) Source: World BankDatabase
% Change in Renewable energy Consumption (% of Final Energy Consumption)
19900.03349-95.11971-
19910.046050.37594.188650.02208
19920.03768−0.181894.161050.02131
19930.058620.5555693.545550.02168
19940.071180.2142992.380240.02253
19950.075360.0588291.73240.02311
19960.07536091.515460.02246
19970.087920.1666790.708660.02187
19980.092110.0476290.491180.02245
19990.12560.3636488.052430.02396
20000.1256088.284550.06062
20010.142350.1333387.756510.02746
20020.10886−0.235389.94330.03617
20030.121420.1153889.442880.02326
20040.11304−0.06990.297010.02354
20050.12560.1111189.517380.02256
20060.10467−0.166791.253260.01932
20070.108860.0491.312270.02172
20080.12560.1538590.468930.02025
20090.146540.1666788.927090.01472
20100.167470.1428687.292450.01133
20110.184220.186.945510.03075
20120.209340.1363684.69734−0.0688
20130.247020.1886.25310.13245
20140.24702084.374790.01502
Table A3. Historical dataset for SDG 12 and percent change calculation.
YearsT 12.2.2.1
(%) Use of Fossil Fuel Energy Consumption Source: World Bank Database
% Change in Use of Fossil Fuel Energy ConsumptionT 12.2.2.3
Land Use for Agricultural Production (Cereal as % of Cultivated Land)
Source: World Bank Database
% of Change in Land Use for Agricultural Production (Cereal as % of Cultivated Land)
19905.05114-3,045,230-
19916.009830.228162,986,490−0.01929
19926.287240.06872,840,020−0.04904
19936.701780.096283,105,5100.093482
19947.853940.213413,031,239−0.02392
19958.558690.122823,213,5800.060154
19968.668710.038053,257,7900.013757
19979.655920.148333,262,3400.001397
19989.930470.0543,259,770−0.00079
199912.50620.3253132,89,8750.009235
200011.97370.012823,330,7400.012421
200112.35250.066283,270,617−0.01805
200210.1577−0.16863,334,2590.019459
200310.610.074763,347,1990.003881
20049.70524−0.07263,355,0240.002338
200510.64680.131593,363,2950.002465
20068.83105−0.17063,370,9340.002271
20078.61563−0.00383,314,830−0.01664
20089.886060.181543,428,0110.034144
200911.03910.152713,428,4240.00012
201012.59690.175683,393,553−0.01017
201112.98680.066893,478,8130.025124
201215.19160.118213,484,5320.001644
201313.6780.00123,339,077−0.04174
201415.48270.174533,480,0520.04222
Table A4. Historical dataset for SDG 15 and percent change calculation.
YearT 15.1.1
Forest Area (% of Land Area)
Source: FAO Database
% Change in Forest Area (% of Land Area)
199033.685-
199133.044−0.01903
199232.403−0.0194
199331.762−0.01978
199431.12−0.02021
199530.479−0.0206
199629.838−0.02103
199729.197−0.02148
199828.555−0.02199
199927.914−0.02245
200027.206−0.02536
200126.838−0.01353
200226.469−0.01375
200326.101−0.0139
200425.733−0.0141
200525.364−0.01434

Appendix B. Pairwise Pearson’s Correlation Coefficient Calculation

Pairwise Pearson’s correlation was calculated by dividing the covariance of the two variables by the product of their standard deviation. It defines the extent and the direction of the linkages between two variables i.e., targets. This only reflects the linear relationship.
Table A5. Pairwise Pearson’s Correlation Between SDG 13 and SDG 7.
SDG_13.1.3.1SDG_13.1.3.8SDG_7.1.1.1SDG_7.2.1
SDG_13.1.3.110.93 *0.93 *−0.84 *
SDG_13.1.3.80.93 *11−0.95 *
SDG_7.1.1.10.93 *11−0.95 *
SDG_7.2.1−0.84 *−0.95 *−0.95 *1
Note: Statistical level of correlation coefficient have been presented in stars: p ≤ 0.01 * (highly significant).
Table A6. Pairwise Pearson’s Correlation Between SDG 13 and SDG 12.
SDG_13.1.3.4SDG_13.1.3.5SDG_13.1.3.8SDG_12.2.2.1SDG_12.2.2.3
SDG_13.1.3.110.920.950.930.82 *0.86
SDG_13.1.3.40.9210.910.920.900.89 *
SDG_13.1.3.50.950.9110.950.920.74 *
SDG_13.1.3.80.930.920.9510.93 *0.90
SDG_12.2.2.10.82 *0.900.920.93*10.90 *
SDG_12.2.2.30.860.89 *0.74 *0.900.901
Note: Statistical level of correlation coefficient have been presented in stars: p ≤ 0.01 * (highly significant).
Table A7. Pairwise Pearson’s Correlation Between SDG 13 and SDG 15.
SDG_13.1.3.4SDG_13.1.3.5SDG_13.1.3.8SDG_15.1.1
SDG_13.1.3.110.920.910.93−0.94 *
SDG_13.1.3.40.9210.910.92−0.97 *
SDG_13.1.3.50.900.9110.95−0.82 *
SDG_13.1.3.80.930.920.951−0.94 *
SDG_15.1.1−0.94 *−0.97 *−0.82 *−0.94 *1
Note: Statistical level of correlation coefficient have been presented in stars: p ≤ 0.01 * (highly significant).

References

  1. Opoku, A. SDG2030: A sustainable built environment’s role in achieving the post-2015 United Nations Sustainable Development Goals. In Proceedings of the 32nd Annual ARCOM Conference, Manchester, UK, 5–7 September 2016; Association of Researchers in Construction Management: Manchester, UK, 2016; Volume 2, pp. 1149–1158. [Google Scholar]
  2. Leal Filho, W.; Tripathi, S.K.; Andrade Guerra, J.B.S.O.D.; Giné-Garriga, R.; Orlovic Lovren, V.; Willats, J. Using the sustainable development goals towards a better understanding of sustainability challenges. Int. J. Sustain. Dev. World Ecol. 2019, 26, 179–190. [Google Scholar] [CrossRef]
  3. Lim, M.M.; Jørgensen, P.S.; Wyborn, C.A. Reframing the sustainable development goals to achieve sustainable development in the Anthropocene—A systems approach. Ecol. Soc. 2018, 23, 1–19. [Google Scholar] [CrossRef] [Green Version]
  4. Lee, B.X.; Kjaerulf, F.; Turner, S.; Cohen, L.; Donnelly, P.D.; Muggah, R.; Davis, R.; Realini, A.; Kieselbach, B.; MacGregor, L.S.; et al. Transforming Our World: Implementing the 2030 Agenda Through Sustainable Development Goal Indicators. J. Public Health Policy 2016, 37, S13–S31. [Google Scholar] [CrossRef] [PubMed]
  5. Weitz, N.; Carlsen, H.; Nilsson, M.; Skånberg, K. Towards systemic and contextual priority setting for implementing the 2030 agenda. Sustain. Sci. 2018, 13, 531–548. [Google Scholar] [CrossRef] [Green Version]
  6. Mainali, B.; Luukkanen, J.; Silveira, S.; Kaivo-Oja, J. Evaluating synergies and trade-offs among Sustainable Development Goals (SDGs): Explorative analyses of development paths in South Asia and Sub-Saharan Africa. Sustainability 2018, 10, 815. [Google Scholar] [CrossRef] [Green Version]
  7. Fader, M.; Cranmer, C.; Lawford, R.; Engel-Cox, J. Toward an understanding of synergies and trade-offs between water, energy, and food SDG targets. Front. Environ. Sci. 2018, 6, 112. [Google Scholar] [CrossRef]
  8. Mosquera-Losada, M.R.; Moreno, G.; Pardini, A.; McAdam, J.H.; Papanastasis, V.; Burgess, P.J.; Lamersdorf, N.; Castro, M.; Liagre, F.; Rigueiro-Rodríquez, A. Past, present and future of agroforestry systems in Europe. In Agroforestry—The Future of Global Land Use; Nair, P.K.R., Garrity, D., Eds.; Springer: Dordrecht, The Netherlands, 2012; Volume 9, pp. 285–311. [Google Scholar]
  9. Jessel, S.; Sawyer, S.; Hernández, D. Energy, poverty, and health in climate change: A comprehensive review of an emerging literature. Front. Public Health 2019, 7, 357. [Google Scholar] [CrossRef] [Green Version]
  10. Parry, M.L.; Canziani, O.; Palutikof, J.; Van der Linden, P.; Hanson, C. (Eds.) Climate Change 2007-Impacts, Adaptation and Vulnerability: Working Group II Contribution to the Fourth Assessment Report of the IPCC; Cambridge University Press: Cambridge, UK, 2007; Volume 4. [Google Scholar]
  11. Huq, S.; Reid, H.; Konate, M.; Rahman, A.; Sokona, Y.; Crick, F. Mainstreaming adaptation to climate change in least developed countries (LDCs). Clim. Policy 2004, 4, 25–43. [Google Scholar] [CrossRef]
  12. Wright, H.; Huq, S.; Reeves, J. Impact of Climate Change on Least Developed Countries: Are the SDGs Possible? International Institute for Environment and Development (IIED): London, UK, 2015. [Google Scholar]
  13. IPCC Intergovernmental Panel on Climate Change. Special Report on Climate Change, Desertification, Land Degradation, Sustainable Land Management, Food Security, and Greenhouse Gas Fluxes in Terrestrial Ecosystems; IPCC Special Reports; WMO: Geneva, Switzerland; UNEP: Nairobi, Kenya, 2019. [Google Scholar]
  14. Roy, J.; Tscharket, P.; Waisman, H.; Abdul Halim, S.; Antwi-Agyei, P.; Dasgupta, P.; Hayward, B.; Kanninen, M.; Liverman, D.; Okereke, C.; et al. Sustainable Development, Poverty Eradication and Reducing Inequalities; Cambridge University Press: Cambridge, UK; New York, NY, USA, 2018; pp. 445–538. [Google Scholar] [CrossRef]
  15. Nash, J.; Peña, O.; Galford, G.L.; Gurwick, N.; Pirolli, G.; White, J.M.; Wollenberg, E.K. Reducing Food Loss in Agricultural Development Projects through Value Chain Efficiency. CCAFS Working Paper. 2017. Available online: https://cgspace.cgiar.org/bitstream/handle/10568/89103/CCAFS%20Working%20Paper%20204.pdf?sequence=1 (accessed on 2 December 2022).
  16. Su, B.; Huang, J.; Fischer, T.; Wang, Y.; Kundzewicz, Z.W.; Zhai, J.; Sun, H.; Wang, A.; Zeng, X.; Wang, G.; et al. Drought losses in China might double between the 1.5 C and 2.0 C warming. Proc. Natl. Acad. Sci. USA 2018, 115, 10600–10605. [Google Scholar] [CrossRef]
  17. CBS. National Climate Change Impact Survey 2016: A Statistical Report; Central Bureau of Statistics: Kathmandu, Nepal, 2017. [Google Scholar]
  18. MoE. Mountain environment and climate change in Nepal. In Country Report for the International Conference of Mountain Countries on Climate Change; MoE: Kathmandu, Nepal, 2012. [Google Scholar]
  19. Mahat, T.J.; Bláha, L.; Uprety, B.; Bittner, M. Climate finance and green growth: Reconsidering climate-related institutions, investments, and priorities in Nepal. Environ. Sci. Eur. 2019, 31, 46. [Google Scholar] [CrossRef] [Green Version]
  20. Ranabhat, S.; Ghate, R.; Bhatta, L.D.; Agrawal, N.K.; Tankha, S. Policy coherence and interplay between climate change adaptation policies and the forestry sector in Nepal. Environ. Manag. 2018, 61, 968–980. [Google Scholar] [CrossRef] [PubMed]
  21. Darjee, K.B.; Sunam, R.K.; Köhl, M.; Neupane, P.R. Do National Policies Translate into Local Actions? Analyzing Coherence between Climate Change Adaptation Policies and Implications for Local Adaptation in Nepal. Sustainability 2021, 13, 13115. [Google Scholar] [CrossRef]
  22. Shawoo, Z.; Maltais, A.; Dzebo, A.; Pickering, J. Political drivers of policy coherence for sustainable development: An analytical framework. Environ. Policy Gov. 2022. [Google Scholar] [CrossRef]
  23. Huttunen, S.; Kivimaa, P.; Virkamäki, V. The need for policy coherence to trigger a transition to biogas production. Environ. Innov. Soc. Transit. 2014, 12, 14–30. [Google Scholar] [CrossRef]
  24. Behboudi, R.; Majid, M.R.; Johar, F. Horizontal coherence in environmental policies of Iskandar Malaysia. J. Teknol. 2015, 73. [Google Scholar] [CrossRef] [Green Version]
  25. Perera, N.; Boyd, E.; Wilkins, G.; Itty, R.P. Literature Review on Energy Access and Adaptation to Climate Change; Evidence on Demand: UK, 2015. Available online: https://assets.publishing.service.gov.uk/media/57a0896b40f0b652dd0001fe/LitRev-EnergyAccessandAdaptation-Final-2.pdf (accessed on 2 December 2022).
  26. Fuso Nerini, F.; Tomei, J.; To, L.S.; Bisaga, I.; Parikh, P.; Black, M.; Borrion, A.; Spataru, C.; Castán Broto, V.; Anandarajah, G.; et al. Mapping synergies and trade-offs between energy and the Sustainable Development Goals. Nat. Energy 2018, 3, 10–15. [Google Scholar] [CrossRef] [Green Version]
  27. Alfredsson, E.; Bengtsson, M.; Brown, H.S.; Isenhour, C.; Lorek, S.; Stevis, D.; Vergragt, P. Why achieving the Paris Agreement requires reduced overall consumption and production. Sustain. Sci. Pract. Policy 2018, 14, 1–5. [Google Scholar] [CrossRef]
  28. National Planning Commision. Nepal’s Sustainable Goals, Status and Roadmap: 2016–2030; Government of Nepal, National Planning Comminsion: Kathmandu, Nepal, 2017.
  29. Mainali, B.; Pachauri, S.; Rao, N.D.; Silveira, S. Assessing rural energy sustainability in developing countries. Energy Sustain. Dev. 2014, 19, 15–28. [Google Scholar] [CrossRef]
  30. Mainali, B.; Silveira, S. Alternative pathways for providing access to electricity in developing countries. Renew. Energy 2013, 57, 299–310. [Google Scholar] [CrossRef]
  31. Pachauri, S.; Cherp, A. Energy security and energy access: Distinct and interconnected challenges. Curr. Opin. Environ. Sustain. 2011, 3, 199–201. [Google Scholar] [CrossRef]
  32. Nilsson, M.; Griggs, D.; Visbeck, M. Policy: Map the interactions between Sustainable Development Goals. Nature 2016, 534, 320–322. [Google Scholar] [CrossRef] [PubMed] [Green Version]
  33. Le Blanc, D. Towards Integration at Last? The Sustainable Development Goals as a Network of Targets. Sustain. Dev. 2015, 23, 176–187. [Google Scholar] [CrossRef]
  34. Weitz, N.; Nilsson, M.; Davis, M. A Nexus Approach to the Post-2015 Agenda. SAIS Rev. Int. Aff. 2014, 34, 37–50. [Google Scholar] [CrossRef]
  35. Srivastava, P.; Hopwood, N. A practical iterative framework for qualitative data analysis. Int. J. Qual. Methods 2009, 8, 76–84. [Google Scholar] [CrossRef] [Green Version]
  36. Bruce, C. Questions arising about emergence, data collection, and its interaction with analysis in a grounded theory study. Int. J. Qual. Methods 2007, 6, 51–68. [Google Scholar] [CrossRef] [Green Version]
  37. Luukkanen, J.; Vehmas, J.; Panula-Ontto, J.; Allievi, F.; Kaivo-oja, J.; Pasanen, T.; Auffermann, B. Synergies or Trade-offs? A New Method to Quantify Synergy Between Different Dimensions of Sustainability. Environ. Policy Gov. 2012, 22, 337–349. [Google Scholar] [CrossRef] [Green Version]
  38. Kaivo-oja, J.; Luukkanen, J.; Malaska, P. Advanced sustainability analysis. Dimens. Sustain. Dev. 2009, II, 110. [Google Scholar]
  39. Hoffrén, J.; Luukkanen, J.; Kaivo-oja, J. Decomposition analysis of Finnish material flows: 1960–1996. J. Ind. Ecol. 2000, 4, 105–125. [Google Scholar] [CrossRef]
  40. Kaivo-oja, J.; Vehmas, J.; Luukkanen, J. A note: De-growth debate and new scientific analysis of economic growth. J. Environ. Prot. 2014, 5, 51794. [Google Scholar] [CrossRef] [Green Version]
  41. Series, W.P. Working Paper Series Macroeconomic Policy and Financing for Development Division Nepal’ s Graduation from the Least Developed Country Group: Potential Implications and Issues for Consideration. 2020. Available online: https://repository.unescap.org/handle/20.500.12870/1221 (accessed on 27 October 2021).
  42. Rai, T.R. Nepal’ s LDC Graduation Target and It’ s Challenges. Civ. Serv. J. 2017, 38, 167–175. [Google Scholar]
  43. Federation of Nepalese Chambers of Commerce and Industries. Nepal: Nepal’s Graduation from LDC—A Private Sector Perspective. 2021. Available online: https://www.fncci.org/publication/detail.php?id=46#:~:text=The%20United%20Nations%20General%20Assembly,2026%20on%2024th%20November%202021 (accessed on 18 July 2022).
  44. GoN. 2016 Nepal’s First NDC; Government of Nepal (GoN): Kathmandu, Nepal, 2016; Volume 23, pp. 28–38.
  45. Abdallah, L.; El-Shennawy, T. Reducing carbon dioxide emissions from electricity sector using smart electric grid applications. J. Eng. 2013, 2013, 845051. [Google Scholar] [CrossRef]
  46. Shahi, D.K.; Rijal, H.B.; Shukuya, M. A study on household energy-use patterns in rural, semi-urban and urban areas of Nepal based on field survey. Energy Build. 2020, 223, 110095. [Google Scholar] [CrossRef]
  47. Demirbaş, A. Biomass resource facilities and biomass conversion processing for fuels and chemicals. Energy Convers. Manag. 2001, 42, 1357–1378. [Google Scholar] [CrossRef]
  48. Surendra, K.C.; Khanal, S.K.; Shrestha, P.; Lamsal, B. Current status of renewable energy in Nepal: Opportunities and challenges. Renew. Sustain. Energy Rev. 2011, 15, 4107–4117. [Google Scholar]
  49. Bhattacharya, S.C.; Abdul Salam, P. Low greenhouse gas biomass options for cooking in the developing countries. Biomass Bioenergy 2002, 22, 305–317. [Google Scholar] [CrossRef]
  50. Chontanawat, J. Relationship between energy consumption, CO2 emission and economic growth in ASEAN: Cointegration and causality model. Energy Rep. 2020, 6, 660–665. [Google Scholar] [CrossRef]
  51. Pradhan, B.B.; Limmeechokchai, B. Electric and Biogas Stoves as Options for Cooking in Nepal and Thailand. Energy Procedia 2017, 138, 470–475. [Google Scholar] [CrossRef]
  52. Zhang, R.; Fujimori, S. The role of transport electrification in global climate change mitigation scenarios. Environ. Res. Lett. 2020, 15, 034019. [Google Scholar] [CrossRef]
  53. Chien, F.; Sadiq, M.; Nawaz, M.A.; Hussain, M.S.; Tran, T.D.; Le Thanh, T. A step toward reducing air pollution in top Asian economies: The role of green energy, eco-innovation, and environmental taxes. J. Environ. Manag. 2021, 297, 113420. [Google Scholar] [CrossRef]
  54. Asian Development Bank (ADB). Nepal Energy Sector Assessment, Strategy, and Road Map; ADB: Kathmandu, Nepal, 2017. [Google Scholar]
  55. Bengtsson, M.; Alfredsson, E.; Cohen, M.; Lorek, S.; Schroeder, P. Transforming systems of consumption and production for achieving the sustainable development goals: Moving beyond efficiency. Sustain. Sci. 2018, 13, 1533–1547. [Google Scholar] [CrossRef]
  56. NPC. An Approach Paper to the Thirteenth Plan (FY 2013/14–2015/16); National Planning Commission: Kathmandu, Nepal, 2013.
  57. WU Vienna. Comparing countries/regions by different indicators. In Visualization Based upon the UN IRP Global Material Flows Database; Vienna University of Economics and Business: Vienna, Austria, 2020; Available online: Materialflows.net/visualisation-centre (accessed on 15 December 2020).
  58. Steckel, J.C.; Brecha, R.J.; Jakob, M.; Strefler, J.; Luderer, G. Development without energy? Assessing future scenarios of energy consumption in developing countries. Ecol. Econ. 2013, 90, 53–67. [Google Scholar] [CrossRef]
  59. Baniya, B.; Aryal, P.P. Nepal’s domestic material consumption—Projection and causal impact of external financial inflows, services value-added, population, and economic growth. Environ. Sci. Pollut. Res. 2022, 29, 33674–33697. [Google Scholar] [CrossRef] [PubMed]
  60. Nepal, S.; Neupane, N.; Belbase, D.; Pandey, V.P.; Mukherji, A. Achieving water security in Nepal through unravelling the water-energy-agriculture nexus. Int. J. Water Resour. Dev. 2019, 37, 67–93. [Google Scholar] [CrossRef] [Green Version]
  61. Food and Agriculture Organisation (FAO). Towards a Water and Food Secure Future: Critical Perspectives for Policy-Makers; Food and Agriculture Organization of the United Nations: Rome, Italy; World Water Council: Marseille, France, 2015. [Google Scholar]
  62. Honkonen, T. Water security and climate change: The need for adaptive governance. Potchefstroom Electron. Law J./Potchefstroomse Elektron. Regsblad 2017, 20. [Google Scholar] [CrossRef] [Green Version]
  63. Jeong, J.; Ko, H. Bracing for Climate Impact: Renewables as a Climate Change Adaptation Strategy; International Renewable Energy Agency: Abu Dhabi, United Arab Emirates, 2021. [Google Scholar]
  64. Zhao, Y.; Shi, Q.; Qian, Z.; Zheng, L.; Wang, S.; He, Y. Simulating the economic and environmental effects of integrated policies in energy-carbon-water nexus of China. Energy 2022, 238, 121783. [Google Scholar] [CrossRef]
  65. Chandra, R.; Takeuchi, H.; Hasegawa, T. Methane production from lignocellulosic agricultural crop wastes: A review in context to second generation of biofuel production. Renew. Sustain. Energy Rev. 2012, 16, 1462–1476. [Google Scholar] [CrossRef]
  66. Raut, N.; Sitaula, B.K.; Bajracharya, R.M.; Karki, S. Methane emission from unsustainable crop production in Nepal, system of rice intensification as an option for mitigation. In Climate Change and Soil Interactions; Elsevier: Amsterdam, The Netherlands, 2020. [Google Scholar] [CrossRef]
  67. Chaudhary, D. Agricultural policies and rural development in Nepal: An overview. Res. Nepal J. Dev. Stud. 2018, 1, 34–46. [Google Scholar] [CrossRef]
  68. Awasthi, S.; Adhikari, N. Potential inter-fuel substitution between hydroelectricity and fossil fuels in Nepal. Econ. J. Dev. Issues 2018, 25–26, 26–46. [Google Scholar] [CrossRef] [Green Version]
  69. Ministry of Finance. 2019. Economic Survey 2018/2019. Available online: https://mof.gov.np/uploads/document/file/compiled%20economic%20Survey%20english%207-25_20191111101758.pdf (accessed on 16 October 2019).
  70. MoF. Economic Survey; Ministry of Finance: Kathmandu, Nepal, 2008.
  71. Acharya, N.; Ale, B.; Shakya, S.R. Urbanization and its Impact on Transport Sector Energy use in Kathmandu Valley. Int. Conf. Technol. Innov. Manag. 2014, 2000, 269–273. [Google Scholar]
  72. Government of Nepal. Nepal: Rapid Assessment and Gap Analysis. 2013. Available online: https://npc.gov.np/images/category/SE4ALL_RA_GA_Report_As_published.pdf?fbclid=IwAR2aqaz6jXUwF2R_sRMYOaiCvJRG3_VCrAFaIXNMqLr8nkorz2KTV218QXU (accessed on 12 June 2019).
  73. Government of Nepal. Nepal Second National Communication to the Conference of Parties of the United Nations Framework Convention on Climate Change. 2014. Available online: https://unfccc.int/resource/docs/natc/nplnc2.pdf (accessed on 2 December 2022).
  74. Bakrania, S. Urbanisation and urban growth in Nepal. In Governance. Social Development, Humanitarian Response and Conflict (GSDRC); Applied Knowledge Services of University of Birmingham: Birmingham, UK, 2015; Available online: http://www.gsdrc.org/wpcontent/uploads/2015/11/HDQ1294.pdf (accessed on 9 November 2010).
  75. De Jong, W.; Pokorny, B.; Katila, P.; Galloway, G.; Pacheco, P. Community forestry and the sustainable development goals: A two way street. Forests 2018, 9, 331. [Google Scholar] [CrossRef] [Green Version]
  76. National Adaptation Programme of Action (Nepal); Nepal Ministry of Environment. National Adaptation Programme of Action (NAPA) to Climate Change; Ministry of Environment, Government of Nepal: Kathmandu, Nepal, 2010.
  77. Lal, R. Forest soils and carbon sequestration. For. Ecol. Manag. 2005, 220, 242–258. [Google Scholar] [CrossRef]
  78. Shackleton, C.M.; Shackleton, S.E.; Buiten, E.; Bird, N. The importance of dry woodlands and forests in rural livelihoods and poverty alleviation in South Africa. For. Policy Econ. 2007, 9, 558–577. [Google Scholar] [CrossRef]
  79. Bonan, G.B. Forests and climate change: Forcings, feedbacks, and the climate benefits of forests. Science 2008, 320, 1444–1449. [Google Scholar] [CrossRef] [PubMed] [Green Version]
  80. Rijal, H.B. Firewood consumption in Nepal. In Sustainable Houses and Living in the Hot-Humid Climates of Asia; Springer: Singapore, 2018; pp. 335–344. [Google Scholar]
  81. Chaudhary, R.P.; Uprety, Y.; Rimal, S.K. Deforestation in Nepal: Causes, consequences and responses. In Biological and Environmental Hazards, Risks, and Disasters; 2016; pp. 335–372. Available online: https://www.academia.edu/27404457/Deforestation_in_Nepal_Causes_Consequences_and_Responses (accessed on 2 December 2022)ISBN 978-0-12-394847-2.
  82. Makundi, W.R. Global climate change mitigation and sustainable forest management—The challenge of monitoring and verification. Mitig. Adapt. Strateg. Glob. Chang. 1997, 2, 133–155. [Google Scholar] [CrossRef] [Green Version]
  83. Sajjad, H.; Kumar, P.; Masroor, M.; Rahaman, M.H.; Rehman, S.; Ahmed, R.; Sahana, M. Forest vulnerability to climate change: A review for future research framework. Forests 2022, 13, 917. [Google Scholar]
  84. Chitale, V.S.; Thapa, S.; Matin, M.A.; Gurung, K.; Adhikari, S.; Maharjan, R. Climate-resilient forest management in Nepal. In Earth Observation Science and Applications for Risk Reduction and Enhanced Resilience in Hindu Kush Himalaya Region; Springer: Cham, Switzerland, 2021; pp. 127–145. [Google Scholar]
  85. Pokharel, R.; Acharya, S.R. Sustainable transport development in Nepal: Challenges, opportunities and strategies. J. East. Asia Soc. Transp. Stud. 2015, 11, 209–226. [Google Scholar]
  86. Poudyal, R.; Loskot, P.; Nepal, R.; Parajuli, R.; Khadka, S.K. Mitigating the current energy crisis in Nepal with renewable energy sources. Renew. Sustain. Energy Rev. 2019, 116, 109388. [Google Scholar] [CrossRef]
  87. Bastola, U.; Sapkota, P. Relationships among energy consumption, pollution emission, and economic growth in Nepal. Energy 2015, 80, 254–262. [Google Scholar] [CrossRef]
  88. Katuwal, H.; Bohara, A.K. Biogas: A promising renewable technology and its impact on rural households in Nepal. Renew. Sustain. Energy Rev. 2009, 13, 2668–2674. [Google Scholar] [CrossRef]
  89. Ghimire, L.P.; Kim, Y. An analysis on barriers to renewable energy development in the context of Nepal using AHP. Renew. Energy 2018, 129, 446–456. [Google Scholar] [CrossRef]
  90. Sovacool, B.K.; Bambawale, M.J.; Gippner, O.; Dhakal, S. Electrification in the Mountain Kingdom: The implications of the Nepal Power Development Project (NPDP). Energy Sustain. Dev. 2011, 15, 254–265. [Google Scholar] [CrossRef]
  91. Prajapati, A.; Bajracharya, T.R.; Bhattarai, N.; Froyen, Y.K. Public Bus Accessibility and its Implications in Energy and Environment: A Case Study of Kathmandu Valley. J. Inst. Eng. 2019, 15, 253–260. [Google Scholar] [CrossRef]
  92. National Planning Commission. An Approach to the Graduation from the Least Developed Country by 2022; Government of Nepal: Kathmandu, Nepal, 2014.
  93. Liou, R.M.; Huang, S.N.; Lin, C.W. Methane emission from fields with differences in nitrogen fertilizers and rice varieties in Taiwan paddy soils. Chemosphere 2003, 50, 237–246. [Google Scholar] [CrossRef] [PubMed]
  94. World Resources Institute. Climate Analysis Indicators Tool (WRI CAIT 4.0). In GHG Emissions Are Expressed in Units of Carbon Dioxide Equivalent. Global Warming Potentials (GWPs) Are the 100-Year GWPs from the Intergovernmental Panel on Climate Change (IPCC) Second Assessment Report (SAR); World Resources Institute: Washington, DC, USA, 2017. [Google Scholar]
  95. Barrueto, A.K.; Merz, J.; Kohler, T.; Hammer, T. What prompts agricultural innovation in rural Nepal: A study using the example of macadamia and walnut trees as novel cash crops. Agriculture 2018, 8, 21. [Google Scholar] [CrossRef]
  96. Gornall, J.; Betts, R.; Burke, E.; Clark, R.; Camp, J.; Willett, K.; Wiltshire, A. Implications of climate change for agricultural productivity in the early twenty-first century. Philos. Trans. R. Soc. B Biol. Sci. 2010, 365, 2973–2989. [Google Scholar] [CrossRef] [PubMed]
  97. Basukala, A.K.; Rasche, L. Towards sustainable agricultural land use in Nepal: The role of irrigation and fertilizer application (No. EGU22-7566). In Proceedings of the Copernicus Meetings, Online, 13–14 October 2022. [Google Scholar]
  98. FAO. Food and Agriculture Organization of the United Nations. Statistics Division. FAOSTAT. Available online: https://www.fao.org/faostat/en/#country/149 (accessed on 18 April 2020).
  99. Rehman, A.; Ma, H.; Khan, M.K.; Khan, S.U.; Murshed, M.; Ahmad, F.; Mahmood, H. The asymmetric effects of crops productivity, agricultural land utilization, and fertilizer consumption on carbon emissions: Revisiting the carbonization-agricultural activity nexus in Nepal. Environ. Sci. Pollut. Res. 2022, 29, 39827–39837. [Google Scholar] [CrossRef] [PubMed]
  100. Khanal, N.R.; Nepal, P.; Zhang, Y.; Nepal, G.; Paudel, B.; Liu, L.; Rai, R. Policy provisions for agricultural development in Nepal: A review. J. Clean. Prod. 2020, 261, 121241. [Google Scholar] [CrossRef]
  101. Food and Agriculture Organisation (FAO). Global Forest Resources Assessment 2005: Nepal Country Report; Forestry Department, FAO, Country Report 192; Food and Agriculture Organisation: Rome, Italy, 2005. [Google Scholar]
  102. Subedi, P.B.; Ojha, P.; Mahara, S.; Gautam, D. Assessment of rate and drivers of deforestation and forest degradation in the lower-tropical region: A case of Punarbas Municipality, Nepal. Our Nat. 2022, 20, 27–40. [Google Scholar] [CrossRef]
  103. Bakehe, N.P.; Hassan, R. The Effects of Access to Clean Fuels and Technologies for Cooking on Deforestation in Developing Countries. J. Knowl. Econ. 2022. [Google Scholar] [CrossRef]
  104. MOFE. Annual Progress Report FY 2075/076 (2018/19); Ministry of Forests and Environment: Kathmandu, Nepal, 2019.
  105. Lama, S.; Shrestha, S.; Sherpa, A.P. Forest Watcher: Employing citizen science in forest management of Nepal. In Asia-Pacific Forest Sector Outlook: Innovative Forestry for a Sustainable Future: Youth Contributions from Asia and the Pacific; 2021; p. 21. Available online: https://www.cifor.org/publications/pdf_files/FTA/WPapers/FAO-FTA-WP-10.pdf (accessed on 2 December 2022).
  106. Bhattarai, S.; Pant, B.; Laudari, H.K.; Rai, R.K.; Mukul, S.A. Strategic Pathways to Scale up Forest and Landscape Restoration: Insights from Nepal’s Tarai. Sustainability 2021, 13, 5237. [Google Scholar] [CrossRef]
Figure 1. Examined SDGs 13 with SDG7, 12, and 15 separately.
Energies 16 00566 g001
Figure 2. Analytical framework for evaluating synergy and trade-off among SDGs.
Energies 16 00566 g002
Figure 3. Description to analyze the extent and direction of interlinkages between the SDGs.
Energies 16 00566 g003
Figure 4. Description to evaluate the synergy and trade-offs between SDGs.
Energies 16 00566 g004
Figure 5. A conceptual linkage between SDG 7 with SDG 13.
Energies 16 00566 g005
Figure 6. A conceptual linkage between SDG 12 with SDG 13.
Energies 16 00566 g006
Figure 7. A conceptual linkage between SDG 13 and SDG 15.
Energies 16 00566 g007
Figure 8. Linkages Among the Targets Associated with SDG 7, 12, 13 &15.
Energies 16 00566 g008
Figure 9. GHG emission (CO2) from energy sector (left) and per capita energy (final) consumption (right).
Energies 16 00566 g009
Figure 10. Synergy: GHG emission (CO2) from energy sector (Industrial, Transport and Others) and per capita energy (Final) consumption.
Energies 16 00566 g010
Figure 11. GHG emission (CO2) from energy sector (% change) (left) and Renewable energy share in total final energy consumption (right).
Energies 16 00566 g011
Figure 12. Synergy: GHG emission (CO2) from energy sector (Industrial, Transport and Others) and renewable energy share in total final energy consumption.
Energies 16 00566 g012
Figure 13. GHG emission from transport sector (left) and renewable energy share in total final energy consumption (right).
Energies 16 00566 g013
Figure 14. Synergy: GHG emission from transport sector and renewable energy share in total final energy consumption.
Energies 16 00566 g014
Figure 15. GHG emission (CH4, N2O) from agriculture sector (left) and land use for agricultural production (cereal as of % of cultivated land) (right).
Energies 16 00566 g015
Figure 16. Synergy: GHG emission (CH4, N2O) from Agricultural Sector and Land Use for Agricultural Production (cereal as % of cultivated land).
Energies 16 00566 g016
Figure 17. GHG emission from energy and agriculture sector (left) and forest area as a proportion of total land area (% change) (right).
Energies 16 00566 g017
Figure 18. Synergy Among SDG 13 and SDG 15.
Energies 16 00566 g018
Table 1. Four SDGs examined, their specific targets and indicators [28].
SDGsSymbolTarget Description
Ensure access to affordable, reliable, sustainable, and modern energy for allT-7.1.1Proportion of population with access to electricity
T 7.1.1.1per capita energy (final) consumption
T 7.1.2 Proportion of population with primary reliance on clean fuels and technology
T-7.2.1Renewable energy share in the total final energy consumption
T-7.3.3Higher efficiency appliance (in residential and commercial)
T-7.3.1.4EVs in public transport system
T-12.2.1.1Proportion to total water resources used
T-12.2.2.1Use of fossil fuel energy consumption (% of total)
T-12.2.2.3Land use for agricultural production (cereal as % of cultivated land)
Take urgent action to combat climate change and its impactsT-13.1Strengthen resilience and adaptive capacity to climate-related hazard and natural disasters
T-13.1.3.1GHG emission from Transport Sector
T-13.1.3.2GHG emission from Industrial Sector
T-13.1.3.3GHG emission from Commercial Sector
T-13.1.3.4GHG emission (CH4) from Agricultural sector
T-13.1.3.5GHG emission (N2O) from Agricultural sector
T-13.1.3.8GHG emission (CO2) from Energy Sector
T 13.2Integrate climate change measures into national policies
Protech, restore and promote sustainable use of terrestrial ecosystems, sustainably manage forests, combat desertification and halt and reverse land degradation and halt biodiversity loss T-15.1.1Forest area as a proportion of total land area
T-15.2.1Progress towards sustainable forest management
Disclaimer/Publisher’s Note: The statements, opinions and data contained in all publications are solely those of the individual author(s) and contributor(s) and not of MDPI and/or the editor(s). MDPI and/or the editor(s) disclaim responsibility for any injury to people or property resulting from any ideas, methods, instructions or products referred to in the content.

