Article

Households’ Energy Transformation in the Face of the Energy Crisis

by
Elżbieta Jadwiga Szymańska
1,*,
Maria Kubacka
2 and
Jan Polaszczyk
3
1
Department of Logistics, Institute of Economics and Finance, Warsaw University of Life Sciences—SGGW, 02-787 Warsaw, Poland
2
Department of Finance, Banking and Accountancy, Faculty of Management, Rzeszow University of Technology, 35-959 Rzeszow, Poland
3
Department of Economics, Faculty of Management, Rzeszow University of Technology, 35-959 Rzeszow, Poland
*
Author to whom correspondence should be addressed.
Energies 2023, 16(1), 466; https://doi.org/10.3390/en16010466
Submission received: 28 November 2022 / Revised: 23 December 2022 / Accepted: 28 December 2022 / Published: 1 January 2023

Abstract

:
The purpose of conducted research was to recognize factors determining households’ Energy transition and barriers that slow that process. Energy transition itself, understood as a shift in the structure of fuels used in energy production and technological changes related to its use, are key elements of shaping the economy. It was determined to what extent existing household renewable energy installations meet the energy needs of their residents and what factors encourage their installation. In addition, barriers limiting energy transition as perceived by household members were identified. The research used data from the EUROSTAT and the results of surveys conducted using the CAWI (Computer-Assisted Web Interview) and PAPI (Paper and Pencil Interview) techniques among households in Poland. The methods of descriptive statistics, the chi-square test of independence, the Kruskal–Wallis ANOVA test, the Mann–Whitney U test and logistic regression were used to analyze the research results. The analyses show that fossil fuels dominate in energy production in Poland. The share of renewable energy sources in the gross final energy consumption in 2020 was 16.1%. Their structure is dominated by photovoltaic installations with a share of 52%. Further increase in energy prices and fears of interruptions in energy supplies will favor the further increase in the number of installations for renewable energy sources. According to the respondents, the energy efficiency has a significant impact on the quality of life and environment, but the main barriers to its development include financial constraints of households.

1. Introduction

The energy transition process is defined as a gradual transition from the traditional energy supply path to a new system, based on structural changes in the primary energy produced, observed at the global, national and household levels (Smil 2010). Blazquez et al. define this issue as the transition from an economic system dependent on specific energy sources and technologies to another economic system [1]. Following Fouquets’ definition [2] energy transition involves changing the fuels and technologies used in the way society uses energy to less carbon-intensive alternatives. In the opinion of Miller (2013), the scientific world currently equates the energy transition not only with a change in the fuel used, but with a change in entire socio-economic and political arrangements. According to O’Connor [3], the energy transition affects such elements of the energy economy as sourcing, carriers, processing and also services related to its operation and distribution. Each of these elements is related to the development of technological aspects of the energy industry [4]. The energy transition results for several reasons. Firstly, estimated fossil fuel reserves are already reaching critical values and their extraction is becoming less and less profitable (Popkiewicz 2016). Secondly, the increasing importance of renewable energy sources is causing the dynamic development of technologies. Thirdly, there is a significantly increasing awareness of the potential of natural energy sources in society.
The European Union’s (EU) climate and energy policy has a significant impact on shaping Poland’s energy transition. A key element was the signing of an agreement at the 21st United Nations Climate Change Conference to limit the average increase in the Earth’s temperature. Nearly 190 countries, including member states of the European Union, have joined the Paris Agreement. In December 2018, during the UN Climate Summit in Katowice, Poland, the so-called Katowice Package was adopted. It provides detailed rules and guidelines, and sets out procedures to implement the provisions adopted in the Paris Agreement. It emphasized that the transition resulting from the Paris Agreement must proceed in a fair and solidarity-based manner. In 2019, the European Commission published a statement on the European Green Deal, a strategy with the ambitious goal of achieving climate neutrality for the EU by 2050. Due to the EU’s adopted decarbonization targets, in December 2020 the European Council approved a binding EU target to reduce net greenhouse gas emissions by at least 55% by 2030 compared to 1990 levels. The implementation of this goal is to be carried out on the basis of member states’ contributions, considering their circumstances, the principle of sovereignty in shaping the national energy mix and the need to guarantee energy security in each country.
Considering the EU’s energy transition requirements are a significant challenge for Poland, on 2 February 2021 the Council of Ministers adopted a resolution on a strategy for the transformation of Poland’s energy sector by 2040. It is based on three pillars: a just transition, building a parallel zero-carbon energy system and good air quality. Implementing these three guidelines will require the Polish government to invest a large amount in RES and nuclear power plants. Simultaneously, according to the adopted strategy, it is expected that already by 2028 up to 80% of households will have modern remote reading meters, the position of prosumers will be strengthened and energy aggregation services will be developed and popularized.
According to Poland’s Energy Policy until 2040 (PEP 2040), the energy transition will require the involvement of many actors, including households. Household energy services account for a large percentage of global final energy consumption and carbon reduction potential [5]. Across the EU, households account for 27.8% of energy consumption. In Poland, in 2021, the share of households in the national energy consumption was 29.6%. In the structure of energy consumption in households in the country, solid fuels, mainly hard coal, are the most important [6]. It is expected that the phasing out of solid fuels will contribute to the transition to low-carbon energy, while bringing health and environmental benefits.
The research problem addressed is particularly important in the period of the COVID-19 pandemic, in the era of the war in Ukraine, the freezing of gas supplies from the Russian Federation and the instability of energy markets. In this situation, the basic tenets of the energy transition to a zero-carbon economy are being redefined. The uncertainty of the environment makes it necessary to identify the factors, concerns and barriers to the energy transition so that a state response to them becomes possible.
The purpose of conducted research was to recognize factors determining households’ energy transition and barriers that slow that process. The literature review conducted indicates a research gap in the identification of energy transition factors and barriers to implementing a zero-carbon economy in households. The study therefore attempts to answer the following questions:
  • What is the extent to which renewable energy installations meet household energy needs?
  • What factors encourage the installation of renewable energy sources in households?
  • What barriers are limiting household energy transition?
  • Based on the literature review and research conducted to date, three research hypotheses were formulated:
H1. 
The presence of RES installations in households differentiates the place of residence and type of building.
H2. 
Having RES installations in households reduces concerns about the energy crisis.
H3. 
The main barrier to energy transition is household financial limitations.

2. Literature Review

2.1. Household Energy Transition

Consumption of energy resources takes place in many dimensions affecting the quality of life. The most frequently mentioned categories relate to meeting needs such as:
-
heating of residential and utility buildings—e.g., garage, garden house;
-
cooking and meal preparation;
-
widely considered use of electricity, including portable devices, batteries, chargers, etc.;
-
transport;
-
entertainment and tourism.
Energy consumption is affected by many factors. Selvakkumaran i Ahlgren point out six categories of that [7]:
-
economic factors;
-
environmental factors;
-
personal values and preferences;
-
social factors;
-
household characteristics;
-
market and policy factors.
It is crucial to underline that economic factors are present in every area of energy consumption [8]. The increase in energy costs leads to an increase in the share of expenditures to meet energy needs and, consequently, to a decrease in the amount available for other expenditures.
Limited natural resources, the need to protect the environment and rising energy prices force the need for energy transformation. The concept of energy transformation is inextricably linked to energy security, which is the basis for the functioning of the energy sector and all other economic branches [9]. The households’ energy transition is a process of continuous change of a pattern of usage different energy sources by a household in order to:
-
possibly maximize the utility coming out of energy consumption, regarding multiple levels of a household needs;
-
meet expected emission and energy efficiency targets imposed by socio-cultural environment conditions;
-
achieve a desired quality of life level regarding access to the energy-based technology and daily solutions.
The process of implementing the energy transition is taking place in various areas. Among the most important issues in this area in the literature are:
-
energy poverty of households;
-
energy consumption of urban/rural housing buildings;
-
fuel choice of households;
-
clean energy adoption of households;
-
social programs and policies concerning household energy consumption;
-
gendering households’ energy.
Within these areas, Guta et al. [10,11] indicate that poverty makes it difficult for households to switch from solid fuels to cleaner fuels. Moreover, other authors show that commercial energy use in total household energy consumption in rural areas is increasing in some countries. Additionally, they show that energy consumption differs by building type, and the type of energy transition solutions varies based on the different household structures and where they are locationed [12,13,14,15]. The literature also analyses fuel consumption patterns [16,17] and the adaptation of gaseous fuels and electricity to everyday cooking activities as part of clean energy adoption [18,19,20,21]. In terms of implications for governments, it is recommended to promote the use of renewable energy in rural households by increasing the degree of financial openness, improving credit policy and encouraging non-agricultural activities [22,23]. The latest studies indicate differences in men’s and women’s attitudes toward energy. Research shows that men choose clean energy for their homes more often than women [14,24,25].
The transition to sustainable energy systems is recognized as the cornerstone for climate mitigation and transforming to a net zero emissions global economy [26]. The rapidly changing environment and energy demand in terms of technology and policy impose the need for households to adapt to new conditions. They seek to increase their satisfaction coming from consumption, but also to decrease its cost. At the same time turbulent conditions and the current geopolitical situation including the Ukraine—Russia conflict have a strong influence on availability of energy sources, hence the drastic changes in prices. That also touches households as they try to meet their energy comfort (mostly for heating, electricity and transportation possibilities). Increasing energy prices have a direct impact on their budgets. In this situation, households are making investments in new technologies. Palm [8] identifies the following motives for investing in photovoltaic installations:
-
testing new technology, technical interests;
-
increase convenience;
-
earning money;
-
cost efficiency;
-
protecting against future high cost;
-
environmental benefit;
-
security of supply;
-
symbolic reasons;
-
self-sufficiency;
-
social networks, peer effects.
Households during the energy transition also face a number of barriers that more or less slow down or even stop the process. From a macro perspective, such barriers can pose a major challenge to the economy in its pursuit of the goals set by EU policy. The barriers presented in the literature to carrying out the energy transition can be divided into the following groups:
-
financial barriers;
-
political barriers;
-
lack of household interest in energy transition;
-
lack of public awareness of the benefits of renewable energy sources, awareness;
-
lack of certainty regarding the effectiveness of available solutions;
-
resistance to change, habituation.
Financial barriers mainly concern the costs related to RES installations and long periods of return on investment. The literature emphasizes the role of financial instruments and savings in implementing investments in RES [15,27,28,29,30]. This is due to the lack of appropriate legal regulations motivating such undertakings [31,32,33] and low subsidies for installation activities. A significant barrier is a lack or low level of public awareness of pro-environmental measures included in the energy policies of modern economies that meet the assumptions of sustainable development [34,35,36,37]. This barrier is associated with the lack of certainty as to the positive outcome of activities related to energy transformation and resistance to change [38,39]. Therefore, shaping the country’s energy policy must be done while reducing these barriers, taking into account the most pressing problems raised by households and with their consultation and approval.

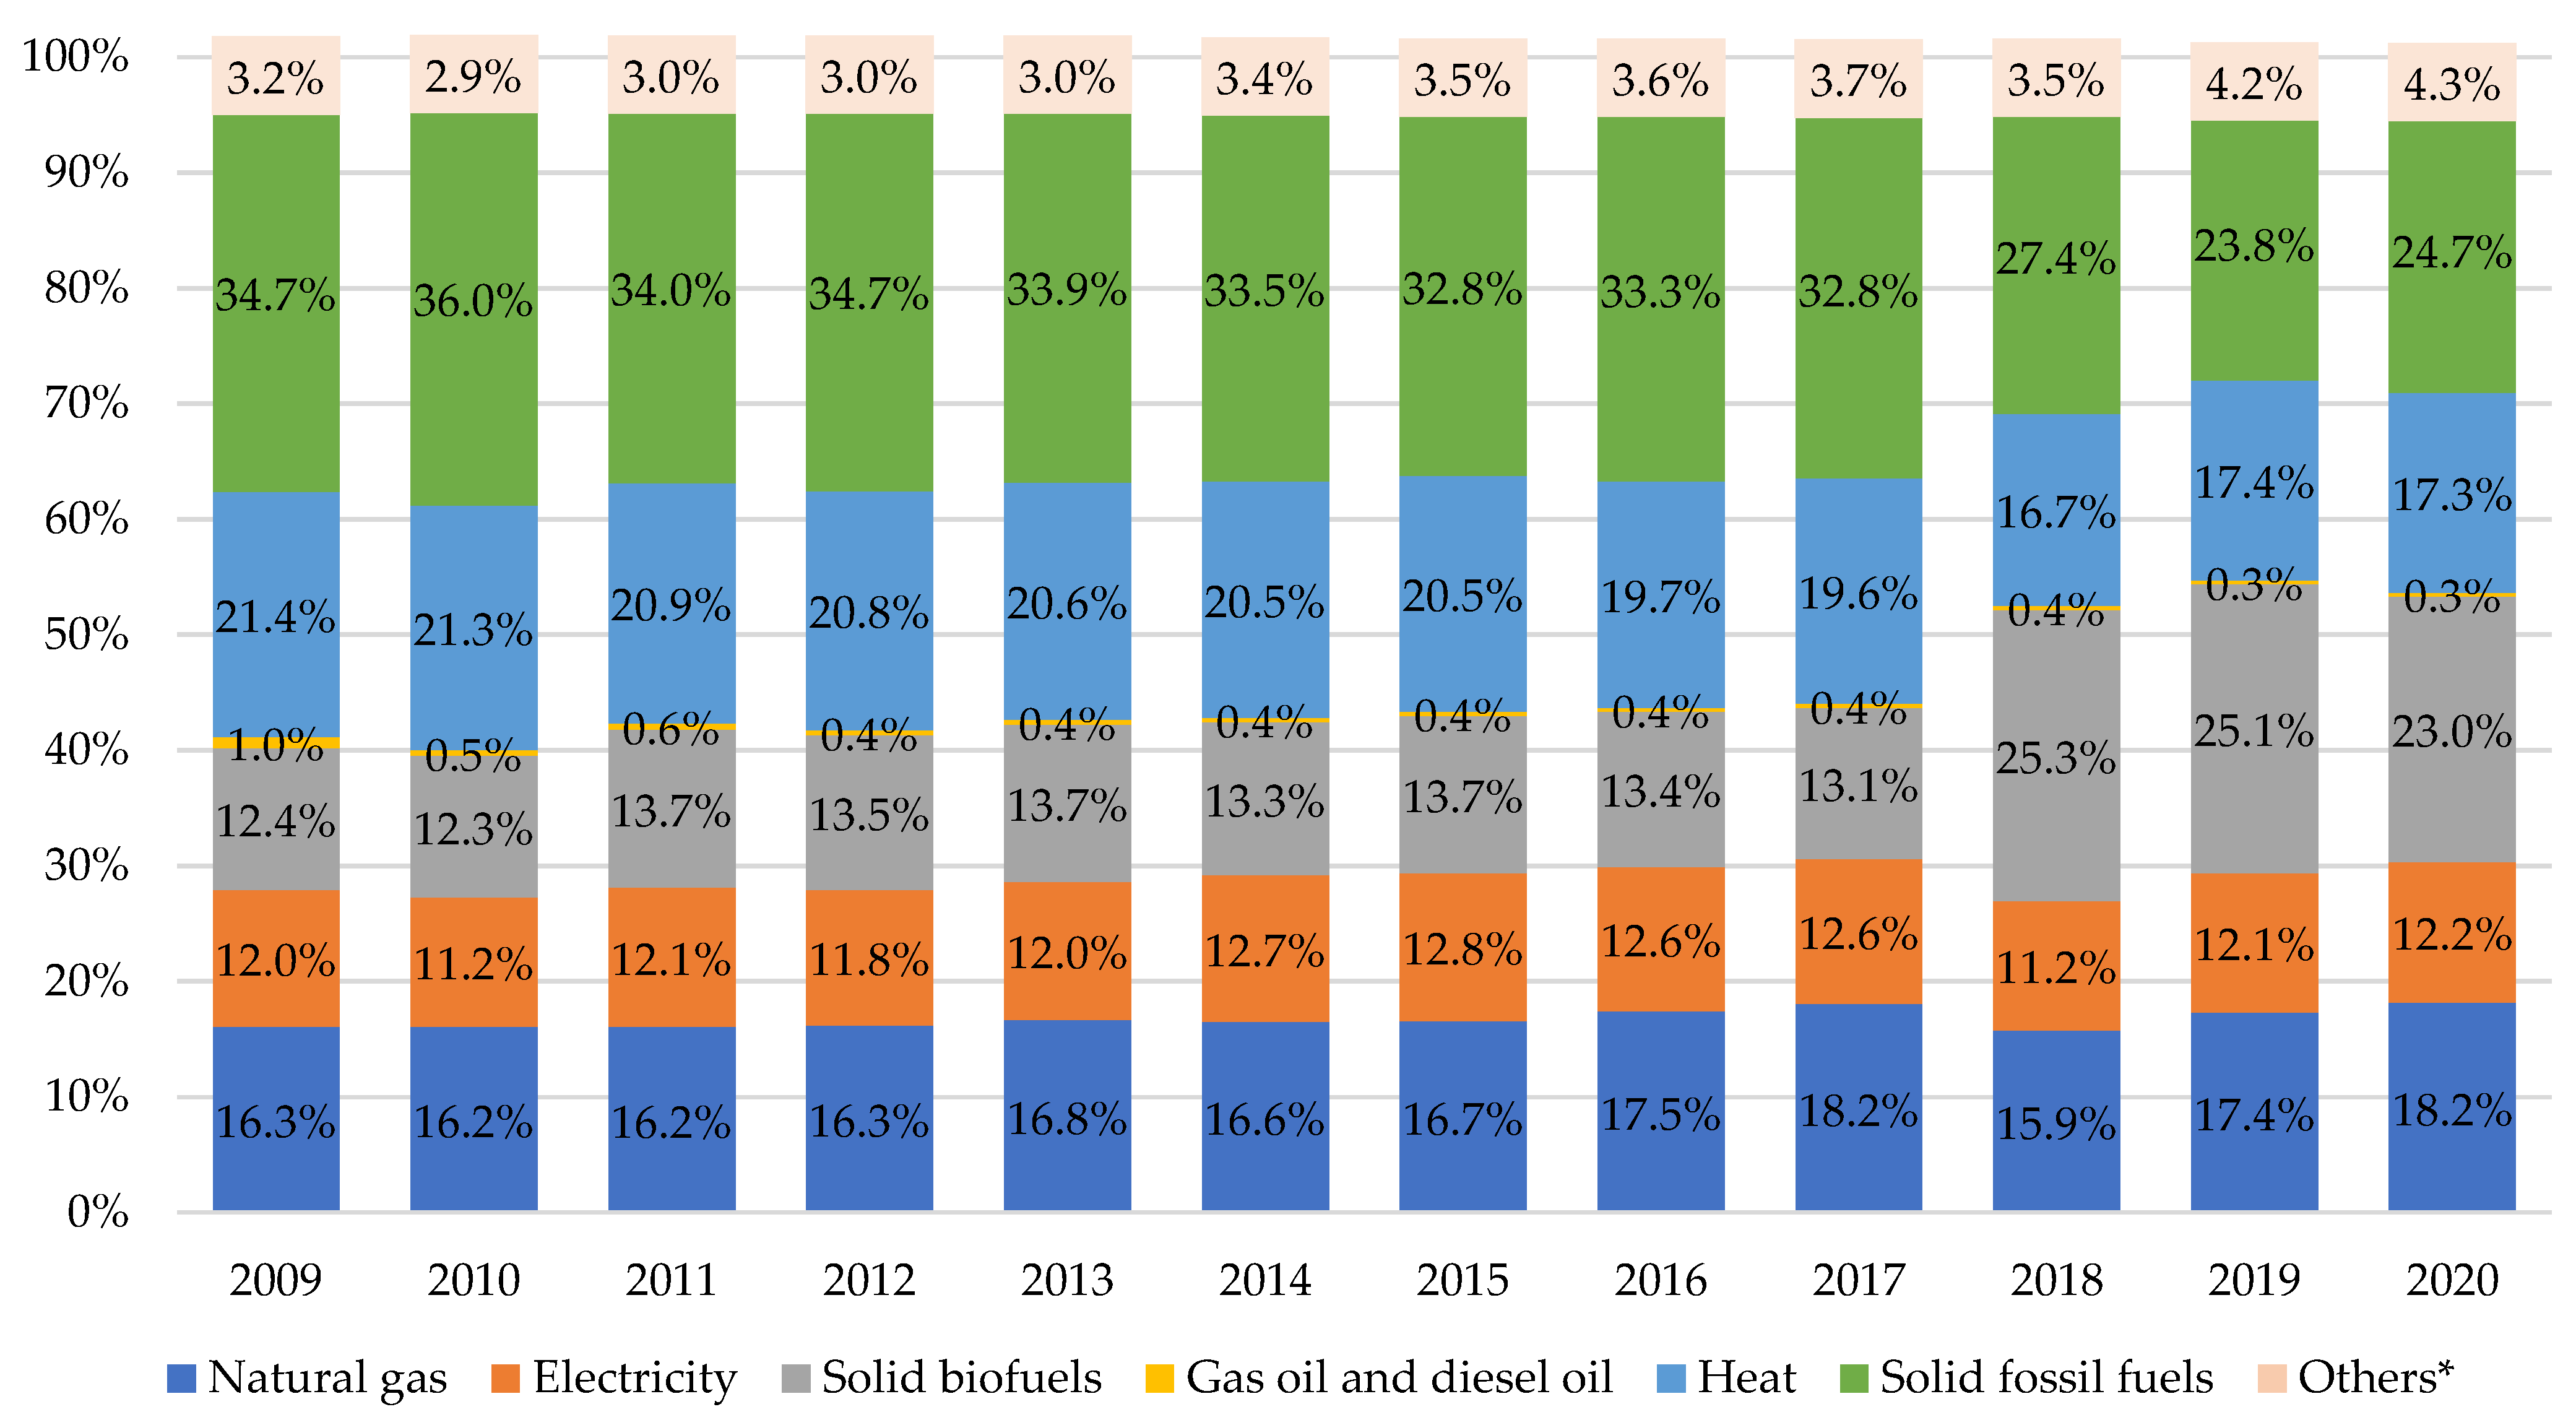
2.2. Energy Sources and Prices in Poland Compared to the EU

The structure of energy sources in the European Union has developed in a similar way with slight fluctuations in recent years. The main energy sources include natural gas, with a share of 32% of energy consumed, and electricity with a share of 25% of the EU energy mix. In addition, there is a noticeable trend of a gradual reduction in the share of diesel fuel at the expense of increasing the level of biofuels in the structure of final energy consumption. This phenomenon is also present in the Polish energy market.
The energy needs of Polish households are mainly met by burning coal and lignite, which are the main resources used in the production of electricity and heating in residential buildings. The more drastic changes in the energy source mix include the turn of 2017 and 2018. There was then a 16-percentage point reduction in the share of fossil fuel consumption. This was due to a five-fold increase in the price of CO₂ emission rights (from EUR 6 to more than EUR 25 per ton). This contributed to the unprofitability of seven mines responsible for about 15% of domestic coal production. Changes in the structure of final energy consumption by source of energy in 2009–2020 are presented in Figure 1 and Figure 2.
Despite a noticeable decline in the share of fossil fuels in recent years, they account for nearly 25% of all energy sources. The average value of thermal energy consumption for the entire European Union is more than twice as low as in Poland. The country’s biofuel use, on the other hand, is as high as 23%, more than 6 percentage points higher than the EU average. They play a significant role in the structure of consumer spending earmarked for electricity, with further price increases expected in the near future. This will mean an increase in the share of electricity spending in household budgets. Currently, the monthly average renumeration presented by labor cost levels anually is approximately EUR 11,500 for Poland and EUR 29,100 for the EU [41]. In relation to this renumeration, Figure 3 presents the change in electricity for the average household size.
Electricity prices for household consumers are defined as follows: average national price in Euro per kWh including taxes and levies applicable for the first semester of each year for medium size household consumers (Consumption Band Dc with annual consumption between 2500 and 5000 kWh). Electricity and natural gas prices in Poland are lower than the average EU prices. This is due to the difference in factor costs, including labor costs, which are lower in Poland than in Western Europe.
Electricity prices in the EU are steadily increasing, but the year-on-year rate of change is decreasing. In 2022 the average price of electricity in the EU was 22 EUR/kWh. In Poland, between 2010 and 2020, the average level of electricity prices was about 0.14 EUR/kWh. In 2022, however, there was a significant increase in energy prices to 0.15 EUR/kWh. However, this is still lower than the EU average by 0.07 EUR/kWh.
The increase in electricity prices has been led by energy policies that take into account the recommendations of the Paris Agreement and the need to reduce atmospheric emissions. The consequences of these policies will be felt in 2023 and beyond. In the near term, the geopolitics of natural gas supplies to the Eurozone will also negatively affect prices. In view of the war in Ukraine, Poland and other European countries will continue to face a significant increase in the price of energy resources.

2.3. Financial Support for the Country’s Energy Transition

Even the cost of coal-fired energy will gradually increase as a result of additional CO₂ fees. Therefore, households, especially in Poland, are forced to look for alternative sources of energy generation. One of the solutions supported by the state is the use of RES. The development of this sector is one of the main goals of Poland’s Energy Policy until 2040 (PEP2040) [43], which assumes that the level of use of renewable energy sources in 2030 in gross final energy consumption will reach at least 23%. In addition to state support, there is a noticeable increase in the level of environmental awareness among the public. According to the survey “Poles on energy conservation and energy” conducted by CBOS [44] in 2016, at least one-fifth of Poles are willing to install devices that enable the use of renewable energy sources. The growing need to change the sources of energy generation in society and the desire to achieve the goals of Poland’s Energy Policy until 2040 have contributed to measures to support households. Currently, they have the opportunity to benefit from at least 10 different forms of subsidies (depending on the function and type of investment). Available energy transition support programs for residential consumers are presented in Table 1.
The household support programs presented are designed to activate the public in making technological improvements to residential buildings. Acquisition of funds by beneficiaries in the form of non-refundable (grants) or refundable (loans) support will make it possible to make changes in the economy. The following amounts of financial support have been allocated for the most important programs:
-
Priority program of National Fund for Environmental Protection and Water Management “Czyste Powietrze” (Clean Air)—PLN 103 billion;
-
Priority program of National Fund for Environmental Protection and Water Management “Mój Prąd” (My Electricity)— PLN 1.1 billion;
-
Program “Stop Smog”—PLN 1.2 billion.
The high level of state funding in the form of funds allocated to the programs in question indicates the strategic steps being taken to combat energy poverty. The selected programs are intended to help implement key measures to reduce the negative environmental impact of fossil fuel extraction without reducing the amount of energy produced.

3. Materials and Methods

3.1. Methods

The purpose of the study was to identify the determinants of household energy transition and the barriers to its development, as well as concerns about the energy crisis. The research tool was a survey questionnaire, and the research was conducted using CAWI (Computer-Assisted Web Interview) and PAPI (Paper and Pencil Interview) techniques. The survey was anonymous and partial in nature. The survey sample was selected using the snowball method in order to reach as many households as possible. The research in question was preceded by a pilot study on a group of dozens of household members. The survey questionnaire was then sent to dozens of household members with a request to recruit more people for the survey, at the same time the survey link was posted on various online forums. A total of 387 people participated in the survey. Assuming a confidance level of 95%, a margin of error of 5%, a fraction of 50% and a household population size that in 2020 was 15,015,333 [54], the minimum survey sample should be 385 units. This requirement was therefore met in our study.
The survey form consisted of three parts. The first part collected sociodemographic information. The second part concerned the determination of a household’s current situation with regard to ownership of RES installations and related issues, such as the share of energy obtained from RES and the intention to invest in such installations. In the third section, respondents were asked for their opinions on concerns about the energy crisis. In this section, respondents evaluated a number of theses. A five-point, bipolar Likert scale was used for evaluation, which included a neutral mean value [55,56]. In the scale used, a value of 1 meant an opinion of definitely no, and 5 meant an opinion of definitely yes. In the next section of the questionnaire, respondents rated the energy transition theses and ranked the barriers to the transition on a scale of 1 to 6, with 1 being the least important barriers and 6 being the most important.
The results were analyzed using STATISTICA. Depending on the nature of the variables, the following methods were used to analyze the results:
-
Percentage distribution (in the form of tables or figures) of nominal or ordinal characteristics, also of summary descriptive statistics for numerical characteristics;
-
Chi-square independence test [57] ( χ 2 ) (to assess the correlation of qualitative traits). Among the many statistical approaches used for observational studies, the Chi-square (χ2) test is widely used by researchers studying survey response data. It helps in analyzing differences in categorical variables (nominal in nature). The Chi-square test of independence was used to verify the relationship between place of residence, household disposable income per person, residental building, age, sex and NUTS 1 macroregion. It was also used for (1) the household equipment with renewable energy installations, (2) the intention to invest in renewable energy installations and (3) the concerns resulting from power outages;
-
The Mann–Whitney U test [58] (to determine the correlations between qualitative and quantitative traits when there were two categories of a qualitative variable). This test was used to verify the relationship between type of housing and the assessment of (1) concerns about the energy crisis, (2) opinions about the energy transition and (3) barriers of energy transition, as well as between owning RES installations and the assessment of concerns about the energy crisis;
-
The Kruskal–Wallis ANOVA test was used to determine the correlations between qualitative and quantitative traits when there were more than two categories of a qualitative variable [59,60,61]. The Kurskal–Wallis test was used to verify the relationship between place of residence, disposable income per person and NUTS 1 macroregion, and the assessment of (1) concerns about the energy crisis, (2) opinions about the energy transition and (3) barriers of energy transition;
-
Logistic regression (for qualitative dichotomous variables) [62] enables investigating the influence exerted by many independent variables on the dichotomous dependent variable. The values of the dependent variable are coded as follows: 1—the distinguished value possessing the feature, 0—not possessing the feature. The logistic regression model for the dichotomous variable specifies the conditional probability of taking by this variable the distinguished value. The logistic regression was used to determine what factors determine investment in RES. Statistically significant independent factors (living in a single-family building and the belief that RES installations protect against the effects of the energy crisis) that influence the intention to invest in renewable energy installations were verified.
For the research hypotheses, the probability of intention to invest in renewable energy sources was calculated depending on the type of residential building (single-family) and the belief that RES installations protect households from increased energy expenses [62]. It was also verified whether respondents’ opinions on concerns about the energy crisis and evaluation of energy transition statements are related to a household’s ownership of a renewable energy facility.
The results of all statistical tests were reported in terms of test probability p-values, which allows a direct assessment of the significance of test correlations, without having to use arrays. The paper assumed the usual error rate of the first kind α = 0.05 [57], and thus correlations, for which p < 0.05 were considered statistically significant.

3.2. Materials

The study was conducted in August–September 2022. The spatial scope of the survey included all households in Poland by NUTS 1 regions [63]. The characteristics of the research sample are presented in detail in the Table 2.
Among the respondents, 32.8% were respondents living in rural areas, while the rest of the respondents declared living in a city of varying population. Among urban residents, residents of cities with a population of up to 50,000 were the largest group. In terms of age, four categories of generations described in the literature were considered [64]. Generation Y accounted for the largest share of the age structure (73.1%), while Generation Z accounted for the smallest (just 2.1%). In terms of average monthly disposable income [65], the largest share was accounted for by members of households with disposable income of more than PLN 3000 per person (42.6% of respondents). Respondents living in single-family houses, row houses or semi-detached houses [66,67] accounted for 56.6% of respondents, while 43.4% of respondents lived in multi-family buildings. Analyzing the respondents’ region of residence, the largest share came from the eastern region 29.2% and southwest 25.6%, while the smallest share came from the central region 4.4%.

4. Results

4.1. Identifying the Status of Household Renewable Energy Installations and Modeling the Intention to Implement Such Installations Using Logistic Regression

4.1.1. Current Status

The survey showed that 26.9% of respondents have renewable energy installations in their households. The study therefore examined what criteria determine ownership of this type of installation (Table 3).
Based on the results of the survey using the chi-square test of independence, it was found that a household’s ownership of a renewable energy installation depends on where it is located (p = 0.0000). Clearly, such installations are most common in the households of rural residents (48% of respondents). Disposable income per family member also differentiates ownership of RES installations (p = 0.0383). Such installations are most common in households with the lowest incomes, (57.1% of respondents). At the same time, almost one-third of respondents with incomes in the PLN 1000.01–2000.00 and PLN 2500.01–3000.00 ranges also say they use such installations. This may indicate an attempt by these households to protect themselves firstly from rising energy prices and to move towards energy independence. It also depends on the type of building to have RES installations (p = 0.0000). Respondents living in single-family houses (detached, terraced or semi-detached) are far more likely, (44% of respondents) to declare having RES installations. In this way, the first hypothesis (H1) was positively verified. This is due to the greater opportunity to invest in such a solution in single-family homes compared to multi-family buildings. In addition, the region also differentiates household equipment with RES installations (p = 0.0013). The largest percentage of respondents from the eastern region indicated that they had RES installations (41.6% of respondents). This may be due to degrees of sunshine. The eastern and southern region of Poland have the highest degrees of insolation, which may influence the owning of RES installations [15]. The structure of renewable installations used in households is presented in the Figure 4.
Among those surveyed using renewable energy installations, nearly 78% of respondents indicated that they had photovoltaic panels. More than a quarter of respondents had solar panels (26.0%) or a heat pump (28.8%). By far the least popular are recuperators (8.7%) and biomass boilers (1.0%).
Considering that members of households often have more than one RES installation, the share of energy obtained from renewable sources in the total amount of energy consumed in households with RES installations was recognized. The data are presented in Table 4.
As Table 4. shows, a quarter of the respondents obtain 40–60% of their energy from renewable sources. A similar percentage of households (24%) obtain 20–40% of their energy from RES. On the other hand, 21.2% of respondents said they obtain less than 20% of their energy from these sources. The average share of energy obtained from renewable energy sources in the surveyed households is therefore 46.2%.
The intention to invest in renewable energy installations was declared by 44.4% of respondents. It varies by place of residence (p = 0.0002) and residential building (p = 0.0000), as confirmed by the chi-square independence test.
The most frequent intention to invest in RES is indicated by members of rural households (62% of respondents living in rural areas) and residents of cities with up to 50,000 residents (40%). In addition, residents of single-family homes, are far more likely to declare such actions (58.9% of respondents).
The results of the chi-square independence test also confirmed that the need to install RES is mainly due to the fear of power disruptions (p = 0.0005). Among respondents living in multi-family buildings, almost 62% of respondents indicated this concern, while in single-family buildings, more than 78% of respondents. At the same time, 60% of respondents believe that RES installations protect households from the effects of the energy crisis.

4.1.2. Modeling the Intention of Households to Invest in Renewable Energy Installations

The logistic regression model shows (Table 5) that investment in RES installations is significantly influenced by living in a single-family building (including terraced or semi-detached houses) (odds ratio 4.20) and the belief that such installations protect against the effects of the energy crisis (1.71). Of course, the impact of these factors can be cumulative, meaning that residents of single-family homes with the belief that RES installations will protect against rising energy expenses are 7.2 times more likely (4.20 × 1.71) to make the decision to invest in RES. The factors included in the model allow a good selection of which households will consider investing in RES. The share of correct classifications accounted for 65.6%.

4.2. Household Members’ Concerns over Energy Crisis

Respondents rated concerns about the energy crisis according to a 5-point Likert scale, where 1 meant definitely not worried and 5 meant definitely worried. The highest average was obtained by a further increase in energy prices (average of 4.21), which means that this particular concern is the most important in the opinion of respondents. The other uncertainties about the Energy Crisis in the assessment of household members reached an average rating of 3.51 to 3.58 (Table 6).
The study, using the Kruskal–Wallis ANOVA test and the Mann–Whitney U test, found statistically significant correlations between some concerns about the energy crisis and the respondents’ place of residence and type of housing (Figure 5a–c).
The survey shows that members of households living in single-family buildings (Figure 5a) are significantly more concerned about problems related to the purchase of raw materials for heating (mean score of 3.74) compared to respondents living in multi-family buildings (mean score of 3.22). Similarly, concerns about not being able to meet energy needs were rated higher by respondents living in single-family buildings (average 3.76 vs. 3.36) (Figure 5b). Assessment of the problem of purchasing raw materials for heating decreased as the number of residents in cities increased (Figure 5c). The highest rating for this variable was given by rural residents (average 3.82). The opinions of these people are the least varied. In cities with up to 50,000 residents, opinions on the problem of purchasing raw materials for heating were characterized by greater variation. The greatest disparity in this aspect was among those in cities with a population of up to 50 to 1000 (average 3.43).
Based on the Mann–Whitney U test, it was also found that owning a renewable energy facility has a significant impact on assessing concerns about the energy crisis (p = 0.0001). Respondents with renewable energy installations are less concerned about further price increases (average 3.85), but their responses are more varied. Those without such installations rate concerns about rising energy prices significantly higher (average 4.35). Their opinions are more homogeneous (Figure 6).

4.3. Energy Transition: Identification of Opinions and Barriers

As part of the survey, respondents were asked to rate statements about the energy transition (Table 7).
The majority of respondents believe that the energy transition has a positive impact on the environment (average 3.74) and on the quality of life of society (average 3.58). The results of the survey therefore indicate that respondents, despite some negative effects of the energy transition, attach more importance to its beneficial aspects. Such an approach may to some extent mitigate negative public attitudes toward the changes taking place in the broader energy field. Respondents were least negative about the impact of the energy transition process on the shortage of energy resources (average 2.82) and interruptions in the continuity of the supply of raw materials (average 2.87).
In order to verify the formulated hypotheses, it was checked whether socio-economic factors such as place of residence, income earned, type of housing and NUTS1 region influence respondents’ assessment of the energy transition (Table 8).
The study, based on the Kruskal–Wallis ANOVA test, found that the assessment of the positive impact of the energy transition on society’s quality of life is correlated with the place of residence (p = 0.0199). Respondents from cities with a population of 100,000–500,000 rated this thesis the highest (average 3.85). Similarly high indications in this regard were provided by respondents from cities with more than 500,000 residents (average 3.65) and rural areas (average 3.61). Based on this, it can be concluded that respondents living in rural areas, i.e., having more contact with nature and the environment, and those living in very large cities, where the negative effects of environmental pollution are very evident, value the positive impact of the energy transition on quality of life the most. The lowest average rating in this regard occurred in the group of residents of cities with a population of 50,000 to 100,000 (average 3.26).
The results of the statistical tests (ANOVA Kruskal–Wallis test) also confirmed the relationship between the respondent’s disposable income and the assessment of the negative consequences of the energy transition (p = 0.0102). The poorest people, whose disposable income is up to PLN 1000 per month, gave the least negative assessment of this variable (average 3.07). In contrast, respondents with a household disposable income of PLN 1500.01–2000.00 per person rated the negative consequences of the energy transition the highest (average 3.83). This indicates that not necessarily the poorest people are against the transition.
The study, using the Mann–Whitney U test, also showed that people living in single-family homes are less negative about the technical difficulties of the energy transition (average 3.39) compared to residents of multi-family homes (average 3.62).
At the same time, regional variation in assessments of the energy transition was confirmed in terms of its negative effects on households (p = 0.0336), further increases in energy prices (p = 0.0093) and lack of continuity in the supply of energy resources (p = 0.0086) (using the Kruskal–Wallis ANOVA test). Summarizing the identified correlations regarding regional variations in assessments of the energy transition, it can be said that residents of the northwestern region are least negative about the process, compared to residents of the southwestern region, who are most critical of it. The southwestern region of Poland is characterized by a large coal mining potential, which may be the reason for such a skeptical approach to the transition, among other things, the result of which is supposed to be a move away from fossil fuels.
It has been shown that ownership of renewable energy installations has a significant impact on the assessment of opinions regarding the energy transition (Table 9).
An analysis of the average ratings related to the energy transition carried out using the Mann–Whitney U test (Table 9) allows us to conclude that households with renewable energy installations view it more positively. The second hypothesis (H2) was therefore positively verified. As for the negative financial impact, respondents from these households on average rated it at 3.08, while respondents without such installations rated it at 3.45. A similar situation applies to the thesis relating to further increases in energy prices. This variable is also rated lower by respondents with RES installations (mean 3.10 vs. 3.39). Respondents in this group are less likely to believe that the energy transition is leading to shortages of energy resources (mean score of 2.58) and are lower in their assessment of the technical difficulties of its implementation (mean score of 3.29). In contrast, respondents with renewable energy installations are more positive about the transformation’s positive impact on society’s quality of life (mean score of 3.81 vs. 3.49) and its positive impact on the environment (mean score of 3.97 vs. 3.66).
In conclusion, it can be said that households using energy from renewable sources are more positive about the effects of the energy transition. Presumably, having these installations to some extent reduces concerns about the negative effects of change. In this situation, decision-makers should do more public outreach on the positive aspects of the energy transition and implement programs to support investment in renewable energy sources.
The survey questionnaire asked respondents to rate six barriers related to the energy transition, where 1 meant the least important barrier and 6 meant the most important barrier (Table 10).
The data show (Table 10) that the most significant barrier to household energy transition is financial. Nearly 65% of respondents indicated that this was the most important barrier (ranking them sixth). The least important obstacle to the transformation process in the opinion of respondents is the public’s resistance to change, more than half of the respondents indicated it in the first place. Complementing the data is Figure 7.
The survey showed that the most important barriers to the transformation of Polish farms were financial barriers with an average score of 5.28. In this way, the first hypothesis (H1) was positively verified, with political barriers being the second most frequently indicated (average 4.21). The least significant barrier to transformation was the public’s resistance to change (average 2.11). Assessment of all barriers shows similar variation.
The analysis showed significant correlations between the assessment of energy transition barriers for the characteristics of the study sample (Table 11).
Respondents from households with a per capita monthly disposable income of PLN 2500.01–3000.00 (average 5.54) rated financial barriers the highest, while those with income above PLN 3000.01 (average 4.98) rated them the lowest (Table 11). Households with an income of up to PLN 1000 per month have the greatest variation in responses (Figure 8).
The respondent’s residential building also significantly differentiates the rating of financial barriers (p = 0.0456) (Table 12). Financial barriers are rated significantly lower by respondents from multi-family buildings (mean 5.12). This is probably also due to the limited opportunities to invest in renewable energy sources, and therefore the lack of need to finance them.

5. Discussion

The energy transformation of households in Poland and across the EU is a major challenge. According to the European Commission, buildings remain the largest consumers of energy in Europe, consuming 40% of total energy and emitting 36% of greenhouse gases, and most of them are still powered by fossil fuels [68]. Heating, cooling and domestic hot water together account for 80% of the energy consumed by households. In order to use energy more efficiently and reduce greenhouse gas emissions, it has introduced a Green Deal strategy to become climate neutral by 2050.
One of the EU’s stated goals is to provide citizens with clean and safe energy at socially acceptable prices. It can be achieved by activating citizens throughout the energy transition process and increasing the share of renewable energy sources as well as improving the energy efficiency of buildings. Simultaneously, the European Union is trying to ensure that citizens are protected from energy exclusion. Initiatives to finance the renovation and thermal modernization of buildings and lower electricity bills serve this purpose [69].
The war in Ukraine has destabilized prices in the energy resources sector such as natural gas, oil and coal, leading to higher fuel prices and higher energy bills. As a result of these changes, the energy transition may be stalled. However, the need to become independent of energy resources from Russia may accelerate the transition to renewable energy. According to the Blue Media survey “Environmental Attitudes of Poles 2022” conducted in April 2022 on a representative nationwide sample of 1037 people, as many as 69% of people agree with the statement that Russia’s attack on Ukraine forces changes in existing assumptions about Poland’s energy policy, and that moving away from fossil fuels is not an alternative but a necessity. In turn, 70% of respondents believe that Poland should strive not only to change the supplier of coal and gas, but also to reduce their use, and this process should be supported by the state as part of taking care of the country’s energy security. The majority of respondents (54%) also rated the origin of the fuel they use to heat their homes as important to them. The majority of respondents (63%) decided to reduce energy consumption in response to the war of their neighbors [70].
Surveys conducted indicate that Poles expect further increases in energy prices. In order to minimize the expenditures spent on meeting energy needs, two courses of action are possible. Firstly, the energy efficiency of building structures can be increased through the use of better insulation, which reduces energy consumption for both heating and cooling buildings. Secondly, the use of high-carbon energy sources can be reduced by replacing coal, gas or oil-fired boilers and stoves with appliances powered by low-carbon alternative energy sources [71].
Within the framework of the EU-funded ENERGISE project, an experiment was conducted to reduce energy consumption in more than 300 households in eight countries. The goal was to lower the indoor temperature to a maximum of 18 °C. Studies have indicated that lowering the temperature in buildings by 1 °C in winter results in energy savings of about 6%. In some cases, savings were even greater, and changes in energy behavior patterns were maintained for 3 months after the challenge was introduced. The results of the study also indicate that people are more likely to respond positively to energy savings if they have control over their thermal comfort, and are less likely to rely on smart buildings and invisible heating systems for limited interventions [68].
According to Selvakkumaran and Ahlgren, household energy transition depends on a number of social factors, such as income, gender and age, for example [7]. The completed research confirms that there are significant correlations between these factors and the planning and implementation of investments to reduce energy consumption. In addition, financial barriers remain a major reason for slowing down the transformation process [72,73,74].
Based on the analysis carried out, it should be concluded that developing the awareness of residents regarding the rational use of energy, climate change and its consequences, and what to do to mitigate and counteract them, is one of the most important investments. After all, education, especially of the younger generation, will be the key to the success of any future energy transition efforts.

6. Conclusions

The energy transformation of households is necessary and requires a change in the structure of energy consumption. The decision-making processes of consumers of household energy resources in the implementation of energy investments directly determine their transformation. In the surveyed group of households, ownership of RES installations was declared by 26.9%. Their occurrence is differentiated by place of residence, type of residential building, level of disposable income and NUTS 1 macro-region. Most often such installations are owned by those living in rural areas (48.0%) and in single-family buildings (43.3%).
The most popular installations are photovoltaic panels, heat pumps and solar panels. In the surveyed households with RES installations, the average share of energy obtained from renewable sources was 46.2%. At the same time, residents of rural areas, small towns and single-family buildings are more likely to declare their intention to invest in such installations. Renewable energy now dominates investments in electricity generation systems installed around the world [75]. Renewable energy and complementary sustainable technologies are expected to attain very high levels of penetration in energy systems, particularly in regions well-endowed with solar and wind potential [76,77].
Modeling using logistic regression showed that the intention to invest in RES installations is influenced by the type of building and the belief that such installations protect against rising energy prices. People living in single-family buildings and those positive about renewable energy installations are the target group willing to invest in RES.
The most important concerns related to the current energy crisis are primarily further increases in energy prices. At the same time, households with RES installations share these concerns to a lesser extent compared to non-RES users.
In the opinion of respondents, energy transformation has a positive impact on the environment and air quality. These statements were rated highest by respondents. Respondents also pointed to the negative financial aspects for households associated with the energy transition. The survey found that having RES installations in households reduces concerns about the energy transition. Moreover, those with RES installations are far less negative about its effects (financial, energy price increases, lack of energy resources) and much more positive about the positive effects of the energy transition (positive impact on quality of life and the environment). This state of affairs should encourage actions to support households in investing in RES, as it may increase positive perceptions of the ongoing energy transition process.
High inflation in Poland and the increase in energy resources prices caused by, among other things, the war in Ukraine and the lack of supply of resources from the Russian Federation, may affect the increased interest of households in renewable energy sources. This indicates directions for further empirical research on the development and impact of the geopolitical situation on households’ behaviors and attitudes towards RES.

Author Contributions

Conceptualization, E.J.S., M.K. and J.P.; methodology, E.J.S., M.K. and J.P.; validation, E.J.S., M.K. and J.P.; formal analysis, E.J.S. and M.K.; investigation, E.J.S., M.K. and J.P.; resources, M.K. and J.P.; data curation, M.K.; writing—original draft preparation, E.J.S., M.K. and J.P.; writing—review and editing, E.J.S., M.K. and J.P.; visualization, M.K. and J.P.; supervision, E.J.S.; project administration, E.J.S. and M.K.; funding acquisition, M.K. and J.P. All authors have read and agreed to the published version of the manuscript.

Funding

This research received no external funding.

Data Availability Statement

The data used for the research come from the sources indicated in the article.

Conflicts of Interest

The authors declare no conflict of interest.

References

  1. Blazquez, J.; Fuentes, R.; Manzano, B. On some economic principles of the energy transition. Energy Policy 2020, 147, 111807. [Google Scholar] [CrossRef]
  2. Fouguet, R. The slow search for solutions: Lessons from historical energy transitions by sector and service. Energy Policy 2010, 38, 6586–6596. [Google Scholar] [CrossRef] [Green Version]
  3. O’Connor, P.A. The Pardee Papers. Energy Transit. 2010, 12. Available online: https://www.bu.edu/pardee/pardee-paper-012-energy/ (accessed on 12 November 2022).
  4. Miller, C.A.; Richter, J.; O’Leary, J. Socio-energy systems design: A policy framework for Energy transitions. Energy Res. Soc. Sci. 2015, 6, 29–40. [Google Scholar] [CrossRef] [Green Version]
  5. Frankowski, J.; Turado Herrero, S. “What is in it for me?” A people-centered account of household energy transition co-benefits in Poland. Energy Res. Soc. Sci. 2021, 71, 101787. [Google Scholar] [CrossRef]
  6. Eurostat. Final Energy Consumption by Sector. Available online: https://ec.europa.eu/eurostat/databrowser/view/TEN00124__custom_4296821/default/table?lang=en.9 (accessed on 22 December 2022).
  7. Selvakkumaran, S.; Ahlgren, E. Determining the factors of household energy transitions: A multi-domain study. Technol. Soc. 2018, 57, 54–75. [Google Scholar] [CrossRef]
  8. Palm, J. Household installation of solar panels—Motives and barriers in a 10-year perspective. Energy Policy 2018, 113, 1–8. [Google Scholar] [CrossRef] [Green Version]
  9. Kucharska, A.; Prugar, J.; Ruszel, M. Transformacja Energetyczna—Pomiędzy Bezpieczeństwem Energetycznym a Konkurencyjnością Gospodarki. Oficyna Wydawnicza Politech Rzesz. 2020. Available online: https://ruj.uj.edu.pl/xmlui/handle/item/259297 (accessed on 12 November 2022).
  10. Guta, D.; Baumgartnerb, J.; Jack, D.; Carterd, E.; Shene, G.; Orgill-Meyerf, J.; Rosenthalg, J.; Dickinsonh, K.; Bailisi, R.; Masudaj, J.; et al. A systematic review of household energy transition in low and middle income countries. Energy Res. Soc. Sci. 2022, 86, 102463. [Google Scholar] [CrossRef]
  11. Karpinska, L.; Śmiech, S. Will energy transition in Poland increase the excent and depth of energy poverty? J. Clean. Prod. 2021, 328, 129480. [Google Scholar] [CrossRef]
  12. Zhang, X.; Xu, K.; He, M.; Wang, J. A Review on the Rural Household Energy in China From 1990s—Transition, Regional Heterogeneity, Emissions, Energy-Saving, and Policy. Front. Energy Res. 2022, 10, 907803. [Google Scholar] [CrossRef]
  13. Ahady, S.; Dev, N.; Mandal, A. Urban Residential Buildings’ Energy Consumption Pattern and Efficiency. Iran J. Sci. Technol. Trans. Civ. Eng. 2022, 46, 3963–3978. [Google Scholar] [CrossRef]
  14. Kaviti Musango, J. Assessing gender and energy in urban household energy transitions in South Africa: A quantitative storytelling from Groenheuwel informal settlement. Energy Res. Soc. Sci. 2022, 88, 102525. [Google Scholar] [CrossRef]
  15. Lew, G.; Sadowska, B.; Chudyk-Laskowska, K.; Zimon, G.; Wójcik-Jurkiewicz, M. Influence of Photovoltaic Development on Decarbonization of Power Generation—Example of Poland. Energies 2021, 14, 7819. [Google Scholar] [CrossRef]
  16. Waleed, K.; Mirza, F.M. Examining fuel choice patterns through household energy transition index: An alternative to traditional energy ladder and stacking models. Environ. Dev. Sustain. 2022, 24, 5225–5257. [Google Scholar] [CrossRef]
  17. Clean Household Energy Consumption in Kazakhstan: A Roadmap, Scenario for Future Household Energy Consumption. Available online: https://www.iea.org/reports/clean-household-energy-consumption-in-kazakhstan-a-roadmap/scenario-for-future-household-energy-consumption (accessed on 12 October 2022).
  18. Chadwick, K.; Russel-Bennett, R.; Biddle, N. The role of human influences on adoption and rejection of energy technology: A systematized critical review of the literature on household energy transitions. Energy Res. Soc. Sci. 2022, 89, 102528. [Google Scholar] [CrossRef]
  19. Damette, O.; Delacote, P.; Del Lo, G. Households energy consumption and transition toward cleaner energy sources. Energy Policy 2018, 113, 751–764. [Google Scholar] [CrossRef]
  20. Shen, G.; Xiong, R.; Tian, Y.; Luo, Z.; Jiangtulu, B.; Meng, W.; Du, W.; Meng, J.; Chen, Y.; Xue, B.; et al. Substantial transition to clean household energy mix in rural China. Natl. Sci. Rev. 2022, 9, nwac050. [Google Scholar] [CrossRef]
  21. Li, L.; Fan, F.; Liu, X. Determinants of rural household clean energy adoption intention: Evidence from 72 typical villages in ecologically fragile regions of western China. J. Clean. Prod. 2022, 347, 131296. [Google Scholar] [CrossRef]
  22. Li, H.; Li, H.; Cao, A.; Guo, L. Does attending in social pension program promotes household energy transition? Evidence from ethnical minority regions of rural China. Energy Sustain. Dev. 2022, 70, 361–370. [Google Scholar] [CrossRef]
  23. Gatto, A. The energy futures we want: A research and policy agenda for energy transitions. Energy Res. Soc. Sci. 2022, 89, 102639. [Google Scholar] [CrossRef]
  24. Filosa Francisco Chicombo, A.; Kaviti Musango, J. Towards a theoretical framework for gendered energy transition at the urban household level: A case of Mozambique. Renew. Sustain. Energy Rev. 2022, 157, 112029. [Google Scholar] [CrossRef]
  25. Adjakloe, Y.D.; Boateng, E.N.; Osei, S.A.; Agyapong, F. Gender and households’ choice of clean energy: A case of the Cape Coast Metropolis, Ghana. Soc. Sci. Humanit. Open 2021, 4, 100227. [Google Scholar] [CrossRef]
  26. Bögel, P.; Upham, P.; Shahrokni, H.; Kordas, O. What is needed for citizen-centred urban energy transitions: Insights on attitudes towards decentralized energy storage. Energy Policy 2021, 149, 112032. [Google Scholar] [CrossRef]
  27. Schueftan, A.; Aravena, C.; Reyes, R. Financing energy efficiency retrofits in Chilean households: The role of financial instruments, savings and uncertainty in energy transition. Resour. Energy Econ. 2021, 66, 101265. [Google Scholar] [CrossRef]
  28. Gina Maswabi, M.; Chun, J.; Chung, S. Barriers to energy transition: A case of Botswana. Energy Policy 2021, 158, 112514. [Google Scholar] [CrossRef]
  29. Dcuypere, R.; Robayest, B.; Hudders, L.; Baccarne, B.; Van de Sompel, D. Transitioning to energy efficient housing: Drivers and barriers of intermediaries in heat pump technology. Energy Policy 2022, 161, 112709. [Google Scholar] [CrossRef]
  30. Wilson, C.; Crane, L.; Chryssochoidis, G. Why do homeowners renovate energy efficiently? Contrasting perspectives and implications for policy. Energy Res. Soc. Sci. 2015, 7, 12–22. [Google Scholar] [CrossRef] [Green Version]
  31. Zepa, I. From energy islands to energy highlands? Political barriers to sustainability transitions in the Baltic region. Energy Res. Soc. Sci. 2022, 93, 102809. [Google Scholar] [CrossRef]
  32. Todd, I.; McCauley, D. Assessing policy barriers to the energy transition in South Africa. Energy Policy 2021, 158, 112529. [Google Scholar] [CrossRef]
  33. Efe Biresslioglu, M.; Hakan Demir, M.; Demirbag Kaplan, M.; Solak, B. Individuals, collectives, and energy transition: Analysing the motivators and barriers of European decarbonisation. Energy Res. Soc. Sci. 2020, 66, 101493. [Google Scholar] [CrossRef]
  34. Sahović, N.; Pereira da Silva, P. Comunity Renewable Energy—Research Perspectives. Energy Procedia 2016, 106, 46–58. [Google Scholar] [CrossRef]
  35. Persson, J.; Gronkvist, S. Drivers for and barriers to low-energy buildings in Sweden. J. Cleaer Prod. 2015, 109, 296–304. [Google Scholar] [CrossRef]
  36. Astmarsson, B.; Anker Jensen, P.; Maslesa, E. Sustainable renovation of residential buildings and the landlord/tenant dilemma. Energy Policy 2013, 63, 355–362. [Google Scholar] [CrossRef]
  37. Jung, N.; Moula, M.E.; Fang, T.; Hamdy, M.; Lahdelma, R. Social acceptance of renewable energy technologies for builidings in the Helskinki Metropolitan Area of Finland. Renew. Energy 2016, 99, 813–824. [Google Scholar] [CrossRef]
  38. Graf, P. Resistance to Energy transition—The Case of Argentina. ECPR Gen Conf. Oslo. 2017. Available online: https://ecpr.eu/Events/Event/PaperDetails/35773 (accessed on 10 November 2022).
  39. Karapin, R. Household Costa and Resistance to Germany’s Energy Transition. Rev. Policy Res. 2020, 37, 313–341. [Google Scholar] [CrossRef]
  40. Eurostat. Final Energy Consumption in Households by Type of Fuel. Available online: https://ec.europa.eu/eurostat/web/products-datasets/-/ten00125 (accessed on 10 November 2022).
  41. Eurostat. Labour Cost Levels by NACE Rev 2 Activity. Available online: https://ec.europa.eu/eurostat/web/products-datasets/-/lc_lci_lev (accessed on 12 November 2022).
  42. Eurostat. Electricity Prices by Type of User. 2022. Available online: https://ec.europa.eu/eurostat/databrowser/view/ten00117/default/table (accessed on 10 November 2022).
  43. Załącznik do Uchwały nr 22/2021 Rady Ministrów z dnia 2 Lutego 2021 r. Polityka Energetyczna Polski do 2040 r. Available online: https://www.gov.pl/attachment/52f58faa-cb7d-4045-8863-80322fc83dbf (accessed on 10 November 2022).
  44. Gwiazda, M.; Ruszkowski, P. Polacy o Źródłach Energii, Polityce Energetycznej i Stanie Środowiska; CBOS: Warsawa, Poland, 2016; ISSN 2083-1706. Available online: https://www.cbos.pl/PL/publikacje/diagnozy/034.pdf (accessed on 10 November 2022).
  45. MÓJ PRĄD. Program Dofinansowania Mikroinstalacji Fotowoltaicznych. Available online: https://mojprad.gov.pl/ (accessed on 10 November 2022).
  46. Program Czyste Powietrze. Available online: https://czystepowietrze.gov.pl/czyste-powietrze/ (accessed on 10 November 2022).
  47. Program Dofinansowania Pomp Ciepła Moje Ciepło. Available online: https://mojecieplo.gov.pl/#about-program (accessed on 10 November 2022).
  48. Portal Gov.pl. Program Mój Elektryk Narodwego Funduszu Ochrony Środowiska i Gospodarki Wodnej. Available online: https://www.gov.pl/web/nfosigw/moj-elektryk (accessed on 10 November 2022).
  49. Rządowy Program Stop Smog. Available online: https://czystepowietrze.gov.pl/stop-smog/ (accessed on 10 November 2022).
  50. Podatki.gov.pl. Ulga Termomodernizacyjna. Available online: https://www.podatki.gov.pl/pit/ulgi-odliczenia-i-zwolnienia/ulga-termomodernizacyjna/ (accessed on 10 November 2022).
  51. BGK. Premia Termomodernizacyjna z Funduszu Termomodernizacji i Remontów. Available online: https://www.bgk.pl/male-i-srednie-przedsiebiorstwa/modernizacja-i-rewitalizacja/premia-termomodernizacyjna-z-funduszu-termomodernizacji-i-remontow/ (accessed on 10 November 2022).
  52. Portal Gov.pl. Program Moja Woda. Available online: https://www.gov.pl/web/susza/program-moja-woda (accessed on 10 November 2022).
  53. Krajowy Ośrodek Zmian Klimatu, EKO-KLIMAT—Woda, Powietrze, Ziemia. Available online: https://ekodotacje.ios.edu.pl/eko-klimat-woda-powietrze-ziemia/ (accessed on 14 November 2022).
  54. Dane.gov.pl. Zużycie energii w Gospodarstwach Domowych—Szacunki Danych za rok. 2020. Available online: https://dane.gov.pl/pl/dataset/2061,szacunki-danych-o-zuzyciu-energii-w-gospodarstwach/resource/38941/table?page=1&per_page=20&q=&sort= (accessed on 1 September 2022).
  55. Chyung, S.Y.; Roberts, K.; Swanson, I.; Hankinson, A. Evidence-Based Survey Design: The Use of a Midpoint on the Likert Scale. Perform. Perform. Improv. 2017, 56, 15–23. [Google Scholar] [CrossRef] [Green Version]
  56. Dyduch, W. Ilościowe badania i operacjonalizacja zjawisk w naukach o zarządzaniu. In Podstawy Metodologii Badań w naukach o Zarządzaniu; Czakon, W., Ed.; Wolters Kluwer Business: Warszawa, Poland, 2013; p. 163. [Google Scholar]
  57. Cleff, T. Applied Statistics and Multivariate Data Analysis for Business and Economics. A Moder Approach Using SPSS, Stata, and Excel; Springer: Berlin/Heidelberg, Germany, 2019; p. 317. [Google Scholar]
  58. Witte, R.S.; Witte, J.S. Statistics, 11th ed.; John Wiley & Sons, Inc.: Hoboken, NJ, USA, 2017; pp. 387–392, 398–400. [Google Scholar]
  59. Rouder, J.N.; Engelhardt, C.R.; McCabe, S.; Morey, R. Model comparison in ANOVA. Psychon. Bull. Rev. 2016, 23, 1779–1786. [Google Scholar] [CrossRef] [Green Version]
  60. Kim, Y.J.; Cribbie, R.A. ANOVA and the variance homogeneity assumption: Exploring a better gatekeeper. Br. J. Math. Stat. Psychol. 2017, 71, 1–12. [Google Scholar] [CrossRef]
  61. Liu, Q.; Wang, L.; Wang, L. t-Test and ANOVA for data with ceiling and/or floor effects. Behav. Res. Methods 2020, 53, 264–277. [Google Scholar] [CrossRef]
  62. Hosmer, D.W., Jr.; Lemeshow, S.; Sturdivant, R.X. Applied Logistic Regression, 3rd ed.; John Wiley & Sons, Inc.: Hoboken, NJ, USA, 2013. [Google Scholar] [CrossRef]
  63. Regulation (EC) No 1059/2003 of the European Parliament and of the Council of 26 May 2003 on the Establishment of a Common Classification of Territorial Units for Statistics (NUTS). Available online: https://eur-lex.europa.eu/legal-content/EN/TXT/?uri=celex:32003R1059 (accessed on 1 September 2022).
  64. Zemke, R.; Raines, C.; Filipczak, B. Generetions At Work Managing the Clash of Boomers, Gen Xers and Gen Yers in the Workplace, 2nd ed.; Americam Management Association: New York, NY, USA, 2013. [Google Scholar]
  65. Atkinson, A.B; Bourguignon, F. (Eds.) Handbook of Income Distribution; North Holland: Amsterdan, The Netherlands, 2015; p. 598. Available online: https://ec.europa.eu/eurostat/statistics-explained/index.php?title=Glossary:Households_disposable_income (accessed on 1 September 2022).
  66. Rozporządzenie Rady Ministrów z dnia 30 Grudnia 1999 r. w Sprawie Polskiej Klasyfikacji Obiektów Budowlanych (PKOB), Dz.U. 1999 nr 112, poz. 1316, p. 6933. 1999. Available online: https://isap.sejm.gov.pl/isap.nsf/DocDetails.xsp?id=WDU19991121316 (accessed on 1 September 2022).
  67. Rozporządzenie Rady Ministrów z dnia 12 Lutego 2002 r. Zmieniające Rozporządzenie w Sprawie Polskiej Klasyfikacji Obiektów Budowlanych (PKOB). Dz.U. 2002 nr 18, poz. 170. Available online: https://isap.sejm.gov.pl/isap.nsf/DocDetails.xsp?id=WDU20020180170 (accessed on 1 September 2022).
  68. European Network for Research, Good Practice and Innovation for Sustainable Energy. Available online: https://cordis.europa.eu/article/id/422396-how-households-can-accelerate-the-transition-to-renewable-energy/pl (accessed on 14 November 2022).
  69. Transformacja Energetyczna u Kowalskich. Available online: https://gig.eu/pl/blogig/transformacja-energetyczna-u-kowalskich (accessed on 14 November 2022).
  70. Czy wojna w Ukrainie Zmieniła nasz Stosunek do Transformacji Energetycznej? Available online: https://bluemedia.pl/baza-wiedzy/badania-i-raporty/wojna-w-ukrainie-transformacja-energetyczna (accessed on 14 November 2022).
  71. Engel, H.; Purta, M.; Speelman, E.; Szarek, G.; Pluijm, P. Neutralna Emisyjnie Polska 2050. Jak Wyzwanie Zmienić w Szansę; McKinsey & Company: Warszawa, Poland, 2020. [Google Scholar]
  72. Abrecht, P.; Arungu-Olende, S.; Francis, J.; Gaspar, D.; Nashed, W.; Nwosu, B.C.E.; Rose, D.; Shinn, R. Public Acceptance of Nuclear Power—Some Ethical Issues. World Counc. Churches. Available online: https://www.iaea.org/sites/default/files/publications/magazines/bulletin/bull19-6/19604794857.pdf (accessed on 14 November 2022).
  73. Murakami, T.; Anbumozhi, V. An International Analysis of Public Acceptance of Nuclear Power, ERIA Research Project Report 2017, 3. Available online: https://www.eria.org/uploads/media/ERIA_RPR_2017_03.pdf (accessed on 14 November 2022).
  74. Wu, H.; Huang, L.; Yuan, L.; Wang, D.; Wang, S. Young Chinese people’s perceptions of nuclear power: Connection with enthusiasm of information, perceptions of nuclear reactor technology and NIMBY. Prog. Nucl. Energy 2021, 141, 103964. [Google Scholar] [CrossRef]
  75. Ram, M.; Bogdanov, D.; Aghahosseini, A.; Gulagi, A.; Oyewo, A.S.; Mensah, T.N.O.; Child, M.; Caldera, U.; Sadovskaia, K.; Barbosa, L.D.S.N.S.; et al. Global energy transition to 100% renewables by 2050: Non fiction, but needed impetus for developing economies to leapfrog into a sustainable future. Energy 2022, 246, 123419. [Google Scholar] [CrossRef]
  76. Hansen, K.; Breyer, C.; Lund, H. Status and perspectives on 100% renewable energy system. Energy 2019, 175, 471–480. [Google Scholar] [CrossRef]
  77. Zimon, D.; Woźniak, J.; Domingues, P.; Ikram, M.; Kuś, H. Proposition of improving selected logistics processes of pellet production. Inter. J. Qual. Res. 2021, 15, 387–402. [Google Scholar] [CrossRef]
Figure 1. The structure of final energy consumption in households by type of fuel in the EU. Source: own elaboration based on EUROSTAT [40]. * Others—including: liquefied petroleum gases, ambient heat (heat pumps), other kerosene, solar thermal.
Energies 16 00466 g001
Figure 2. The structure of final energy consumption in households by type of fuel in Poland. Source: own elaboration based on EUROSTAT [40]. * Others—including: liquefied petroleum gases, ambient heat (heat pumps), other kerosene, solar thermal.
Energies 16 00466 g002
Figure 3. Electricity prices for medium size households comparison of Poland and EU average. Source: own elaboration based on EUROSTAT [42].
Energies 16 00466 g003
Figure 4. Structure of renewable energy installations used in households. Source: own study N = 104.
Energies 16 00466 g004
Figure 5. Average ratings of concerns related to the energy crisis: (a) the problem of purchasing raw materials for heating due to the apartment building; (b) the problem of not being able to meet household energy needs due to the apartment building; (c) the problem of purchasing raw materials for heating due to the place of residence. Source: own elaboration.
Energies 16 00466 g005aEnergies 16 00466 g005b
Figure 6. Having renewable energy installations vs. assessing further increases in energy prices. Source: own study.
Energies 16 00466 g006
Figure 7. Average ratings of energy transition barriers. Source: own study N = 387.
Energies 16 00466 g007
Figure 8. Assessment of financial barriers according to disposable income. Source: own study N = 387.
Energies 16 00466 g008
Table 1. Support programs for households in the energy transition process.
Program NameAmount of SupportScope of Investment
My Electricity [45]subsidy up to 50% of the cost, not more than PLN 3000purchase and installation of PV systems with a capacity of 2–10 kW
Clean Air [46]subsidy of up to 50% of the cost per device;
up to a maximum of PLN 37,000—the amount depends on income
replacement of old and inefficient solid fuel heat sources with modern heat sources
My Heat [47]subsidies up to 30% of the cost, not more than PLN 21,000purchase and installation of a heat pump
My electric car [48]individuals:
without a large family card it is up to PLN 18,750
with a large family card it is up to PLN 27,000
subsidies for the purchase or leasing of electric cars and vans
Stop Smog [49]up to 70% of the cost, the average cost per building/location may not exceed PLN 53,000replacement or elimination of high-carbon heat sources with low-carbon ones,
thermal modernization of single-family houses, connection to a district heating or gas network
Thermal modernization relief [50]the maximum deduction for all completed projects cannot exceed PLN 53,000the relief covers expenses related to the purchase of construction materials, equipment and services related to the implementation of thermal modernization of the building
Thermal modernization bonus [51]only for investors using loans:
16% of costs associated with thermal upgrading,
21% of the costs associated with thermomodernization with the installation of RES micro-installation,
an additional 50% of the costs associated with the reinforcement of a large-plate building during thermomodernization
costs associated with the thermal modernization of the building
My Water [52]up to PLN 5000 per project,
up to 80% of the eligible costs of installations included in the project
purchase, supply, installation, construction and commissioning of installations related to:
rainwater harvesting,
rainwater retention,
utilization of retained rainwater
ECO—CLIMATE—Water, air, land [53]preferential loanactivities related to:
energy transition
improvement of air quality
improving water and sewage management,
transition to a closed-loop economy,
nature conservation measures, adaptation to climate change
Voivodship, commune or city fundingdependent on the particular programdependent on the particular program
Source: own elaboration.
Table 2. Sample characteristics.
VariableN%
Place of residence
village12732.8
city with up to 50,000 residents8020.7
city with over 50,000 up to 100,000 residents4611.9
city with over 100,000 up to 500 thousand residents6516.8
city with over 500,000 residents6917.8
Age
2001–Present (Generation Z)82.1
1982–2000 (Generation Y)28373.1
1961–1981 (Generation X)8221.2
1943–1960 (Baby boomers (BB))143.6
Sex
Female20753.5
Male18046.5
Disposable income per person
<1000 PLN143.6
1000.01–1500 PLN369.3
1500.01–2000 PLN4611.9
2000.01–2500 PLN5414.0
2500.01–3000 PLN7218.6
>3000.01 PLN16542.6
Residential building
single-family building21956.6
multi-family building16843.4
NUTS 1 macroregion
Eastern11329.2
Southwestern9925.6
Southern5815.0
Mazowieckie district3910.1
Northwestern256.5
Northern369.3
Central174.4
Source: own study.
Table 3. Household equipment with renewable energy installations for statistically significant criteria. Results of chi-square independence test.
VariableEquipment with Renewable Energy Installations
YesNo
N%N%
Place of residence (p = 0.0000)
village6148.0%6652.0%
city with up to 50 thousand residents1822.5%6277.5%
city over 50 thousand to 100 thousand residents715.2%3984.78%
city over 100 thousand to 500 thousand residents1421.5%5178.5%
city over 500 thousand inhabitants45.8%6594.2%
Household disposable income (p = 0.0383)
<1000 PLN857.1%642.9%
1000.01–1500 PLN1130.6%2569.4%
1500.01–2000 PLN1430.4%3269.6%
2000.01–2500 PLN916.7%4583.3%
2500.01–3000 PLN2331.9%4968.1%
>3000.01 PLN3923.6%12676.4%
Residential building (p = 0.0000)
single-family building9543.3%12456.6%
multi-family building95.4%15994.6%
NUTS 1 macroregion (p = 0.0013)
East4741.6%6658.4%
South West1818.2%8181.8%
South1627.6%4272.4%
Mazowieckie province512.8%3487.2%
Northwest416.0%2184.0%
North925.0%2775.0%
Central529.4%1270.6%
Source: own study. N = 104.
Table 4. Share of energy from renewable energy sources in total household energy consumption. N = 104.
Share of Energy Obtained from RESN *%
20%2221.2
(20–40%]2524.0
(40–60%]2625.0
(60–80%]1312.5
>80%1817.3
Total104100.0
Source: own study. *N = 104, number of respondents with RES installations.
Table 5. Factors influencing the intention to invest in renewable energy sources.
Independent FactorsIntention to Invest in Renewable
Energy Installations (Correct Classifications: 65.63%)
OR (95% Confidence Interval)p
Residential building (single-family)4.20 (2.7–6.5)0.00000
The belief that RES installations protect against the effects of the energy crisis1.71 (1.1–2.7)0.01708
p—test probability value—an assessment of the statistical significance of a factor. OR—odds ratio (along with 95% confidence interval) expresses how many times a given event will take place, if there occurs a change of independent variable (at established values of independent variables). Source: own study.
Table 6. Assessment of concerns about the energy crisis—response structure and basic statistical parameters.
Concerns about the Energy CrisisValuation of the Statement (N = 387)
Definitely
Not Afraid
I’m Not
Worried
I Have No
Opinion
I’m WorriedDefinitely Afraid x ¯ s
(1)(2)(3)(4)(5)
further increase in energy prices 2.8%7.0%4.7%37.2%48.3%4.211.01
energy supply interruptions4.7%19.1%11.6%45.0%19.6%3.561.14
problems with purchasing raw materials for household heating6.7%18.3%14.5%37.7%22.7%3.511.22
inability to meet the energy needs of the household2.3%20.4%14.7%41.6%20.9%3.581.10
x ¯ —arithmetic mean, s —standard deviation. Source: own study. The more intense colour indicates a higher percentage of indications.
Table 7. The structure of responses regarding the energy transition and the mean score and standard deviation.
Energy Transition StatementsEvaluation of the Statement (N = 387)
I Strongly DisagreeI DisagreeI Have No OpinionI AgreeI Strongly Agree x ¯ s
(1)(2)(3)(4)(5)
has a negative financial impact on households4.9%19.1%28.9%30.0%17.1%3.351.12
will cause further increases in energy prices over the next 5 years4.4%23.8%24.8%30.5%16.5%3.311.13
will affect the stabilization of energy prices over the next 5 years4.7%25.8%39.5%24.8%5.2%3.000.95
leads to quantitative shortages of energy resources11.9%31.8%27.1%20.7%8.5%2.821.15
leads to shortages in the continuity of energy supply9.3%33.6%24.5%25.6%7.0%2.871.11
is technically difficult to implement2.6%14.5%27.9%41.3%13.7%3.490.99
has a positive impact on the level of quality of life4.4%11.4%22.5%45.7%16.0%3.581.03
has a positive impact on the environment7.0%7.2%18.3%39.3%28.2%3.741.15
x ¯ —arithmetic mean, s —standard deviation. Source: own study. N = 387.
Table 8. Energy transition opinions and selected characteristics from the metric (Kruskal–Wallis ANOVA and Mann–Whitney U test results).
Household Energy Transformation OpinionsResidenceDisposable
Income
Residential BuildingNUTS 1
(p)
currently has a negative financial impact on households0.32290.01020.29170.0336
will cause further increases in energy prices over the next 5 years0.11270.19720.91900.0093
will affect the stabilization of energy prices over the next 5 years0.20330.71880.13230.1214
leads to quantitative shortages of energy resources0.15860.48030.87090.4093
leads to shortages in the continuity of energy supply0.24730.24560.39360.0086
is technically difficult to implement0.50250.09730.03250.1104
has a positive impact on the quality of life of society0.01990.95530.75360.1111
has a positive impact on the environment0.30660.78510.31620.2213
Source: own study.
Table 9. Opinions on energy transition according to possession of renewable energy installations.
Opinions on Energy Transition Has an Installation Using RES
(Average Rating)
pYesNo
negative financial impact on households0.00873.083.45
increase in energy prices over the next 5 years0.02623.103.39
results in a quantitative shortage of energy resources0.00832.582.91
is technically difficult to implement0.02363.293.57
positive impact on the level of quality of life0.00803.813.49
positive impact on the environment0.03153.973.66
Source: own study based on Mann–Whitney U test. N = 387.
Table 10. Structure of responses regarding barriers to energy transition, as well as the average score and standard deviation.
BarriersBarrier Evaluation * x ¯ s
123456
financial barriers2.6%3.6%4.1%6.5%18.9%64.3%5.281.24
political barriers9.0%10.3%7.5%13.7%42.9%16.5%4.211.53
lack of interest9.8%18.9%28.7%30.2%9.0%3.4%3.201.23
lack of awareness8.8%21.7%34.9%21.2%10.1%3.4%3.121.21
lack of certainty13.2%30.7%17.3%18.9%13.2%6.7%3.081.47
resistance to change56.6%14.7%7.5%9.6%5.9%5.7%2.111.57
Total100%100%100%100%100%100%
* 1—barrier is least important, 6—barrier is most important, x ¯ —arithmetic mean, s —standard deviation. Source: own study.
Table 11. Evaluation of barriers to energy transition according to variables characterizing the study sample (Results of Kruskal–Wallis ANOVA and Mann–Whitney U test).
Barriers to TransitionResidenceDisposable IncomeResidential BuildingNUTS 1
(p)
financial barriers0.17070.00630.04560.2280
political barriers0.82840.57260.87650.1216
lack of interest0.03900.40220.09060.8107
lack of awareness0.46580.48100.21700.5980
lack of certainty0.31230.90080.15970.1161
resistance to change0.47310.30150.91130.0121
Source: own study N = 387.
Table 12. Average ratings of energy transition barriers according to important characteristics of surveyed households.
VariableAverage Evaluation of Financial Barriers
Disposable income (p = 0.0063)
<1000 PLN5.43
1000.01 PLN do 1500 PLN5.53
1500.01–2000 PLN5.50
2000.01–2500 PLN5.50
2500.01–3000 PLN5.54
>3000.01 PLN4.98
Residential building (p = 0.0456)
single-family building5.41
multi-family building5.12
Source: own study based on Kruskal–Wallis ANOVA and Mann–Whitney U test. N = 387.
Disclaimer/Publisher’s Note: The statements, opinions and data contained in all publications are solely those of the individual author(s) and contributor(s) and not of MDPI and/or the editor(s). MDPI and/or the editor(s) disclaim responsibility for any injury to people or property resulting from any ideas, methods, instructions or products referred to in the content.

