Article

Economic, Energy and Environmental Efficiency of Road Freight Transportation Sector in the EU

by
Joanna Domagała
1,* and
Marta Kadłubek
2
1
Institute of Economics and Finance, Warsaw University of Life Sciences, 166 Nowoursynowska St., 02-787 Warsaw, Poland
2
Faculty of Management, Czestochowa University of Technology, 42-200 Czestochowa, Poland
*
Author to whom correspondence should be addressed.
Energies 2023, 16(1), 461; https://doi.org/10.3390/en16010461
Submission received: 24 October 2022 / Revised: 22 December 2022 / Accepted: 27 December 2022 / Published: 31 December 2022
(This article belongs to the Special Issue Energy Consumption in EU Countries)

Abstract

:
The proper development of transportation constitutes the basis for an effectively functioning economy at the national and global levels. On the other hand, transportation significantly impacts the environment and climate. Sustainable transportation management should therefore include both economic, social and environmental aspects. The article aims to comprehensively assess the economic–energy–environmental efficiency of the 27-road freight transport sector in EU countries in 2019. The research was conducted using the non-parametric Data Envelopment Analysis (DEA) method. The Slacks-Based Measure–Data Envelopment Analysis (SBM-DEA) model was used, taking into account unwanted (undesirable) effects. As non-energy inputs in the DEA model used the labor in the road freight transport sector, stock of registered goods vehicles, and the length of the road network. Moreover, the energy consumption by the road freight transport sector was used as energy inputs in the DEA model. Desirable outputs were taken as road freight transport sector revenues and freight work performed by the sector. GHG emissions expressed in CO2 equivalent were treated as undesirable outputs. The research also adopts energy productivity and GHG emission efficiency indicators. The eco-efficiency of the road freight transport sector in EU countries varies. Ten countries have efficient road freight transport sectors. The efficient road freight transport group included Denmark, Germany, Belgium, Lithuania, Luxembourg, the Netherlands, Poland, Portugal, Slovenia and Bulgaria. They efficiently transformed the inputs into outputs. Five countries were recognized as eco-efficiency followers, including Italy, Finland, Slovakia, Sweden and Romania, and 12 countries were characterized by an inefficient road freight transport sector. Based on benchmarking principles for inefficient road freight transport sectors, the changes in input and output levels were proposed to improve efficiency. The relationship between the economic development of EU countries and the eco-efficiency of the road freight transport sector was also analyzed, indicating a positive relationship between the variables but with weak strength. The main contributions of this article are an extension of previous DEA works that assesses the efficiency of the road freight transport sector, also considering undesirable variables. Research conclusions are particularly important for policymakers in the context of management sustainable transportation development in the EU.

1. Introduction

The transport sector is crucial to global economic development. It has been one of the critical factors in improving mobility, urbanization and trade. In addition, the transport sector has enabled connectivity between cities, countries and remote regions worldwide. It has created millions of jobs and increased the productivity of other sectors of the global economy [1].
The transport sector in the European Union (EU) has grown rapidly over the past quarter century (up 36%). In 2020, the total goods transportation activities done by transport was 3271 billion tonne-kilometers (Figure 1). A proportion of 54% of the transport work performed in the EU is by road, 28% by sea and 11.5% by rail. The other modes of transportation are far less critical. It should also be noted that road transport has led the way in terms of development. Between 1995 and 2020, road transportation work increased from 1127.16 billion tkm to 1744.99 billion tkm (i.e., by 55%).
However, the systematic increase in the tasks carried out in road transportation for both freight and passenger transport is causing an increasing demand for energy [2], leading to air pollution, climate change and the depletion of fossil fuel reserves [3].
Therefore, it becomes imperative to improve road transportation’s energy and environmental efficiency, which relies primarily on petroleum products. Energy efficiency is one of the main challenges of the European Union’s Europe 2020 development strategy [4] and its flagship initiatives: Resource-Efficient Europe [5] and Innovation Union [6]. Making resource efficiency a guiding principle of EU policy provided the basis for developing a shared, coherent and sustainable vision of resource use, increasing the competitiveness of individual economies and the EU as a whole, and improving the well-being of current and future societies [7,8]. Such ambitious challenges require appropriate and swift action on many levels, including transportation.
Increasing transportation activity and its negative environmental impact is increasingly of interest to researchers [9,10,11,12]. Studies also often look at regulatory policy instruments (in the form of certificates, standards, taxes, fees or greenhouse gases (GHG) emission allowances) to accelerate the greening of the transport sector. Yan and Eskeland [13] focused on the registration tax introduced in Norway, which has a statistically significant positive impact on the car market, increasing sales of low-emission vehicles. Baranzini et al. [14] and Vehmas et al. [15] conducted analyses of the impact of carbon fuel taxes on CO2 reduction. Lin and Li [16] estimated reductions in emission growth rates due to carbon taxation in four Scandinavian countries and the Netherlands. Bosquet [17] studied the effects of green taxation reform on CO2 emissions in eight countries.
Policymakers are raising the demand for new concepts and methodologies that will enable an integrated and comprehensive assessment of transportation eco-efficiency to improve its eco-efficiency by the introduction of appropriate regulatory instruments. Analyses of transportation eco-efficiency are based on various methods, among others, Stochastic Frontier Analysis [18], analysis and model that combines output growth and energy savings [19], scope-based non-parametric methods [20] and lifecycle methods [21]. However, the most popular method is Data Envelopment Analysis (DEA).
However, most studies based on the DEA method use single-period data sets for local transportation systems. There are few analyses internationally that detect disparities between countries in terms of transportation efficiency. In addition, most studies [22,23,24,25,26] estimate the efficiency of the transport sector by combining multiple modes (e.g., road, rail and inland waterway). These assessments ignore internal independent transportation subsectors.
Given that the road freight transport sector is the largest consumer of energy and emitter of GHGs, the empirical study examined this particular transport subsector in a cross-section of EU countries. This article’s main objective is to determine the efficiency of the road freight transport sector in EU countries in a comprehensive and multidimensional manner, i.e., accounting for economic, energy and environmental aspects, using a non-parametric Data Envelopment Analysis method that accounts undesirable effects. In addition, it is assumed that inefficient road freight transport sectors, following the idea of benchmarking changes in the inputs and outputs level, could improve their efficiency. The research will also determine the relationship between the eco-efficiency of the road freight transport sector and countries’ level of economic development as expressed by gross domestic product (GDP) per capita. Finally, the research will verify the hypothesis that EU countries with higher levels of economic development have higher economic–energy–environmental efficiency in the road freight transport sector.
This research fills the research gap in assessing the variation in eco-efficiency of the road freight transport sector in EU countries and determining the relationship between its efficiency and the economic development of countries. In addition, the DEA method considers energy consumption on the input side and GHG emissions on the output side, so it was deemed that the DEA method comprehensively and multidimensionally evaluates the economic–energy–environmental efficiency of the road freight transport sector in EU countries. This approach is part of sustainable transportation management. The efficiency analyses conducted have further identified sources for improving the eco-efficiency of individual transport sectors in EU countries. The study’s insights can aid governments and policymakers in evaluating and enhancing the operational efficiency of road transportation and its associated industries.
The paper is structured as follows: Section 1 contains the introduction, Section 2 presents the literature review in the field of energy consumption and GHG emission by transport in the EU. This section also covers the application of the Data Envelopment Analysis method in the efficiency measurement of transport. In Section 3, the variables are described and the methodology of the Slacks-Based Measure (SBM) DEA model is presented. Section 4 provides the results of the empirical analysis and covers the discussion the main findings. Section 5 presents conclusions.

2. Literature Review

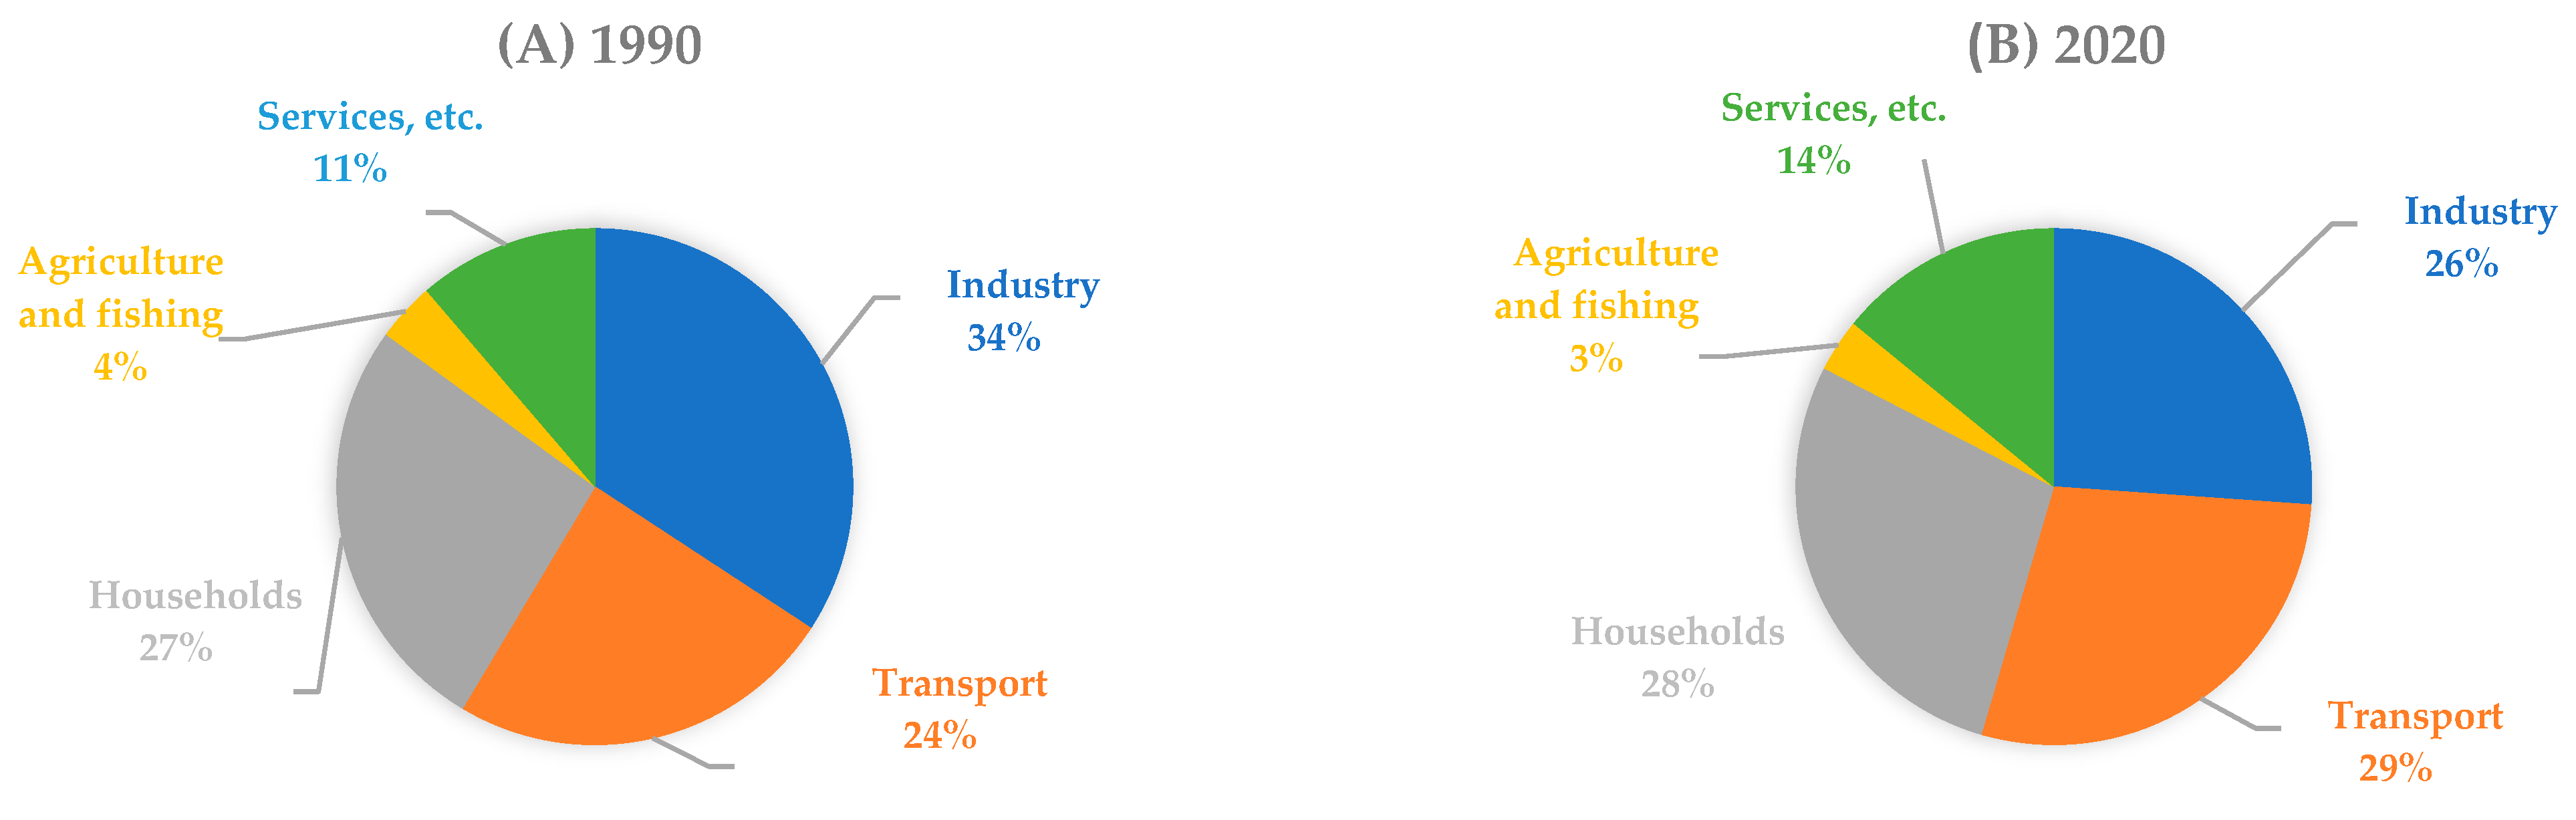
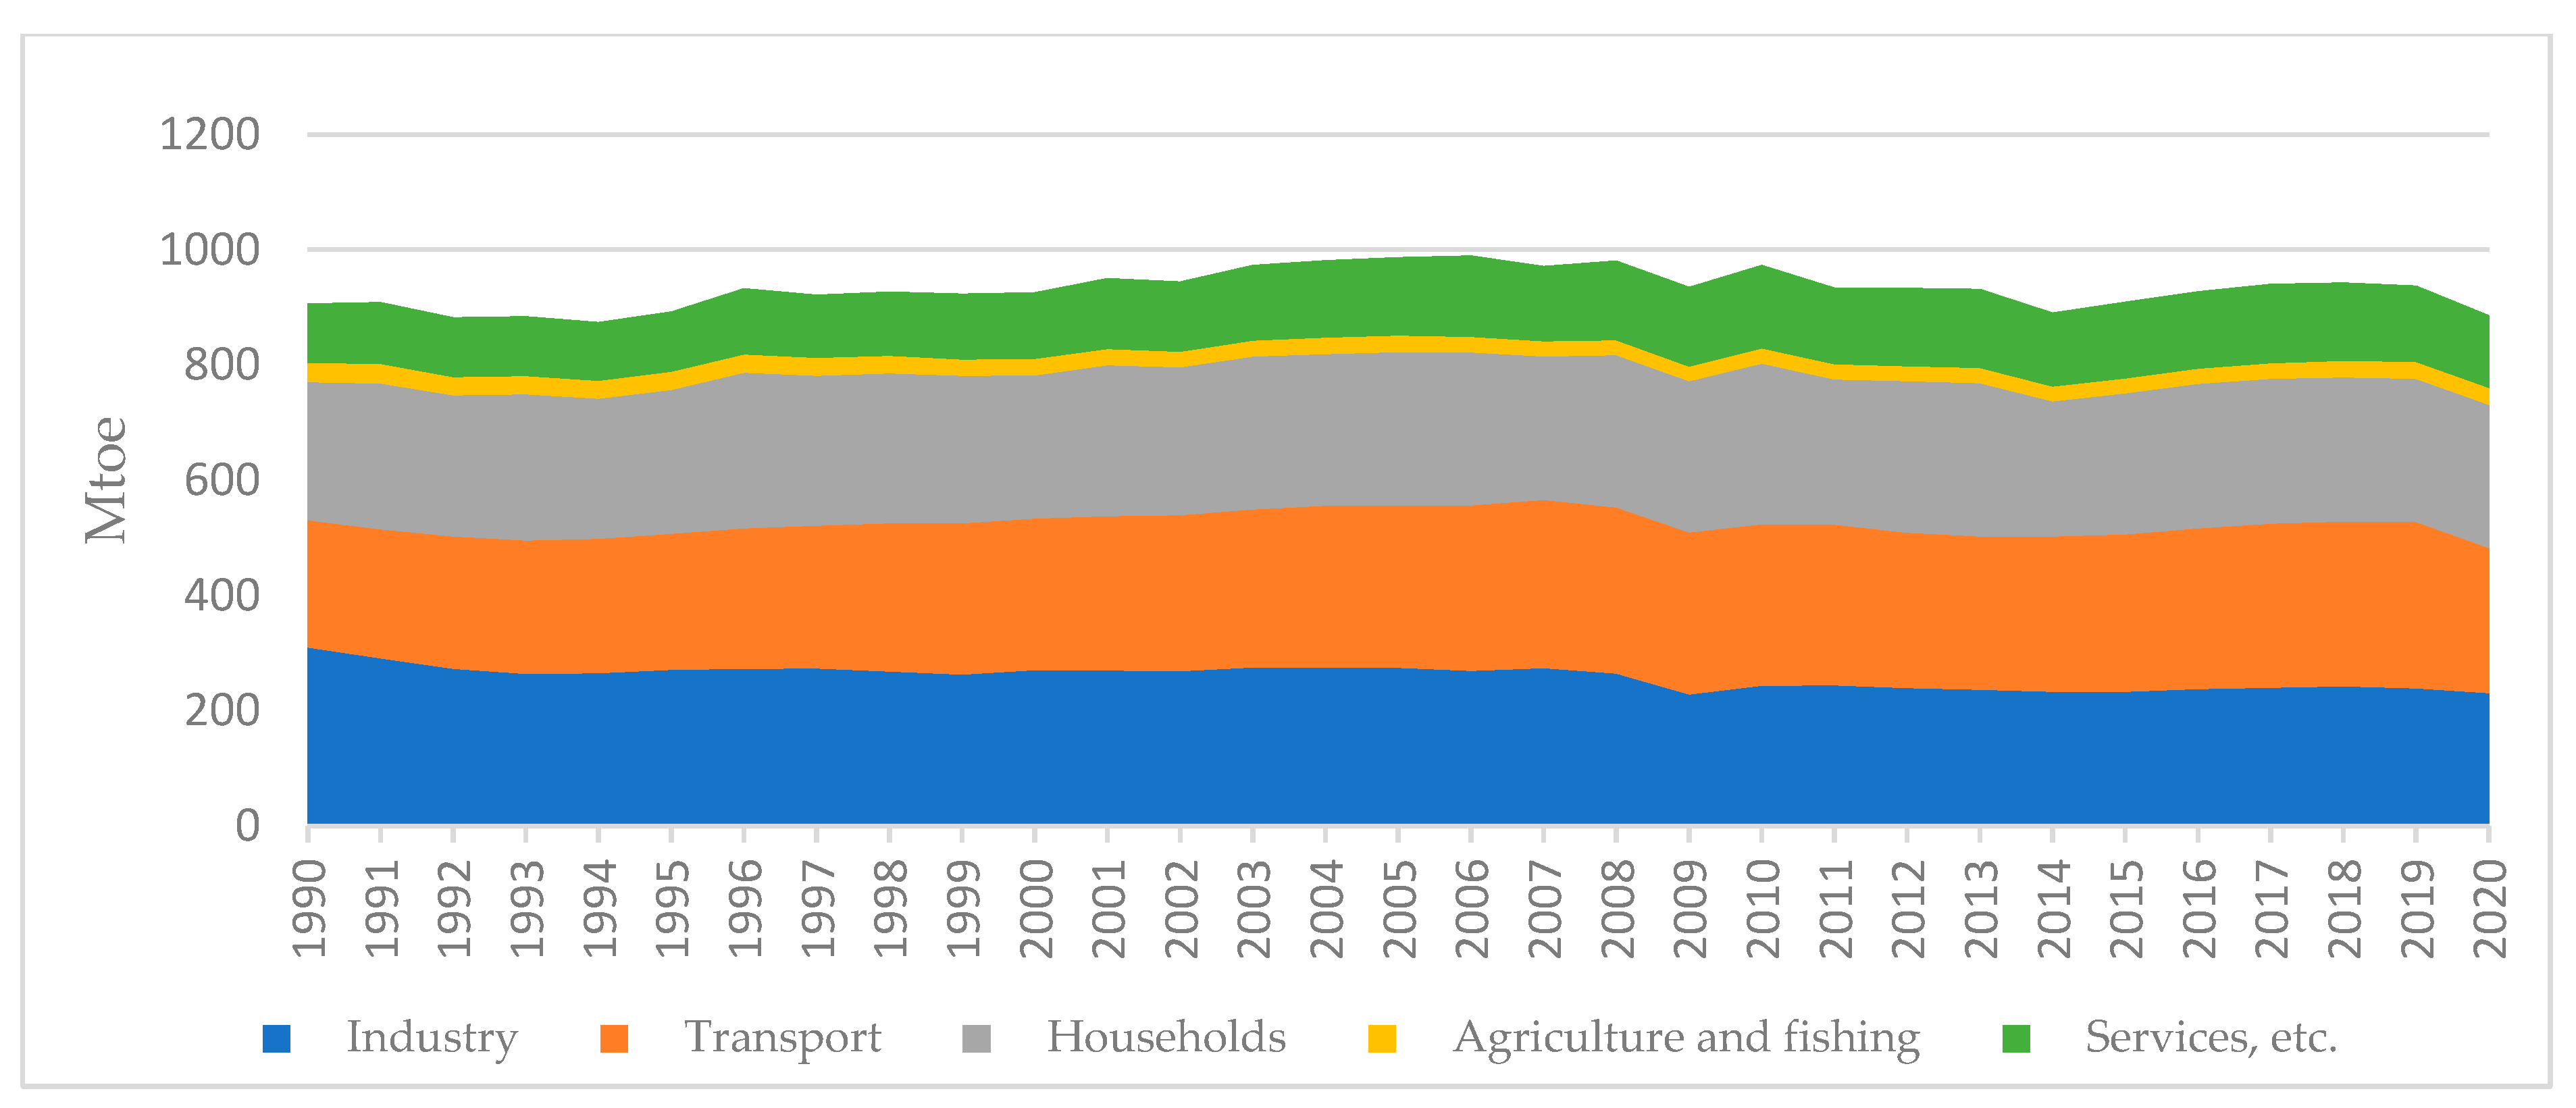
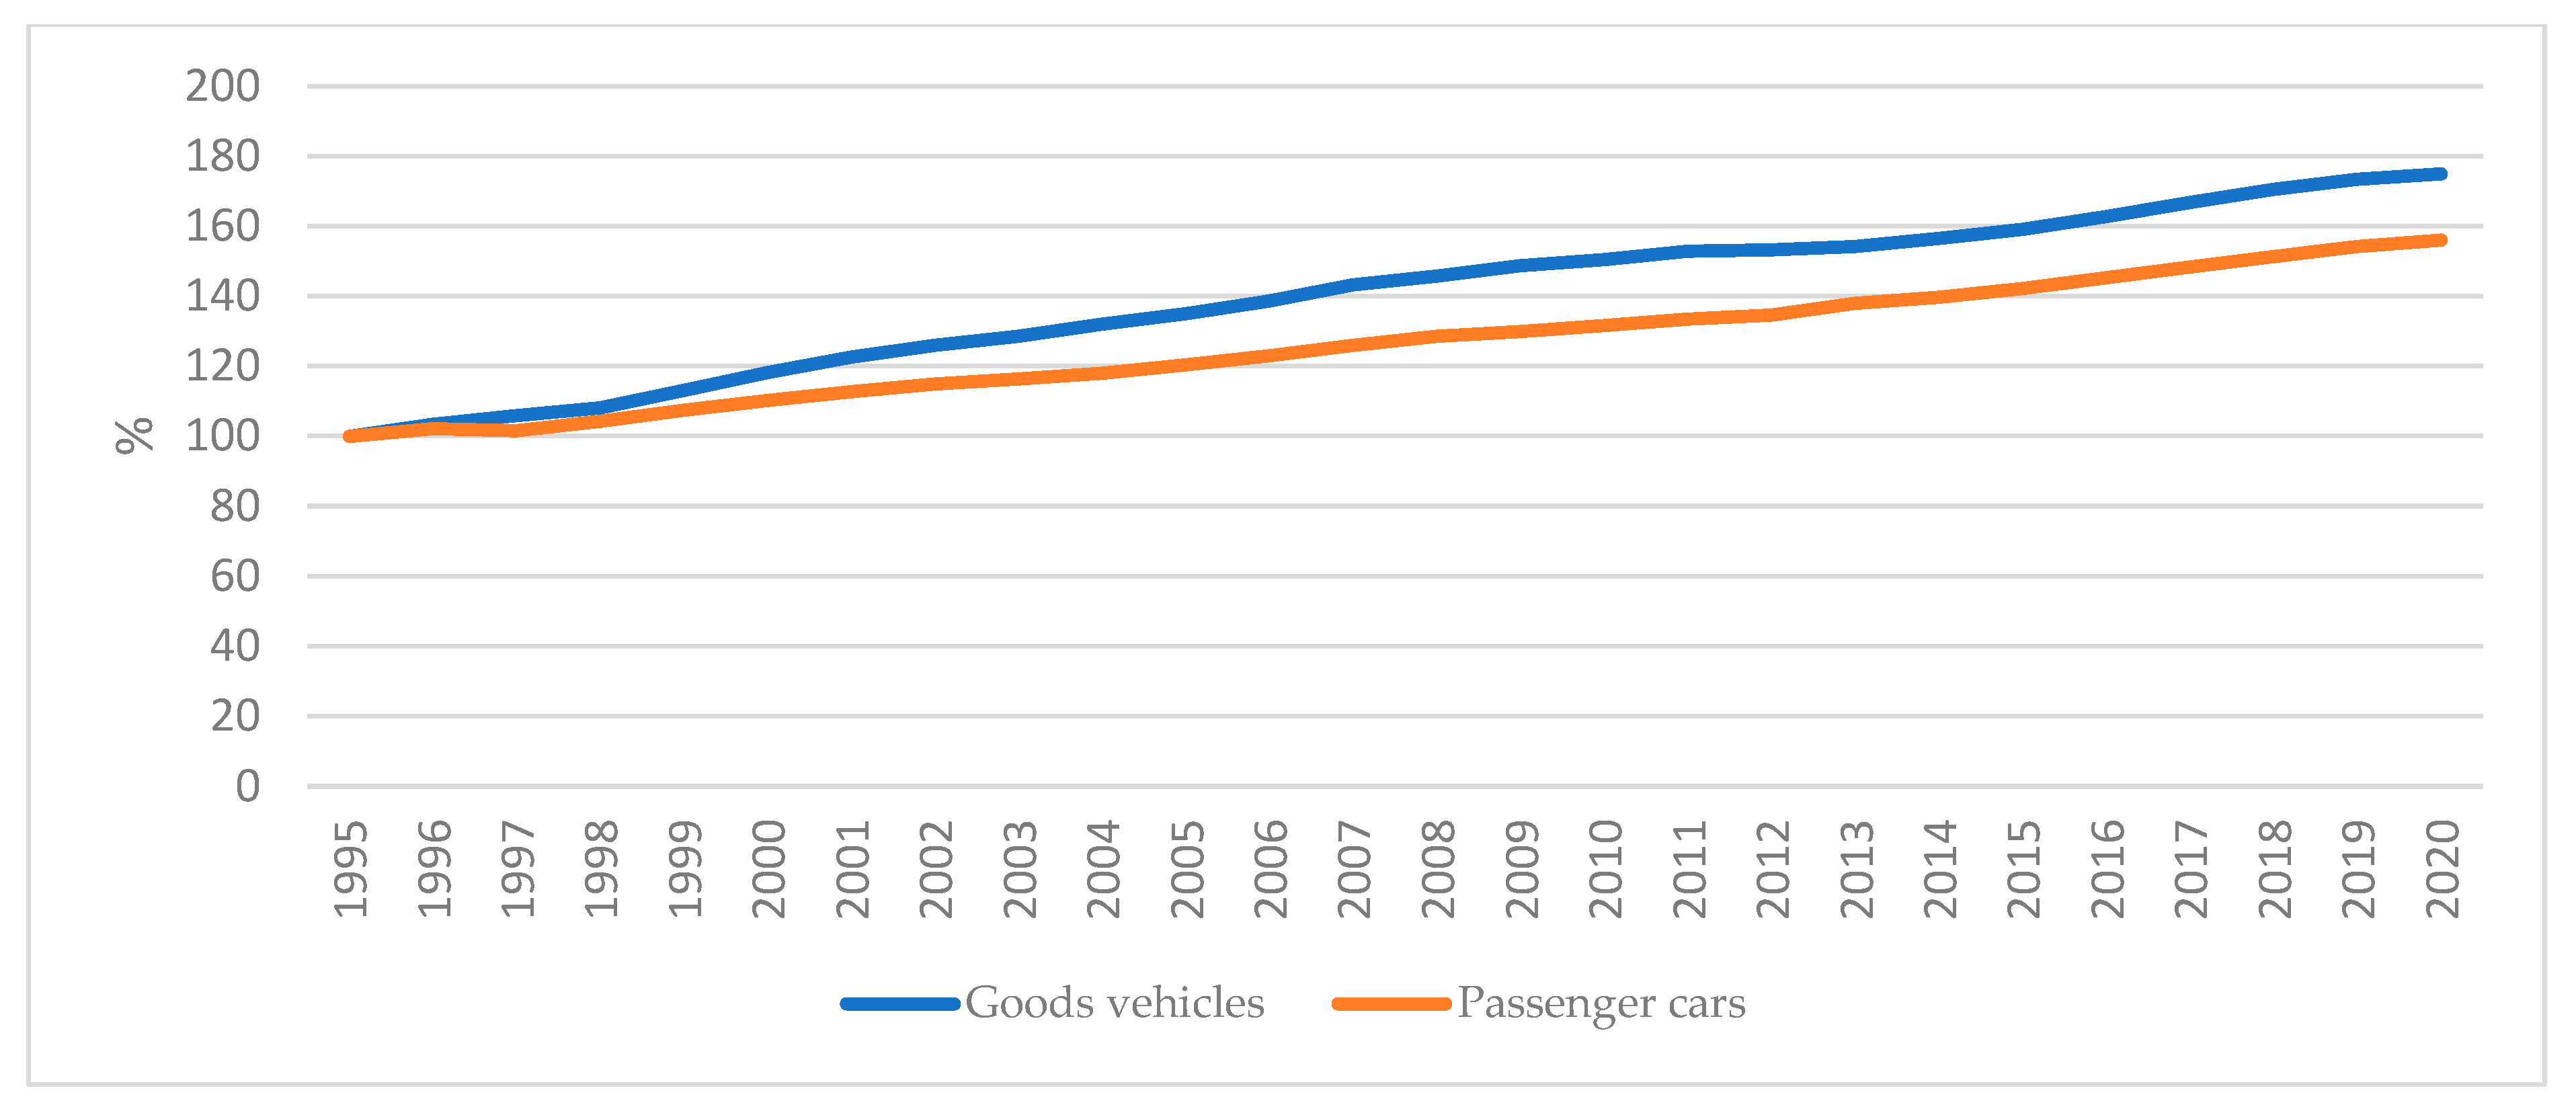
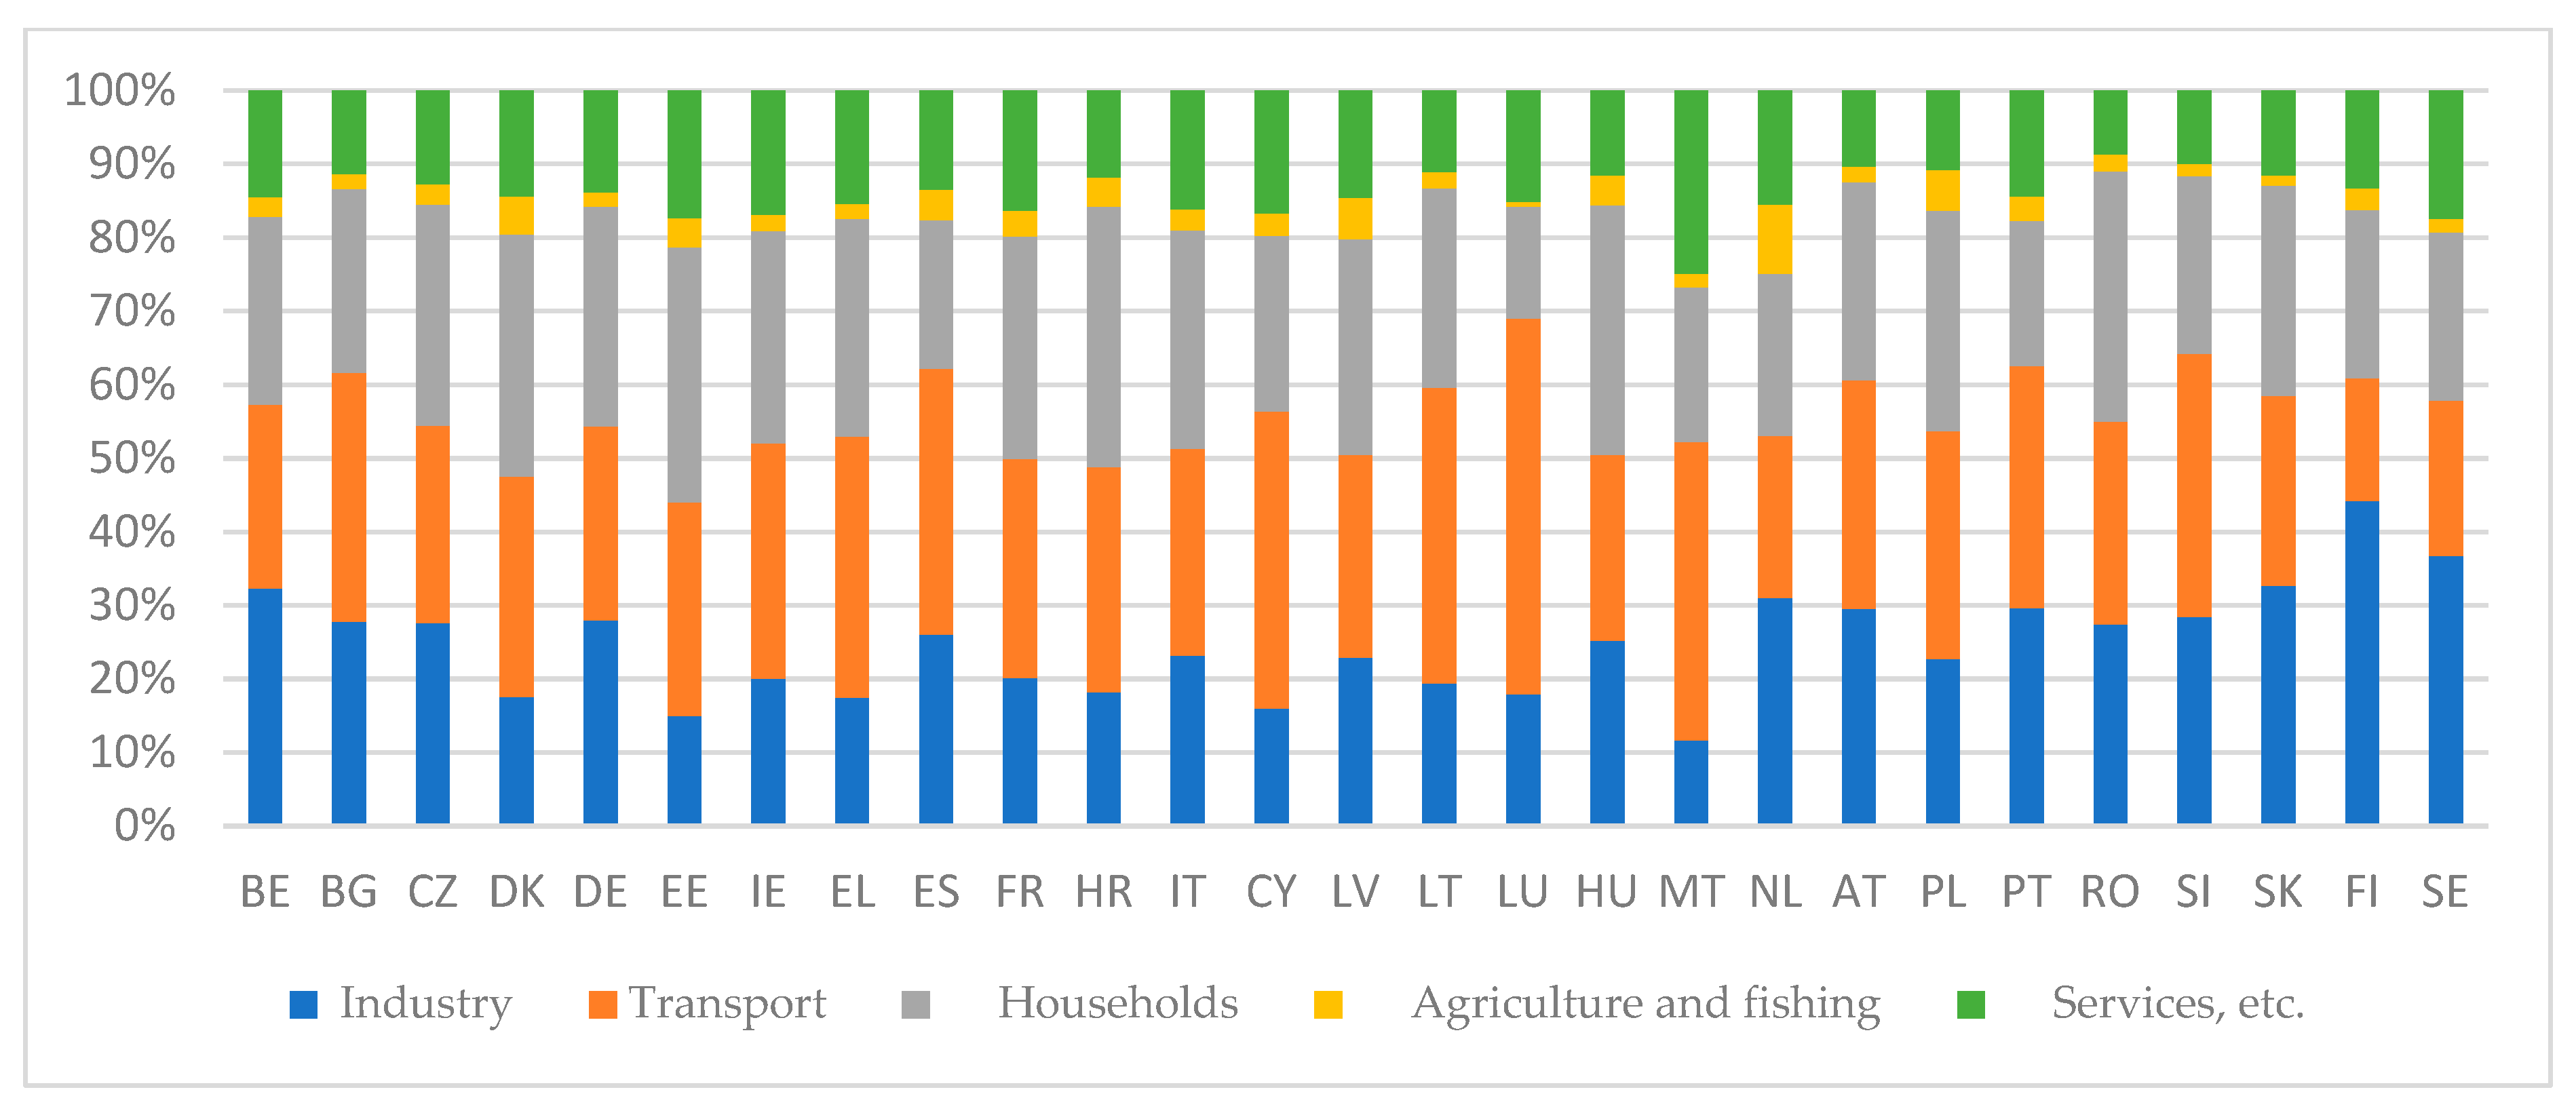
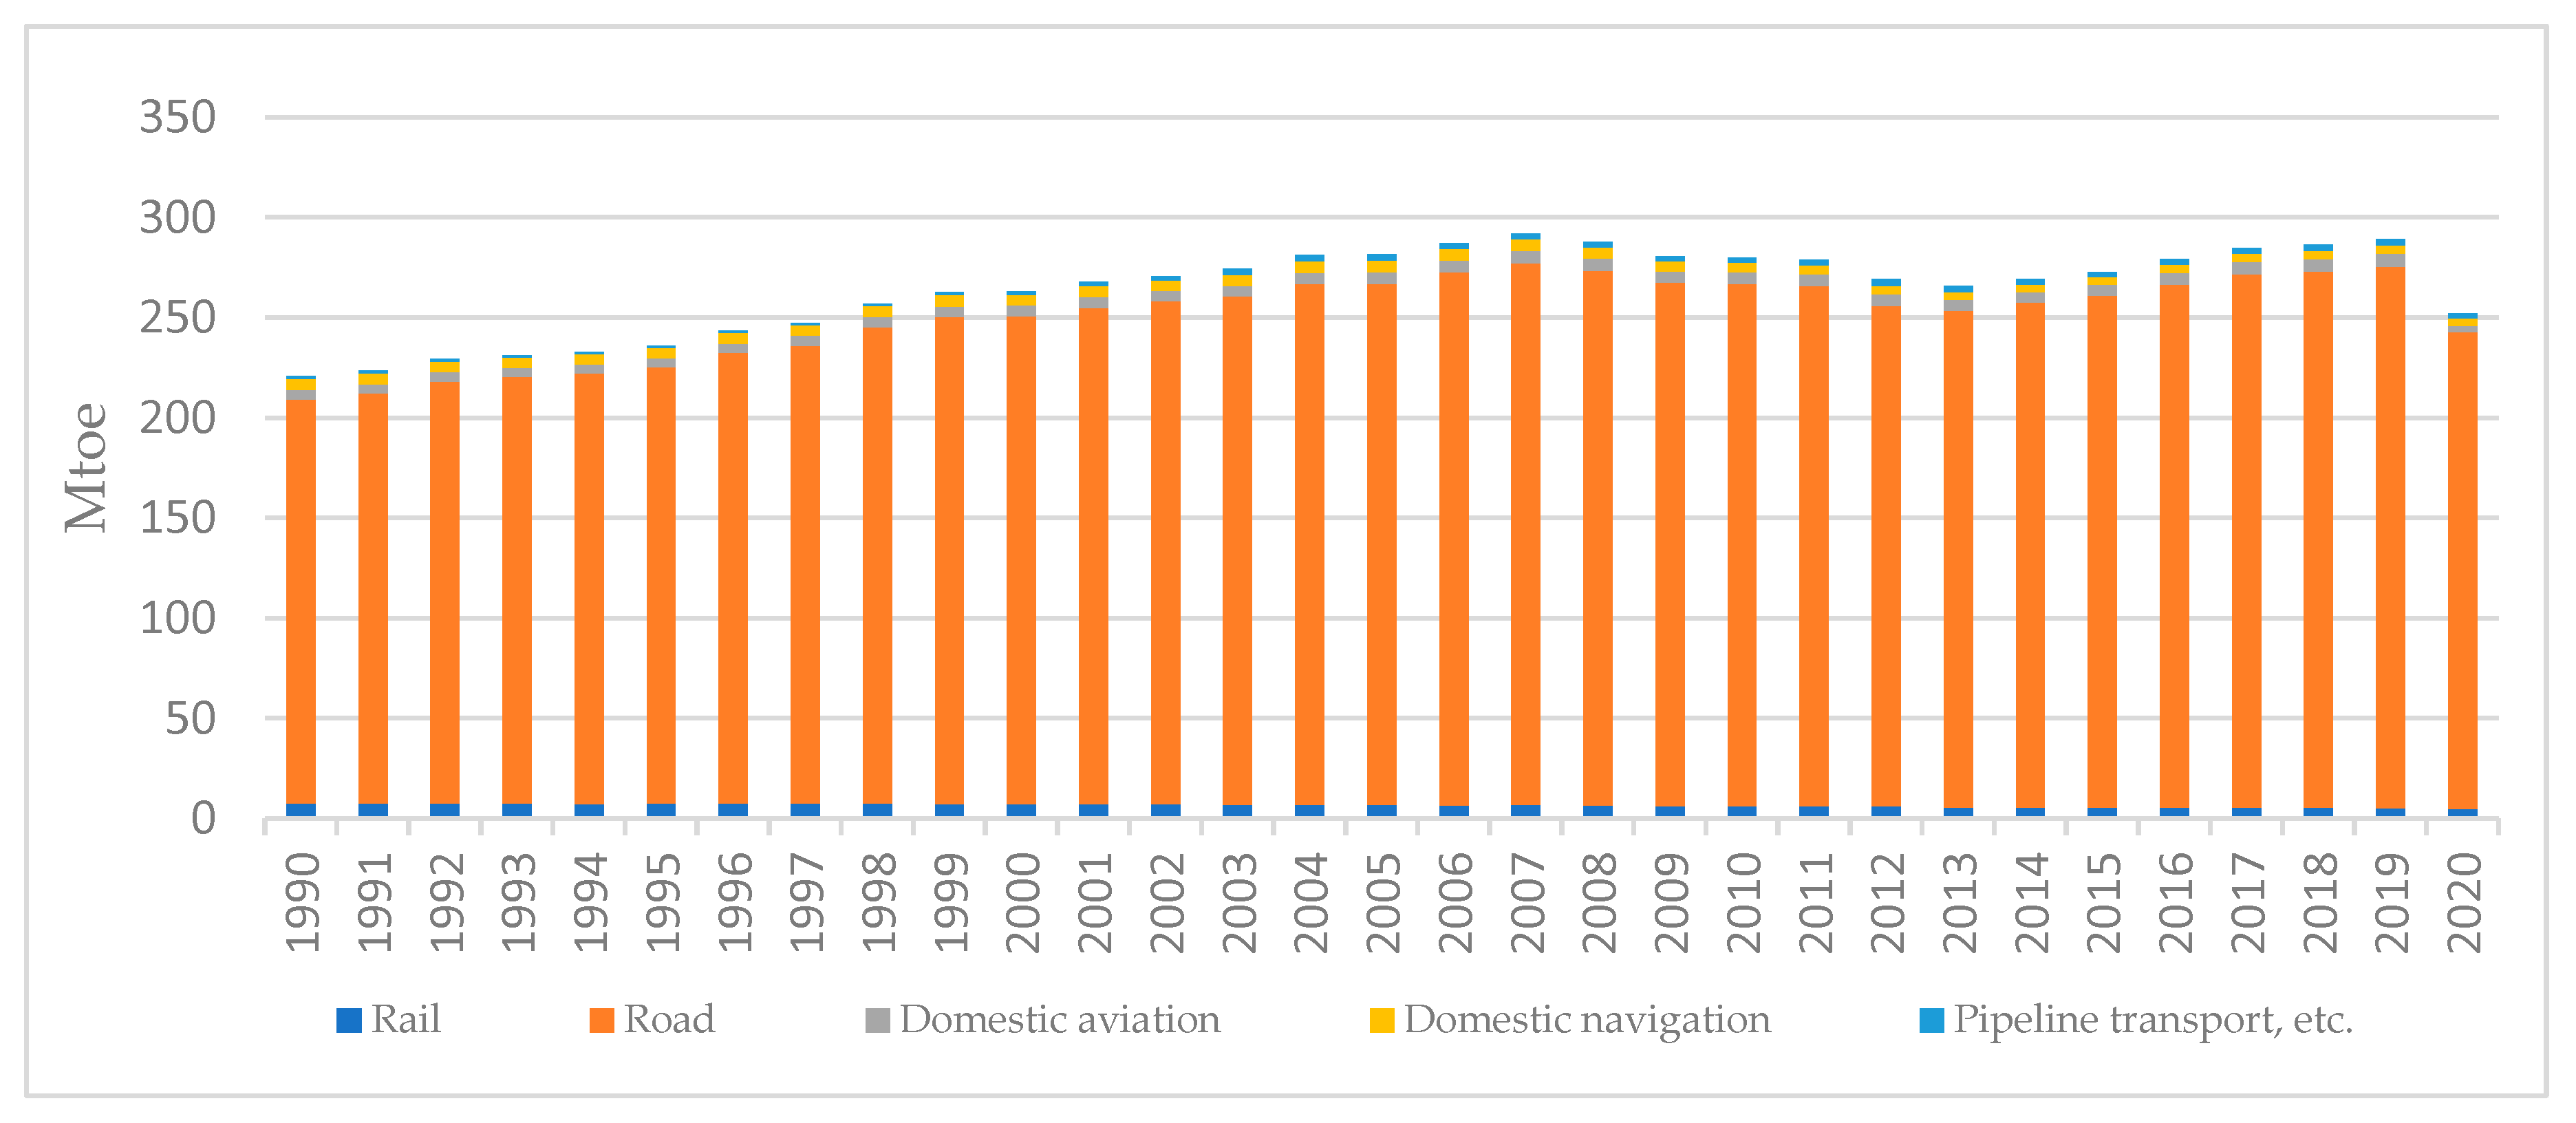
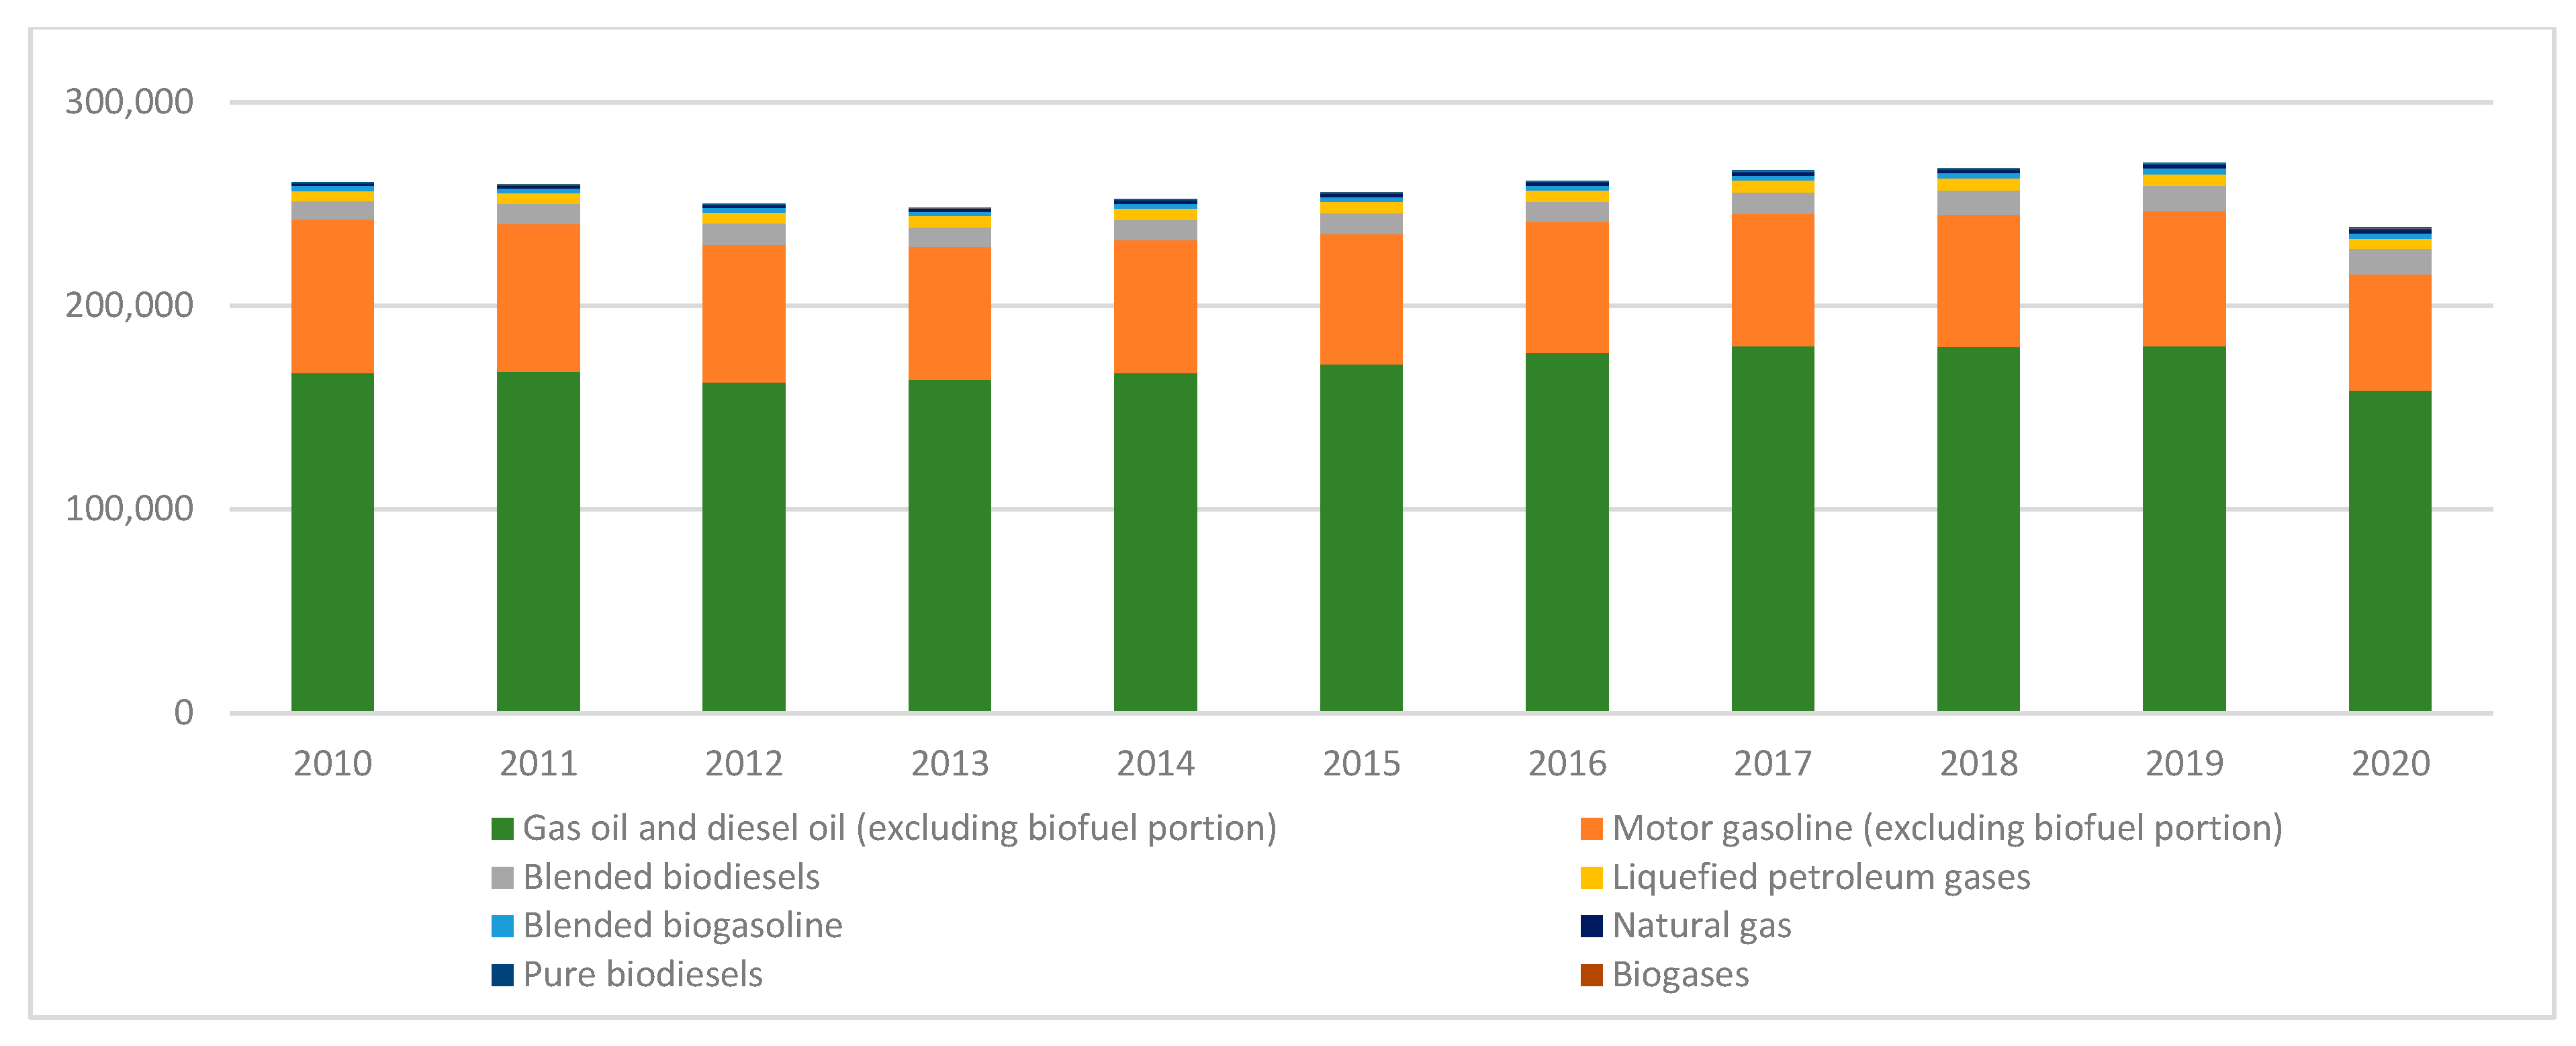
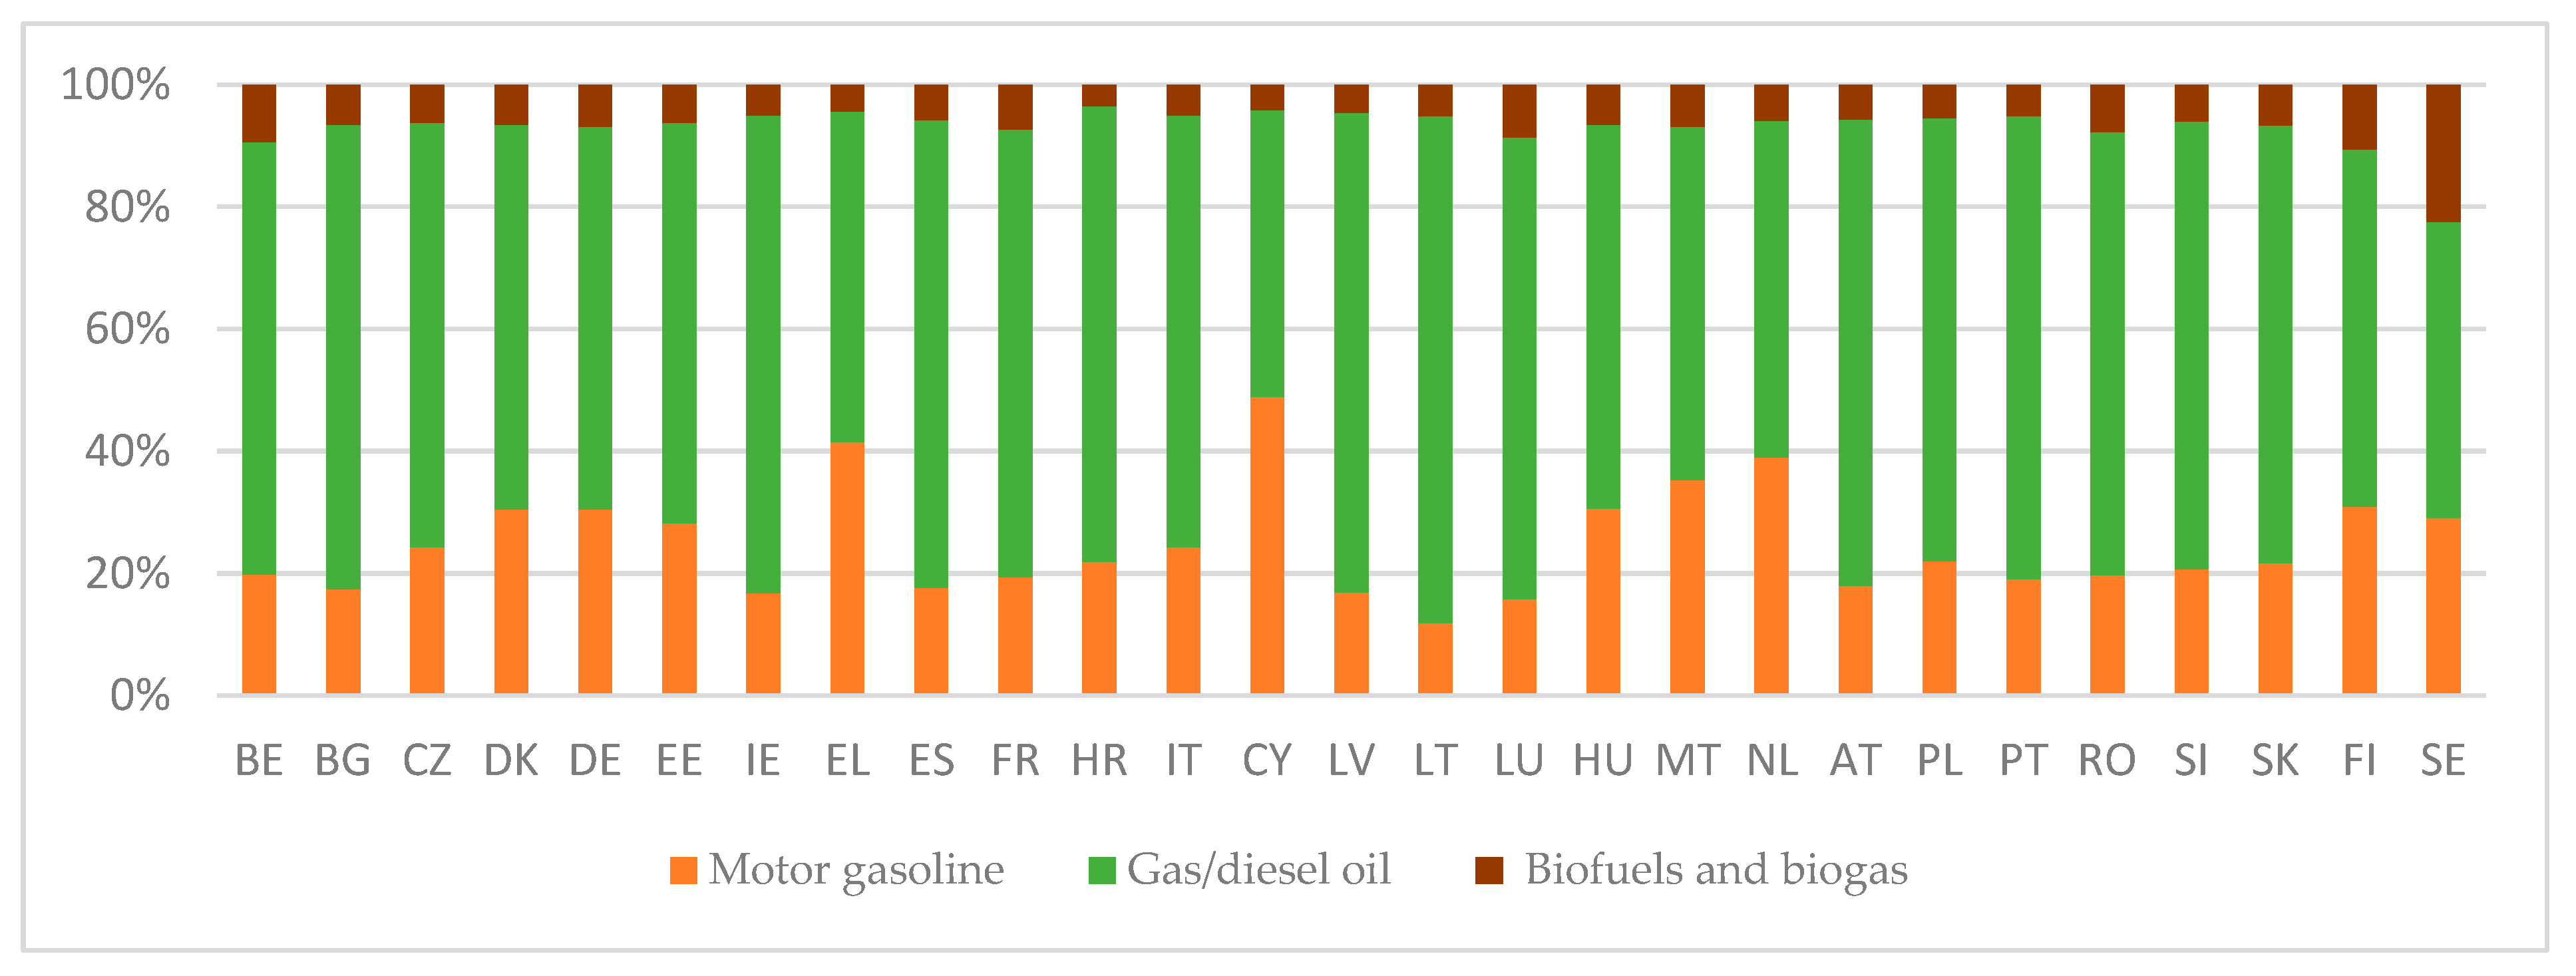
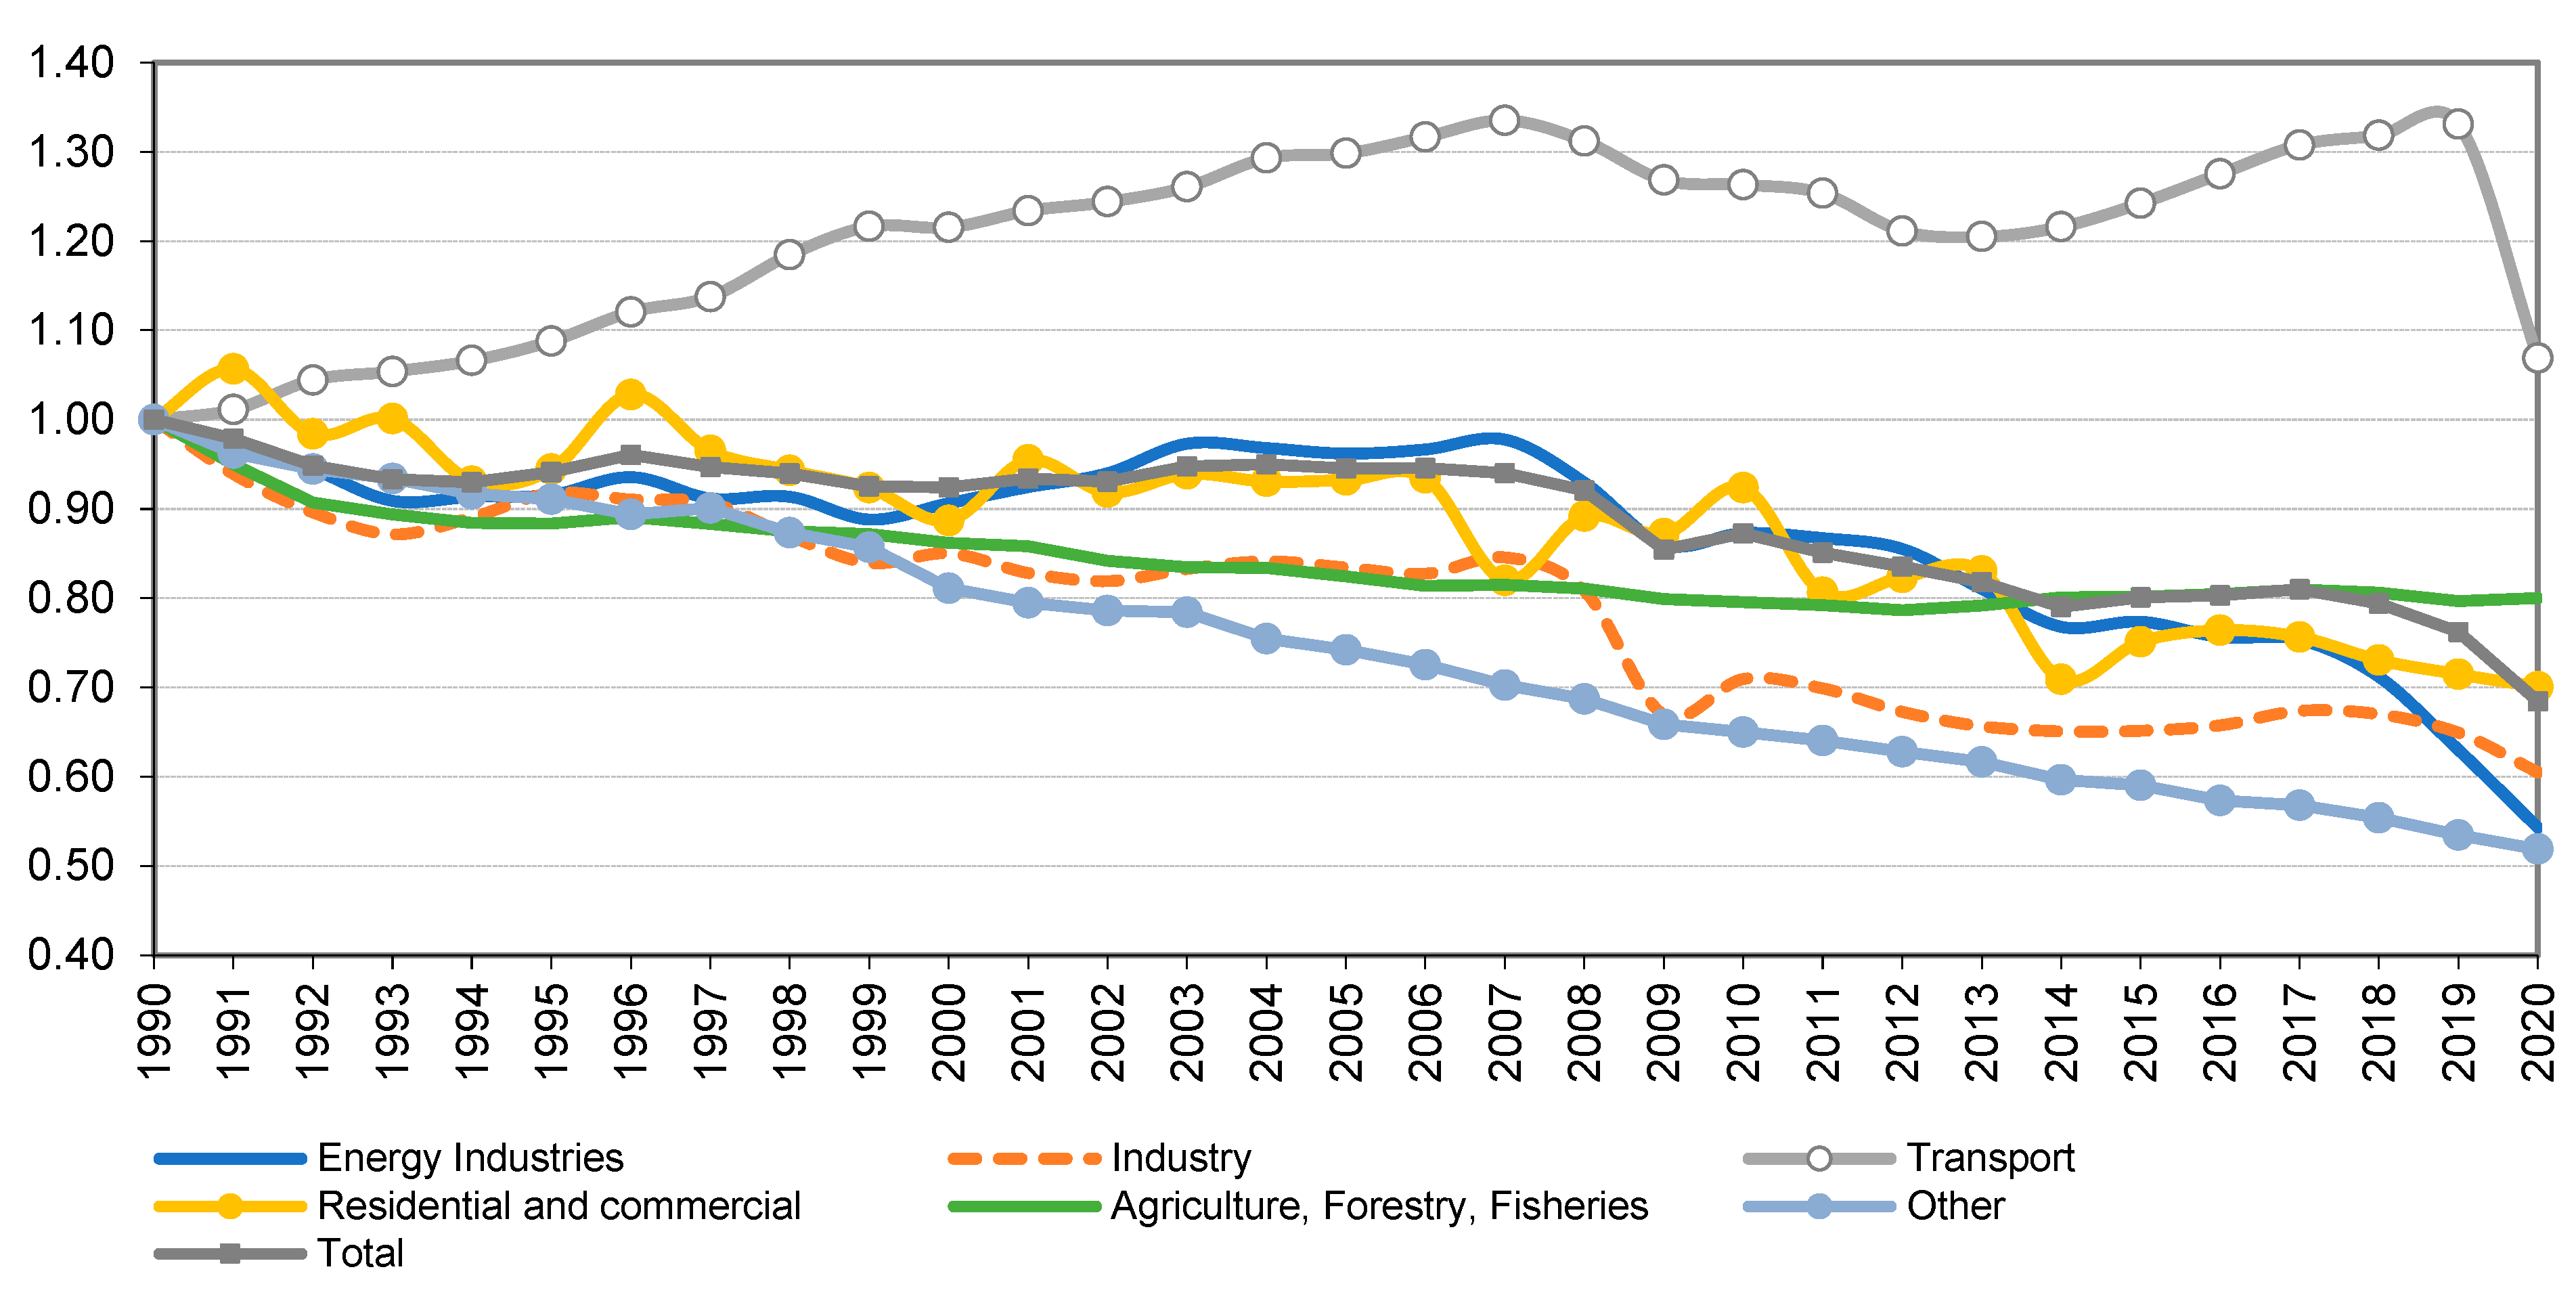
2.1. Energy Consumption and GHG Emissions by the Transport Sector in EU Countries

The structure of energy consumption in the European Union is shown in Figure 2. One-third of the energy consumed in the Union in 2020 was by transportation, which consists of road, rail, air and inland waterway transport. In second place, in terms of energy consumption, were households, which consumed 28% of the EU in 2020. The third-highest energy consumer is industry, with about 26% of consumption, followed by trade and services, which consumes 14%, and the agriculture and forestry sector, which consumes 3% of energy in the EU. It is worth noting that the share of each sector in EU energy consumption for 30 years is very close to each other (Figure 2 and Figure 3). The sector with the highest share of energy consumption increases between 1990 and 2020 is the transport sector. Total energy consumption in transportation increased by 14% between 1990 and 2020, while there was a downward trend in industry and agriculture. Energy consumption in 2020 in the transport sector in the EU was 252 Mtoe, driven by rapid global economic development, as well as increasing levels of motorization. Between 1995 and 2020, the number of passenger vehicles in the EU increased by 56%, from 160,500 to 250,000 and trucks by 75%, from 20,300 to 35,500 (Figure 4).
Transportation is the leading consumer of domestic energy in most EU countries. For example, in Luxembourg, the share of transportation in national energy consumption is 51%, Malta—41%, Cyprus and Lithuania—40%, Spain, Slovenia and Greece—36%, Bulgaria—34%, Portugal—33%, Lithuania—39.4%, Greece—39.2%, Portugal—36.6%, Ireland—32% and Austria, Croatia and Poland—31% (Figure 5).
In turn, considering the various modes of transport, road transport is the largest consumer of transport energy in the EU (Figure 6). The share of road transport in the total energy consumption attributable to this sector of the economy in the EU between 1990 and 2020 increased slightly to 95% in 2020. The second place in the structure of transport energy consumption in 2020 went to rail transport (2%).
Important to an economy’s efficiency is the amount of energy consumed by the various sectors and from which sources this used energy comes. The most significant energy source consumed in the European Union is petroleum products, mainly crude oil; its share in total consumption was 37.2% in 2019 for the whole EU. Coal (solid fossil fuels) is only 2% of the energy consumed in the EU. Directly used renewable energy sources account for about 10% of the energy consumed in the EU.
Gas oil, diesel oil and motor gasoline were the primary energy sources used in road transportation from 2010 to 2020. In 2020, these sources accounted for 69% and 24% of energy, respectively (Figure 7). Other sources of energy consumed in transportation were relatively marginal. However, it can be noted that the last decade has seen an increase in the use of renewable energy sources in road transportation in EU countries. This is related to the adopted transportation policy of reducing greenhouse gas emissions and promoting clean transportation. Compared to 2010, the use of renewable energy in road transportation nearly doubled in 2020, reaching 17 million tons of oil equivalent. When considering only renewable sources, the most commonly used fuels in road transport in the EU are blended biogasoline and blended biodiesels.
The EU has set a common target of 10% renewable energy (including liquid biofuels, hydrogen, biomethane, “green” energy, etc.) in the total energy consumption by the transport sector by 2020. Sweden and Finland have already reached the required aim and those countries are definite leaders in shares of fuels from renewable sources used in road transport. A relatively high share of fuels coming from renewable sources is also observed in France, Romania and the Netherlands. In turn, the lowest share of renewable energy sources used in road transport is recorded in Croatia and Cyprus, where it is below 3% (Figure 8).
From an environmental point of view, the vast consumption of fossil fuels causes significant carbon dioxide emissions (CO2), which consequently generates the greenhouse effect and causes natural hazards. In 2020, the transport sector, on par with energy industries, was the first largest source of CO2 emissions in the EU. It was responsible for 777.2 million tons of CO2 emissions, which accounted for almost a quarter of European GHG emissions (Figure 9). From 1990 to 2019, in the transport sector alone, GHG emissions increased by 33% (Figure 10). GHG emissions from transportation increased from 2014 to 2019, falling only in 2020 due to the COVID-19 pandemic and the restrictions imposed on various modes of transportation (from 967.6 in 2019 to 777.2 million tons of CO2 in 2020, that is, about 20%). Road freight transport in 2020 was responsible for 689.8 million tons of CO2 equivalent, accounting for 76.7% of total EU transport GHG emissions.
The energy and greenhouse gas efficiency indicators of the road freight transport sector in each EU country in 2010 and 2019 are shown in Table 1. The average energy consumption of the road freight transport sector in the EU in 2019 was 0.20 kg oe/tkm. The countries with the most efficient energy use in transportation are Lithuania, Poland, Latvia, Slovakia and Slovenia. It was noted that countries with high energy efficiency rates in the transport sector were also characterized by high GHG emission efficiency. Correlation analysis confirmed that there is a statistically significant correlation between energy productivity and emission efficiency of the road transport sector (Pearson correlation coefficient = 0.998). The average GHG emission of the road transport sector was 574 g of CO2 per tkm in 2019. Ireland, Austria, Luxembourg and Denmark fared much more poorly in this regard, with scores almost eight times higher than the leaders.
In contrast, the worst performer in terms of energy consumption as well as GHG emissions was Cyprus, where energy productivity, as well as GHG emissions, were more than 20 times higher than the ranking leaders. Thirteen countries (Lithuania, Romania, Slovenia, Latvia, Poland, Sweden, Croatia, Spain, Greece, United Kingdom, Ireland, Slovakia and Denmark) saw energy productivity improvements of between 1 and 46% between 2010 and 2019, and this translated into GHG emission reductions of between 3 and 46% in these countries. In addition, countries where the road freight sector has improved GHG emission efficiency can include Finland and Netherlands.
Since the transport sector, mainly freight, is a significant source of fossil fuel consumption and CO2 emitter in the EU and worldwide, this is becoming a focus of interest for researchers and policymakers. For the transport sector, renewable energy use, greenhouse gas emissions and energy efficiency targets are set for 2020, 2030 and 2050 [27].

2.2. Application of the DEA Method to Measure Transport Efficiency

Transportation efficiency is defined in various ways in the literature [28,29,30,31,32]. In this article, the efficiency of the transport sector will be defined as the efficiency of converting the inputs held by the transport sector into outputs [28]. Efficient transport sectors are those that generate a certain amount or more outputs while spending a given amount of inputs or using the same amount or fewer inputs to produce a given amount of outputs, as compared with other sectors in the test group [33].
There are numerous studies evaluating the effectiveness and efficiency of transportation. An essential element in assessing the efficiency of the transport sector is the selection of the right indicators. The problem of indicator measurement of efficiency and sustainability of transportation is challenging. Based on an analysis of the definition of sustainable transport development and the objectives and priorities of the European Union’s transport policy, it is possible to identify the key measuring features in a system of three spheres: social, economic and environmental. Given the above, one-dimensional indicators cannot comprehensively assess transportation efficiency [34,35]. For example, the energy efficiency indicators analyzed above, and the efficiency of GHG emissions in transportation analyze efficiency in one dimension. Both indicators should be combined and supplemented with social and economic indicators for a comprehensive analysis of the transport sector. However, using multiple indicators can yield divergent conclusions and make it difficult to clearly assess the efficiency of the transport sector. Data Envelopment Analysis (DEA) is commonly used in the literature for multivariate analysis of transportation efficiency.
The literature review identified the application of the DEA method in transportation in categories such as (1) rail transport (2) air transportation (3) ports and maritime transportation (4) road transportation— especially highways (5) public transportation (6) transport sector analysis (7) eco-efficiency, sustainability and green issues in transportation (Table 2).
Analyses in the field of rail transportation include such issues as the analysis of the efficiency of rail transportation companies, evaluation of the efficiency of rail transportation systems in terms of environmental factors, and the study of the impact of private sector participation, investment and management on the efficiency of rail transportation [25,33,39,45,49,51,57,61,64]. Air transportation research focuses on analyzing the efficiency of airports and airlines, the efficiency of airways, and the efficiency of passenger and cargo service [40,41,43,45,55,66].
Seaport and shipping efficiency publications based on the DEA method focus on the efficiency of container terminals and international seaports, the impact of private sector participation, management structure, new investments and port infrastructure on their efficiency [40,59,68,73].
In the DEA analysis of road transportation, the efficiency of highway operations, or the problem of road traffic accident management, is most often studied [25,33,36,37,38,40,44,47,48,53,54,62,65,67,69]. Analyses of environmental and energy consumption in highway transportation are also emerging. Safety in road transportation systems is another issue that is increasingly emerging in research from Vaziri [78], Egilmez and McAvoy [79] and Alper et al. [80]. The efficiency of road transport sectors, mainly in China and OECD countries, was also analyzed. Such analyses are lacking in a cross-section of EU countries.
In the field of public transportation, the DEA method has been used to evaluate the efficiency of urban transportation systems, particularly bus transportation and to compare the efficiency of different urban transportation systems [42,46,50,52,58,68,74,78].
Energy efficiency, environmental efficiency and transportation sustainability were also analyzed using DEA models. The research based on the DEA method and taking into account eco-efficiency have appeared in the last decade, when the issues of environmental effectiveness have become more important. The researchers primarily focused on analyzing the environmental performance of transportation systems in China, studied the problems of repairing and maintaining transportation systems with environmental factors in mind, analyzed transportation energy efficiency and identified weaknesses and identified potential solutions to improve eco-efficiency [22,23,56,60,63,67,69,70,71,72].
DEA analyses conducted for the transport sector can be divided into two types: analysis with or without considering undesirable outputs. The first type refers to estimating transportation efficiency without considering undesirable outcomes, an approach used in research by Boame [81], Barros and Peypoch [82], Chiu et al. [83], Kerstens [84], Karlaftis [85] and Yu and Lin [86]. The second type of analysis evaluates the efficiency of the transportation system by considering undesirable outputs. Undesirable results reflect negative environmental impacts, e.g., exhaust emissions such as CO2 and nitrogen oxide (NOx).
McMullen and Noh [87] analyzed the performance of 43 US bus transportation agencies by accounting for hazardous emissions. Wei et al. [88] used a super-efficient DEA method to measure the performance of urban transportation systems in 34 cities in China, taking NO2 levels and noise levels as environmental indicators. Çipil [56] used the DEA method to compare transportation systems in Turkey to transportation systems in EU countries in terms of GHG emissions. He confirmed that using renewable energies could increase the efficiency of transportation systems in Turkey. Chang et al. [72] studied the efficiency of ports operating in the European Union and North America. Their study examines whether Emission Control Areas regulations impact the eco-efficiency of ports. Baran and Górecka [33] analyzed the efficiency of inland transportation in old and new European Union countries and compared DEA results with CO2 emissions from road and rail transport.
Chang et al. [22] and Song et al. [67] used DEA models to evaluate the efficiency of the transport sector in Chinese provinces. As part of the variables, they included CO2 emissions linked to energy consumption by transport sectors. The results confirmed that highway transportation systems in China are inefficient in terms of energy consumption and other environmental considerations.
Lin [89] applied the DEA method to analyze the energy efficiency of rail, road, air and water transportation. The author also used a DEA model to forecast future energy consumption in China’s transport sector. Li et al. [24] used a super-SBM DEA model to evaluate the efficiency of regional transportation in China with CO2 emissions from 1995 to 2012. Wu [69] used DEA to assess regional highway China’s transportation networks’ energy and environmental performance systems. Song, Hao and Zhu [23] studied the environmental efficiency of the transportation sector in 30 Chinese provinces between 2003 and 2012. They used an undesirable-output-oriented SBM-DEA model to indicate the potential for decreasing CO2 emissions and energy saving. Moreover, Wu et al. [70] applied the DEA method to measure the energy and environmental efficiency of transportation sector in 30 China’s regions with the goal of sustainable development. They compared passenger transportation and freight transport subsystems. According to the authors’ study, the eco-efficiency of passenger and freight transport subsystems are different. China’s regional transportation sectors were also analyzed by Wang and He [71]. The authors investigated productivity, economic efficiency, environmental efficiency and marginal abatement cost. The changes in total factor carbon emissions performance within the transportation sector in China were also studied by Zhang et al. [60].
Stefaniec et al. [90], based on the DEA method, analyzed inland transportation in China, taking into account the social, economic and environmental elements of sustainability. Castelo Gouveia and Clímaco [91] analyzed fuel taxation policies to overcome GHG emissions problems in on-road highway transportation systems. Rogers and Weber [92] estimated the CO2 emissions and fatalities in road transportation systems in 50 US states. Subsequently, Leal et al. [54] expanded on their work by considering various environmental factors as inputs and outputs for prioritization in different bioethanol highway transportation modes. The results support the Brazilian government in improving the highway transportation system.
Most of the studies we analyzed used the DEA method for the efficiency analysis of local transportation systems, especially in China. There is a research gap in terms of international analyses that detect disparities between countries in transportation eco-efficiency. According to Table 2, CCR (Charles, Cooper & Rhodes), BCC (Banker, Charles & Cooper) and SBM (Slacks-Based Measure) are the most popular models used in the literature.

3. Materials and Methods

Eco-efficiency is a complex economic issue. Thus, to evaluate the eco-efficiency of transportation, it is worth using an integrated approach based on various methods that complement each other and make it possible to formulate reliable conclusions. In this article, both simple, one-dimensional indicators (energy and environmental indicators), as well as a non-parametric, multidimensional Data Envelopment Analysis method, were used to study the eco-efficiency of the road freight transport sector in the EU.

3.1. Data Collection

The source material for the empirical research was data published in the databases of Eurostat, the European Environment Agency and Statistical Pocketbook (2021) [93] on the road freight transport sector in individual EU member states. The time scope of the study was dictated by the availability of data—the most current and complete data for all EU countries covered 2019. The subjects for the study were selected in a purposive manner. The research sample comprised 27 road freight transport sectors from each European Union country. Malta was not included within the analyzed countries, as data on the transport sector for that country was incomplete. It is worth noting that the share of road transport work in Malta in the total EU transport work is 0.016%, so it is a country of negligible importance for EU transport.
The authors of the article applied acronyms for individual countries: Austria (AT), Belgium (BE), Bulgaria (BG), Croatia (HR), Cyprus (CY), the Czech Republic (CZ), Denmark (DK), Estonia (EE), Finland (FI), France (FR), Germany (DE), Greece (EL), Hungary (HU), Ireland (IE), Italy (IT), Latvia (LV), Lithuania (LT), Luxemburg (LU), the Netherlands (NL), Poland (PL), Portugal (PT), Romania (RO), Slovakia (SK), Slovenia (SI), Spain (ES), Sweden (SE) and the United Kingdom (UK).
The advantage of the DEA method is the assumption that the variables adopted for the models need not be expressed in the same units. Four factors were selected as the inputs and three factors as the outputs (Table 3). The basic principles of economics suggest land, labor and capital as the three main inputs. The number of employees in the road freight transport sector was used as a labor factor. Each country’s road freight transport sector energy consumption was taken as the land equivalent. Since capital data was unavailable then, based on the literature, the following were additionally included as inputs: registered trucks and the length of the road network in each country. The variables taken as effects were divided into desirable and undesirable. Desirable outputs were taken as sector revenues and freight work performed in tonne-kilometer. In contrast, GHG emissions expressed in CO2 equivalents were treated as undesirable outputs.

3.2. Data Envelopment Analysis (DEA)

The Data Envelopment Analysis (DEA) method was used to measure transportation eco-efficiency. The DEA method is a non-parametric efficiency analysis that can be used to assess the relative efficiency of entities. The objects of analysis are termed Decision Making Units (DMUs). In this research, the DMUs will be the road freight transport sectors in EU countries. The DEA models may be categorized based on two criteria: model orientation and type of returns to scale. Depending on the model orientation, a calculation of efficiency is focused on the input minimization (input-oriented model) or the output maximization (output-oriented model) [94]. However, taking into account the type of returns to scale, the following models are highlighted: the CCR model (proposed by Charnes, Cooper and Rhodes [95]) provides for constant returns to scale, and the BCC model provides for a variable return to scale (the name also derives from the authors of the model: Banker, Charnes and Cooper [96]).
Charnes, Cooper and Rhodes [95] introduced a measure of efficiency for each DMU that is obtained as the maximum ratio of weighted outputs (s) to weighted inputs (m).
The DEA model can be calculated in the following manner [97]:
m a x r = 1 s u r y r j i = 1 m ν i x i j
r = 1 s u r y r j i = 1 m ν i x i j 1 ,   u r , v i 0
where s represents the number of outputs, m represents the quantity of inputs, ur represents the weights denoting the significance of respective outputs, νi represents the weights denoting the significance of respective outputs, yrj represents the amount of output of r-th type (r = 1,…, R) in j-th object, xij represents the number of inputs of i-th type (n = 1,…, N) in j-th object, (j = 1,…,J).
In the DEA model m of the inputs and s of the diverse outputs come down to single figures of “synthetic” input and “synthetic” output, which are subsequently used for calculating the object efficiency index. The quotient of synthetic output and synthetic input is an objective function, which is solved in linear programming. DMUs are efficient if their efficiency index equals 1, which means that in the model focused on input minimization, there is not any other more favorable combination of inputs allowing objects to achieve the same outputs [94,98]. However, if they are inefficient, their efficiency index is below 1. The efficiency of the object is measured against other objects from the focus group and is assigned values from the range (0, 1). Efficient DMUs are members of the reference set and they are the benchmark for inefficient DMUs. The reference set is the set of efficient road freight transport sectors to which the inefficient sector has been most directly compared when calculating its efficiency rating.
The use of the DEA method has many advantages, such as its ability to accommodate a multiplicity of inputs and outputs, it does not require an assumption that a function relates inputs to outputs; inputs and outputs can have very different units. However, DEA also has some limitations: it is a deterministic rather than statistical technique and produces results that are particularly sensitive to measurement error. It only measures efficiency relative to best practices within a particular sample, so comparisons of scores between different studies are not meaningful. Being nonparametric, it is difficult to apply it to test statistical hypotheses, which is the focus of ongoing research

3.3. Slacks-Based Measure (SBM) DEA Model

A traditional DEA model does not consider undesirable outputs such as air pollution. The undesirable output model was proposed by Cooper et al. [97]. This model deals with the same problem by applying a slacks-based measure of efficiency (SBM) in Tone [99]. The SBM DEA is non-radial and non-oriented model that uses input and output slacks to measure efficiency directly. The undesirable outputs SBM DEA model has two variants, including the Bad-Output and Non-Separable models. This research used the Bad-Output model. The Bad-Output model deals with good (desirable) and bad (undesirable) outputs independently. There is no connection between undesirable and desirable outputs.
There are n Decision-Making Units (DMUs) in the SBM DEA model and each has three factors: inputs, good (desirable) outputs, and bad (undesirable) outputs. The three factors are represented by the three vectors X     R m ,   Y g   R s 1 ,   Y b   R s 2 , respectively. We define the matrices X, Y g and Y b as follows. X = [ x 1 ,   , x n   ]   R m   ×   n ,   Y g = [ y 1 g ,   , y n g ]   R s 1   ×   n ,   and   Y b = [ y 1 b ,   , y n b ]   R s 2   ×   n . We assume X > 0, Y g > 0 and Y b > 0.
A DMU can be represented as ( x 0 , y 0 g , y 0 b ) and evaluated by two kinds of output (desirable and undesirable), where y 0 g denotes the desirable output and y 0 b denotes the undesirable output. The production possibility set (P) is defined by [98]:
P = { ( x ,   y g , y b ) | x X λ ,   y g     Y g   λ ,   y b Y b λ ,   L   e λ   U ,   λ   0   | }
where λ is the intensity vector and L and U are the lower and upper bounds of the intensity vector, respectively. The efficiency DMU in this frame is defined as follows. A DMU0  ( x 0 , y 0 g , y 0 b ) is efficient if there is no vector ( x 0 , y 0 g , y 0 b )   P such that x 0 x ,   y 0 g y g ,   y 0 b y b with at least one strict inequality. According to the SBM proposed by Tone [100,101] the objective of the model was modified as follows.
[ SBM Undesirable ] ρ *   = min 1 1 m i = 1 m s i 0 x i 0 1 + 1 s ( r = 1 s 1 s r g y r 0 g + r = 1 s 2 s r b y r 0 b   )
subject to x 0 = X λ + S ; y 0 g = Y λ S g ; y 0 b = Y λ + S b ; L e λ U ; S , S g ,   S b ,   λ   0 .
The vectors S and S b correspond to excesses in inputs and undesirable outputs, and S g represents the shortage in good outputs. The DMU0 is efficient with consideration of undesirable output if and only if ρ *   = 1 , i.e., S * = 0 ,   S b * = 0 and S g * = 0 . If the DMU0 is inefficient, i.e., ρ *   < 1 , it can be improved and become efficient by deleting the excesses in inputs and bad outputs and augmenting the shortfalls in good outputs by the following projection [97]:
x 0     ^ x 0   S * y 0 g   ^ y 0 g + S g * y 0 b   ^ y 0 b S b *
At the same time, because the model is a nonlinear programming model, it can be transformed into a linear programming model according to the Charnes–Cooper conversion method. For calculating the DEA method, DEA ProSolver 14 was used.

3.4. Energy and Environmental Indicators

Indicators were used to evaluate energy productivity and GHG emission in the road freight transport sector. Energy consumption was calculated as:
Energy consumption = E/TKM
where: E–energy consumption in road freight transport sector (kg oil equivalent). TKM–freight work in road transport sector (tkm).
The GHG emission efficiency of road freight transport was calculated based on GHG emissions (in CO2 equivalent grams) per tonne-kilometers of freight transport.
GHG emission = GHG/TKM
where: GHG–greenhouse gas emissions by road freight transport sector (g CO2 equivalent). TKM–freight work in the road transport sector (tkm).

4. Results and Discussion

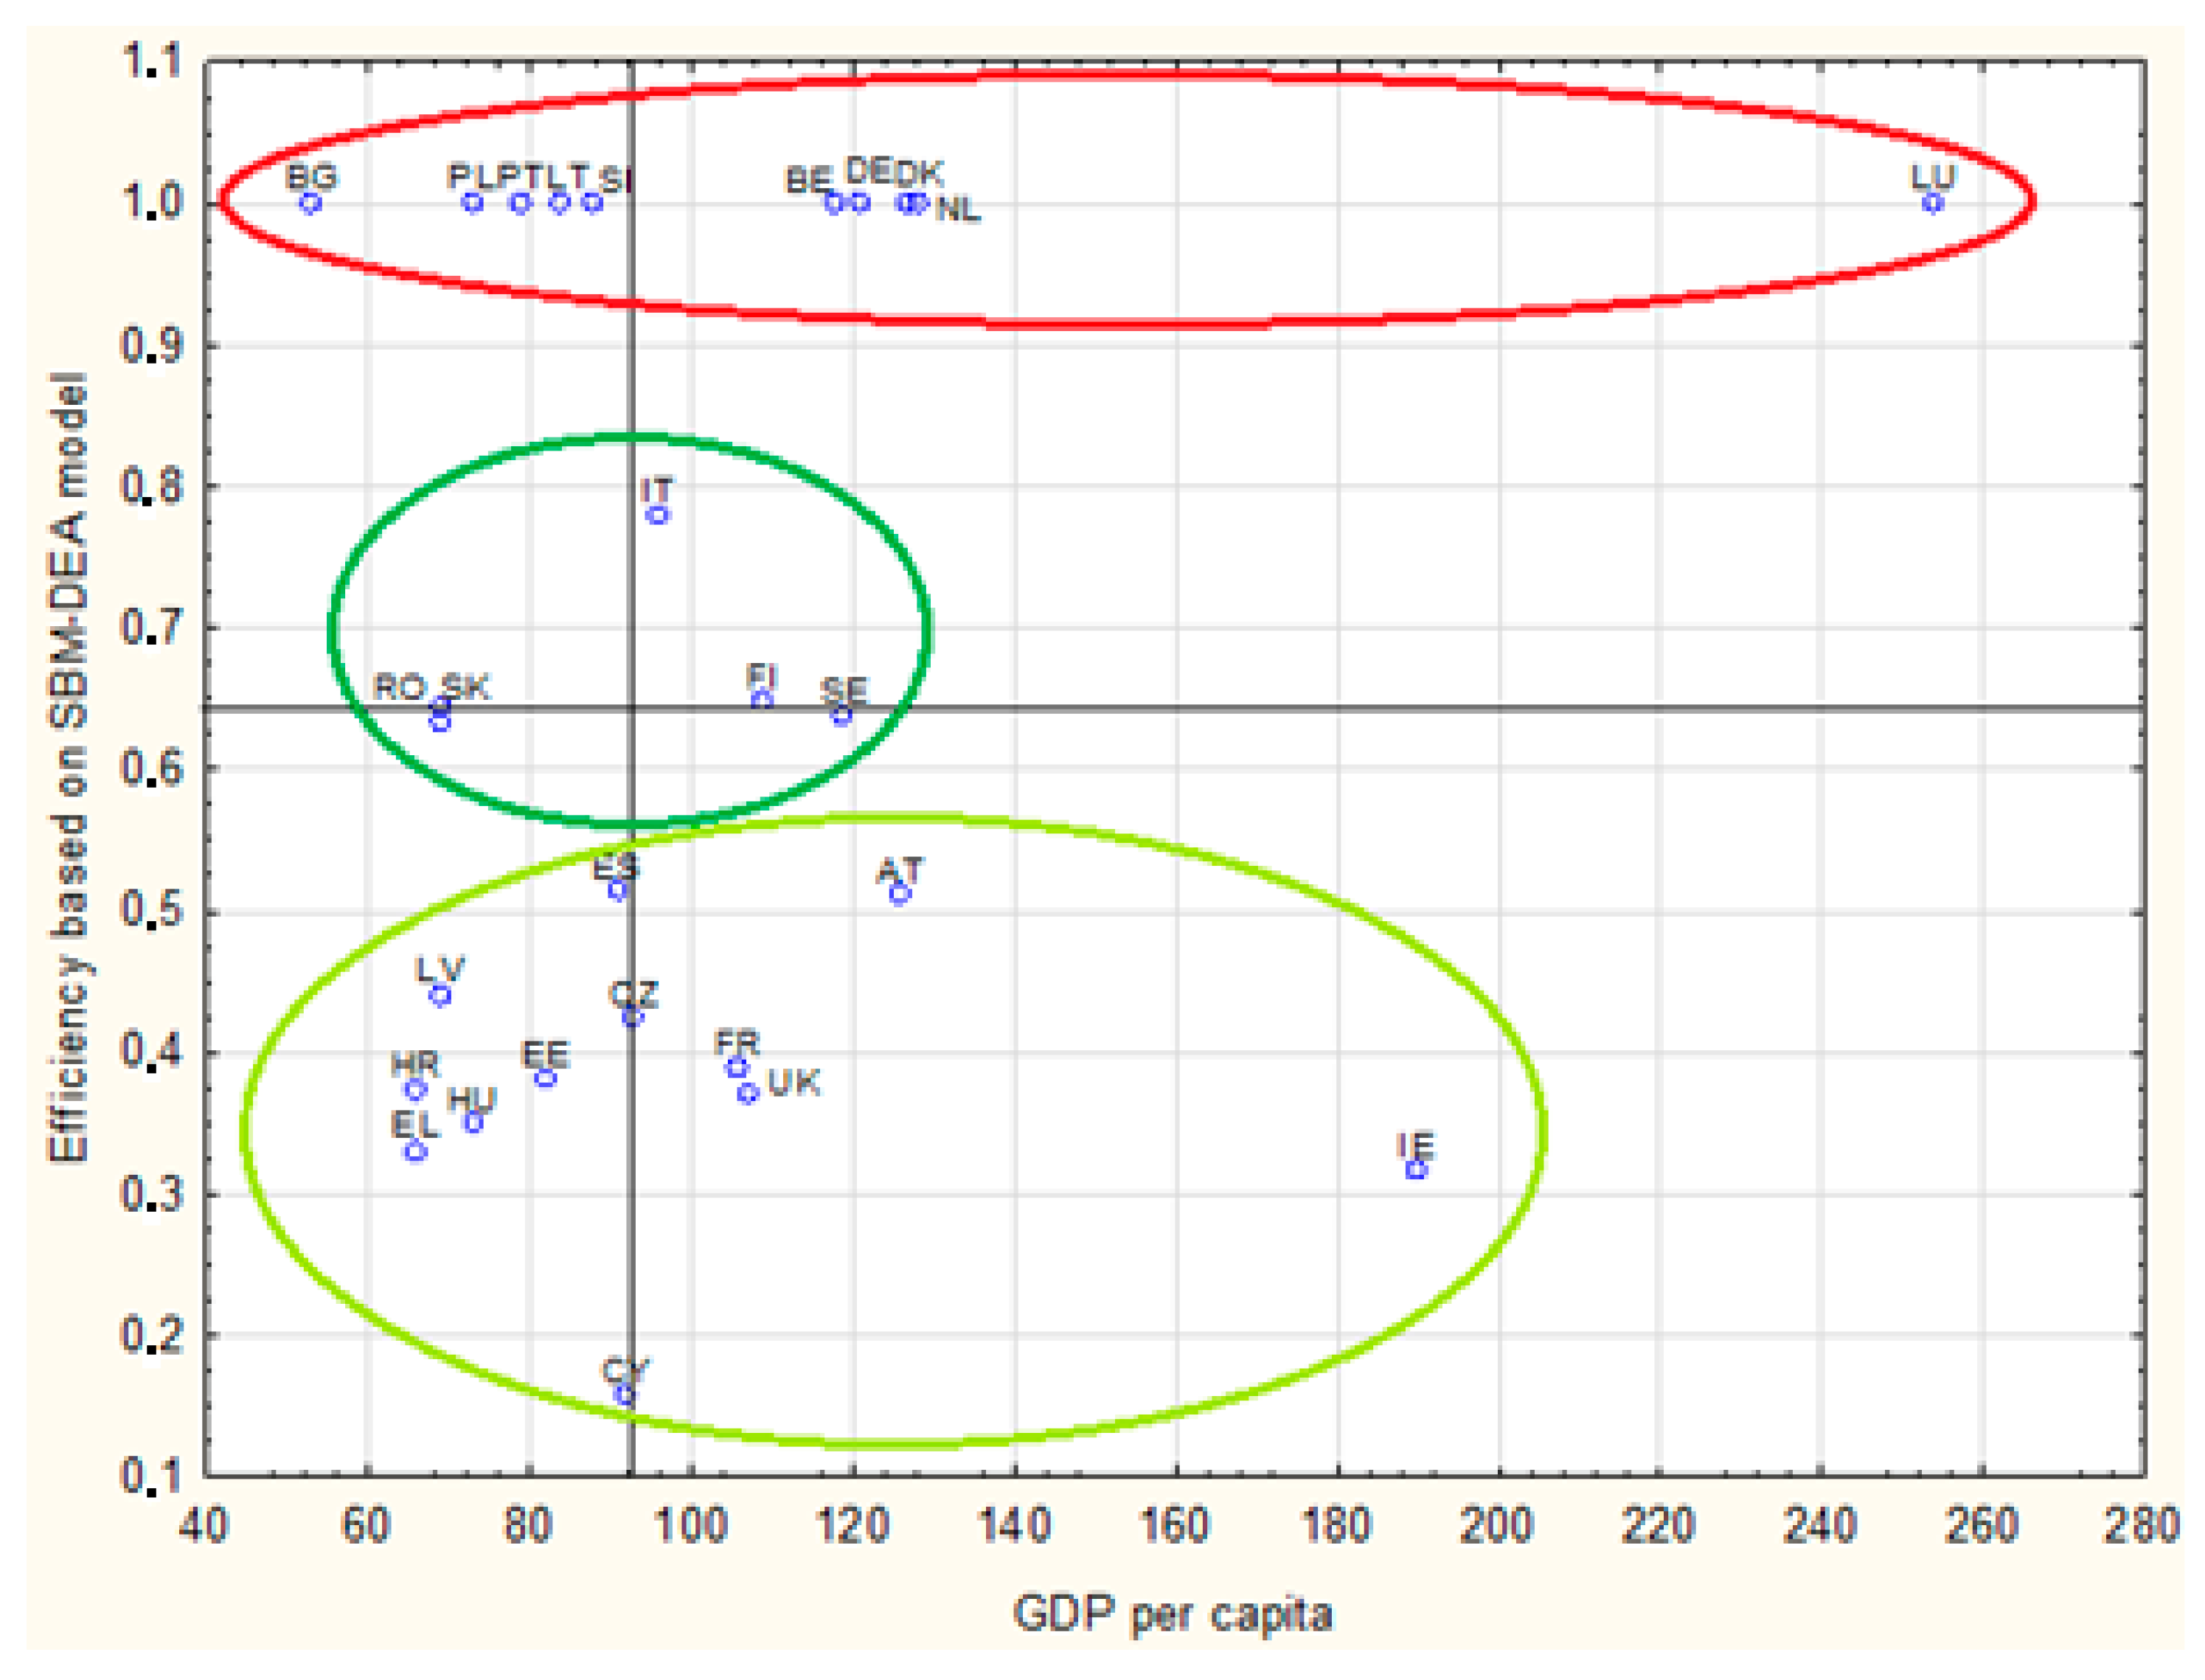
4.1. Efficiency of Road Freight Transport Sector in EU Counties

The results of eco-efficiency for the road freight transport sector, calculated using both the DEA-CCR model and the undesirable outputs SBM-DEA model, are shown in Figure 11. The average value of eco-efficiency generated by the DEA-CCR model for the 27 EU countries was 0.98, while the average value from the SBM-DEA model was only 0.66. The results show that GHG emissions have led to a greater loss of efficiency, which implies that any transportation efficiency evaluation is meaningless if environmental factors are not considered. The undesirable outputs SBM-DEA model can avoid the angular and radial defects of the traditional DEA. The SBM-DEA model results can be more accurate. Therefore, the undesirable outputs SBM-DEA model was chosen for further analysis.
The results obtained according to the assumptions of this model will identify efficient road freight transport sectors in the EU and analyze and diagnose inefficient sectors, indicating how much they need to increase or decrease their effects and inputs to become economically, energetically and environmentally efficient. The ranking of road freight sectors according to the SBM-DEA model is shown in Figure 12. The efficiency of the road freight transport sectors studied ranged from 0.15 to 1. The average efficiency of the sample was 0.66 and the median was 0.63. The results show that the road freight sectors in 10 EU countries were considered efficient: Denmark, Germany, Belgium, Lithuania, Luxembourg, the Netherlands, Poland, Portugal, Slovenia and Bulgaria. Their performance indicators reached values equal to 1. Thus, more than a third of EU countries have efficient road freight sectors that efficiently utilize their inputs (employees, road network, energy, trucks) and convert them into appropriate results.
Road freight sectors for which efficiency indicators were less than 1 were considered inefficient. The transport sectors from Cyprus, Ireland, Hungary and Greece had the lowest efficiency. It should be noted that these are some of the smaller EU countries in terms of area and population, which means that the needs for freight transport are also more minor and thus, the generated effects of revenue and freight work are also at a lower level.
The analyses indicate that the economic–energy–environmental efficiency of road freight transport in EU countries varies. Varying levels of road transport freight transport eco-efficiency suggested that it may be linked to economic development in EU countries. The road freight transport sectors studied were classified into three groups (Figure 13):
  • Eco-efficiency leaders—A group of countries in which the road freight sector was considered efficient (the efficiency index was equal to 1)—Slovenia, Belgium, Bulgaria, Portugal, Denmark, Germany, Poland, Netherlands, Luxembourg and Lithuania. This group includes both countries with a higher than the median level of GDP per capita and a lower level of economic development.
  • Eco-efficiency followers—Countries distinguished by higher than the EU median eco-efficiency of road freight transport (Italy, Finland, Sweden, Slovakia and Romania). In the case of Romania and Slovakia, the lower eco-efficiency of transport may be due to slower economic development.
  • Eco-efficiency slackers—a group of countries with less than the EU median value of economic–energy–environmental efficiency of road freight transport (Spain, Austria, Latvia, Czechia, France, Estonia, Croatia, United Kingdom, Hungary, Greece, Ireland and Cyprus). Moreover, countries such as Ireland, Austria, the United Kingdom and France, despite their advanced economic development, do not consider the environmental efficiency of road transport.
The next stage of the study determined how inefficient sectors (eco-efficiency followers and eco-efficiency slackers) should increase their effects (revenues and/or freight work) or reduce input consumption and GHG emissions to be considered economically, energetically and environmentally efficient. For this purpose, efficiency benchmarks were identified following the idea of benchmarking for countries characterized by an inefficient transport sector (Table 4). Then, based on benchmarks for inefficient countries, corresponding changes in inputs and outputs were proposed (Table 5 and Table 6). It is worth noting that the benchmarks (reference set) were transport sectors from Lithuania, Luxembourg, the Netherlands, Portugal and Slovenia. For example, for the road transport sector in Austria, the benchmark was the transport sector from the Netherlands (Table 4).

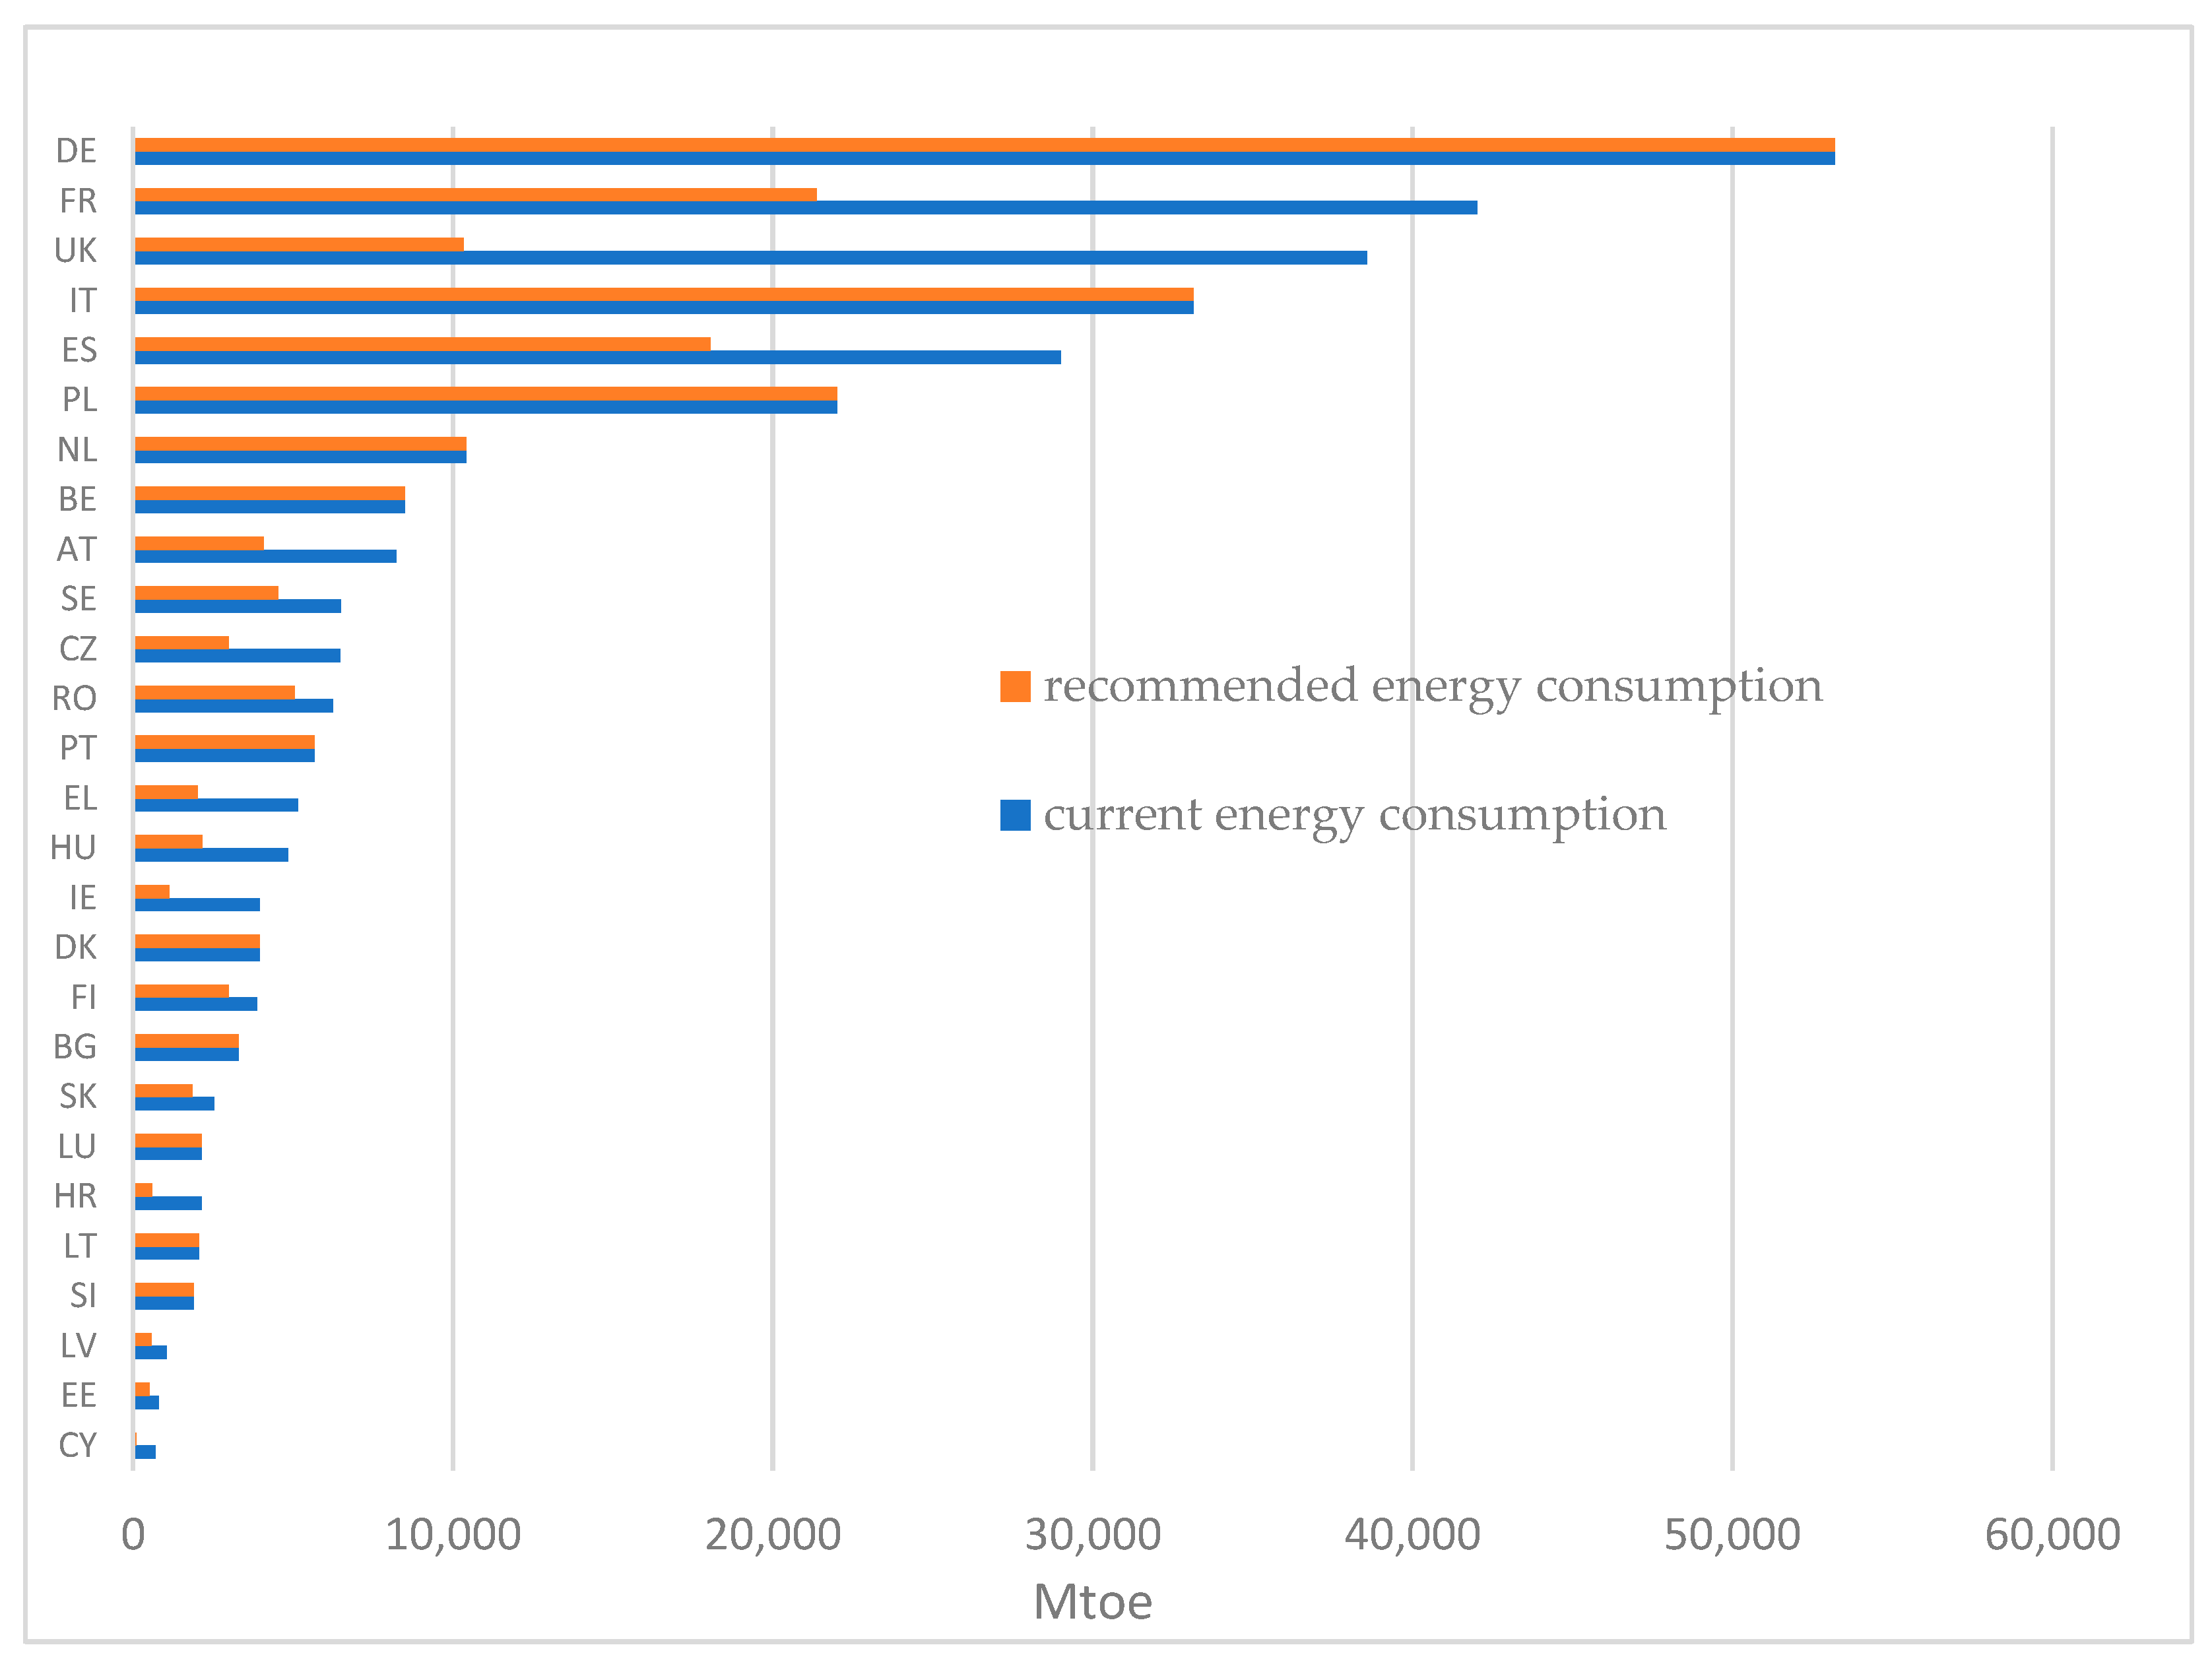
4.2. Potential Energy Saving in the Road Freight Transportation Sector in the EU

Energy consumption by road freight transport is distributed according to the Pareto principle. 6 countries consume 70% of all energy consumed by road freight transport in the EU. Among these countries, we can include Germany, France, the United Kingdom, Italy, Spain and Poland.
According to the DEA method, inefficient DMUs can become efficient and achieve the required level of eco-efficiency if they reduce their inputs. Figure 14 and Figure 15 show the potential energy savings that should be made in the road transport sectors in various EU countries. In four countries (Cyprus, the United Kingdom, Croatia and Ireland), the potential savings in energy consumption should be more than 70%. Romania had the lowest energy-saving potential of all inefficient countries. It is worth noting that the countries that should make the most significant changes in energy consumption are not the energy consumption leaders. This is the essence of efficiency; according to DEA, it is about using inputs (including energy) as efficiently as possible to produce specific results. In the study group of 27 countries, a 27% reduction in energy consumption from 308,395 Mtoe to 224,666 Mtoe should occur.

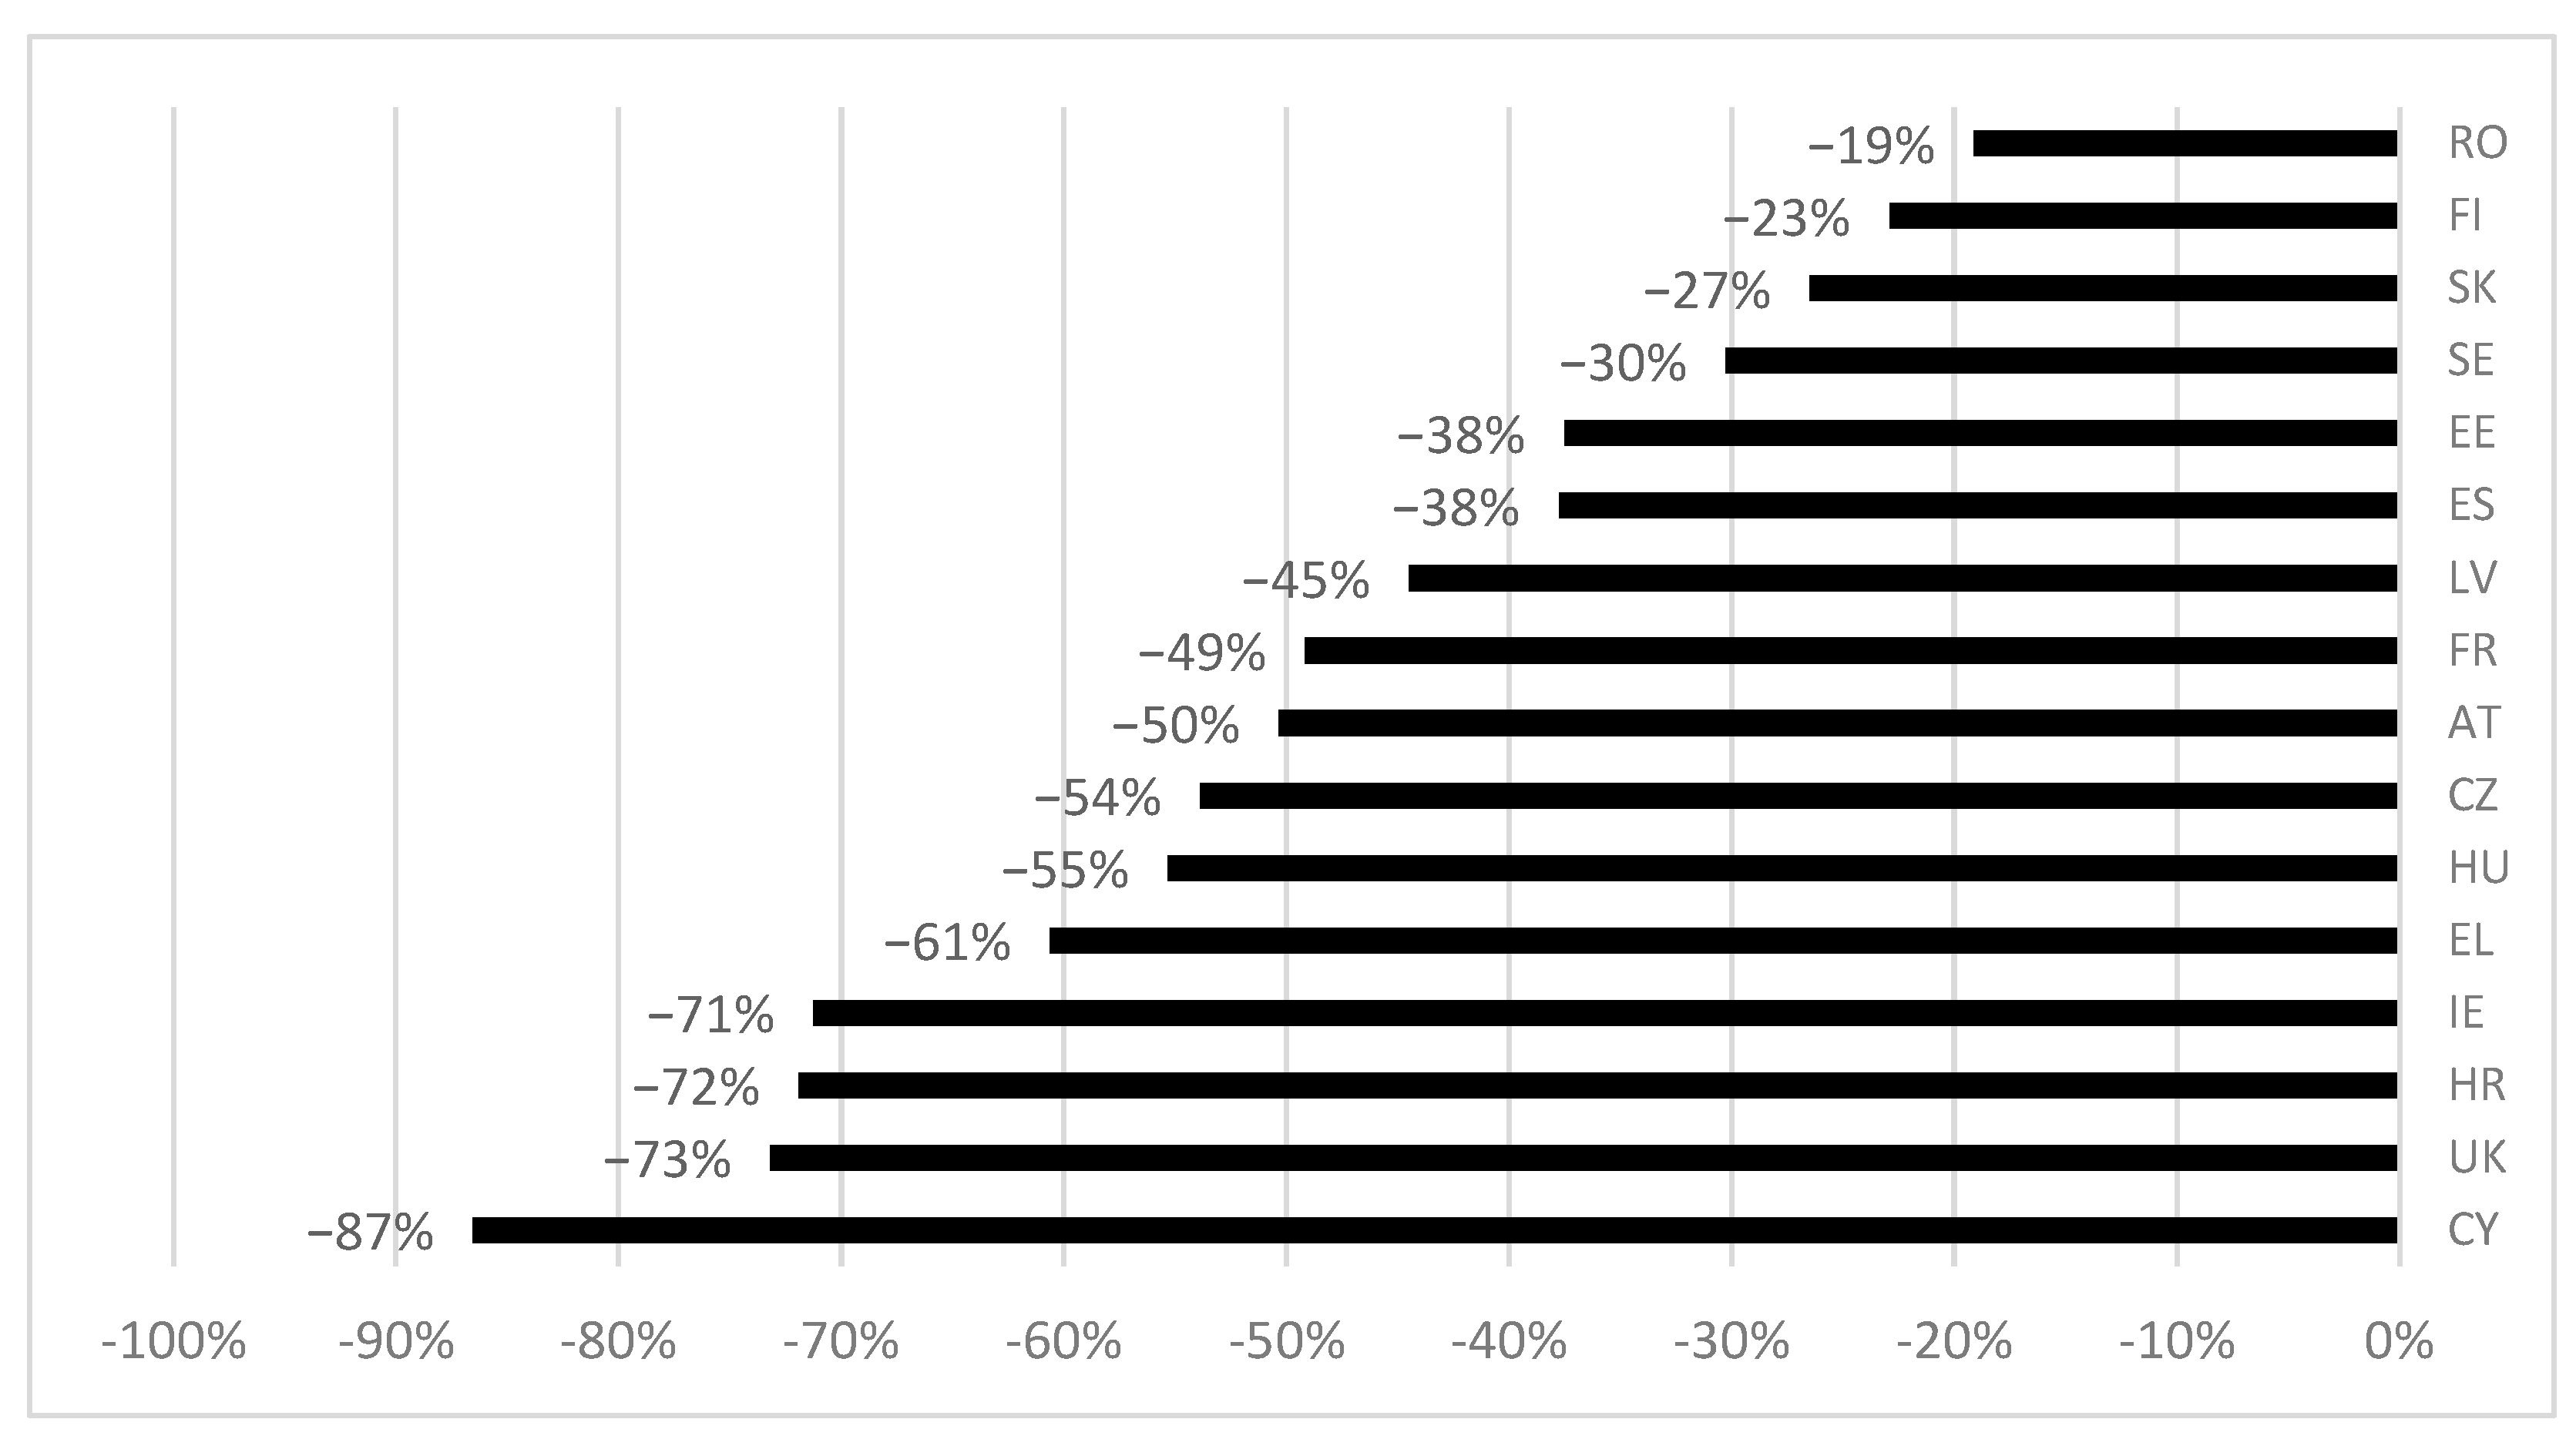
4.3. Analysis of the Potential for Decreasing CO2 Emissions in Road Freight Transportation Sector in the EU

The results of the study show quite a wide variation in the eco-efficiency of the road freight sector across EU countries. Table 5 indicates the potential changes in terms of generated results that should occur in each country for the transport sectors to improve their eco-efficiency. The ten road freight transport sectors deemed efficient do not need to change their performance levels. The countries with the lowest efficiency in the road freight sector are Cyprus, Ireland, Hungary and Greece. According to calculations, GHG emissions from the transport sectors in these countries are expected to decrease the most by 61 to 87%. In contrast, minor changes of 2% in GHG emissions are proposed for Italy. The entire group of 27 countries studied should see a 27% reduction in GHG emissions from 902.5 to 659.2 million tons of CO2 equivalent.
In addition, for inefficient transport sectors to be considered fully efficient compared to other countries, they should also increase the revenue generated and freight work performed (Table 6). The most significant changes in revenue are expected to be in the transport sectors from Greece, Latvia and Slovakia. In contrast, more freight work should be done in the Czech Republic, Estonia, Italy, Sweden and Austria.
Some potential proposals for change may be difficult to apply in practice. Nonetheless, the results of the study indicate that there is quite a variation in the efficiency of the road freight sector across EU countries and a lot of room for reducing GHG emissions from the road freight sector. The results justify the EU’s policy push towards more environmentally friendly transportation measures. The results of the study, deepened by additional analysis, may be of interest to policymakers shaping EU transport policy to indicate which sectors require exceptional support for sustainable and green development.

4.4. Discussion

Most of the existing studies in the literature focus on analyzing the efficiency of different transportation modes but mainly at the level of a single country. Many researchers analyze the eco-efficiency of transportation systems in China, but there are few analyzes in the field of transport in Europe. The study conducted in this article compared the eco-efficiency of the road freight transport sector in 27 EU countries and filled a research gap. The average efficiency level of the road freight transport sector in the EU countries based on the SBM-DEA model was 0.66. Still, the efficiency varies quite a bit between countries. The study found that 10 countries (Denmark, Germany, Belgium, Lithuania, Luxembourg, the Netherlands, Poland, Portugal, Slovenia and Bulgaria) are on the efficiency frontier and should therefore serve as benchmarks (models for improving eco-efficiency in the transport sector) for other countries. Furthermore, specific measures to improve transportation eco-efficiency should be comprehended in the 12 countries (Spain, Austria, Latvia, Czechia, France, Estonia, Croatia, United Kingdom, Hungary, Greece, Ireland and Cyprus) that have been recognized as eco-efficiency slackers.
It is difficult to reliably compare the results of studies by other authors because they relate to a different period, a different research sample and concern the entire road transport sector. The obtained results were similar to the studies by Djordjević and Krmac [101]. Authors using the DEA method evaluated the transport energy and environmental efficiency in EU countries in the years 2006–2012. The best value of efficiency was for Lithuania, Luxemburg, Slovakia and Slovenia. The transport sector from Cyprus had the lowest efficiency. Wang et al. [102] focused on measuring the environmental efficiency of land transportation in OECD countries in the period of 2015–2019. In this research, Switzerland, France, Spain, Italy, Lithuania, Poland, Sweden, The Netherlands, Australia, Japan, Korea and the USA were the countries with the best efficiency score. On the other hand, Shen, Bao and Hermans [103] studied road transport sustainability in the 28 EU countries. Among these analyzed countries, Sweden was the best-performing country. In contrast, countries like Cyprus and Croatia perform relatively poorly from both the desirable and undesirable perspectives.
Studies have confirmed the correlation between the economic development of EU countries as measured by GDP per capita and higher energy consumption and GHG emissions from the road freight transport sector (Table 7). Pearson’s correlation coefficient was respectively: 0.31 and 0.28. The study also confirmed the positive relationship between the economic development of EU countries and the level of eco-efficiency of the road freight transport sector. The correlation was positive but at a reasonably low level (r = 0.27).
The link between the eco-efficiency of the road freight transport sector and the country’s economic development has also been confirmed in studies by other authors. However, these studies usually focused on a single country or countries outside the EU, such as OECD countries. Secondly, these studies relied on one-dimensional indicators, i.e., they analyzed the relationship between economic growth, freight transport and energy consumption Nasreen et al. [104] analyzed the relationship between economic growth, freight transport and energy consumption. The authors divided 63 developing countries into three groups (1) lower-middle, (2) upper-middle and (3) high-income countries. The results indicated the relationship between economic growth and freight transport for all groups. Also, the results confirmed the relationship between energy consumption and economic growth in high- and upper-middle-income countries. Ibrahiem [105] studied the relationships between energy consumption by road transportation, economic growth, urbanization and population growth in Egypt. The results showed the existence of a long-run and short-run relationship between the variables. Liddle and Lung [106] used the Granger-causality analyzed direction and sign of long-run causality between transport energy consumption per capita and real GDP per capita. Relationships between transportation rail and road infrastructure, energy consumption and CO2 emissions in transport in Tunisia were analyzed by Achour and Belloumi [107]. This study’s findings showed unidirectional short-run causality running from road transport-related energy consumption to transport CO2 emissions. On the other hand, Gherghina et al. [108] confirmed that CO2 emissions from all modes of transport, alongside other specific air pollutants, negatively influence gross domestic product per capita.
Compared to other sectors, transportation is the leading domestic energy consumer in most EU countries and is also the only sector where greenhouse gas emissions have increased by 33% over the past three decades. In 2020, road transport accounted for about one-fifth of the EU’s GHG emissions. The EU’s policy aims to reverse the growing energy consumption of Europe’s transport sector and thus increase environmental protection. The research identified potential (recommended) reductions in energy consumption and GHG emissions in individual EU countries’ road freight transport sector. Moreover, the study identified potential reductions in energy consumption and GHG emissions for the road freight transport sector in all EU. The entire group of 27 countries studied should achieve a 27% reduction in energy consumption and GHG emissions from road freight transport sector. The potential savings in energy consumption and reducing GHG emissions should be the largest in four countries: Cyprus, the United Kingdom, Croatia and Ireland.
The research can help decision-makers decide where to promote energy conservation and emission reduction policies more intensively, where to introduce technological innovations in transportation and possibly raise emission standards. To improve the environmental performance of the transport sector, policymakers may also consider measures such as expanding infrastructure and reducing regional disparities in the country’s transport sector. Other EU actions for reducing GHG emissions from transportation are as follows:
  • CO2 emissions trading system reform,
  • Increasing the share of renewable fuels in transportation,
  • Removal of tax breaks for fossil fuels,
  • Amending regulations on alternative fuel infrastructure to increase its capacity.
As part of the measures to reduce CO2 emissions and achieve climate neutrality by 2050, greenhouse gas emissions should be reduced by 90%, compared to 1990 levels. To reduce emissions from heavy-duty vehicles, improvements in vehicle fuel efficiency must also continue, but other efforts are needed. Shift freight transport from road to rail and passenger transport from cars to buses and coaches.
In July 2021, the European Commission proposed lowering the emissions limit for cars and vans by another 15% from 2025, followed by a 55% reduction for cars and 50% for vans by 2030, reaching zero emissions by 2035.
Two ways to reduce CO2 emissions from cars are to increase vehicle efficiency or change the fuel used. In 2020, most European road transportation used diesel fuel, followed by gasoline. However, electric cars are gaining in popularity and in 2020, they accounted for 11% of all newly registered passenger vehicles. Sales of electric vehicles (battery electric vehicles and plug-in hybrid electric vehicles) have risen sharply since 2017 and tripled in 2020 when current CO2 emission targets take effect. In 2020, electric vans accounted for 2.3% of the market share of newly registered vans.
When evaluating the amount of CO2 a vehicle produces, it is essential to consider the amount of CO2 emitted during use and the emissions caused by its production and permanent storage. The production and permanent storage of electric cars are less environmentally friendly than cars with internal combustion engines and emissions from electric vehicles vary depending on how the electricity is generated. However, given the average energy mix in Europe, electric cars are already proving to be cleaner environmentally than gasoline-powered vehicles. As the share of renewable electricity grows, electric cars should become even less harmful to the environment, especially given the EU’s plans to make batteries greener.
In addition to setting targets for car emissions, policymakers are looking at other maritime and air transport measures: including maritime transport in the emissions trading system, revising the system for aviation and designing more sustainable fuels for aviation and ships. Although emissions from aviation and shipping account for only about 8% of the EU’s total emissions, they are steadily increasing.

5. Conclusions

Transportation is an economic sector that is crucial to maintaining and enhancing European competitiveness. Transportation systems ensure a high level of mobility in Europe and the continued growth of urbanization and trade. Based on the analysis concerning the development of road freight transport in the past decade, it can be concluded that the activities of this sector experienced significant growth, which has not been accompanied by corresponding progress in reducing energy consumption and reducing GHG emissions. The road transport sector primarily depends on fossil fuels, with negative consequences for energy supply security and climate change. Increasing demand for non-renewable energy sources, the depletion of cheaper-to-exploit sources of energy extraction and the deteriorating state of the environment are forcing the search for low-carbon transportation system solutions.
To make the right decisions and apply suitable instruments to transportation, decision-makers need new concepts and methodologies to enable an integrated and comprehensive assessment of transportation eco-efficiency. Thus, new approaches are needed to address the inputs’ efficiency in relation to the economic results obtained in the various transport modes. Resource efficiency (including energy) and greenhouse gas efficiency are crucial elements in this paradigm. Analyzing the relationship between the environment and economic performance makes it possible to formulate scientifically sound directives for development policies and transportation organizations.
A comprehensive and multidimensional assessment of the economic–energy–environmental efficiency of the road freight transport sector is included in the research conducted in the article based on the non-parametric DEA method.
The results obtained within the framework of the conducted research allowed us to formulate the following conclusions:
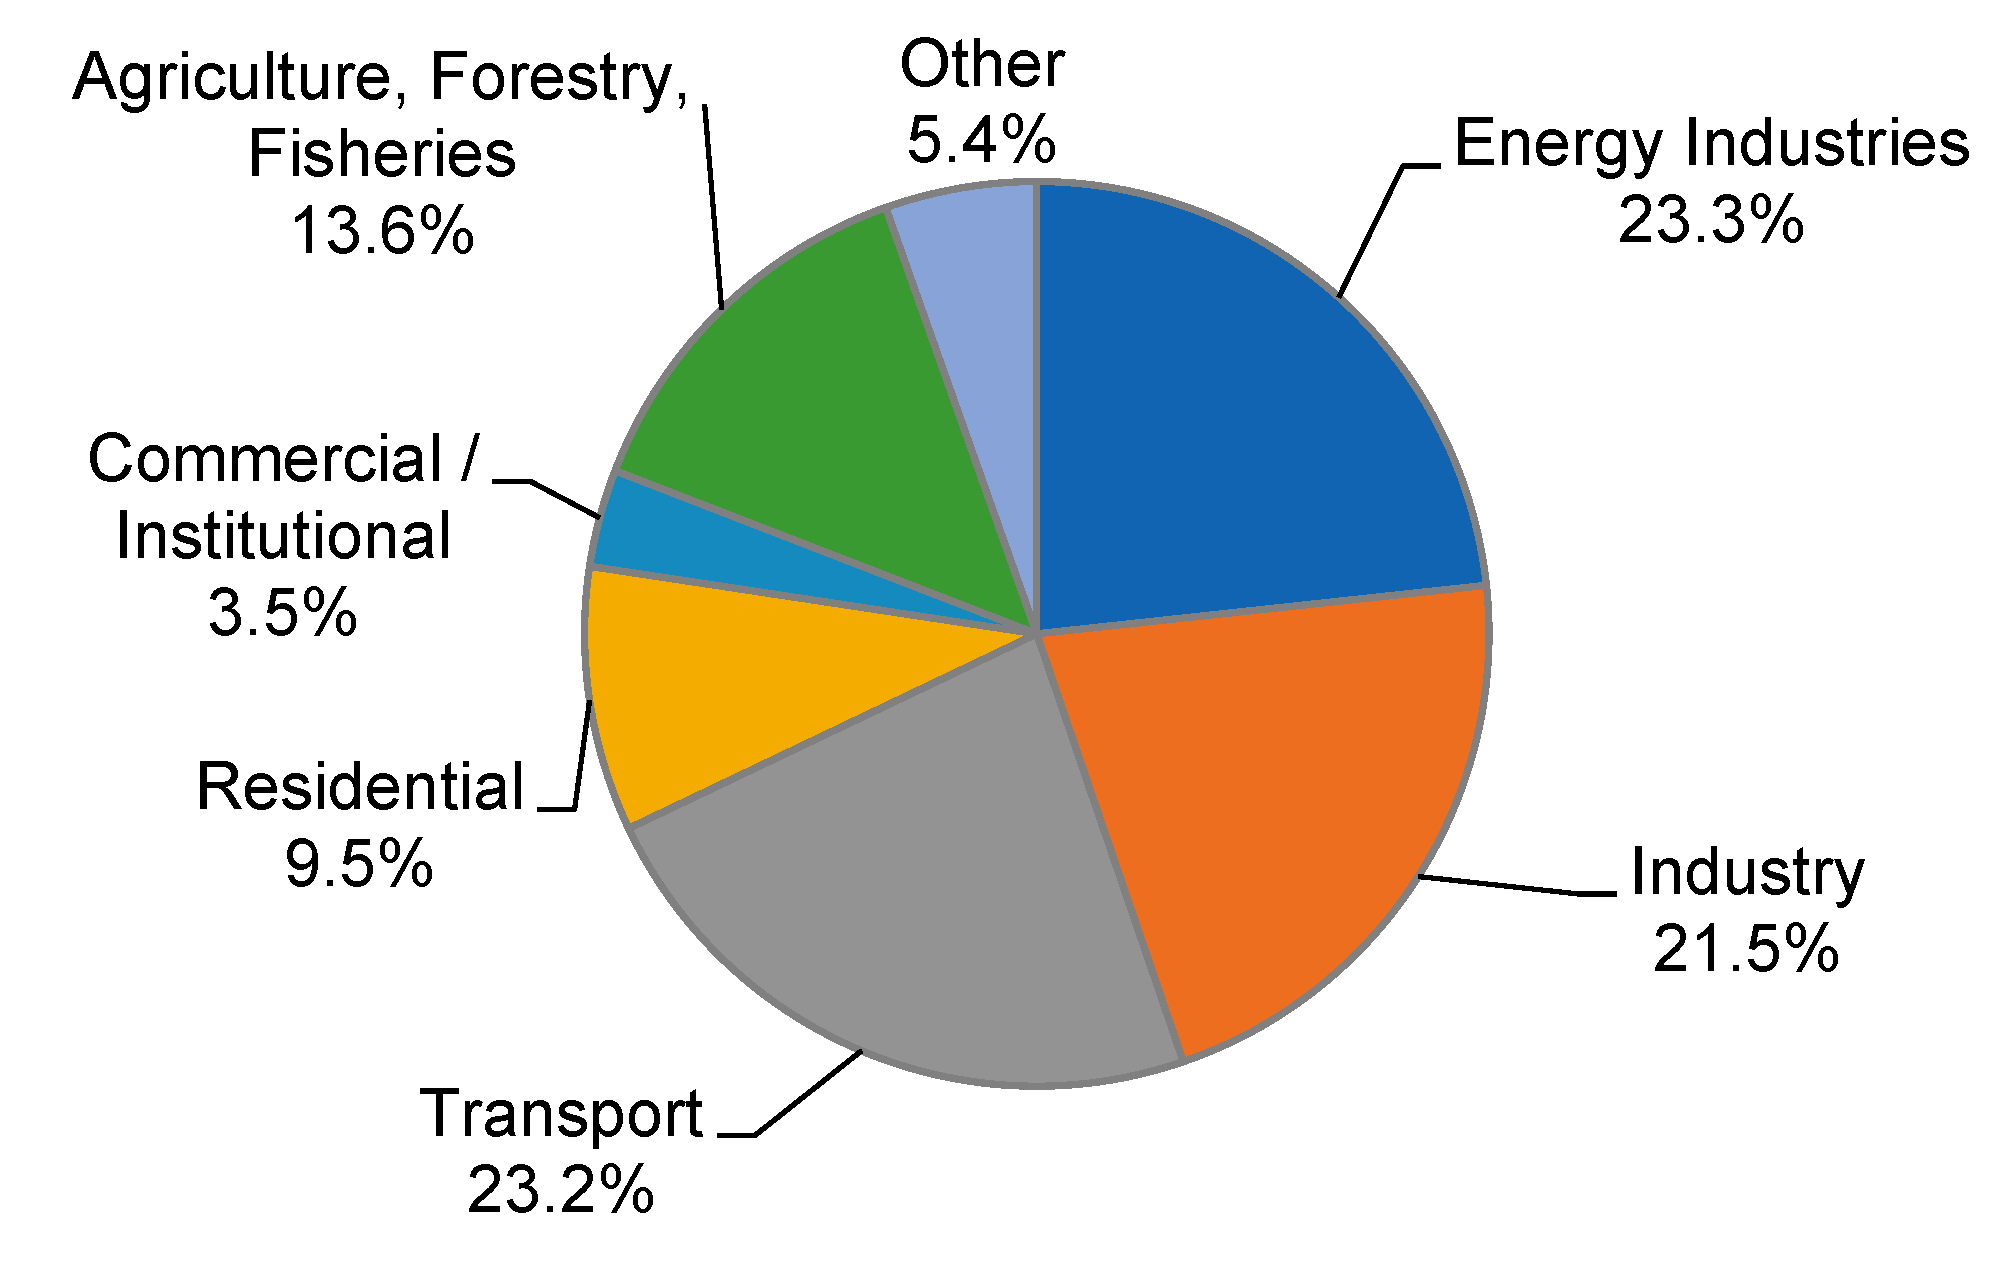
  • Transportation is the EU’s primary energy consumer (consuming about 30% of energy, 95% of which consume by road transport) and is responsible for about 25% of the EU’s total CO2 emissions, 88% of which came from road transport.
  • The evaluation of transport eco-efficiency using the SBM-DEA model with the inclusion of undesired output effects avoided the angular and radial defects of the traditional DEA model. Due to this, the eco-efficiency evaluation gained accuracy and reliability.
  • The average eco-efficiency level of the road freight transport sector in the EU in 2019, estimated using the SBM-DEA model was 0.66.
  • The economic–energy–environmental efficiency of the road freight transport sectors in EU countries varies. The study identifies countries with the highest (Slovenia, Belgium, Bulgaria, Portugal, Denmark, Germany, Poland, Netherlands, Luxembourg and Lithuania) and the lowest eco-efficiency of the road freight transport sector (Spain, Austria, Latvia, Czechia, France, Estonia, Croatia, United Kingdom, Hungary, Greece, Ireland and Cyprus).
  • The study identified potential reductions in energy consumption and GHG emissions that would improve the eco-efficiency of the road freight transport sector in each EU country. The entire group of 27 countries should achieve a 27% reduction in energy consumption and GHG emissions from the road freight transport sector. Reducing energy consumption in the road transport sector can be ensured with better integration of different modes of transport, a more significant share of energy from renewable sources and the use of alternative fuels, improving the energy efficiency of vehicles, developing road transport infrastructure and environmentally friendly tax policies.
  • The study filled a research gap in comparative analyses of the eco-efficiency of the road freight transport sector in EU countries. Moreover, the study filled a research gap in the link between the eco-efficiency of the road freight transport sector in EU countries and their economic development. The research hypothesis was confirmed that as the economic development of EU countries increases, the level of eco-efficiency of the road freight transport sector increases. However, the correlation of this relationship was found to be weak.
The research conducted has some limitations. Firstly, these limitations are due to the shortcomings of the DEA method. Since the DEA method is a deterministic technique, noise such as measurement error can cause significant problems. Moreover, the DEA method estimates the relative efficiency of a DMU to best practices within a particular sample and so comparisons of scores between different studies is not correct nor reliable.
Efficiency is a complex economic issue and the methods used to analyze it have their advantages and disadvantages, so according to the authors, when evaluating the efficiency of transportation at the micro-, meso- or macro-level, it is worth using an integrated approach—based on various methods that complement each other and thus make it possible to formulate reliable conclusions. In addition, the DEA method does not forecast future performance. As a result, future research should integrate DEA with, for example, Gray’s GM prediction model, DEA resampling prediction techniques or machine learning prediction techniques [109] to provide more detailed information to decision-makers.
In further studies, other negative externalities of road transportation should be considered, such as noise and accidents. To evaluate transport in terms of sustainability, one would also need to analyze social factors related to transportation.
In addition to the road subsector, transportation includes rail, sea, air and inland waterways. In this study, only the eco-efficiency of road freight transport was calculated. However, calculating and comparing economic–energy–environmental efficiencies for other modes of transportation would also be of great value.

Author Contributions

Conceptualization, J.D. and M.K.; methodology, J.D.; software, J.D.; validation, J.D. and M.K.; formal analysis, J.D. and M.K.; investigation, J.D. and M.K.; resources, J.D. and M.K.; data curation, J.D.; writing—original draft preparation, J.D. and M.K.; writing—review and editing, J.D. and M.K.; visualization, J.D. and M.K.; supervision, J.D.; project administration, J.D.; funding acquisition, J.D. All authors have read and agreed to the published version of the manuscript.

Funding

This research received no external funding.

Data Availability Statement

Data available on request due to restrictions privacy or ethical.

Conflicts of Interest

The authors declare no conflict of interest.

References

  1. Kopp, A.; Block, R.I.; Limi, A. Turning the Right Corner: Ensuring Development Through a Low-Carbon Transport Sector; World Bank: Washington, DC, USA, 2013. [Google Scholar]
  2. Motowidlak, U. Polityka Unii Europejskiej na rzecz zwiększenia efektywności ekonomicznej i środowiskowej transportu. Cz. 1. Poprawa efektywności energetycznej transport. Logistyka 2014, 3, 4507–4514. [Google Scholar]
  3. Fuglestvedt, J.; Berntsen, T.; Myhre, G.; Rypdal, K.; Skeie, R.B. Climate forcing from the transport sectors. Proc. Natl. Acad. Sci. USA 2008, 105, 454–458. [Google Scholar] [CrossRef] [PubMed] [Green Version]
  4. European Environment Agency. A Strategy for Smart, Sustainable and Inclusive Growth, COM (2010) 2020 Final Version; European Commission: Brussels, Belgium, 2010.
  5. European Environment Agency. A Resource-Efficient Europe—Flagship Initiative under the Europe 2020 Strategy, COM (2011) 21 Final Version; European Commission: Brussels, Belgium, 2011.
  6. European Environment Agency. Innovation Union—Flagship Initiative. COM (2010) 546 Final Version; European Commission: Brussels, Belgium, 2010.
  7. Kryk, B. Efektywność energetyczna w kontekście wyzwania zasobooszczędnego gospodarowania na przykładzie modernizacji budynków w Polsce. Zesz. Nauk. Uniw. Szczecińskiego Finans. Rynk. Finans. Ubezpieczenia 2013, 756, 317–330. [Google Scholar]
  8. Kabus, J.; Dziadkiewicz, M. Residents’ Attitudes and Social Innovation Management in the Example of a Municipal Property Manager. Energies 2022, 15, 5812. [Google Scholar] [CrossRef]
  9. Hájek, M.; Zimmermannová, J.; Helman, K. Environmental efficiency of economic instruments in transport in EU countries. Transp. Res. Part D 2021, 100, 103054. [Google Scholar] [CrossRef]
  10. Ślusarczyk, B.; Grondys, K. The Concept of Sustainable Development in the Functioning of Municipalities Belonging to Special Economic Zones in Poland. Sustainability 2018, 10, 2169. [Google Scholar] [CrossRef] [Green Version]
  11. Jacyna, M.; Wasiak, M. The study of transport impact on the environment with regard to sustainable development. J. Vibroengineering 2017, 13, 285–289. [Google Scholar]
  12. Szymanski, P.; Ciuffo, B.; Fontaras, G.; Martini, G.; Pekar, F. The future of road transport in Europe. Environmental implications of automated, connected and low-carbon mobility. Combust. Engines 2021, 60, 3–10. [Google Scholar] [CrossRef]
  13. Yan, S.; Eskeland, G.S. Greening the vehicle fleet: Norway’s CO2-Differentiated registration tax. J. Environ. Economics Manag. 2018, 91, 247–262. [Google Scholar] [CrossRef]
  14. Baranzini, A.; Goldemberg, J.; Speck, S. A Future for Carbon Taxes. Ecol. Econ. 2000, 32, 395–412. [Google Scholar] [CrossRef]
  15. Vehmas, J.; Kaivo-oja, J.; Luukkanen, J.; Malaska, P. Environmental Taxes on Fuels and Electricity—Some Experiences from the Nordic Countries. Energy Policy 1999, 27, 343–355. [Google Scholar] [CrossRef]
  16. Lin, B.; Li, X. The effect of carbon tax on per capita CO2 emissions. Energy Policy 2011, 39, 5137–5146. [Google Scholar] [CrossRef]
  17. Bosquet, B. Environmental Tax Reform: Does it Work? A Survey of the Empirical Evidence. Ecol. Econ. 2000, 34, 19–32. [Google Scholar]
  18. Wanke, P.; Chen, Z.; Zheng, X.; Antunes, J. Sustainability Efficiency and Carbon Inequality of the Chinese Transportation System: A Robust Bayesian Stochastic Frontier Analysis. J. Environ. Manag. 2020, 260, 110163. [Google Scholar] [CrossRef] [PubMed]
  19. Liu, W.; Lin, B. Analysis of Energy Efficiency and its Influencing Factors in China’s Transport Sector. J. Clean. Prod. 2018, 170, 674–682. [Google Scholar] [CrossRef]
  20. Wang, K.; Lu, B.; Wei, Y.-M. China’s Regional Energy and Environmental Efficiency: A Range-Adjusted Measure Based Analysis. Appl. Energy 2013, 112, 1403–1415. [Google Scholar] [CrossRef]
  21. Meng, F.; Liu, G.; Yang, Z.; Casazza, M.; Cui, S.; Ulgiati, S. Energy Efficiency of Urban Transportation System in Xiamen, China. An Integrated Approach. Appl. Energy 2017, 186, 234–248. [Google Scholar] [CrossRef]
  22. Chang, Y.T.; Zhang, N.; Danao, D.; Zhang, N. Environmental efficiency analysis of transportation system in China: A non-radial DEA approach. Energy Policy 2013, 58, 277–283. [Google Scholar] [CrossRef]
  23. Song, X.; Hao, Y.; Zhu, X. Analysis of the environmental efficiency of the Chinese transportation sector using an undesirable output slacks-based measure data envelopment analysis model. Sustainability 2015, 7, 9187–9206. [Google Scholar] [CrossRef] [Green Version]
  24. Li, T.; Yang, W.; Zhang, H.; Cao, X. Evaluating the impact of transport investment on the efficiency of regional integrated transport systems in China. Transp. Policy 2016, 45, 66–76. [Google Scholar] [CrossRef]
  25. Liu, H.; Zhang, Y.; Zhu, Q.; Chu, J. Environmental efficiency of land transportation in China: A parallel slack-based measure for regional and temporal analysis. J. Clean Prod. 2017, 142, 867–876. [Google Scholar] [CrossRef]
  26. Zhou, G.; Chung, W.; Zhang, X. A study of carbon dioxide emissions performance of China’s transport sector. Energy 2013, 50, 302–314. [Google Scholar] [CrossRef]
  27. Daroń, M.; Wilk, M. Management of Energy Sources and the Development Potential in the Energy Production Sector—A Comparison of EU Countries. Energies 2021, 14, 685. [Google Scholar] [CrossRef]
  28. Costa, Á.; Markellos, R.N. Evaluating public transport efficiency with neural network models. Transp. Res. Part C Emerg. Technol. 1997, 5, 301–312. [Google Scholar] [CrossRef]
  29. Viton, P.A. Changes in multi-mode bus transit efficiency, 1988–1992. Transportation 1998, 25, 1–21. [Google Scholar] [CrossRef]
  30. Yu, M.M. Assessing the technical efficiency, service effectiveness, and technical effectiveness of the world’s railways through NDEA analysis. Transp. Res. Part A Policy Pract. 2008, 42, 1283–1294. [Google Scholar] [CrossRef]
  31. Karlaftis, M.G.; Tsamboulas, D. Efficiency measurement in public transport: Are findings specification sensitive? Transp. Res. Part A Policy Pract. 2012, 46, 392–402. [Google Scholar] [CrossRef]
  32. Tamaki, T.; Nakamura, H.; Fujii, H.; Managi, S. Efficiency and emissions from urban transport: Application to world city-level public transportation. Econ. Anal. Policy 2019, 61, 55–63. [Google Scholar] [CrossRef]
  33. Baran, J.; Górecka, A.K. Economic and environmental aspects of inland transport in EU countries. Econ. Res. Ekon. Istraživanja 2019, 32, 1037–1059. [Google Scholar] [CrossRef] [Green Version]
  34. Benjamin, J.; Obeng, K. The effect of policy and background variables on total factor productivity for public transit. Transp. Res. Part B Methodol. 1990, 24, 1–14. [Google Scholar] [CrossRef]
  35. Holden, R.; Xu, B.; Greening, P.; Piecyk, M.; Dadhich, P. Towards a common measure of greenhouse gas related logistics activity using data envelopment analysis. Transp. Res. Part A Policy Pract. 2016, 91, 105–119. [Google Scholar] [CrossRef]
  36. Cook, W.D.; Kazakov, A.; Roll, Y.; Seiford, L.M. A data envelopment approach to measuring efficiency: Case analysis of highway maintenance patrols. J. SocioEconomics 1991, 20, 83–103. [Google Scholar] [CrossRef]
  37. Rouse, P.; Putterill, M.; Ryan, D. Towards a general managerial framework for performance measurement: A comprehensive highway maintenance application. J. Product. Anal. 1997, 8, 127–149. [Google Scholar] [CrossRef]
  38. Cook, W.D.; Kazakov, A.; Persaud, B.N. Prioritising highway accident sites: A data envelopment analysis model. J. Oper. Res. Soc. 2001, 52, 303–309. [Google Scholar] [CrossRef]
  39. Hilmola, O.-P. European railway freight transportation and adaptation to demand decline: Efficiency and partial productivity analysis from period of 1980-2003. Int. J. Product. Perform. Manag. 2007, 56, 205–225. [Google Scholar] [CrossRef]
  40. Rassafi, A.A.; Vaziri, M. Assessment of modal transportation sustainability: Application of data envelopment and concordance analyses. Iran. J. Sci. Technol. Trans. B Eng. 2007, 31, 179–193. [Google Scholar]
  41. Barros, C.P.; Dieke, P.U. Measuring the economic efficiency of airports: A Simar–Wilson methodology analysis. Transp. Res. Part E Logist. Transp. Rev. 2008, 44, 1039–1051. [Google Scholar] [CrossRef]
  42. Sampaio, B.R.; Neto, O.L.; Sampaio, Y. Efficiency analysis of public transport systems: Lessons for institutional planning. Transp. Res. Part A Policy Pract. 2008, 42, 445–454. [Google Scholar] [CrossRef] [Green Version]
  43. Michaelides, P.G.; Belegri-Roboli, A.; Karlaftis, M.; Marinos, T. International air transportation carriers: Evidence from SFA and DEA technical efficiency results (1991-2000). Eur. J. Transp. Infrastruct. Res. 2009, 9, 347–362. [Google Scholar]
  44. Rouse, P.; Chiu, T. Towards optimal life cycle management in a road maintenance setting using DEA. Eur. J. Oper. Res. 2009, 196, 672–681. [Google Scholar] [CrossRef]
  45. Savolainen, V.; Hilmola, O. The relative technical efficiency of European transportation systems concerning air transport and railways. Int. J. Bus. Perform. Manag. 2009, 11, 19–42. [Google Scholar] [CrossRef]
  46. Söderberg, M. A broad performance benchmark based on citizens’ preferences: The case of Swedish public transportation. Ann. Public Coop. Econ. 2009, 80, 579–603. [Google Scholar] [CrossRef]
  47. Wang, L.-C.; Tsai, H.-Y. Evaluation of Highway Maintenance Performance Using Data Envelopment Analysis (DEA) in Taiwan. J. Mar. Sci. Technol. 2009, 17, 145155. [Google Scholar] [CrossRef]
  48. Cruijssen, F.; Dullaert, W.; Joro, T. Freight transportation efficiency through horizontal cooperation in Flanders. Int. J. Logist. Res. Appl. 2010, 13, 161–178. [Google Scholar] [CrossRef]
  49. Jitsuzumi, T.; Nakamura, A. Causes of inefficiency in Japanese railways: Application of DEA for managers and policymakers. Socio-Econ. Plan. Sci. 2010, 44, 161–173. [Google Scholar] [CrossRef]
  50. Sun, L.; Rong, J.; Yao, L. Measuring transfer efficiency of urban public transportation terminals by data envelopment analysis. J. Urban Plan. Dev. 2010, 136, 314319. [Google Scholar] [CrossRef]
  51. Hilmola, O.-P. Role of location in railway sector efficiency. Int. J. Logist. Syst. Manag. 2011, 10, 478–494. [Google Scholar] [CrossRef]
  52. Chen, Y.; Han, B. Regional public transportation scheduling model based on welfare economics and DEA. Int. J. Model. Identif. Control. 2012, 16, 272–276. [Google Scholar] [CrossRef]
  53. Lee, G.; Yu, M.-M.; Wang, L.-C. DEA-based integrated relationship of returns to scale–an application to road maintenance in Taiwan. J. Civ. Eng. Manag. 2012, 18, 709–723. [Google Scholar] [CrossRef]
  54. Leal, I.C.; de Almada Garcia, P.A.; de Almeida, D.A.M. A data envelopment analysis approach to choose transport modes based on eco-efficiency. Environ. Dev. Sustain. 2012, 14, 767–781. [Google Scholar] [CrossRef]
  55. Chang, Y.-T.; Park, H.-S.; Jeong, J.-B.; Lee, J.-W. Evaluating economic and environmental efficiency of global airlines: A SBM-DEA approach. Transp. Res. Part D Transp. Environ. 2014, 27, 46–50. [Google Scholar] [CrossRef]
  56. Çipil, F. Performance Analysis of Turkey’s Transport Sector Greenhouse Gas Emissions. Energy Environ. 2014, 25, 357–367. [Google Scholar] [CrossRef]
  57. Chen, C.C. The operation of new transportation infrastructure and regional economic efficiency: A case study of Taiwan high speed rail on regions in western Taiwan. Reg. Sect. Econ. Stud. 2014, 14, 179–194. [Google Scholar]
  58. Vaidya, O.S. Evaluating the Performance of Public Urban Transportation Systems in India. J. Public Transp. 2014, 17, 11. [Google Scholar] [CrossRef] [Green Version]
  59. Baran, J.; Górecka, A. Seaport efficiency and productivity based on Data Envelopment Analysis and Malmquist Productivity Index. Logist. Sustain. Transp. 2015, 6, 25–33. [Google Scholar] [CrossRef] [Green Version]
  60. Zhang, N.; Wei, X. Dynamic total factor carbon emissions performance changes in the Chinese transportation industry. Appl. Energy 2015, 146, 409–420. [Google Scholar] [CrossRef]
  61. Azadeh, A.; Salehi, V.; Kianpour, M. Performance evaluation of rail transportation systems by considering resilience engineering factors: Tehran railway electrification system. Transp. Lett. 2016, 1–14. [Google Scholar] [CrossRef]
  62. Azadeh, A.; Zarrin, M.; Hamid, M. A novel framework for improvement of road accidents considering decision-making styles of drivers in a large metropolitan area. Accid. Anal. Prev. 2016, 87, 17–33. [Google Scholar] [CrossRef]
  63. Chu, J.-F.; Wu, J.; Song, M.-L. An SBM-DEA model with parallel computing design for environmental efficiency evaluation in the big data context: A transportation system application. Ann. Oper. Res. 2016, 1–20. [Google Scholar] [CrossRef]
  64. Kleinová, E. Does liberalization of the railway industry lead to higher technical effectiveness? J. Rail Transp. Plan. Manag. 2016, 6, 67–76. [Google Scholar] [CrossRef]
  65. Li, Z.; Zhao, L.; Yuan, Z. Highway Transportation Efficiency Evaluation for Beijing Tianjin-Hebei Region Based on Advanced DEA Model. Int. Rev. Spat. Plan. Sustain. Dev. 2016, 4, 36–44. [Google Scholar] [CrossRef] [PubMed] [Green Version]
  66. Min, H.; Joo, S.-J. A comparative performance analysis of airline strategic alliances using data envelopment analysis. J. Air Transp. Manag. 2016, 52, 99–110. [Google Scholar] [CrossRef]
  67. Song, M.; Zheng, W.; Wang, Z. Environmental efficiency and energy consumption of highway transportation systems in China. Int. J. Prod. Econ. 2016, 181, 441–449. [Google Scholar] [CrossRef]
  68. Wanke, P.; Barros, C.P. New evidence on the determinants of efficiency at Brazilian ports: A bootstrapped DEA analysis. Int. J. Shipp. Transp. Logist. 2016, 8, 250272. [Google Scholar] [CrossRef]
  69. Wu, J.; Chu, J.; An, Q.; Sun, J.; Yin, P. Resource reallocation and target setting for improving environmental performance of DMUs: An application to regional highway transportation systems in China. Transp. Res. Part D Transp. Environ. 2018, 61, 204–216. [Google Scholar] [CrossRef]
  70. Wu, J.; Zhu, Q.; Chu, J.; Liu, H.; Liang, L. Measuring energy and environmental efficiency of transportation systems in China based on a parallel DEA approach. Transp. Res. Part D Transp. Environ. 2016, 48, 460–472. [Google Scholar] [CrossRef]
  71. Wang, Z.; He, W. CO2 emissions efficiency and marginal abatement costs of the regional transportation sectors in China. Transp. Res. Part D Transp. Environ. 2017, 50, 83–97. [Google Scholar] [CrossRef]
  72. Chang, Y.-T.; Park, H.K.; Lee, S.; Kim, E. Have Emission Control Areas (ECAs) harmed port efficiency in Europe? Transp. Res. Part D Transp. Environ. 2018, 58, 39–53. [Google Scholar] [CrossRef]
  73. Domagała, J. Efficiency of Polish seaports against the background of the largest ports in Europe. Zesz. Nauk. Ekon. I Organ. Logistyki 2019, 4, 77–85. [Google Scholar] [CrossRef]
  74. Yang, T.; Guan, X.; Qian, Y.; Xing, W.; Wu, H. Efficiency Evaluation of Urban Road Transport and Land Use in Hunan Province of China Based on Hybrid Data Envelopment Analysis (DEA) Models. Sustainability 2019, 11, 3826. [Google Scholar] [CrossRef] [Green Version]
  75. Tang, T.; You, J.; Sun, H.; Zhang, H. Transportation Efficiency Evaluation Considering the Environmental Impact for China’s Freight Sector: A Parallel Data Envelopment Analysis. Sustainability 2019, 11, 5108. [Google Scholar] [CrossRef] [Green Version]
  76. Yanga, F.; Choib, Y.; Leec, H. Life-cycle data envelopment analysis to measure efficiency and cost-effectiveness of environmental regulation in China’s transport sector. Ecol. Indic. 2021, 126, 107717. [Google Scholar] [CrossRef]
  77. Romero-Ania, A.; De Vicente Oliva, M.A.; Rivero Gutiérrez, L. Economic Evaluation of the Urban Road Public Transport System Efficiency Based on Data Envelopment Analysis. Appl. Sci. 2022, 12, 57. [Google Scholar] [CrossRef]
  78. Vaziri, M. A comparative appraisal of roadway accident for Asia-Pacific countries. Int. J. Eng. Trans. A Basics 2010, 23, 111–126. [Google Scholar]
  79. Egilmez, G.; McAvoy, D. Benchmarking road safety of US states: A DEA-based Malmquist productivity index approach. Accid. Anal. Prev. 2013, 53, 55–64. [Google Scholar] [CrossRef] [PubMed]
  80. Alper, D.; Sinuany-Stern, Z.; Shinar, D. Evaluating the efficiency of local municipalities in providing traffic safety using the Data Envelopment Analysis. Accid. Anal. Prev. 2015, 78, 39–50. [Google Scholar] [CrossRef] [PubMed]
  81. Boame, A.K. The technical efficiency of Canadian urban transit systems. Transp. Res. Part E Logist. Transp. Rev. 2004, 40, 401–416. [Google Scholar] [CrossRef]
  82. Barros, C.P.; Peypoch, N. An evaluation of European airlines’ operational performance. Int. J. Prod. Econ. 2009, 122, 525–533. [Google Scholar] [CrossRef]
  83. Chiu, Y.H.; Huang, C.W.; Ma, C.M. Assessment of China transit and economic efficiencies in a modified value-chains DEA model. Eur. J. Oper. Res. 2011, 209, 95–103. [Google Scholar] [CrossRef]
  84. Kerstens, K. Technical efficiency measurement and explanation of French urban transit companies. Transp. Res. Part A Policy Pract. 1996, 30, 431–452. [Google Scholar] [CrossRef]
  85. Karlaftis, M.G. A DEA approach for evaluating the efficiency and effectiveness of urban transit systems. Eur. J. Oper. Res. 2004, 152, 354–364. [Google Scholar] [CrossRef]
  86. Yu, M.M.; Lin, E.T. Efficiency and effectiveness in railway performance using a multi-activity network DEA model. Omega Int. J. Manag. Sci. 2008, 36, 1005–1017. [Google Scholar] [CrossRef]
  87. McMullen, B.S.; Noh, D.W. Accounting for emissions in the measurement of transit agency efficiency: A directional distance function approach. Transp. Res. Part D Transp. Environ. 2007, 12, 1–9. [Google Scholar] [CrossRef]
  88. Wei, J.; Xia, W.; Guo, X.; Marinova, D. Urban transportation in Chinese cities: An efficiency assessment. Transp. Res. Part D Transp. Environ. 2013, 23, 20–24. [Google Scholar] [CrossRef] [Green Version]
  89. Lin, W.; Chen, B.; Xie, L.; Pan, H. Estimating energy consumption of transport modes in China using DEA. Sustainability 2015, 7, 4225–4239. [Google Scholar] [CrossRef] [Green Version]
  90. Stefaniec, A.; Hosseini, K.; Xie, J.; Li, Y. Sustainability assessment of inland transportation in China: A triple bottom line-based network DEA approach. Transp. Res. Part D Transp. Environ. 2020, 80, 102258. [Google Scholar] [CrossRef]
  91. do Castelo Gouveia, M.; Clímaco, I. Assessment of Fuel Tax Policies to Tackle Carbon Emissions from Road Transport—An Application of the Value-Based DEA Method Including Robustness Analysis, Energy Management—Collective and Computational Intelligence with Theory and Applications; Springer: Berlin/Heidelberg, Germany, 2018; pp. 167–191. [Google Scholar]
  92. Rogers, M.M.; Weber, W.L. Evaluating CO2 emissions and fatalities tradeoffs in truck transport. Int. J. Phys. Distrib. Logist. Manag. 2011, 41, 750–767. [Google Scholar] [CrossRef]
  93. Statistical Pocketbook. EU Transport in Figures, Mobility and Transport; Publications Office of the European Union: Brussels, Belgium, 2021. [Google Scholar]
  94. Domagała, J. Economic and environmental aspects of agricultural in EU countries. Energies. 2021, 14, 7826. [Google Scholar] [CrossRef]
  95. Charnes, A.; Cooper, W.W.; Rhodes, A. Measuring the Efficiency of Decision Making Units. Eur. J. Oper. Res. 1978, 2, 429–444. [Google Scholar]
  96. Banker, R.D.; Charnes, A.; Cooper, W.W. Some models for estimating technical and scale inefficiencies in data envelopment analysis. Manag. Sci. 1984, 1930, 1078–1092. [Google Scholar]
  97. Cooper, W.W.; Seiford, L.M.; Tone, K. Data Envelopment Analysis, A Comprehensive Text with Models, Applications, References and DEA-Solver Software. Kluwer Academic Publishers: New York, NY, USA, 2007. [Google Scholar]
  98. Coelli, T.J.; Prasada Rao, D.S.; O’Donnell, C.J.; Battese, G.E. An Introduction to Efficiency and Productivity Analysis; Springer: Berlin/Heidelberg, Germany, 2005. [Google Scholar]
  99. Tone, K. A slack-based measure of e_ciency in data envelopment analysis. Eur. J. Oper. Res. 2001, 130, 498–509. [Google Scholar] [CrossRef] [Green Version]
  100. Tone, K. Toronto: Presentation at NAPW III. In Dealing with Undesirable Outputs in DEA: A Slacks-Based Measure (SBM) Approach; National Graduate Institute for Policy Studies: Tokyo, Japan, 2004. [Google Scholar]
  101. Djordjevića, B.; Krmac, E. Evaluation of Energy-Environment Efficiency of European Transport Sectors: Non-Radial DEA and TOPSIS Approach. Energies 2019, 12, 2907. [Google Scholar] [CrossRef] [Green Version]
  102. Wang, C.-N.; Le, T.Q.; Yu, C.-H.; Ling, H.-C.; Dang, T.-T. Strategic Environmental Assessment of Land Transportation: An Application of DEA with Undesirable Output Approach. Sustainability 2022, 14, 972. [Google Scholar] [CrossRef]
  103. Shen, Y.; Bao, Q.; Hermans, E. Applying an Alternative Approach for Assessing Sustainable Road Transport: A Benchmarking Analysis on EU Countries. Sustainability 2020, 12, 10391. [Google Scholar] [CrossRef]
  104. Nasreen, S.; Saidi, S.; Ozturk, I. Assessing links between energy consumption, freight transport, and economic growth: Evidence from dynamic simultaneous equation models. Environ. Sci. Pollut. Res. 2018, 25, 16825–16841. [Google Scholar] [CrossRef] [PubMed]
  105. Ibrahiem, D.M. Road energy consumption, economic growth, population and urbanization in Egypt: Cointegration and causality analysis. Environ. Dev. Sustain. 2018, 20, 1053–1066. [Google Scholar] [CrossRef]
  106. Liddle, B.; Lung, S. The long-run causal relationship between transport energy consumption and GDP: Evidence from heterogeneous panel methods robust to cross-sectional dependence. Econ. Lett. 2013, 121, 524–527. [Google Scholar] [CrossRef]
  107. Achour, H.; Belloumi, M. Investigating the causal relationship between transport infrastructure, transport energy consumptionand economic growth in Tunisia. Renew. Sustain. Energy Rev. 2016, 56, 988–998. [Google Scholar] [CrossRef]
  108. Gherghina, S.C.; Onofrei, M.; Vintila, G.; Armeanu, D.S. Empirical evidence from EU-28 countries on resilient transport infrastructure systems and sustainable economic growth. Sustainability 2018, 10, 2900. [Google Scholar] [CrossRef] [Green Version]
  109. Zhang, Z.; Xiao, Y.; Niu, H. DEA and Machine Learning for Performance Prediction. Mathematics 2022, 10, 1776. [Google Scholar] [CrossRef]
Figure 1. EU-28 performance by mode of freight transport in 1995–2020 (billion tkm). Source: Own elaboration based on Eurostat 2022.
Energies 16 00461 g001
Figure 2. (A) Final energy consumption by sector in EU-27 in 1990 (shares of total consumption in EU). (B) Final energy consumption by sector in EU-27 in 2020 (shares of total consumption in the EU). Source: Own elaboration based on Eurostat 2022; European Environment Agency 2022.
Energies 16 00461 g002
Figure 3. Final energy consumption by sector in EU-27 in the years 1990–2020 (Mtoe). Source: Own elaboration based on Eurostat 2022; European Environment Agency 2022.
Energies 16 00461 g003
Figure 4. Dynamics of changes in the number of goods vehicles and passenger cars in the EU-27 in the years 1995–2000 (1995 = 100%). Source: Own elaboration based on Eurostat 2022.
Energies 16 00461 g004
Figure 5. Structure of energy consumption in EU countries by sectors (shares of total consumption in the country, 2020). Source: Own elaboration based on Eurostat 2022.
Energies 16 00461 g005
Figure 6. Total energy consumption by transport mode in the EU-27 in the years 1990–2020 (Mtoe). Source: Own elaboration based on Eurostat 2022; European Environment Agency 2022.
Energies 16 00461 g006
Figure 7. Final energy consumption in road transport by type of fuel in EU-27 (Mtoe). Source: Own elaboration based on Eurostat 2022.
Energies 16 00461 g007
Figure 8. Final consumption of motor gasoline, diesel, biofuels and biogas for transport (shares of total consumption in the country, 2020). Source: Own elaboration based on Eurostat 2022.
Energies 16 00461 g008
Figure 9. Greenhouse Gas Emissions by sector in the EU in 2020 (shares of total emission in EU-27). Source: Own elaboration based on European Environment Agency, 2022.
Energies 16 00461 g009
Figure 10. Greenhouse Gas Emissions by sector in the EU (1990 = 1). Source: Own elaboration based on European Environment Agency, 2022.
Energies 16 00461 g010
Figure 11. Efficiency of road freight transport sectors according to the DEA-CCR and SBM-DEA model. Source: Own elaboration.
Energies 16 00461 g011
Figure 12. Efficiency of road freight transport sectors in EU countries in 2019 according to the SBM-DEA model. Source: Own elaboration.
Energies 16 00461 g012
Figure 13. Eco-efficiency of road freight transport sector in EU countries versus GDP per capita. Source: Own elaboration.
Energies 16 00461 g013
Figure 14. Final consumption of energy by road freight transport sector in the EU (2019, Mtoe). Source: Own elaboration.
Energies 16 00461 g014
Figure 15. Proposals for changes in energy consumption in the road freight transport sector. Source: Own elaboration.
Energies 16 00461 g015
Table 1. Efficiency of energy consumption and efficiency of greenhouse gas emissions from road freight transport in the EU in the years 2010–2019.
CountryEnergy Consumption
[kg Oil Equivalent/tkm]
Change of Energy Consumption [%]GHG Emission
[g CO2 Equivalent /tkm]
Change of GHG Emissions [%]
201020192019/2020201020192019/2010
AT0.260.31118764897117
BE0.240.24100671718107
BG0.130.16126386476123
CY0.700.8011421162502118
CZ0.110.17154328479146
DE0.160.17106469512109
DK0.270.2699812816100
EE0.120.17138374487130
EL0.220.188464453984
ES0.140.128239933985
FI0.130.1310140636690
FR0.230.24107688716104
HR0.210.178061550983
HU0.120.13113344389113
IE0.340.3293101593492
IT0.200.24118626708113
LT0.070.045421111454
LU0.250.29116725834115
LV0.100.077428321175
NL0.140.1510544543497
PL0.080.067723318680
PT0.170.18105517546106
RO0.170.105954529755
SE0.190.157952735267
SI0.110.087232623472
SK0.080.079523622395
UK0.260.249376168790
Max0.70.815421162502146
Mean0.190.29957357497
Min0.070.045421111454
Source: Own elaboration based on European Environment Agency (https://www.eea.europa.eu/data-and-maps, accessed on 9 September 2022) and Eurostat (https://ec.europa.eu/eurostat/en/web/main/data/database, accessed on 9 September 2022).
Table 2. Application of the DEA method in transport—a list of selected studies.
Authors, YearSubject of StudyDEA Model
RoadRailAirSeaPublic TransportationTransportation System/SectorEnergy and/or Environmental Efficiency of TransportationCCRBCCSBMOther
Cook et al. (1991) [36]x xx
Rouse et al. (1997) [37]x xx
Cook et al. (2001) [38]x x
Hilmola (2007) [39] x x
Rassafi, Vaziri (2007) [40]xxxx x
Barros, Dieke (2008) [41] x xx
Sampaio et al. (2008) [42] x x
Michaelides et al. (2009) [43] x x
Rouse, Chiu (2009) [44]x x
Savolainen, Hilmola (2009) [45] xx x
Söderberg (2009) [46] x x
Wang, Tsai (2009) [47]x xx
Cruijssen et al. (2010) [48]x xx
Jitsuzumi, Nakamura (2010) [49] x x
Sun et al. (2010) [50] x x
Hilmola (2011) [51] x x
Chen, Han (2012) [52] x x
Lee et al. (2012) [53]x xx
Leal et al. (2012) [54]x xx
Chang et al. (2013) [22] xx x
Chang et al. (2014) [55] x x
Çipil (2014) [56] x
Chen (2014) [57] x xx
Vaidya (2014) [58] x x
Baran, Górecka (2015) [59] x xx
Song et al. (2015) [23] x x
Zhang, Wei (2015) [60] x x
Azadeh et al. (2016) [61] x x
Azadeh et al. (2016) [62]x xx
Chu et al. (2016) [63] x x
Kleinová (2016) [64] x x
Li et al. (2016) [65]x x
Min, Joo (2016) [66] x x
Song et al. (2016) [67]x x x
Wanke, Barros (2016) [68] xx x
Wu et al. (2016) [69]x xx
Wu et al. (2016) [70] xx
Liu et al. (2017) [25]xx x
Wang, He (2017) [71] x x
Chang et al. (2018) [72] x x
Baran, Górecka (2019) [33]xx x x
Domagała (2019) [73] x x
Yang et al. (2019) [74] x x
Tang et al. (2019) [75] x x
Yang et al. (2021) [76] x x
Romero-Ania et al. (2022) [77] x x
Source: Own elaboration.
Table 3. Statistical description of selected output and input variables.
Inputs and OutputsVariableUnitMaxMinMeanStd. Dev.
Non-energy inputx1–laborThousands of persons4812133144
x2–stock of registered vehiclesNumber of vehicles70134714941884
x3–length of road networkKm1,104,0872914181,015233,710
Energy inputx4–energy consumptionThousand tonnes of oil equivalent (thousand toe)53,20769011,42214,301
Desirable outputy1–turnoverMillion Euro52,73919514,44816,167
y2–haulage by vehicles registered in the reporting countryMillion tonne-kilometer (million tkm)348,95285873,35993,236
Undesirable outputy3–GHG emissionMillion tonnes CO2 equivalent16023342
Source: Own elaboration.
Table 4. The reference set (lambda) for inefficient road freight transport sectors.
Countries with an Inefficient Road Freight Transport SectorEfficient Road Freight Transport Sectors (Benchmarks)
LTLUNLSIPT
AT 0.39
CY 0.010.02
CZ1.38 0.01
EE0.15 0.02
EL0.09 0.97
ES1.22 0.197.15
FI0.06 0.170.60
FR0.83 1.88
HR0.22 0.02
HU0.57 0.09
IE0.12 0.08
IT 7.581.49 0.25
LV0.28
RO0.820.710.18
SE0.37 0.36
SK0.39 0.56
UK2.34 0.53
Source: Own elaboration.
Table 5. Summary of average excess in inputs.
Road Freight Transport Sector in
a Country
LabourStock of Registered VehiclesLength of Road NetworkEnergy Consumption
Projection [Thous. of Persons]Change
[%]
Projection
[Number of Vehicles]
Change
[%]
Projection
[km]
Change
[%]
Projection
[Thous. Toe]
Change
[%]
AT52−18425−1755,062−574087−50
CY1−428−931529−8893−87
CZ1310203−72101,838−222987−54
EE17041−6913,690−77507−38
EL370125−9144,145−632029−61
ES34901198−77391,154−4118,044−38
FI450258−6050,622−352992−23
FR326−162156−69324,962−7121,356−4
HR22−1446−7617,730−34600−72
HU66−21181−7054,840−752168−55
IE23−8109−7020,925−791141−71
IT275−222346−46235,090033,1400
LV26−138−5820,429−70580−4
RO106−35336−6986,39105052−19
SE820442−3477,737−614530−30
SK530117−6449,603−141857−2
UK289−1893−81244,113−4210,343−73
Source: Own elaboration.
Table 6. Recommendations for increasing or decreasing the output for the road freight transport sectors by EU countries to improve efficiency.
Undesirable OutputDesirable Output
Road Freight Transport Sector in a CountryGHG EmissionTurnoverHaulage by Vehicles Registered in the Reporting Country
CurrentProjectionChangeCurrentProjectionChangeCurrentProjectionChange
[Million Tonnes CO2 Equivalent][%][Million Euro][%][Million tkm][%]
AT23.711.7−5198019801026,44427,0222
BE25.025.0012,61612,616034,82934,8290
BG9.89.8044304430020,55120,5510
CY2.10.3−8719519508588580
CZ18.78.8−5396879687039,05974,09890
DE159.7159.7047,43747,4370311,875311,8750
DK12.212.2064136413014,99114,9910
EE2.31.5−371496149604794940796
EL15.26.0−61265837804228,19728,1970
ES84.553.1−3736,21336,2130249,559249,5590
FI10.58.7−1864966496028,84828,8480
FR124.661.4−5152,73952,7390174,061174,0610
HR6.41.8−7218351835012,47712,4770
HU14.46.3−5662496249036,95136,9510
IE11.63.3−7229632963012,44412,4440
IT97.795.4−250,28250,2820137,986166,37621
LT6.16.1067726772053,11753,1170
LU6.26.20150915090738173810
LV3.21.7−46155619082314,96514,9650
NL29.929.9024,99924,999068,92368,9230
PL64.864.8038,25138,2510348,952348,9520
PT16.916.9063256325031,01431,0140
RO18.214.6−1911,04411,044061,04161,0410
SE15.013.0−1311,54711,547042,60444,6945
SI5.65.6032523252024,01124,0110
SK7.65.5−2842284434533,94133,9410
UK110.430.0−7329,09529,0950160,831160,8310
Source: Own elaboration.
Table 7. Pearson’s correlation (r) between eco-efficiency of road freight transport and GDP per capita in EU countries.
VariableGDP per capitaEnergy ConsumptionGHG EmissionEco-Efficiency Measured by SBM-DEA
GDP per capita1.00
Energy consumption0.311.00
GHG emission0.281.001.00
Eco-efficiency measured by SBM-DEA0.27−0.37−0.361.00
Source: Own elaboration.
Disclaimer/Publisher’s Note: The statements, opinions and data contained in all publications are solely those of the individual author(s) and contributor(s) and not of MDPI and/or the editor(s). MDPI and/or the editor(s) disclaim responsibility for any injury to people or property resulting from any ideas, methods, instructions or products referred to in the content.

