
Partial Discharge Detection and Defect Location Method in GIS Cable Terminal

 and
and
Abstract
:1. Introduction
2. Methods
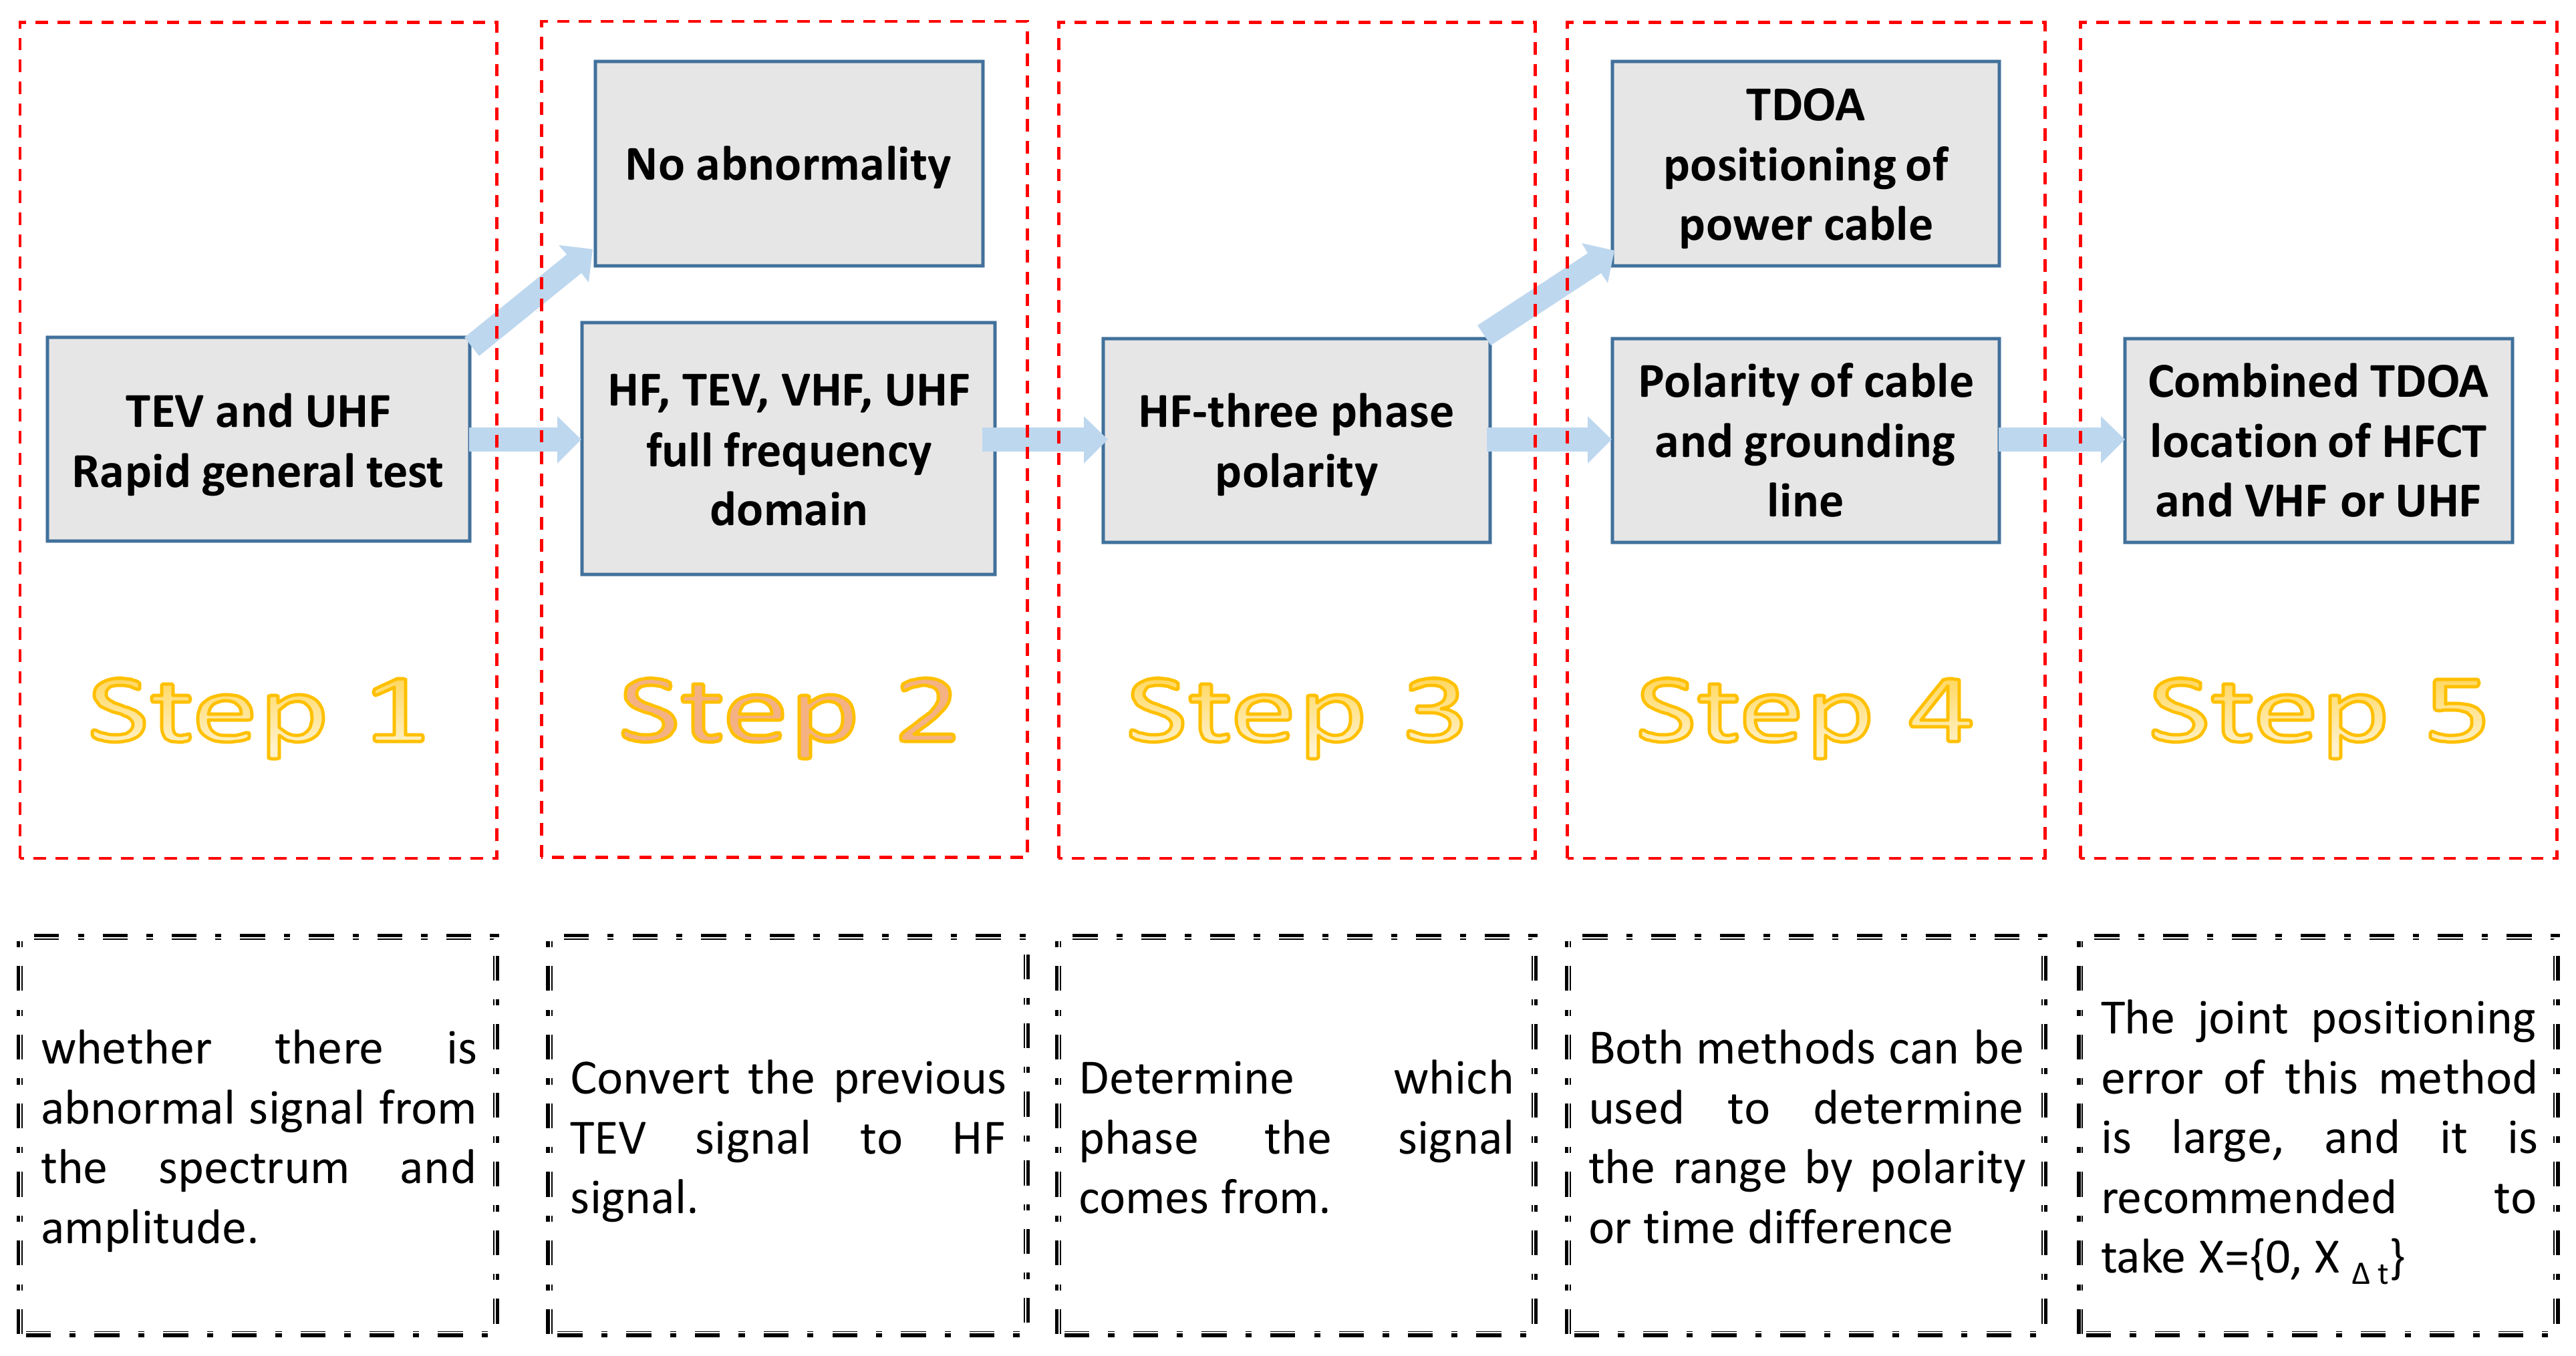
- (1)
- TEV and UHF methods are used first to complete a rapid general test, and preliminarily judge whether there is an abnormal signal according to the signals of transient voltage pulse and ultra-high frequency electromagnetic wave. During the general TEV test, the TEV sensor should be put in the middle of the host top to ensure that the contact surface with the equipment is as large as possible.
- (2)
- If any suspicious abnormal signal is found, the full spectrum detection should be used for retesting and the abnormal TEV signal can be converted into an HF signal.
- (3)
- Based on the polarity of the three-phase waveform of the abnormal HF signal, the phase source can be determined. During polarity detection and judgment, it should be ensured that all channels use the same cable model (BNC or N type) and the same cable length. The signals of each phase must be triggered separately to judge the possibility of multi-phase (point) discharge.
- (4)
- If the abnormal signal comes from one phase, the time difference of arrival (TDOA) positioning for the abnormal phase is carried out. If there is no difference in the three-phase signal polarity, the three-phase signal polarity should be compared with that of the grounding wire to determine whether it is from ground grid interference. During TDOA positioning, the length and model of signal line should be consistent. Various amplifiers should be connected to ensure that the signals of each channel are original.
- (5)
- The TDOA positioning results of the HF, VHF and UHF methods should be comprehensively compared. As the range error of the positioning results may be large, it is recommended to take the local discharge position as X = {0, XΔ t}. The amplifier must not be connected in this step, otherwise an additional cable length (between the amplifier and the oscilloscope) will be introduced, causing a time-difference calculation error.
3. Results
3.1. Case 1
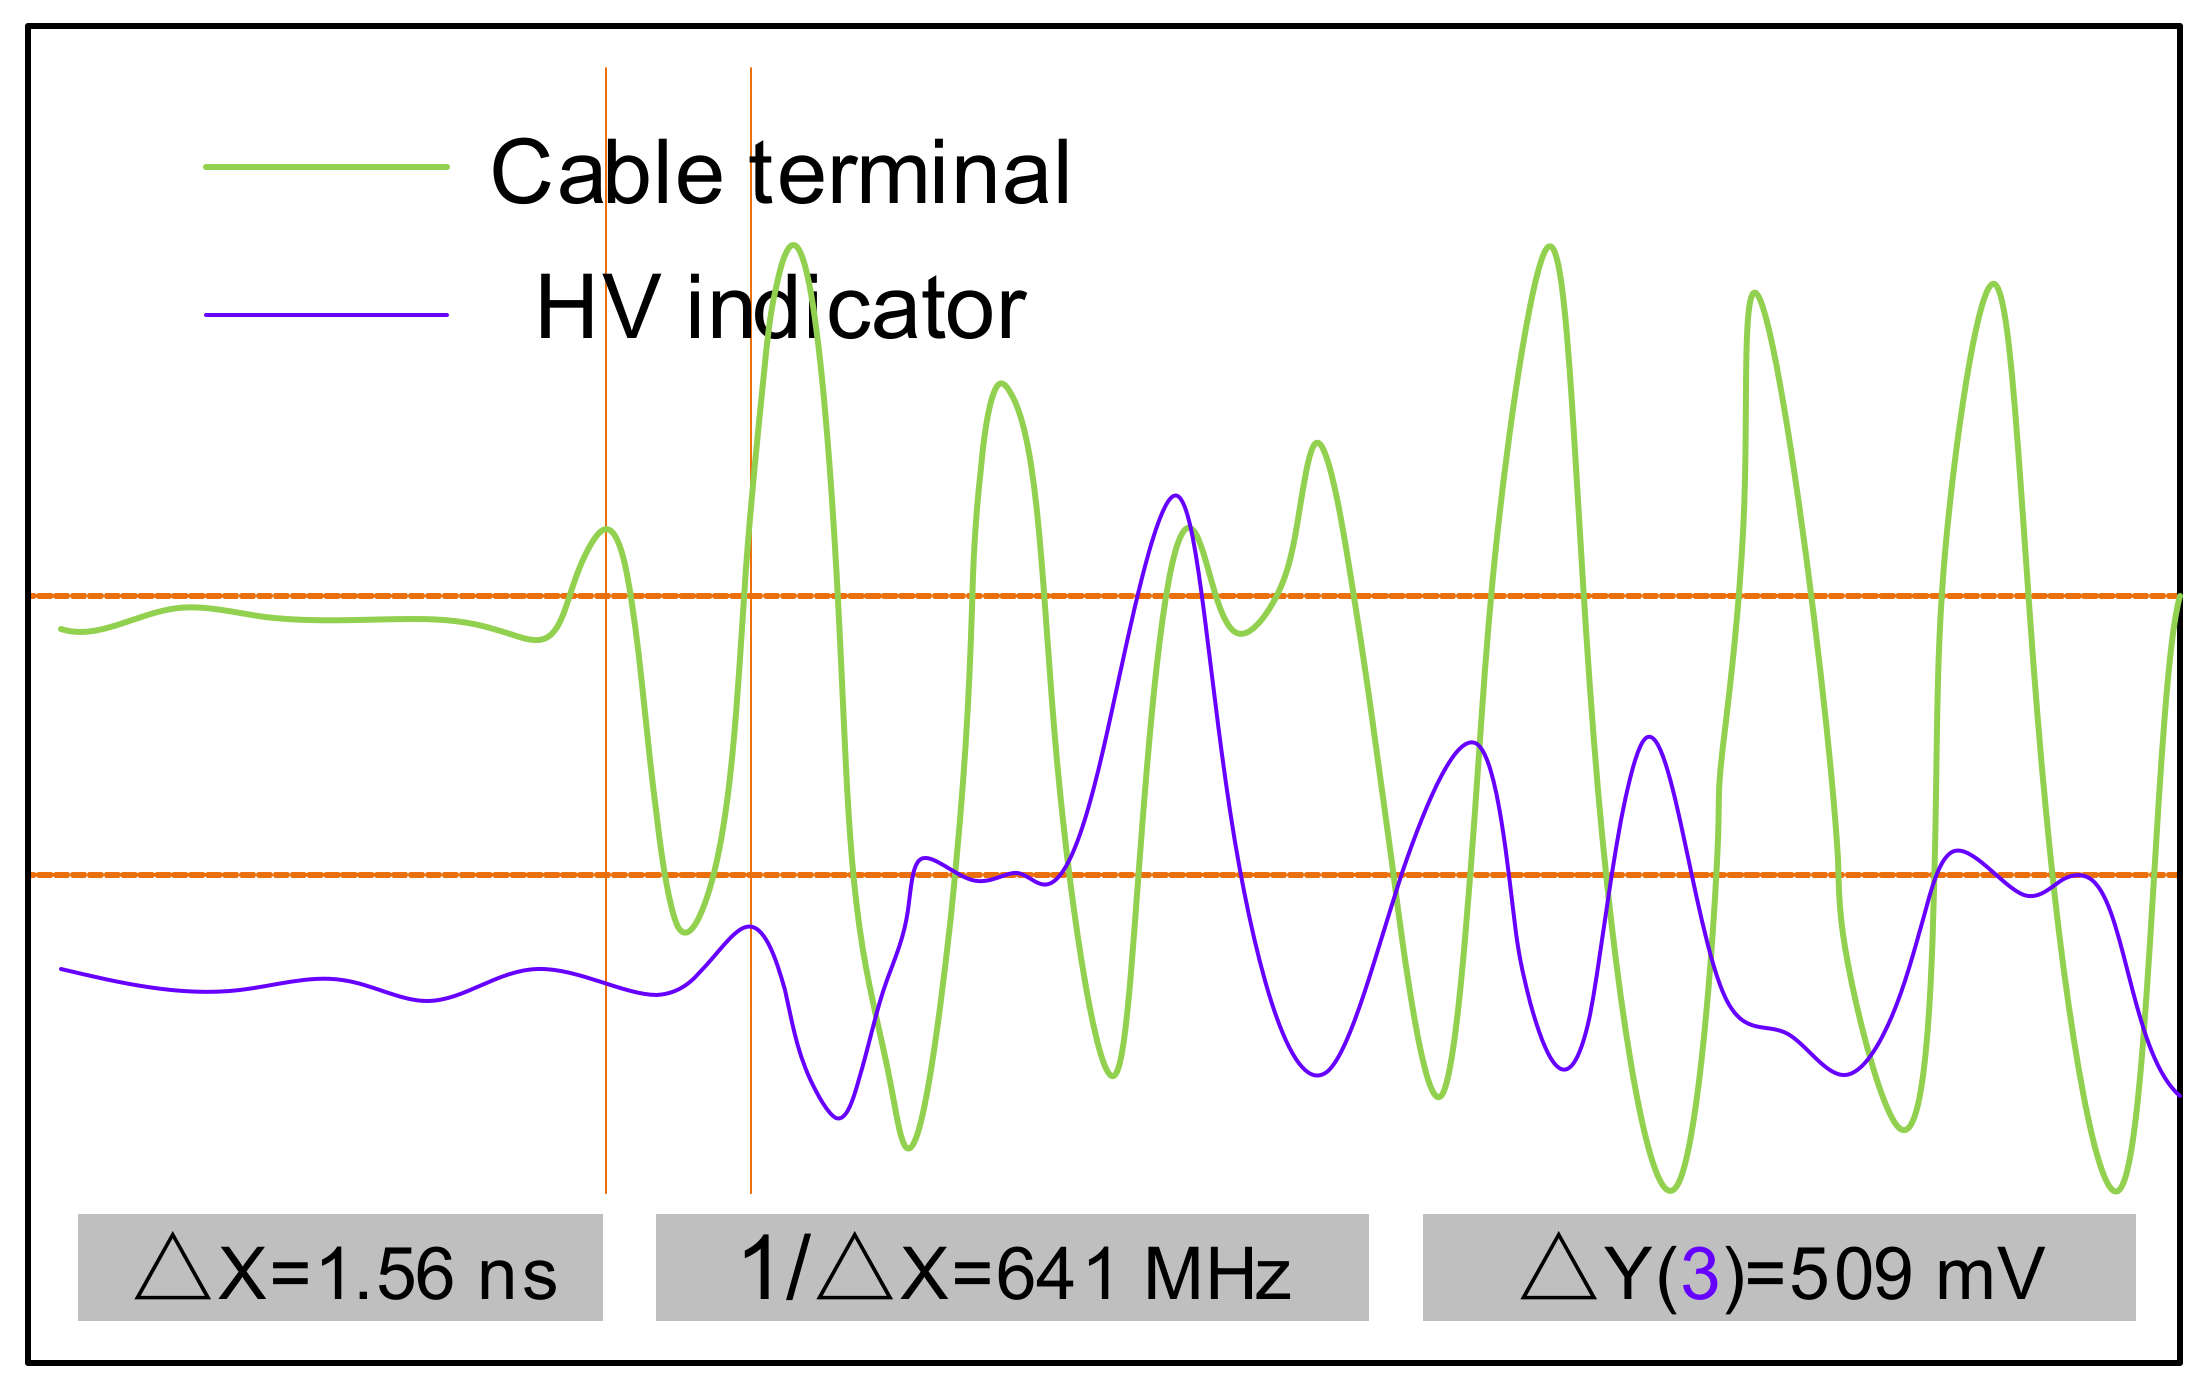
3.1.1. Partial Discharge Characteristics and Location
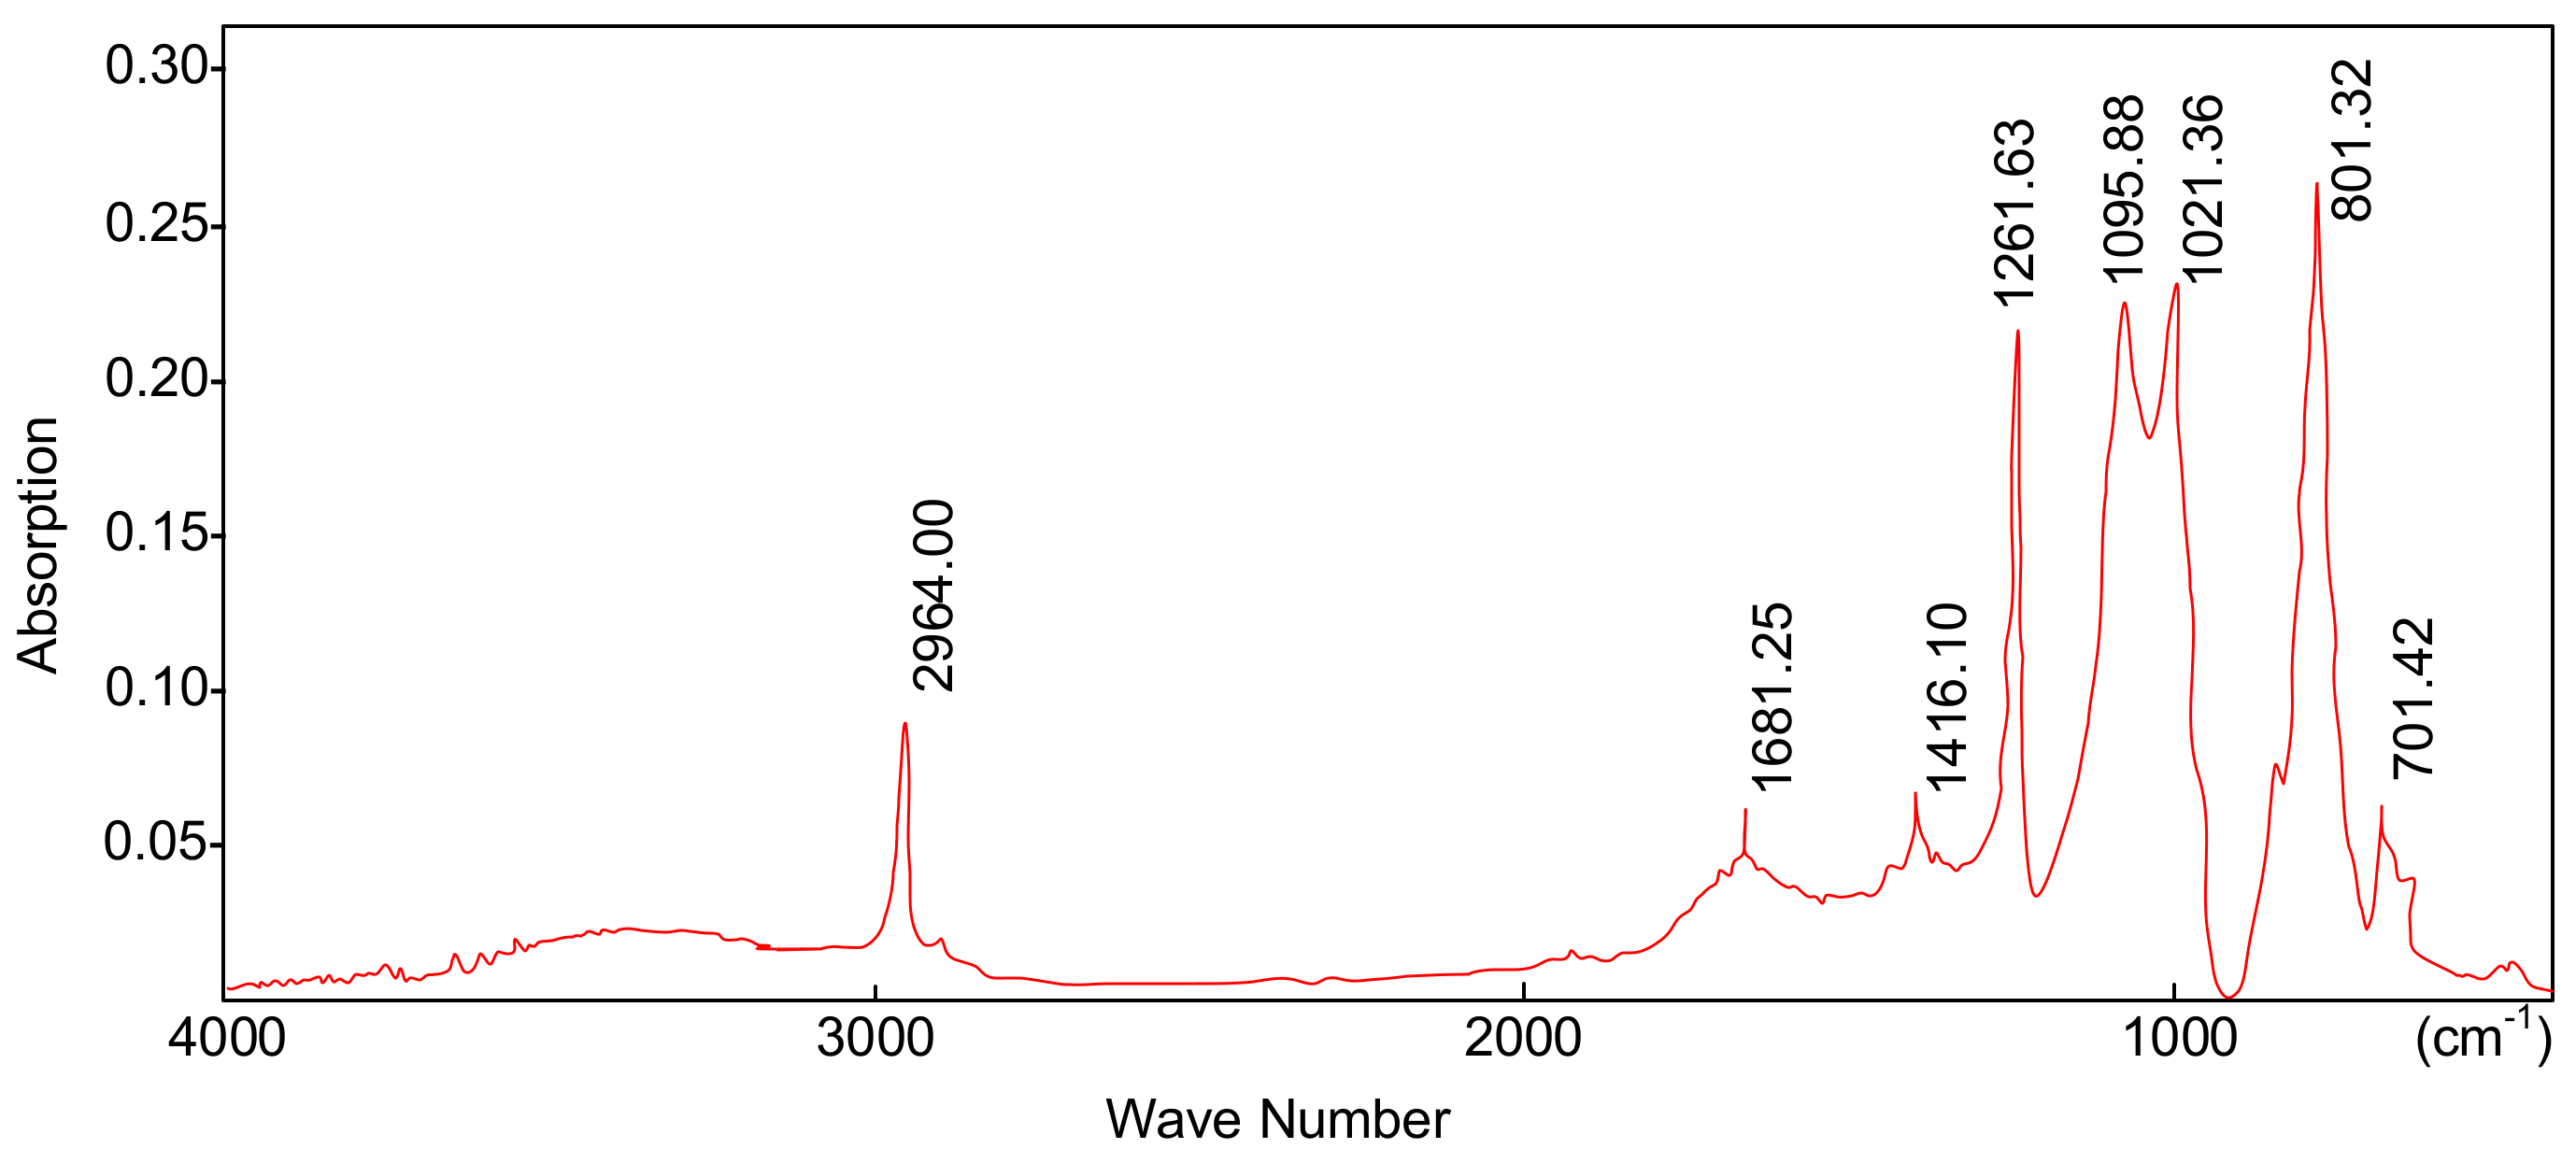
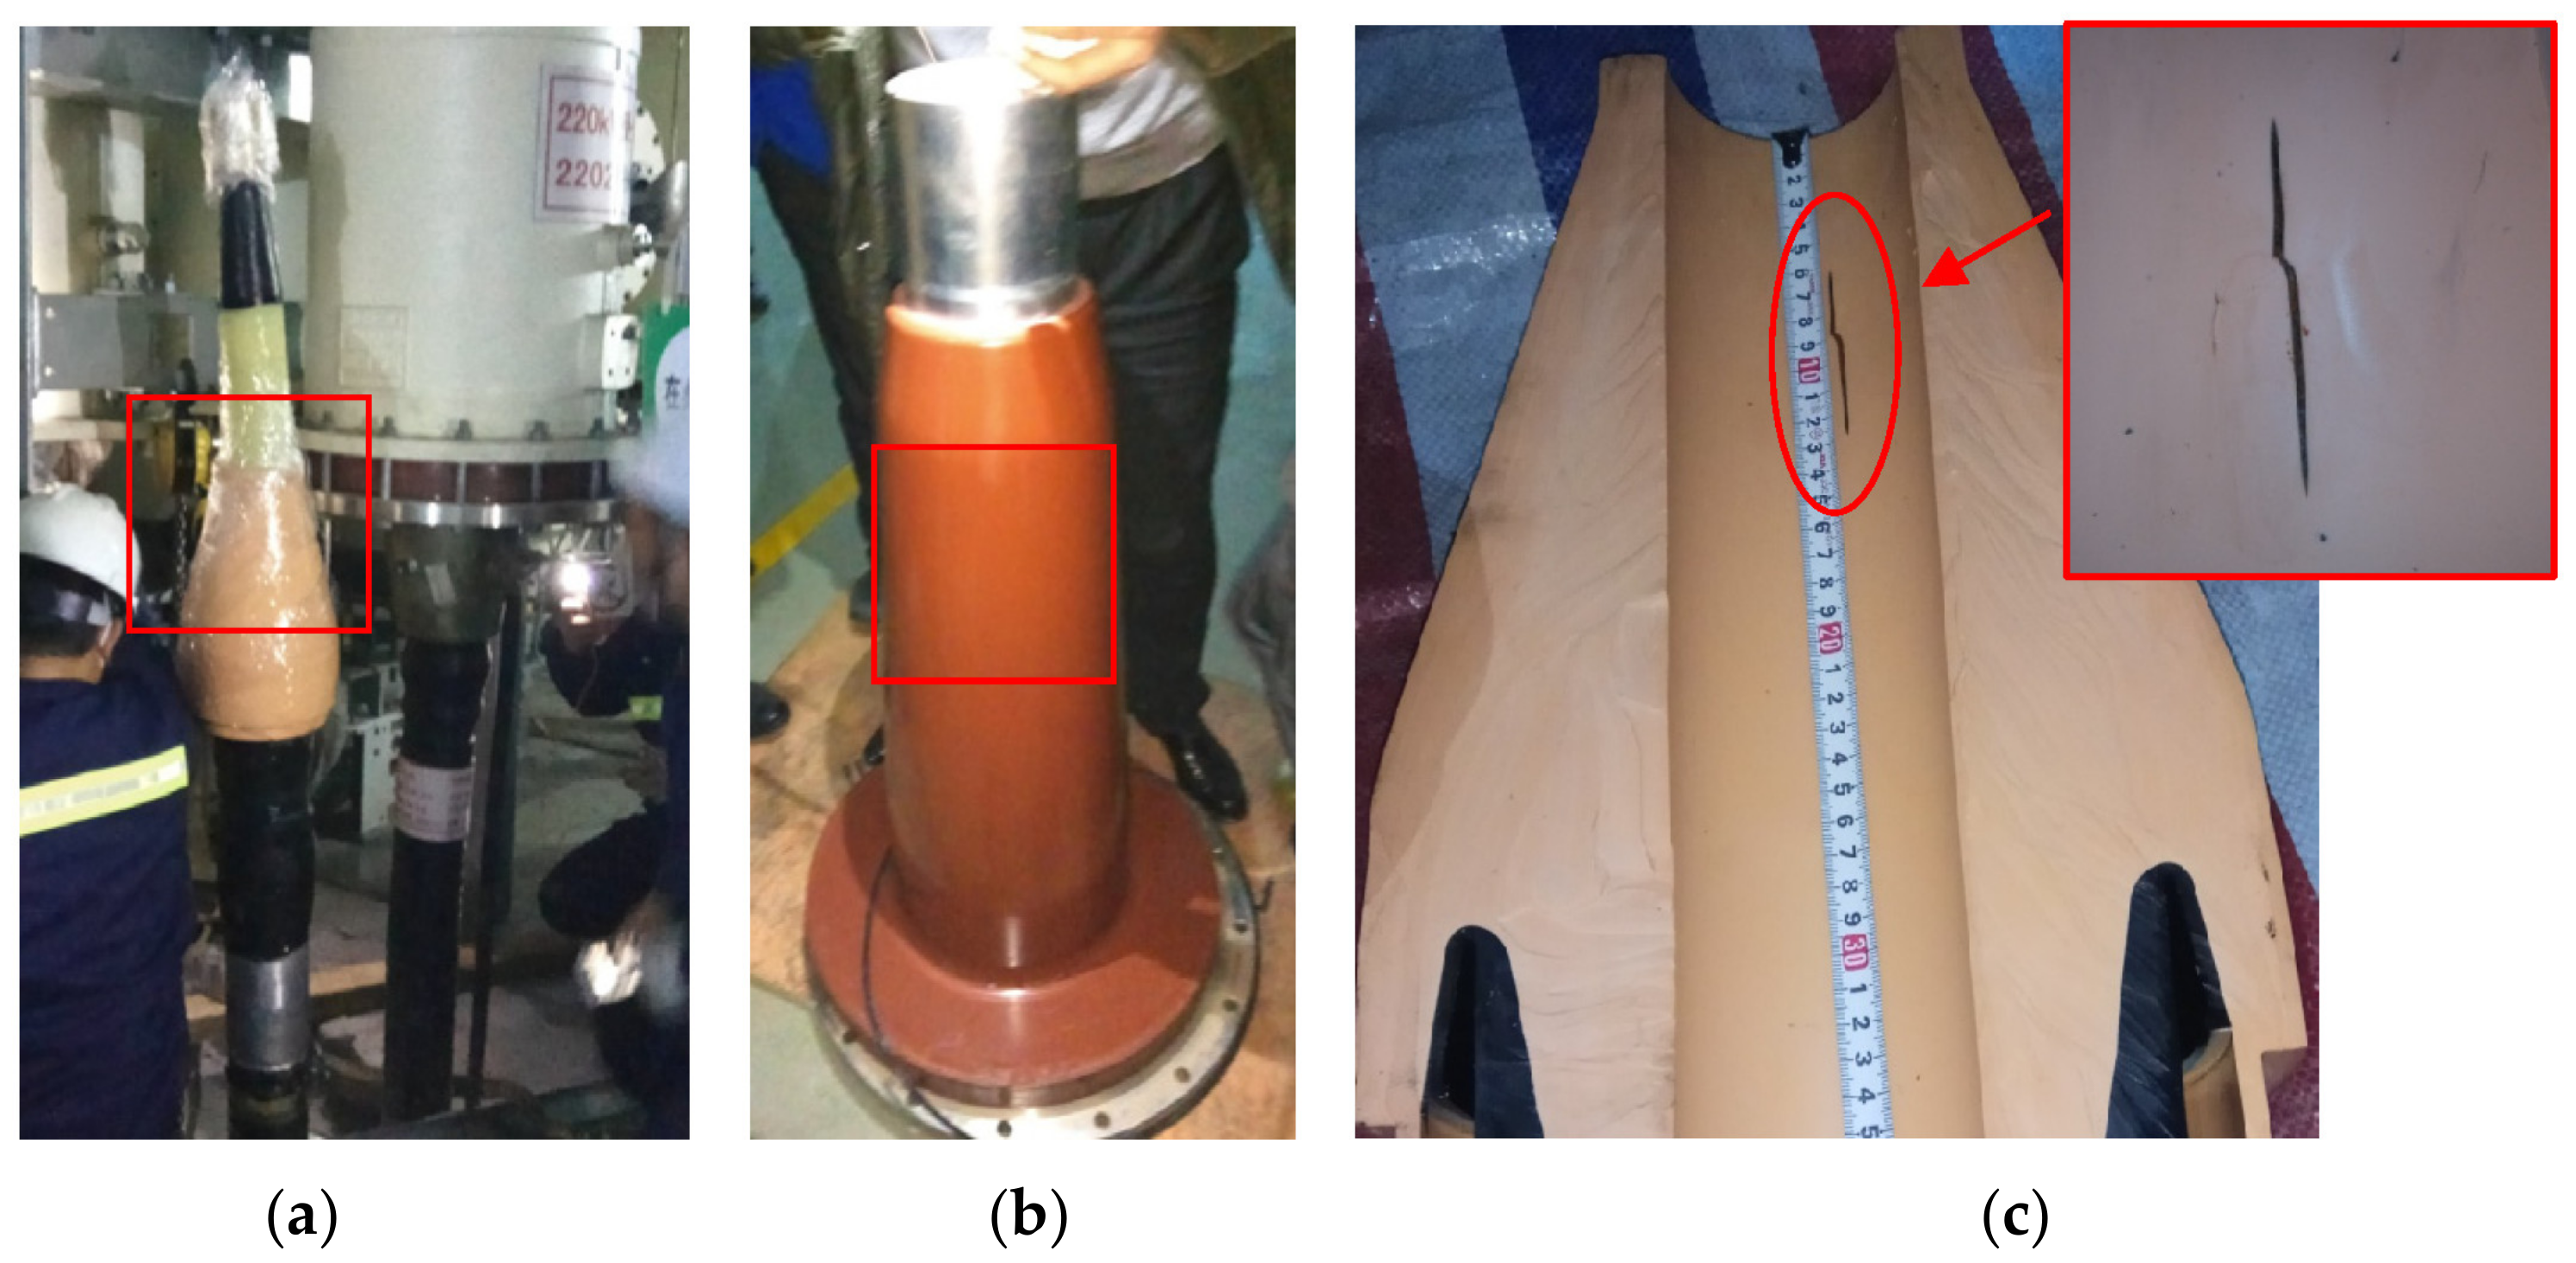
3.1.2. Disassembly Verification
3.2. Case 2
3.2.1. Partial Discharge Characteristics and Location
3.2.2. Disassembly Verification
4. Discussion
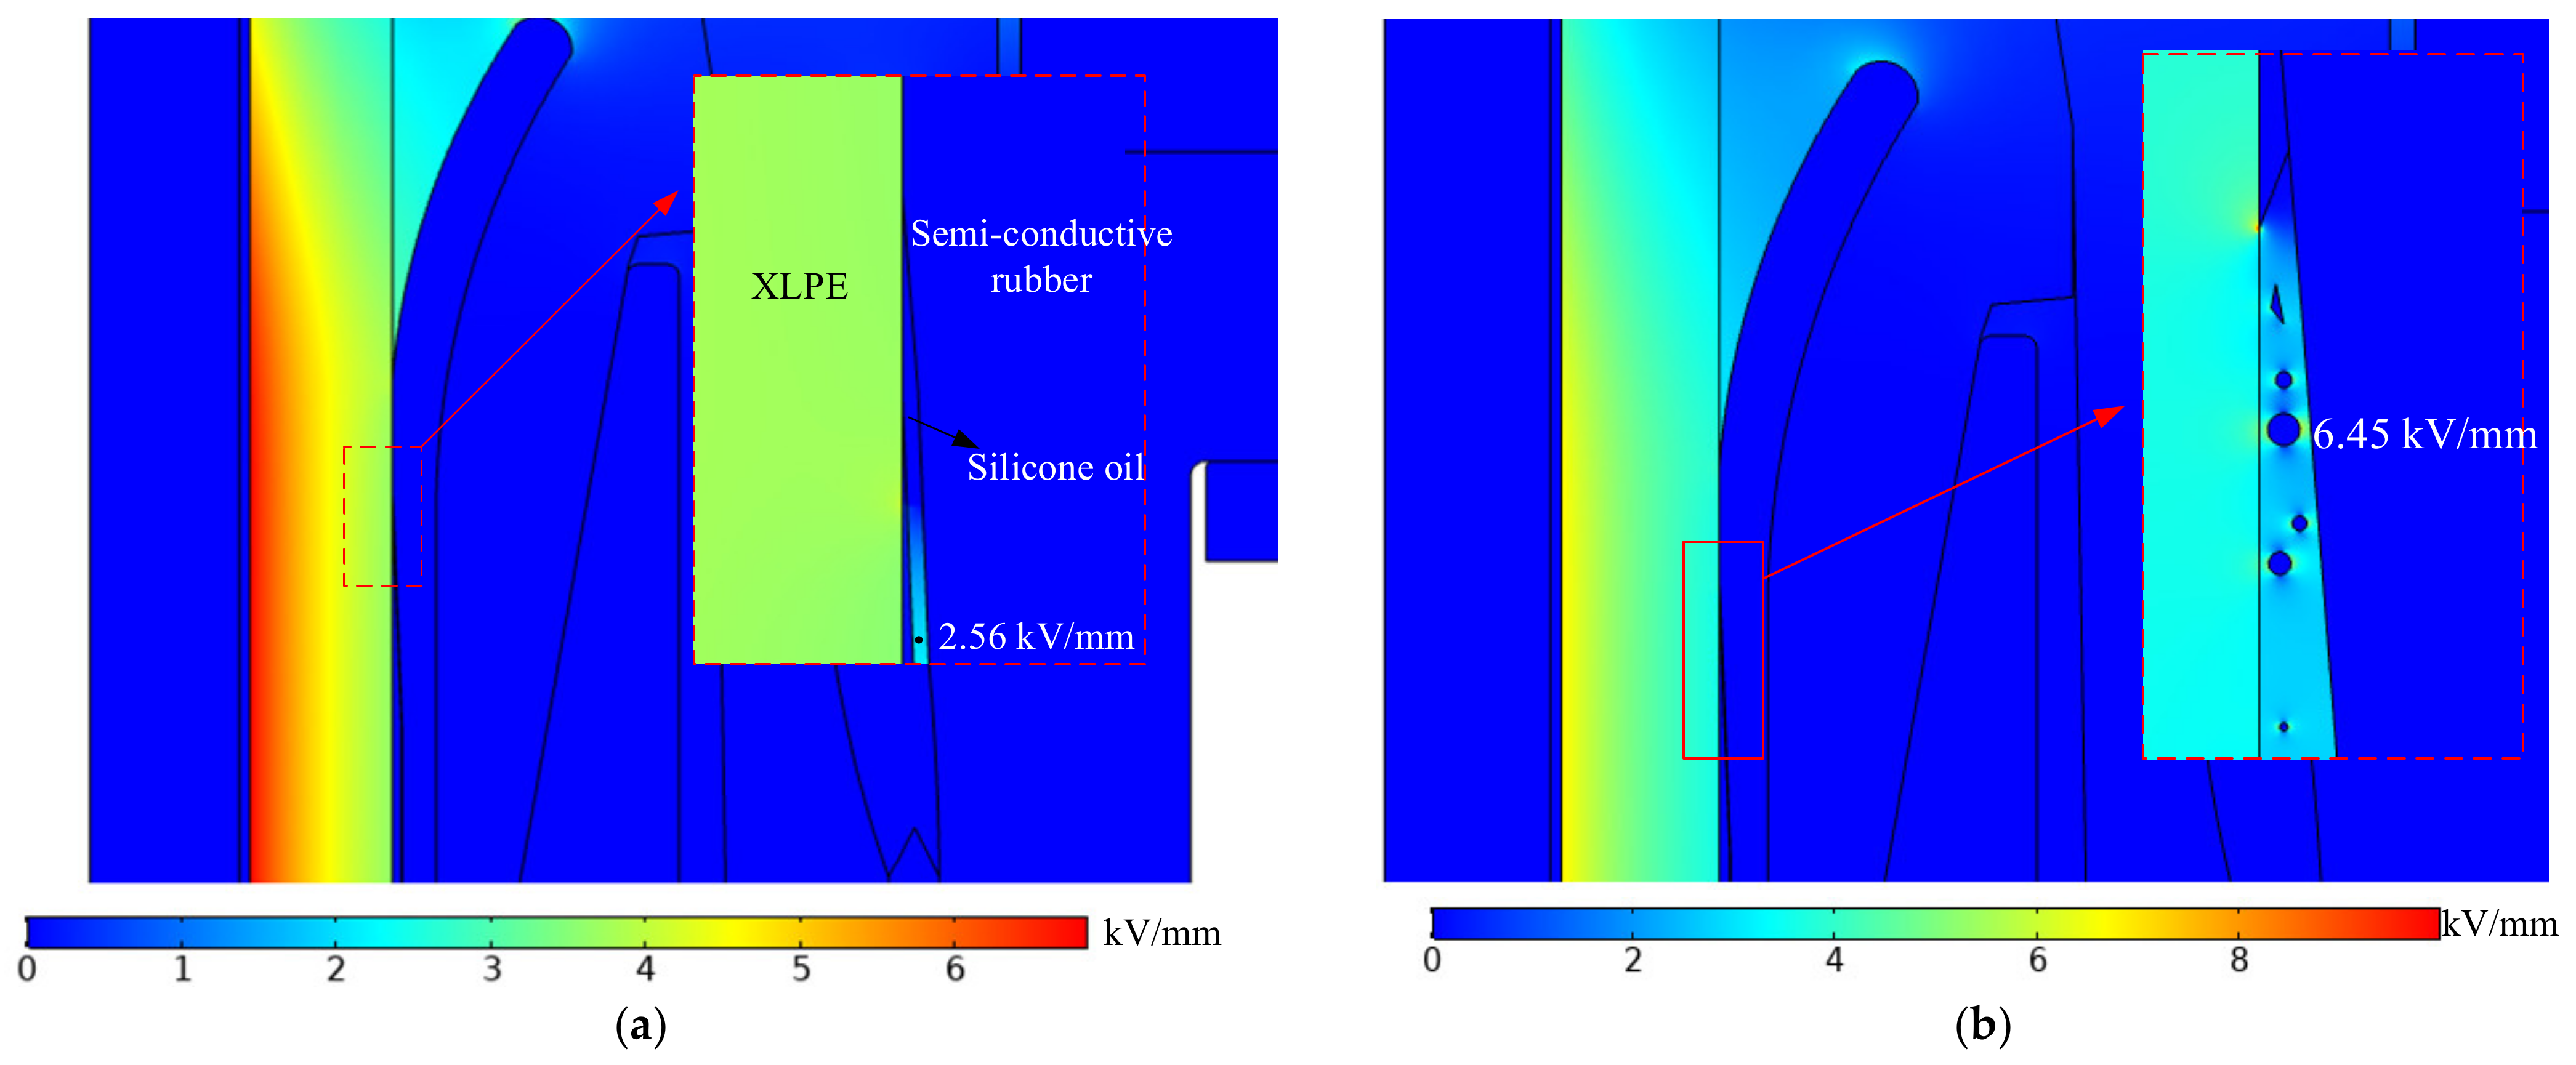
4.1. Electric Field Distribution
4.2. Internal Discharge Development Mechanism
4.2.1. Stage I: Development from Surface Discharge
4.2.2. Stage II: Enhanced Partial Discharge
5. Conclusions
- (1)
- A diagnosis scheme suitable for a GIS cable terminal is proposed, which can effectively determine the type and phase sequence of discharge defects, and accurately locate and analyze the defect source at ultra-high voltage.
- (2)
- The disassembly analysis of the GIS cable terminals showed the accuracy and effectiveness of the discharge defects and positioning methods, which provided a typical detection demonstration for GIS cable terminal-defect diagnosis. However, the sensitivity of this scheme to detect partial discharge at the initial stage of internal terminal faults needs to be improved.
- (3)
- The electric field distribution of the GIS cable terminal was analyzed by finite element simulation, and the mechanism of the internal fault of the cable terminal was analyzed.
Author Contributions
Funding
Data Availability Statement
Conflicts of Interest
References
- Li, J.; Liang, H.; Chen, Y.; Du, B. Promising Functional Graded Materials for Compact Gaseous Insulated Switchgears/Pipelines. High Volt. 2020, 5, 231–240. [Google Scholar] [CrossRef]
- Zheng, J.; Chen, Z.; Wang, Q.; Qiang, H.; Xu, W. GIS Partial Discharge Pattern Recognition Based on Time-Frequency Features and Improved Convolutional Neural Network. Energies 2022, 15, 7372. [Google Scholar] [CrossRef]
- Nadolny, Z. Electric Field Distribution and Dielectric Losses in XLPE Insulation and Semiconductor Screens of High-Voltage Cables. Energies 2022, 15, 4692. [Google Scholar] [CrossRef]
- Bakhshizadeh, M.K.; Vilmann, B.; Kocewiak, Ł. Modal Aggregation Technique to Check the Accuracy of the Model Reduction of Array Cable Systems in Offshore Wind Farms. Energies 2022, 15, 7996. [Google Scholar] [CrossRef]
- Arsenyev, D.; Dubitsky, S.; Kiesewetter, D.; Malyuin, V. Numerical Simulation and Calculation of Resistance of Laminated Paper-Impregnated Insulation of Power Cables. Energies 2022, 15, 7403. [Google Scholar] [CrossRef]
- Li, J.; Wang, Y.; Song, P.; Zhu, W.; Liang, H.; Du, B. Dynamic Interface Charge Behaviors in HVDC Cable Terminal Considering Carrier Dynamic Equilibrium. IEEJ Trans. Fundamen. Mater. 2021, 141, 567–573. [Google Scholar] [CrossRef]
- Zhao, X.; Yang, X.; Gao, L.; Li, Q.; Hu, J.; He, J. Tuning the potential distribution of AC cable terminals by stress cone of nonlinear conductivity material. IEEE Trans. Dielectr. Electr. Insul. 2017, 24, 2686–2693. [Google Scholar] [CrossRef]
- Kim, S.; Lee, D.; Kim, J.; Lee, B. Numerical Analysis of Electric Field Characteristics and Interfacial Pressure of HVDC XLPE Cable Joint Considering Load Cycles. Energies 2022, 15, 4684. [Google Scholar] [CrossRef]
- Li, J.; Du, B.; Su, J.; Liang, H.; Liu, Y. Surface Layer Fluorination-Modulated Space Charge Behaviors in HVDC Cable Accessory. Polymers 2018, 10, 500. [Google Scholar] [CrossRef] [Green Version]
- Zhang, Z.P.; Zheng, C.J.; Zheng, M.; Zhao, H.; Zhao, J.K.; Sun, W.F.; Chen, J.Q. Interface Damages of Electrical Insulation in Factory Joints of High Voltage Submarine Cables. Energies 2020, 13, 3892. [Google Scholar] [CrossRef]
- Li, J.; Liu, S.; Song, P.; Du, B. Solidification Dynamics of Silicone Oil and Electric Field Distribution Within Outdoor Cable Terminations Subjected to Cold Environments. IEEE Trans. Power Deliv. 2022, 37, 4126–4134. [Google Scholar] [CrossRef]
- Panteli, M.; Mancarella, P. Influence of Extreme Weather and Climate Change on the Resilience of Power Systems: Impacts and Possible Mitigation Strategies. Electr. Power Syst. Res. 2015, 127, 259–270. [Google Scholar] [CrossRef]
- Panteli, M.; Mancarella, P. Modeling and Evaluating the Resilience of Critical Electrical Power Infrastructure to Extreme Weather Events. IEEE Syst. J. 2017, 11, 1733–1742. [Google Scholar] [CrossRef]
- Guo, C.; Ye, C.; Ding, Y.; Wang, P. Multi-State Model for Transmission System Resilience Enhancement Against Short-Circuit Faults Caused by Extreme Weather Events. IEEE Trans. Power Deliv. 2021, 36, 2374–2385. [Google Scholar] [CrossRef]
- Lemke, E. Analysis of the Partial Discharge Charge Transfer in Extruded Power Cables. IEEE Electr. Insul. Mag. 2013, 29, 24–28. [Google Scholar] [CrossRef]
- Mu, L.; Xu, X.; Xia, Z.; Yang, B.; Guo, H.; Zhou, W.; Zhou, C. Autonomous Analysis of Infrared Images for Condition Diagnosis of HV Cable Accessories. Energies 2021, 14, 4316. [Google Scholar] [CrossRef]
- Wang, H.; He, C.; Guo, R.; Meng, X.; Yuan, W.; Li, J. Partial Discharge Measurement and Analysis Under Lightning Impulse Superimposed DC Voltage in SF6 Gas. High Volt. 2022, 7, 744–752. [Google Scholar] [CrossRef]
- Jiang, J.; Chen, J.; Li, J.; Yang, X.; Albarracín-Sánchez, R.; Ranjan, P.; Zhang, C. Propagation and Localisation of Partial Discharge in Transformer Bushing Based on Ultra-High Frequency Technique. High Volt. 2021, 6, 684–692. [Google Scholar] [CrossRef]
- Zheng, Q.; Luo, L.; Song, H.; Sheng, G.; Jiang, X. Intelligent Learning Approach for UHF Partial Discharge Localisation in Air-Insulated Substations. High Volt. 2020, 5, 583–590. [Google Scholar] [CrossRef]
- Xing, C.; Zang, Q.; He, R.; Zhao, J.; Wang, L.; Dai, L.; Shi, R.; Wang, S.; Ma, G. Phase Stability Control of Optical Fiber Partial Discharge Ultrasonic Sensing System. Sensors 2022, 22, 8495. [Google Scholar] [CrossRef]
- Baug, A.; Choudhury, N.; Ghosh, R.; Dalai, S.; Chatterjee, B. Identification of Single and Multiple Partial Discharge Sources by Optical Method Using Mathematical Morphology Aided Sparse Representation Classifier. IEEE Trans. Dielectr. Electr. Insul. 2017, 24, 3703–3712. [Google Scholar] [CrossRef]
- Yang, J.; Yan, K.; Wang, Z.; Zheng, X. A Novel Denoising Method for Partial Discharge Signal Based on Improved Variational Mode Decomposition. Energies 2022, 15, 8167. [Google Scholar] [CrossRef]
- Stone, G.; Cavallini, A.; Behrmann, G. A Review of the History of the Development of Partial Discharge Testing. In Proceedings of the 2022 IEEE Electrical Insulation Conference (EIC), Knoxville, TN, USA, 19–23 June 2022; pp. 85–89. [Google Scholar]
- Liu, F.; Ding, D.; Chen, L.; He, L.; Zhu, J.; Ma, Q.; Zhang, H.; Zeng, H. Combined Diagnosis of GIS Cable Termination Based on Partial Discharge Detection with Multi Frequency Band. High Volt. Apparat. 2020, 56, 266–274. [Google Scholar]
- Tariq, R.; Alhamrouni, I.; Rehman, A.U.; Tag Eldin, E.; Shafiq, M.; Ghamry, N.A.; Hamam, H. An Optimized Solution for Fault Detection and Location in Underground Cables Based on Traveling Waves. Energies 2022, 15, 6468. [Google Scholar] [CrossRef]
- Li, G.; Chen, J.; Li, H.; Hu, L.; Zhou, W.; Zhou, C.; Li, M. Diagnosis and Location of Power Cable Faults Based on Characteristic Frequencies of Impedance Spectroscopy. Energies 2022, 15, 5617. [Google Scholar] [CrossRef]
- Cheng, X.; Tao, S.; Wang, W. The Partial Discharge Detection and Location as Well as Dissection of 110 kV XLPE Cable Terminal. Proc. CSEE 2013, 33, 226–230. [Google Scholar]


| Tests | Results | Remarks |
|---|---|---|
| UHV for GIS | Abnormal | Discharge by insulation defects |
| HV for cable | Normal | |
| Ultrasonic for GIS | Normal | |
| TEV | Normal | |
| PD location | Cable compartment | TDOA and amplitude |
| Decomposition gas detection | Normal |
| Position | PRPS | PRPD |
|---|---|---|
| Cable terminal |  |  |
| Basin spacer above CT |  |  |
| Tests | Results | Remarks |
|---|---|---|
| UHV for GIS | Abnormal | Discharge by insulation defects |
| HV for cable | Abnormal | Interference signal |
| Ultrasonic for GIS | Normal | |
| TEV | Normal | |
| PD location | Cable compartment | TDOA and amplitude |
| Decomposition gas detection | Normal |
| Position | PRPS | PRPD |
|---|---|---|
| Cable terminal |  |  |
| High-voltage indicating device |  |  |
Disclaimer/Publisher’s Note: The statements, opinions and data contained in all publications are solely those of the individual author(s) and contributor(s) and not of MDPI and/or the editor(s). MDPI and/or the editor(s) disclaim responsibility for any injury to people or property resulting from any ideas, methods, instructions or products referred to in the content. |
© 2022 by the authors. Licensee MDPI, Basel, Switzerland. This article is an open access article distributed under the terms and conditions of the Creative Commons Attribution (CC BY) license (https://creativecommons.org/licenses/by/4.0/).
Share and Cite
Li, S.; Song, P.; Wei, Z.; Li, X.; Tang, Q.; Meng, Z.; Li, J.; Liu, S.; Wang, Y.; Li, J. Partial Discharge Detection and Defect Location Method in GIS Cable Terminal. Energies 2023, 16, 413. https://doi.org/10.3390/en16010413
Li S, Song P, Wei Z, Li X, Tang Q, Meng Z, Li J, Liu S, Wang Y, Li J. Partial Discharge Detection and Defect Location Method in GIS Cable Terminal. Energies. 2023; 16(1):413. https://doi.org/10.3390/en16010413
Chicago/Turabian StyleLi, Songyuan, Pengxian Song, Zhanpeng Wei, Xu Li, Qinghua Tang, Zhengzheng Meng, Ji Li, Songtao Liu, Yuhuai Wang, and Jin Li. 2023. "Partial Discharge Detection and Defect Location Method in GIS Cable Terminal" Energies 16, no. 1: 413. https://doi.org/10.3390/en16010413