Review

Insulation Degradation Mechanism and Diagnosis Methods of Offshore Wind Power Cables: An Overview

1
School of New Energy and Power Engineering, Lanzhou Jiaotong University, Lanzhou 730070, China
2
School of Engineering, University of Southern Queensland, Brisbane 4702, Australia
3
Linxia Power Supply Company, State Grid Gansu Electrical Power Company, Linxia 731100, China
*
Authors to whom correspondence should be addressed.
Energies 2023, 16(1), 322; https://doi.org/10.3390/en16010322
Submission received: 28 November 2022 / Revised: 17 December 2022 / Accepted: 26 December 2022 / Published: 28 December 2022

Abstract

:
The marine environment in which offshore wind turbines are located is very complex and subjected to a variety of random loads that vary with time and space. As an important component of offshore wind power, the cable also bears the impact of the environment in which most of the turbines are located. Under the long-term action of mechanical stresses such as tension, torsion, and vibration, the cable insulation will crack due to stress fatigue leading to partial discharge, which seriously affects its electrical performance. The study of the mechanism of the change of electrical properties of cable insulation due to mechanical behavior is of great theoretical guidance to improve the reliable operation of cables. This paper first introduces the basic characteristics and operating conditions of torsion-resistant cables and submarine cables. Then the mechanical behavior of the cables is summarized, and the deterioration mechanism and deterioration effect of wind power cable insulation under the influence of multiple factors such as heat, oxygen, and mechanical stress are sorted out. Then, the basic principles of wind power cable operation condition monitoring methods and their characteristics are described. Finally, the relevant methods for the detection of hidden defects inside the insulation are summarized.

1. Introduction

Energy is the cornerstone of economic and social development and a fundamental guarantee for the survival of human society. In recent years, global climate change has been abnormal, resources are increasingly depleted, and countries are accelerating the development of new energy sources [1,2,3]. As a kind of new energy generation, wind power has many advantages and can effectively reduce environmental pollution and energy costs, so the wind power industry is developing rapidly, and the global installed capacity of wind power generation is increasing at a rate of more than 20% per year. China is rich in offshore wind energy resources, and offshore wind power generation is close to the load center, so the development prospect is very broad [4,5]. The rapid development of wind power generation has greatly stimulated the demand for cables, and the scale of cables for offshore wind power generation will increase significantly in the coming decades [6]. The main cables for offshore wind power generation are control cables concentrated inside the nacelle, torsion-resistant cables connected between the nacelle and the upper and lower parts of the tower, and submarine composite cables that transmit electrical energy to land.
Offshore wind farms raise the voltage usually using the two-stage step-up method, the wind turbine output voltage of 690 V through the box transformer to 35 kV, respectively through the 35 kV submarine cable convergence to 110 kV or 220 kV booster station, and then through the 110 kV or 220 kV submarine cable transmission to the shore, and finally connected to the grid.
For torsion-resistant cables, the electrical performance will be degraded during operation by various factors such as electrical, thermal, and mechanical. The main insulation of this part of the cable is made of ethylene propylene rubber (EPR). This is because EPR has high operational reliability, and its electrical and mechanical properties hardly degrade after water immersion. The main insulation of submarine cables is made of cross-linked polyethylene (XLPE), which has a simple structure, good heat resistance, high load capacity, and high mechanical strength.
Offshore wind power cable operating conditions are complex, as reflected in: on the one hand, in the wind turbine yaw process cable twists with the nacelle, frequent twisting makes the cable core and sheath between the formation of relative sliding, frequent friction leads to insulation and sheath aging accelerated, eventually leading to cable insulation damage, breakdown or serious damage to the outer sheath; on the other hand, the submarine cable work in a complex submarine environment, long-term exposure to ocean currents impact, the operation process will be subject to mechanical stresses, such as twisting, stretching, frictional vibration, etc., which will damage the insulation structure and water insulation capacity of the submarine cable, and then directly affect its electrical performance, threatening the normal operation of the submarine power transmission network [7,8]. The schematic diagram of cables for wind turbines is shown in Figure 1.
The study of the mechanism of cable insulation degradation and electrical performance change due to mechanical behavior is of great theoretical guidance to improve the reliable operation of cables. To this end, this paper introduces the characteristics and operating conditions of wind power cables, sorts out the research related to cable insulation deterioration under multiple stresses, and explains the ways of insulation aging, aging mechanisms, and aging effects. The current methods and research results in the field of cable insulation defect detection are summarized.

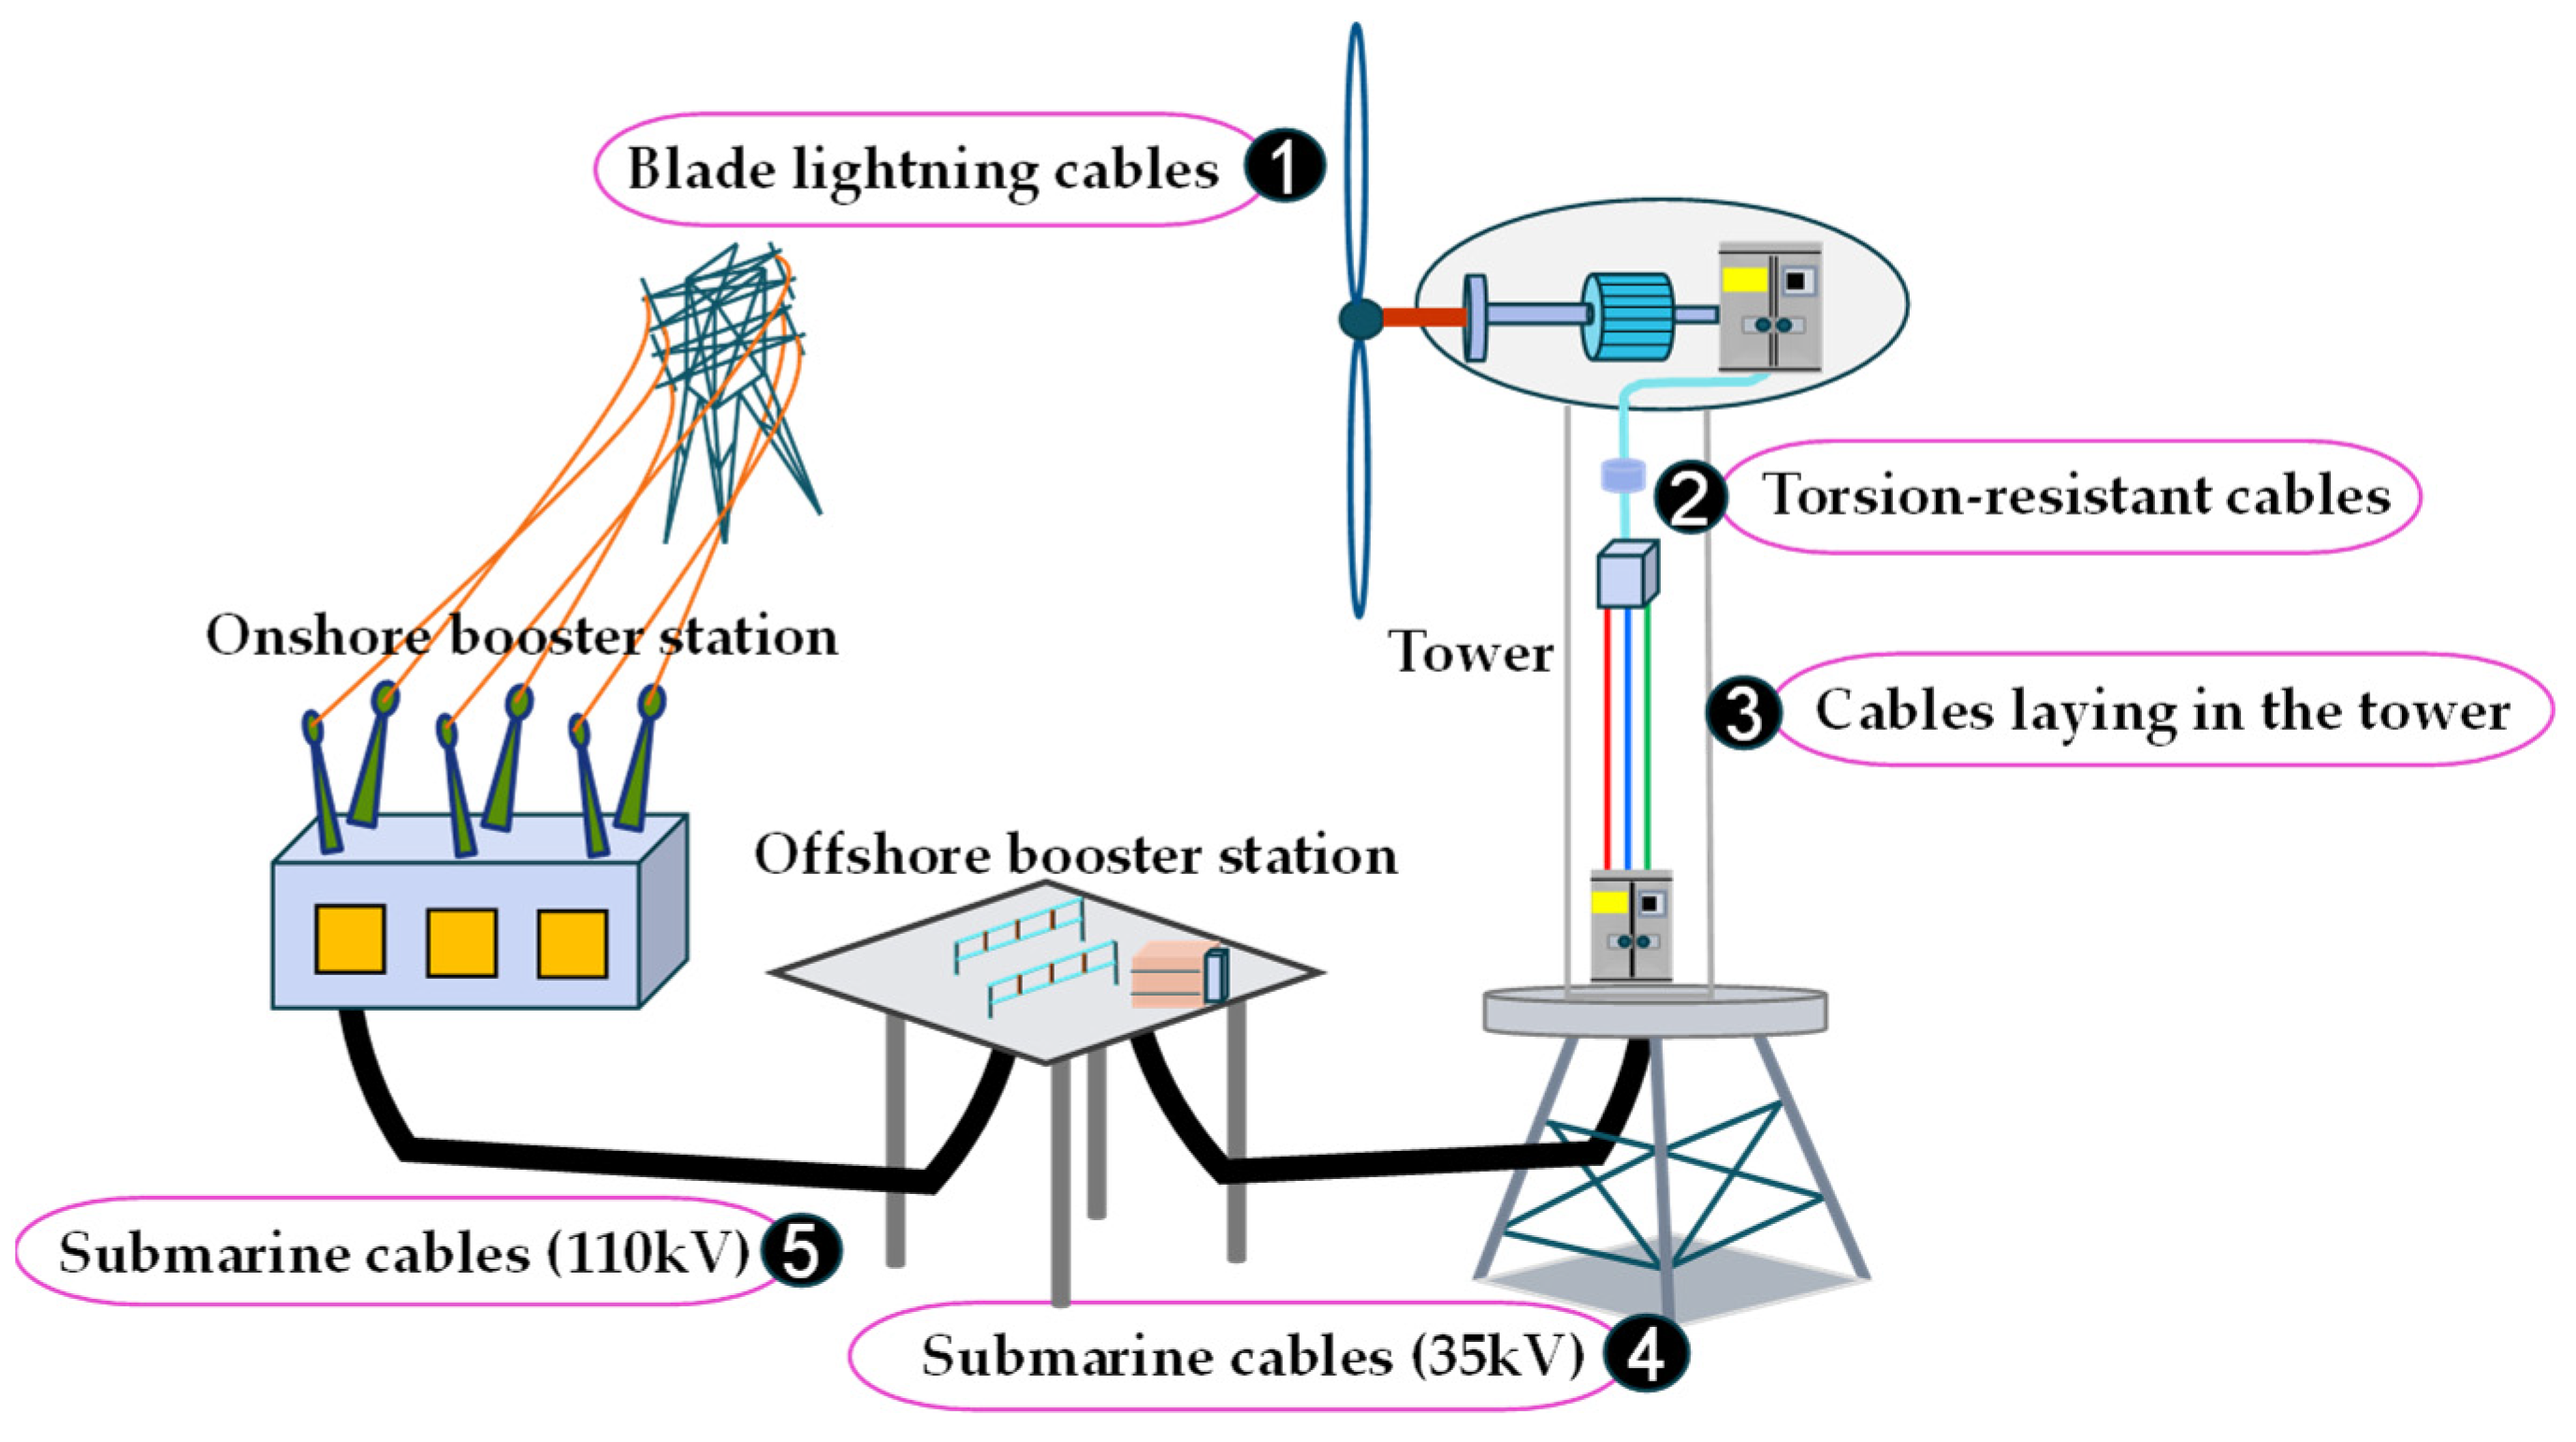
2. Overview of Offshore Wind Power Cables

2.1. Introduction to Cables for Blade Lightning Protection and Fixed Cables in Tower

Lightning strikes are a serious threat to the safe and stable operation of wind turbines. The blade is one of the important parts of a wind turbine, but also the most vulnerable to lightning strike components. In the event of a lightning strike, the blade lightning cable will lightning current discharge into the earth as far as possible to reduce the blade to bear the intensity of lightning current and time, to minimize losses. Wind turbine blade lightning cable is generally arranged in the blade internal, from the flash connector parts; to the blade root end. The cable core is made of copper, and the main insulation is made of polyvinyl chloride or cross-linked polyethylene. As the lightning current amplitude is huge, the blade lightning cable copper conductor cross-sectional area is generally 50~70 mm2 to ensure that when a lightning strike occurs, the huge lightning current will not make the blade temperature increase, to avoid the blade being damaged by the lightning current.
In wind turbines, except for the cables in the uppermost section of the tower, the other cables in the tower are fixed-laid. Unlike the cables in the nacelle and the upper section of the tower, the fixed-laying cables do not require the performance requirements of twist resistance, and the amount of tower cables is much larger than the number of cables in the nacelle. So the cable inside the tower can be replaced by aluminum core cable to reduce cost reduction. This part of the cable uses a new aluminum alloy wire structure, the outer diameter is smaller, has superior bending performance, and the outer diameter is smaller than the same current-carrying copper cable, lighter weight. This part of the cable is reliably fixed by the clamp plate installed on the inner wall of the tower when it is laid. Due to the long-term vibration of the wind turbine tower, this part of the cable also has to have excellent anti-vibration properties.

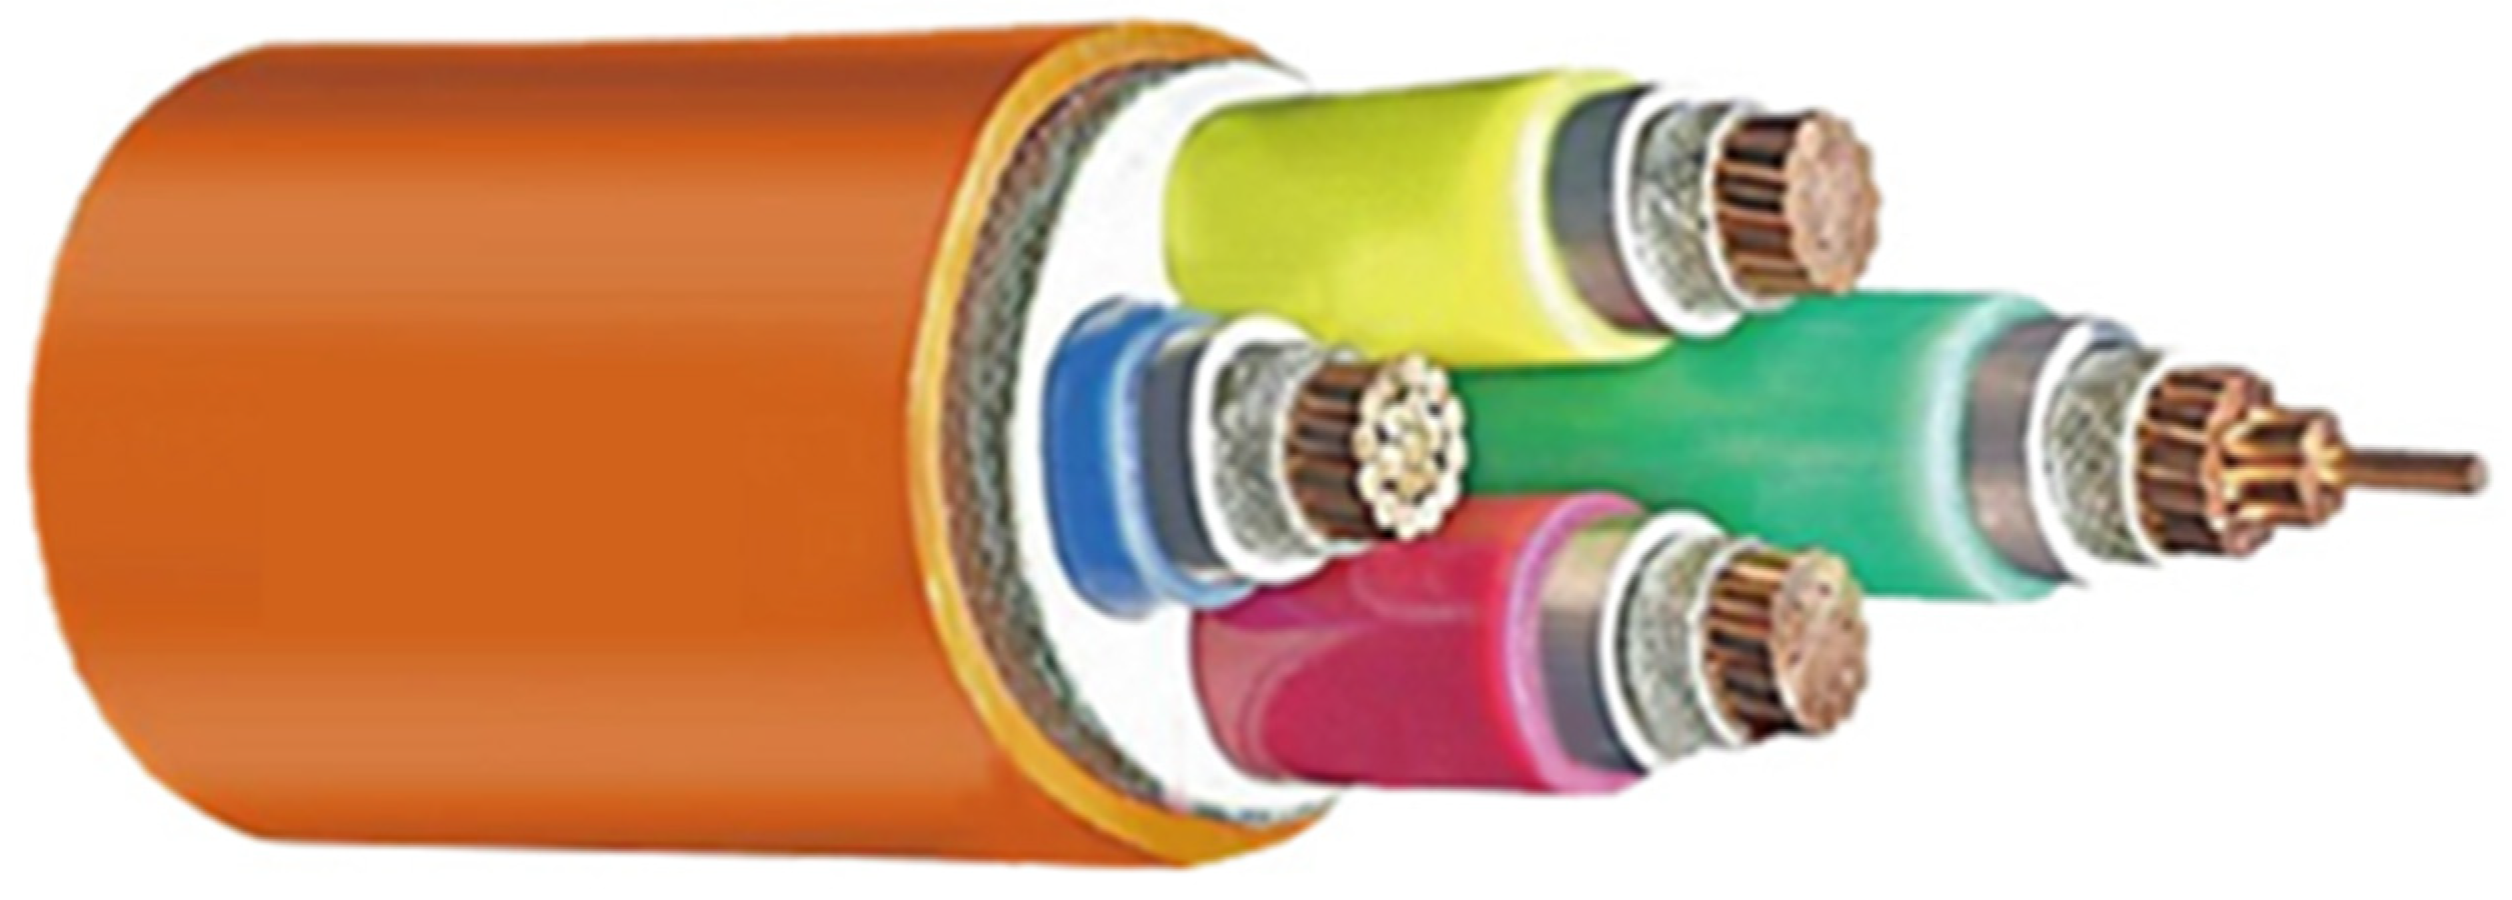
2.2. Characteristics of Torsion-Resistant Cables

Offshore wind turbines are located in a very complex and harsh marine environment, subject to a variety of random loads that vary with time and space, including strong winds, currents, tides, etc., and are also subject to the threat of earthquakes and the impact of human activities. Wind power cables in the long-term torsion process, the main insulation due to fatigue stress cracking, seriously affect its service life. Cables for wind turbines are divided into power cables, control cables, and grounding cables, which are mainly used for the transmission of electrical energy as well as control signals and safety protection of the unit in the generator, control cabinet, and box transformer [9]. The semi-conductive shield is an important structure of the cable, which plays the role of a uniform electric field and makes the connection between the conductor and the insulation layer tighter, and is an indispensable part of the cable [10]. The semi-conductive layer of the cable is highly susceptible to damage during twisting, resulting in damaged insulation. Therefore, the cables used in wind turbines must have excellent performance to ensure that they can maintain excellent electrical transmission performance and mechanical properties in the harsh external environment. Figure 2 shows the current torsion-resistant cables produced by domestic manufacturers.
Usually, this part of the cable should have characteristics such as low-temperature resistance, torsion resistance, corrosion resistance, oil resistance, etc. The main technical performance requirements of the cable [11]:
  • Good low-temperature resistance and torsion resistance characteristics, excellent corrosion resistance to oil and chemicals, UV resistance and salt spray resistance;
  • Must meet the ambient temperature of −45 °C~+50 °C and the operating temperature of −40 °C~+90 °C;
  • The requirements of the cable bending radius: fixed installation is not less than four times the outer diameter of the cable; mobile installation is not less than five times the outer diameter of the cable;
  • Pass the single vertical combustion test as stipulated in DB/T18380.12 and the bundle combustion test as stipulated in GB/T18380.35 for Class C;
  • In the −40 °C low-temperature environment with clockwise and counterclockwise rotation 1440°, the number of rotations for 10,000 conditions, the surface of the sheath after twisting no cracks, conductor fracture does not occur, and immersion in water after 2.5 U0 AC power does not break down within the specified time;
  • The halogen-free performance of the cable meets the requirements of IEC60745-1 and IEC60745-2.
The cables for wind turbines can be divided into 450/690 V, 0.6/1 kV, 1.8/3 kV, 12/20 kV, 18/30 kV, and 20/35 kV according to the working voltage, and the main insulation is generally made of ethylene propylene rubber (EPR). In recent years, the cables for wind turbines of 1.8/3 kV and below produced by domestic enterprises have fully met the requirements of use. With the development of offshore wind turbines toward single large-capacity, countries have launched research on medium-voltage torsion-resistant cables with rated voltages of 12/20 kV, 18/30 kV, and 20/35 kV. Among them, the 20/35 kV cable is mainly used in wind turbines with a single capacity of 2 MW and above to connect the high-voltage side of the transformer located at the rear of the nacelle and the medium voltage switchgear at the bottom of the tower [12]. This cable is suspended inside the uppermost tower section, with the upper end rotating with the nacelle and the lower end fixed to the tower.

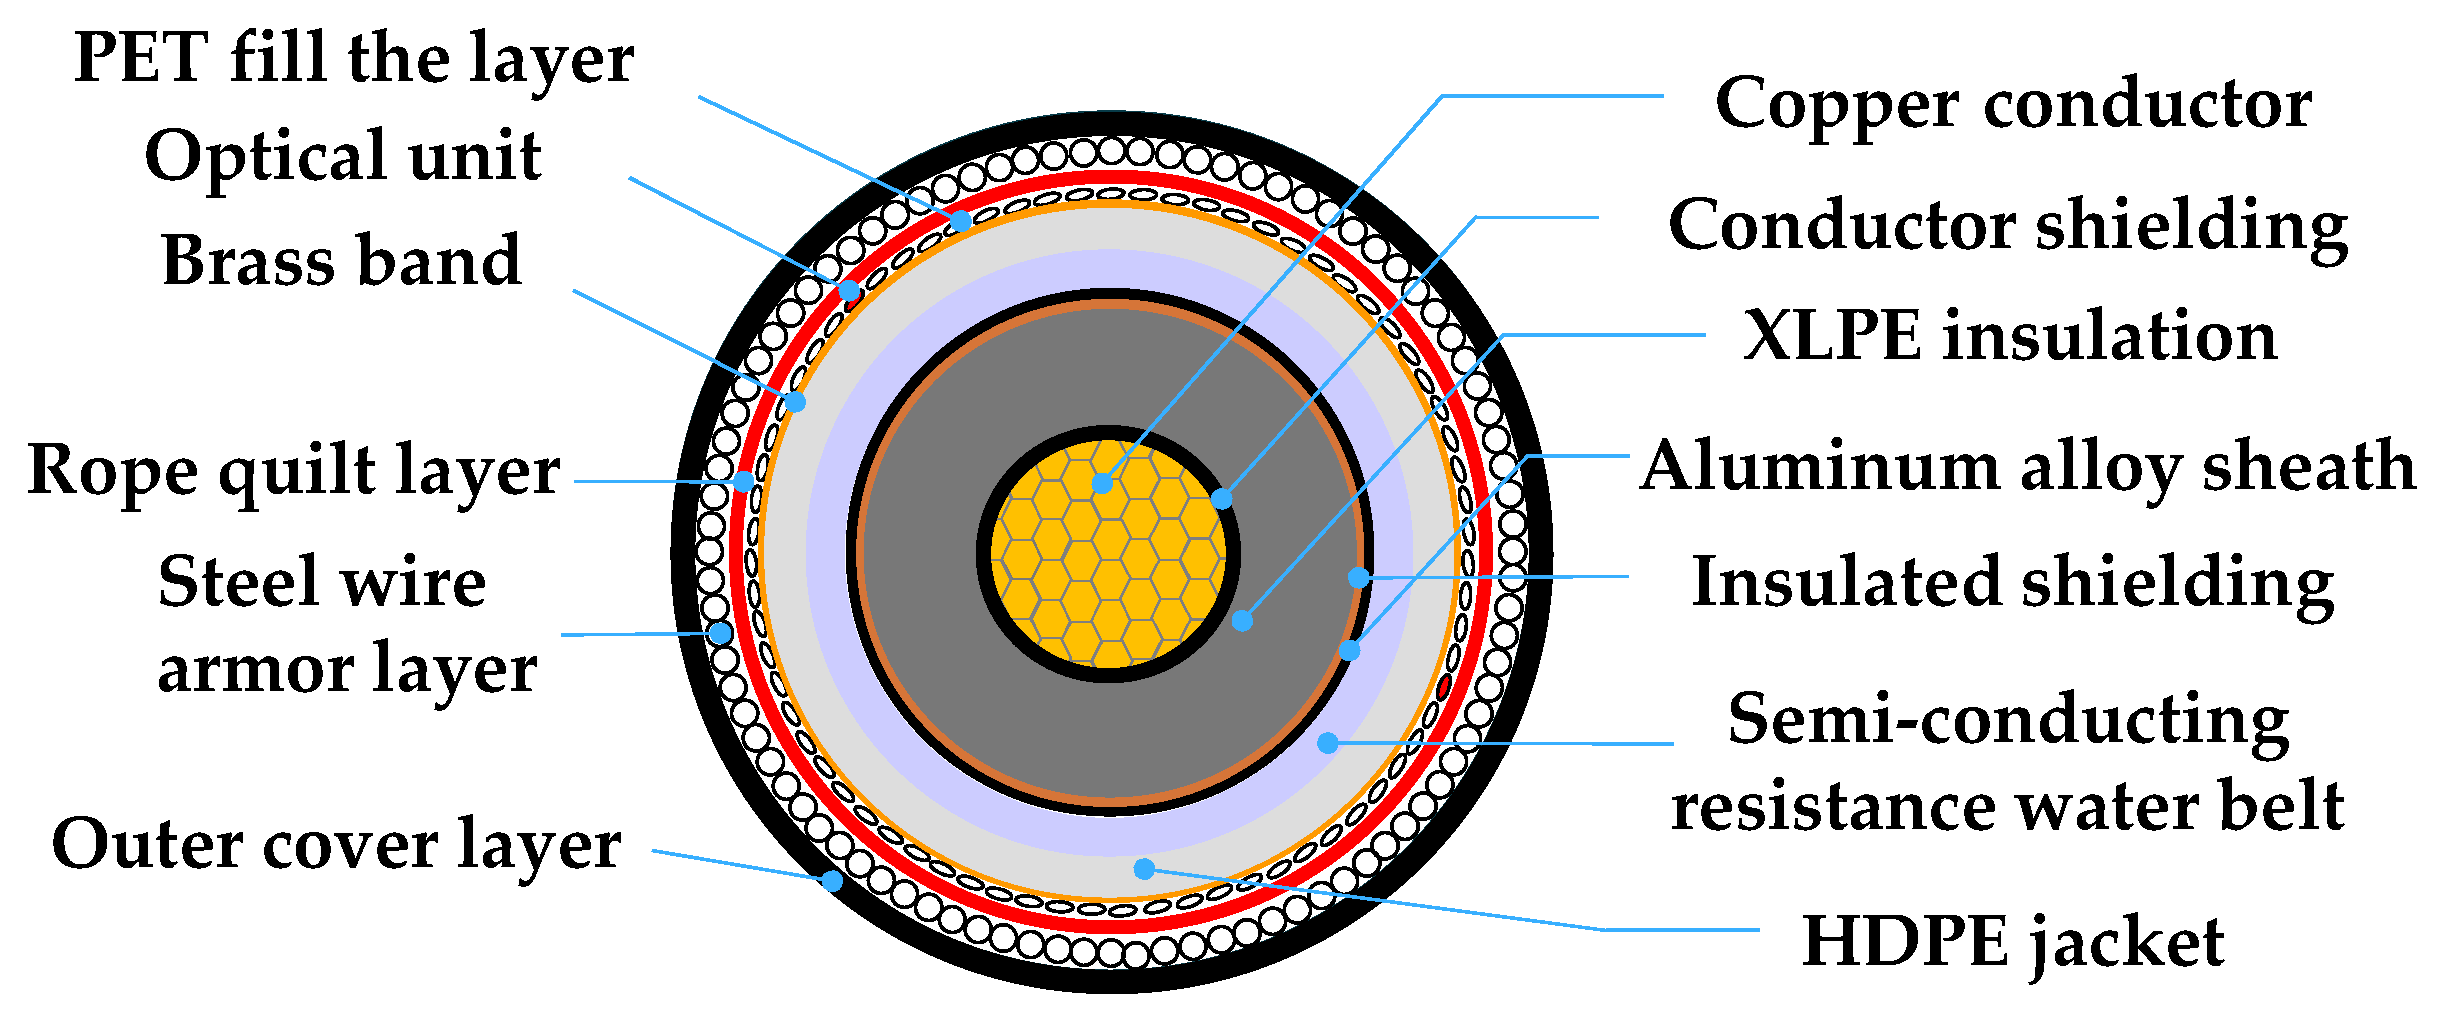
2.3. Overview of Submarine Cable Operating Conditions

Submarine transmission cables transmit the electrical energy generated by offshore wind turbines to shore [13,14]. As an important electric energy transmission channel and key equipment for wind power generation, the working condition of the cable is of great significance to the stable operation of the power grid [15,16]. The development and utilization of submarine cable technology have a history of more than 100 years, and the early submarine cables were used to supply power to offshore equipment. The first submarine power cable in history was successfully laid in the English Channel in the 1850s in the UK [17]. At the beginning of the 20th century, the 10 kV AC three-core submarine cable was put into use in San Francisco, USA. The booming offshore wind power in recent years has brought about the rapid development of composite submarine cables. China’s research and development of submarine cables started in 2004, with the delivery of 110 kV fiber optic composite submarine cables in 2007, the production of China’s first 220 kV-grade submarine cable in 2010, and the development of 500 kV-grade submarine cables in 2014, which were delivered through acceptance in July 2018.
Cross-linked polyethylene (XLPE), due to its good electrical, mechanical, physical, and chemical properties, is widely used as the main insulation material for submarine cables [18,19]. Due to the complex environment of the subsea, submarine cables are designed and manufactured to contain metal armor layers to ensure mechanical strength. The overall structure of submarine cables is divided into single-core and three-core. Single-core submarine cables are less expensive to produce and generally have a larger transmission capacity and high operating voltage during long-distance transportation, so single-core cables are mostly used. And three-core is mainly used for low-voltage transmission and distribution lines. Under the conditions of the same conductor cross-section and material selection of each layer, the loss of three-core submarine cable is smaller. To achieve the simultaneous transmission of electricity and signals, the fiber optic composite submarine cable is formed by adding communication fiber optic cable or temperature measurement fiber optic cable to the submarine cable [20]. Figure 3 shows the structure of a single-core submarine cable.
XLPE-insulated submarine cable is also divided into two types DC submarine cable and AC submarine cable. DC submarine cables use the high-voltage DC transmission method, which does not have the problem of reactive power compensation and can flexibly adjust the power and current of the line. The use of DC transmission also has inherent disadvantages, the accumulated space charge in the insulation layer will lead to insulation performance degradation, and DC system monopole operation generated by galvanic corrosion can also harm submarine equipment.
Since submarine cables are subjected to external loads such as tension, torsion, and anchor smash, these external loads can affect the electrical performance of the cable. Wenchao Wang et al. built a tensile test rig, as shown in Figure 4 [21]. Tensile tests and finite element simulations were carried out on the flat steel wire armored fiber composite submarine cable. The simulation results showed that the strain on the inner liner and sheath of the submarine cable was higher than the other layers when subjected to tensile load; because the inner liner and sheath were made of softer materials such as linen or plastic with smaller thickness, which were easily damaged when subjected to overload. At the same time, in the middle section of the cable in the tensile process, the stress and strain are more gentle, and, in the end position, it is easy to produce large deformation and stress concentration, and the laying and operation process should focus on this part of the region.
It is necessary to consider the working conditions of submarine cables during coiling, transportation, laying, and operation to ensure the stable operation of submarine cables. In the process of transmitting power and signals, submarine cables will inevitably cross over fault activity areas. Slip and misalignment displacements triggered by walking faults can subject the cable to a variety of loads, and Dongliang Shao et al. studied the stress state and damage mechanism of submarine cables under typical walking faults [22]. When a slip fault occurs, the cable is subjected to transient impact and large deformation, which can lead to outer sheath cracking in severe cases. Figure 5 shows the trend of cross-sectional deformation of the copper conductor, XLPE insulation layer, and armor layer at the fault layer with fault displacement.
When the fault displacement is less than 0.3 mm, the cross-sectional deformation of the XLPE insulation layer and armor layer is roughly the same region, but with the increase of the misalignment displacement, the deformation of both is not synchronized. The stiffness of galvanized armor layer is larger than that of the insulation layer, so it is not easy to deform, and the amount of misalignment displacement is too large, which will lead to delamination between the main insulation and the armor layer of the cable, forming uneven electric field and affecting the electrical performance of the submarine cable.

3. Deterioration Mechanism of Wind Power Cable Insulation

3.1. Deterioration Mechanism of Ethylene Propylene Rubber

The main insulation material for wind power torsion-resistant cables is ethylene propylene rubber (EPR), which is soft and has good resistance to deformation and thermal cycling aging [23]. Compared with XLPE, EPR can effectively inhibit the generation and growth of electrical and water dendrites in the cable and is suitable for high-frequency torsional wind power intra-tower cables [24]. Under the impact of strong offshore winds, waves, and high-temperature and humidity operating environments, offshore wind turbines and their attached accessories are subjected to great tests. Due to multiple stresses, the cable insulation degrades faster, and in the tower and nacelle, the cable does not dissipate heat sufficiently during operation, and all these stresses can cause degradation of the insulation material, which may eventually lead to breakdown [25]. The study of the deterioration mechanism of ERP insulation materials is important for the design and manufacture of cable insulation materials and the improvement of their performance, which is beneficial to improve the reliability of wind power generation [26].
Cable insulation materials are subjected to multiple factors such as heat, oxygen, corrosion, and mechanical stresses during use, and degradation, cross-linking, and other aging behaviors occur. Insulation material aging mechanisms are generally thermal-oxygen aging, ozone aging, and fatigue aging, which occur due to the repeated action of mechanical stress, while aging occurs under the multiple effects of electrical and thermal stresses [27]. The aging of EPR under multiple harsh environmental conditions such as heat, salt spray, and humidity has attracted the attention of many scholars [28,29], as some wind power plants are located in environments with large temperature differences between day and night and high humidity and salt spray concentrations in the offshore environment. Sei Li et al. carried out an aging test study on homemade ethylene propylene diene monomer (EPDM) under hot air, humid heat conditions, and salt spray corrosion cycles, respectively, and performed Fourier transform infrared spectroscopy (FTIR) analysis and cross-link density tests, and after aging under the three conditions, the main chains of rubber molecules in foamed EPDM were not destroyed, but as the aging temperature increased, the sample cross-linking phenomenon will be more obvious as the aging temperature increases [30].
Linfeng Cao et al. investigated the accelerated aging of EPR power cables of 15 kV under multi-stress conditions [31]. Current experimental life models for cable aging under multiple stresses mainly include Fallou’s exponential model [32], Montanari’s probabilistic model [33], and Crine’s physical model [34]. Due to the complexity of aging conditions, no single model can explain well the aging phenomena under all conditions from existing publications. The initial partial discharge voltage at different aging times for EPR cables with increasing AC voltage and rated current and superimposed positive polarity switching pulses of 62 kV is shown in Figure 6. After an aging time of 150 h, the initial partial discharge voltage decreases significantly, and then the initial voltage starts to increase. Between the aging time of 650~800 h, the initial partial discharge voltage fluctuates again. As more switching pulses are applied to the cable samples, the partial discharge initial voltage decreases significantly.
As scholars have been studying the cable insulation failure problem, several methods to assess the condition of cable insulation and techniques to explore the insulation failure mechanism have been proposed [25]. The degradation of insulation properties caused by the aging of cable insulation inevitably leads to changes in electrical as well as mechanical parameters. Yin Lin et al. explored the condition assessment of EPR cable insulation under multiple stresses by measuring the infrared spectra, elongation at break, and polarization and depolarization currents of cable insulation samples [35]. The state of the EPR cable insulation was evaluated using the aging factor obtained from isothermal relaxation currents. Lv. Z [36] studied the partial discharge characteristics of failed cable insulation based on pulse sequence analysis, and the results showed that the voltage difference of adjacent partial discharge signals could effectively assess the insulation failure state.

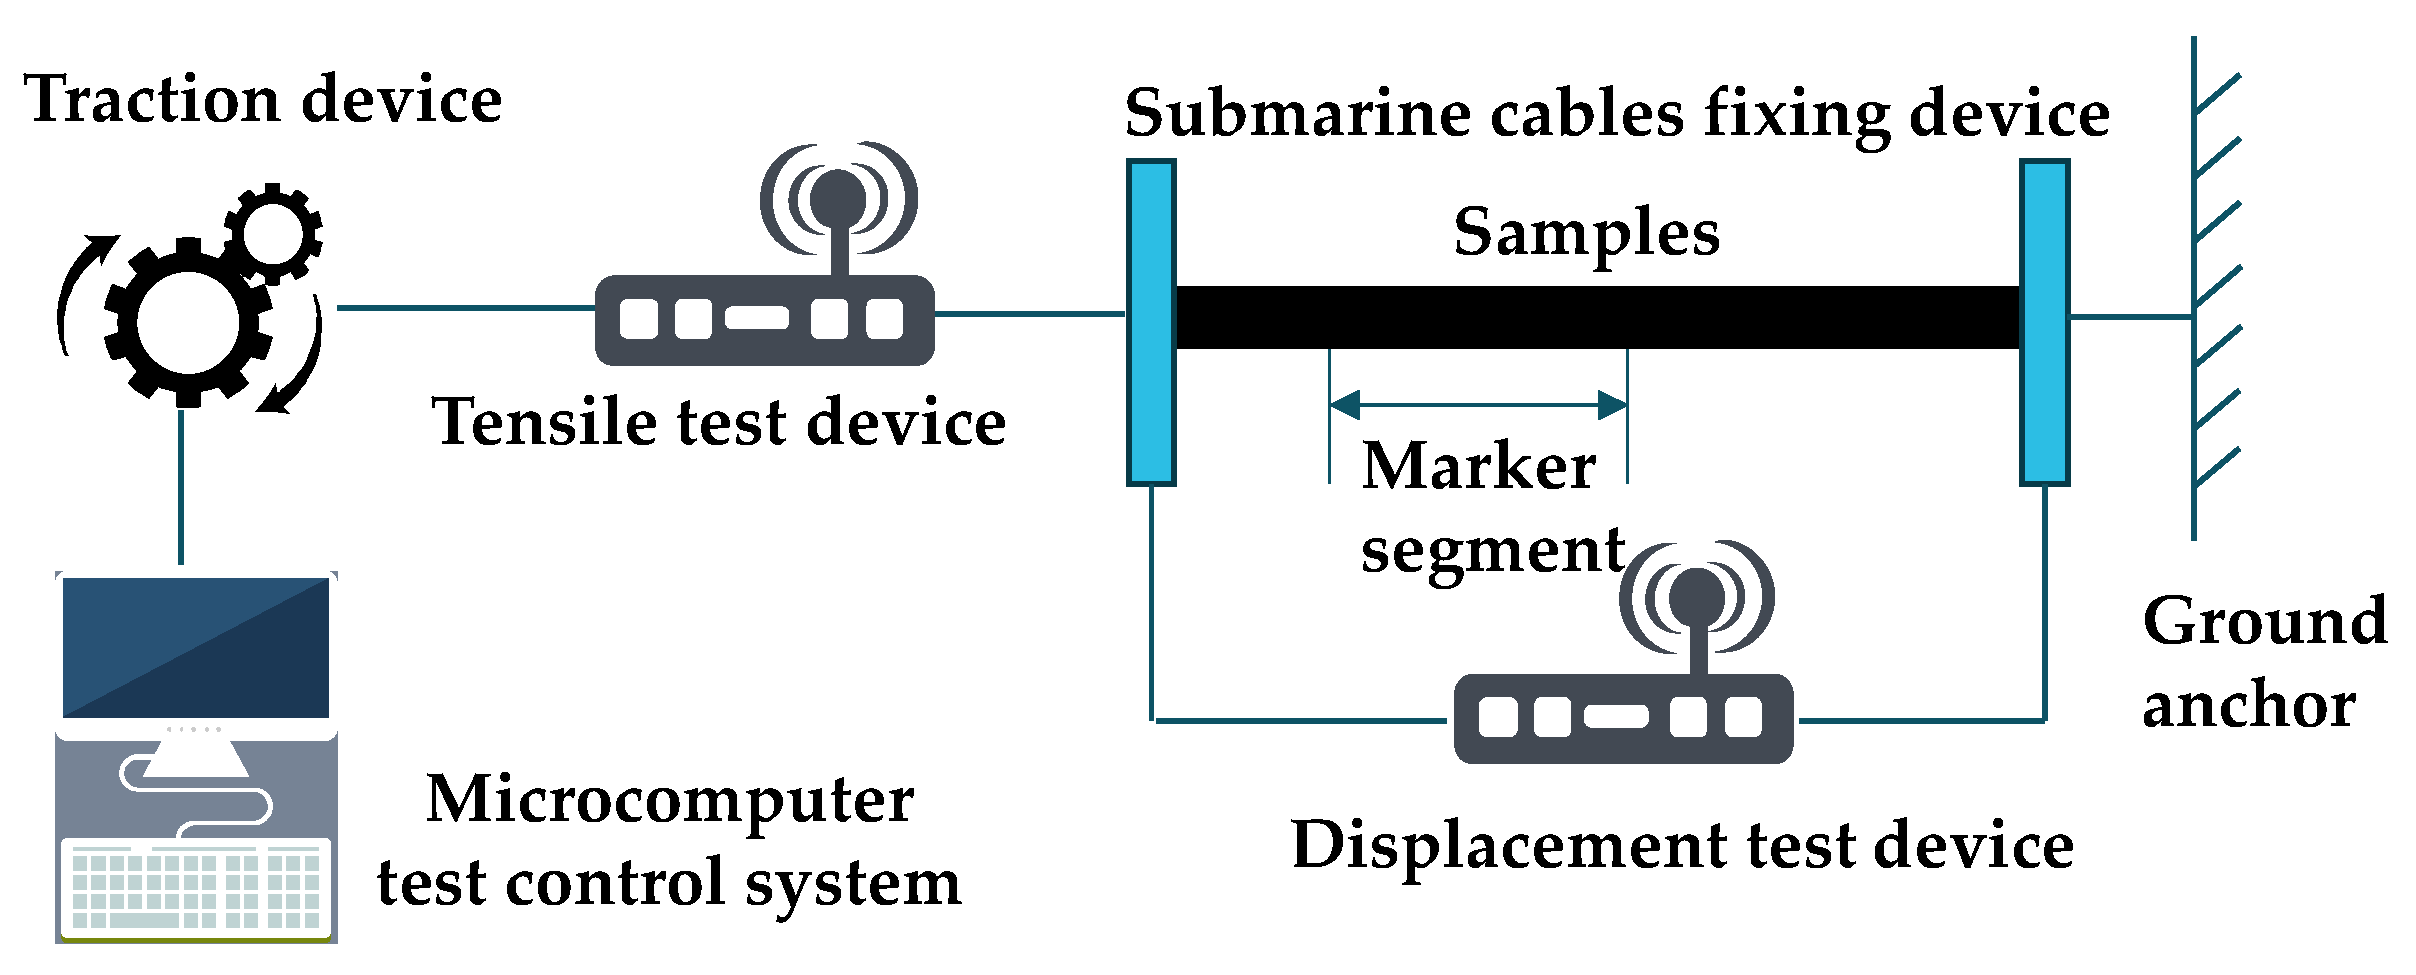
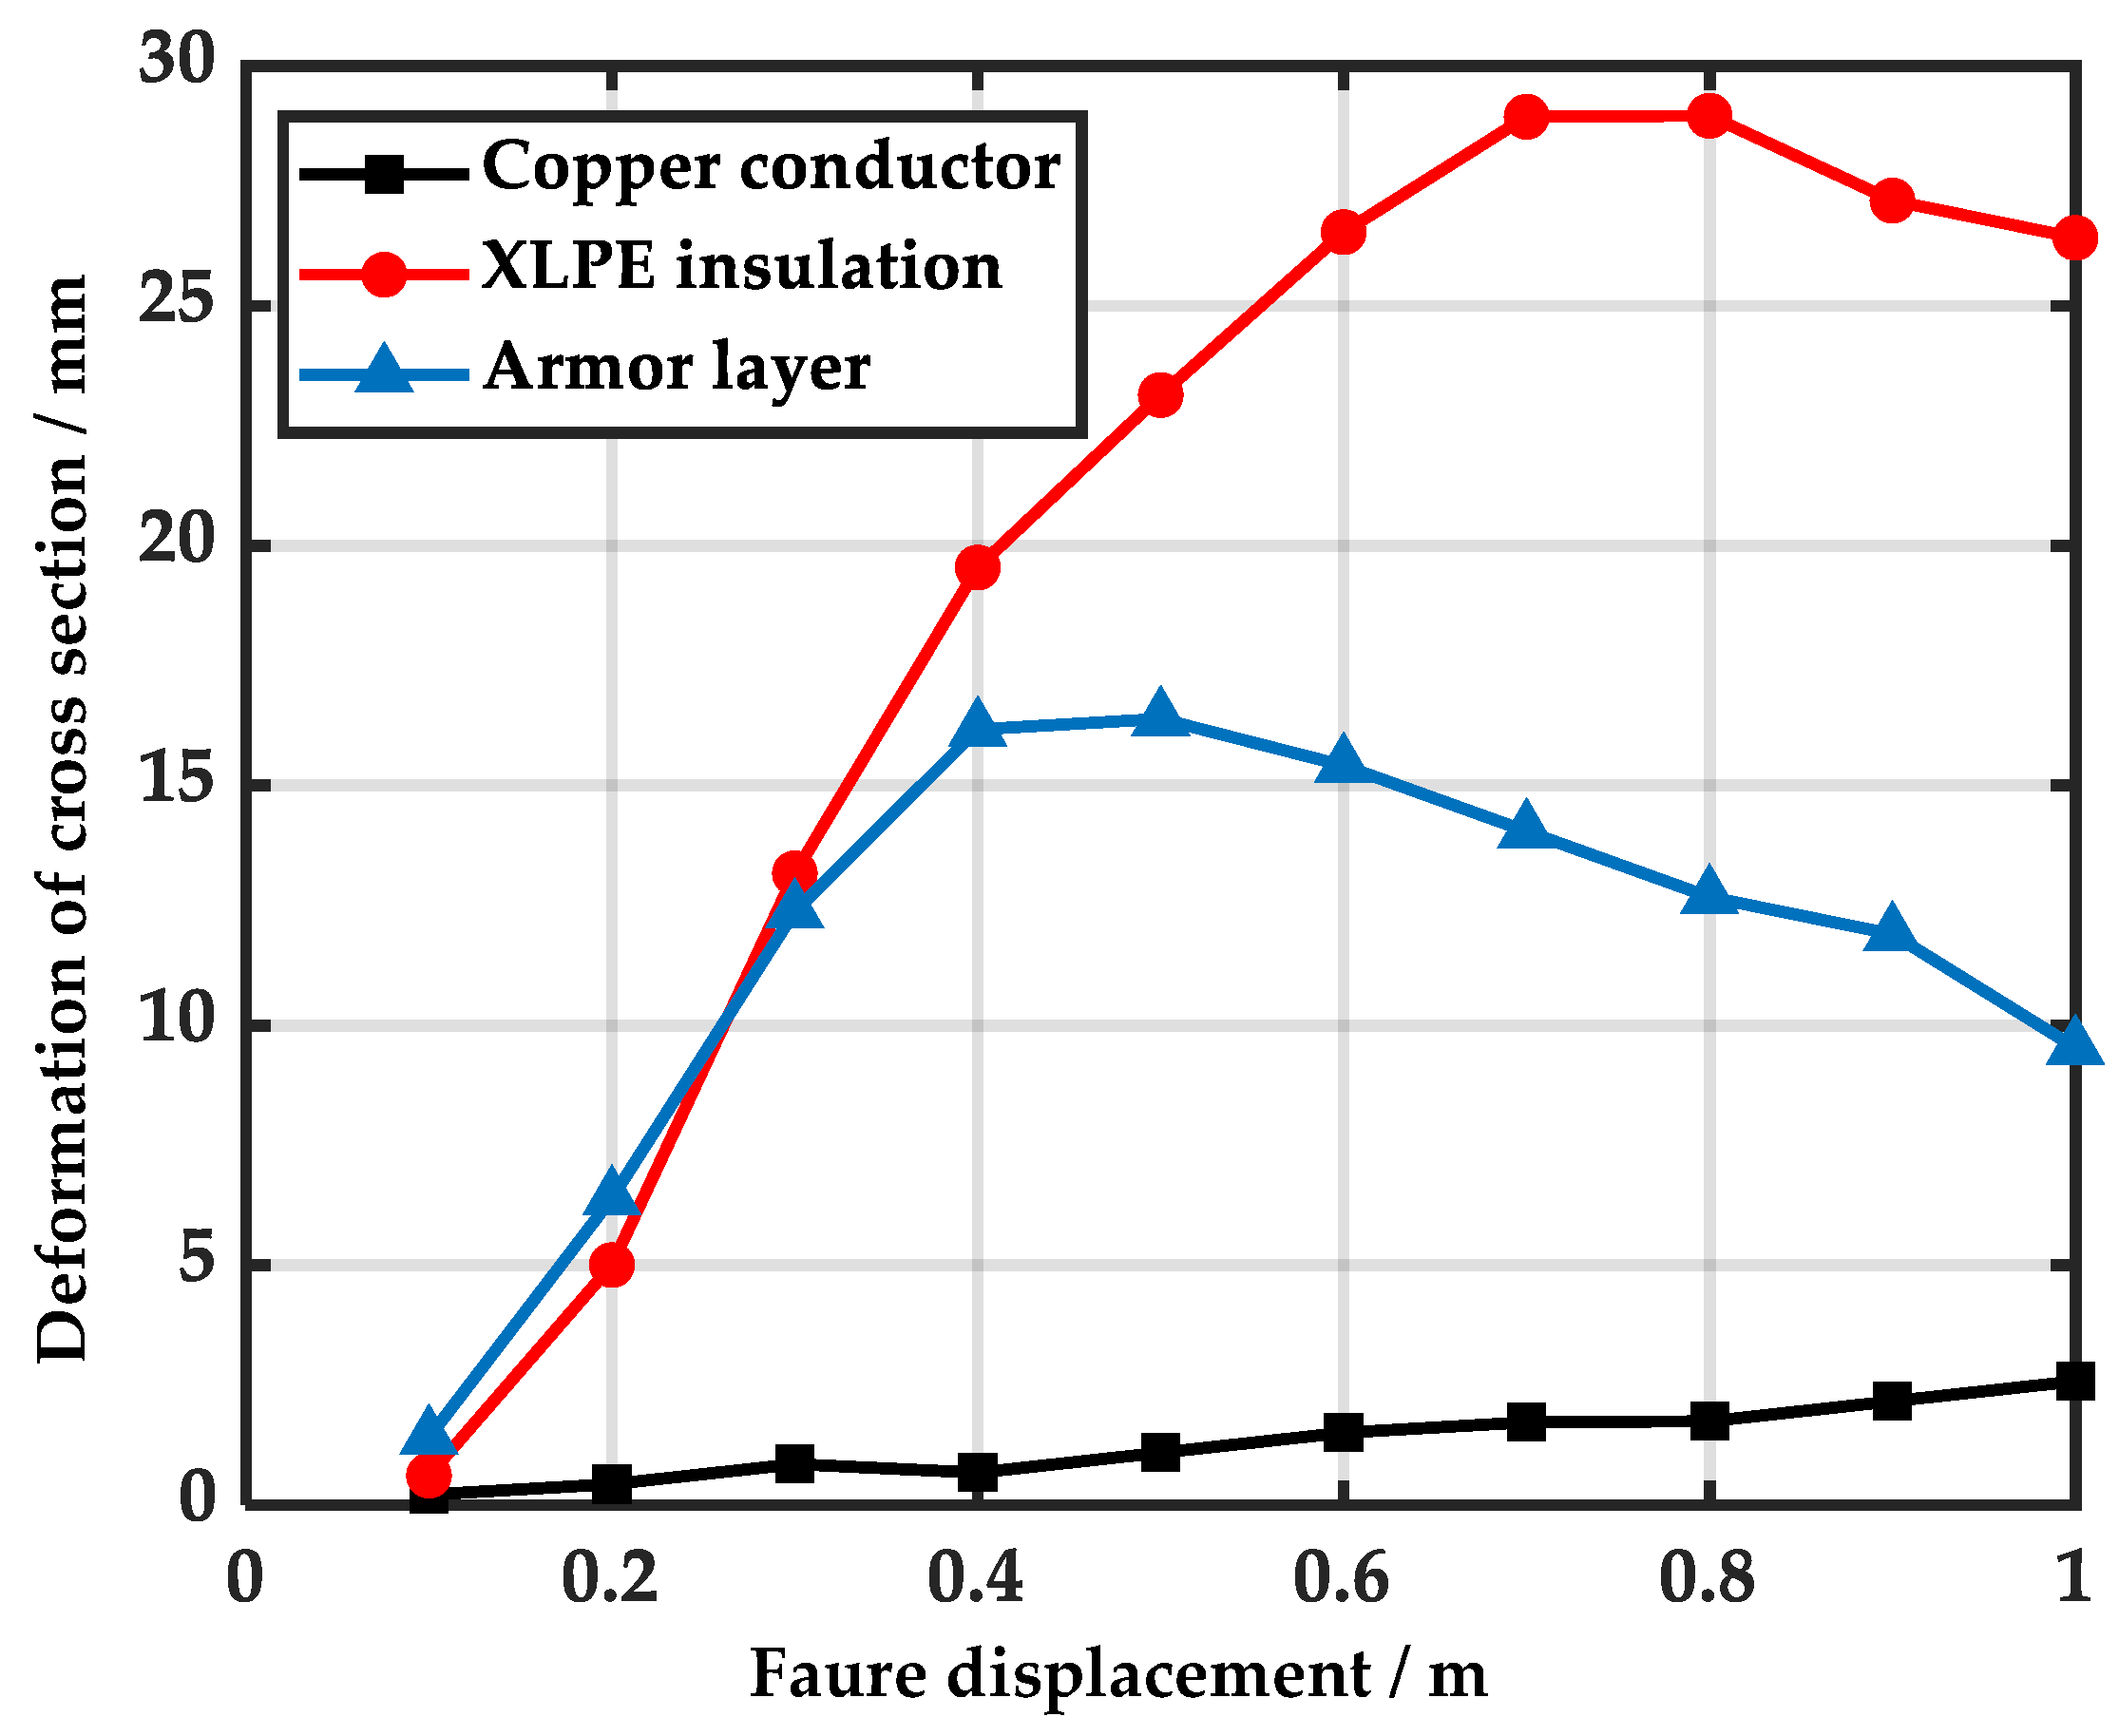
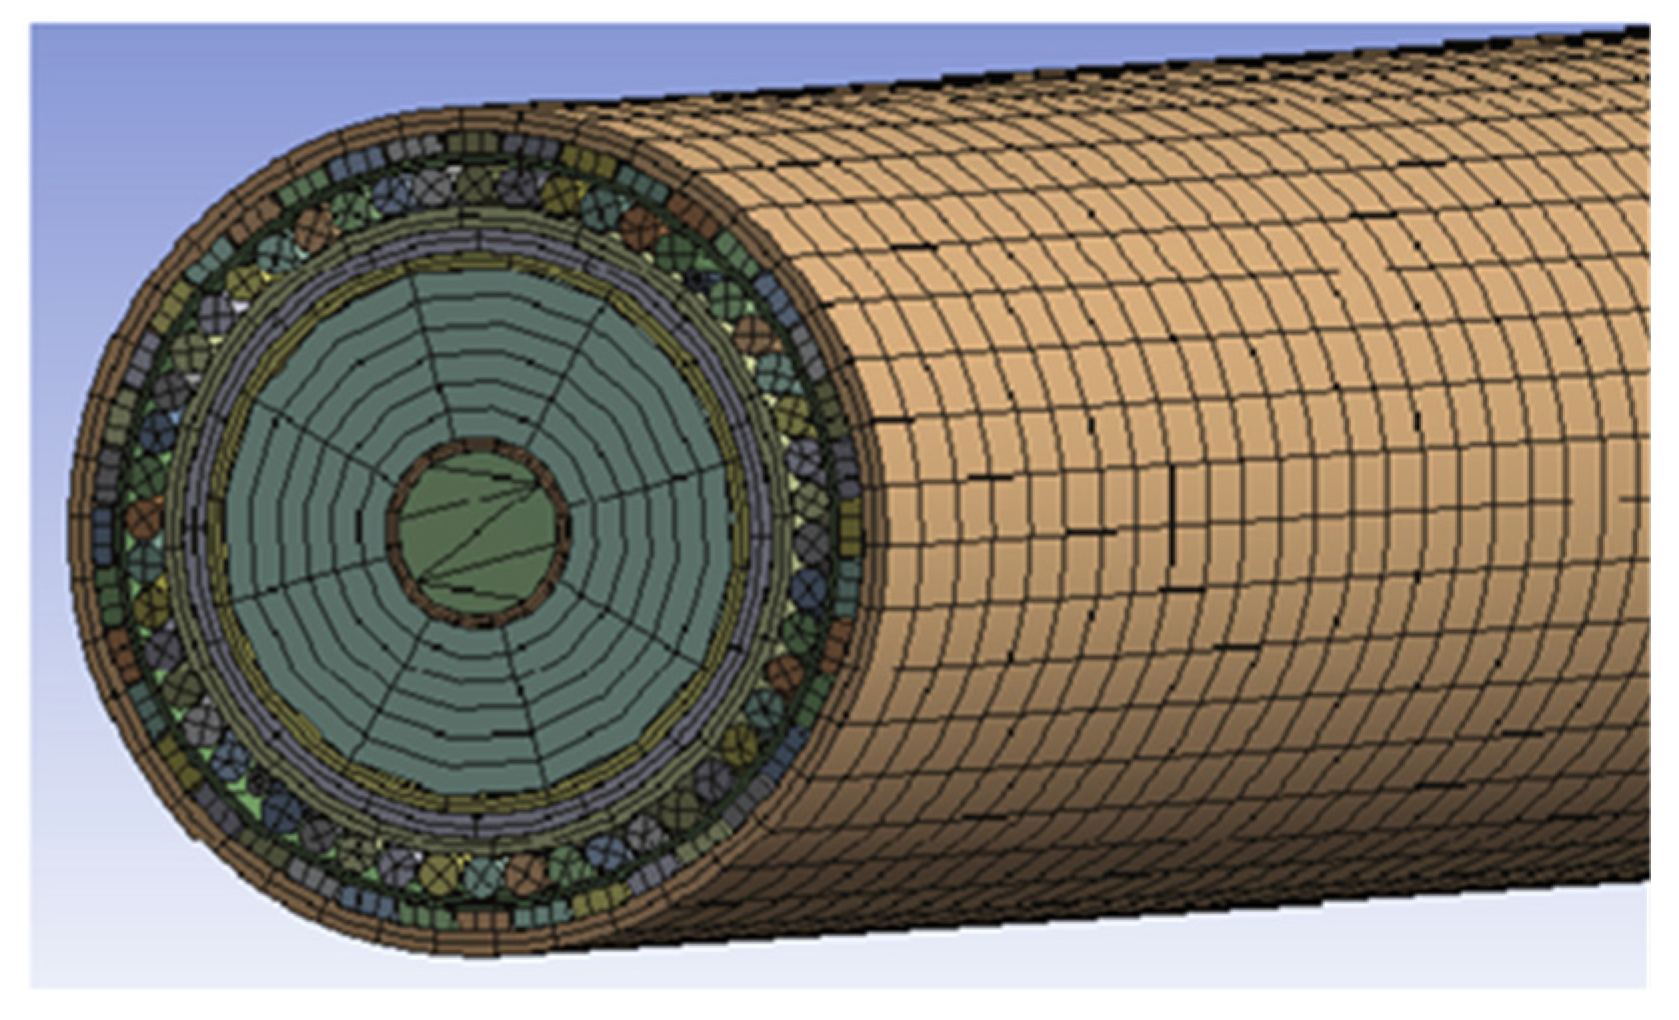
3.2. Analysis of Mechanical Behavior and Insulation Deterioration of Submarine Cables

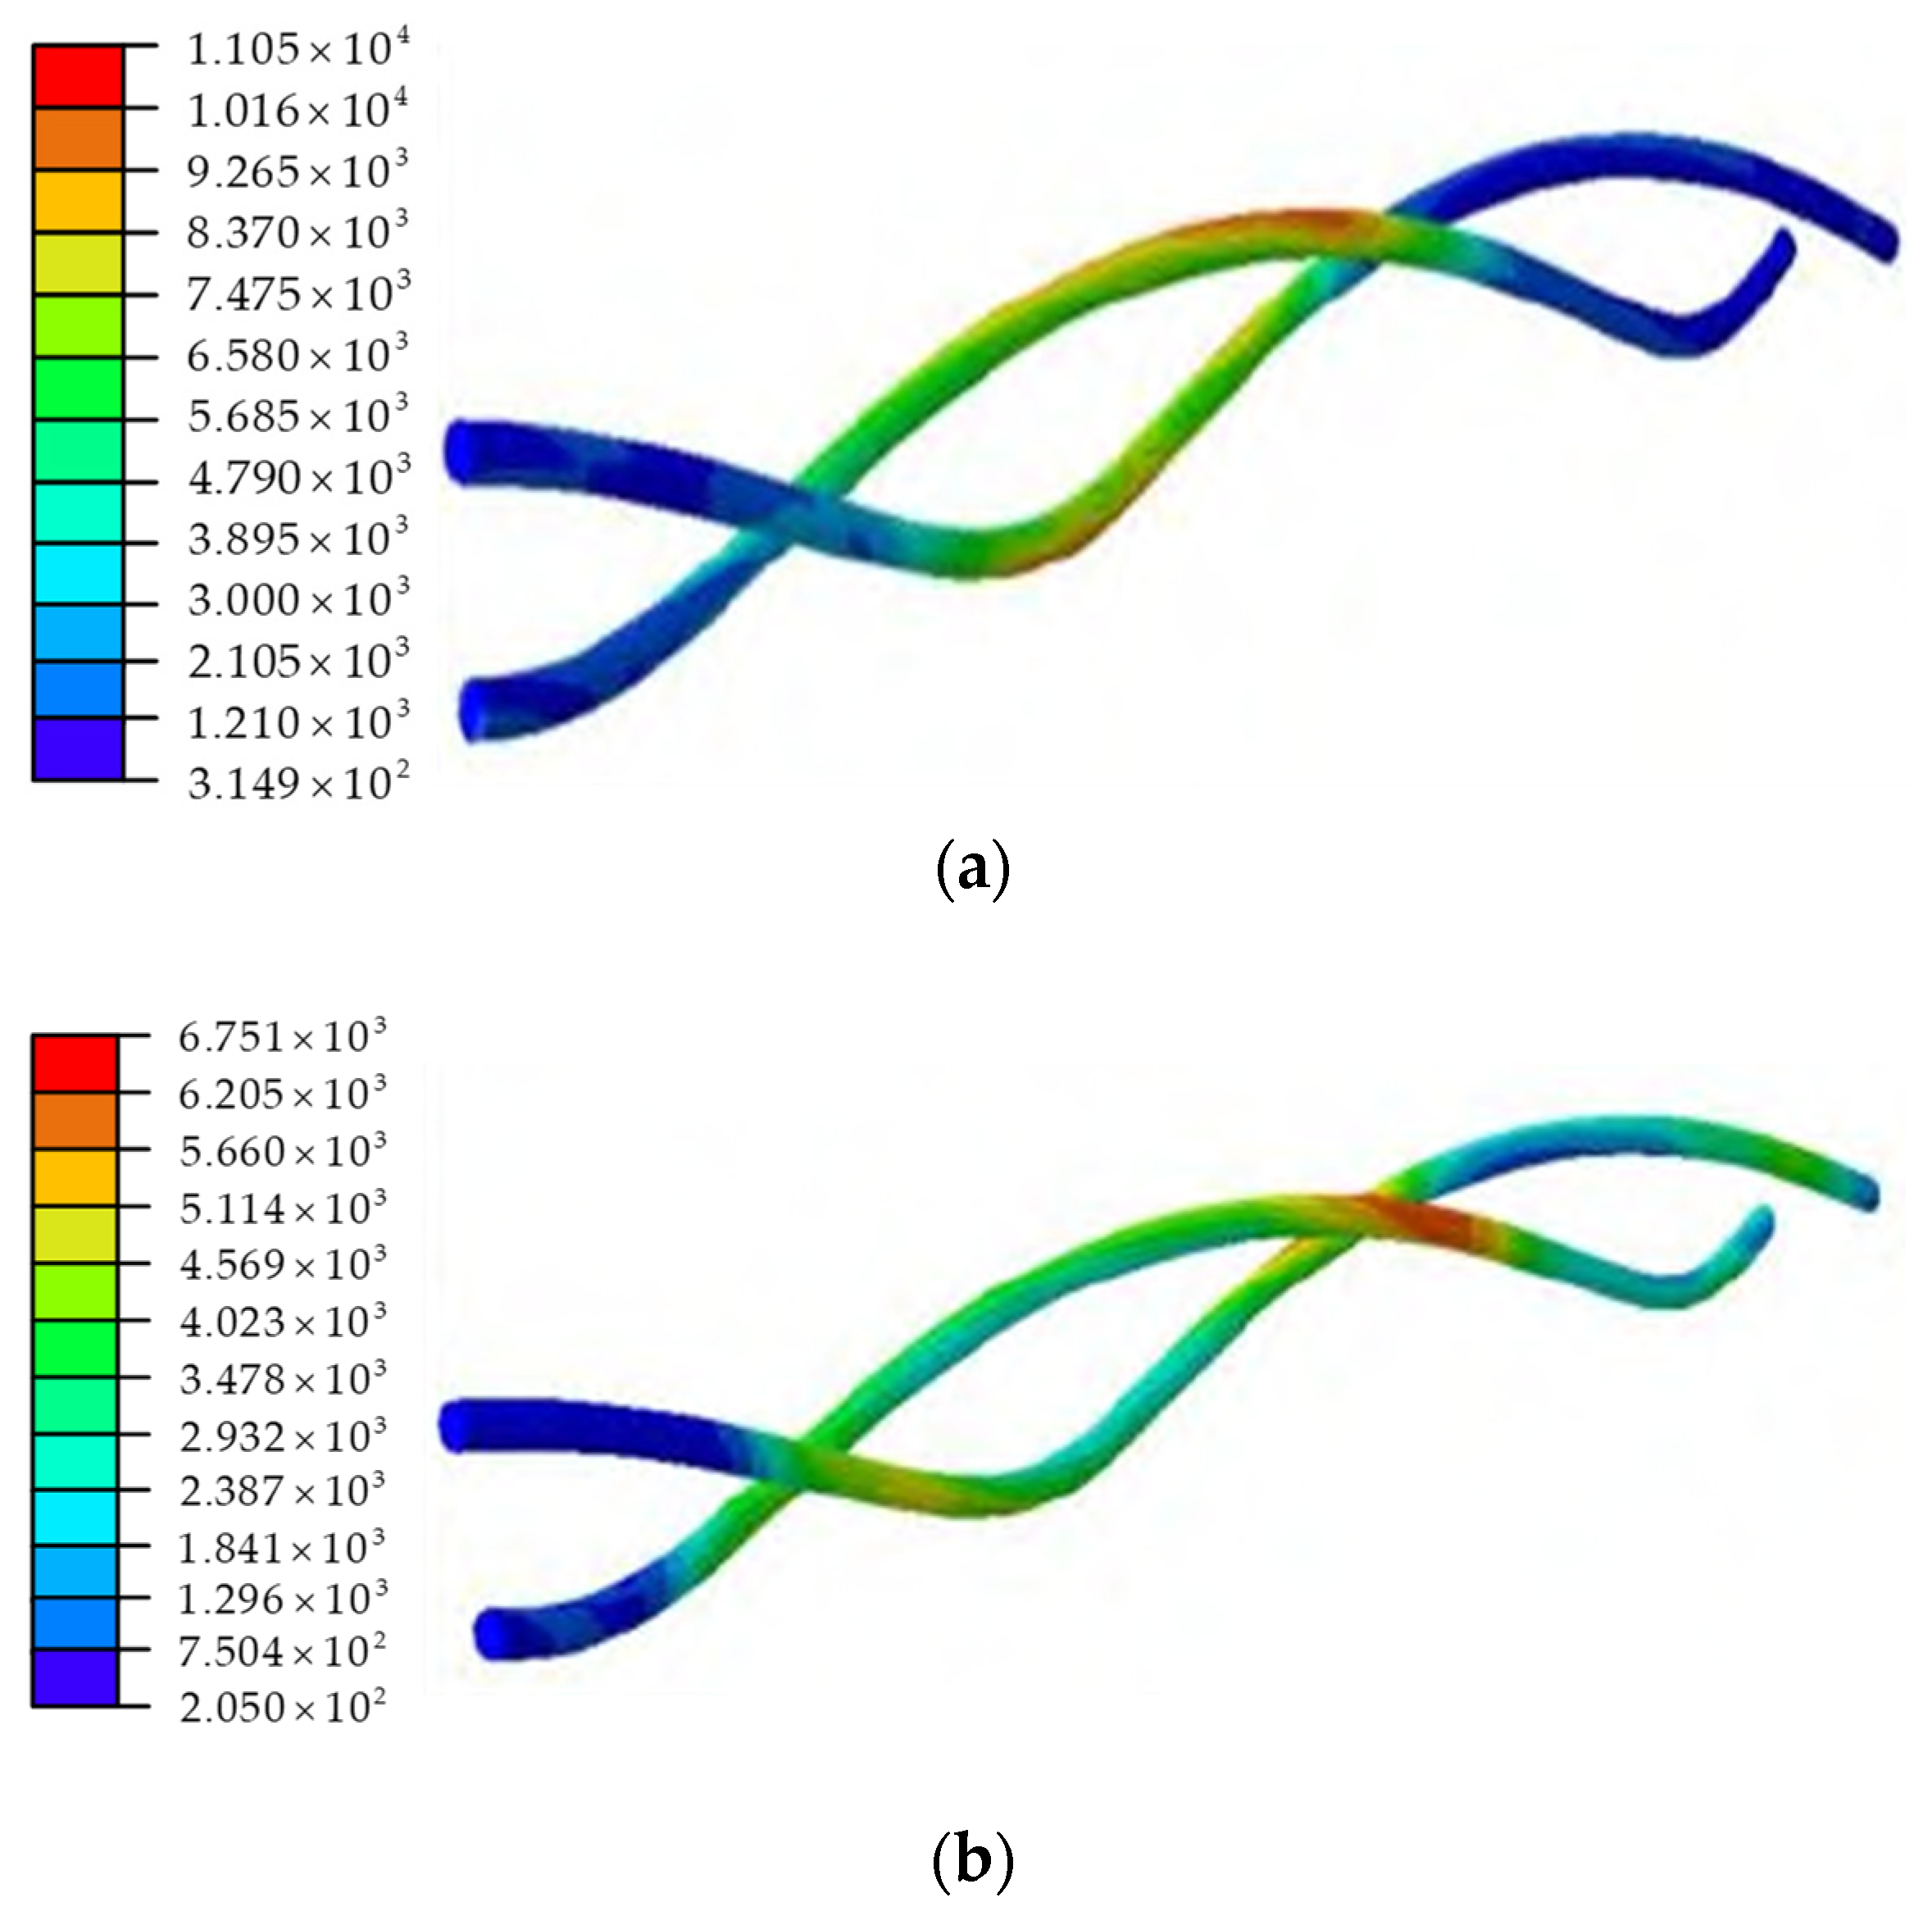
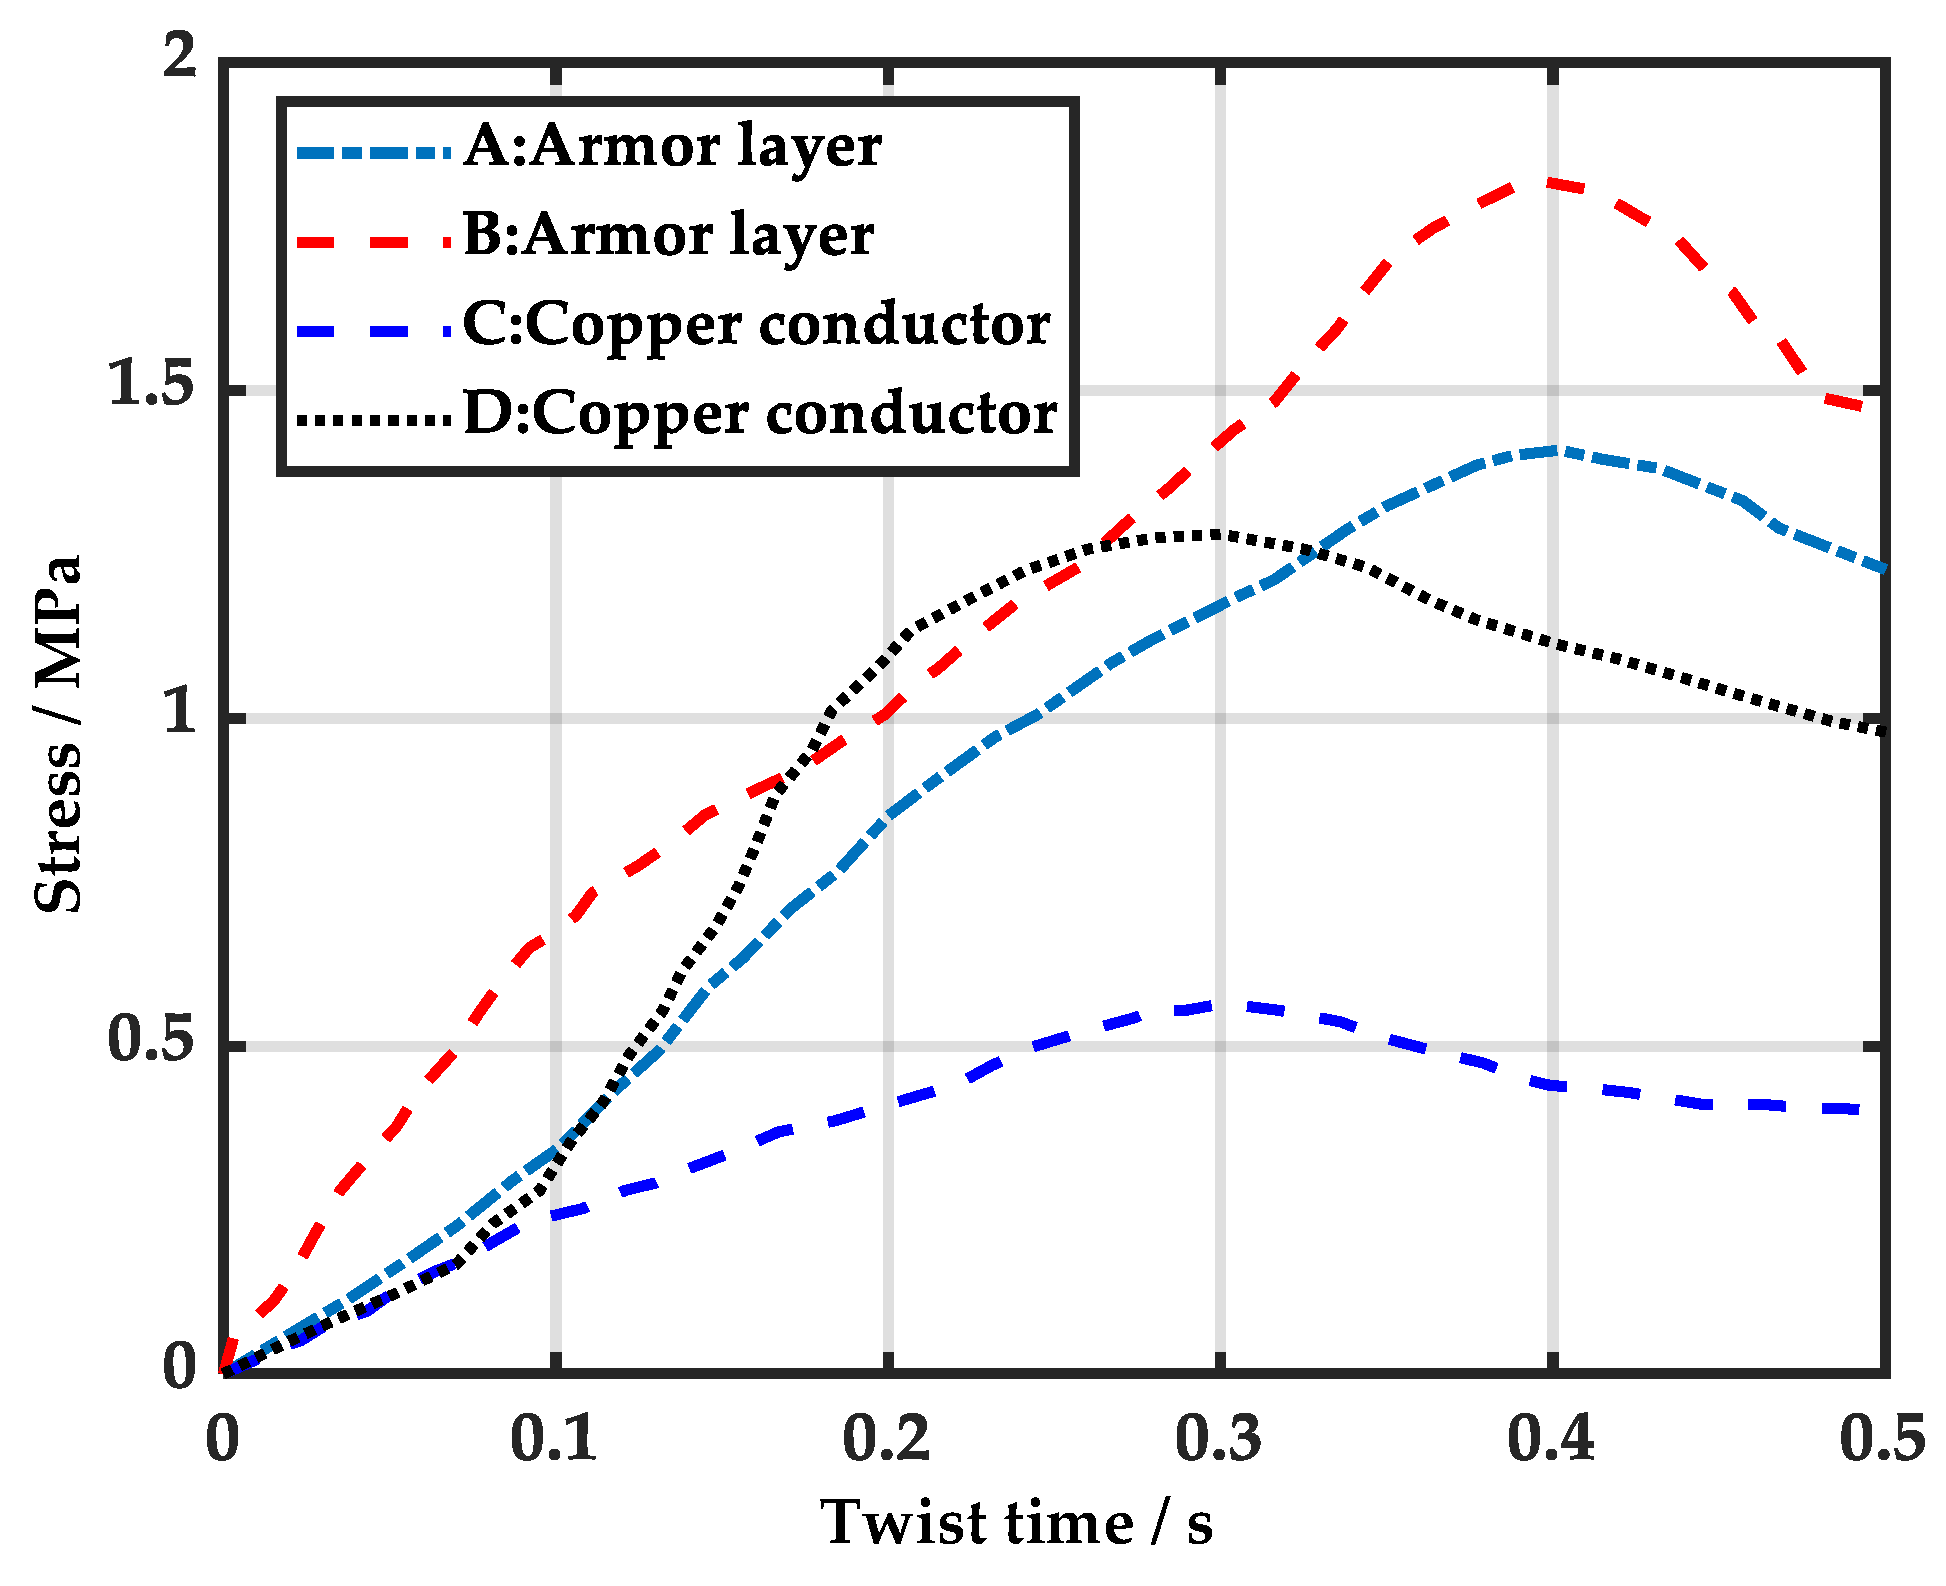
3.2.1. Analysis of Torsional-Vibration of Submarine Cables

With the increasing scale of exploitation of marine resources and various offshore activities, there are increasing requirements for the safe operation of submarine power transmission cables [37]. In contrast to land-based installations, offshore wind turbines and their ancillary equipment are subjected to hydrodynamic loads from waves and currents. The friction of submarine cables can damage the insulation and the cable sheathing, causing damage to the insulation properties of the cables. Seawater corrosion and the adhesion of marine organisms can corrode the cable surface, causing deterioration of the water resistance and insulation deterioration.
Long-term fatigue movement of cables under the action of currents can cause mechanical damage to submarine cables [38,39]. Relevant studies have shown that mechanical damage is the main mode of cable damage. Severe mechanical damage can cause cable breakage, short circuit, or ground fault. After the failure of a submarine cable, its detection and repair often cost a lot of time and financial resources, so it is of great importance to study the mechanism of mechanical stress on cable damage. During lay-up and sea current scouring, submarine cables undergo different degrees of twisting, and Merino et al. modeled the twisting of submarine cables with both downward and inverse loads [40]. Jian Guo [41] took the fiber composite submarine cable as the research object and used ANSYS software to perform torsional simulation on the simplified cable model, and explored the stress changes in the structure of each layer of the cable under different torsional directions and torsional angles, which provided a reference idea for studying the mechanical properties of the submarine cable. Figure 7 shows the finite element model of the submarine cable.
Extracted from the stress distribution cloud map of the submarine cable fiber after torsion, as shown in Figure 8. As can be seen from the figure, the clockwise twisting time unit stress is smaller at both ends and larger in the middle, about 0.01 MPa; the counterclockwise twisting time unit stress is smaller at the left end, and the stress is concentrated in the middle slightly near the position of the bound end, the maximum is only 0.006 MPa, and the stress at the axial position is generally smaller than the clockwise twisting result.
A uniform torsional load with a clockwise and counterclockwise direction and an angle of 30° is applied to the left end of the submarine cable model. At the same position of the torsional angle, that is, the axial Z = 100 cm section position, is used as a typical section to draw the stress change curve of the armored steel wire and the copper conductor at the same angle of torsion. As shown in Figure 9, A and B are the stress time history curves of the armored layer reverse and clockwise torsion, respectively. C and D are the stress time history curves of the copper conductor reverse and clockwise torsion, respectively.
During the clockwise twisting process, the structural stresses show a trend of increasing and then decreasing, reaching the maximum value at 0.39 s and 0.28 s, respectively. During the counterclockwise twisting process, the structural stresses also show a trend of increasing and then decreasing, reaching the maximum value at 0.40 s and 0.30 s, respectively, while the peak value of the armored wire is larger than that of the clockwise twisting result, and the peak value of the copper conductor is the peak value of the armor wire is larger than the clockwise torsion result, and the peak value of the copper conductor is smaller than the clockwise torsion result.
The submarine cables laid on the seabed will be exposed in part due to ocean currents, tidal erosion, and other reasons and will be in a suspended span state. The overhanging section will form alternating vortex shedding behind it when the current passes through, and the submarine cable is prone to resonance and fatigue damage to the submarine cable structure when the inherent frequency of the submarine cable operation is similar or equal to the vortex shedding frequency. Therefore, it is important to study the vibration characteristics of submarine cables for the protection of submarine cables [42,43]. Yushan Feng et al. established a model of the submarine cable using SOLID 185 unit and PIPE 59 unit; and extracted data from the simulation results to obtain the stress-strain and other data of the structure of each layer, and in most cases, the vibration frequency of the submarine cable is around 50 Hz [44].

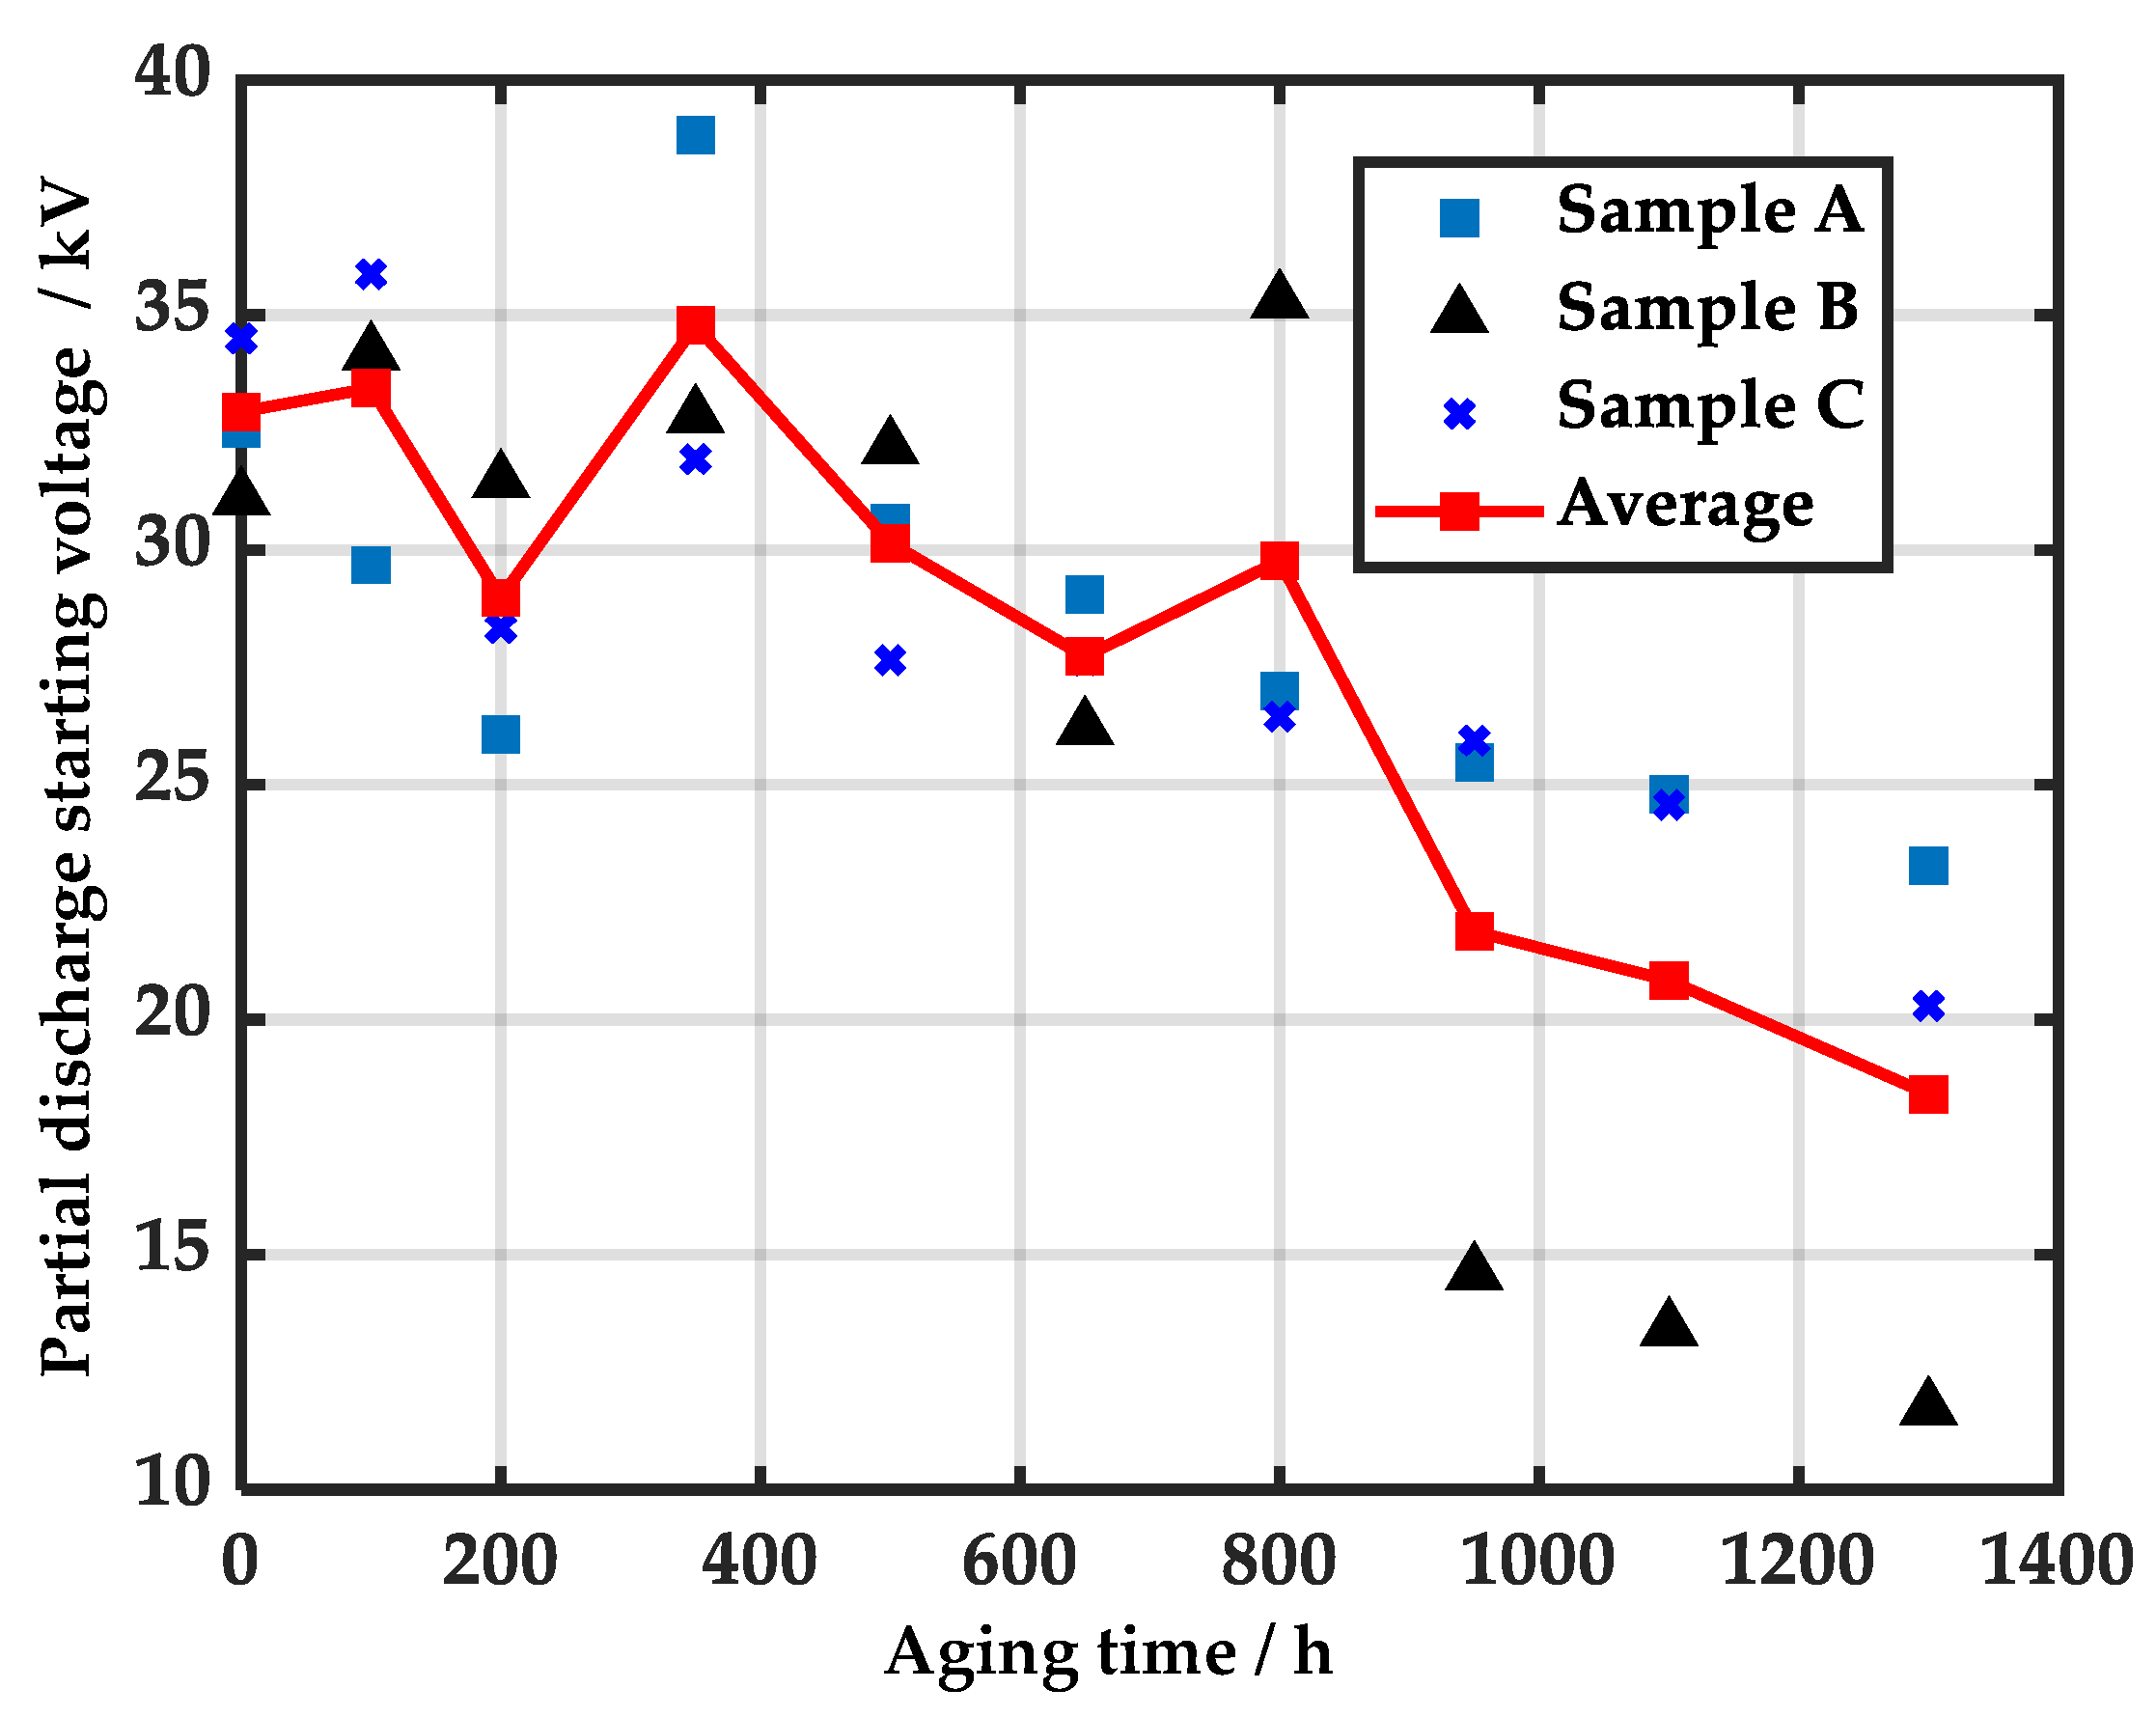
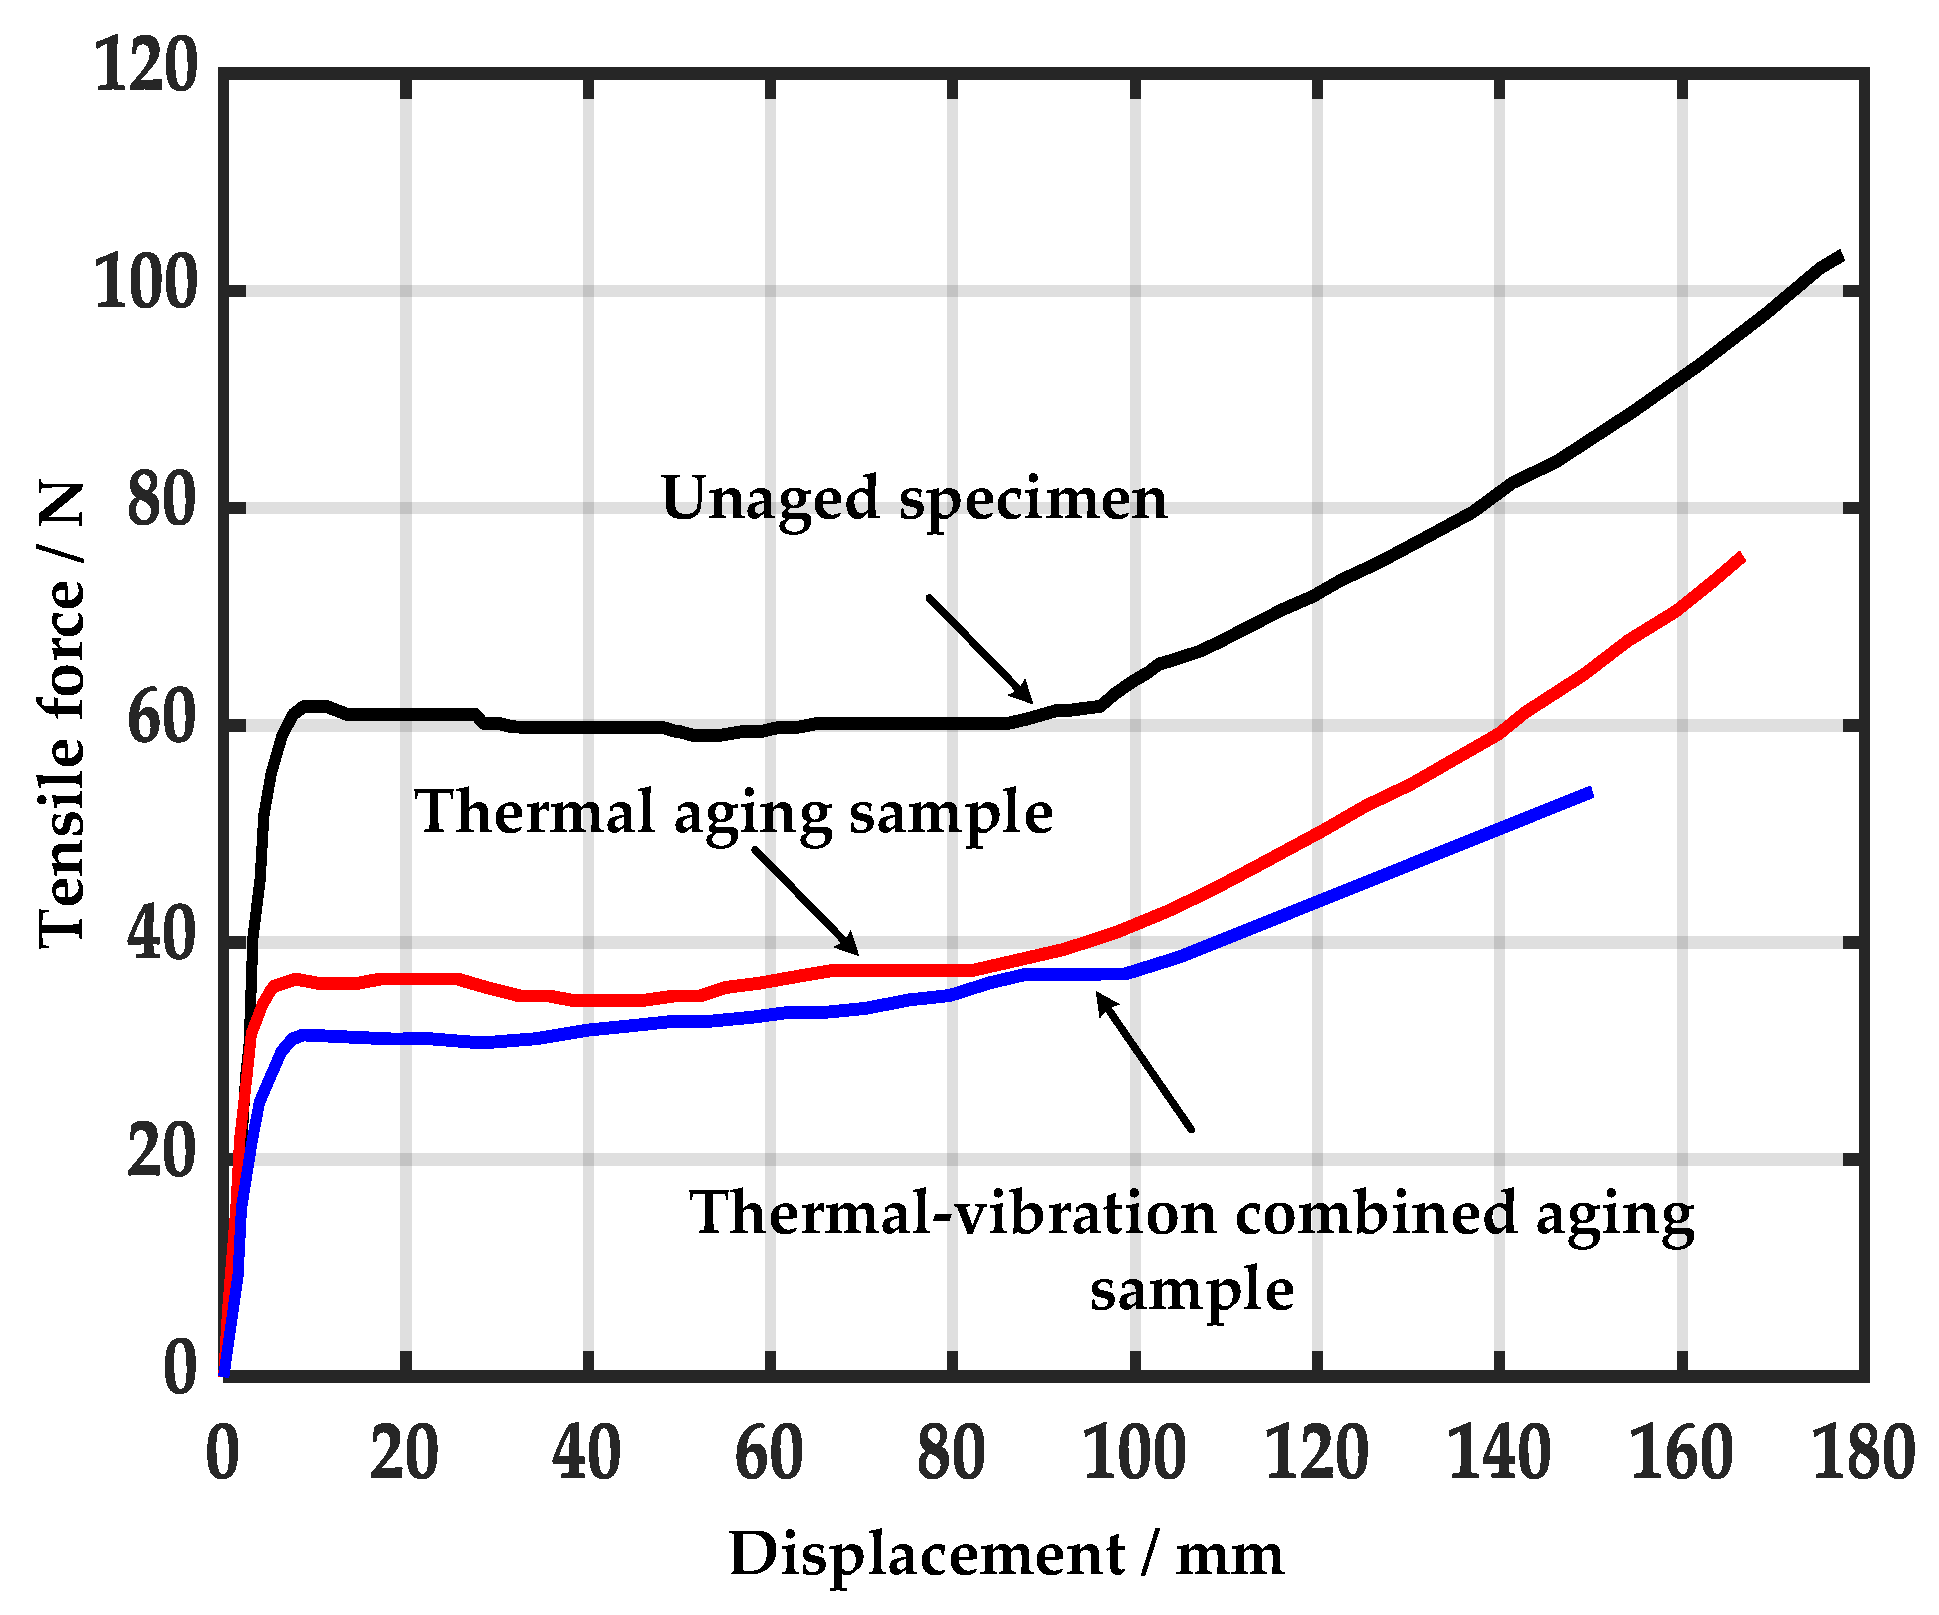
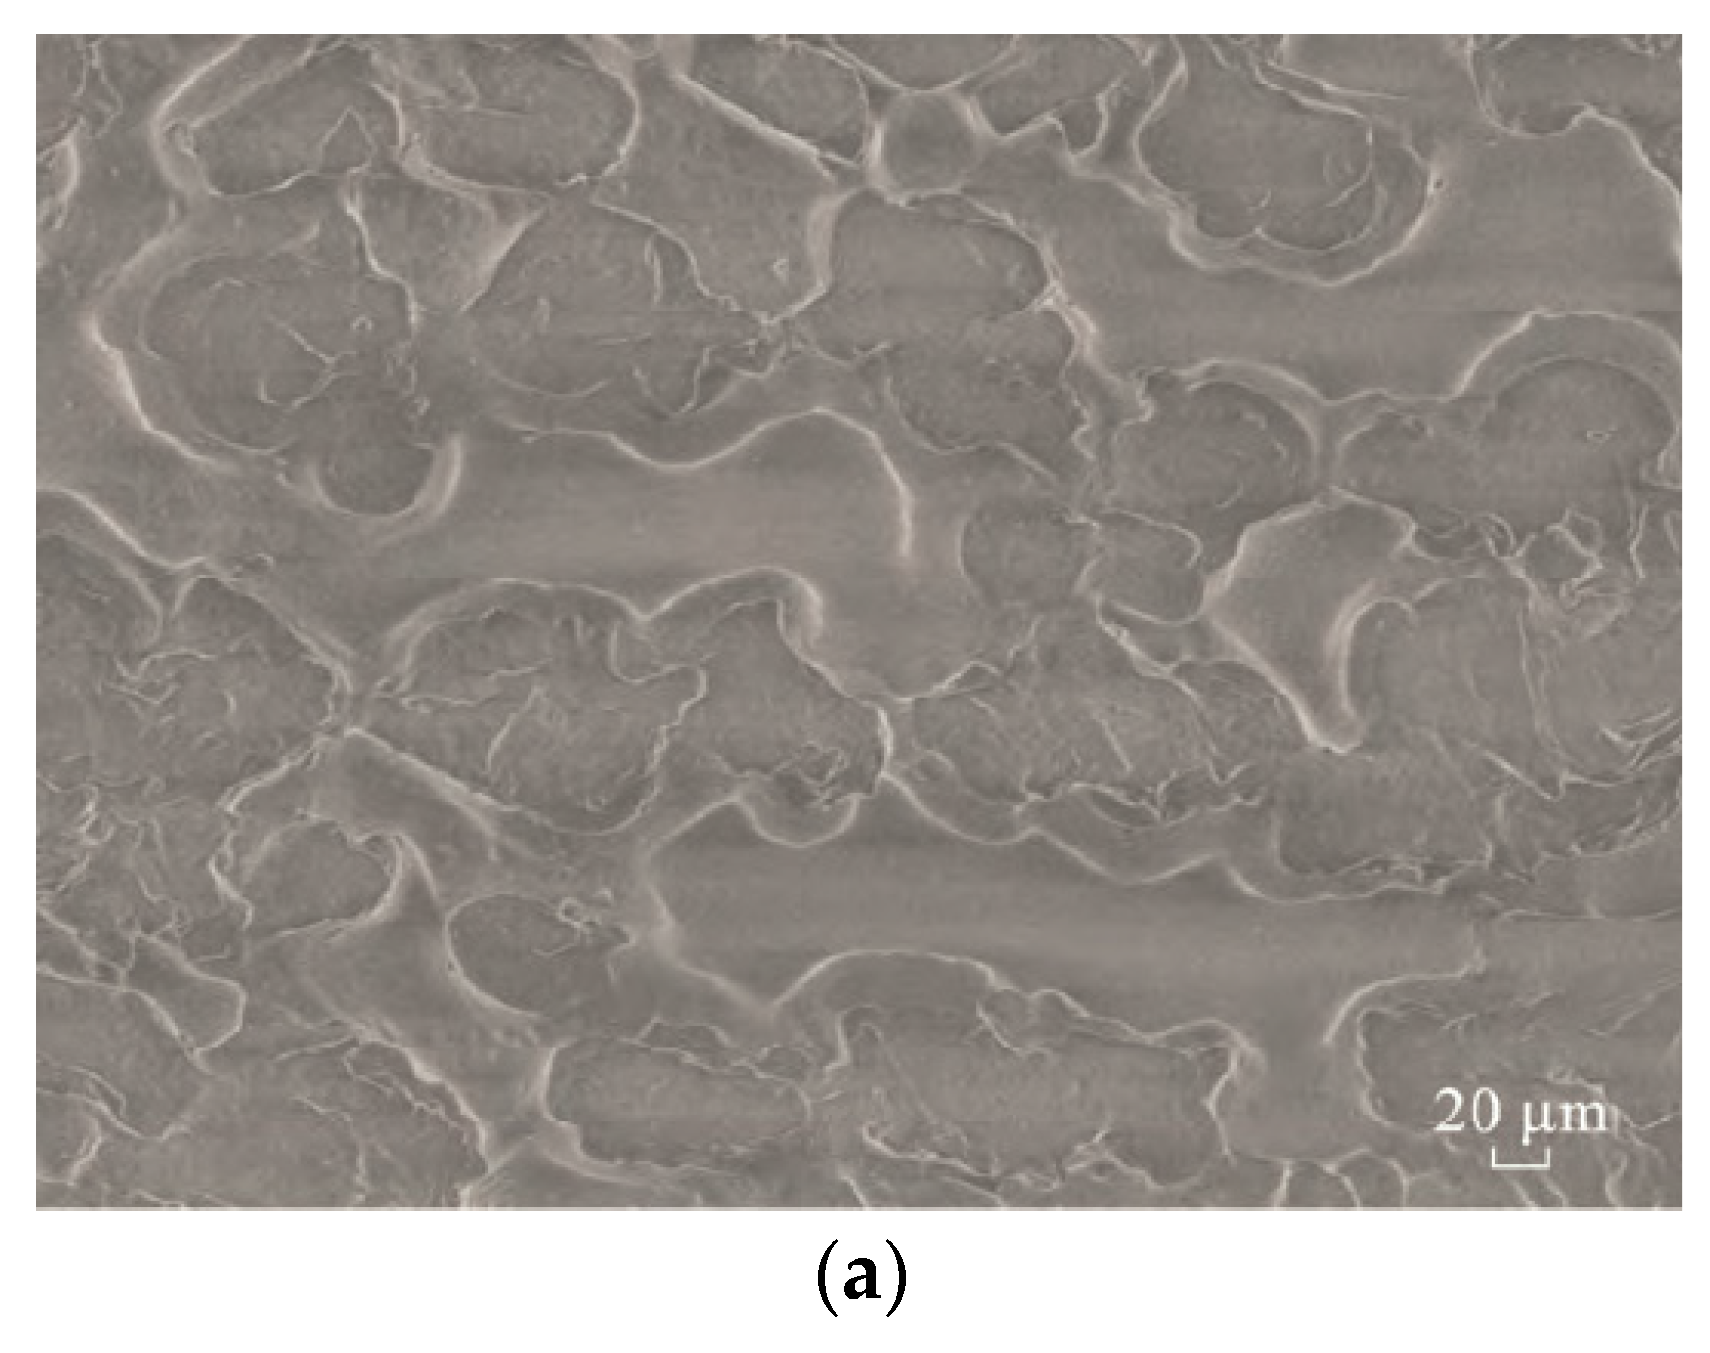
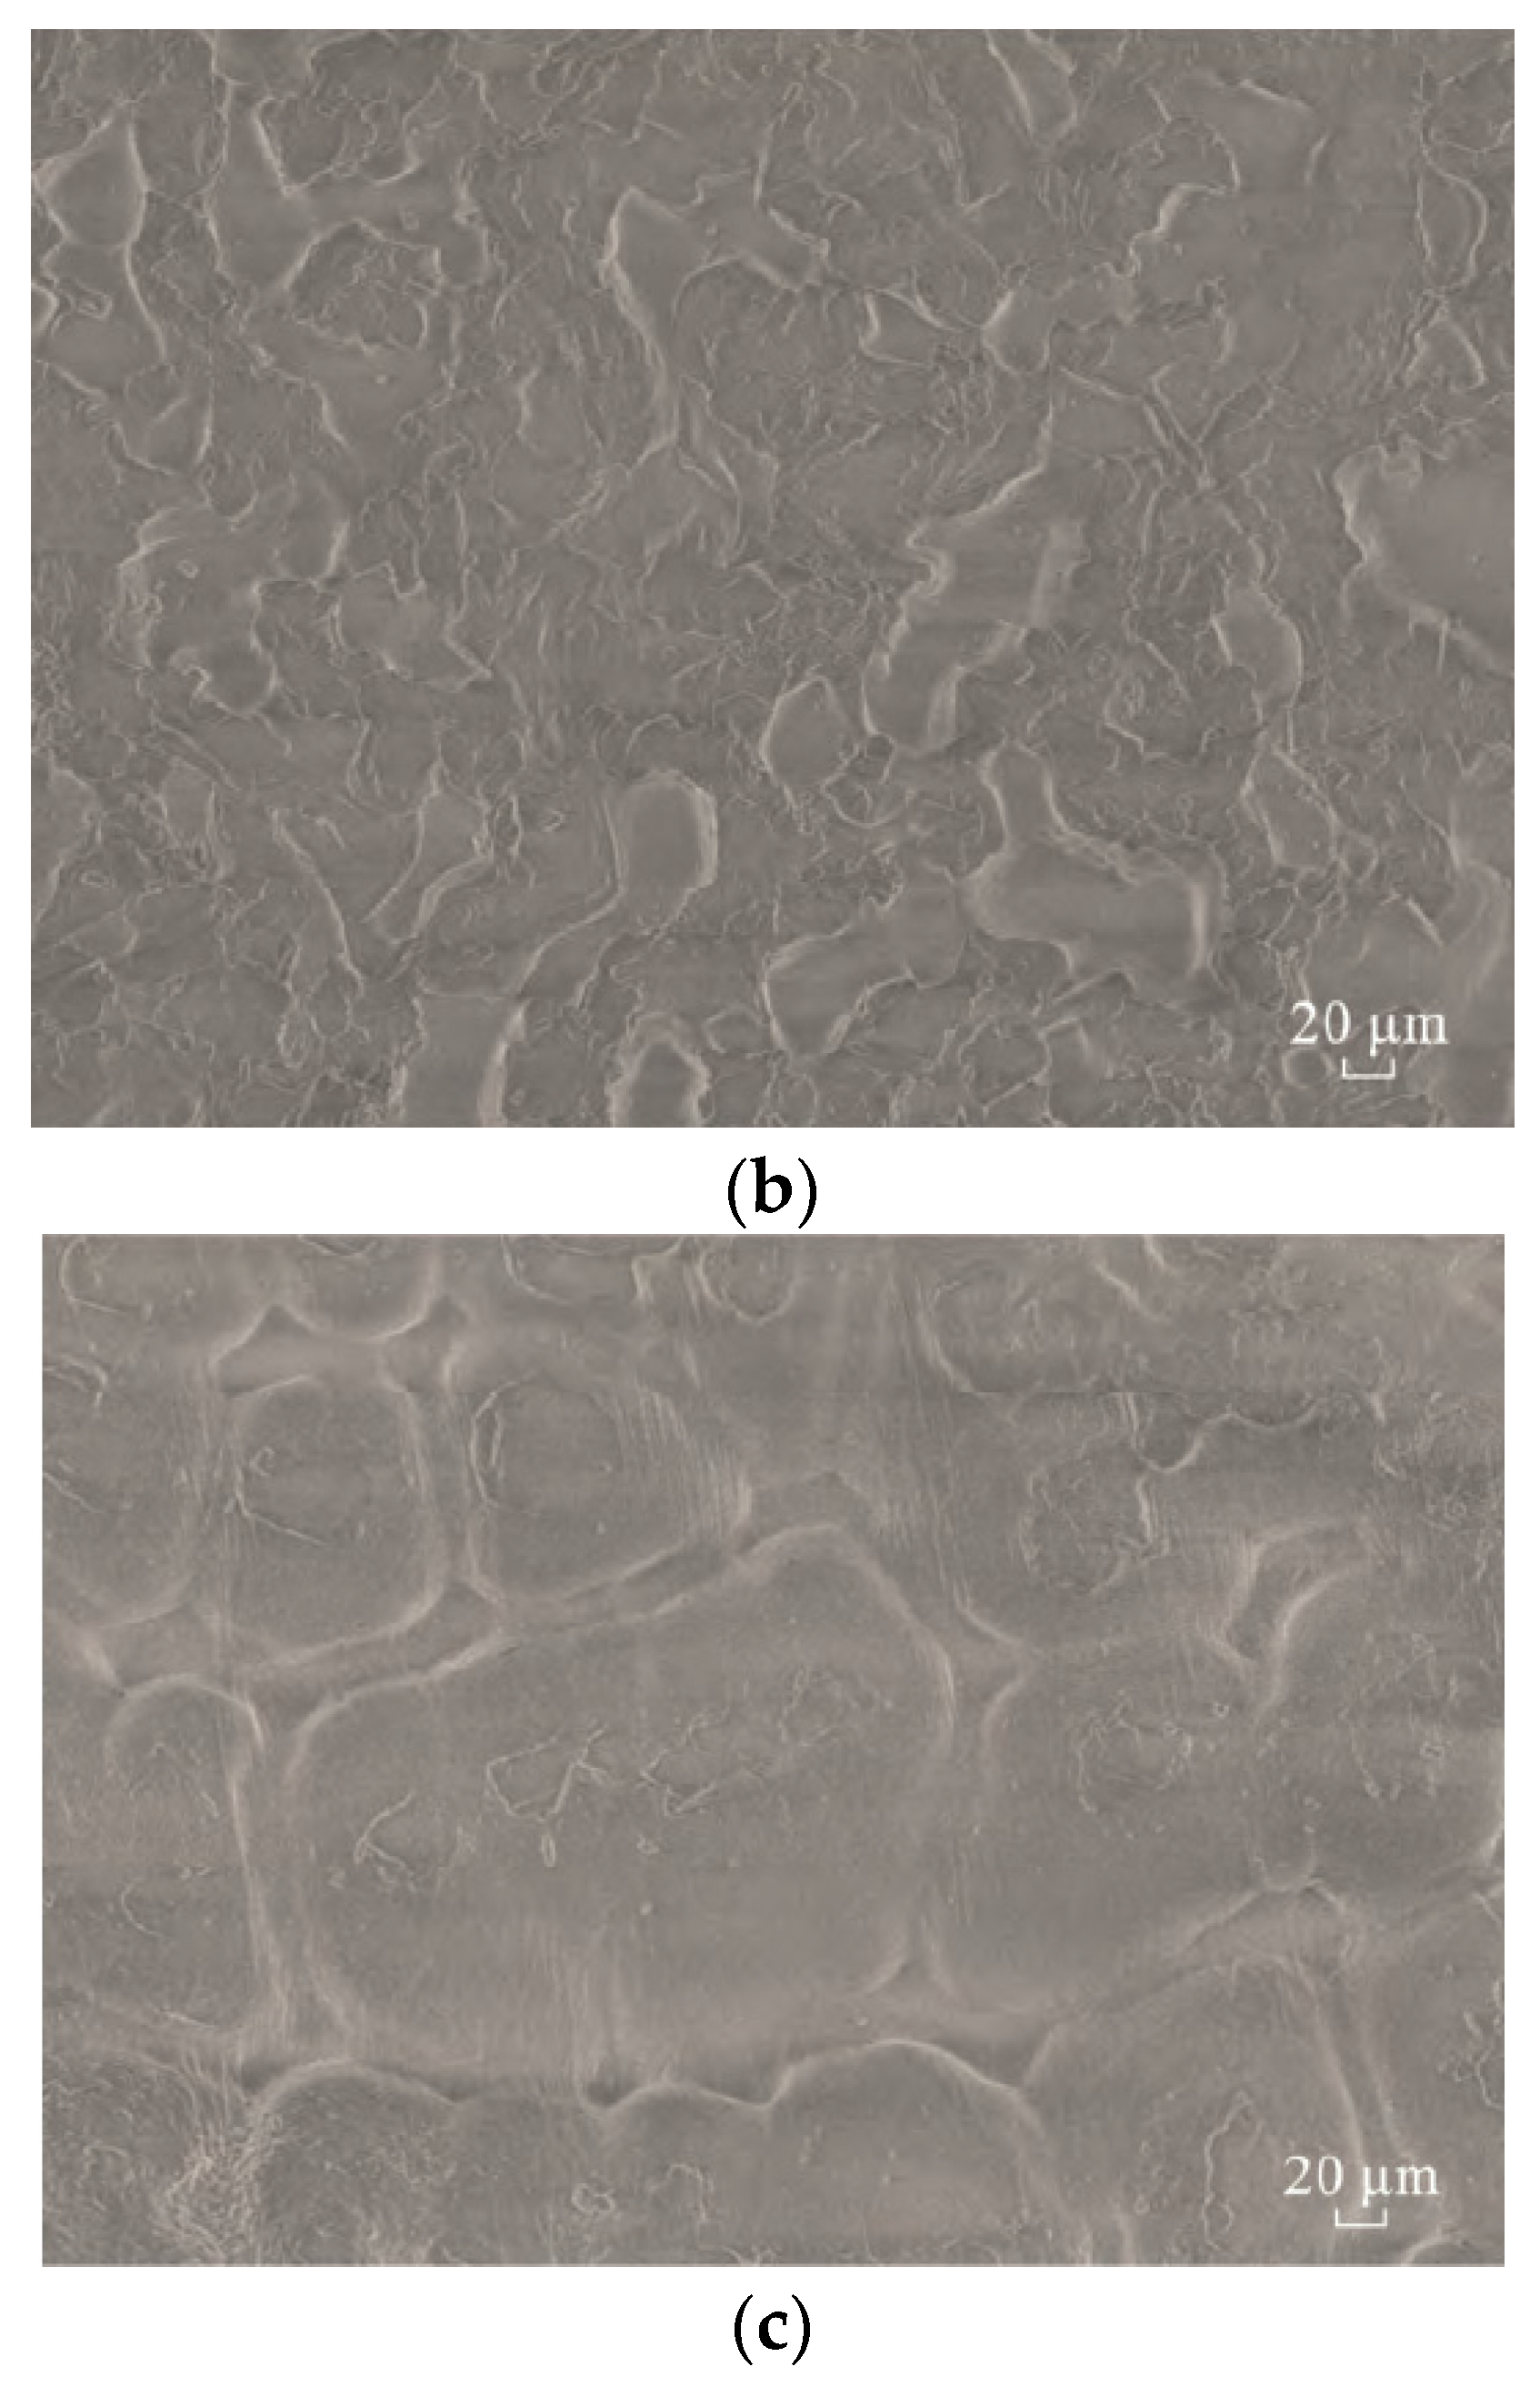
3.2.2. Study on the Deterioration Mechanism of Submarine Cables

XLPE cables are subject to a variety of stresses during service, resulting in changes in their chemical composition and physical form. The degradation of cross-linked polyethylene is irreversible and leads to its reduced life and insulation failure. After a long period of operation, the frequency of cable failure is high, leading to various operational accidents, and it is necessary to study the insulation failure state of cables in special operating environments [45]. Thermal failure is the main cause of XLPE insulation degradation, and the diagnosis of thermal cable aging can be achieved by using the parameters extracted from the dielectric spectrum using the high voltage frequency domain dielectric spectrum characteristics [46]. The presence of local defects such as micro-pores, bubbles, and protrusions of semi-conducting layers in the insulation layer can easily form electrical, thermal, and dendritic failures, leading to the degradation of cable insulation performance [47,48]. Ji Liu [49] proposes a frequency domain dielectric spectrum (FDS) test method based on an I/V conversion microcurrent acquisition device. The results of the study show that the nonlinear characteristic parameters can predict the electrical dendrite length of the cable, thus achieving an effective assessment of the cable insulation status.
When there is mechanical vibration acting on the cable during cable operation, alternating mechanical stresses are generated in its various structural layers, and under the action of long-term mechanical vibration, XLPE materials will become fatigued, causing a decrease in mechanical properties and electrical properties such as insulation resistance, which leads to insulation breakdown [50,51,52]. The heat generated by the current in the cable is difficult to distribute effectively, thermal forces are applied to each structure of the cable, and each structural layer is subjected to both temperature and mechanical vibrations during operation [53,54]. Zhenpeng Zhang [55] built a combined thermal-vibration failure test rig for XLPE cables to conduct the test, where the failure test was conducted at constant temperature and constant temperature-vibration, with the failure temperature set to 90 °C at the same time, the vibration frequency set to 100 Hz, and the aging test time to 1440 h.
(1)
Mechanical property test
Tensile tests were conducted on the constant temperature-vibration samples and constant temperature samples under the aging time of 1440 h, and the results are shown in Figure 10.
Under the action of vibration load, the XLPE cable is aged, resulting in the molecular bonds of the material being shifted, and when deformation occurs, some of the molecular chains in XLPE stretch and fracture due to stress. The material hardens and is easily destroyed, and the cable specimens’ mechanical properties decline significantly.
(2)
Scanning electron microscope test
The results of the original sample at the failure time of 1440 h are shown in Figure 11a, the results of the thermostatic failure are shown in Figure 11b, and the results of the thermostatic vibration are shown in Figure 11c.
Under alternating loads, the cable specimens produced a loose silver grain-like structure. In contrast to the single temperature failure, the firmness nest morphology of the specimens changed more prominently under both temperature and vibration, and the XLPE underwent aging when the molecular chains were broken, producing structures such as double bonds and side chains.
Cable insulation in the long-term operation process will occur a series of solid medium softening or melting and other morphological changes, low-molecular compounds, plasticizer volatilization, and other physical changes and chemical changes such as oxidation, electrolysis, ionization, generation of new substances, resulting in its electrical, mechanical and other properties gradually deteriorate such as conductivity and dielectric loss increase, become brittle, cracking, etc., these phenomena are collectively referred to as the aging of insulation. In practical application, cable insulation materials are often subject to the common effect of multiple aging factors at the same time, and the effect is not a simple superposition of the aging effect of various single factors. There are also interactions between them, so the aging mechanism is complex.

4. Insulation Condition Monitoring of Wind Power Cables

To ensure the safe operation of the cable, it is necessary to monitor the operating condition, which can achieve early warning of faults and reduce the losses caused by insulation faults. The current cable monitoring technology mainly includes periodic insulation monitoring, online temperature monitoring, partial discharge monitoring, and remaining life assessment. Residual life assessment is to determine whether the cable can continue to be used by calculating the dielectric loss and remaining dielectric strength of the insulation. Periodic insulation monitoring technology is carried out in the non-operating state of the cable, and its importance in judging the non-destructiveness of the cable insulation cannot be ignored, but there are limitations as the potential problems of insulation defects cannot be detected in time. Insulation monitoring is mainly divided into destructive tests for AC withstand voltage and non-destructive tests for insulation resistance, leakage current, and partial discharge detection. Figure 12 shows the partial discharge ultra-high frequency detection (UHF) method, and the principle is: GIS insulation failure is the cause of its internal electric field distortion, often accompanied by partial discharge phenomenon, resulting in pulse current, the current pulse rise time is only nanoseconds, the current pulse will excite a high-frequency electromagnetic wave, its main frequency is 0.3–3 GHz, the electromagnetic wave can be leaked from the disk insulator on the GIS, and the electromagnetic wave at the insulation gap is measured by the UHF sensor (frequency band is 0.3–3 GHz), and then the severity of partial discharge is analyzed according to the received signal strength.
Online monitoring technology can achieve continuous monitoring without cable outages and reflect the working status of the cable in actual operation. As more and more composite submarine cables are put into use, distributed fiber optic sensing technology is gradually used for online monitoring of submarine cables. Distributed sensing technology is easy to implant, has strong anti-electromagnetic interference, and has a long monitoring distance. The information of backscattered light is linked with vibration, temperature, and strain to achieve all-around condition monitoring [56]. Table 1 shows several cable online monitoring technologies.

4.1. Component Analysis Method

4.1.1. DC Component Method

Related studies have shown that the main cause of cable insulation aging is water dendrites, and when water dendrites grow into electric dendrites, insulation breakdown can cause operational accidents [57,58,59]. The DC component method is proposed based on the study of water dendrites generated during cable aging. Cables containing water dendrite defects have a core equivalent to the positive pole, a cable shield sheath and ground wire equivalent to the negative pole, and a circuit between the line core and the counter ground, where the dendritic defects form a rectification effect and a trace DC component in the leakage current. The DC component can be used as a basis for determining the presence of electrical dendrites, and the degree of deterioration is judged by the magnitude of the DC component [60].
The ground wire of the cable and the detection device is connected to accurately measure the DC component by the frequency at which the filter will work, interference signal, and other components filtered out because the original signal is small and needs to be amplified by the amplifier, through the A-D changer by analog-to-digital conversion, by the computer to analyze and process. Although the DC component method is simple to operate, the measured signal is very small, and the measurement signal is easily disturbed, so there are some limitations in its use.

4.1.2. AC Superposition Method

The AC superposition method is to superimpose an AC voltage of about 101 Hz on the cable shield and obtain a characteristic signal of 1 Hz to determine the aging degree of the cable insulation. When a voltage of two times the working frequency is applied, the cable will produce a significant characteristic current signal, and the characteristic current reaches its maximum when the superimposed voltage is 101.4 Hz. Studies have shown that this signal is only generated on cables that are deteriorating and that characteristic currents do not occur on intact cables. The AC superposition method requires an additional power supply, is not easily disturbed by external signals, the installation process of the detection device is simple and fast, and the measurement accuracy is high. This method also has certain limitations, high requirements for the superimposed power supply, inability to locate faults, lack of cases for monitoring insulation, and evaluation criteria for insulation deterioration, which are subject to subsequent research [61].

4.2. Distributed Fiber Optic Sensing Technologies

4.2.1. Phase-Sensitive Optical Time-Domain Reflection Technology (φ-OTDR)

When laser conduction in optical fibers encounters changes in refractive index caused by density inhomogeneities in non-crystalline materials, a portion of the light is scattered backward and returns to the incident end of the fiber. The attenuation power of the light through the backscattered light, especially the discontinuity feature, corresponds to a series of events occurring in the fiber optic line. The detected backscattered light power returned at various points along the length of the fiber must contain information about the loss suffered by the light as it travels along the fiber, thus allowing the attenuation of the fiber to be analyzed and determined, so this method is called the backscattering method.
The analysis of the measurement curve provides insight into the uniformity, defects, breaks, and joint coupling of the fiber. Using the phase-sensitive optical time-domain reflection technique, the attenuation of the uniform section of the fiber can be measured, the continuity of light, the location of physical defects or breaks can be checked, the loss and location of joints can be measured, and the length of the fiber can be measured. The phase-sensitive optical time-domain reflectometer can acquire the phase information of light carried by backward Rayleigh scattering in optical fibers and is suitable for sensing vibration information. The distributed fiber optic sensing system uses a narrow linewidth pulse detection light as the sensing light source; when a fiber disturbance is detected, the disturbance intensity at the disturbance location changes accordingly due to the elastic effect, causing a change in the phase information characteristics of the scattered light, and the backward scattered light with the disturbance information is passed through the optical interferometer, converting the change in optical phase to a change in optical intensity, using mediation of specific algorithms thus extracting the vibration information [62]. The online monitoring technology based on the phase-sensitive optical time-domain reflection technology is sensitive, and the data are easy to process, using the optical fibers already present in the submarine cable as sensing units, including intrusion alarm and location systems, abnormal vibration detection, etc., to avoid damage caused by ocean currents and ship anchor activities [63].

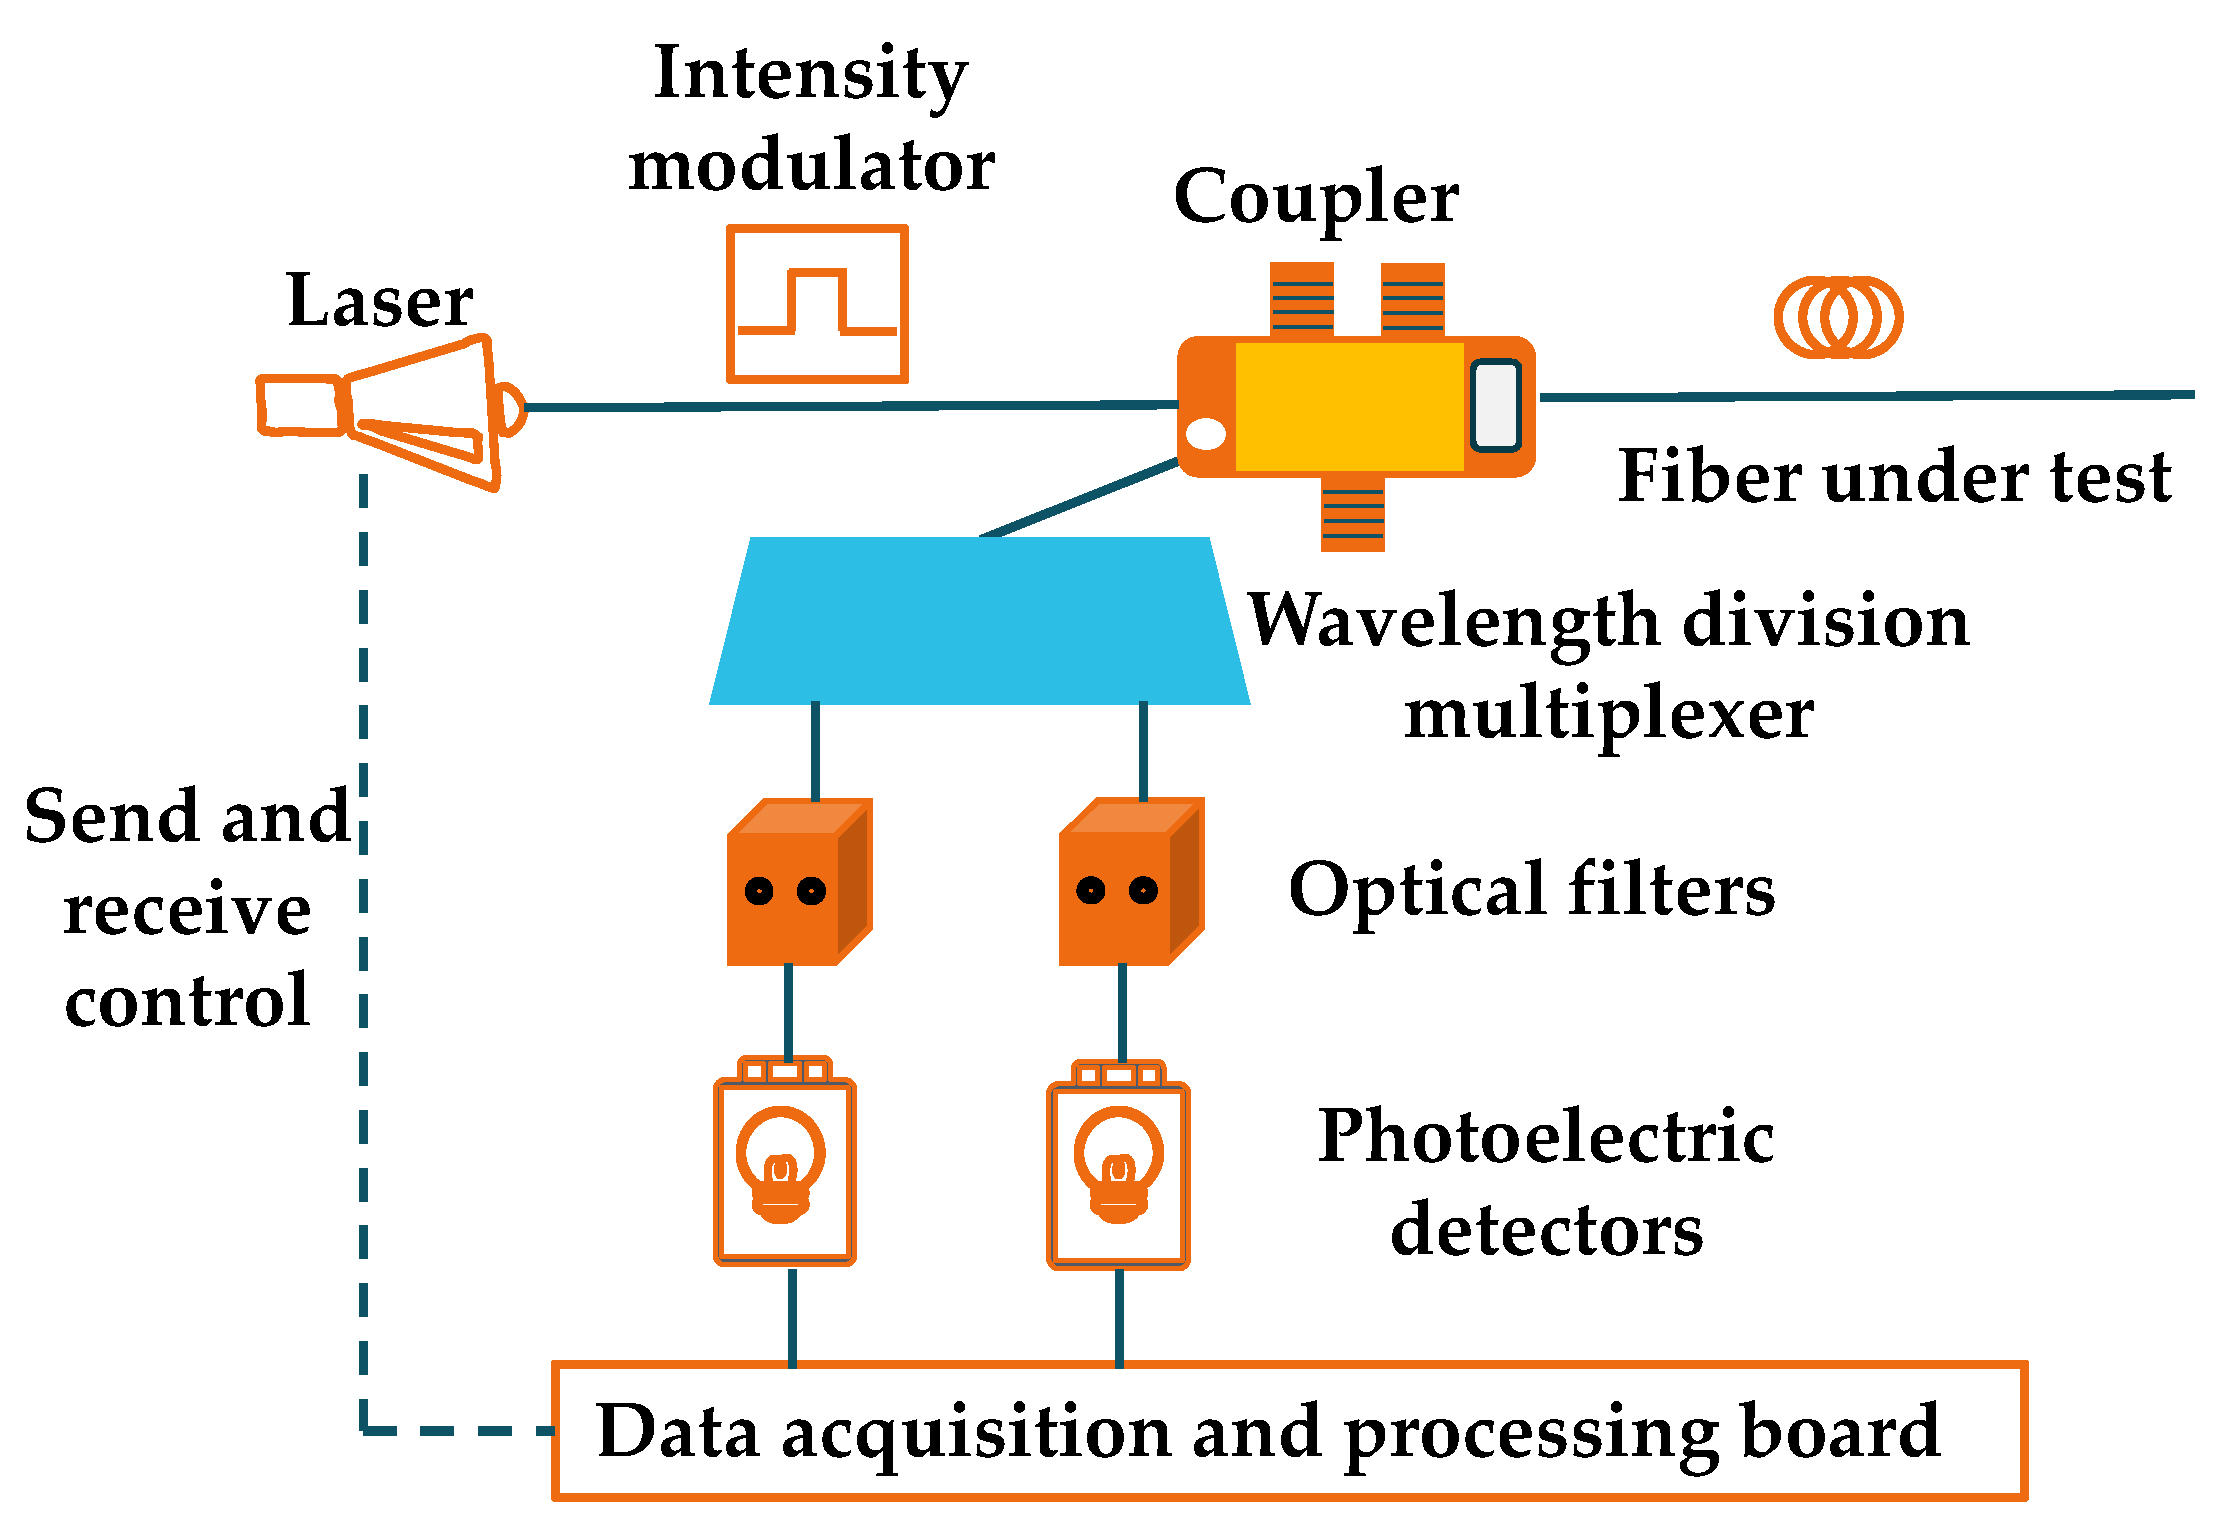
4.2.2. Raman Optical Time Domain Reflection Technique (ROTDR)

During actual operation, the temperature of the cable body changes, affecting the characteristics of the insulation [64,65]. When a cable fails, the temperature at the defect rises, and early warning of abnormal cable temperatures can prevent its long-term operation in an overheated state, and Raman optical time-domain reflection technology can measure the temperature of optical fibers in submarine cables in real time. Figure 13 shows the structure of the temperature measurement system.
Raman scattering is the frequency shift of scattered light when injected photons interact with fiber molecules, including Stokes scattered light and Anti-Stokes scattered light. Among them, Anti-Stokes is more sensitive to temperature, and the light intensity is linearly related to temperature, so Anti-Stokes can be used as a signal channel and Stokes as a comparison channel, and the ratio of the two intensities is applied to adjust the temperature, and the absolute temperature value can be calculated. When using Raman optical time domain reflection technology to monitor the cable temperature, the measurement distance can reach 60 km, and the control unit triggers the laser to generate light pulses through the coupler into the fiber; the wavelength division multiplexer separates the backscattered light into Anti-Stokes component and Stokes components after filtering the photodetector collects the characteristic signal with temperature, and finally, after filtering, the photodetector acquires the characteristic signal with temperature and finally obtains the real-time temperature.

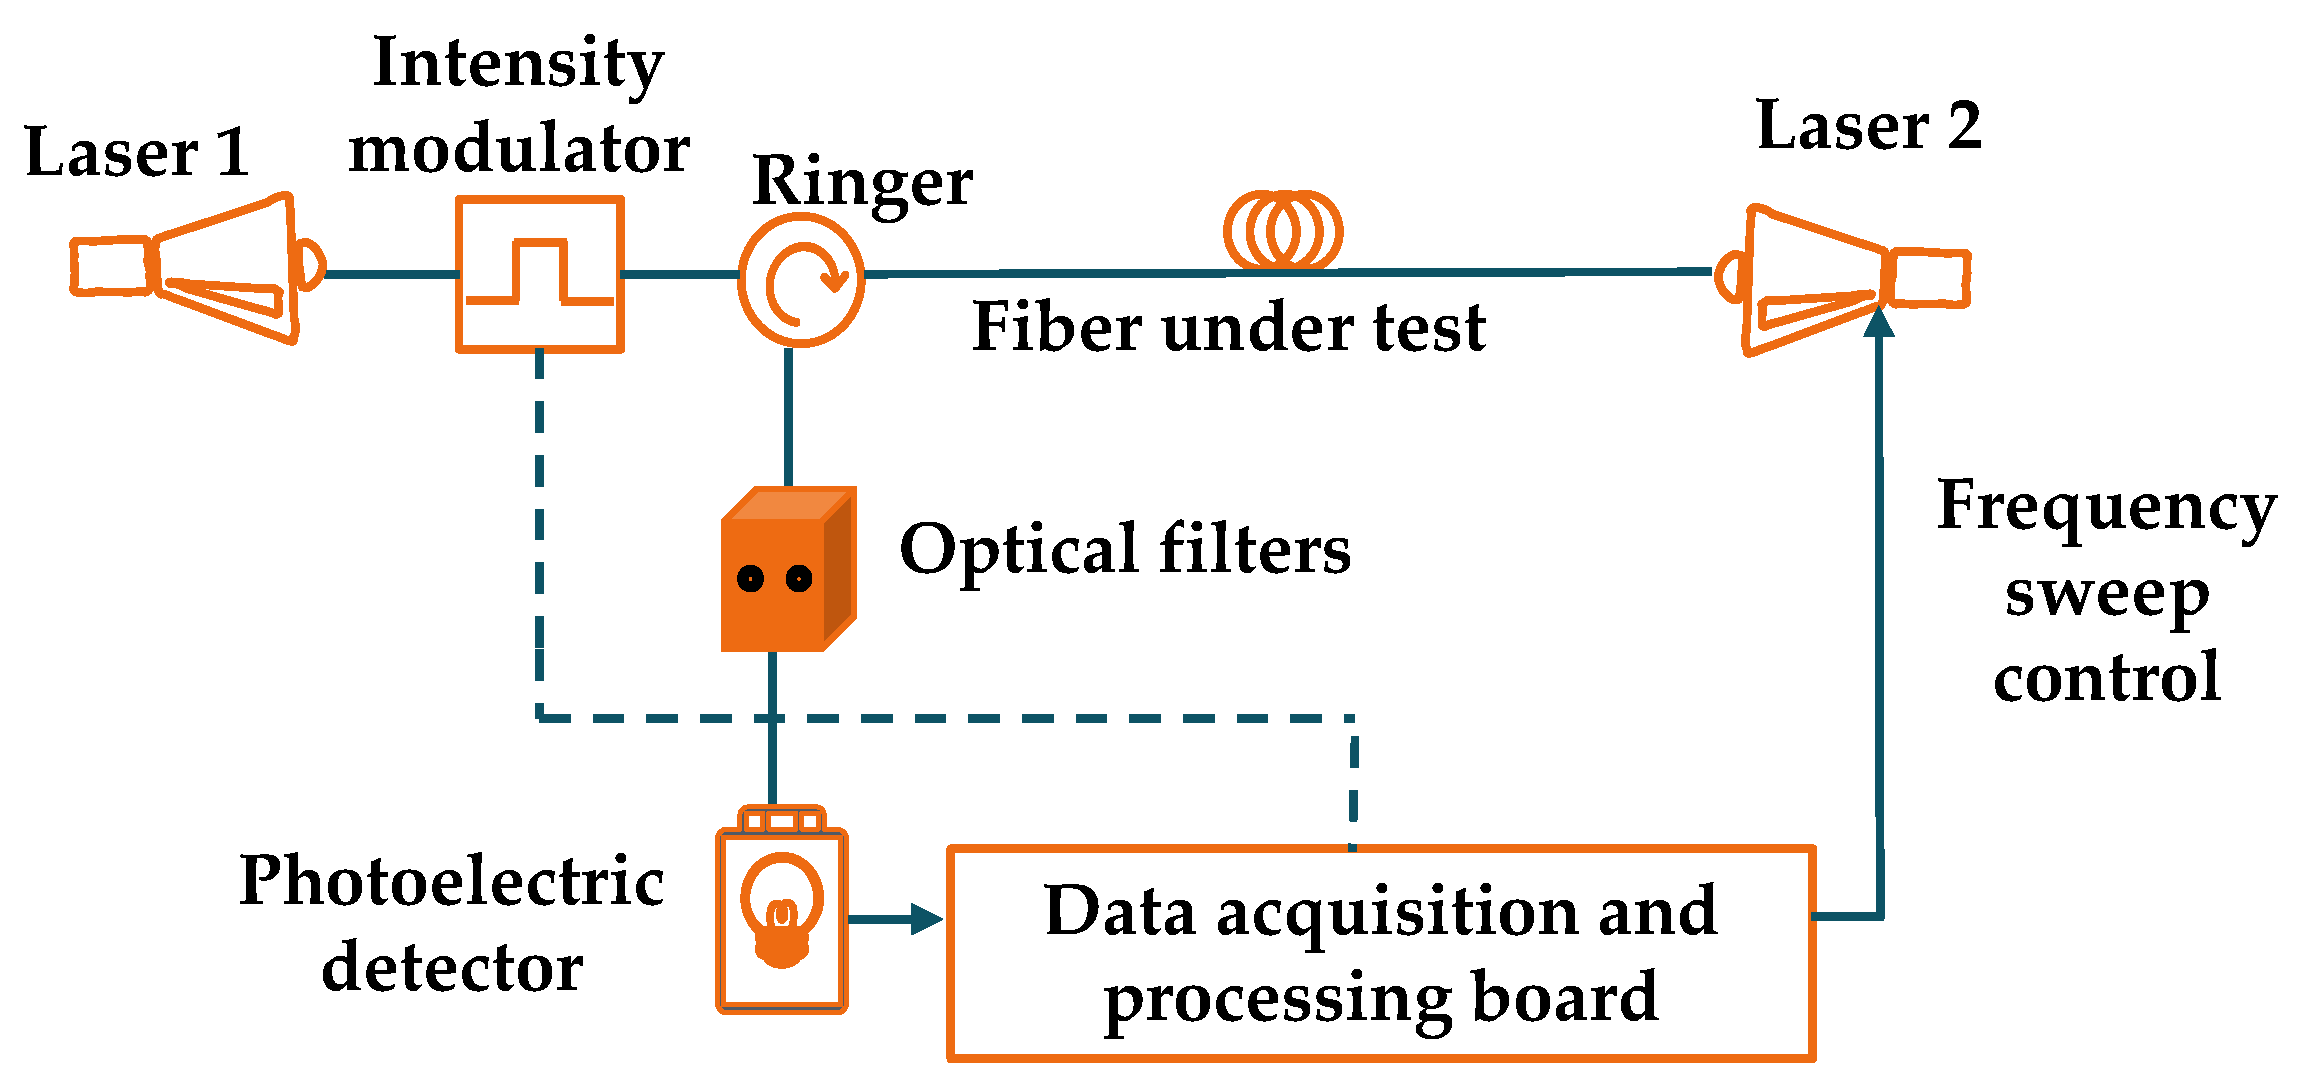
4.2.3. Brillouin Optical Time Domain Analysis (BOTDA)

External forces can cause local stress anomalies in submarine cables, and Brillouin optical time domain analysis technology can measure and locate the temperature and strain of optical fibers in submarine cables. Backward Brillouin scattering in optical fibers is the scattering caused by the interaction of incident light with acoustic waves in the fiber, and the scattered light undergoes a frequency shift called Brillouin frequency shift [66]. Scattering can be divided into spontaneous Brillouin scattering and excited Brillouin scattering, and thus distributed fiber optic sensing techniques based on backward Brillouin scattering can be divided into optical time-domain reflectometer and optical time-domain analyzer. The optical time-domain analyzer utilizes the exciting Brillouin scattering principle, which improves the signal-to-noise ratio and enables a significant increase in monitoring distance and accuracy.
The magnitude of the Brillouin frequency shift is proportional to the speed of sound in the fiber, and both the refractive index and the speed of sound in the fiber are related to factors such as the temperature of the fiber and the stress to which it is subjected, which makes the Brillouin frequency shift vary with temperature and stress [67]. The system structure of the Brillouin light time-domain analysis technique is shown in Figure 14, where laser 1 at both ends of the fiber under test generates pump light, and laser 2 generates probe light injected into the sensing fiber. When the frequency difference between the pump light and the probe light is close to the Brillouin frequency shift of the fiber to be measured, the power of the pump light is transferred to the probe light based on the Brillouin effect, and then the Brillouin frequency shift of the fiber to be measured can be obtained by sweeping the probe light so that the strain distribution at the scattering location can be obtained according to the linear relationship between the frequency shift and the strain [68].

5. Insulation Defect Detection of Wind Power Cables

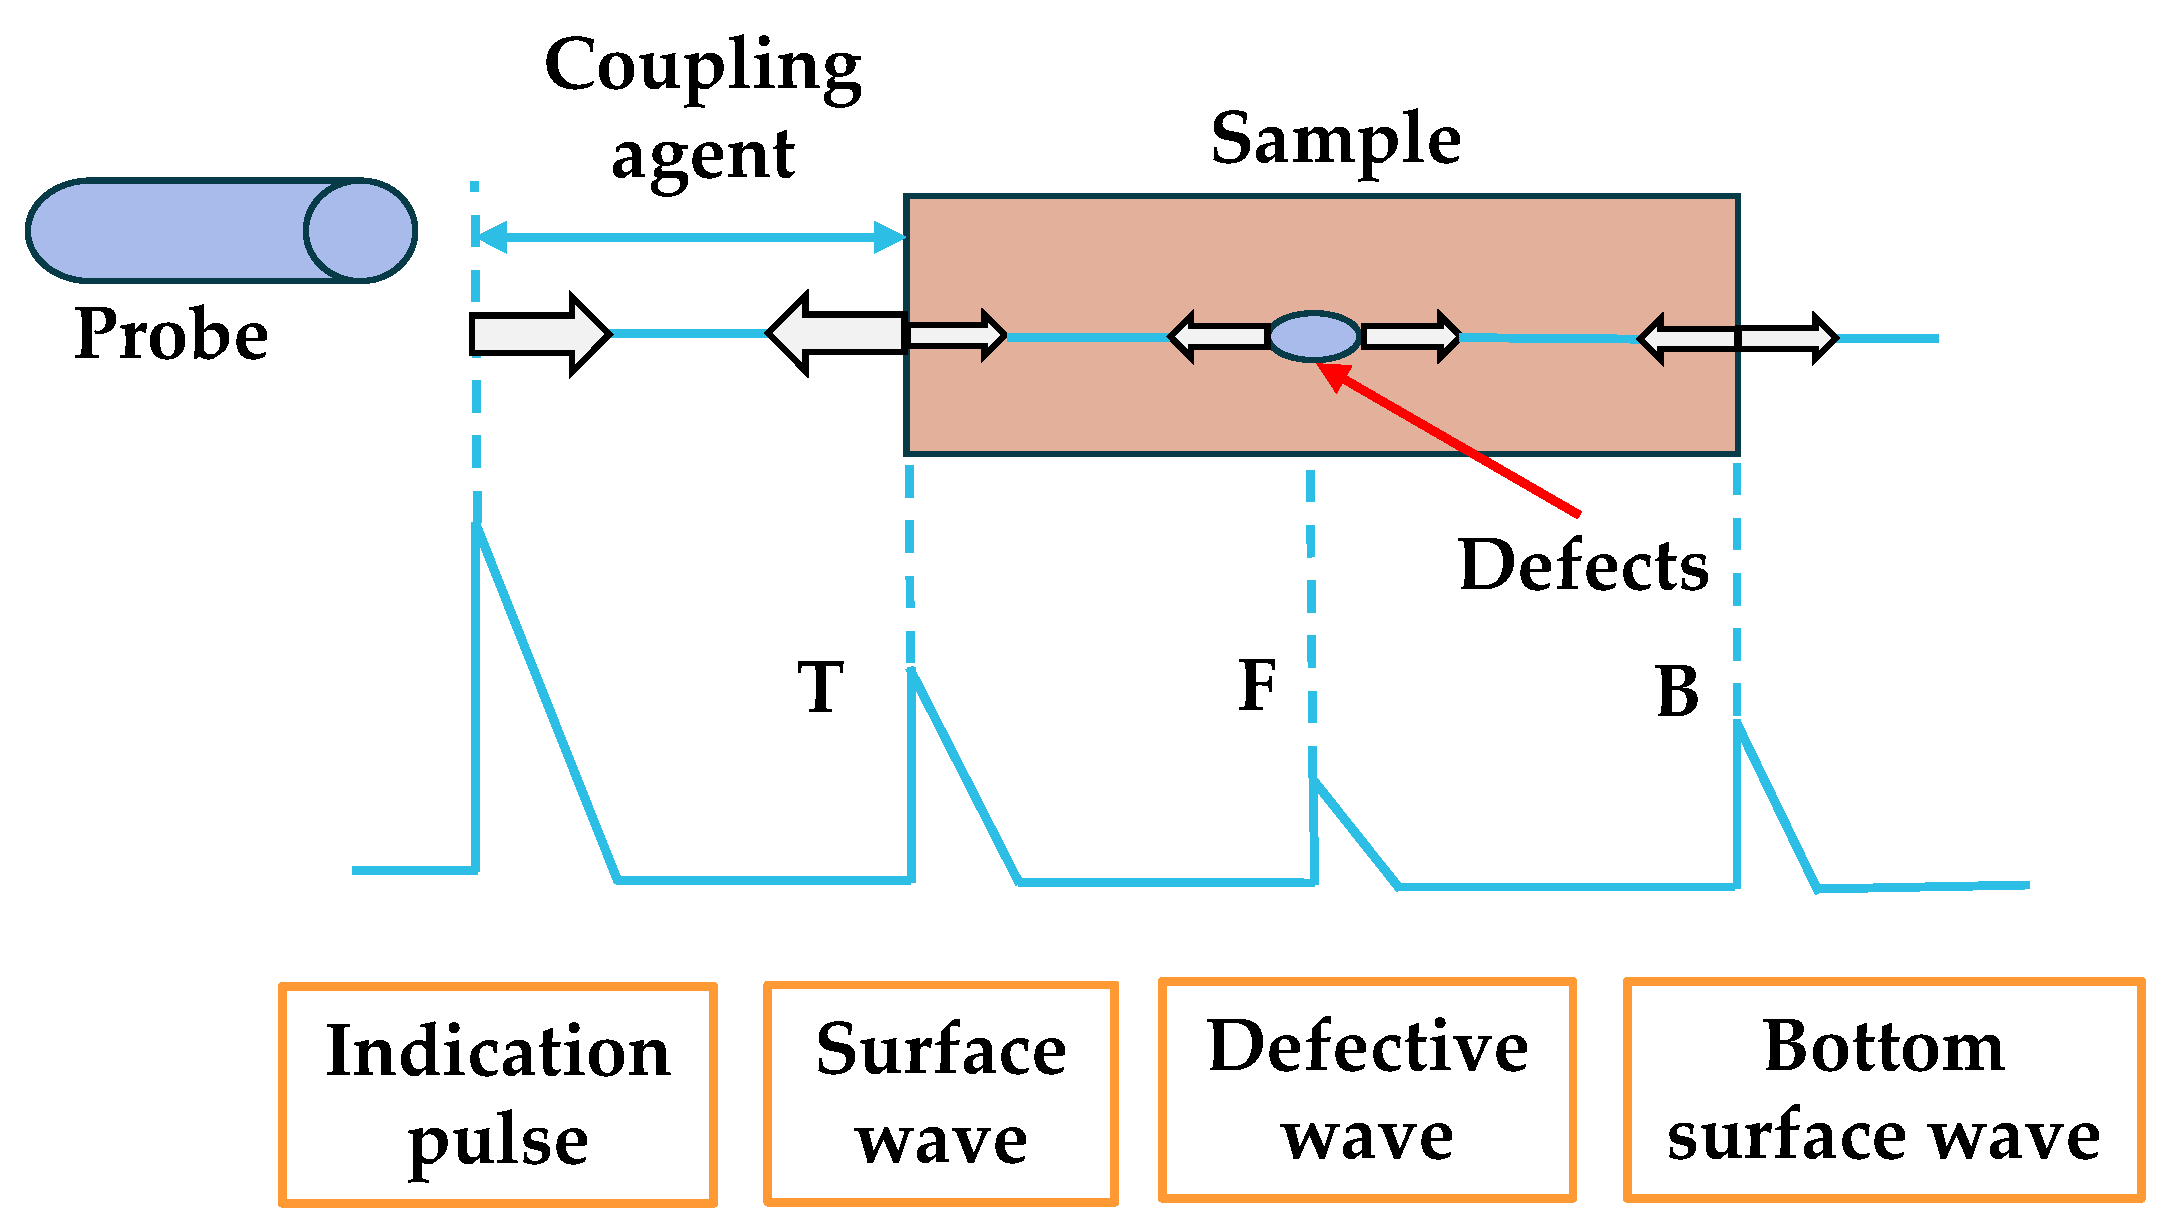
5.1. Ultrasonic Inspection Research

Defects such as air gaps, moisture, and impurities are generated during the manufacturing, installation, and operation of the cable, making a protrusion between the main insulation and the semi-conductive layer, which affects the insulation performance of the cable. The cable insulation failure is mainly caused by the aging of electric and water branches, and the insulation defects inside the cable accelerate the development of electric and water branches, thus accelerating the insulation failure. The results of condition monitoring can only reflect the overall condition of the cable, and nondestructive testing techniques can locate and image the internal defects in the material and reflect the changes in the local properties inside the main insulation [69].
Ultrasonic inspection is a non-destructive testing method. Ultrasonic parameters can characterize the structure and properties of the material and can achieve the localization and imaging of internal defects in the insulation. Its application in the condition inspection of power equipment has attracted extensive research due to various technical advantages such as low cost and ease of field inspection. A schematic representation of ultrasonic inspection is shown in Figure 15.
The ultrasonic probe generates a pulse, and the probe generates ultrasonic waves after the pulse is triggered. When the ultrasonic waves pass through the contact surface of the coupling agent and the specimen, which are two different media, part of the sound waves are refracted and enter the specimen, and at the same time, the contact surface reflects part of the ultrasonic signal to form a surface pulse wave (wave T). The refracted acoustic wave is reflected when it reaches the specimen interface, forming a bottom pulse wave (wave B), and if there is a defect in the specimen, a defect wave F will appear between wave T and wave B. The amplitude of the defect wave can be used as a basis for judging the size of the defect [70].
Ruocheng Wang et al. verified the detection capability of the ultrasonic system by creating bubbles, air gaps, and steel pin defects in the cable insulation [69]. When the ultrasonic probe is perpendicular to the cut surface of the bubble-insulation material interface, the ultrasonic probe completely receives the reflected wave with a large echo amplitude and dark imaging color. When the probe distance becomes larger, and the sound wave is not perpendicular to the interface, part of the echo is reflected, the echo amplitude is small, and the imaging color is light. Compared with bubble defects, air gap defects did not appear ripple image, indicating that the air gap defects’ acoustic impedance changes are small, according to the ultrasonic detection of the location of the calculated defects and the actual artificially created defect location relative error of only 1.6%. For the specimen stabbed into the steel needle to simulate the metal impurity defects inside the cable insulation, the imaging results show that the stress around the steel needle is the most concentrated, which is due to the compression of the needle tip on the rubber insulation material. In addition, the actual burial depth of the steel needle can be calculated. Figure 16 shows the ultrasonic detection results.

5.2. Future Outlook of Wind Power Cables Insulation Defect Detection

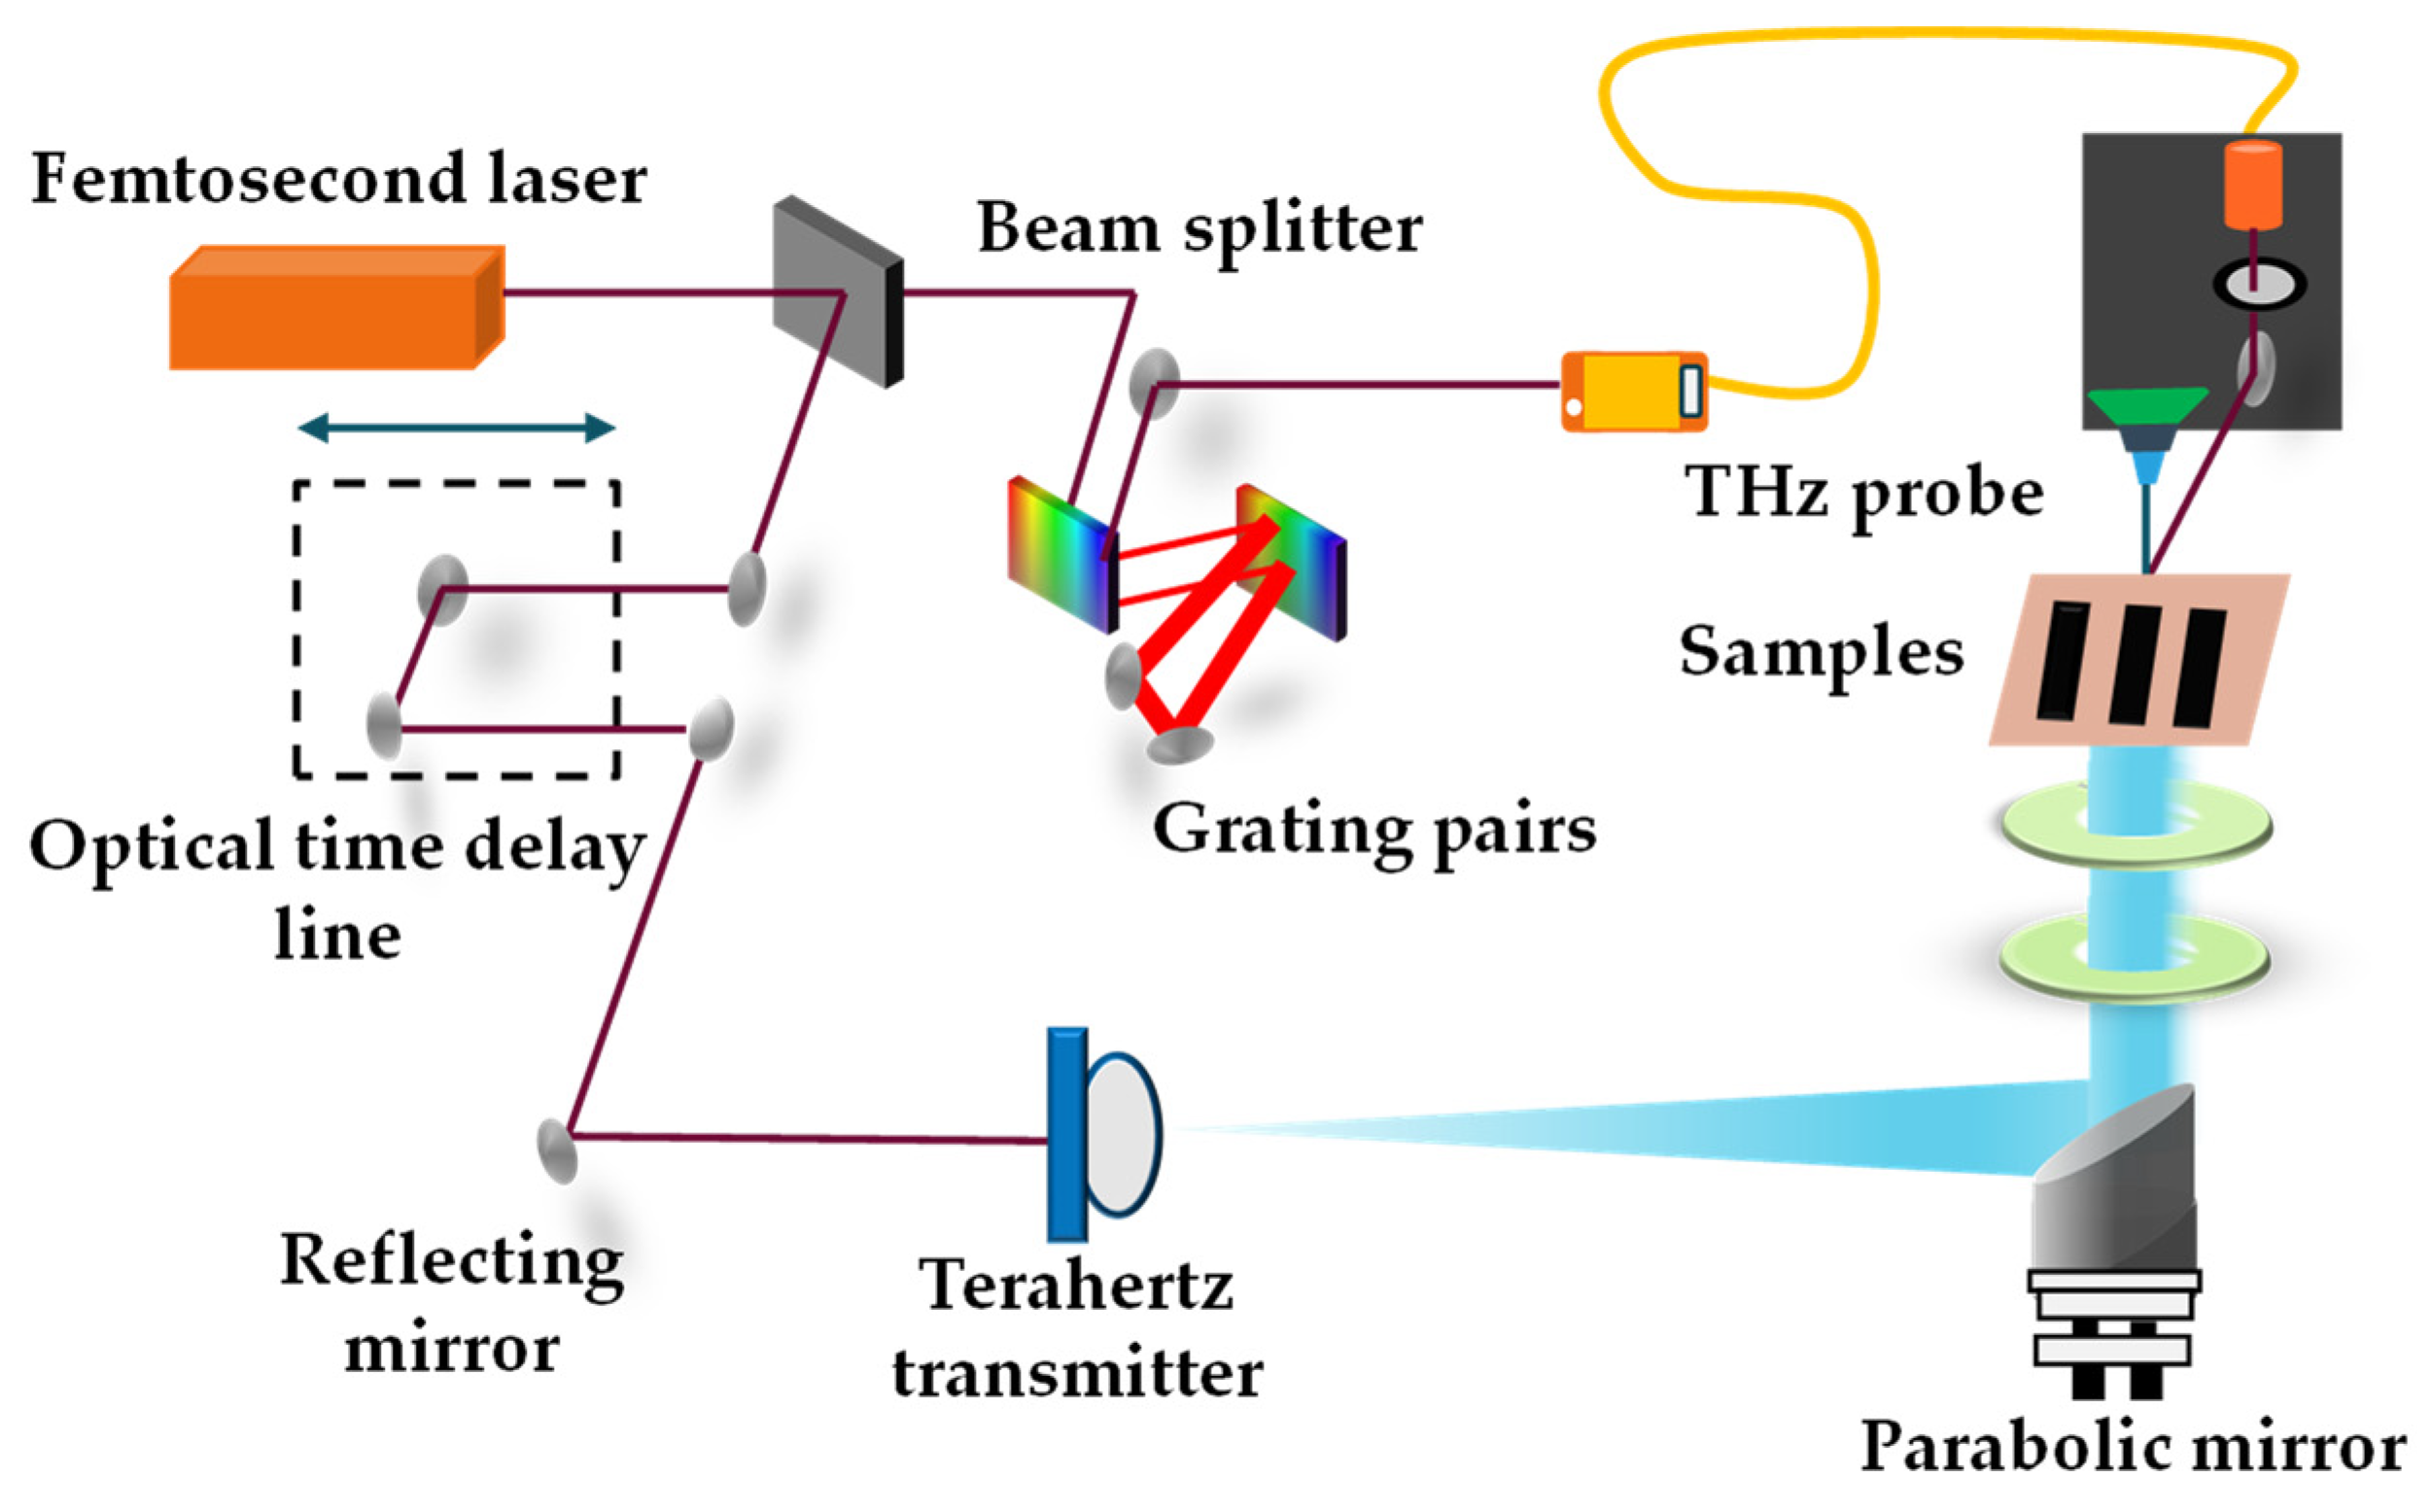
5.2.1. Terahertz Time-Domain Spectroscopy Systems

The current detection methods for insulation layer defects, such as voltage withstand test, insulation resistance method, partial discharge detection method, etc., require high voltage, strong current experimental environment, complex and tedious operation, high requirements for safety, and are unable to detect air gap size, shape, and other information. Traditional non-destructive testing techniques, such as infrared and ultraviolet detection, ultrasonic detection, and X-ray and other methods, have problems such as blind detection area, low sensitivity, and non-negligible impact of X-rays on the human body. In recent years, the continuous research of femtosecond laser technology has promoted the use of terahertz time-domain spectroscopy (THz-TDS) in the detection of insulation defects in power equipment. Terahertz is an electromagnetic wave with a frequency between 0.1 and 10 THz, with a wavelength between microwave and infrared waves, and contains a wealth of physical and chemical properties [71].
Terahertz waves have good penetration into dielectric materials and nonpolar substances and can detect hidden defects inside the insulation well, where a beam splitter divides the femtosecond pulse into pump light and detection light. The pump light is incident on the terahertz emitter, and the resulting terahertz pulse source is reflected by a parabolic mirror onto the sample to be measured. The terahertz pulse containing the sample information passes through a two-dimensional translational detector together with the detection light. The lock-in amplifier amplifies the electric field of the pulse’ containing the sample information and inputs it to the computer for processing. The time delay between the pump light and the detection light is adjusted by a time delay system to obtain the entire time domain waveform of the terahertz pulse. The spectral waveform of the measured sample is obtained by the Fourier transform, and the optical parameters such as dielectric constant, absorption coefficient, and refractive index of the measured sample are obtained after data analysis and processing [72]. A non-invasive detection method based on terahertz technology for onboard cable terminals of moving trains was proposed to detect whether the cable terminals contain moisture and determine the location and depth of moisture, providing a new idea for nondestructive cable inspection [73]. Figure 17 shows the terahertz imaging principle.

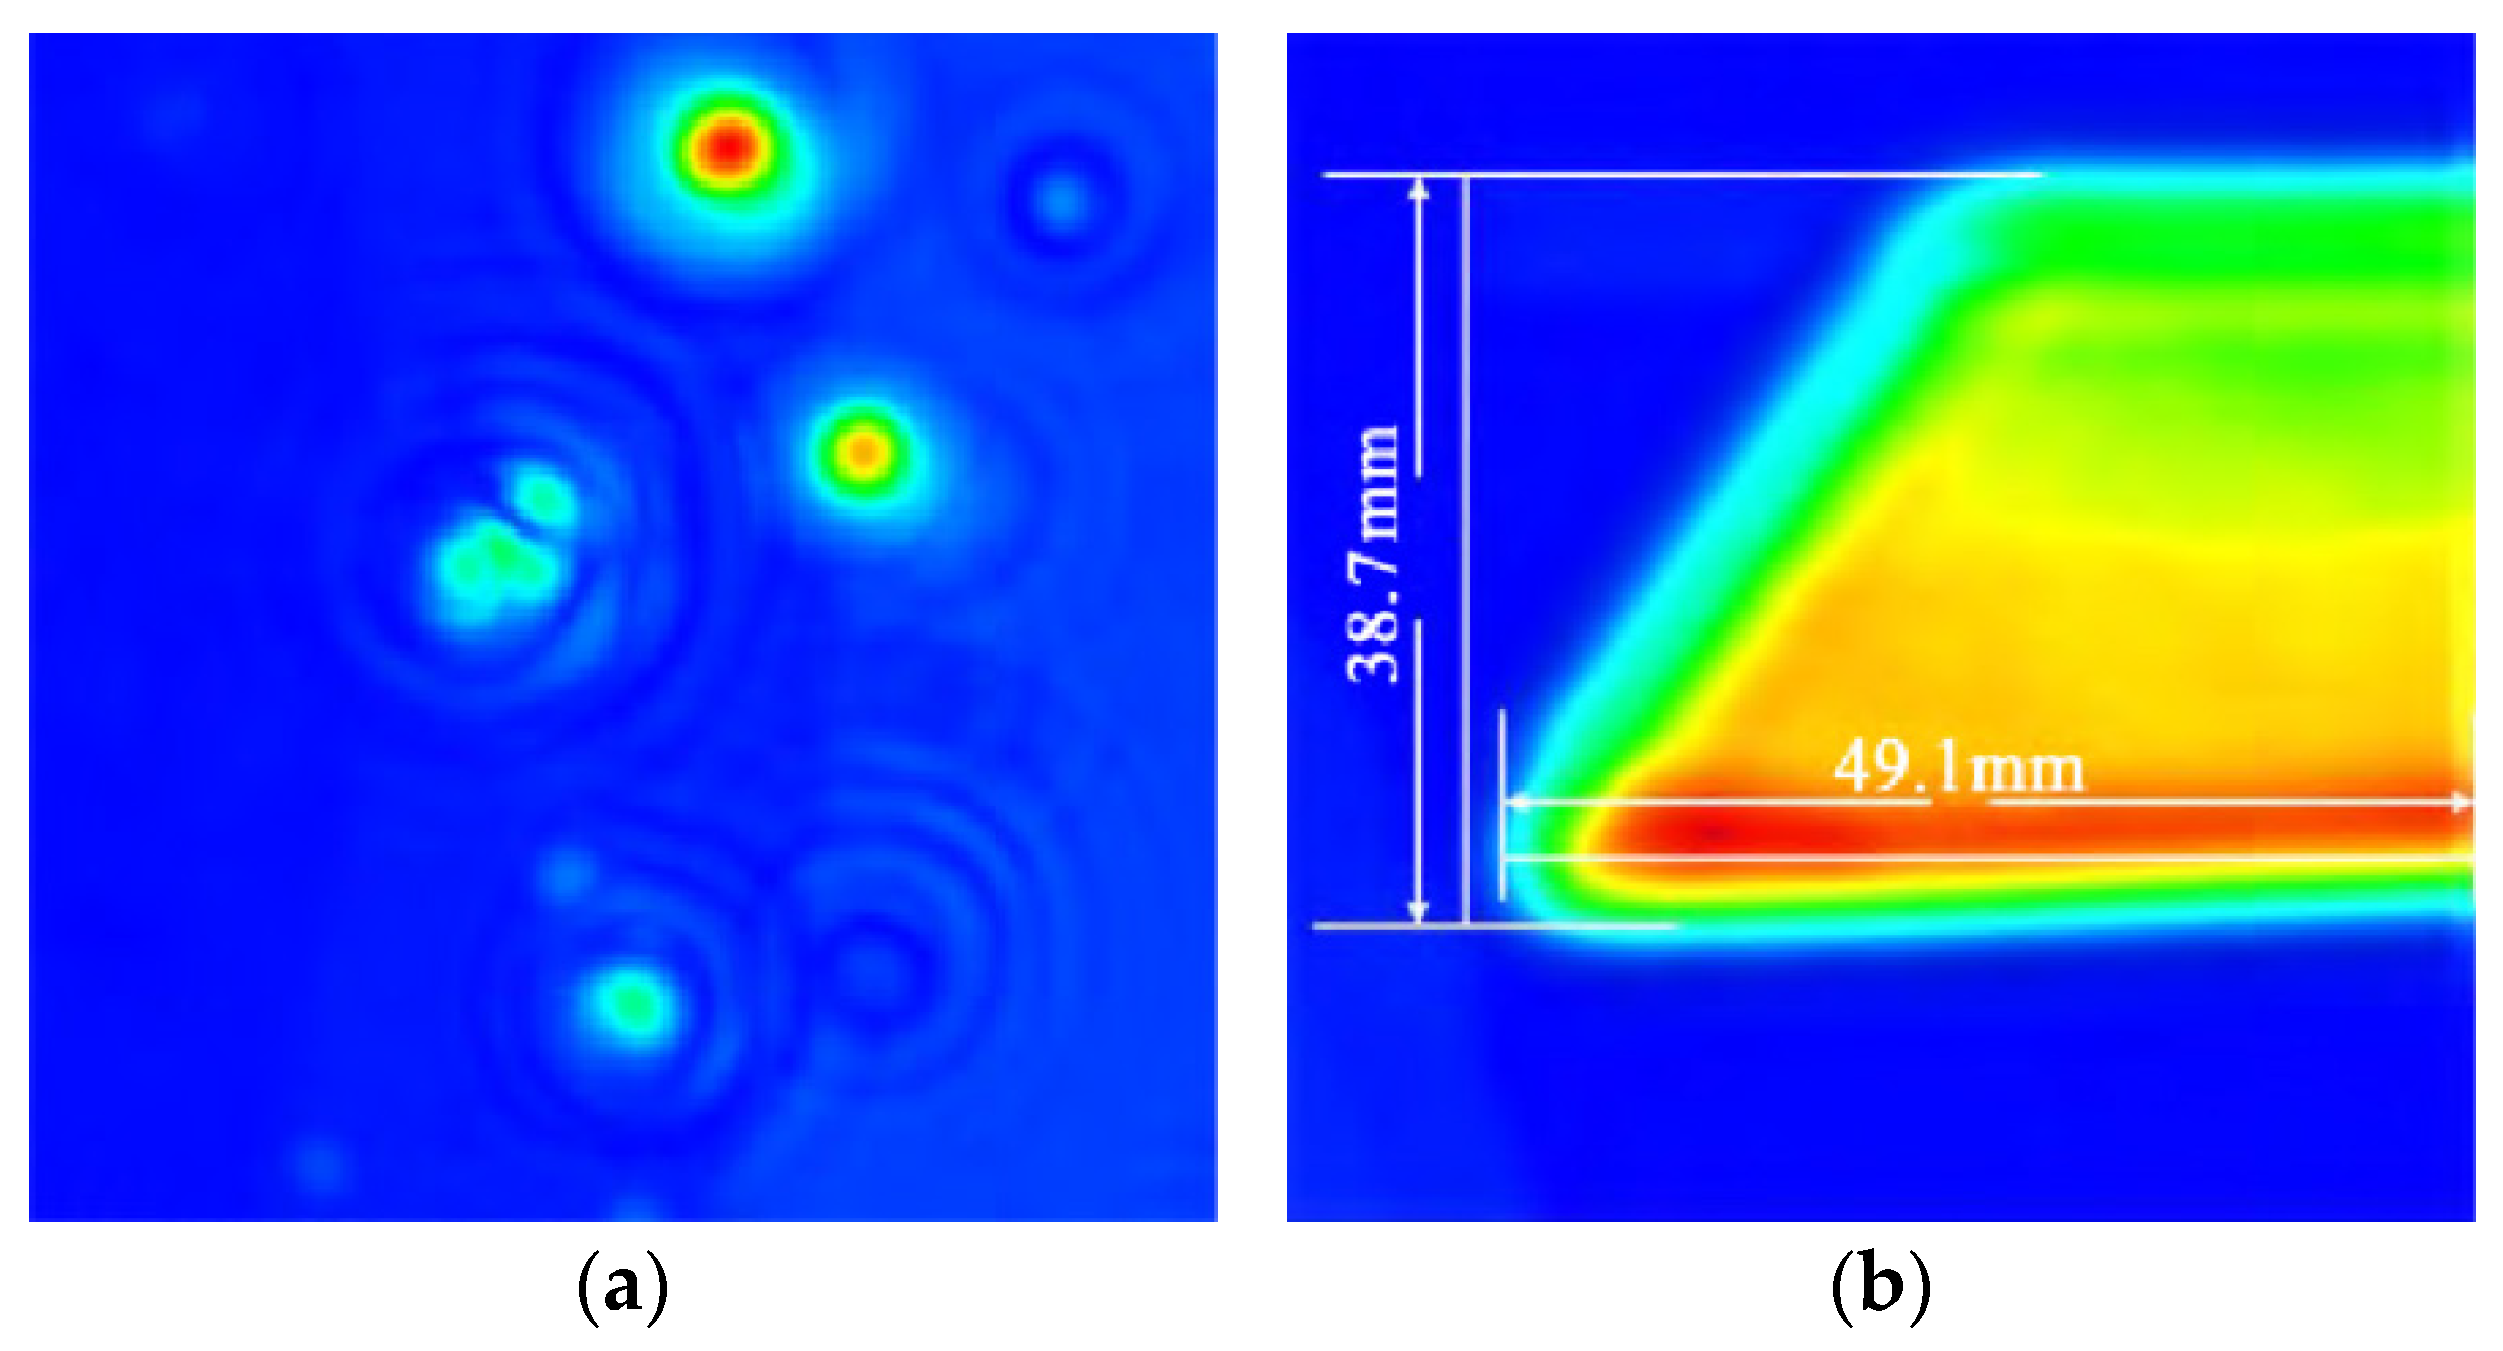
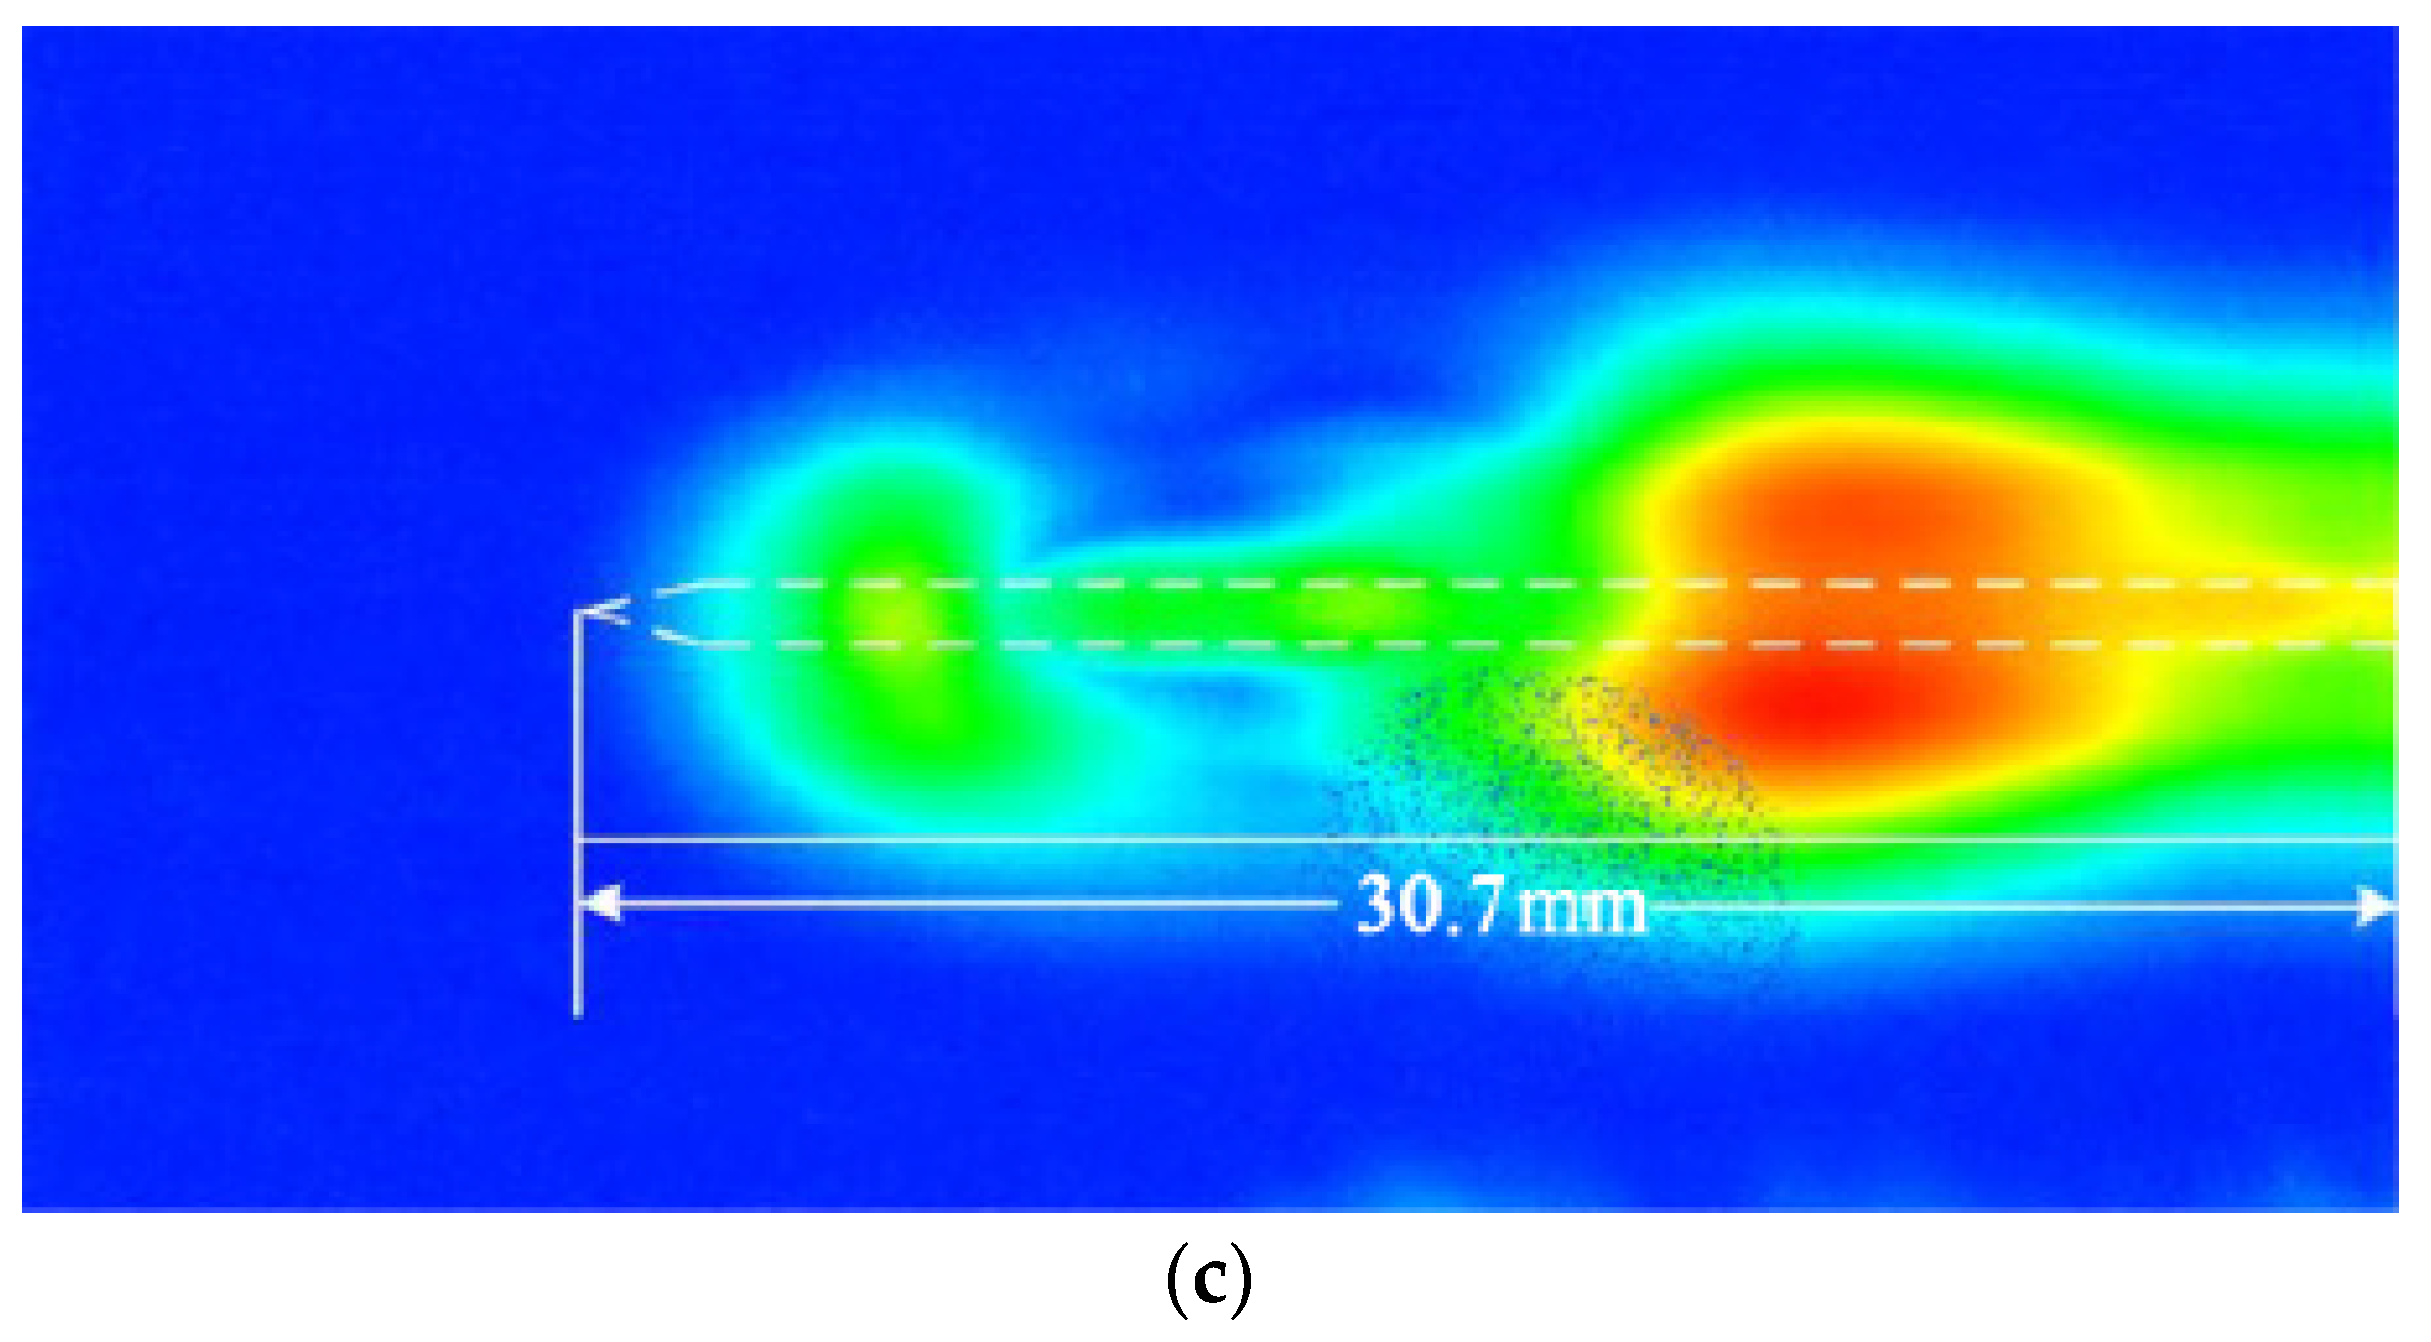
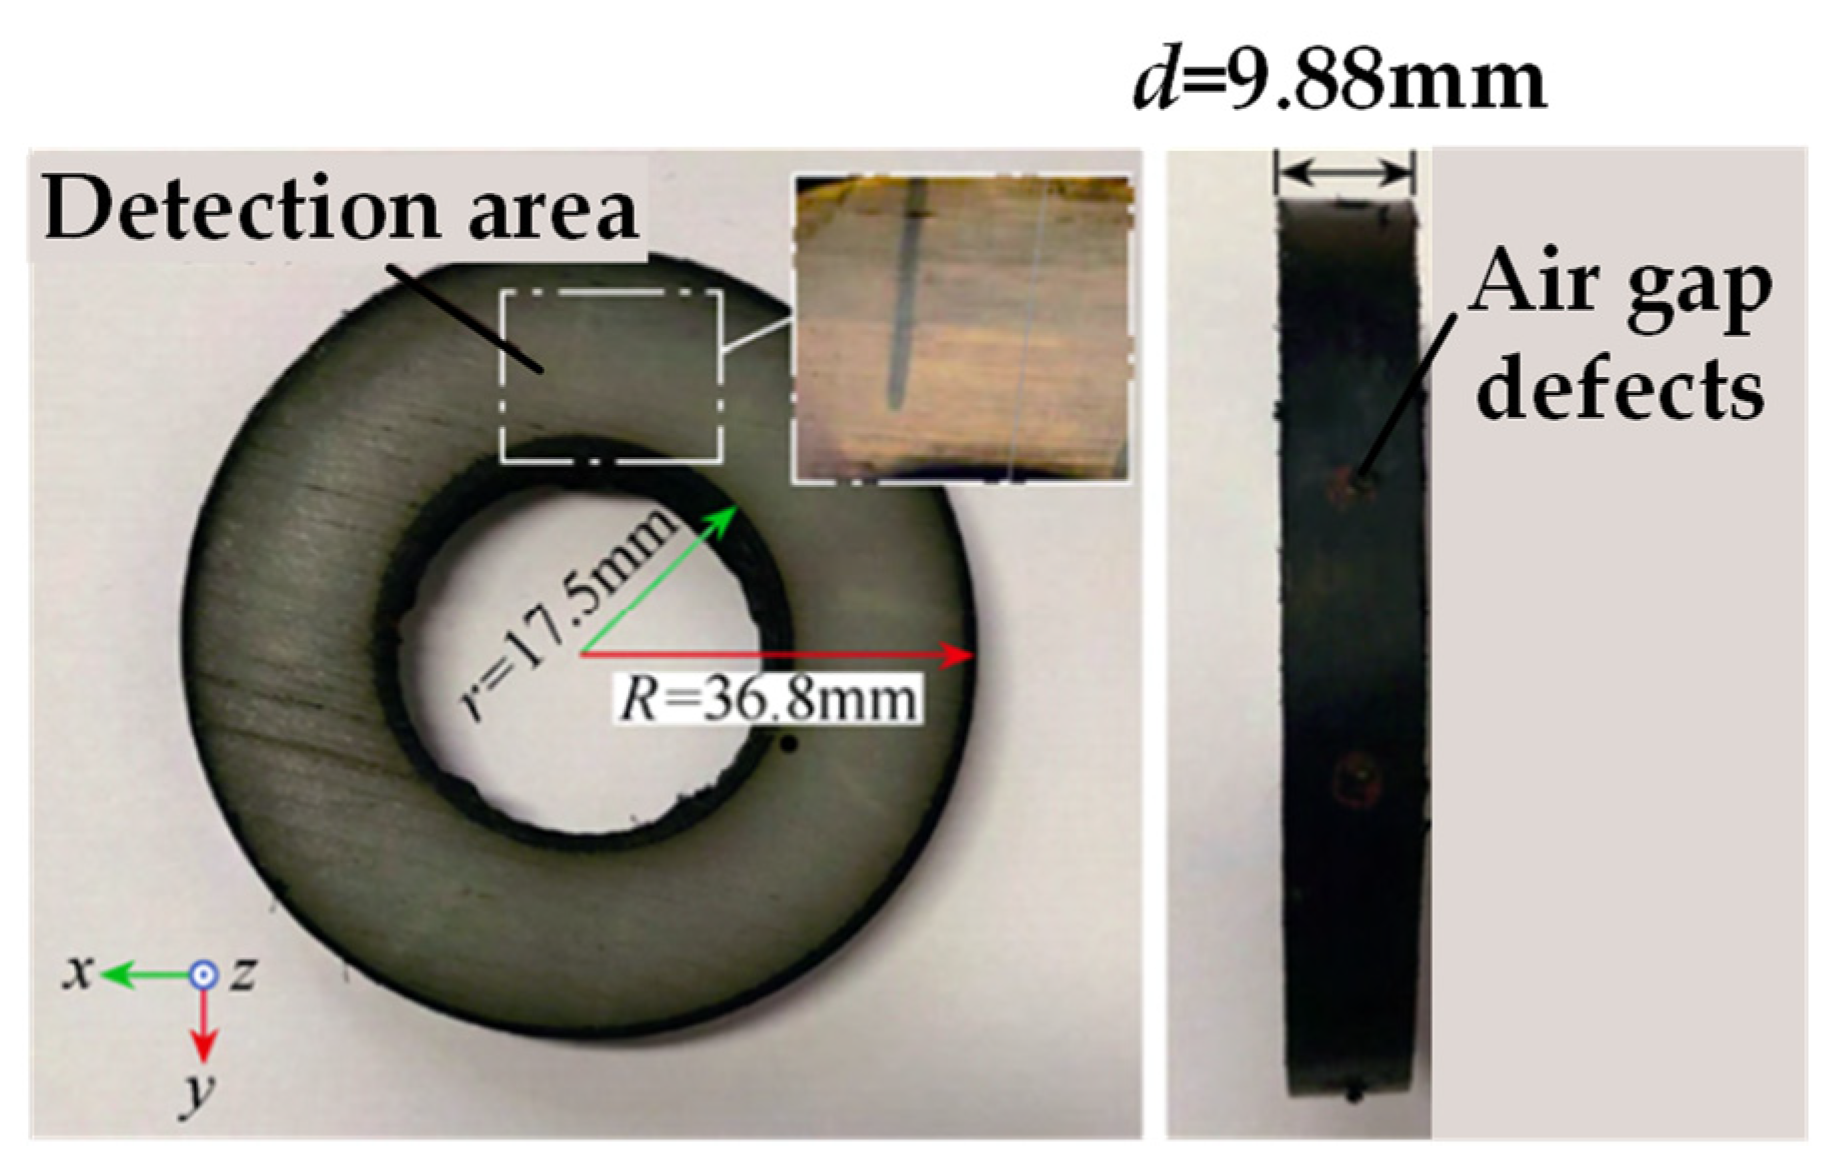
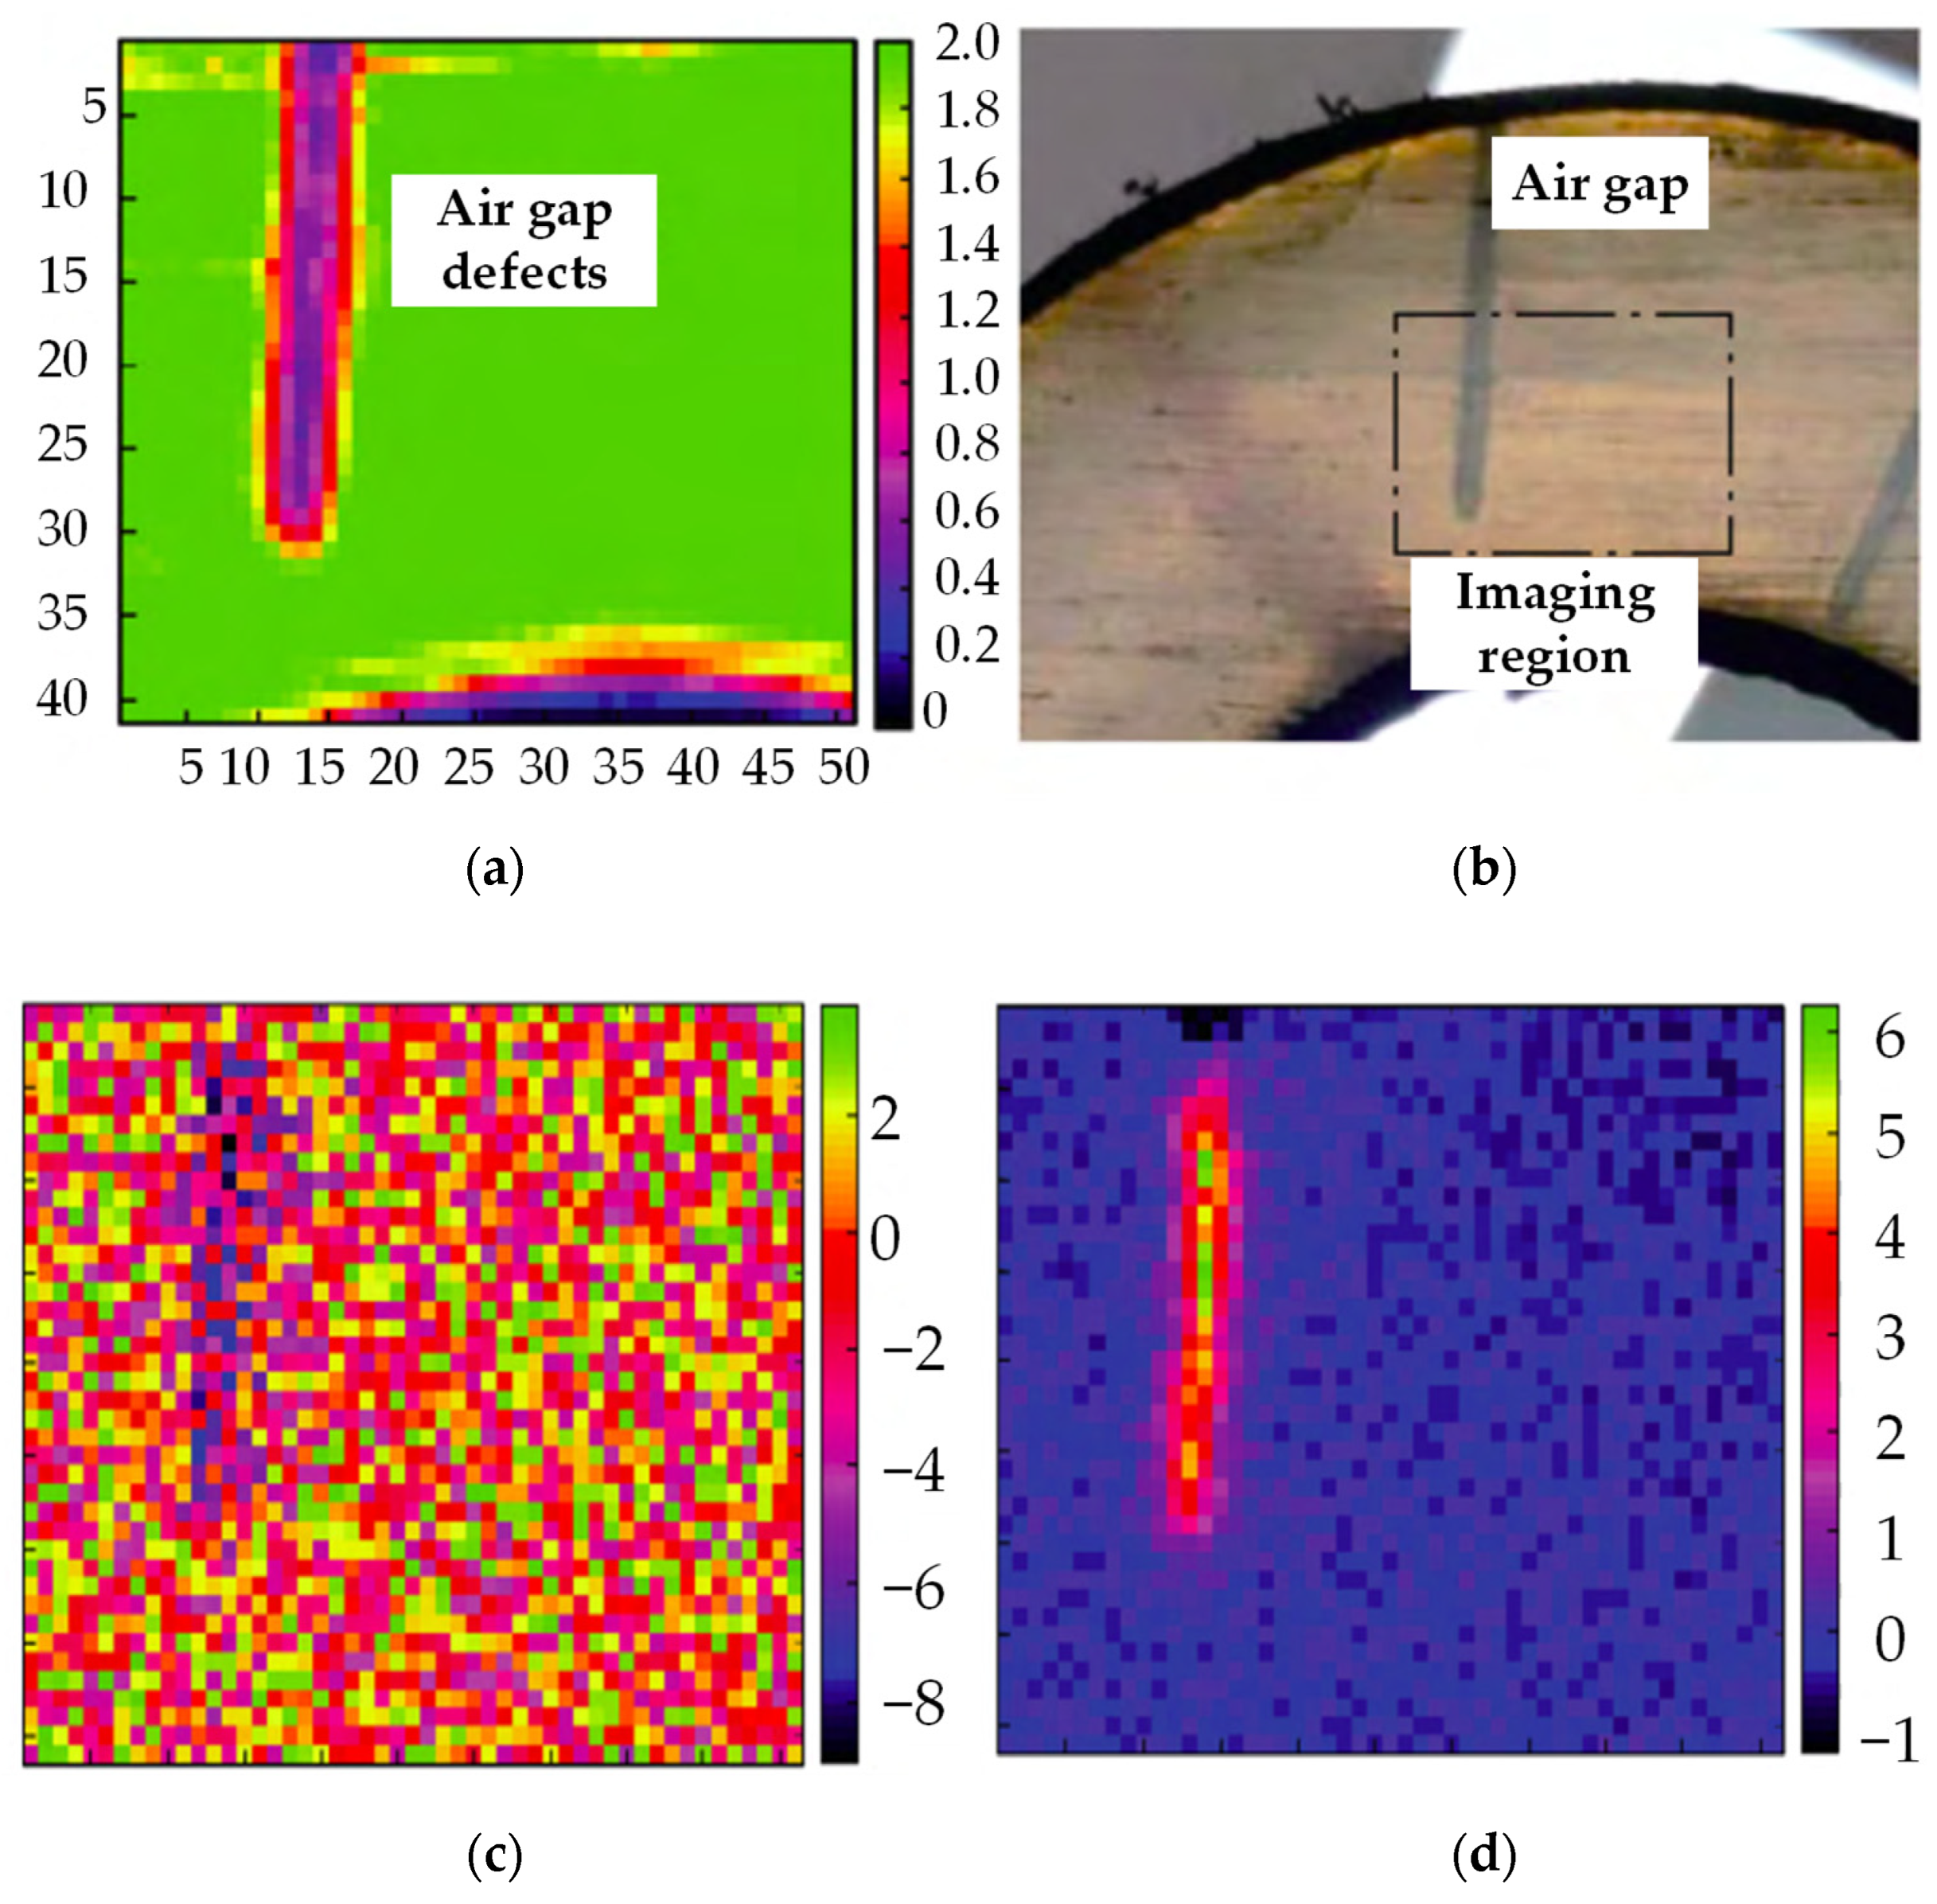
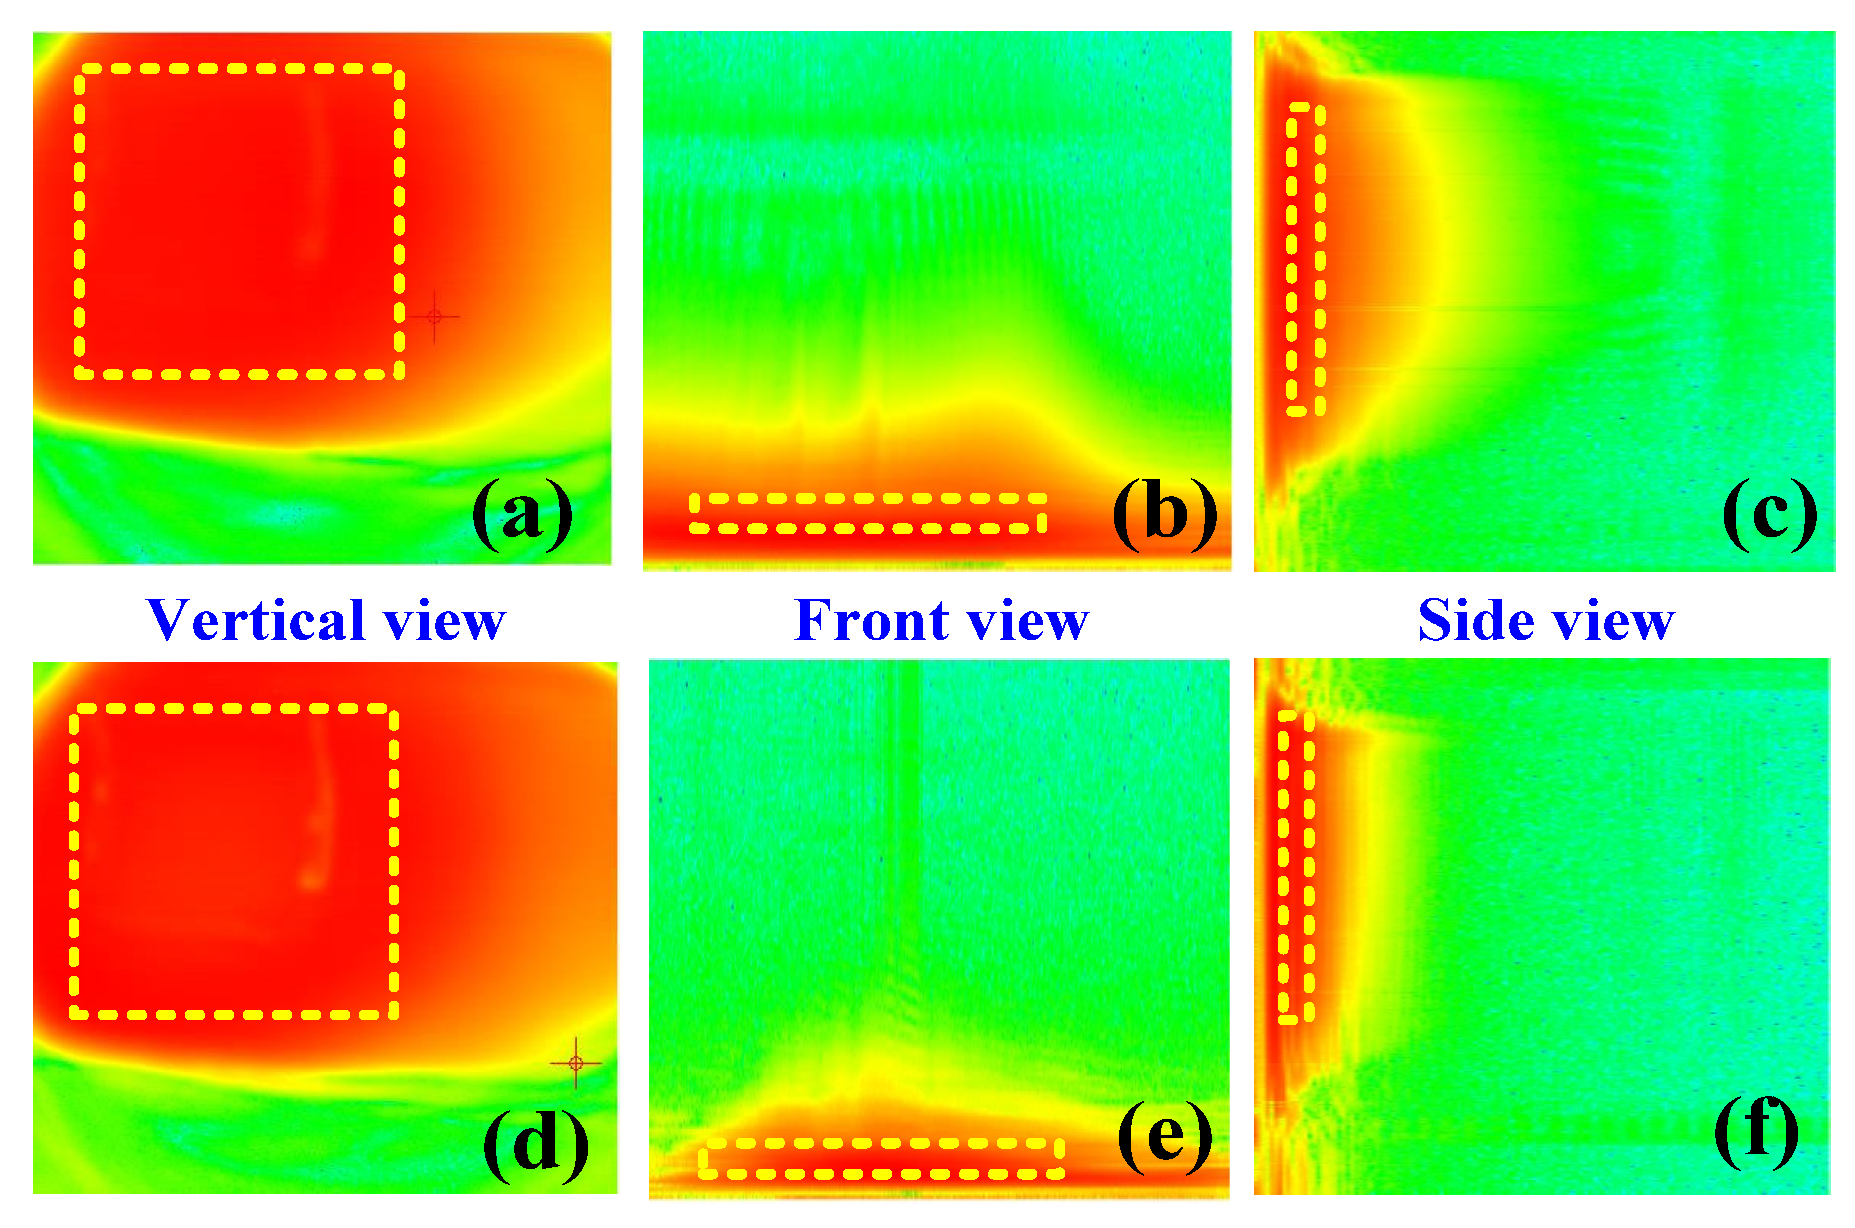
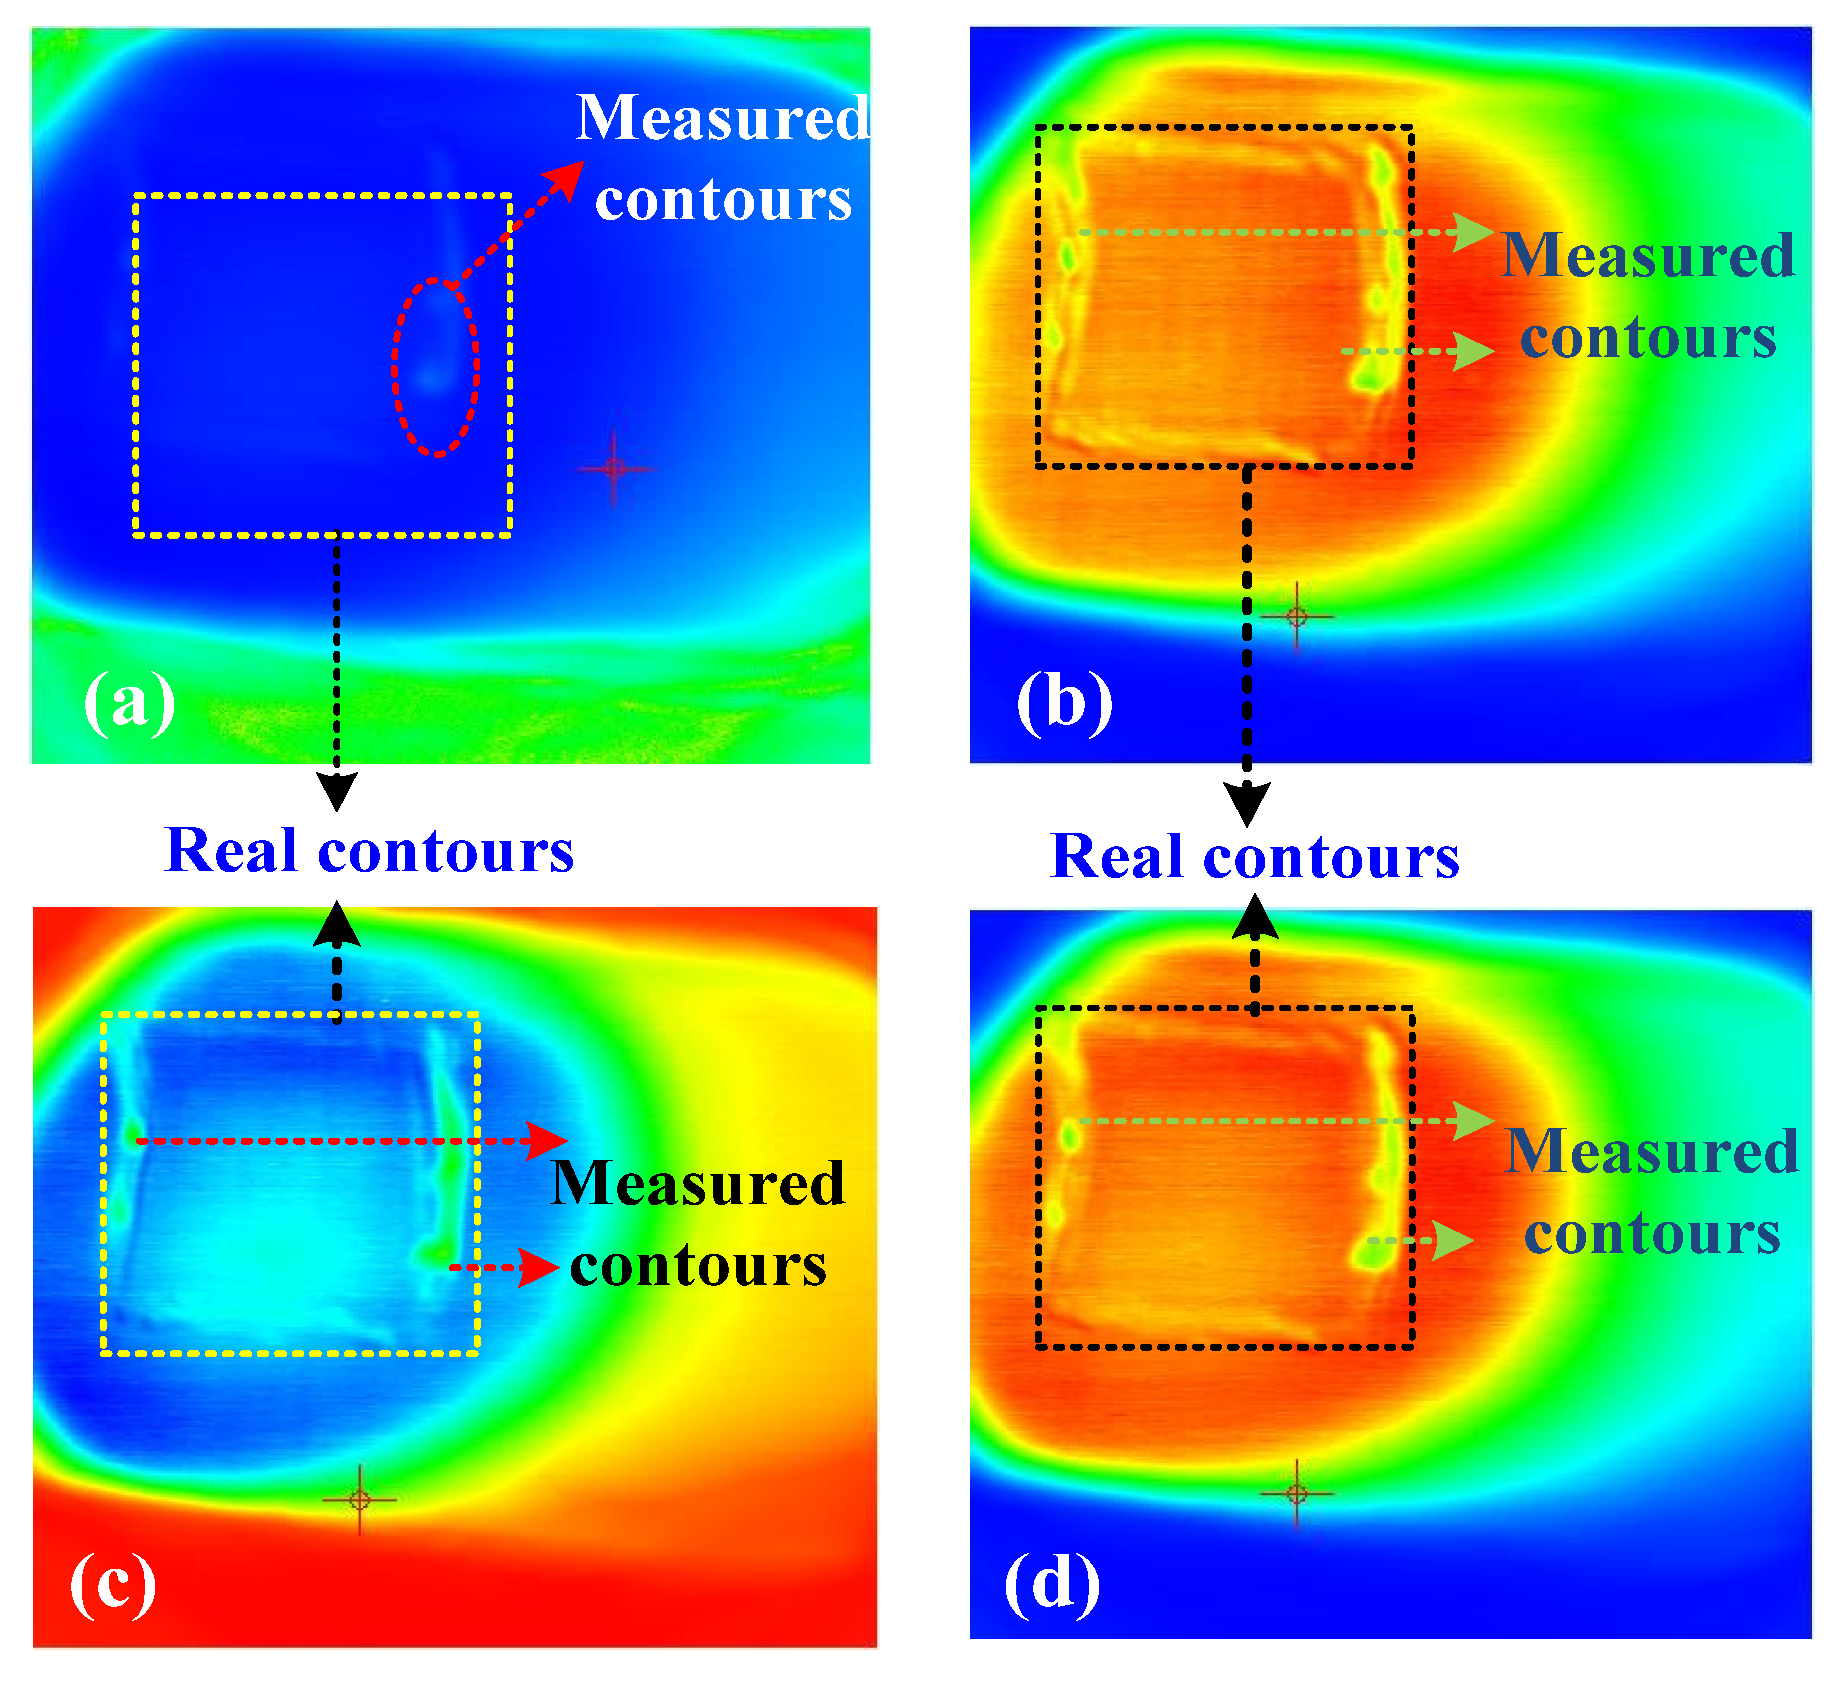
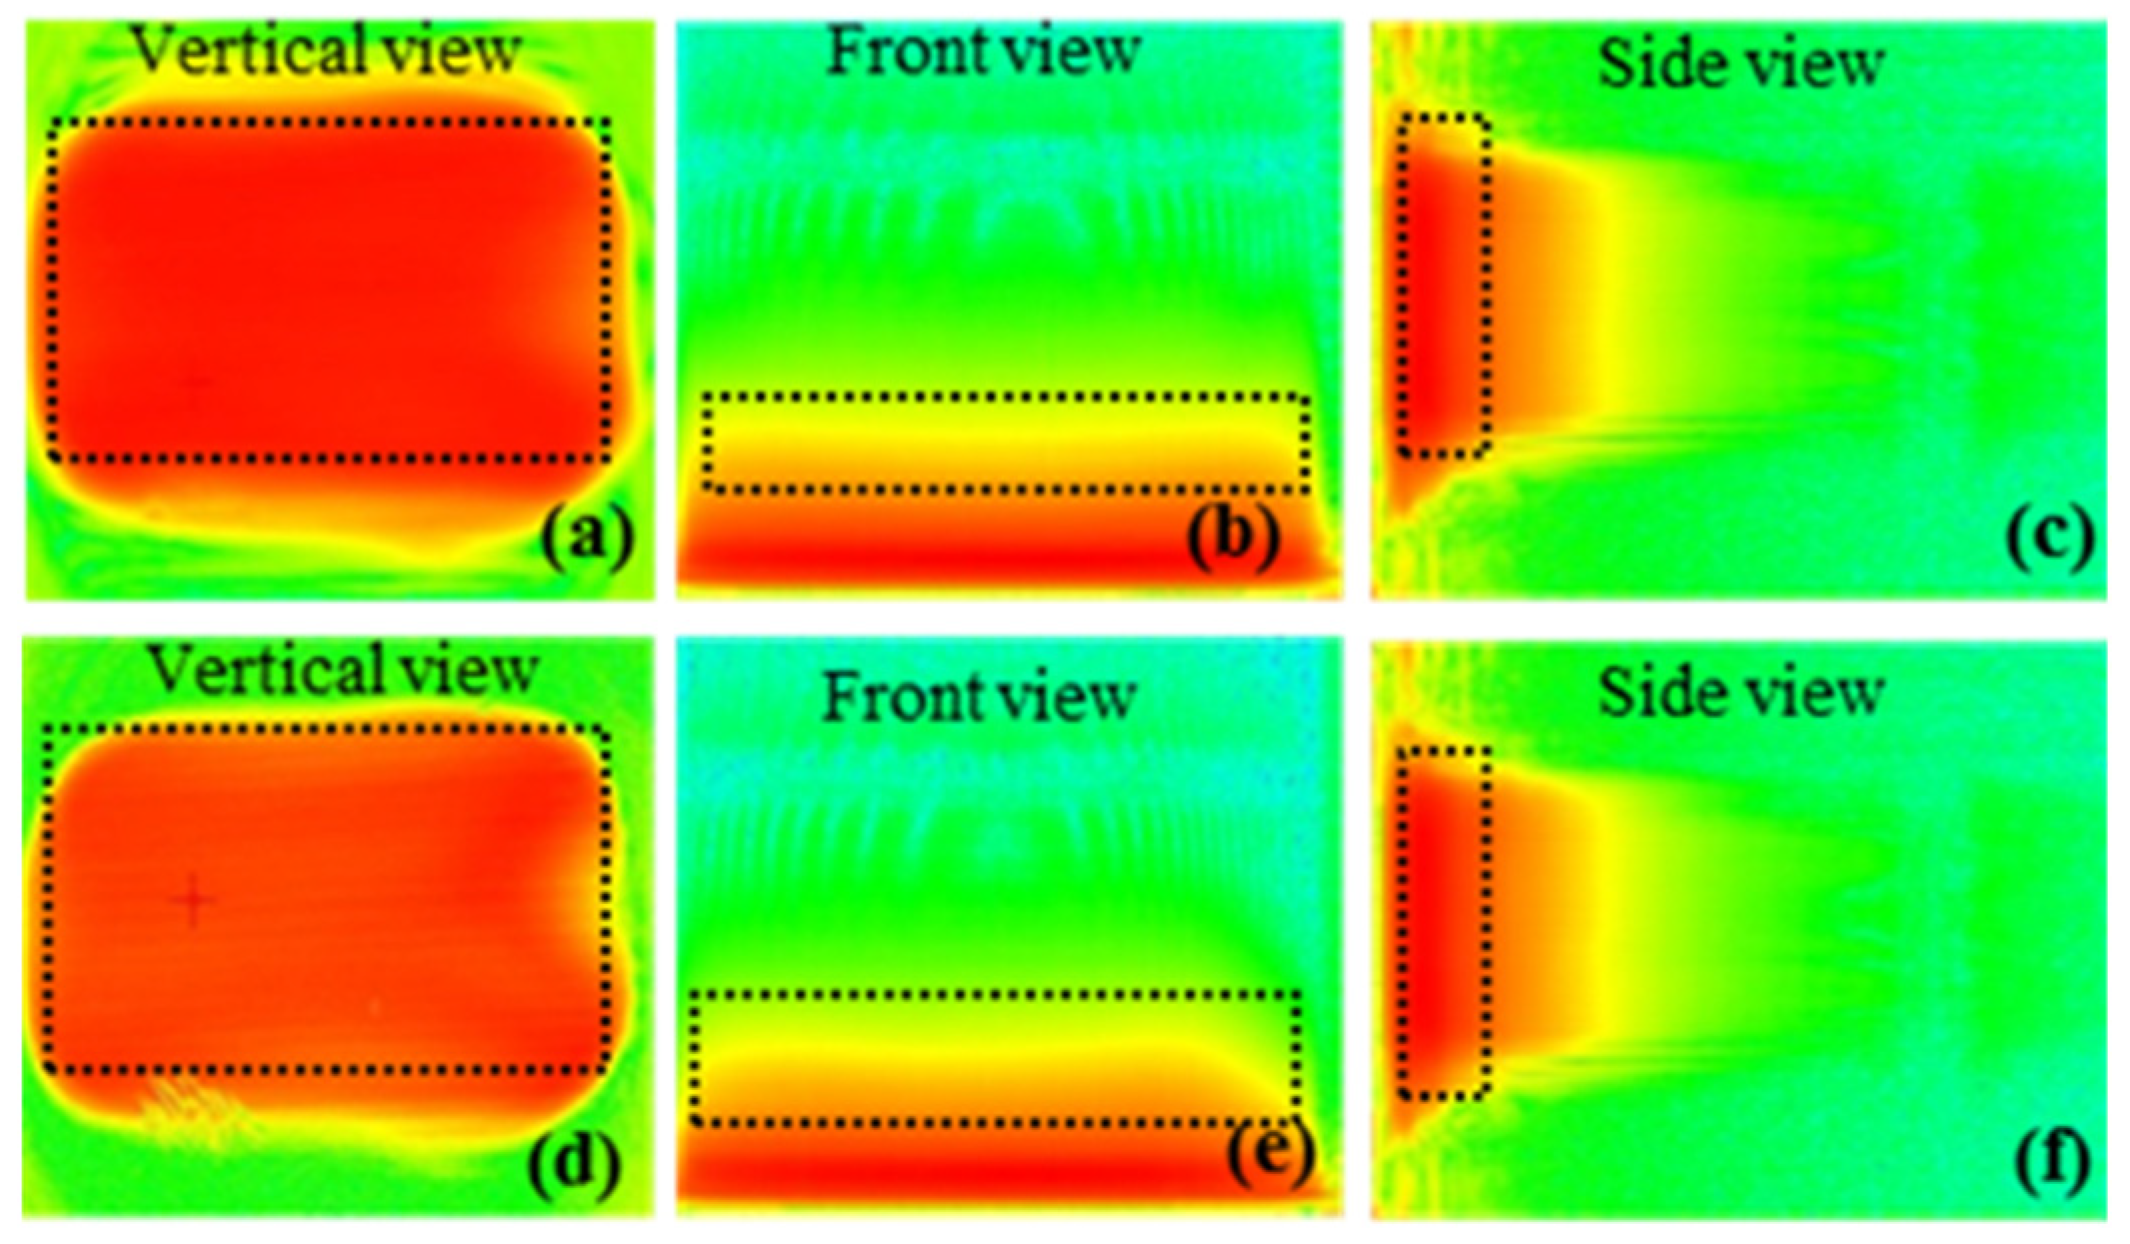
5.2.2. Cable Insulation Defect Detection Based on THz-TDS

Defects such as air-gap impurities inevitably appear in the cable manufacturing process, which can easily cause the concentration of electrical stress inside the insulation and lead to operational accidents, and timely detection of the implied defects can eliminate safety hazards. Shenyi Xie et al. established a multilayer loss model for XLPE cables containing air-gap defects, calculated the refractive index and dielectric constant of XLPE using THz-TDS, and obtained the size of the hidden air-gap by analyzing the THz spectral signal and THz imaging can visually observe the air-gap [74].
The cable containing air-gap defects can be equated to an XLPE-Air-XLPE three-layer structure, and the THz signal containing defective features will show waveform forward and amplitude decrease in the time domain spectrum. To prevent the loss of terahertz radiation, the sample production process must be uniform in thinness and thickness, the air gap defects are prefabricated by humans, and the imaging target area in the experiment must be within a white rectangular box. To prevent the loss of terahertz radiation, the sample production process must be uniform in thinness and thickness, the air gap defects are prefabricated by humans, and the imaging target area in the experiment must be within a white rectangular box. The sample size taken from the power cable is shown in Figure 18.
The terahertz image of the sample containing air gap defects obtained by the peak imaging method is shown in Figure 19a. The change of the amplitude of the terahertz wave after passing through the sample can be revealed by the peak imaging method, and the green region has strong terahertz transmission capability and does not contain air gap defects, while the weaker signal region reflects the presence of defects in the region, and the lower circular region is the semi-conducting layer of the sample. Based on the imaging results, it can be seen that the air gap in the insulation can be detected using THz-TDS, and terahertz imaging can locate the air gap and further identify the shape and size. Imaging based on the phase feature parameter is shown in Figure 19c,d. By selecting a fixed time node with a fixed time delay of 253 ps and 254 ps, respectively, the defects were also observed by extracting the amplitude of this node as a feature parameter. However, with different time nodes, the quality of imaging is unevenly disturbed by the background noise and inferior to the amplitude feature parameter, so an optimized phase imaging algorithm is needed to effectively filter out the background noise.
During operation, the onboard cable terminals of the rolling stock are subjected to frequent alternating hot and cold environments and continuous mechanical vibrations, and the layers of the structure exhibit different shrinkage characteristics, thus forming air gaps inside them and causing delamination of the main insulation of the cable terminals. Using terahertz detection technology, Shuaibing Li et al. achieved accurate detection of insulation delamination defects [75]. Figure 20 shows the THz frequency domain images for the imaging bands 0.348 THz and 0.476 THz. The red areas indicate delamination defects, where the terahertz wave energy and terahertz intensity are reduced in these areas due to the multiple reflections that the terahertz wave undergoes in the air gap. The defects shown in the frequency domain image are in high agreement with the defects of the actual sample in terms of location. However, because the air gap makes the terahertz waves scatter severely, there is a large error in size between the air gap shown by the frequency domain imaging results and the air gap in the actual sample.
To accurately locate the defective region of air gap delamination, the homemade samples were imaged in the time domain with maximum-peak imaging, minimum peak imaging, and peak-peak imaging, respectively, and compared with the imaging results in the frequency domain. The test results using these four imaging modes are shown in Figure 21. The time-domain imaging results are much better than the frequency-domain imaging results in achieving the characterization of the defect size, as the contours of the air gap delamination defects can be found in the figure.
The red region is the region where the moisture is located due to the strong absorption of terahertz waves by moisture or water, resulting in a weak intensity of the reflected terahertz waves. The geometry of the moist region can be reflected from different angles by the three-view of the frequency domain imaging, which is shown by the black dashed rectangle in Figure 22. In practice, the area of the imaging result is larger than the actual area due to the diffusion of moisture in the sample. To further show the diffusion of moisture inside the insulation, absorption spectral imaging, maximum-peak imaging, minimum-peak imaging, and peak-peak imaging were also performed. The imaging results are shown in Figure 23.
The yellow area and the green area are the moisture diffusion area. Absorption spectral imaging, maximum peak imaging, and minimum peak imaging can show the actual moist area and the water diffusion areas.
In general, many research teams are currently conducting a lot of research on the application of terahertz technology in the field of non-destructive testing, especially to detect hidden defects inside cable insulation. The use of terahertz technology to detect delamination and moisture in the insulation inside cables has proven to be effective. Torsion-resistant cables for offshore wind turbines are subjected to mechanical stresses such as torsion and tension while operating in a humid environment for a long time. There are few studies related to the aging process and aging mechanism of torsion-resistant cables for wind turbines. We hope that we can reveal this process with the help of terahertz detection technology.
Table 2 shows the two techniques of cable insulation defect detection and their characteristics. In the field of non-destructive testing of electrical equipment, terahertz inspection technology can be used as an important inspection tool for non-metallic insulating material equipment. It has broad application prospects for hidden defects inside cables, insulator surfaces, metal composition analysis, etc. Currently, there have been some research teams that have conducted a lot of research on the application of terahertz technology in the field of nondestructive testing, and the detection of defects inside cables with terahertz technology has been proven to be effective. However, terahertz technology is still at the stage of laboratory-level inspection and cannot be used for the online detection of defects in cables in the field. Moreover, the electromagnetic environment around the operating cable is complex, and there are metal shields and aluminum alloy sheaths in the cable, so the terahertz waves cannot pass through the metal structure, and the feasibility of detection is not guaranteed. These are the obstacles on the road of terahertz technology to detect insulation defects in electrical equipment, and continuous research is needed to solve the above problems. There are few studies related to the use of terahertz technology to detect insulation defects in wind power cables, and we hope to use terahertz detection technology to reveal the aging process and aging mechanism of torsion-resistant cables.

6. Summary

Wind power generation technology is the most mature in the field of new energy utilization, and offshore wind power represents the frontier and high point of wind power technology. In the face of a complex and changing environment, offshore wind power will bring great challenges to the normal operation of the grid when it is connected to the grid, and the transmission stability of large-scale offshore wind power has become a hot spot for research. This paper gives an overview of the characteristics and operating conditions of torsion-resistant cables and submarine cables for wind power, composes relevant research on the deterioration mechanism of cable insulation under multiple stresses, summarizes the condition monitoring and insulation defect detection techniques for wind power cables, and draws the following conclusions:
  • The cable insulation material is affected by multiple factors such as heat, oxygen, irradiation, and mechanical stress during use and will undergo degradation, cross-linking, and other aging behaviors. The insulation material aging mechanism generally has thermal oxygen aging, ozone aging, and fatigue aging due to the repeated action of mechanical stress, while aging occurs under the multiple effects of electrical and thermal stress, which is the mechanism of fatigue aging;
  • The insulation of torsion-resistant cables is subjected to long-term torsional action due to fatigue stress cracking serious. At the same time, the semi-conducting layer of which is very easy to damage, resulting in partial discharge of damaged insulation, greatly shortening the service life of the cable. For offshore wind power, the cable is subject to the impact of the environment in which the turbine is located; moisture and salt spray accelerate the deterioration of insulation performance;
  • Submarine cables are subject to mechanical stresses such as stretching, twisting, and vibration during pre-production, transportation, installation, and post-operation, which can damage the insulation structure and water resistance of submarine cables and can lead to a decrease in insulation performance, which in turn directly affects their electrical performance;
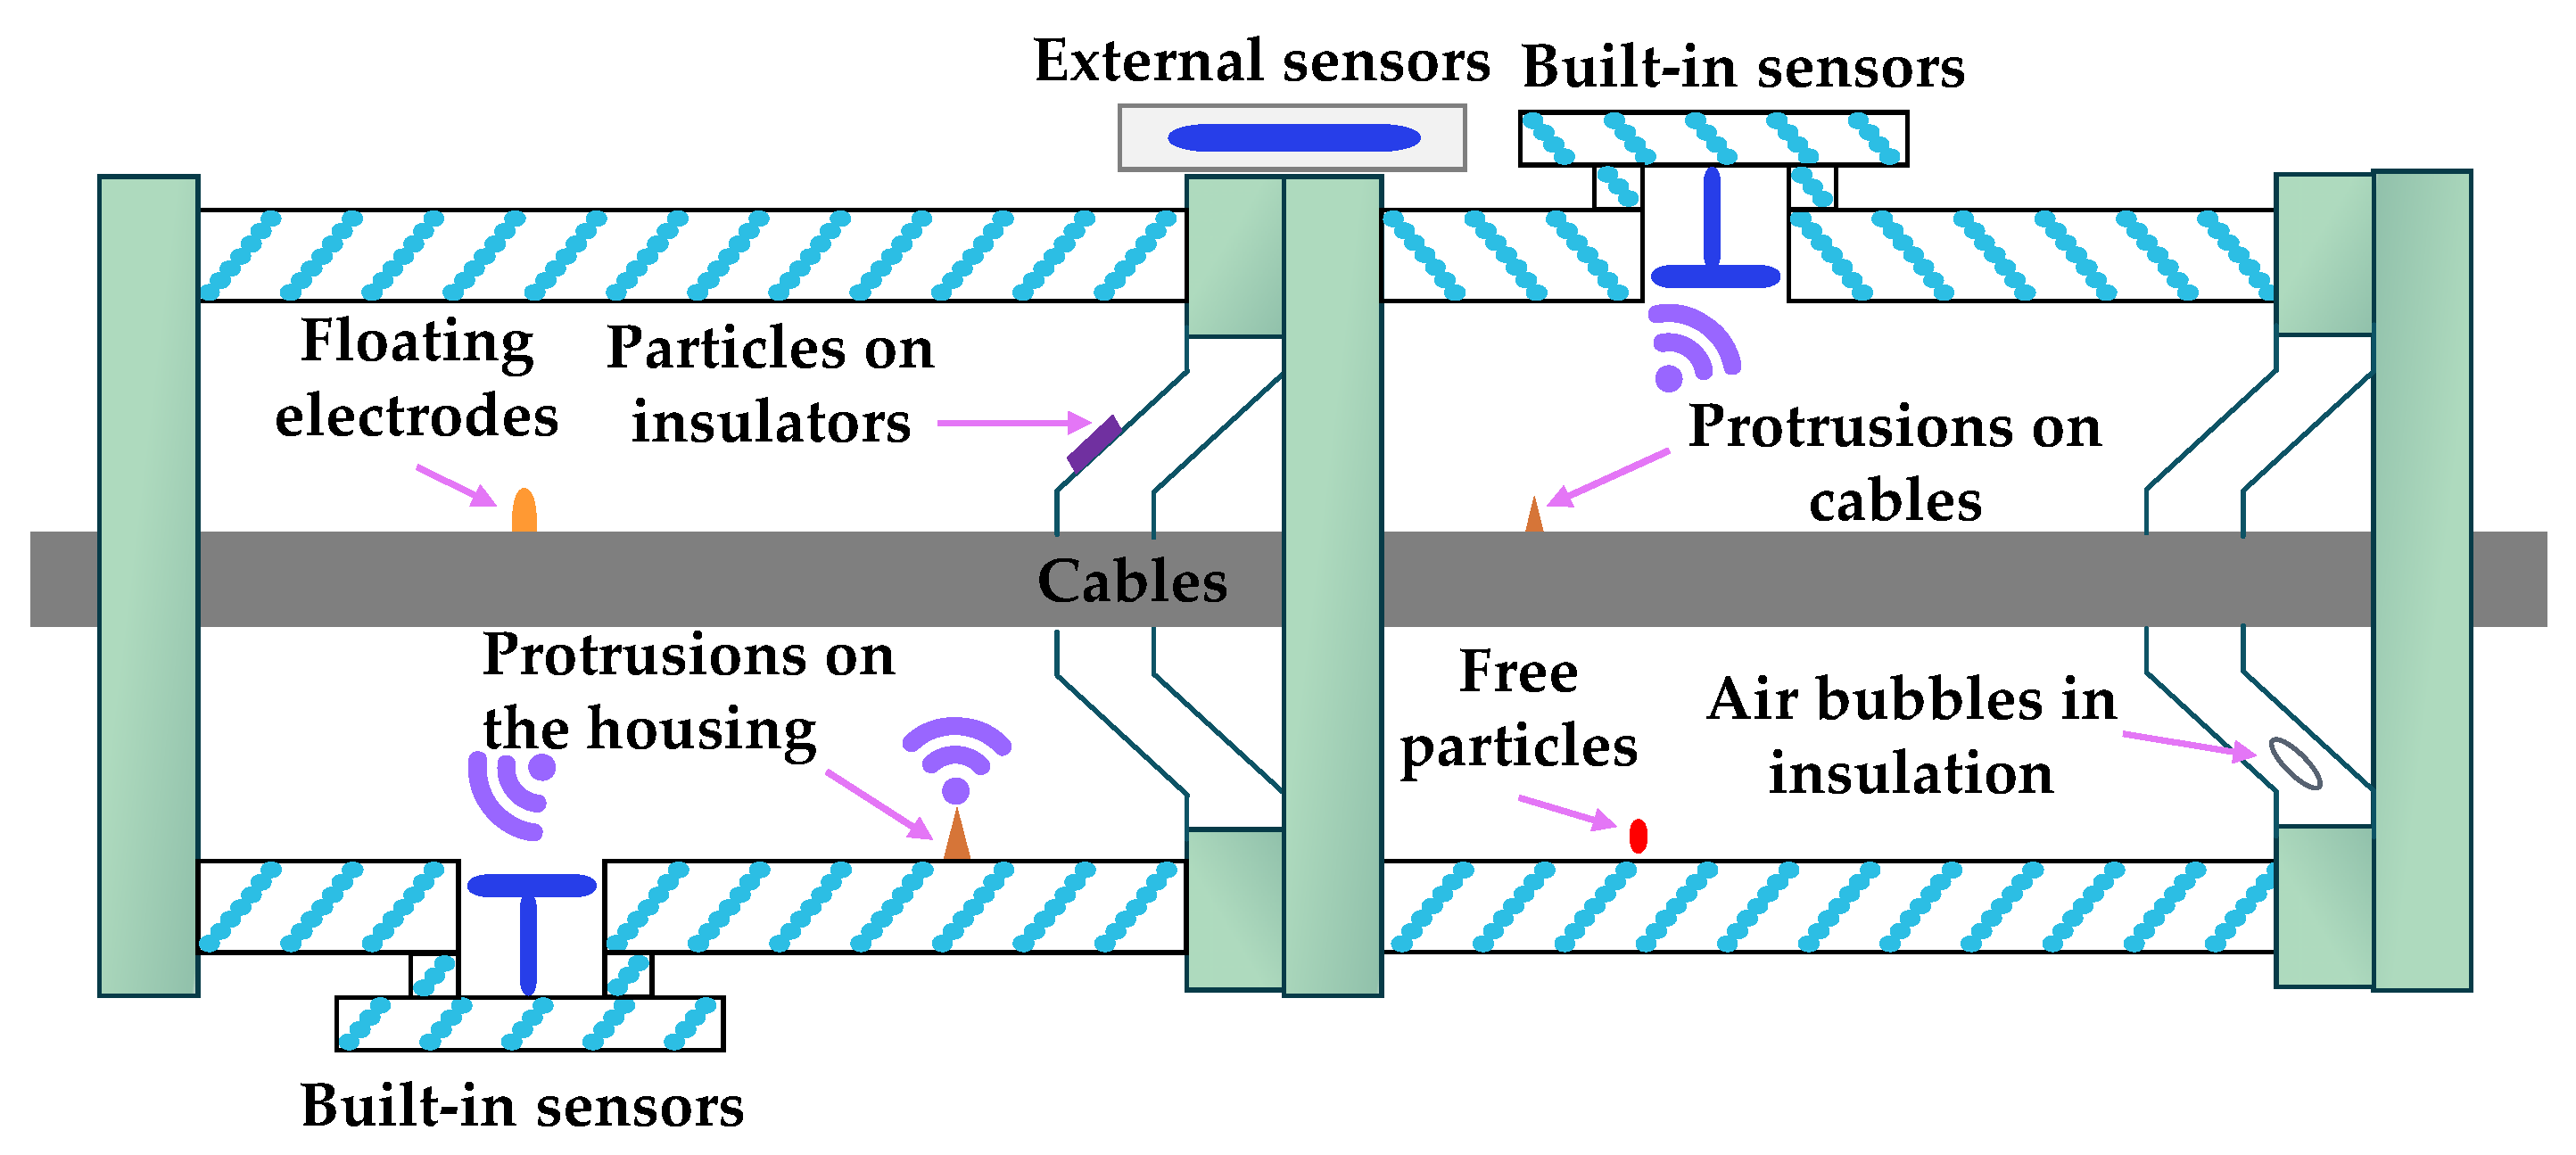
  • By monitoring the condition of the cable, defects can be found in time. Among the cable insulation condition monitoring technologies, both the DC superposition method and AC superposition method have limitations, and their application in the insulation monitoring of power equipment needs further research. Distributed fiber optic sensing technology can monitor the vibration, temperature, and external force changes of cables, especially submarine cables, in real-time to ensure the safe operation of cables;
  • The use of condition monitoring technology achieves all–around sensing of the cable operating conditions, but the monitoring results can only reflect the overall condition of the cable and cannot detect information such as air gap size and shape. In addition, it also requires high voltage, a strong current experimental environment, complex and tedious operation, and high requirements for safety.

Author Contributions

Conceptualization, B.L. and S.L.; methodology, B.L. and S.L.; investigation, X.Z.; resources, D.Z. and Y.K.; writing–original draft preparation, B.L. and S.L.; writing–review and editing, B.L., S.L. and Y.C.; project administration, S.L.; funding acquisition, H.D. All authors have read and agreed to the published version of the manuscript.

Funding

This work was supported by the programs of the National Science Foundation of China (No. 52167018), the National Science Foundation of Ningxia (2021AAC03493), and the Young Doctor Foundation of JYT. GANSU. GOV. CN (No. 2021QB-060).

Institutional Review Board Statement

Not applicable.

Informed Consent Statement

Not applicable.

Data Availability Statement

Not applicable.

Conflicts of Interest

The authors declare no conflict of interest.

References

  1. Hussain, H.M.; Narayanan, A.; Nardelli, P.H.J.; Yang, Y. What is energy internet? concepts, technologies, and future directions. IEEE Access 2020, 8, 183127–183145. [Google Scholar] [CrossRef]
  2. Hasegawa, K.; Ueno, T.; Kiwata, T. Proposal of wind vibrational power generator using magneto strictive material. IEEE Trans. Magn. 2019, 55, 8203104. [Google Scholar] [CrossRef]
  3. Suo, X.; Zhao, S.; Ma, Y.; Dong, L. New energy wide area complementary planning method for multi-energy power system. IEEE Access 2021, 9, 157295–157305. [Google Scholar] [CrossRef]
  4. Wang, Q.; Yu, Z.; Ye, R.; Lin, Z.; Tang, Y. An ordered curtailment strategy for offshore wind power under extreme weather conditions considering the resilience of the grid. IEEE Access 2019, 7, 54824–54833. [Google Scholar] [CrossRef]
  5. Guo, Q.; Yang, Z.; Liu, C.; Xu, Y.; Zhou, D.; Xie, L. Anti-typhoon yaw control technology for offshore wind farms. In Proceedings of the 2020 IEEE 5th International Conference on Mechanical, Control and Computer Engineering (ICMCCE), Harbin, China, 25–27 December 2020; pp. 578–581. [Google Scholar]
  6. Purvins, A.; Sereno, L.; Ardelean, M. Submarine power cable between Europe and north America: A techno-economic analysis. J. Clean. Prod. 2018, 186, 131–145. [Google Scholar] [CrossRef]
  7. Liu, J.; Li, X.; Gao, H.; Guo, H. Characteristics of electric and temperature fields of underwater umbilical cable based on finite element analysis. High. Volt. Eng. 2014, 40, 1658–1665. [Google Scholar]
  8. Chen, J.; Shen, Y.; Yu, Z. Testing and process improvement of residual stress in XLPE cable insulation layer. High. Volt. Eng. 2004, 30, 1–2+14. [Google Scholar]
  9. Yu, L.; Yu, Y.; Ren, H. An analysis of cable damage in wind turbines. Dong Turb. 2021, 13, 68–70. [Google Scholar]
  10. Wei, Y.; Han, W.; Li, G. Research progress of semiconductive shielding layer of HVDC cable. High. Volt. 2020, 5, 1–6. [Google Scholar] [CrossRef]
  11. Li, J.; Ju, C.; Yue, W. Design and selection of torsion-resistant medium-voltage flexible cables for wind turbines. Optic. Fiber. Electr. Cable Their Appl. 2015, 49, 40–41. [Google Scholar]
  12. Li, W. Development of twist-resistant power cables for 20/35 kV wind power generation. Wire Cable 2010, 53, 22–25. [Google Scholar]
  13. Zaliskyi, M.; Petrova, Y.; Asanov, M.; Bekirov, E. Statistical data processing during wind generators operation. Int. J. Electr. Electron. Eng. Telecommun. 2019, 8, 33–38. [Google Scholar] [CrossRef] [Green Version]
  14. Taormina, B.; Bald, J.; Want, A.; Gerard, T.; Lejart, M.; Desroy, N.; Carlier, A. A review of potential impacts of submarine power cables on the marine environment: Knowledge gaps, recommendations and future directions. Renew. Sustain. Energy Rev. 2018, 96, 380–391. [Google Scholar] [CrossRef]
  15. Dinmohammadi, F.; Flynn, D.; Bailey, C.; Pecht, M.; Robu, V. Predicting damage and life expectancy of subsea power cables in offshore renewable energy applications. IEEE Access 2019, 7, 54658–54669. [Google Scholar] [CrossRef]
  16. Zhao, J.; Chen, Z. A review of domestic and international research on submarine cable engineering. East Chin. Electr. Power 2011, 39, 1477–1481. [Google Scholar]
  17. Liu, F.; Jiang, P.; Lei, Q.; Zhang, L.; Su, W. Insulation diagnosis of service aged XLPE power cables using statistical analysis and fuzzy inference. High. Volt. Eng. 2013, 39, 1932–1940. [Google Scholar]
  18. Madonia, A.; Sanseverino, E.; Romano, P.; Troia, I.; Bononi, S. Wireless partial discharge tracking on cross-linked polyethylene MV and HV cables. IEEE Electr. Insul. Mag. 2018, 34, 8–17. [Google Scholar] [CrossRef]
  19. Reed, C.W. An assessment of material selection for high voltage DC extruded polymer cables. IEEE Electr. Insul. Mag. 2017, 33, 22–26. [Google Scholar] [CrossRef]
  20. Nakamura, Y.; Kuroshima, T.; Takeuchi, M.; Sanpei, T.; Suzuki, S.; Ishikura, S.; Inoue, H.; Uematsu, T. Installation of 66 kV XLPE power-optical fiber composite submarine cable and water pipe for the Trans-Tokyo Bay Highway. IEEE Trans. Power Deliv. 1995, 10, 1156–1167. [Google Scholar] [CrossRef]
  21. Wang, W.; Zhang, J.; Zhao, Y.; Cheng, J.; Ye, C.; Yan, Z. Tensile test and simulation analysis of flat steel wire armored fiber composite submarine cable. High. Volt. Eng. 2019, 45, 3467–3473. [Google Scholar]
  22. Shao, D.; Sun, Y.; Liu, H.; Wang, L.; He, C.; Zhu, Y. Study on the mechanical response law of fiber-optic composite submarine cable under the action of walking slip fault. J. Ocean. Univ. China 2019, 49, 148–154. [Google Scholar]
  23. Fan, X.; Xu, J.; Gao, J.; Zhou, L.; Wang, L.; Zhao, X. The Material Properties and Insulation Design for 35kV Flexible and Torsion Resistant Cable. In Proceedings of the 2021 IEEE International Conference on Electrical Materials and Power Equipment (ICEMPE), Chongqing, China, 11–15 April 2021; pp. 1–5. [Google Scholar]
  24. Gan, Y.; Fang, Q.; Wang, Y. Development of torsion-resistant low-smoke halogen-free flame retardant rubber power cables for wind turbines with rated voltage of 21kV/35kV. World Rubber Ind. 2015, 42, 34–39. [Google Scholar]
  25. Liu, Y.; Wang, X. Research on property variation of silicone rubber and EPDM rubber under interfacial multi-stresses. IEEE Trans. Dielectr. Electr. Insul. 2019, 26, 2027–2035. [Google Scholar] [CrossRef]
  26. Wilder, A.T. Characterization of Insulation aging with power- dense environments. In Proceedings of the 2018 IEEE Electrical Insulation Conference (EIC), San Antonio, TX, USA, 17–20 June 2018; pp. 280–285. [Google Scholar]
  27. Guo, Q.; Shao, H. Progress in the study of aging mechanism and aging behavior of rubber. Polym. Bull. 2022, 34, 17–24. [Google Scholar]
  28. Zhao, Q.; Li, X.; Jin, G. Surface degradation of ethylene-propylene-diene monomer (EPDM) containing 5-ethylidene-2-norbornene (ENB) as diene in artificial weathering environment. Polym. Degrad. Stab. 2008, 93, 692–699. [Google Scholar] [CrossRef]
  29. Zhao, Q.; Li, X.; Gao, J. Aging behavior and mechanism of ethylene-propylene-diene monomer (EPDM) rubber in fluorescent UV/condensation weathering environment. Polym. Degrad. Stab. 2009, 94, 339–343. [Google Scholar] [CrossRef]
  30. Li, S.; Duan, P.; Yue, T. Study on the aging mechanism of foamed EPDM rubber under hot air and humid heat and salt spray. Chin. Rubber Ind. 2022, 69, 403–409. [Google Scholar]
  31. Cao, L.; Grzybowski, S. Electrical aging characteristics of 15 kV EPR cable under the multi-stress conditions. In Proceedings of the 2014 IEEE International Conference on High Voltage Engineering and Application (ICHVE), Poznan, Poland, 8–11 September 2014; pp. 1–4. [Google Scholar]
  32. Dang, C.; Parpal, J.L.; Crine, J.P. Electrical aging of extruded dielectric cables: Review of existing theories and data. IEEE Trans. Dielectr. Electr. Insul. 1996, 3, 237–247. [Google Scholar] [CrossRef]
  33. Montanari, G.C.; Cacciari, M. A probabilistic life model for insulating materials showing electrical thresholds. IEEE Trans. Diel. Electr. Insul. 1989, 24, 135–137. [Google Scholar] [CrossRef]
  34. Crine, J.P.; Dang, C.; Parpal, J.L. Electrical aging of extruded dielectric cables: A physical model. In Proceedings of the1996 IEEE International Symposium on Electrical Insulation, Montreal, QC, Canada, 16–19 June 1996; pp. 646–649. [Google Scholar]
  35. Lin, L.; Lin, C.; Geng, P.; Lei, Z.; Song, J.; Tian, M. Aging life evaluation of coal mining flexible EPR cables under multi–stresses. IEEE Access 2020, 8, 53539–53546. [Google Scholar] [CrossRef]
  36. Lv, Z.; Rowland, S.M.; Chen, S.; Zheng, H.; Wu, K. Modelling of partial discharge characteristics in electrical tree channels: Estimating the PD inception and extinction voltages. IEEE Trans. Dielectr. Electr. Insul. 2018, 25, 1999–2010. [Google Scholar] [CrossRef]
  37. Yuan, F.; Zha, M.; Zhang, P. The threat of ship anchor and its protection measures for submarine fiber optic cable. Opt. Fiber. Electr. Cable Their Appl. 2015, 48, 26–29. [Google Scholar]
  38. Wang, Y. The practice of and the associated concerns in the use of cast iron shell protection of 500 kV submarine cable in immediate off shore areas. S Power Syst. Technol. 2011, 5, 92–94. [Google Scholar]
  39. Hou, Y.; Xiong, A.; Lin, G. Research on the adaptability of conventional UFLS/UVLS criteria for interconnected power systems. Power Syst. Clean. Energy 2009, 25, 12–16. [Google Scholar]
  40. Merino, E.M.; Sousa R, M.; Magluta, C. Numerical and experimental study of a flexible pipe under torsion. In Proceedings of the 29th International Conference on Ocean, Offshore and Arctic Engineering (OMAE), Shanghai, China, 22 December 2010; pp. 911–922. [Google Scholar]
  41. Guo, J.; Wang, B.; Li, P. Comparative study on the cis-reverse torsional characteristics of composite submarine cables. Study Optic. Commun. 2022, 47, 22–26+78. [Google Scholar]
  42. Yue, H.; Wu, G.; Li, J.; Wang, G.; Zhu, J. Experimental study of eddy-excited vibration of submarine cables under the action of uniform flow. Electr. Power Surv. Design 2019, 25, 7–13. [Google Scholar]
  43. Li, X.; Li, S.; Gu, H. Analysis of eddy-excited vibration characteristics of submarine suspended span pipelines under the action of segmental plug flow. J. Vibrat. Shock 2022, 41, 37–43+146. [Google Scholar]
  44. Feng, Y.; Shang, Q.; Lv, A. Finite element analysis of fiber composite submarine cable dynamics under wave forces. Study Optic. Commun. 2017, 42, 30–34. [Google Scholar]
  45. Liu, F.; Jiang, P.; Lei, Q.; Zhang, L. A new parameter for degradation assessment of field aged XLPE power cables. High. Volt. Eng. 2015, 41, 1228–1236. [Google Scholar]
  46. Wang, H.; Wang, X.; Sun, M. High-voltage frequency-domain dielectric spectrum diagnosis method for thermal aging of XLPE cable insulation. Trans. Chin. Electr. Soc. 2022, 37, 4497–4507. [Google Scholar]
  47. Zhou, Y.; Liu, R.; Zhang, Y. The initiation and growth process of silicone rubber electric dendrites. High. Volt. Eng. 2014, 40, 3656–3664. [Google Scholar]
  48. Wang, J.; Li, Y.; Liu, Z. Influence of temperature on the aging characteristics of polyethylene water branches. High. Volt. Eng. 2012, 38, 181–187. [Google Scholar]
  49. Liu, J.; Yan, S.; Wang, S. Evaluation of aging status of XLPE cable based on low frequency high voltage FDS. Trans. Chin. Electr. Soc. 2022, 37, 1–10. [Google Scholar]
  50. Crine, J.P.; Lanteigne, J. Influence of some chemical and mechanical effects on XLPE degradation. IEEE Trans. Electr. Insul. 1984, 19, 220–222. [Google Scholar] [CrossRef]
  51. El-Kady, M.A. Calculation of the sensitivity of power cable ampacity to variations of design and environmental parameters. IEEE Trans. Power Eng. Review. 1984, 8, 2043–2050. [Google Scholar]
  52. Aras, F.; Alekperov, V.; Can, N.; Kirkici, H. Aging of 154 kV underground power cable insulation under combined thermal and electrical stresses. IEEE Electr. Insul. Mag. 2007, 23, 25–33. [Google Scholar] [CrossRef]
  53. Yuan, Y.; Zhou, H.; Dong, J. Sheath current in HV cable systems and its on-line monitoring for cable fault diagnosis. High. Volt. Eng. 2015, 41, 1194–1203. [Google Scholar]
  54. Honjo, R.; Vecchio, R.D. A program to compute magnetic fields, forces, and inductances due to solid rectangular conductors arbitrarily positioned in space. IEEE Trans. Magn. 1986, 22, 1532–1535. [Google Scholar] [CrossRef]
  55. Zhang, Z.; Jin, J.; Liu, J. Experiment and analysis on temperature vibration aging of XLPE cable line. High. Volt. Eng. 2018, 44, 3707–3712. [Google Scholar]
  56. Sedighi, S.; Soto, M.A.; Jderu.; Dorobantu, D. Swelling-based distributed chemical sensing with standard acrylate coated optical fibers. IEEE Sens. J. 2021, 21, 718. [Google Scholar] [CrossRef]
  57. Huang, G.; Li, Z.; Yang, F. Study of leakage current test characteristics of DC cross-linked polyethylene cables. Trans. Chin. Electr. Soc. 2019, 34, 192–201. [Google Scholar]
  58. Chen, X.; Li, W.; Li, Z.; Zhang, Y.; Guan, J.; Zhong, L. Perspectives on key technologies for high-voltage DC XLPE insulation materials and cables. High. Vol. Eng. 2020, 46, 1571–1579. [Google Scholar]
  59. Butler, K.L.; Sarma, N.D.R.; Whitcomb, C.; Carmo, H.D.; Zhang, H. Shipboard systems deploy automated protection. IEEE Comput. Appl. Power 1998, 11, 31–36. [Google Scholar] [CrossRef]
  60. Oonishi, H.; Urano, F.; Mochizuki, T.; Soma, K.; Kotani, K.; Kamio, K. Development of new diagnostic method for hot-line XLPE cables with water trees. IEEE Trans. Power Deliv. 1987, 2, 1–7. [Google Scholar] [CrossRef]
  61. Wu, P.; Wu, X.; Gao, W. A review of online monitoring technology for naval cable insulation. Trans. Chin. Electr. Soc. 2021, 36, 713–722. [Google Scholar]
  62. Fouda, B.M.T.; Yang, B.; Han, D.; An, B. Pattern recognition of optical fiber vibration signal of the submarine cable for its safety. IEEE Sens. J. 2021, 21, 6510–6519. [Google Scholar] [CrossRef]
  63. Pang, F.; He, M.; Liu, H.; Mei, X.; Tao, J. A fading-discrimination method for distributed vibration sensor using coherent detection of φ-OTDR. IEEE Photonics Technol. Lett. 2016, 28, 2752–2755. [Google Scholar] [CrossRef]
  64. Runde, M.; Kvien, O.; Forster, H. Cavities in mass-impregnated HVDC subsea cables studied by AC partial discharge measurements. IEEE Trans. Dielectr. Electr. Insul. 2019, 26, 913–921. [Google Scholar] [CrossRef]
  65. Dordinejad, A.K.; Sharif, F.; Ebrahimi, M.; Rashedi, R. Rheological and thermorheological assessment of polyethylene in multiple extrusion process. Thermochim. Acta 2018, 668, 19–27. [Google Scholar] [CrossRef]
  66. Hartog, A.H.; Englich, F.V. Non-linear interactions with backscattered light: A truly single-ended Brillouin optical time-domain analysis technique. J. Light. Technol. 2019, 37, 2386–2402. [Google Scholar] [CrossRef]
  67. Horiguchi, T.; Tateda, M. Optical-fiber-attenuation investigation using stimulated Brillouin scattering between a pulse and a continuous wave. Opt. Lett. 1989, 14, 408–410. [Google Scholar] [CrossRef]
  68. Zhou, D.; Wang, B.; Bade, X. Fast distributed Brillouin fiber optic sensing for dynamic strain measurement. Acta Opt. Sin. 2018, 38, 67–81. [Google Scholar]
  69. Wang, R.; Kang, H.; He, Y. Ultrasonic detection of internal defects in silicone rubber materials of cable joints. Insul. Mater. 2021, 54, 102–108. [Google Scholar]
  70. Song, J.; Wang, R.; Ji, H. Thermal aging of silicone rubber materials for cable joints with ultrasonic sound velocity characteristics. Insul. Mater. 2020, 53, 50–54. [Google Scholar]
  71. Siegel, P.H. Terahertz technology. IEEE Trans. Microw. Theory Tech. 2002, 50, 910–928. [Google Scholar] [CrossRef]
  72. Li, M.; Tong, M.M.; Fletcher, J.E.; Dong, Z.Y. A novel approach to investigate the deterioration of insulation of oils in power transformers with terahertz time-domain spectroscopy. IEEE Trans. Dielectr. Electr. Insul. 2017, 24, 930–938. [Google Scholar] [CrossRef]
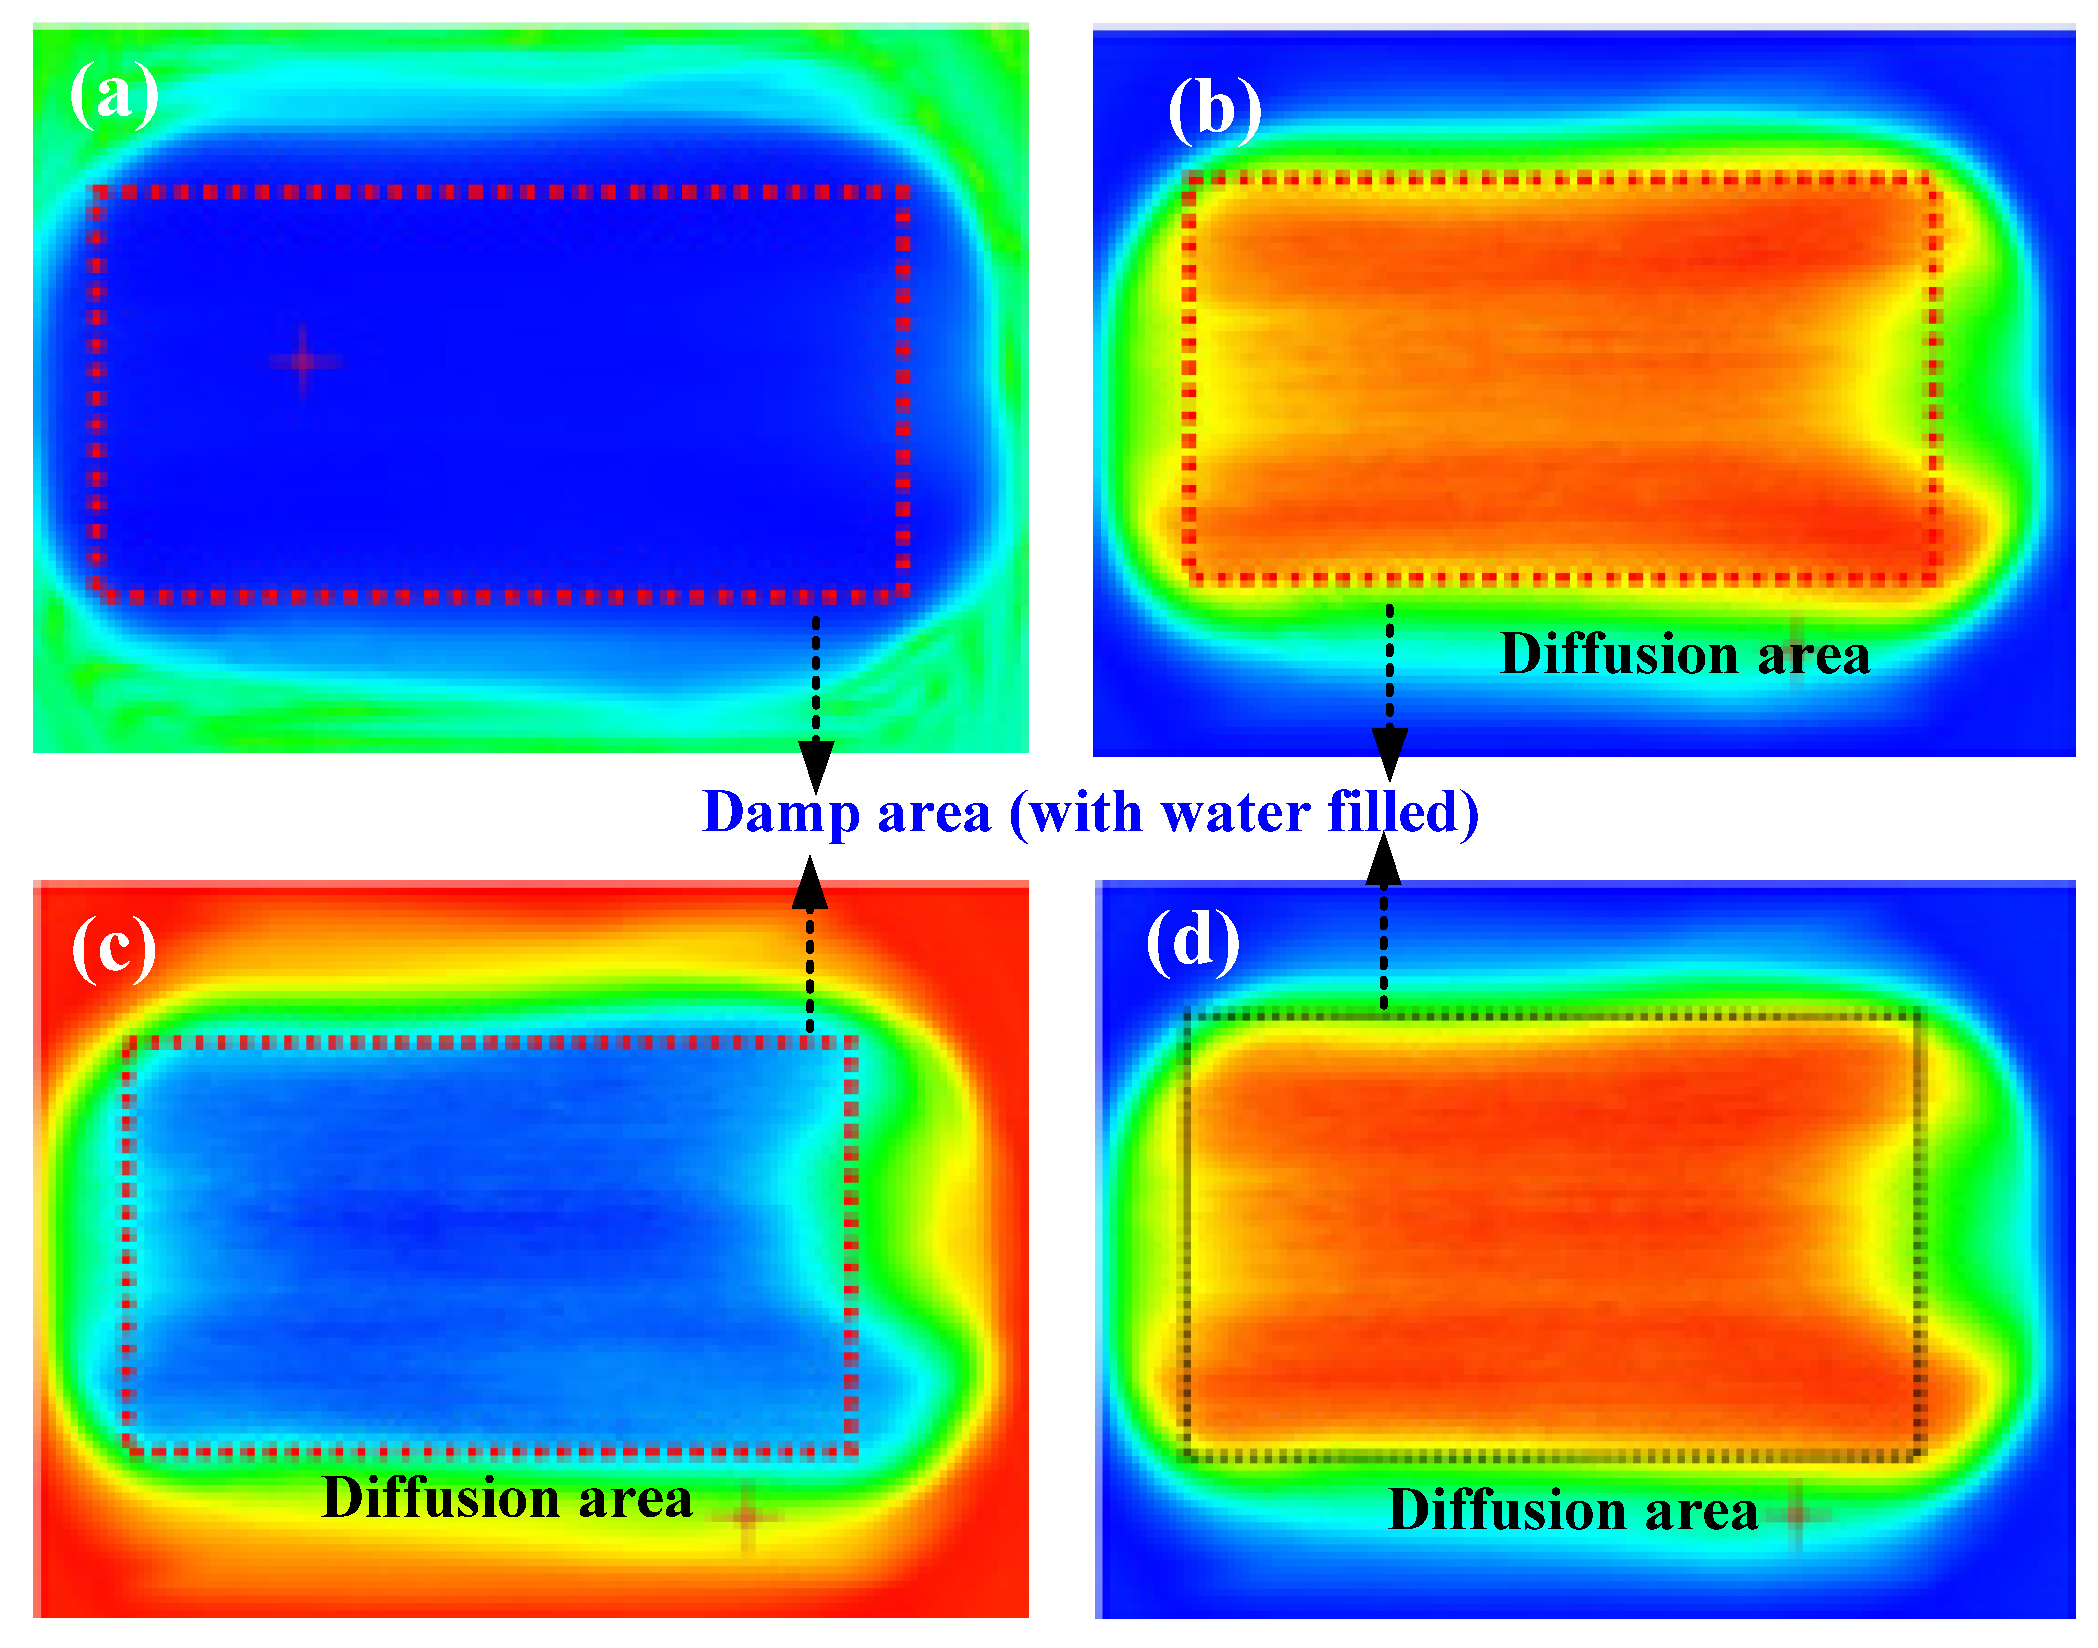
  73. Li, S.; Cao, B.; Kang, Y.; Cui, Y.; Dong, H. Nonintrusive inspection of moisture damp in composited insulation structure based on terahertz technology. IEEE Trans. Instrum. Meas. 2021, 70, 6011110. [Google Scholar] [CrossRef]
  74. Xie, S.; Yang, F.; Huang, X. Analysis of air gap detection of cross–linked polyethylene cable insulation based on terahertz time-domain spectroscopy. Trans. Chin. Electr. Soc. 2020, 35, 2698–2707. [Google Scholar]
  75. Li, S.; Cao, B.; Cui, Y.; Kang, Y.; Gao, S.; Li, H.; Dong, H. Terahertz-based insulation delamination defect inspection of vehicle cable terminals. IEEE Trans. Transp. Electrif. 2022. [Google Scholar] [CrossRef]
Figure 1. Schematic diagram of the cables used in offshore wind power generation systems.
Energies 16 00322 g001
Figure 2. Torsion-resistant cable for wind power generation.
Energies 16 00322 g002
Figure 3. Single core submarine cable structure diagram. Model YJQ41 12-layer single-core fiber-optic composite submarine cable structure planing surface, a 12-layer structure.
Energies 16 00322 g003
Figure 4. Tensile test schematic [21].
Energies 16 00322 g004
Figure 5. Deformation of submarine cable cross-section at the fault surface [22]. The black curve indicates the copper conductor, the blue curve indicates the galvanized armor layer, and the red curve indicates the XLPE insulation. When a slip fault occurs, the structural deformation of each layer of the submarine cable is different, and the damage caused to it is also different.
Energies 16 00322 g005
Figure 6. The initial voltage of local discharge under different aging times [31].
Energies 16 00322 g006
Figure 7. Finite element model of submarine cable [41].
Energies 16 00322 g007
Figure 8. Stress distribution cloud of optical cell [41]. (a) Stress distribution cloud when the fiber is twisted clockwise; (b) Stress distribution cloud diagram when the fiber is twisted counterclockwise.
Energies 16 00322 g008
Figure 9. Submarine cable structure stress time course curve [41]. The A curve is the stress time course curve for the counterclockwise twisting of the armor layer. The B curve is the stress time course curve for the clockwise twisting of the armor layer. The C curve is the stress time course curve for the counterclockwise twisting of the copper conductor. The D curve is the stress time course curve of the copper conductor twisted clockwise.
Energies 16 00322 g009
Figure 10. Tensile test results of XLPE samples under 1440 h aging [55]. The black curve indicates the specimen without aging, the red curve indicates the thermal aging specimen, and the blue curve indicates the combined thermal-vibration aging specimen. The mechanical stress generated by vibration will cause the aging of XLPE, which makes the XLPE specimen less elastic and easy to be destroyed.
Energies 16 00322 g010
Figure 11. SEM test results of XLPE specimens aged 1440 h [55]. (a) Unaged samples; (b) single heat-aged sample; (c) combined heat-vibration aging sample.
Energies 16 00322 g011aEnergies 16 00322 g011b
Figure 12. Partial discharge UHF detection method principle.
Energies 16 00322 g012
Figure 13. The typical system architecture of ROTDR.
Energies 16 00322 g013
Figure 14. Typical system structure of BOTDA.
Energies 16 00322 g014
Figure 15. Principle diagram of the pulse-echo method.
Energies 16 00322 g015
Figure 16. Ultrasonic testing results graph [69]. (a) Bubble defect detection result; (b) Air gap defect detection result; (c) Steel needle defect detection result.
Energies 16 00322 g016aEnergies 16 00322 g016b
Figure 17. Terahertz imaging schematic.
Energies 16 00322 g017
Figure 18. XLPE samples for experimental use [74].
Energies 16 00322 g018
Figure 19. Terahertz amplitude imaging and phase imaging [74]. (a) THz amplitude imaging; (b) physical samples; (c) Time delay t = 253 ps; (d) Time delay 254 ps.
Energies 16 00322 g019
Figure 20. Frequency-domain imaging for the synthetic testing sample [75]. (ac) Three-view imaging results at 0.348 THz; (df) Three-view imaging results at 0.476 THz. Reprinted/adapted with permission from Ref. [75]. 2022, IEEE Transactions on Transportation Electrification.
Energies 16 00322 g020
Figure 21. Top-view of time-domain THz images of the testing sample under different modes [75]. (a) Absorption spectrum imaging at 0.476 THz; (b) Maximum-peak imaging; (c) Minimum-peak imaging; (d) Peak-peak imaging.At the same time, this delamination also leads to moisture intrusion, causing the insulation of the cable to deteriorate with moisture and form water dendrites. After a long period of operation, the dendrites develop and eventually lead to the breakdown of the main insulation of the cable terminals. Shuaibing Li et al. similarly used the terahertz technique to detect the moisture inside the insulation [73]. In the inspection of the samples, it was found that the results of the terahertz frequency domain spectrum test could determine the presence of moisture inside the insulation, but the region of moisture could not be determined, so terahertz imaging was used to determine the region of moisture. In their study, the imaging bands were chosen to be 0.623 THz and 1.648 THz. The imaging results of samples with different viewing angles are shown in Figure 22.
Energies 16 00322 g021
Figure 22. Frequency-domain imaging for artificial test samples [73]. (ac) Three-view imaging results at 0.623 THz; (df) Three-view imaging results at 1.648 THz.
Energies 16 00322 g022
Figure 23. Terahertz images of the test sample under different imaging modes at 0.842 THz [73]. (a) Absorption spectrum imaging; (b) Maximum peak imaging; (c) Minimum peak imaging; (d) Peak-peak imaging.
Energies 16 00322 g023
Table 1. Cable online monitoring technology features.
Online Monitoring MethodsMeasurement
Parameters
Features
DC component methodDC componentsEffective when containing water branches, susceptible to interference from spurious signals
AC superposition methodCharacteristic
current
Effective when containing water branches, high precision, strong anti-interference ability
Partial discharge methodPartial dischargeEffective identification of insulation defects, the weak partial discharge signal
Phase-sensitive optical time-domain reflection technologyVibration
Information
Intrusion alarm and location, abnormal vibration detection
Raman light time domain
reflection technology
Cable temperatureEarly warning of abnormal cable temperature
Brillouin optical time domain
analysis technique
Cable strainLong monitoring distance and high accuracy
Table 2. Technical characteristics of cable insulation defect detection.
Insulation Defect Detection MethodAdvantagesDisadvantages
Ultrasonic inspection technology1. It Is a non-destructive testing method; ultrasonic parameters can characterize the structure and properties of the material and can achieve the positioning and imaging of internal defects in insulation.
2. It has various technical advantages, such as low cost and easy on-site inspection.
1. Need coupling agent, which limits some detection environments and applications.
2. There is a sensitivity problem for the detection of millimeter-level
defects.
THz detection
technology
1. It has a strong penetration ability to non-polar substances and is a non-destructive testing method with high sensitivity to millimeter-level defect detection.
2. It can detect the hidden defects existing inside the insulation material and can accurately locate defects and calculate the geometric shape information.
3. It can directly obtain the physical quantities, such as the dielectric constant and refractive index of the main insulation of the cable.
1. Terahertz detection technology is stuck in the academic research stage and cannot be applied to the actual engineering site.
2. In practice, the cable is a multi-layer cylindrical structure, and when the thickness is large, the received THz signal is weak, and the detection result is not satisfactory.
3. Terahertz radiation cannot penetrate metal and thus cannot detect the structural integrity of the cable.
Disclaimer/Publisher’s Note: The statements, opinions and data contained in all publications are solely those of the individual author(s) and contributor(s) and not of MDPI and/or the editor(s). MDPI and/or the editor(s) disclaim responsibility for any injury to people or property resulting from any ideas, methods, instructions or products referred to in the content.

