Article

A Fractal Model of Effective Thermal Conductivity of Porous Materials Considering Tortuosity

1
School of Energy and Power Engineering, Chongqing University, Chongqing 400030, China
2
Key Laboratory of Low-Grade Energy Utilization Technology and Systems, Chongqing University, Ministry of Education, Chongqing 400030, China
*
Author to whom correspondence should be addressed.
Energies 2023, 16(1), 271; https://doi.org/10.3390/en16010271
Submission received: 28 November 2022 / Revised: 17 December 2022 / Accepted: 23 December 2022 / Published: 27 December 2022

Abstract

:
Accurate estimation of the thermal conductivity of porous materials is crucial for the modeling of heat transfer and energy consumption calculation in energy, aerospace, biomedicine and chemical engineering, etc. The series-parallel model is a simple and direct method and is usually used in the prediction of the effective thermal conductivity (ETC) of porous materials. In this work, the weighted coefficients of the series and parallel section were obtained based on the tortuosity of the porous materials. Then, the physical model of the ETC of the porous materials was established. Furthermore, the ETC of the porous materials was developed using the fractal model to calculate the pore cross-sectional area of the porous materials. Finally, quantitative analysis of the characteristic parameters, e.g., porosity, tortuosity, tortuous fractal dimension and pore diameter distribution, of the ETC of the porous materials was conducted. The results show that the proposed model can provide an accurate prediction of the ETC of porous materials.

1. Introduction

Porous materials, such as sand, soil and foam material, are composite materials in which the internal space is occupied by the solid skeleton and fluid. Heat transfer of the porous materials has received a lot of attention in many fields, such as energy, aerospace and chemical engineering. To simplify the heat transfer in porous materials, the heat transfer of the solid skeleton and various fluids in porous materials is usually regarded as equivalent heat conduction. Subsequently, the effective thermal conductivity (ETC) of the porous materials can be obtained through the Fourier law. Estimating the ETC of the porous materials is useful not only in engineering design but also in constructing specific pore structures to improve or weaken the thermal conductivity of the porous materials.
Many models have been proposed to predict the effective thermal conductivity of porous materials, for example, the series-parallel model [1], Maxwell model [2], Bruggeman model [3] and effective medium theory (EMT) model [4]. Among the various models, the most widely used is the series-parallel model, which is established by the principle of thermoelectric analogy, as shown in Table 1. This table shows the two extreme models for the thermal conductivity that might be used, namely series and parallel, and the ETC λe of the porous materials is defined as:
λ e = W λ s + 1 W λ p
where λ1, λ2 are the thermal conductivity of the solid matrix and the liquid/gas in pores, respectively; ε is the porosity of the porous materials; W represents the weight coefficient of the component of porous materials thermal conductivity model; λs is the series thermal conductivity and λp is the parallel thermal conductivity. It can be seen from Equation (1) that the weight coefficient is the key to the ETC model of porous materials. The selection or determination of series and parallel weight coefficient of the porous materials can be divided into three categories. The first way is to simply take the median value of 0.5 as the series and parallel weight coefficients of the porous materials, as in Kong et al. [5]. However, the error of this method is generally large. The second way is to calculate the series and parallel weighted coefficients based on some hypothetical pore shape in the porous materials. For example, Qian et al. [6] assumed that the pore shape was spherical, and the weight coefficient of the porous materials was obtained by the average integration method. Nevertheless, the pore size and shape in this method are usually fixed and simple to avoid insoluble calculation. Another way is to determine the series-parallel weight coefficients based on the Sierpinski carpet structure, and many forecasting models have been proposed [7,8,9,10,11]. However, the pores of these models are not connected, which is not consistent with the reality and leads to a significant difference between the calculated and the experimental results. To overcome this defect, Wang et al. [12] associated the tortuosity with the weight coefficient of the series-parallel model, and their results showed a good prediction of the ETC of the porous materials. Unfortunately, they did not explain in detail how to deduce the weight coefficient in terms of the tortuosity, and their calculation process was too complex due to the introduction of the hypergeometric function. Despite that, Wang’s method still provided an interesting idea to incorporate the tortuosity of the porous materials in the weight coefficient of series-parallel model.
The pore space of porous materials is highly chaotic, and the flow path of the fluid in porous materials is tortuous. Therefore, the tortuosity of porous materials is the ratio of the actual length of the fluid path to the characteristic length along the macroscopic driving potential [13]. In this study, according to the definition of tortuosity, the relationship between tortuosity and series and parallel weight coefficient was analyzed, then the thermal conductivity model of the porous materials expressed by tortuosity was obtained. However, this model is only related to the porosity and tortuosity of the materials. This leads to the thermal conductivity model not taking the microstructure parameters of the porous materials into account sufficiently, e.g., the pore size distribution, area fractal dimension and tortuosity fractal dimension. The introduction of fractal theory into the model is an effective method to study the influence of the microstructure parameters of the porous materials on the ETC [14].
Fractals are geometric figures characterized by fractional dimension (Df), intricate and complex structure, geometric construction based on iteration procedure and geometric schemes that are repeated on different scales [15,16]. Fractal geometry and analysis were introduced by Mandelbrot to describe mathematical and natural objects with highly irregular shapes in the 1970s [17]. The fractal theory is an effective method for discussing the complex pore structure features of the porous materials [18]. The method of fractal geometry was often used to describe the impact of microstructure parameters on the physical properties of the porous materials, e.g., the ETC [19,20], spontaneous capillary self-absorption [21,22], permeability [23,24] and electrical conductivity [25,26].
Based on the literature survey, we found that there was little research on the influence of tortuosity on ETC of porous materials. Therefore, the aim of this work was to accurately estimate the ETC of the porous materials combing the effect of tortuosity and to analyze the effect of microstructure parameters on the ETC of porous materials. We simplified the geometric structure of the capillary bundles model of porous materials and obtained the weight coefficient of the series-parallel model. Subsequently, a new ETC model was established using the fractal model to calculate the pore cross-sectional area. The new model was validated by comparing model predictions with experimental data in the published literature. Based on the proposed model, the effects of porosity, tortuosity, pore size distribution and other microstructure parameters on the effective thermal conductivity of porous materials were also analyzed and evaluated.

2. Model Establishment

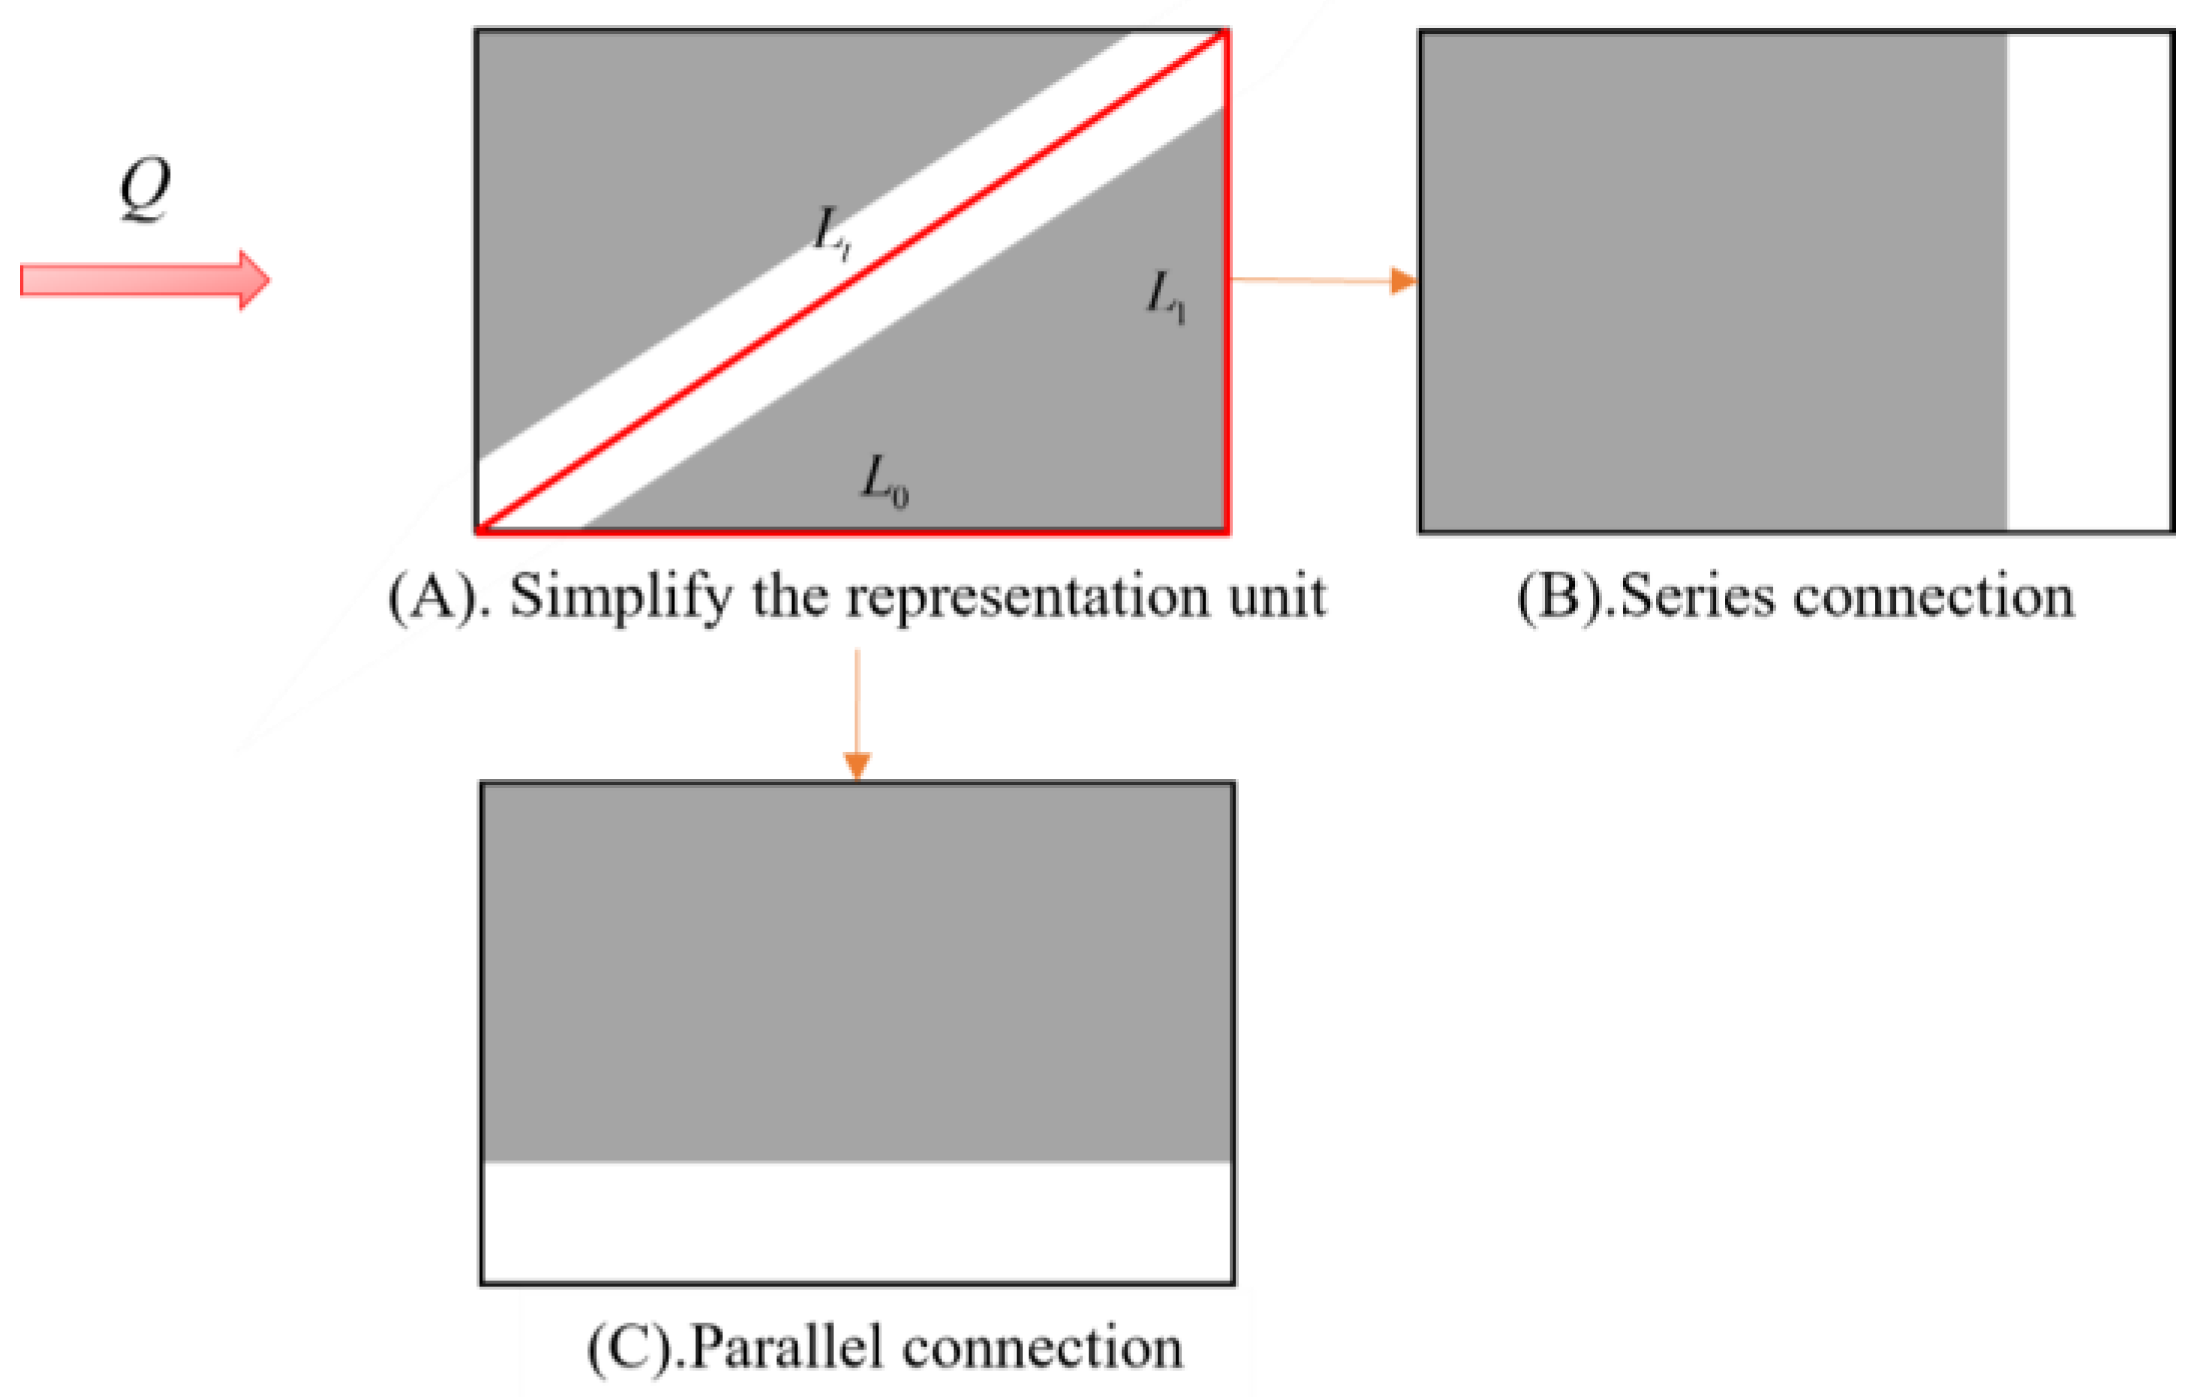
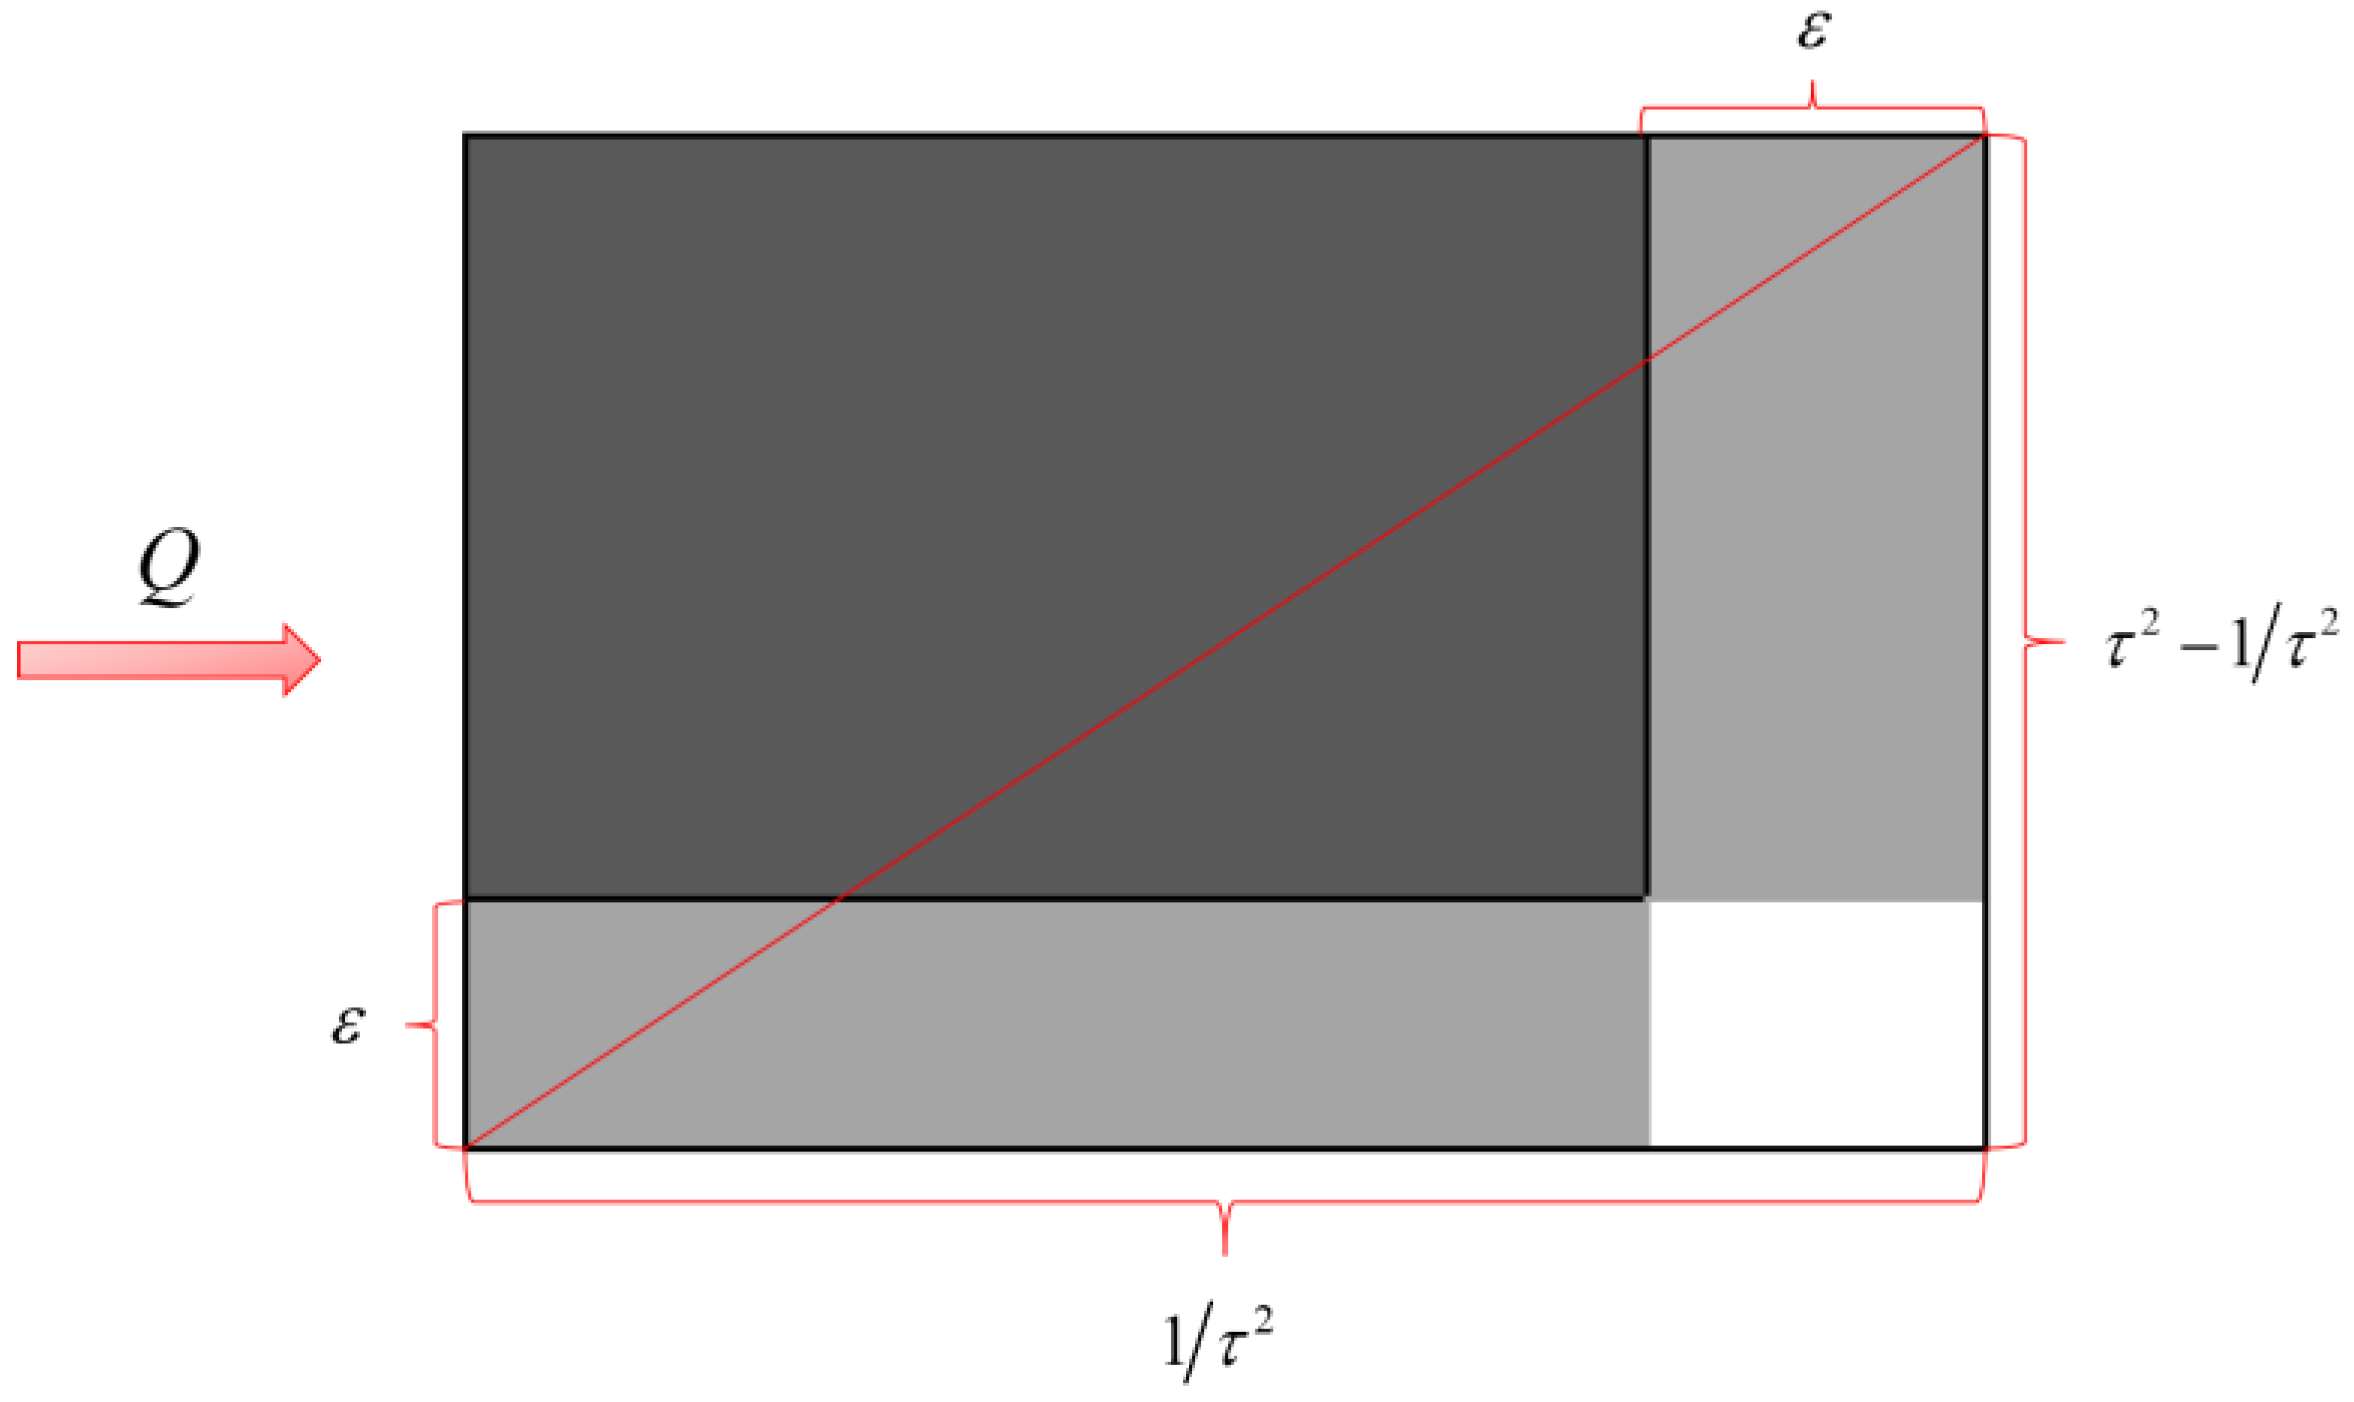
2.1. Weight Coefficients in Terms of Tortuosity

To simplify our modeling, the pore structure of porous materials is approximately assumed to be connected by pores of different sizes according to the characteristics of the porous material. Furthermore, the pore structure of the porous materials is simplified as a capillary bundle with a certain tortuosity, as is shown in Figure 1A. Within a certain size, the pore sizes are randomly distributed in the cross-section of vertical heat flow direction. In the cross-section parallel to the heat flow direction, the capillary bundles are connected by pore spaces, and several capillary channels run in parallel arrays.
The cross-section of porous materials along the direction of heat flow consists of two parallel phases: solid and liquid/gas. A representation unit, as depicted in the red dotted line in Figure 1A, is taken on the longitudinal section of the simplified model of structure space of the porous materials, as shown in Figure 1B.
Tortuosity is usually defined as [13]:
τ = L t L 0
where Lt is the actual length of the fluid path and L0 is the characteristic length in the direction of the macroscopic driving potential gradient, i.e., it is the length along the heat flow. To use the series-parallel model to represent the ETC of the porous materials, the geometry of Figure 2 is simplified to the form shown in Figure 2A.
As shown in Figure 2A, we assume that Lt is a straight line, which represents the hypotenuse of the right triangle. The length of the projection below Lt downwards is L0, which is a right edge of the right triangle. The two-dimensional structure is represented by Figure 2C, in which the solid matrix and pores are in parallel in the direction of heat flow, and the parallel part is L0. The other leg of a right triangle is assumed to be L1, which is the projection of Lt to the right. The two-dimensional structure is shown in Figure 2B, where the solid matrix and pores are in series in the direction of heat flow, and the series part is L1.
It is obvious in Figure 2A that:
L t 2 = L 1 2 + L 0 2
Dividing both sides of Equation (3) by Lt2, the following equation is obtained:
L 1 2 L t 2 + L 0 2 L t 2 = 1
where the term of L12/Lt2 is the weight coefficient of the series part of the porous materials, and L02/Lt2 is the weight coefficient of the parallel part of the porous materials. Therefore, the following equation is obtained by combing Equations (3) and (4):
τ 2 1 τ 2 + 1 τ 2 = 1
The rectangle shown in Figure 3 is made up of Figure 2B,C where the real length of the fluid path is the length of the diagonal Lt. The weight coefficient of the parallel part can be expressed in terms of the length of the rectangle, and the weight coefficient of the series part can be expressed in terms of the width of the rectangle.
Combined with Figure 3 and Equation (5), the weight coefficient of the series part is (τ2−1)/τ, and the weight coefficient of the parallel part is 1/τ2. Then, the series-parallel thermal conductivity can be expressed as:
λ e = τ 2 1 τ 2 λ s + 1 τ 2 λ p
where the parallel thermal conductivity is λp = ε(λ2−λ1) 1 and the series thermal conductivity is λs = 1/[(1 ε)1 + ε/λ2].

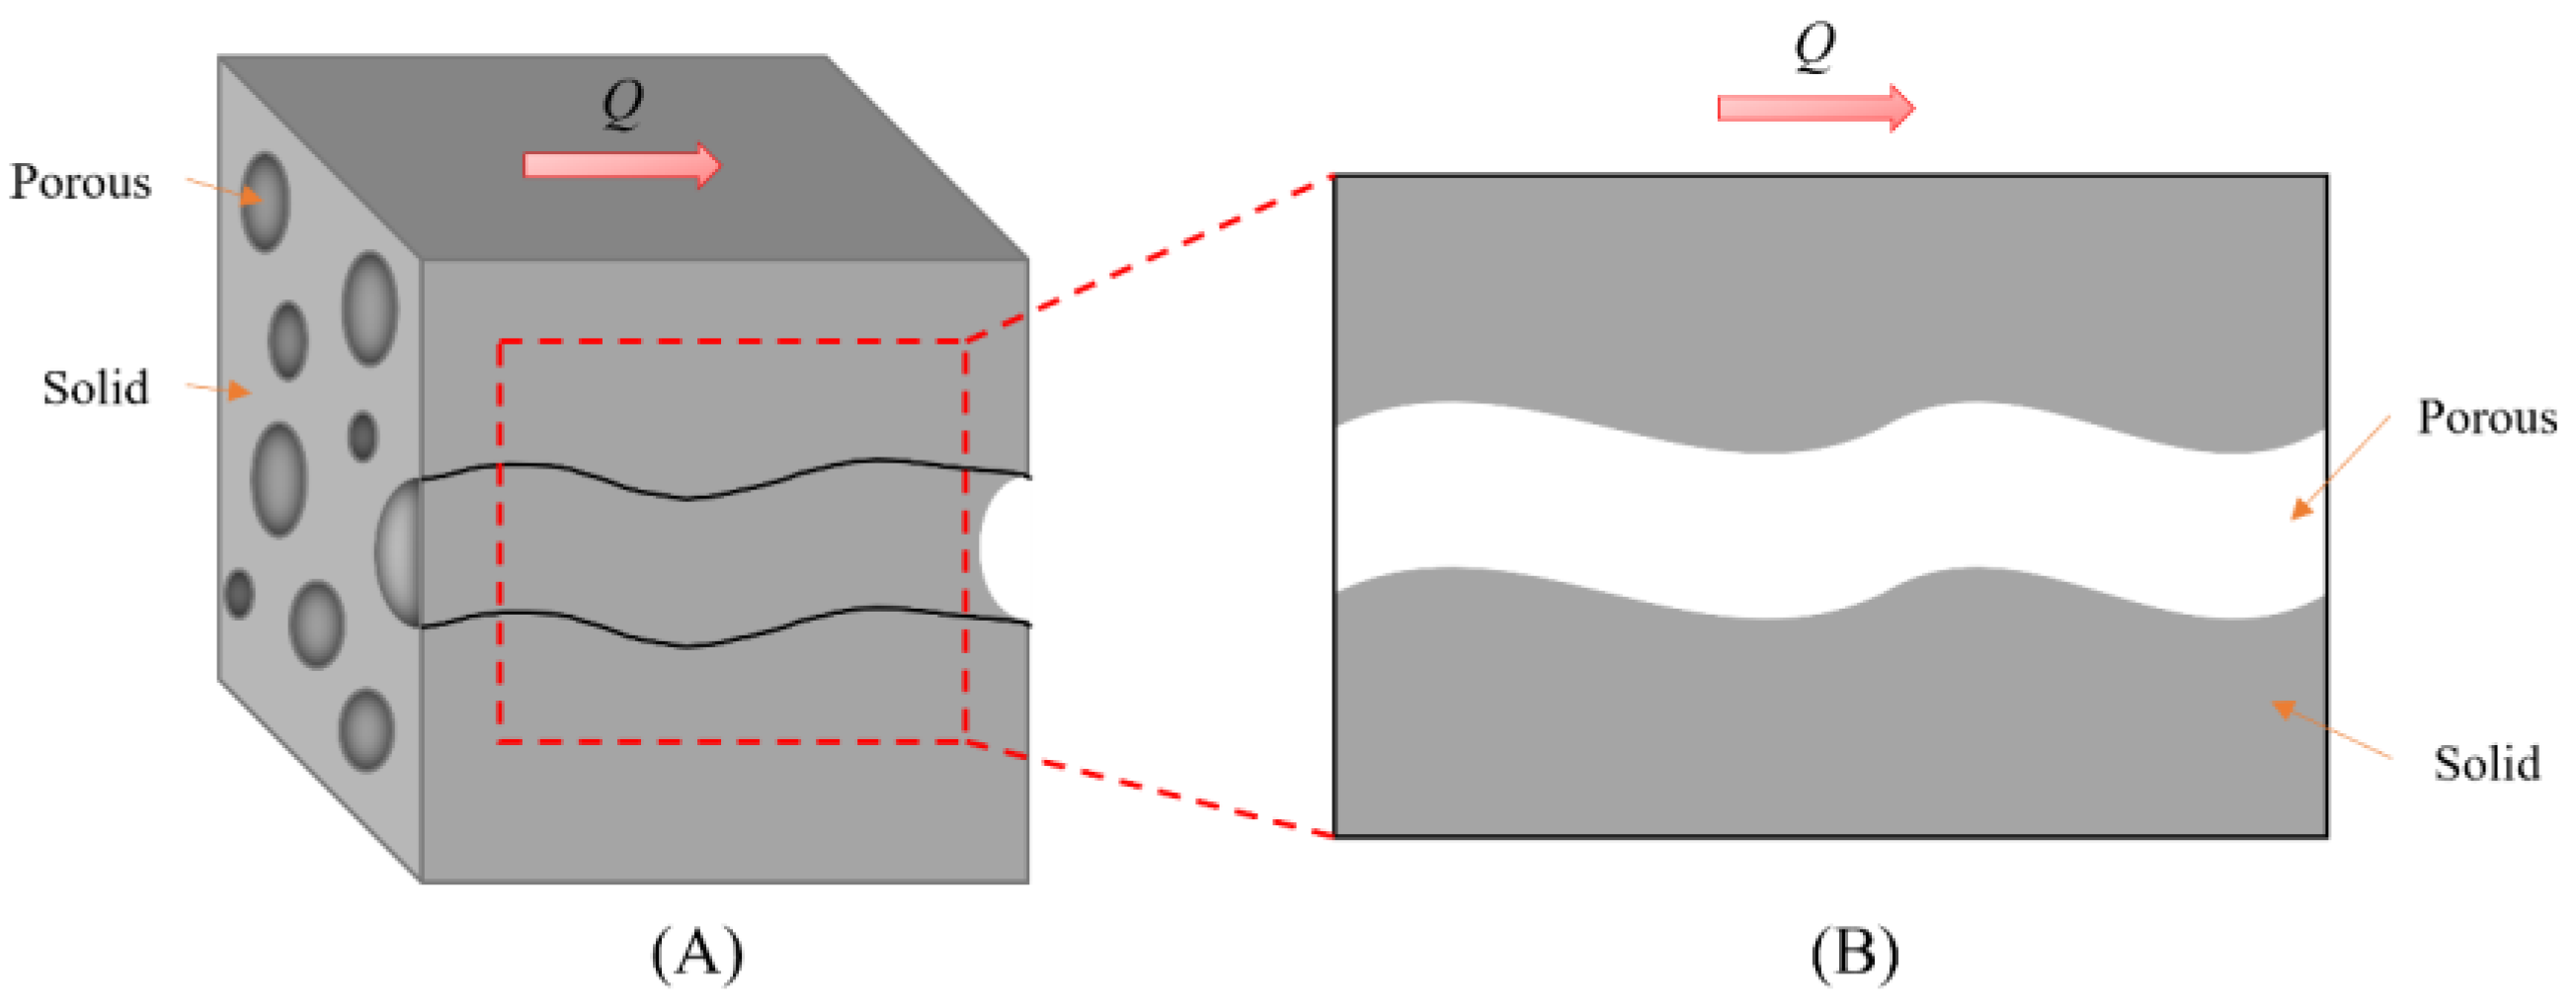
2.2. Fractal Theory for Porous Media

Equation (6) calculates the ETC of porous materials through the series-parallel model. However, microstructure parameters, such as the pore size of porous materials, are not included. The fractal theory is an effective method for discussing the microstructure of porous materials.
To analyze porous materials by fractal theory, the pore size distribution of the porous materials holds if and only if:
Φ min Φ max D f 0
is satisfied, where Df is the area fractal dimension, and Φmin and Φmax are the minimum pore diameter and maximum pore diameter of the porous materials, respectively. Equation (7) [27] implies that fractal analysis of the porous materials must satisfy Φmin << Φmax; if the porous materials are non-fractal, then this condition is not satisfied. In general, Φminmax < 10−2 holds in the porous materials and Equation (7). Therefore, fractal properties of the porous materials can be analyzed by using fractal theory.
For fractal structures, which are statistically self-similar, Yu et al. [27] stated that the cumulative size distribution of pore should follow the following scaling law:
N ( Φ ) = Φ max Φ D f
where d is the pore diameter, N is the number of pores with a diameter (Φ) greater than Φ.
Equation (8) can be approximated as the following equation because of the large number of pores in the porous materials. The number of pores with sizes lying between Φ and Φ + dΦ can be obtained as
dN = D f Φ max D f Φ ( D f + 1 ) d Φ
The minus sign in Equation (9) indicates that the number of the cumulative pores decreases as the pore size increases.
In this work, the pores of porous materials are assumed to consist of curved capillary bundles. The tortuous length of a capillary bundle along the flow direction can be expressed as [13]:
L t = Φ 1 D T L 0 D T
where DT is the tortuous fractal dimension. The degree of the tortuous fractal dimension is represented by the tortuosity fractal dimension. DT can be obtained from Equations (2) and (10) as:
D T = 1 + ln τ ln L 0 Φ

2.3. The ETC Model for Porous Materials
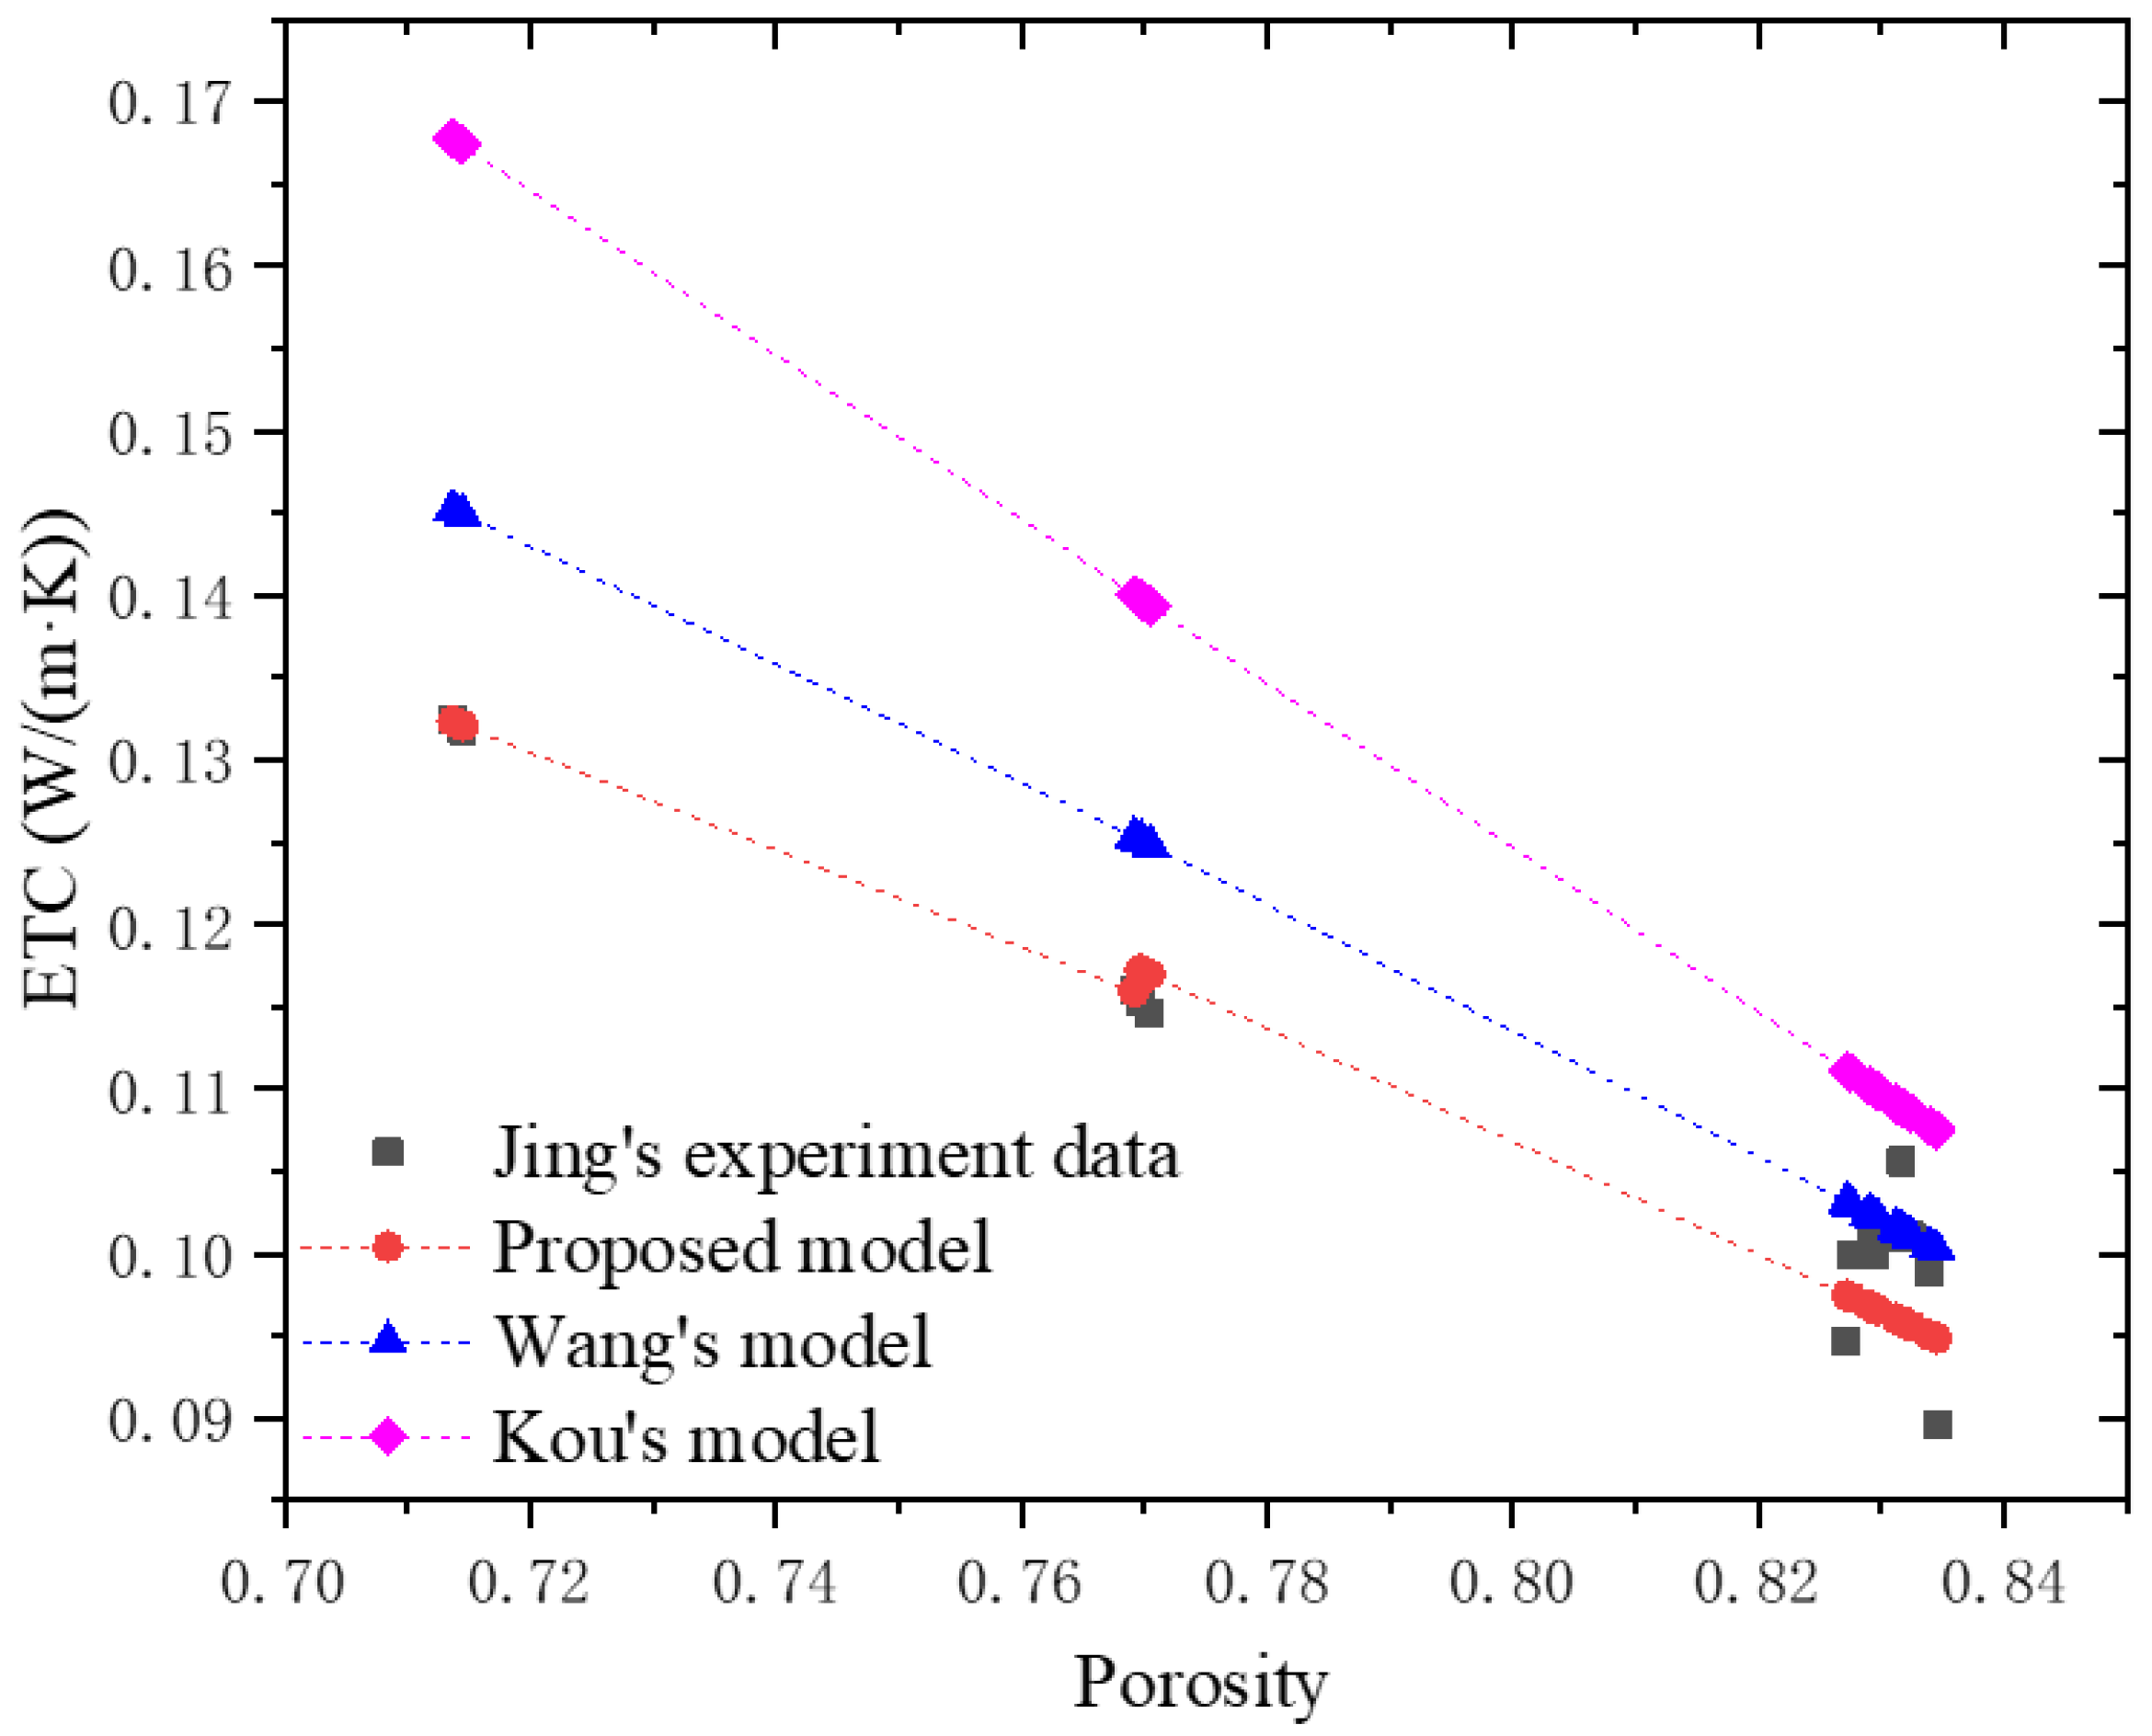
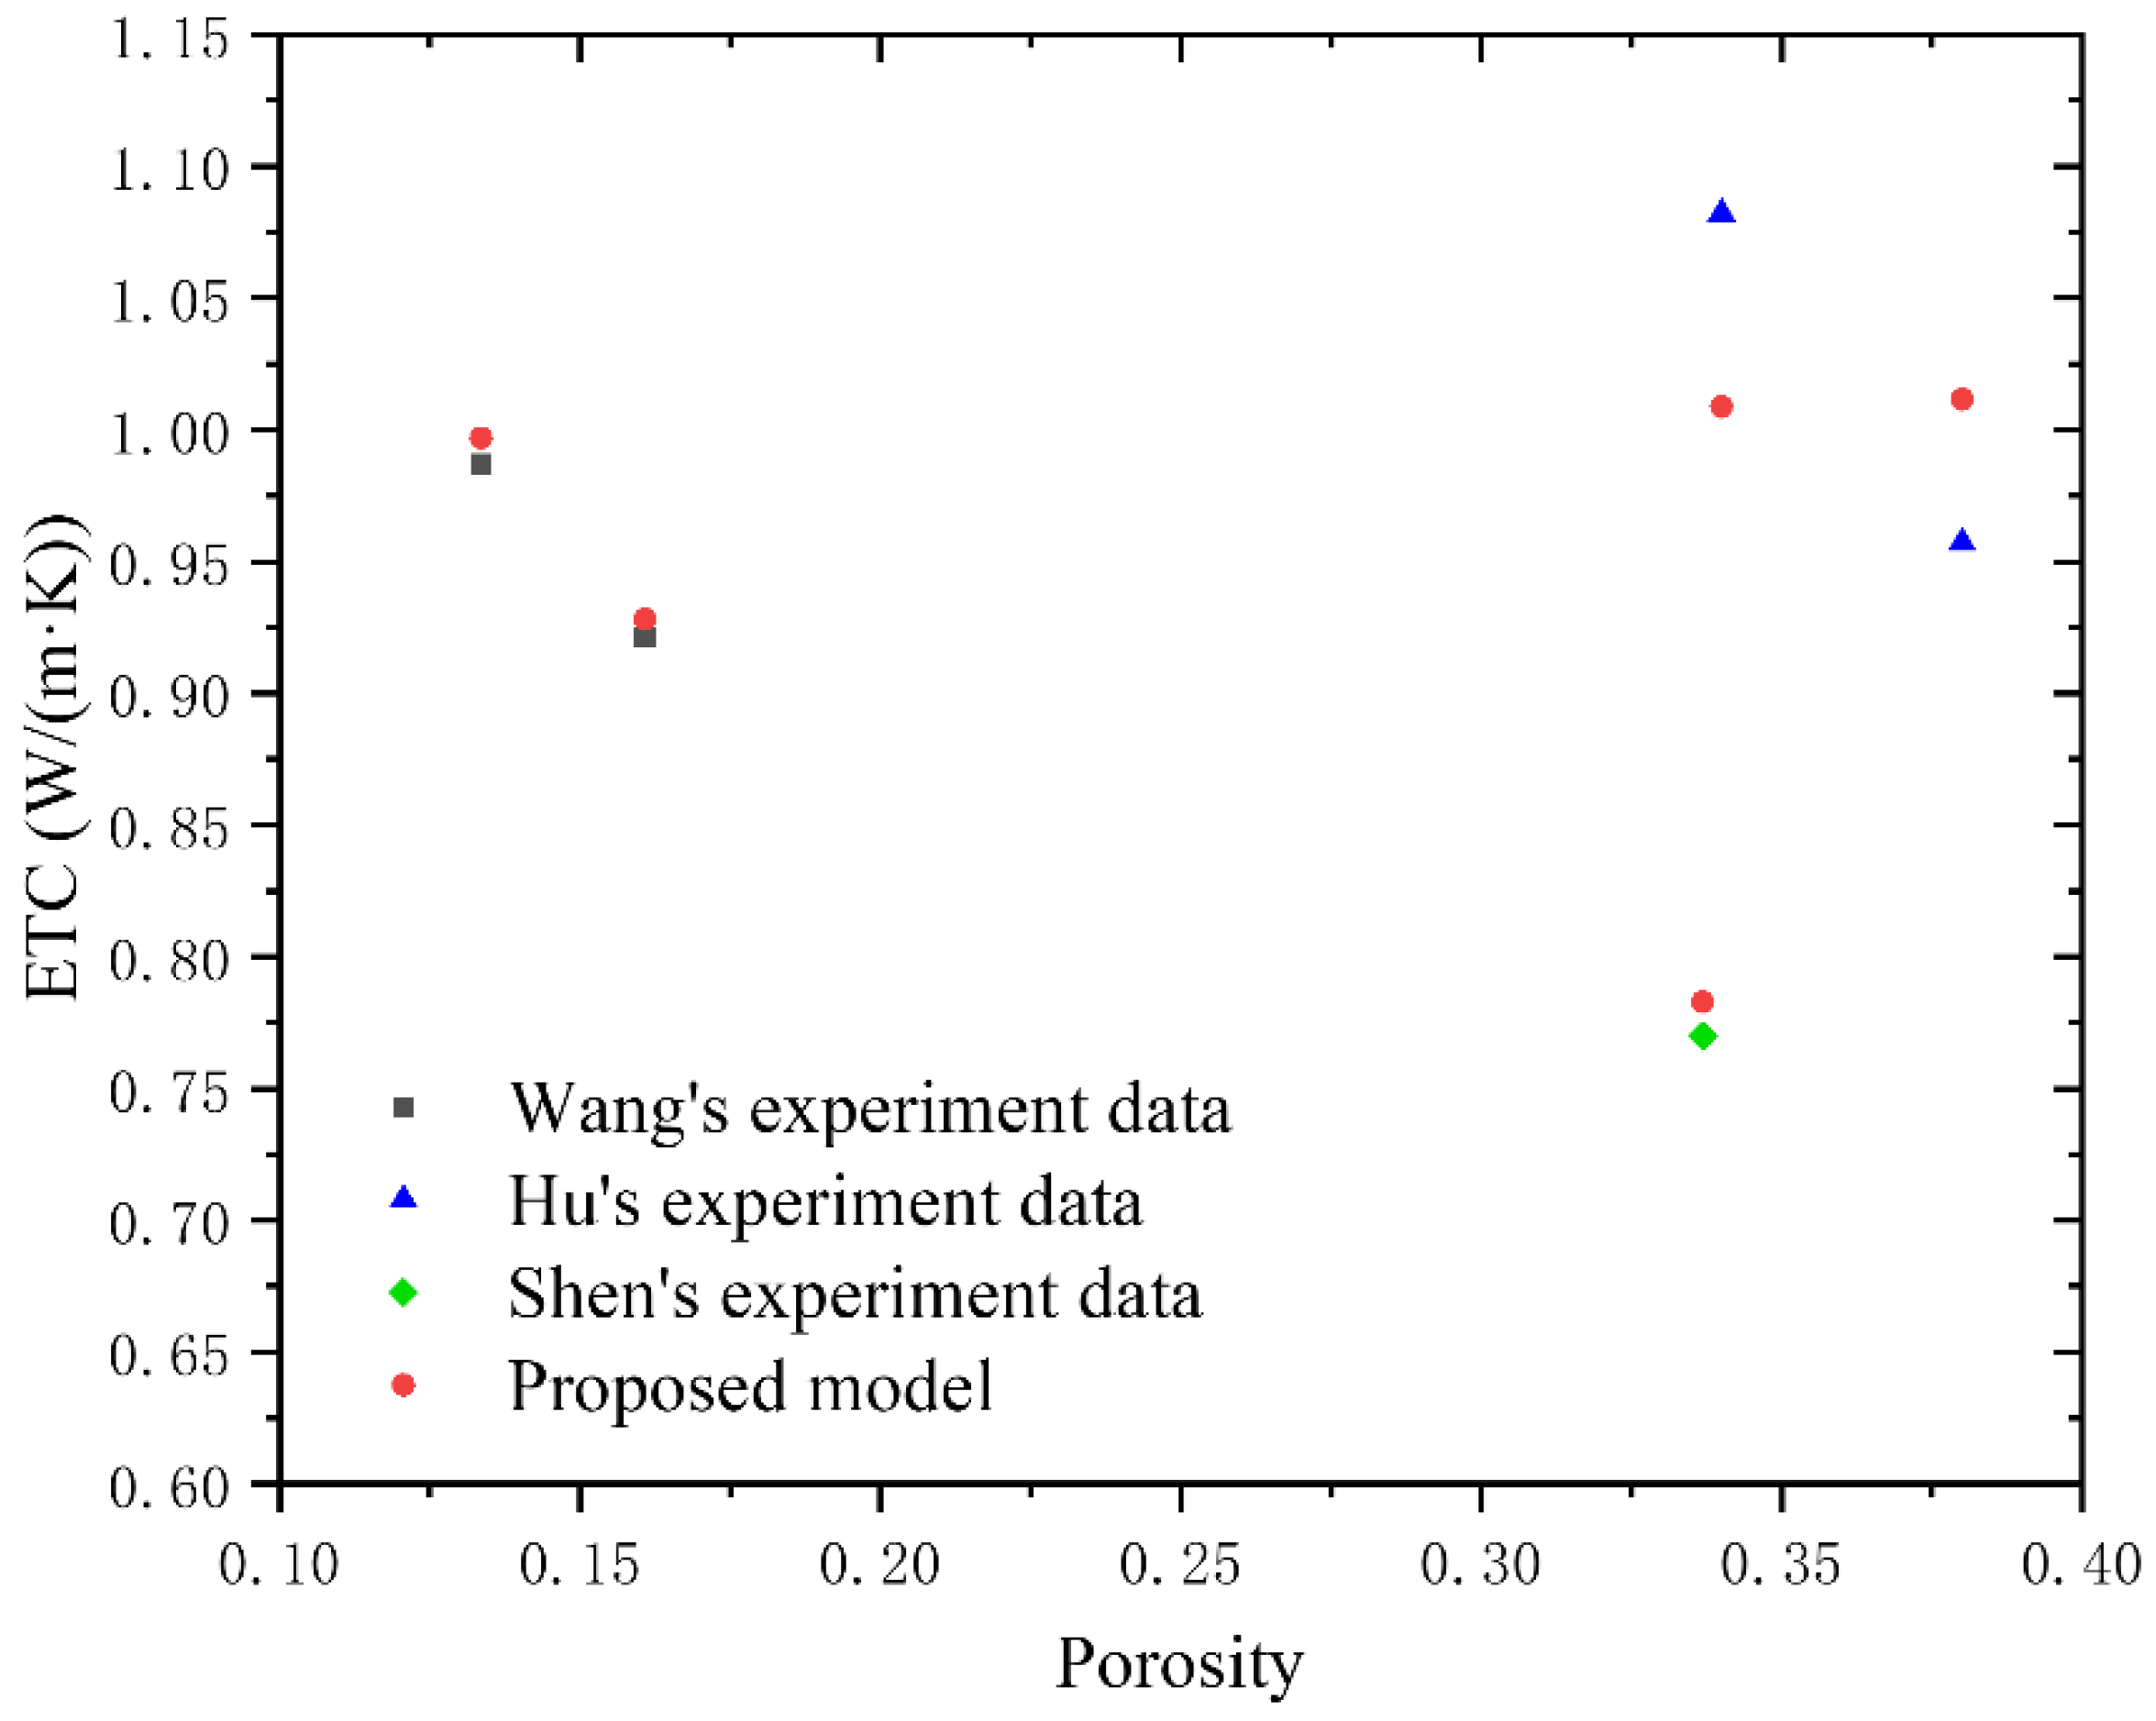
According to Fourier’s law, the heat flow through a representative unit cross-section with the thickness of L0 is given by:
q R = A λ e Δ T L 0 = Φ 2 π λ e Δ T 4 ε L 0
where ∆T is the temperature difference between both sides of the cross-section of a representative unit with a thickness of L.
The total heat transfer of the material can be calculated by integrating the cross-section of the heat flow from the minimum to the maximum solid–gas cross-section:
Q = Φ min Φ max π λ e Δ T τ 4 ε L 0 D T D f Φ max D f Φ D T D f d Φ
The integration result of Equation (13) can be obtained by the following formula.
Q = π λ e Δ T τ 4 ε L 0 D T D f Φ max D f Φ max 1 + D T D f Φ min 1 + D T D f 1 + D T - D f
where λe is the series-parallel thermal conductivity in Equation (6).
From the macroscopic point of view, according to Fourier’s law, the heat flow Qt through the material with At and a thickness of L can be expressed as:
Q t = λ e , m L 0 A t Δ T
where λe,m is the ETC and At is the total cross-sectional area of the porous materials from minimum to maximum pores, which can be denoted by:
A t = Φ min Φ max π 4 ε D f Φ max D f Φ 1 D f d Φ
The total cross-sectional area can be obtained by carrying out the integration:
A t = π D f Φ max D f 4 ε 2 D f Φ max 2 D f Φ min 2 D f
Therefore, the heat flow through the material can be obtained by (15):
Q t = λ e , m π D f Φ max D f Δ T 4 ε 2 D f L 0 Φ max 2 D f Φ min 2 D f
Due to the heat flow through porous materials being identical, the ETC can be obtained by letting Equation (18), equal to Equation (14), then,
λ e , m = L 0 1 D T 2 D f Φ max 1 + D T D f Φ min 1 + D T D f τ 1 + D T D f Φ max 2 D f Φ min 2 D f λ e
Equation (16) is substituted into Equation (19) to obtain:
λ e , m = L 0 1 D T 2 D f Φ max 1 + D T D f Φ min 1 + D T D f τ 1 + D T D f Φ max 2 D f Φ min 2 D f 1 τ 2 λ s + τ 2 1 τ 2 λ p
The series-parallel thermal conductivity is substituted into Equation (20), and the ETC expression is:
λ e , m = L 0 1 D T 2 D f Φ max 1 + D T D f Φ min 1 + D T D f τ 1 + D T D f Φ max 2 D f Φ min 2 D f 1 τ 2 ε λ 2 λ 1 + λ 1 + τ 2 1 τ 2 1 1 ε λ 1 + ε λ 2
The ETC model of the porous materials is established based on the series-parallel model and fractal model, as shown in Equation (21). The effect of tortuosity on the ETC is considered in this work. In addition, other important parameters describing the structure of the porous materials, for instance, porosity, tortuosity, area fractal dimension, tortuous fractal dimension and pore size distribution, are also considered in the model.

3. Model Validation

The experimental data for the porous materials used to verify the accuracy of the ETC model were taken from published work in the previous literature [28]. The maximum and minimum pore diameters and average pore diameters of the autoclaved aerated concrete blocks were obtained by image acquisition and image processing, and the ETC of the autoclaved aerated concrete blocks was measured experimentally. Jing’s experimental data used in the calculation are listed in Table S1. Since Jing [28] did not measure the area fractal dimension of the autoclaved aerated concrete blocks in his experiments, the fractal model of the porous materials was based on the method proposed by Yu [29]. The relationship between area fractal dimension Df and porosity ε is indicated in Equation (22).
D f = 2 ln ε ln ( Φ m i n / Φ m a x )
In Figure 4, the thermal conductivity of the autoclaved aerated concrete blocks is predicted well by the ETC model presented in this work, when the porosity is between 0.70 and 0.84. After the calculation, the error between the ETC calculated by the model and the experimental result is less than 8%.
The ETC model was further compared with Wang’s model [12] and Kou’s model [30] (See Table 2), as shown in Figure 4. The deviation of both the ETC model and Wang’s model is less than 8% compared with the experimental data in the porosity range 0.82 to 0.84. However, when the porosity is 0.70–0.78, the deviation of Wang’s model becomes larger, indicating that the ETC model is well-adapted to porous materials with different porosity.
Due to the large porosity of autoclaved aerated concrete blocks tested by Jing [28], the data of Wang [12], Shen [29] and Hu [31], which can be found in Table S2, were used to verify the accuracy of the proposed model at low porosity. As shown in Figure 5 when the porosity of the porous materials is 0.1–0.4, the ETC model can accurately predict the ETC of the porous materials tested by Wang [12] and Shen [29]. However, there is a relatively large deviation between our model prediction and Hu’s data. It should be pointed out that only tortuosity can be derived from Hu’s data for the absence of fractal parameters in his experiment. Therefore, the predicted effective thermal conductivity based on Hu’s data is defined by Equation (6), which does not include the modification of fractal parameters. The fractal parameter effects are contained in the prediction of Wang’s and Shen’s data; hence, the deviation between the prediction and experimental data is quite small. This also validates the effectiveness of the proposed fractal model in prediction of the ETC of porous materials.
It can be concluded from the above comparison results that the ETC model presented in this work can predict the ETC of porous materials well when they are dry.

4. Analysis and Discussion

4.1. The Correlation of the Microstructure Parameters

The distribution of pores in the porous materials can be expressed in some microstructure parameters, such as area fractal dimension, pore tortuosity, pore tortuosity fractal dimension and pore diameter. In this section, the results obtained reveal the influence of the microstructure parameters of porous materials on their thermal conductivity.

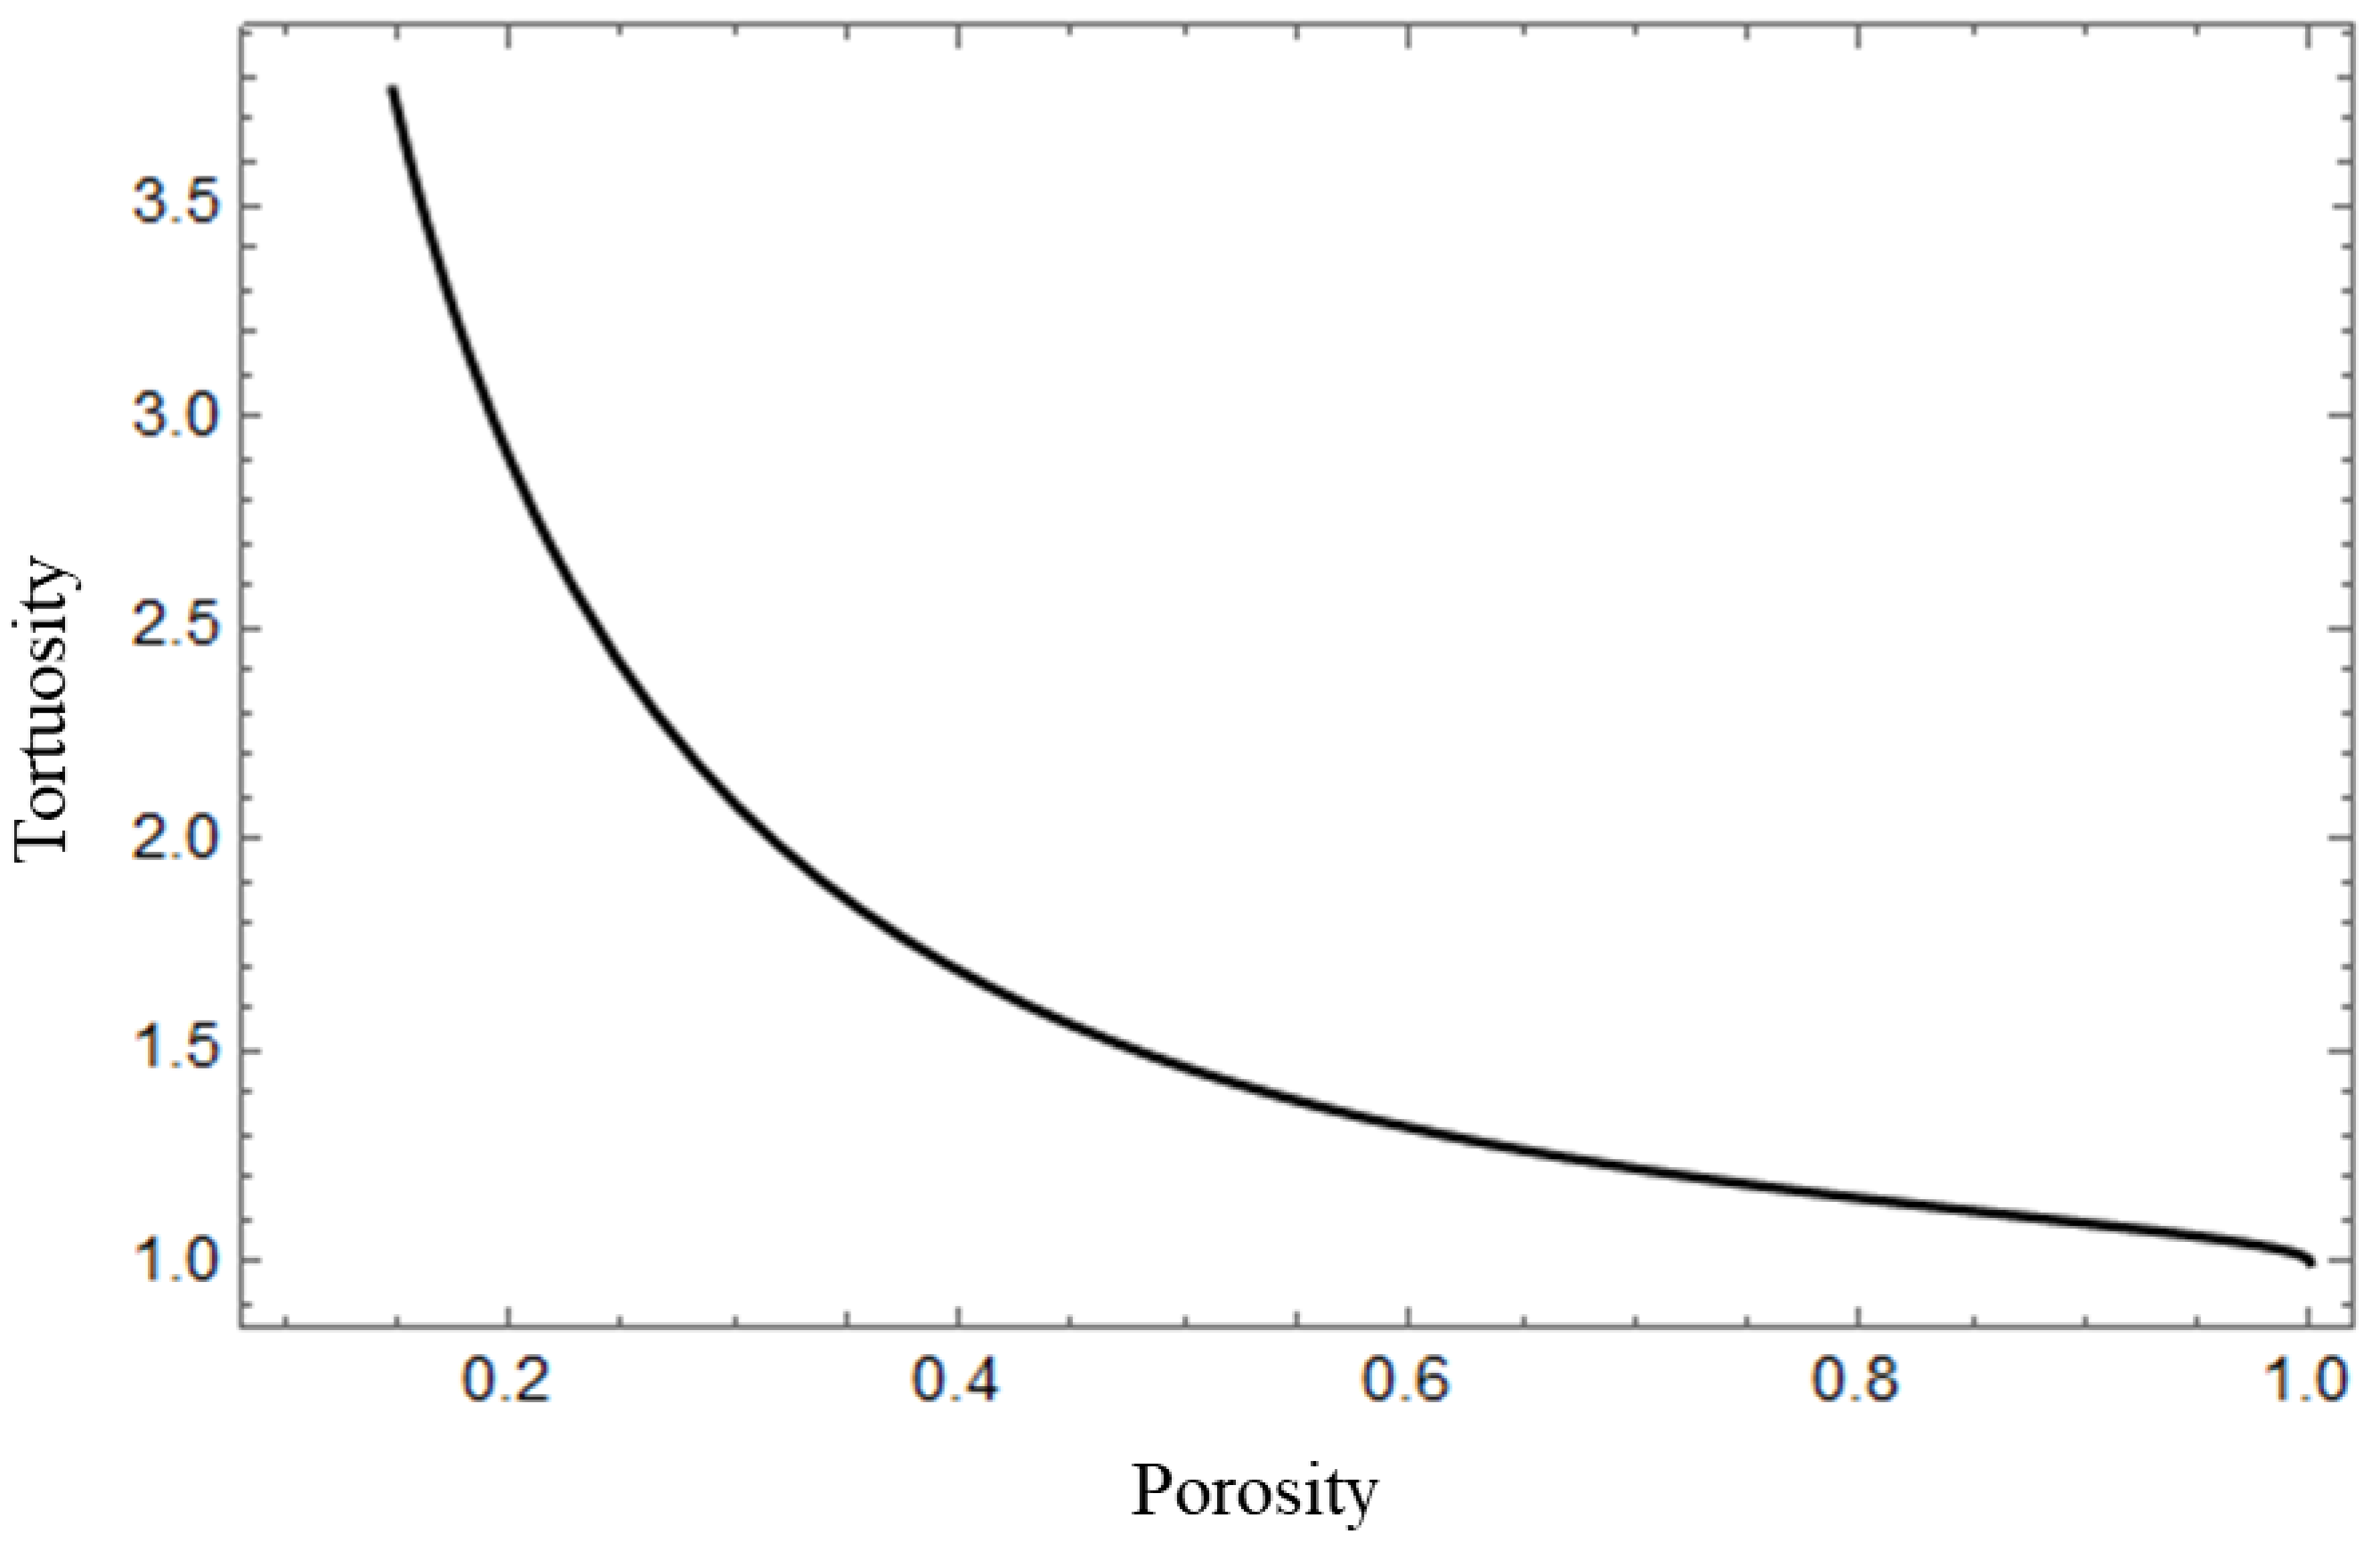
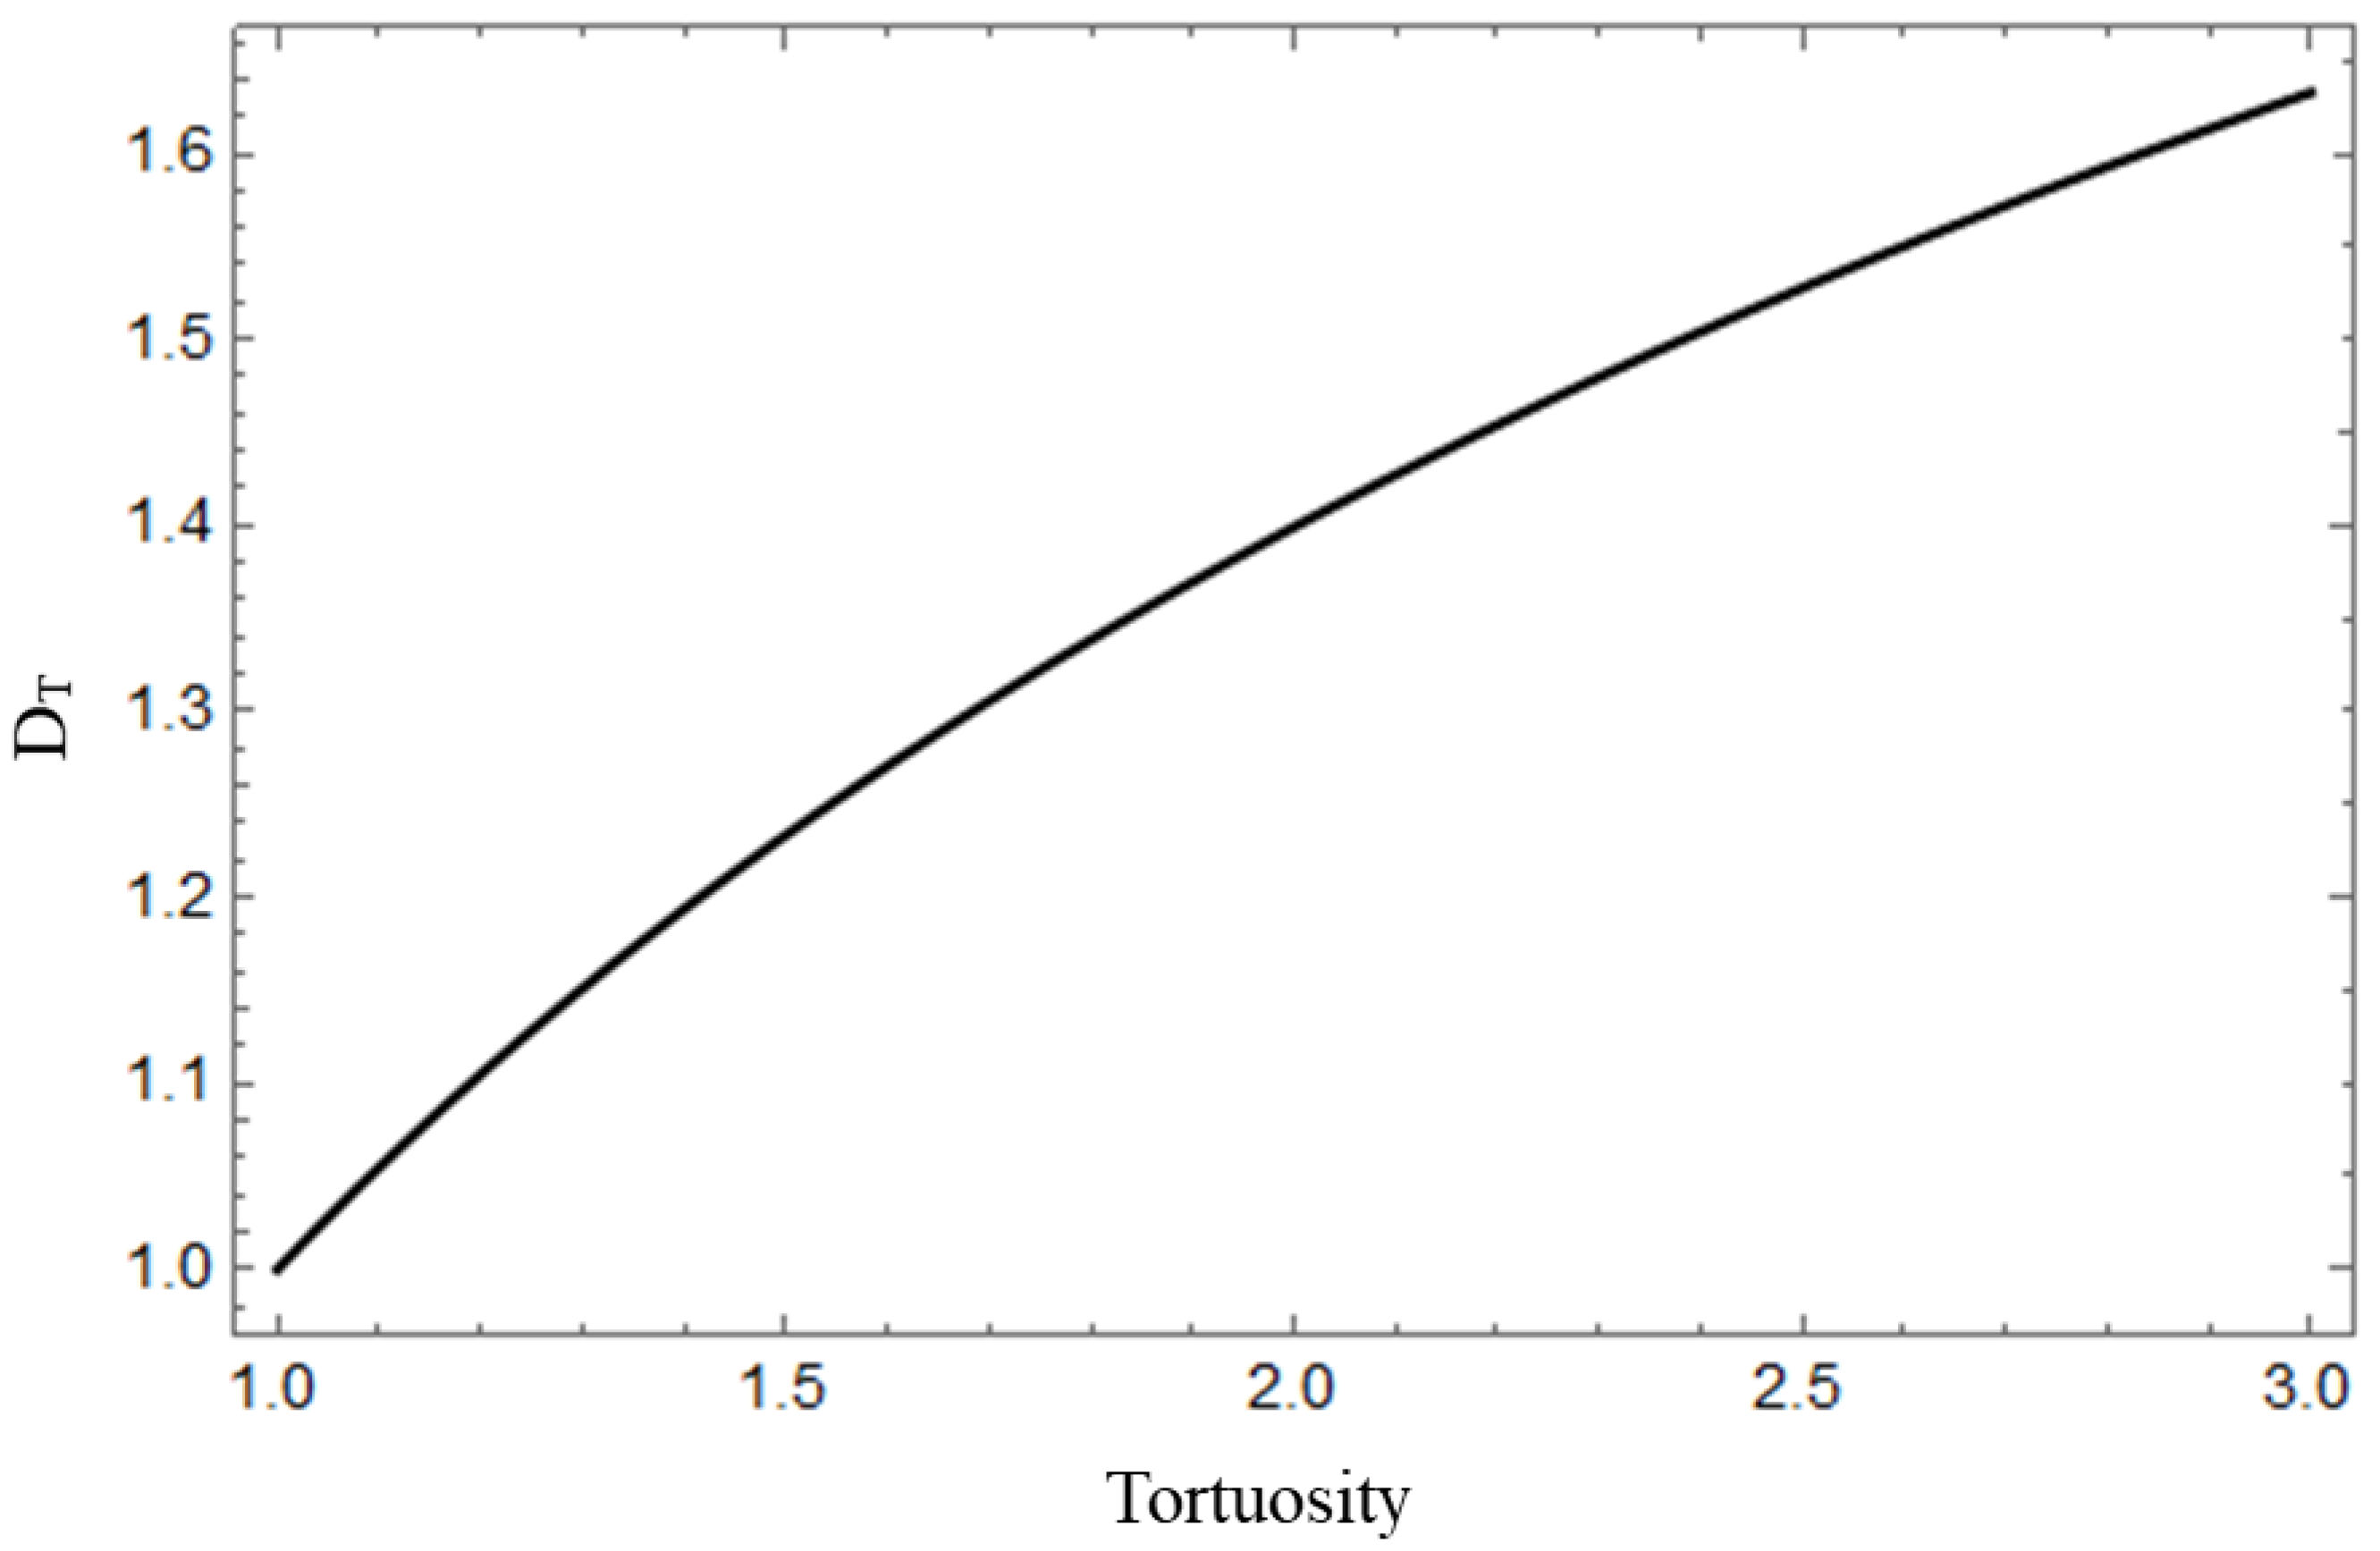
4.1.1. Tortuosity and Tortuous Fractal Dimension

The tortuosity and tortuous fractal dimension characterize the curvature of the pore channels. The ratio of the length of the channel to the size of the corresponding material indicates the tortuosity. The average tortuosity of the pore channels in the cross-section of a porous material can be determined according to the following fitting relationship with the area porosity [32]:
τ = 1 2 1 + 1 2 1 ε + 1 1 ε 2 + 1 ε 4 1 1 ε
Equation (23) explains the porosity of the porous materials as a function of the tortuosity. As shown in Figure 6, the tortuosity of the porous materials decreases rapidly with the increase in the porosity, but the decreasing tendency becomes slower. The definition of tortuosity is the actual length of the fluid path divided by the characteristic length in the direction of the macroscopic driving potential gradient. Therefore, when the porosity is 1, meaning that the pores occupy all the space, i.e., Lt =L0, then the tortuosity approaches the minimum value of 1.
The irregularity of the pore channels is mainly represented by the tortuous fractal dimension of the porous materials. The tortuous fractal dimension of the porous materials tends to become larger, and the pore channels tend to be more complex and irregular. The tortuous fractal dimension is affected by both the material tortuosity and pore diameter distribution, according to Equation (11). Figure 7 depicts the variation of the tortuous fractal dimension with tortuosity. The tortuous fractal dimension rises when the tortuosity increases. With the increase in tortuosity, the pore channels tend to be more complex and irregular, which leads to the increase in the tortuous fractal dimension.
According to Equation (11), the influence of pore diameter distribution on tortuous fractal dimension at different Φmin/Φmax can be calculated. As shown in Figure 8, we assume that the x axis at the bottom of Figure 8 maintains the maximum pore diameter of 1000 μm, and the x axis at the top of Figure 8 maintains the minimum pore diameter of 0.001 μm. Figure 8 shows the tortuous fractal dimension decreases with the decrease in Φmin/Φmax when the maximum pore diameter is 1000 μm. This due to the complexity of the tortuosity decrease with the increase in pore diameter distribution range. The increase in maximum pore diameter has little effect on the fractal dimension of tortuosity while the minimum pore diameter is constant.

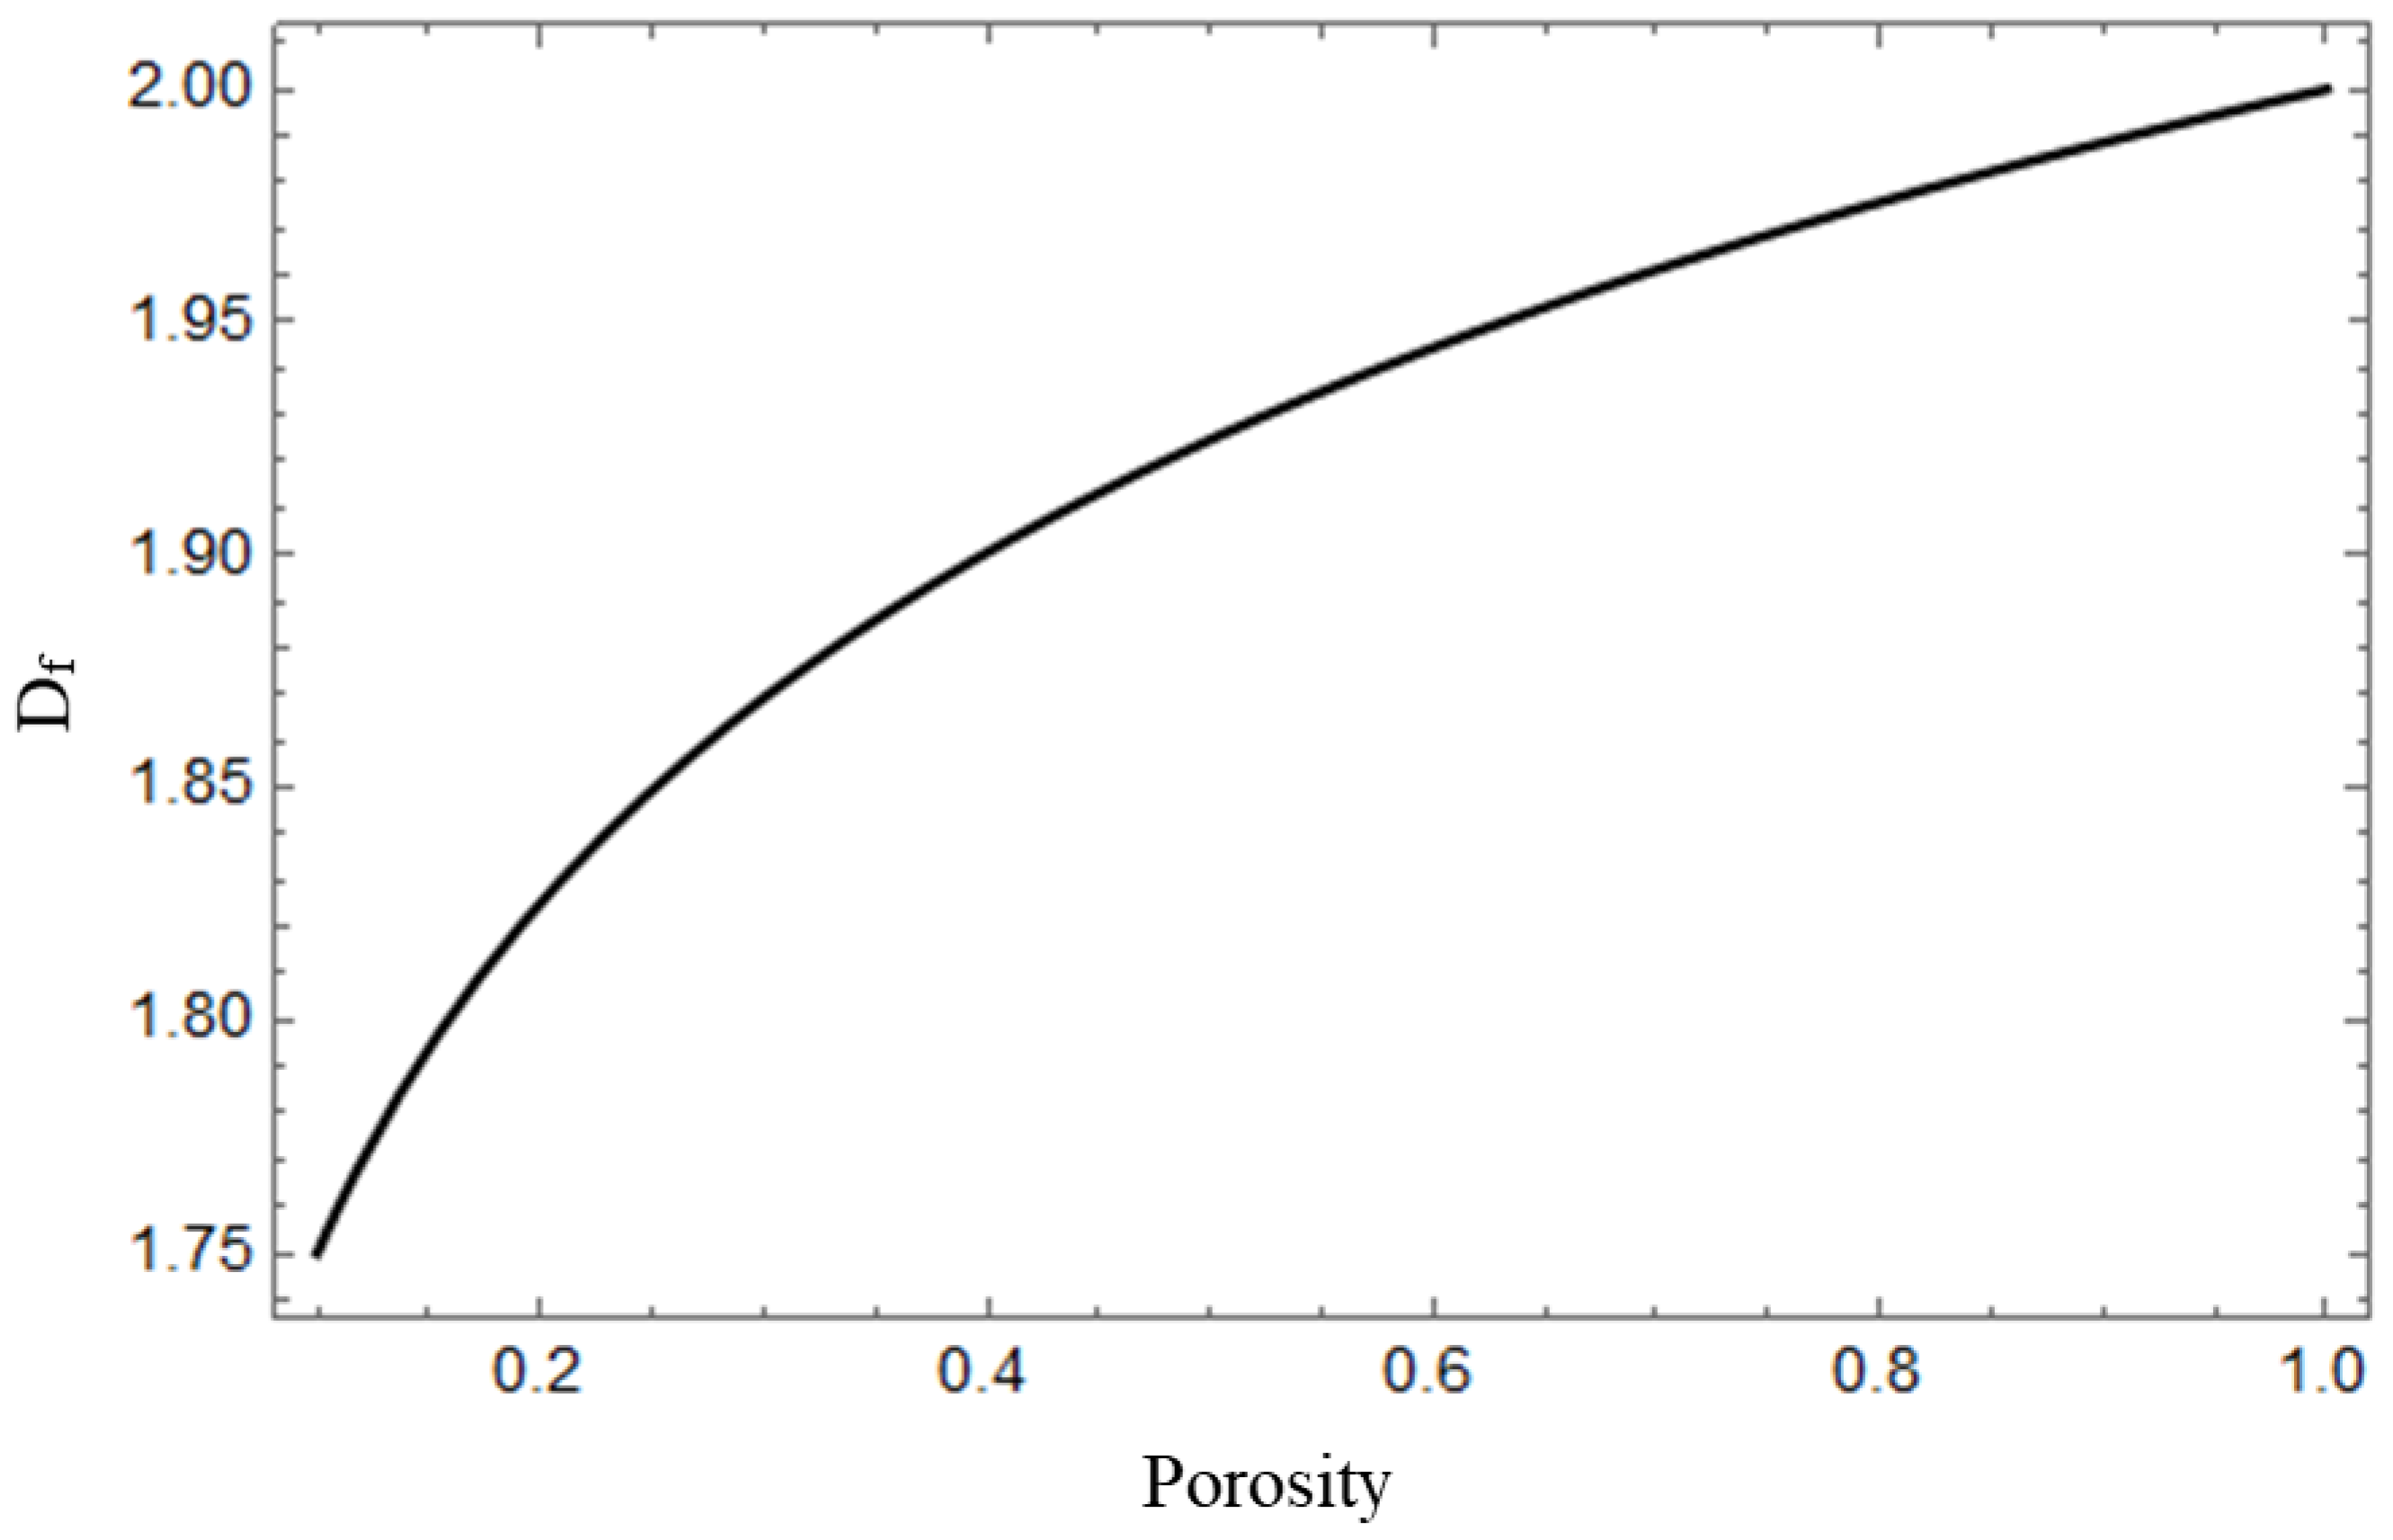
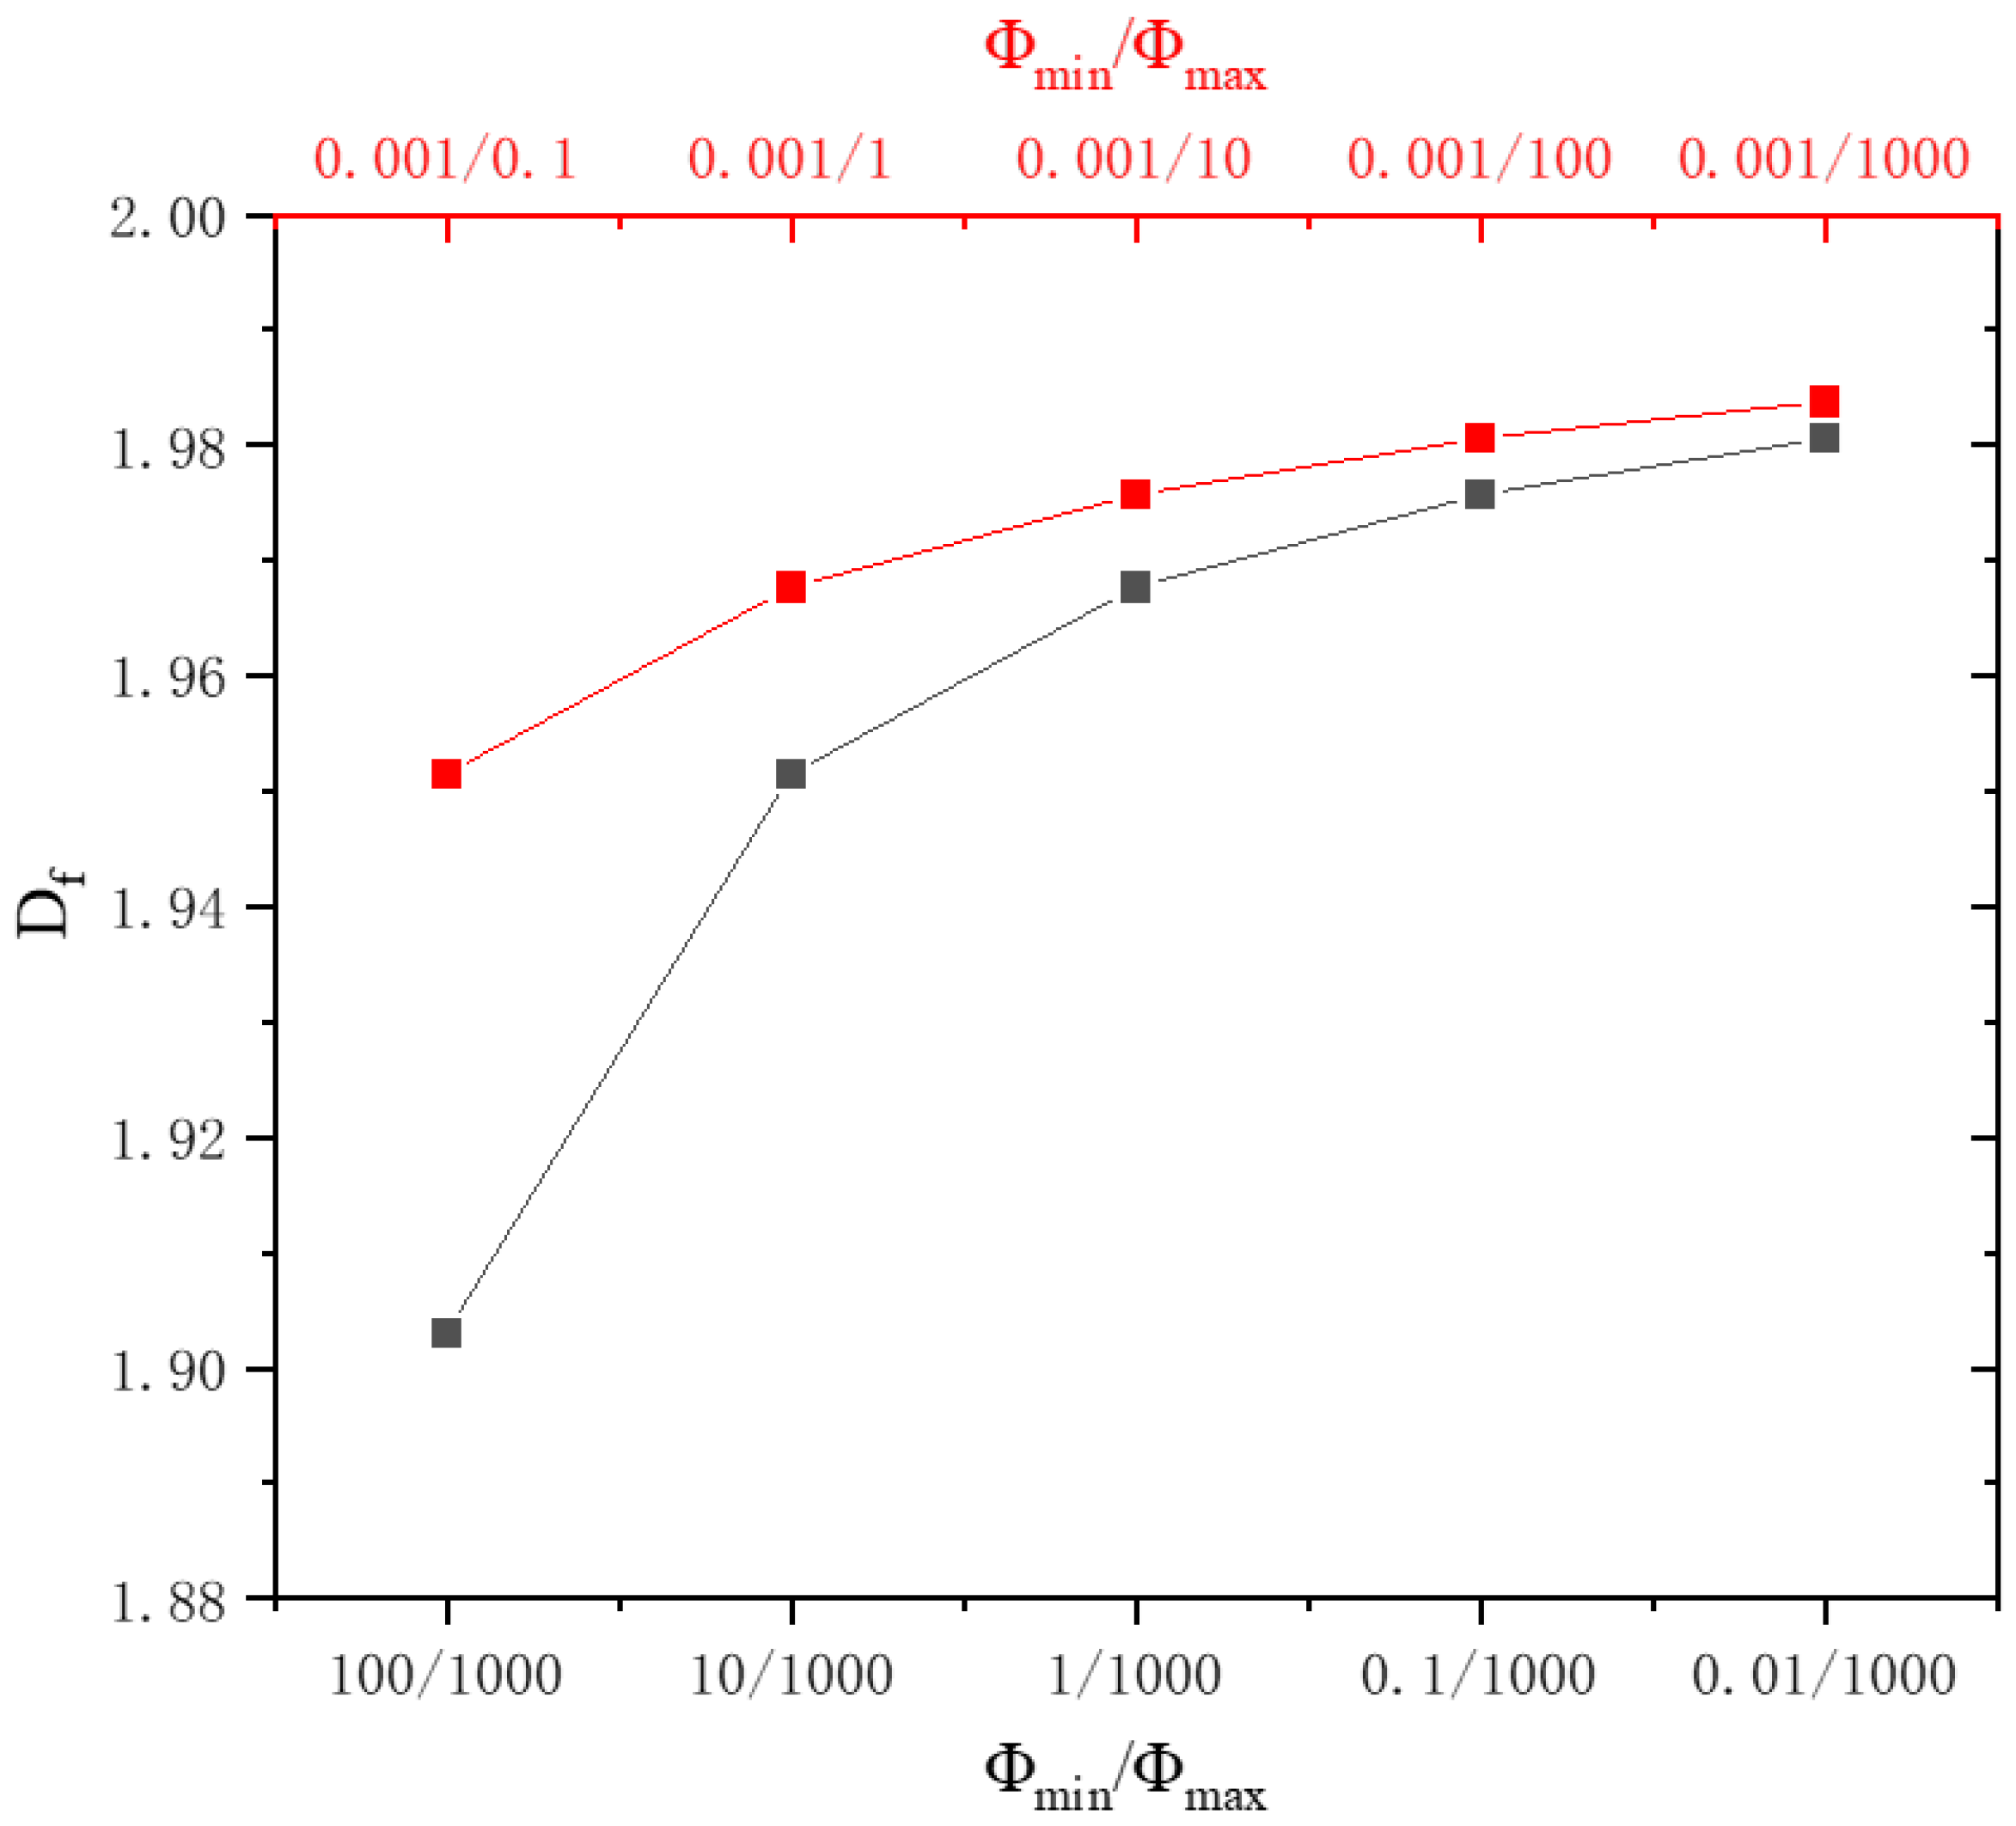
4.1.2. Area Fractal Dimension

An essential parameter to characterize the spatial irregularity of the porous materials is the area fractal dimension of the pore surface, which is defined as the effective space occupied by the complex cross-section shape of the porous materials [12]. It can be obtained from Equation (22) that both the porosity and pore diameter distribution have a significant influence on the area fractal dimension.
Figure 9 shows that the area fractal dimension of the porous materials increases with the increase in porosity, while the changing rate becomes smaller in higher porosity zone. The fractal model is established based on the Sierpinski carpet method; therefore, the area occupied by the pores in the two-dimensional space increases with the increase in porosity. When the porosity equals 1, i.e., the two-dimensional space is completely occupied by pores, the area fractal dimension Df is 2.
When the maximum pore diameter of the porous materials is 1000 μm and the minimum pore diameter is 0.001 μm, the area fractal dimension varies with the pore diameter distribution as shown in Figure 10, indicating that the area fractal dimension increases with the decrease in Φmin/Φmax. The pore structure of porous materials is more complicated when the pore size distribution is larger, and the area fractal dimension characterizes the spatial irregularity of the pore distribution of porous materials. Therefore, the area fractal dimension increases with the increase in the pore diameter distribution. On the other hand, the area fractal dimension under the condition of constant minimum pore diameter and variable maximum pore diameter is larger than the constant maximum pore diameter constant and variable minimum pore diameter condition, which might be attributed to the average diameter being smaller in the constant minimum pore diameter condition. In other words, for the same porosity, smaller pore diameter gives larger area fractal dimension.

4.2. Influence of Microstructure Parameters on the ETC

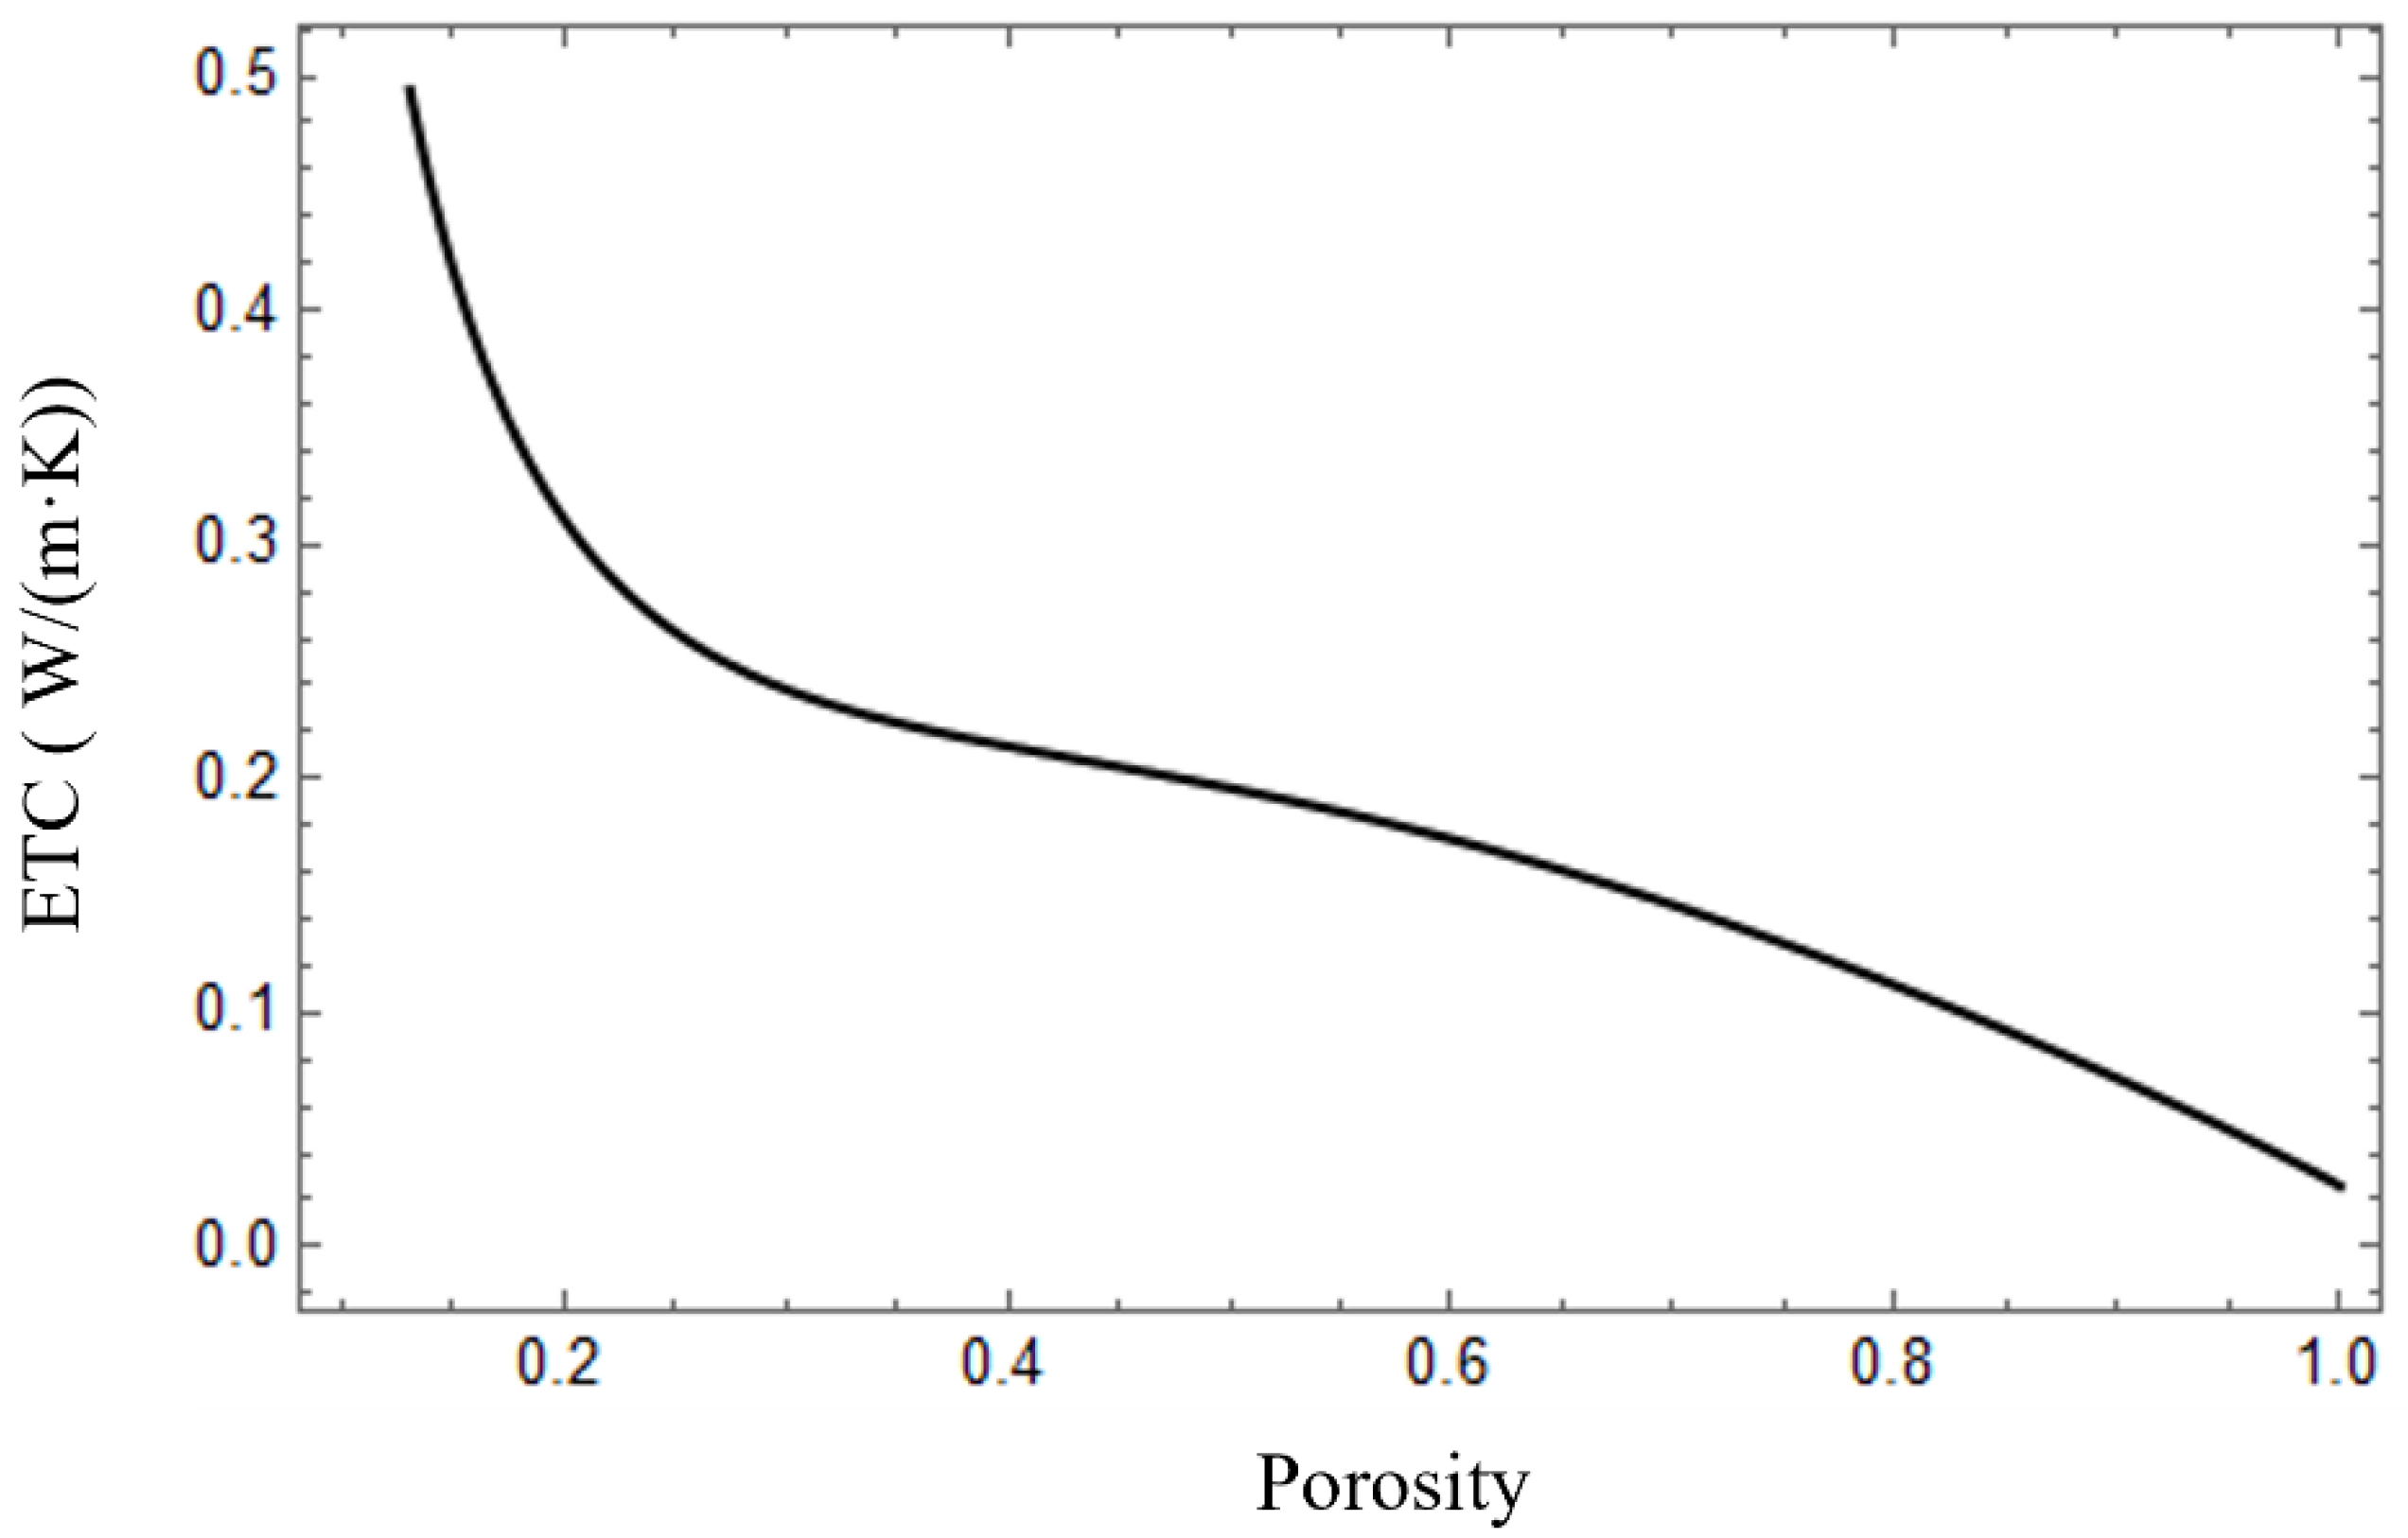
4.2.1. Influence of Porosity on the ETC

For dry porous materials, the pore contains only air. The thermal conductivity of the solid skeletons is generally 1–2 orders of magnitude higher than that of air. Therefore, the porosity has a major effect on the ETC of porous materials.
According to the data from Jing’s [28] paper, the impact of porosity on the ETC of autoclaved aerated concrete was studied. The variation of the ETC of the porous materials can be found in Figure 11, indicating that the ETC decreases with porosity. This is because the proportion of solids in the porous materials decreases, the proportion of air increases with the porosity increases and the thermal conductivity of air is much smaller than that of the solid.

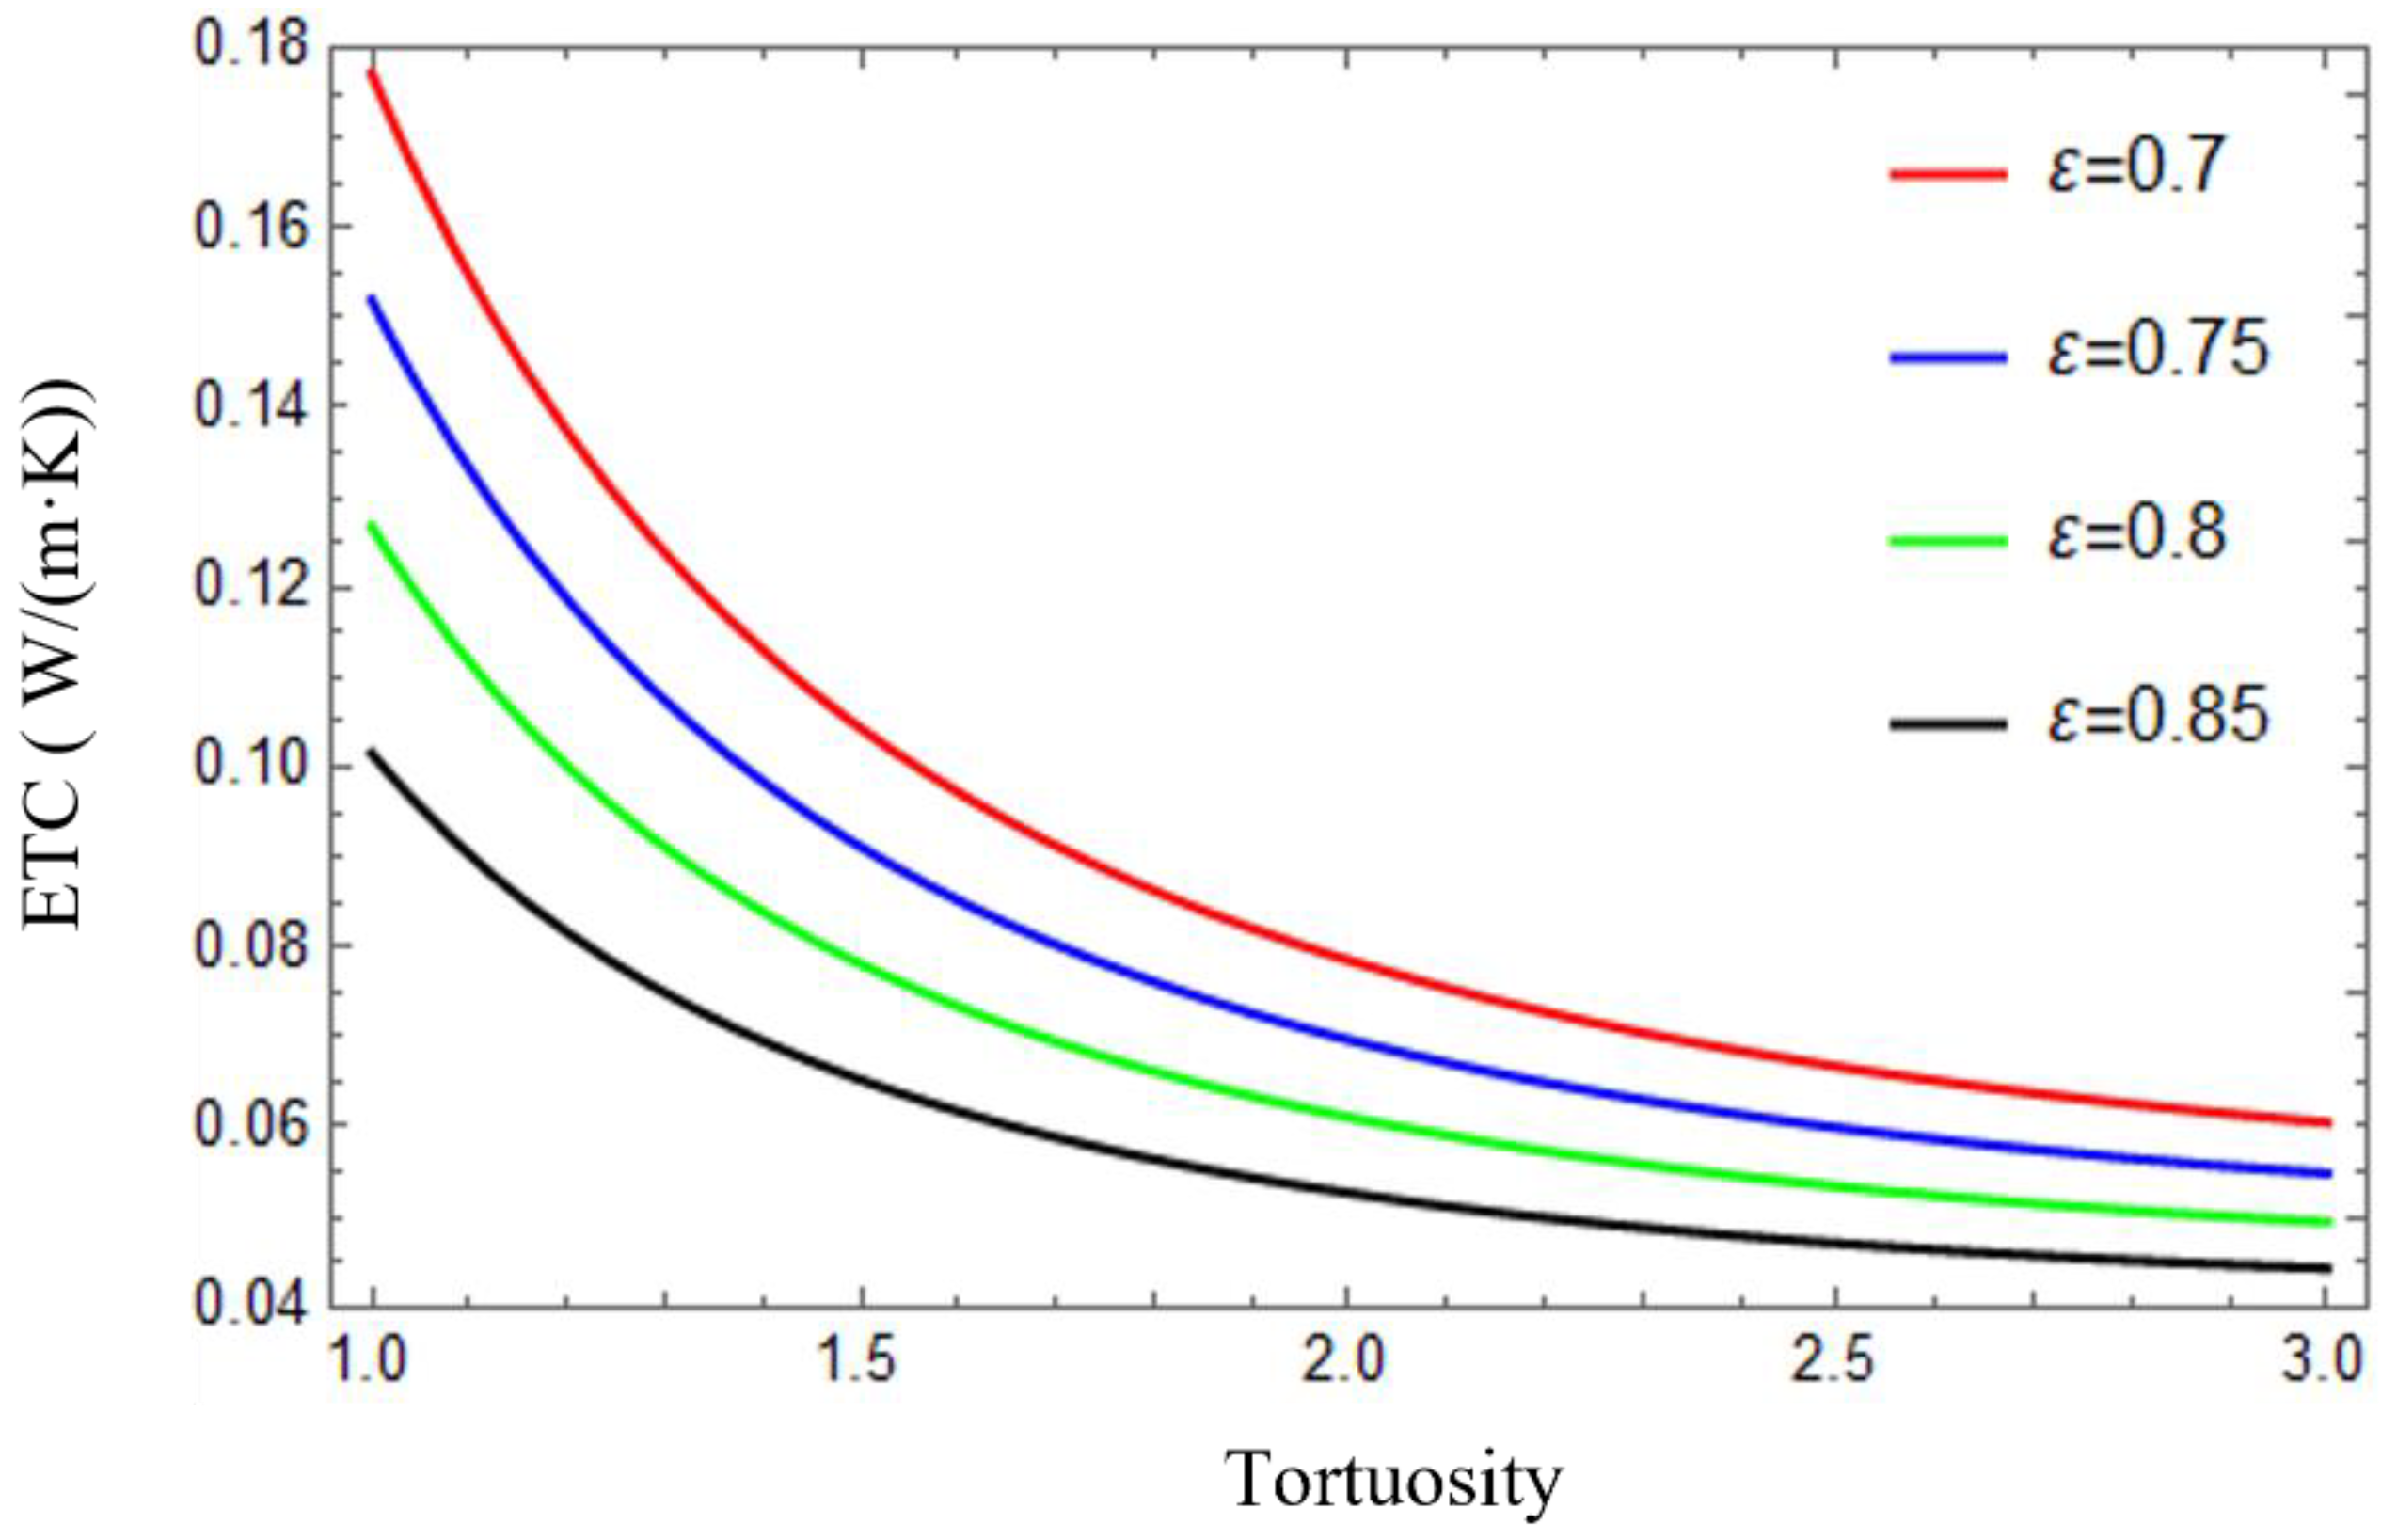
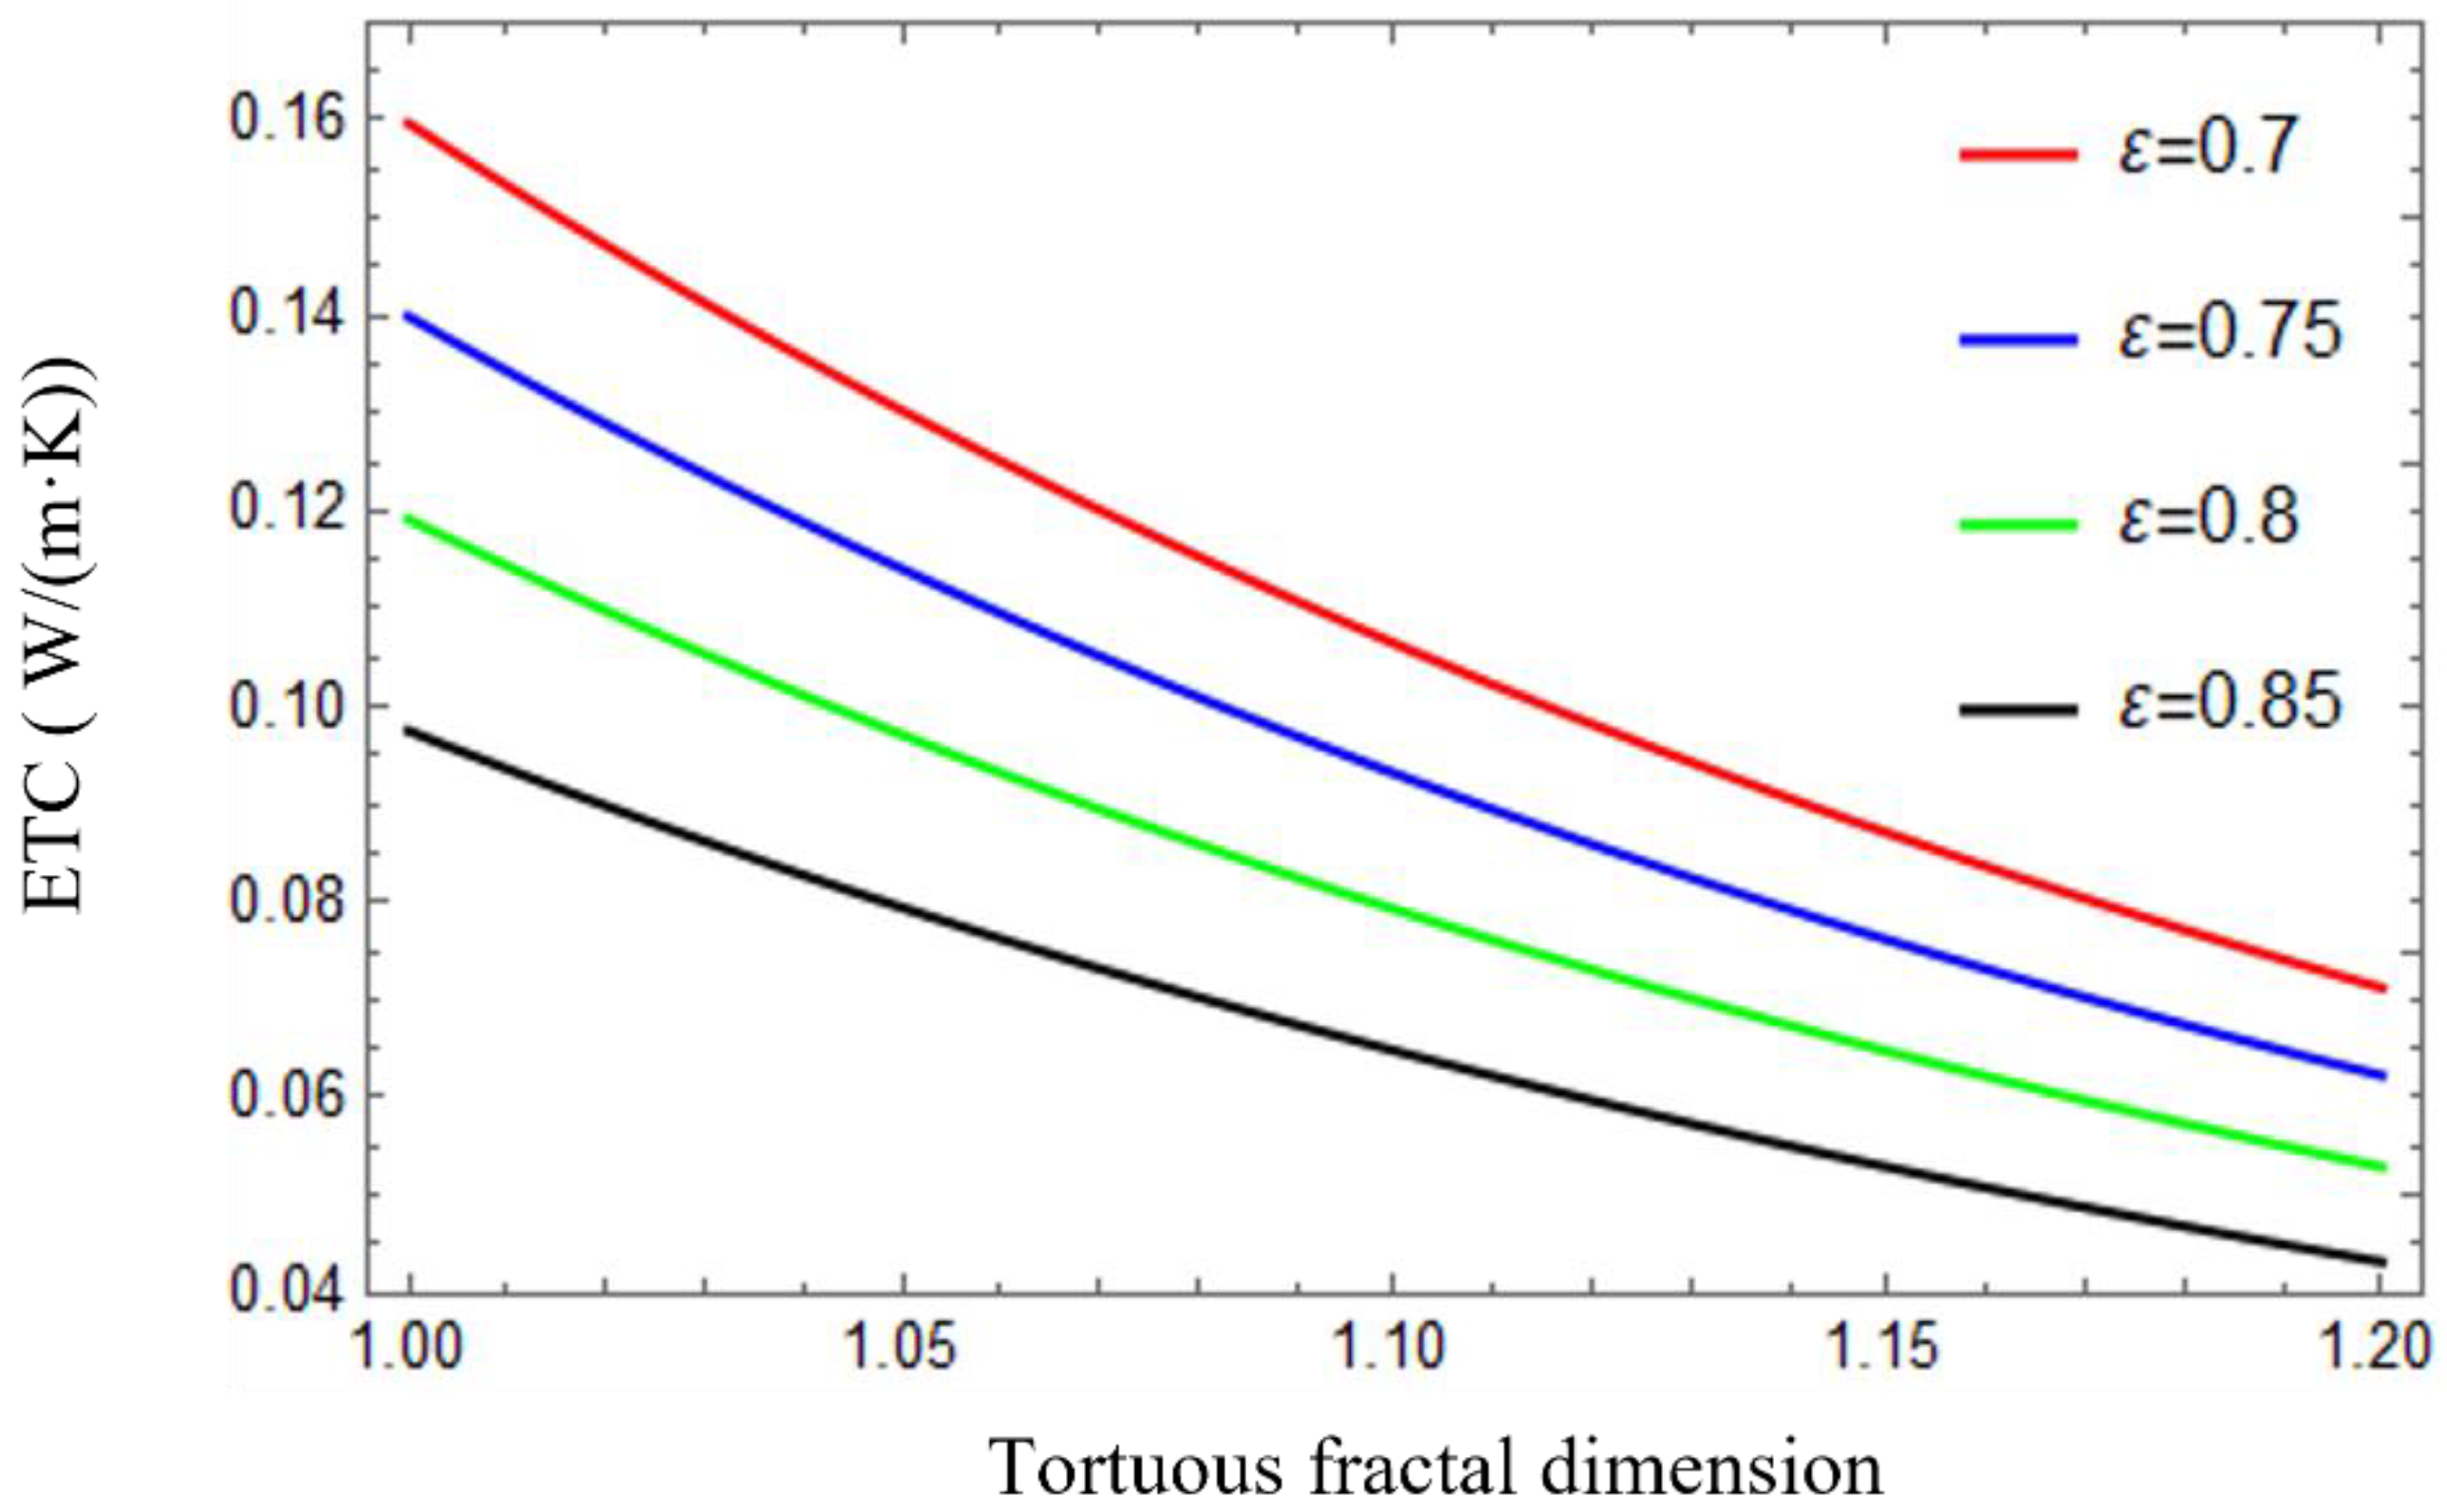
4.2.2. Influence of Tortuosity and Tortuous Fractal Dimension on the ETC

The internal bending degree of the porous materials can be expressed by the tortuosity, which affects not only the solid–gas distribution in the porous materials but also the series-parallel ratio of the solid skeleton and the pores in the model. The material cross-section tortuosity usually ranges from 1 to 3.
The ETC of the porous materials is affected by the tortuosity as shown in Figure 12. It can be seen from this figure that the ETC decreases with the increase in tortuosity. For example, when the porosity is 0.7, the ETC of the porous materials decreases by approximately 66% as tortuosity increases from 1 to 3. This can be attributed to the ratio of the series part increasing with the increase in tortuosity. The series model represents the lowest limit of the ETC, and the ETC decreases with the increase in the proportion of the series part. Meanwhile, the ETC reduction rate decreases slowly with the increase in porosity, which is consistent with the actual situation. When the porosity is 0.85 and the tortuosity increases from 1 to 3, the ETC decreases by about 55%. This indicates that the effect of the tortuosity on the ETC increases as the porosity decreases. This phenomenon can also be explained by the series-parallel model. Under the same porosity condition, the parallel model represents the maximum thermal conductivity of the porous materials, while the series model is the minimum. When the tortuosity is 1, the weight coefficient of the parallel model is 1, and the weight coefficient of the series model is 0. When the tortuosity increases, the weight coefficient of the parallel model decreases, and the weight coefficient of the series model increases; therefore, the ETC of the porous materials decreases.
The analysis of the tortuous fractal dimension of porous materials shows that the tortuous fractal dimension is mainly distributed in the limit 1.0 to 1.2. Figure 13 shows that the ETC of the porous materials decreases as the tortuous fractal dimension increases; for instance, when the material porosity is 0.8, the increase in the tortuous fractal dimension from 1 to 1.2 reduces the ETC by about 54%. This is due to the fact that with the increase in the tortuous fractal dimension, the tortuous structure of pore channel becomes more complex, which makes the series-parallel distribution of solid and gas more complex and increases the internal thermal resistance of the porous materials.

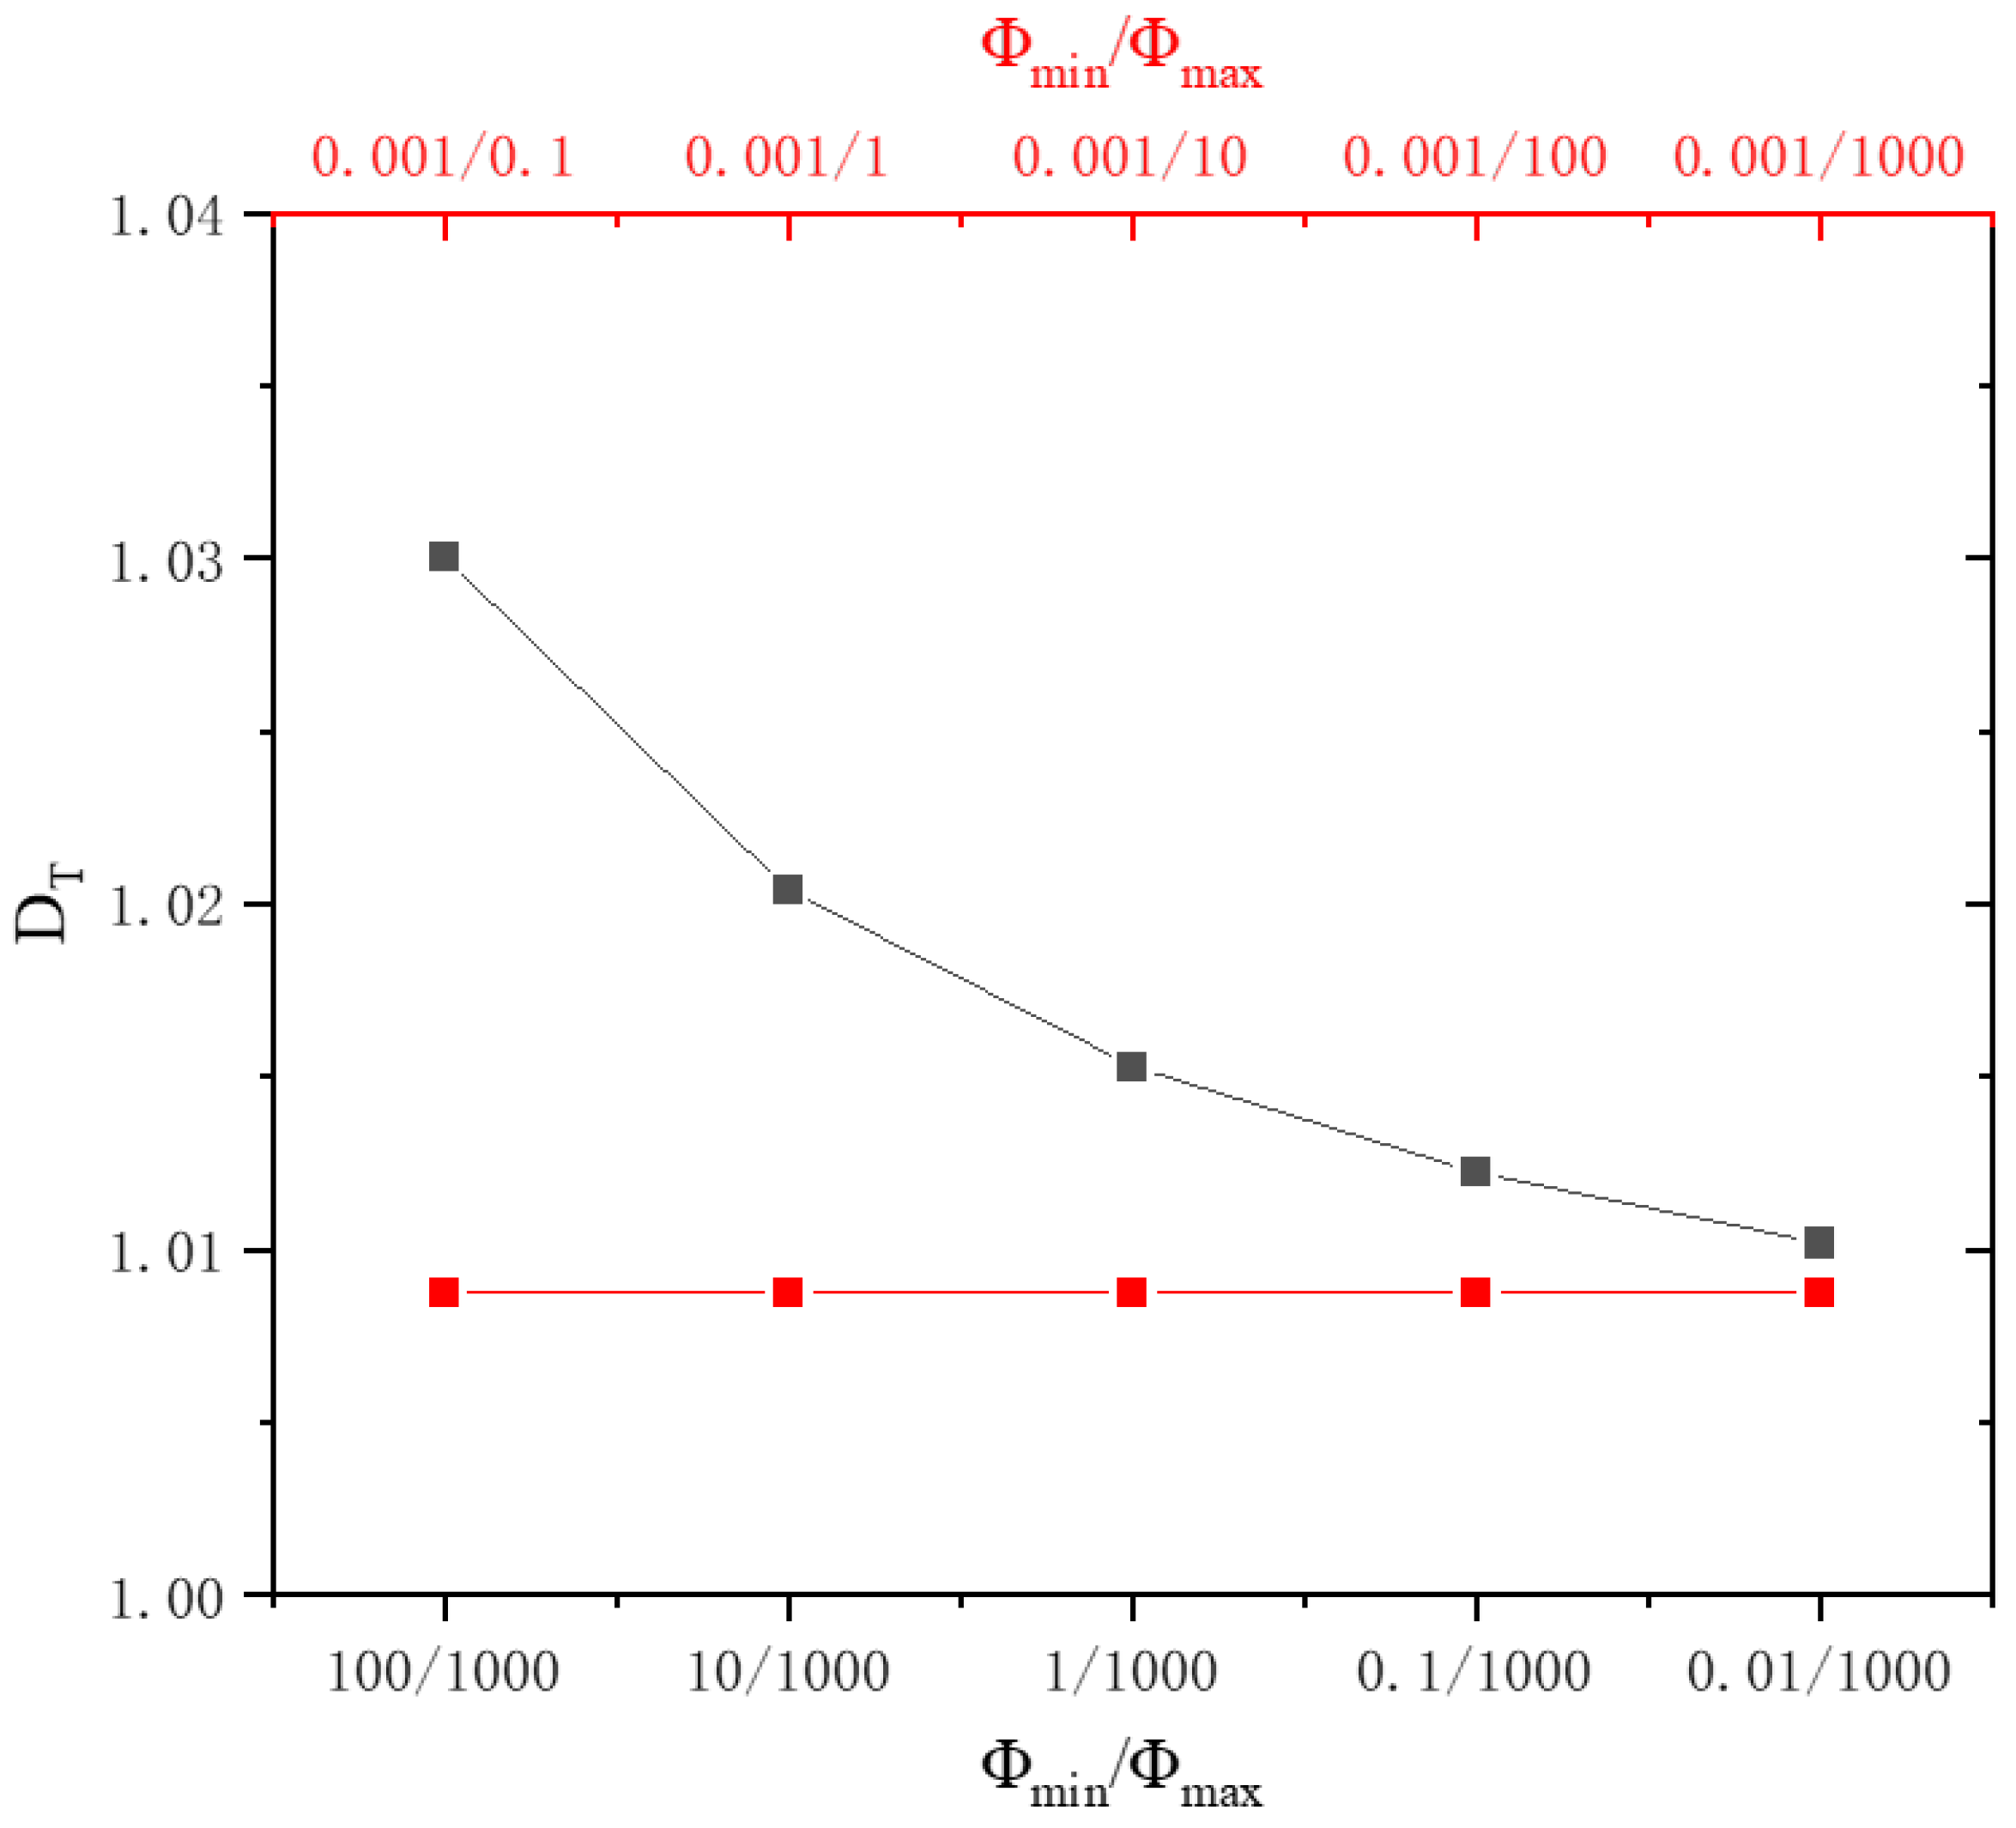
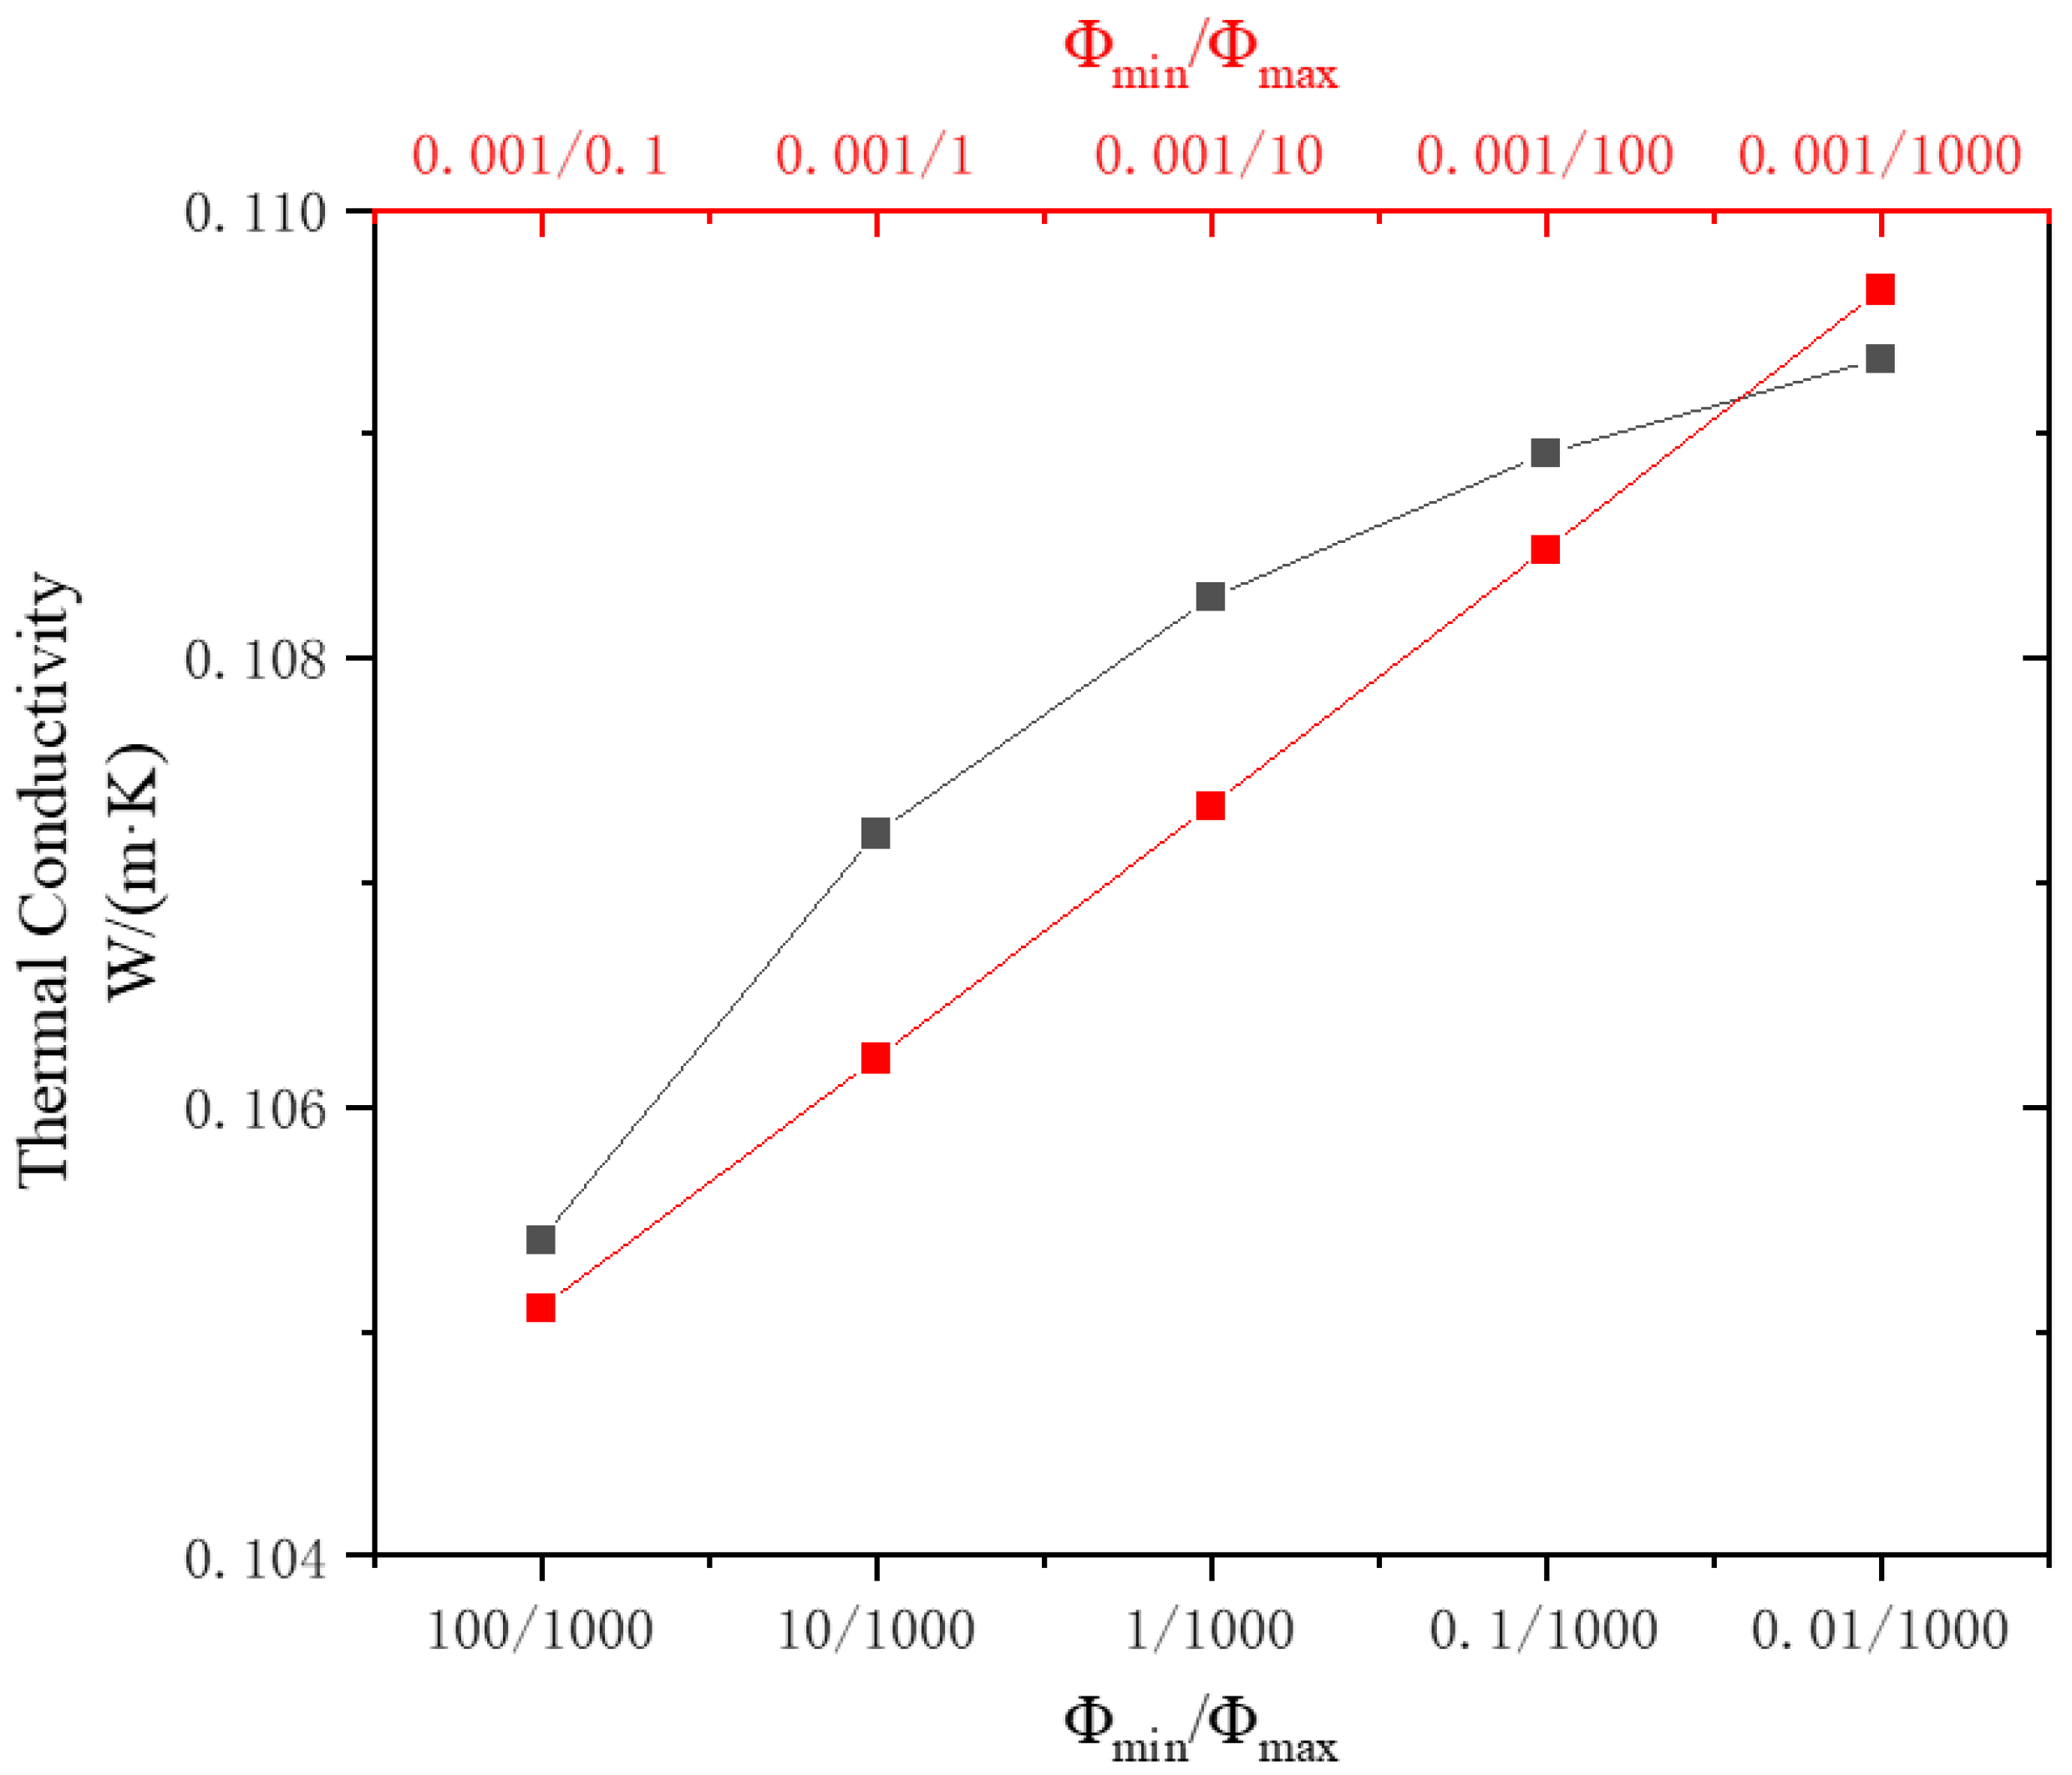
4.2.3. Influence of Pore Diameter Distribution on the ETC

Pore diameter distribution affects the ETC mainly by affecting the area fractal dimension and the tortuous fractal dimension. However, the ETC is barely affected by the area fractal dimension. Therefore, the ETC is mainly influenced by the tortuous fractal dimension under different pore diameter distributions. Figure 14 shows the influence of pore diameter distribution on the ETC when the maximum pore diameter remains 1000 μm and the minimum pore diameter is 0.001 μm. It can be seen that the ETC increases with Φmin/Φmax decreases. This phenomenon can be explained by the results in Figure 8. When Φmin/Φmax decreases, the tortuous fractal dimension decreases as well. On the other hand, the decrease in the tortuous fractal dimension results in the increase in ETC of the porous materials, as shown in Figure 13. Therefore, the decrease in Φmin/Φmax also leads to the increase in the ETC of the porous materials.

5. Conclusions

This study established a predictive model for the ETC of porous materials. A two-dimensional expression for thermal conductivity was obtained by relating the conventional series-parallel model to the tortuosity of the porous materials. Then, the ETC of the porous materials was obtained by introducing the fractal model, which was validated by literature data. To study the influence of the microstructure of the porous materials on the ETC, the effects of the microstructure parameters, i.e., porosity, area fractal dimension, tortuosity, tortuous fractal dimension and pore size distribution, on the ETC were analyzed. The results obtained reveal the influence of the structural parameters of porous materials on their ETC.
It should be pointed out that the proposed model assumes that the porous materials are dry or saturated and does not take into account the effect of moisture content on the ETC of the porous materials. This model can be further improved by including the effect of moisture content in our future study.

Supplementary Materials

The following supporting information can be downloaded at: https://www.mdpi.com/article/10.3390/en16010271/s1, Table S1: The experimental data and corresponding derived parameters from Jing [28]; Table S2: The experimental data and corresponding derived parameters from Wang [12], Shen [29] and Hu [31].

Author Contributions

C.Z.: Conceptualization, methodology, formula derivation and numerical investigation, data reduction, paper writing and revision—original draft, review and editing, visualization. W.C.: Conceptualization, resources, review and editing, supervision, project administration, funding acquisition. L.L.: Conceptualization, resources, review and editing, supervision, project administration, funding acquisition. All authors have read and agreed to the published version of the manuscript.

Funding

This research received no external funding.

Data Availability Statement

Not applicable.

Conflicts of Interest

The authors declare no conflict of interest.

Nomenclature

Attotal cross-sectional area of the porous materials from minimum to maximum pores
Dfarea fractal dimension
DTtortuous fractal dimension
Ltthe actual length of the fluid path
L0the characteristic length in the direction of the macroscopic driving potential gradient i.e., the length along the heat flow
Ntotal number of pores with a diameter greater than Φ
Wthe weight coefficient of the component of the porous materials thermal conductivity model
εporosity of the porous materials
λ1thermal conductivity of the solid matrix
λ2thermal conductivity of the liquid/gas in pores
λsseries thermal conductivity
λpparallel thermal conductivity
λeseries-parallel thermal conductivity
λe,meffective thermal conductivity
τtortuosity
Φminthe minimum pore diameter of the porous materials
Φmaxthe maximum pore diameter of the porous materials
Φpore diameter of the porous materials
Tthe temperature difference between both sides of the cross-section of a representative unit

References

  1. Clauser, C. Heat Transport Processes in the Earth’s Crust. Surv. Geophys. 2009, 30, 163–191. [Google Scholar] [CrossRef]
  2. Maxwell, J.C.A. A Treatise on Electricity and Magnetism. Nature 1954, 7, 478–480. [Google Scholar]
  3. Bruggeman, D.A.G. Berechnung verschiedener physikalischer Konstanten von heterogenen Substanzen. I. Dielektrizitätskonstanten und Leitfähigkeiten der Mischkörper aus isotropen Substanzen. Ann. Der Phys. 1935, 416, 636–664. [Google Scholar] [CrossRef]
  4. Landauer, R. The Electrical Resistance of Binary Metallic Mixtures. J. Appl. Phys. 1952, 23, 779–784. [Google Scholar] [CrossRef]
  5. Kong, F.; Zhang, Q. Effect of heat and mass coupled transfer combined with freezing process on building exterior envelope. Energy Build. 2013, 62, 486–495. [Google Scholar] [CrossRef]
  6. Qian, L.; Pang, X.; Zhou, J.; Yang, J.; Lin, S.; Hui, D. Theoretical model and finite element simulation on the effective thermal conductivity of particulate composite materials. Compos. Part B Eng. 2016, 116, 291–297. [Google Scholar] [CrossRef]
  7. Ma, Y.; Yu, B.; Zhang, D.; Zou, M. A self-similarity model for effective thermal conductivity of porous media. J. Phys. D Appl. Phys. 2003, 36, 2157. [Google Scholar] [CrossRef]
  8. Ma, Y.T.; Zhang, D.M.; Zou, M.Q. Fractal geometry model for effective thermal conductivity of three-phase porous media. J. Appl. Phys. 2004, 95, 6426–6434. [Google Scholar] [CrossRef] [Green Version]
  9. Dongliang, L.I.; Jianwei, D.U.; Song, H.E.; Liang, D.Q.; Zhao, X.Y.; Yang, X.Y. Measurement and modeling of the effective thermal conductivity for porous methane hydrate samples. Sci. China Chem. 2012, 55, 373–379. [Google Scholar]
  10. Jin, H.-Q.; Yao, X.-L.; Fan, L.-W.; Xu, X.; Yu, Z.-T. Experimental determination and fractal modeling of the effective thermal conductivity of autoclaved aerated concrete: Effects of moisture content. Int. J. Heat Mass Transf. 2016, 92, 589–602. [Google Scholar] [CrossRef]
  11. Shen, Y.; Xu, P.; Qiu, S.; Rao, B.; Yu, B. A generalized thermal conductivity model for unsaturated porous media with fractal geometry. Int. J. Heat Mass Transf. 2020, 152, 119540. [Google Scholar] [CrossRef]
  12. Wang, Y.; Ma, C.; Liu, Y.; Dengjia, J. A model for the effective thermal conductivity of moist porous building materials based on fractal theory. Int. J. Heat Mass Transf. 2018, 125, 387–399. [Google Scholar] [CrossRef]
  13. Yu, B.; Ping, C. A fractal permeability model for bi-dispersed porous media. Int. J. Heat Mass Transf. 2002, 45, 2983–2993. [Google Scholar] [CrossRef]
  14. Miao, T.; Cheng, S.; Chen, A.; Yu, B. Analysis of axial thermal conductivity of dual-porosity fractal porous media with random fractures. Int. J. Heat Mass Transf. 2016, 102, 884–890. [Google Scholar] [CrossRef]
  15. Mandelbrot, B.B.; Wheeler, J.A. The Fractal Geometry of Nature. Am. J. Phys. 1983, 51, 468. [Google Scholar] [CrossRef]
  16. Pia, G.; Casnedi, L.; Ricciu, R.; Besalduch, L.A.; Cocco, O.; Murru, A.; Meloni, P.; Sanna, U. Thermal properties of porous stones in cultural heritage: Experimental findings and predictions using an intermingled fractal units model. Energy Build. 2016, 118, 232–239. [Google Scholar] [CrossRef]
  17. Mandelbrot, B.B. How Long Is the Coast of Britain? Statistical Self-Similarity and Fractional Dimension. Science 1967, 156, 636–638. [Google Scholar] [CrossRef] [Green Version]
  18. Shi, M.; Fan, H. A fractal modal for evaluating heat conduction in porous media. J. Therm. Sci. Technol. 2002, 1, 28–31. [Google Scholar]
  19. Peng, X.; Yu, B.; Yun, M.; Zou, M. Heat conduction in fractal tree-like branched networks. Int. J. Heat Mass Transf. 2006, 49, 3746–3751. [Google Scholar]
  20. Huang, Z.; Zhai, D.; Gao, X.; Xu, T.; Fang, Y.; Zhang, Z. Theoretical study on effective thermal conductivity of salt/expanded graphite composite material by using fractal method. Appl. Therm. Eng. 2015, 86, 309–317. [Google Scholar] [CrossRef]
  21. You, L.; Cai, J.; Kang, Y.; Luo, L. A Fractal Approach to Spontaneous Imbibition Height in Natural Porous Media. Int. J. Mod. Phys. C Comput. Phys. Phys. Comput. 2013, 24, 1350063. [Google Scholar] [CrossRef]
  22. Shi, Y.; Yassin, M.R.; Dehghanpour, H. A Modified Model for Spontaneous Imbibition of Wetting Phase into Fractal Porous Media. Colloids Surf. A Physicochem. Eng. Asp. 2017, 543, 64–75. [Google Scholar] [CrossRef]
  23. Tan, X.H.; Jiang, L.; Li, X.P.; Li, Y.Y.; Zhang, K. A complex model for the permeability and porosity of porous media. Chem. Eng. Sci. 2017, 172, 230–238. [Google Scholar] [CrossRef]
  24. Hu, Y.; Wang, Q.; Zhao, J.; Xie, S.; Jiang, H. A Novel Porous Media Permeability Model Based on Fractal Theory and Ideal Particle Pore-Space Geometry Assumption. Energies 2020, 13, 510. [Google Scholar] [CrossRef]
  25. Cai, J.; Wei, W.; Hu, X.; Wood, D.A. Electrical conductivity models in saturated porous media: A review. Earth Sci. Rev. 2017, 171, 419–433. [Google Scholar] [CrossRef]
  26. Meng, H.; Shi, Q.; Liu, T.; Liu, F.; Chen, P. The Percolation Properties of Electrical Conductivity and Permeability for Fractal Porous Media. Energies 2019, 12, 1085. [Google Scholar] [CrossRef] [Green Version]
  27. Yu, B.; Li, J. Some Fractal Characters of Porous Media. Fractals 2001, 09, 365–372. [Google Scholar] [CrossRef]
  28. Jing, P. Effect of Pore Features of Autoclaved Aerated Concrete on Thermal Conductivity. Master’s Thesis, North China University of Water Resources and Electric Power, Zhengzhou, China, 2018. [Google Scholar]
  29. Shen, X. Study on Coupled Heat and Moisture Transfer Characteristics in Building Envelope with Freezing and Thawing Process. Ph.D. Thesis, Chongqing University, Chongqing, China, 2018. [Google Scholar]
  30. Kou, J.; Liu, Y.; Wu, F.; Fan, J.; Lu, H.; Xu, Y. Fractal analysis of effective thermal conductivity for three-phase (unsaturated) porous media. J. Appl. Phys. 2009, 106, 054905–054911. [Google Scholar] [CrossRef] [Green Version]
  31. Hu, A.; Yu, M.; Chen, H.; Xu, B.; Fan, X. A Method for Prediction of Thermal Conductivity of Homogeneously Stacked Small Particles. Int. J. Thermophys. 2015, 36, 2535–2547. [Google Scholar] [CrossRef]
  32. Koponen, A.; Kataja, M.; Timonen, J. Permeability and effective porosity of porous media. Phys. Rev. E 1997, 56, 3319–3325. [Google Scholar] [CrossRef]
Figure 1. (A). Simplified model of pore structure space of the porous materials. (B). Representation unit on the longitudinal section.
Energies 16 00271 g001
Figure 2. Geometric analysis; (A) A geometric reduction of the representation unit(B) series connection; (C) parallel connection.
Energies 16 00271 g002
Figure 3. A geometric simplified model of the weight coefficient of the series-parallel model for representing unit on the longitudinal section.
Energies 16 00271 g003
Figure 4. The calculated results are compared with the experimental data of Jing [28] and the comparison of calculation results of different ETC models.
Energies 16 00271 g004
Figure 5. The calculated results are compared with the experimental data of Wang [12], Shen [29] and Hu [31].
Energies 16 00271 g005
Figure 6. The variation of the tortuosity with the porosity.
Energies 16 00271 g006
Figure 7. The variation of the tortuous fractal dimension with the tortuosity.
Energies 16 00271 g007
Figure 8. The influence of the pore diameter distribution on the tortuous fractal dimension.
Energies 16 00271 g008
Figure 9. Effect of porosity on area fractal dimension.
Energies 16 00271 g009
Figure 10. The influence of the pore diameter distribution on the area fractal dimension.
Energies 16 00271 g010
Figure 11. The variation of the ETC with porosity.
Energies 16 00271 g011
Figure 12. The variation of the ETC with the tortuosity.
Energies 16 00271 g012
Figure 13. The variation of the ETC with the tortuous fractal dimension.
Energies 16 00271 g013
Figure 14. The influence of the pore diameter distribution on the ETC.
Energies 16 00271 g014
Table 1. Series-parallel model (heat flow direction: left to right).
ModelMechanismMath Expression
SeriesEnergies 16 00271 i001 λ s = 1 1 ε λ 1 + ε λ 2
ParallelEnergies 16 00271 i002 λ p = 1 ε λ 1 + ε λ 2
Table 2. Other ETC model which was previously reported.
AuthorModel
Wang [12] λ e , m = λ RE , t 1 L 0 D T 1 2 D f Φ max 2 D f Φ max 2 D f Φ max D T D f + 1 Φ max D T D f + 1 D T D f + 1
Kou [30] λ + = ( 2 D f ) ε Φ max D T + 1 1 Φ min Φ max D T D f + 1 L 0 D T - 1 D T D f + 1 1 ε + 1 ε λ 1 λ 2
Disclaimer/Publisher’s Note: The statements, opinions and data contained in all publications are solely those of the individual author(s) and contributor(s) and not of MDPI and/or the editor(s). MDPI and/or the editor(s) disclaim responsibility for any injury to people or property resulting from any ideas, methods, instructions or products referred to in the content.

