Article

Experimental and Numerical Studies on the Effect of Lithium-Ion Batteries’ Shape and Chemistry on Heat Generation

by
Piyatida Trinuruk
1,*,
Warongkorn Onnuam
1,
Nutthanicha Senanuch
1,
Chinnapat Sawatdeejui
1,
Papangkorn Jenyongsak
1 and
Somchai Wongwises
1,2
1
Fluid Mechanics, Thermal Engineering and Multiphase Flow Research Lab. (FUTURE), Department of Mechanical Engineering, Faculty of Engineering, King Mongkut’s University of Technology Thonburi (KMUTT), Bangkok 10140, Thailand
2
National Science and Technology Development Agency (NSTDA), Pathum Thani 12120, Thailand
*
Author to whom correspondence should be addressed.
Energies 2023, 16(1), 264; https://doi.org/10.3390/en16010264
Submission received: 13 October 2022 / Revised: 3 December 2022 / Accepted: 5 December 2022 / Published: 26 December 2022
(This article belongs to the Topic Advanced Electric Vehicle Technology)

Abstract

:
Data sets of internal resistances and open-circuit voltage of a particular battery are needed in ANSYS Fluent program to predict the heat generation accurately. However, one set of available data, called Chen’s original, does not cover all types and shapes of batteries. Therefore, this research was intended to study the effects of shapes and polarization chemistries on heat generation in Li-ion batteries. Two kinds of material chemistries (nickel manganese cobalt oxide, NMC, and lithium iron phosphate, LFP) and three forms (cylindrical, pouch, and prismatic) were studied and validated with the experiment. Internal resistance was unique to each cell battery. Differences in shapes affected the magnitude of internal resistance, affecting the amount of heat generation. Pouch and prismatic cells had lower internal resistance than cylindrical cells. This may be the result of the forming pattern, in which the anode, cathode, and separator are rolled up, making electrons difficult to move. In contrast, the pouch and prismatic cells are formed as sandwich layers, resulting in electrons moving easily and lowering the internal resistance. The shapes and chemistries did not impact the entropy change. All batteries displayed exothermic behavior during a lower SOC that gradually became endothermic behavior at around 0.4 SOC onwards.

Graphical Abstract

1. Introduction

Lithium-ion batteries (Li-ions) have become prominent in the electric vehicle industry because they can be charged at a high current (fast charging), have high specific energy, and have low self-discharging rates. Nonetheless, to maintain efficiency while it is working, a battery must perform at an appropriate working temperature (15–35 °C) [1,2]. Operating while overheated directly harms a battery’s efficiency and its lifespan [3]. Consequently, overheating can encourage thermal runaway and fire propagation under the worst conditions [4]. Heat in a battery is produced by entropy change ( Δ S ) from the electrochemical reaction, which can be either positive or negative, and Joule heating generated when an electric current is transported across a resistance (or ohmic heating) [5,6]. Several researchers have attempted to explain the thermal characteristics of Li-ion batteries by means of experimental investigation in conjunction with numerical calculation. Jeon et al. [6] studied the thermal modeling of a cylindrical Li-ion battery during discharging. The result was that the contribution of heat generation at a low-current discharge influenced the entropy change, whereas Joule heating played a crucial role at a high discharge rate [6]. Srinivasan et al. [7] studied the thermal and electrochemical characteristics of Li-ions employing a 2D unit layer. The heat generation affected by the entropy was significant at all C-rates, especially at low C-rates, which corresponded to Jeon et al.’s work [6].
Numerical simulation seems preferable because it can reduce the number of experimental cases involving uncertainty. Moreover, 2D or 3D graphic visualization of the simulation result is very useful and informative for verifying and understanding results. The equivalent circuit model (ECM) is often applied to solve the electrical-thermal issues with battery behavior using the parameters extraction [8]. The ECM model is carried out in the commercial software ANSYS Fluent. The concept of the ECM model involves three resistors ( R 1 , R 2 , and R S ) and two capacitors ( C 1 , and C 2 ), as shown in Figure 1. Many researchers have attempted to improve the precision of the ECM model based on the battery’s properties, such as open-circuit voltage ( V o c ) as a function of the state of charge (SOC) and its internal resistance. SOC is an important term which denotes the level of energy available in a battery cell.
However, the internal resistances and entropy changes diversified among Li-ion battery types [10,11]. Calculating the heat generation in Li-ion battery precisely requires considerable data, such as the internal resistances, which are a function of the temperature and the SOC, to be measured under various battery operating conditions [12] and determined accurately via numerical calculation. Onda et al. [5] performed an experiment on the cylindrical SONY-US18650 to determine the internal resistance data as a function of the SOC and the temperature from a secondary battery. Moreover, the entropy change was calculated by monitoring the dependence of the battery’s open-circuit voltage on the temperatures in various SOCs. Entropy change was independent of the temperature over a range of 20 to 40 °C, only varied with SOC. He et al. [13] used ANSYS Fluent 2D computational fluid dynamics (CFD) to investigate the thermal management of multiple-cell modules. The heat generation was dominated by Joule heating from internal resistance alone, while the entropic heating was comparatively small compared to Joule heating. The magnitude of Joule heating and entropy change relied on the operating conditions as well as the difference between the electrode material and nominal capacity [14]. The behavior of irreversible heat, as represented in terms of Joule heating generation, is strongly dependent on the nominal capacity. Otherwise, the reversible heat, which is denoted as entropy change generation, predominately changes according to battery chemistry when the battery is at the same nominal capacity and operates under the same C-rate.
The thermal behavior of Li-ion batteries can vary significantly depending not only on the battery chemistry and current rates, but also the initial battery temperature, as well as the ambient air temperature affecting the heat generation [15,16,17]. Lin et al. [15] assessed the heat generation characteristics of NMC and LFP using extended-volume accelerating rate calorimetry. The difference in cathode materials and formulas affected the different thermal characteristics. The different initial operating temperature of a cell influenced the magnitude of heat generation, even at the same C-rate. Furthermore, the rate of heat generation was dependent on ambient temperature. Higher ambient temperature resulted in a lower heat generation rate [16] because of the effect of the temperature difference.
The shape of the battery is another aspect that may impact heat generation behavior owing to the arrangement of material layers and packaging configuration, which resulted in the ability of heat transferred from the cell to environment. Several prior studies, however, investigated the heat characteristic for a certain shape. Rarely was the comparative examination of shape differences impacting thermal behavior limited. One of the most popular battery shapes for predicting heat generation is an 18650 cylindrical Li-ion battery. Mahboubi et al. [18] studied the input parameters by applying an ECM. Those parameters were applied to calculate the heat generation and the battery temperature via an analytical approach and validated with the pulse-rest test. The results indicated that the maximum error of the temperature was less than 1 °C under a wide range of test conditions. Hwang et al. [2] examined the characterization of the heat generation rates across several discharge rates of a cylindrical cell. The heat generation was fitted to function as polynomial, exponential, and power models and then used as a heat source function in the 3D-CFD solver. The temperature results of the experiment agreed well with the simulation, with a slight error.
The study of thermal behavior was not intended only for 18650 cylindrical cells. Chitta et al. [1] studied the heat generation and the dissipation rate experimentally and numerically at diverse discharge rates for a 20-Ah prismatic LiFePo4 battery inserted between mini-channel cold plates. A lumped model was suggested in this study to predict the heat generation of the battery because it required only three measurable electrical parameters. According to the simulation results, the temperature increased with high C-rates and the cathode produced more heat than the anode. The primary source of heat was electrolyte resistance, and the highest temperature was recorded near the tabs and in the internal space of the battery [19].
Entropy is a measure of a system’s disorder. The higher the entropy, the greater the disorder, which means more unavailable energy to convert to work. A positive entropy change ( + Δ S ) indicates an augmentation of electric charge, which increases the system’s disorder. Li-ion cell contains an insertion compound, allowing Li-ion to be imbedded into a metal oxide lattice. A perfectly empty lattice should be very systematic. Then, the entropy change related to filling a few lithium atoms in available sites would be positive. When all sites at the same energy level are nearly full, the insertion of additional lithium can create a more ordered state (a full lattice), which results in a negative entropy change ( Δ S ) [10]. Zhang et al. [11] explained that the entropy change can be estimated from the temperature gradient of the open-circuit voltage ( d V o c / d T ). Entropy became negative when the next nearest neighbor sites were almost full and changed to the positive when the lattice was virtually empty. The entropy change in a Li-ion battery was positive in the regions of 0.3–0.9 SOC, which means the thermal behavior of the battery was predominantly endothermic during the discharging, even if there was no overpotential loss. The entropy change was mainly positive, except at 0.1–0.3 SOC, indicating a mainly exothermic reaction in the discharging process.
Other than the ECM model, the pseudo-two-dimensional (P2D) [20] and two-dimensional (2D) models were also used to evaluate the battery’s heat generation rate. Ren et al. [21] used the P2D and 2D models to simulate the heat generation characteristics of porous electrodes and the current collector in a prismatic battery. The predicted result concerning the heat generation and discharge time was accurate and sufficiently supported the design of the battery’s thermal management system. On the other hand, heat generation in the porous electrodes and current collectors was not uniformly distributed.
However, the result obtained from the simulation model was difficult to calculate precisely due to the restriction of the ECM model on the input parameters, which were acquired to experiment based on its characteristics (nominal capacity, battery shape, and battery chemistry). Despite extensive research on the properties and conditions, the input parameters obtained from specified experiments for each battery were critical and rarely limited [19,21]. Furthermore, no literature on comparative studies of the influence of battery shapes and chemistries on heat generation has been published, and only a specific shape or cathode material has been reported. Therefore, this research work was intended to study and investigate the heat generation in Li-ion batteries caused by entropy change and their internal resistances via the maximum temperature of the battery surface. The effects of cylindrical, prismatic, and pouch shapes, as well as battery chemistries, NMC (lithium nickel manganese cobalt oxide, LiNixCoyMnzO2), and LFP (lithium iron phosphate, LiFePO4), on battery heat production were compared through experiments and modelling as part of the engineering simulation program ANSYS with ECM model.

2. Heat Generation Model

The principle of heat generation in Li-ion batteries ( Q g e n ) is related to two main effects: Joule heating ( Q j o u l e ) due to the internal resistance (also referred to as irreversible effect) and entropy change ( Q e n t r o p y ) (or reversible effect), which can be expressed by the following equations:
Q g e n = Q j o u l e + Q e n t r o p y
Q j o u l e = I 2 R
Q e n t r o p y = I T c e l l Δ S n F
where I is discharging current, R is internal resistance, T c e l l is battery temperature at that time, Δ S is entropy change, n is the number of electrons (n = 1), and F is Faraday’s number. A set including internal resistance and open-circuit voltage of the battery cell as the function of SOC were desired to calculate the heat generation in ECM model ANSYS Fluent. ECM model on ANSYS Fluent is a sub-model for battery thermal management analysis that can simulate the temperature distribution in a battery cell or a battery pack. The governing equation of heat transfer within the battery can be solved using the following equation [9]:
  ρ C p T t · k   T = q ˙ g e n  
The source term (   q ˙ g e n is the rate of heat production during battery operation, which encompasses the heat of electrochemical reaction, Joule heating, and the heat of entropy change. Equation (5), which represents the heat generation model coupling with electrochemical model, can be expressed as follows:
  q ˙ g e n = σ e f f 2 φ s + k 2 φ e + k D ln c e · φ e + I V o l V o c φ s + φ e T d V d T    
where φ s and φ e are the solid phase potential and the electrolyte phase potential in both negative and positive electrodes, σ e f f is the effective electric conductivities of the solid phase, j ˙ is the volumetric current transfer rate from the electrochemical reaction, V o l is the battery volume, k is the electrolyte ionic conductivity, k D is the electrolyte diffusional conductivity, V is the cell voltage, and c e is the lithium concentration [9].
The charge conservation in solid phase in the positive and negative electrodes can be calculated using Equation (6) [9].
σ e f f φ s = j ˙
j   ˙ = I / V o l
with boundary conditions
σ e f f φ s x x = 0 = σ + e f f φ s x x = L = I A   and   φ s x x = δ = φ s x x = L δ + = 0   for   1 D   analysis
where σ e f f and σ + e f f are the effective electric conductivities of the solid phase in the negative and positive electrodes.
The charge conservation governs electrolyte phase potential is described by Equation (8) [9].
k φ e + k D ln c e = j
with boundary conditions
φ e x x = 0 = φ e x x = L = 0   for   1 D   analysis
According to Equation (5), the factors influencing heat generation in batteries included the ability of positive and negative electrodes to conduct electric current, the volume of battery in relation to its shape, and the voltage characteristic.
The current–voltage relationship in Figure 1 can be represented by Equations (9)–(13), obtained from the ECM [8,9].
V t = V o c S O C + V 1 + V 2 R s S O C I t
d V 1 d t = 1 R 1 S O C C 1 S O C V 1 1 C 1 S O C I t
d V 2 d t = 1 R 2 S O C C 2 S O C V 2 1 C 2 S O C I t
S O C = S O C 0 0 t I t d t 3600 Q A h
I t = > 0 ,     D i s c h a r g e < 0 ,     C h a r g e
The internal resistance and open-circuit voltage as the function of SOC at each temperature constant are required to generate simulation models. Terms of three resistors, two capacitors, and open-circuit voltage can be expressed as fifth-order polynomials as the function of SOC, which can be expressed in a general form as in Equation (14) [9]:
Y = a 0 + a 1 S O C + a 2 S O C 2 + a 3 S O C 3 + a 4 S O C 4 + a 5 S O C 5
where Y represents the parameter terms of either the resistors ( R 1 , R 2 , R s ) , the capacitors ( C 1 , C 2 ) , or open-circuit voltage ( V o c ) , which are the function of SOC. a 0 ,   a 1 ,   a 2 ,   a 3 ,   a 4 , and a 5 are the coefficient terms.
In this study, the internal resistance and the open-circuit voltage were taken into consideration as the input parameters of the ECM model. Considering in Equation (9), when the resistance of two parallel RC circuits was simply assumed to be equal to zero according to Ohm’s law, there was no voltage drop across the RC circuit ( V 1   a n d   V 2 = 0 ) . Therefore, the remaining variables in Equation (9) were the open-circuit voltage, cell voltage, current, and internal resistance as the function of SOC. The rewritten term of the remaining variable in Equation (9) can be expressed as the cell resistance, which was calculated from the difference between V o c and V c e l l divided by discharge current ( I ), as given by Equation (15).
R = V o c V c e l l I
Entropy change is used to describe the chemical reaction in the battery cell. Equation (16) shows that total heat energy, as an aspect of chemical-reaction energy in the system, is the sum of Gibbs energy and entropy change. Gibbs energy is always negative. When the entropy change is positive and overtakes Gibbs energy, the heat balance in the system becomes positive. That means the system gains energy from the environment. If the entropy change is negative, on the other hand, the system loses heat to the environment. Entropy change can be defined by measuring the dependence of a battery’s open-circuit voltage on the temperature at various SOCs, as given by Equation (17).
Δ H = Δ G + T Δ S
Δ S n F = d V o c d T
where Δ H is the total heat in the battery, Δ G is Gibbs energy, Δ S is the entropy change, T is the battery surface temperature, and d V o c / d T is the change rate of open-circuit voltage with temperature gradient.
Thus, the total accumulated heat in the battery can be simply expressed by the internal resistance term, the entropy change term, and the heat convection term, as shown in Equation (18) and rearranged to calculate the battery temperature, as shown in Equation (19). Due to the different types of battery cells, each has its own internal resistance and entropy change features. Therefore, it can cause a different increase in the battery temperature, as expressed in Equation (19).
m c e l l C p , c e l l   d T d t = I 2 R I T Δ S n F h A T T a m b
T i = I 2 R I T Δ S n F h A T T a m b m c e l l C p , c e l l   · t i t t 1 + T i 1
where m c e l l is the battery’s mass, C p , c e l l   is the specific heat of battery, h is the heat convection coefficient, A is the battery’s surface area, and T a m b is the ambient temperature.

3. Methodology

The methodology of this study consisted of two parts: experiment and numerical calculation.

3.1. Experimental Setup

The experiment was performed to investigate the internal resistance and entropy change of two battery chemistries (NMC and LFP) with three different battery shapes (cylindrical, pouch, and prismatic) during the discharge cycle, as concluded in 
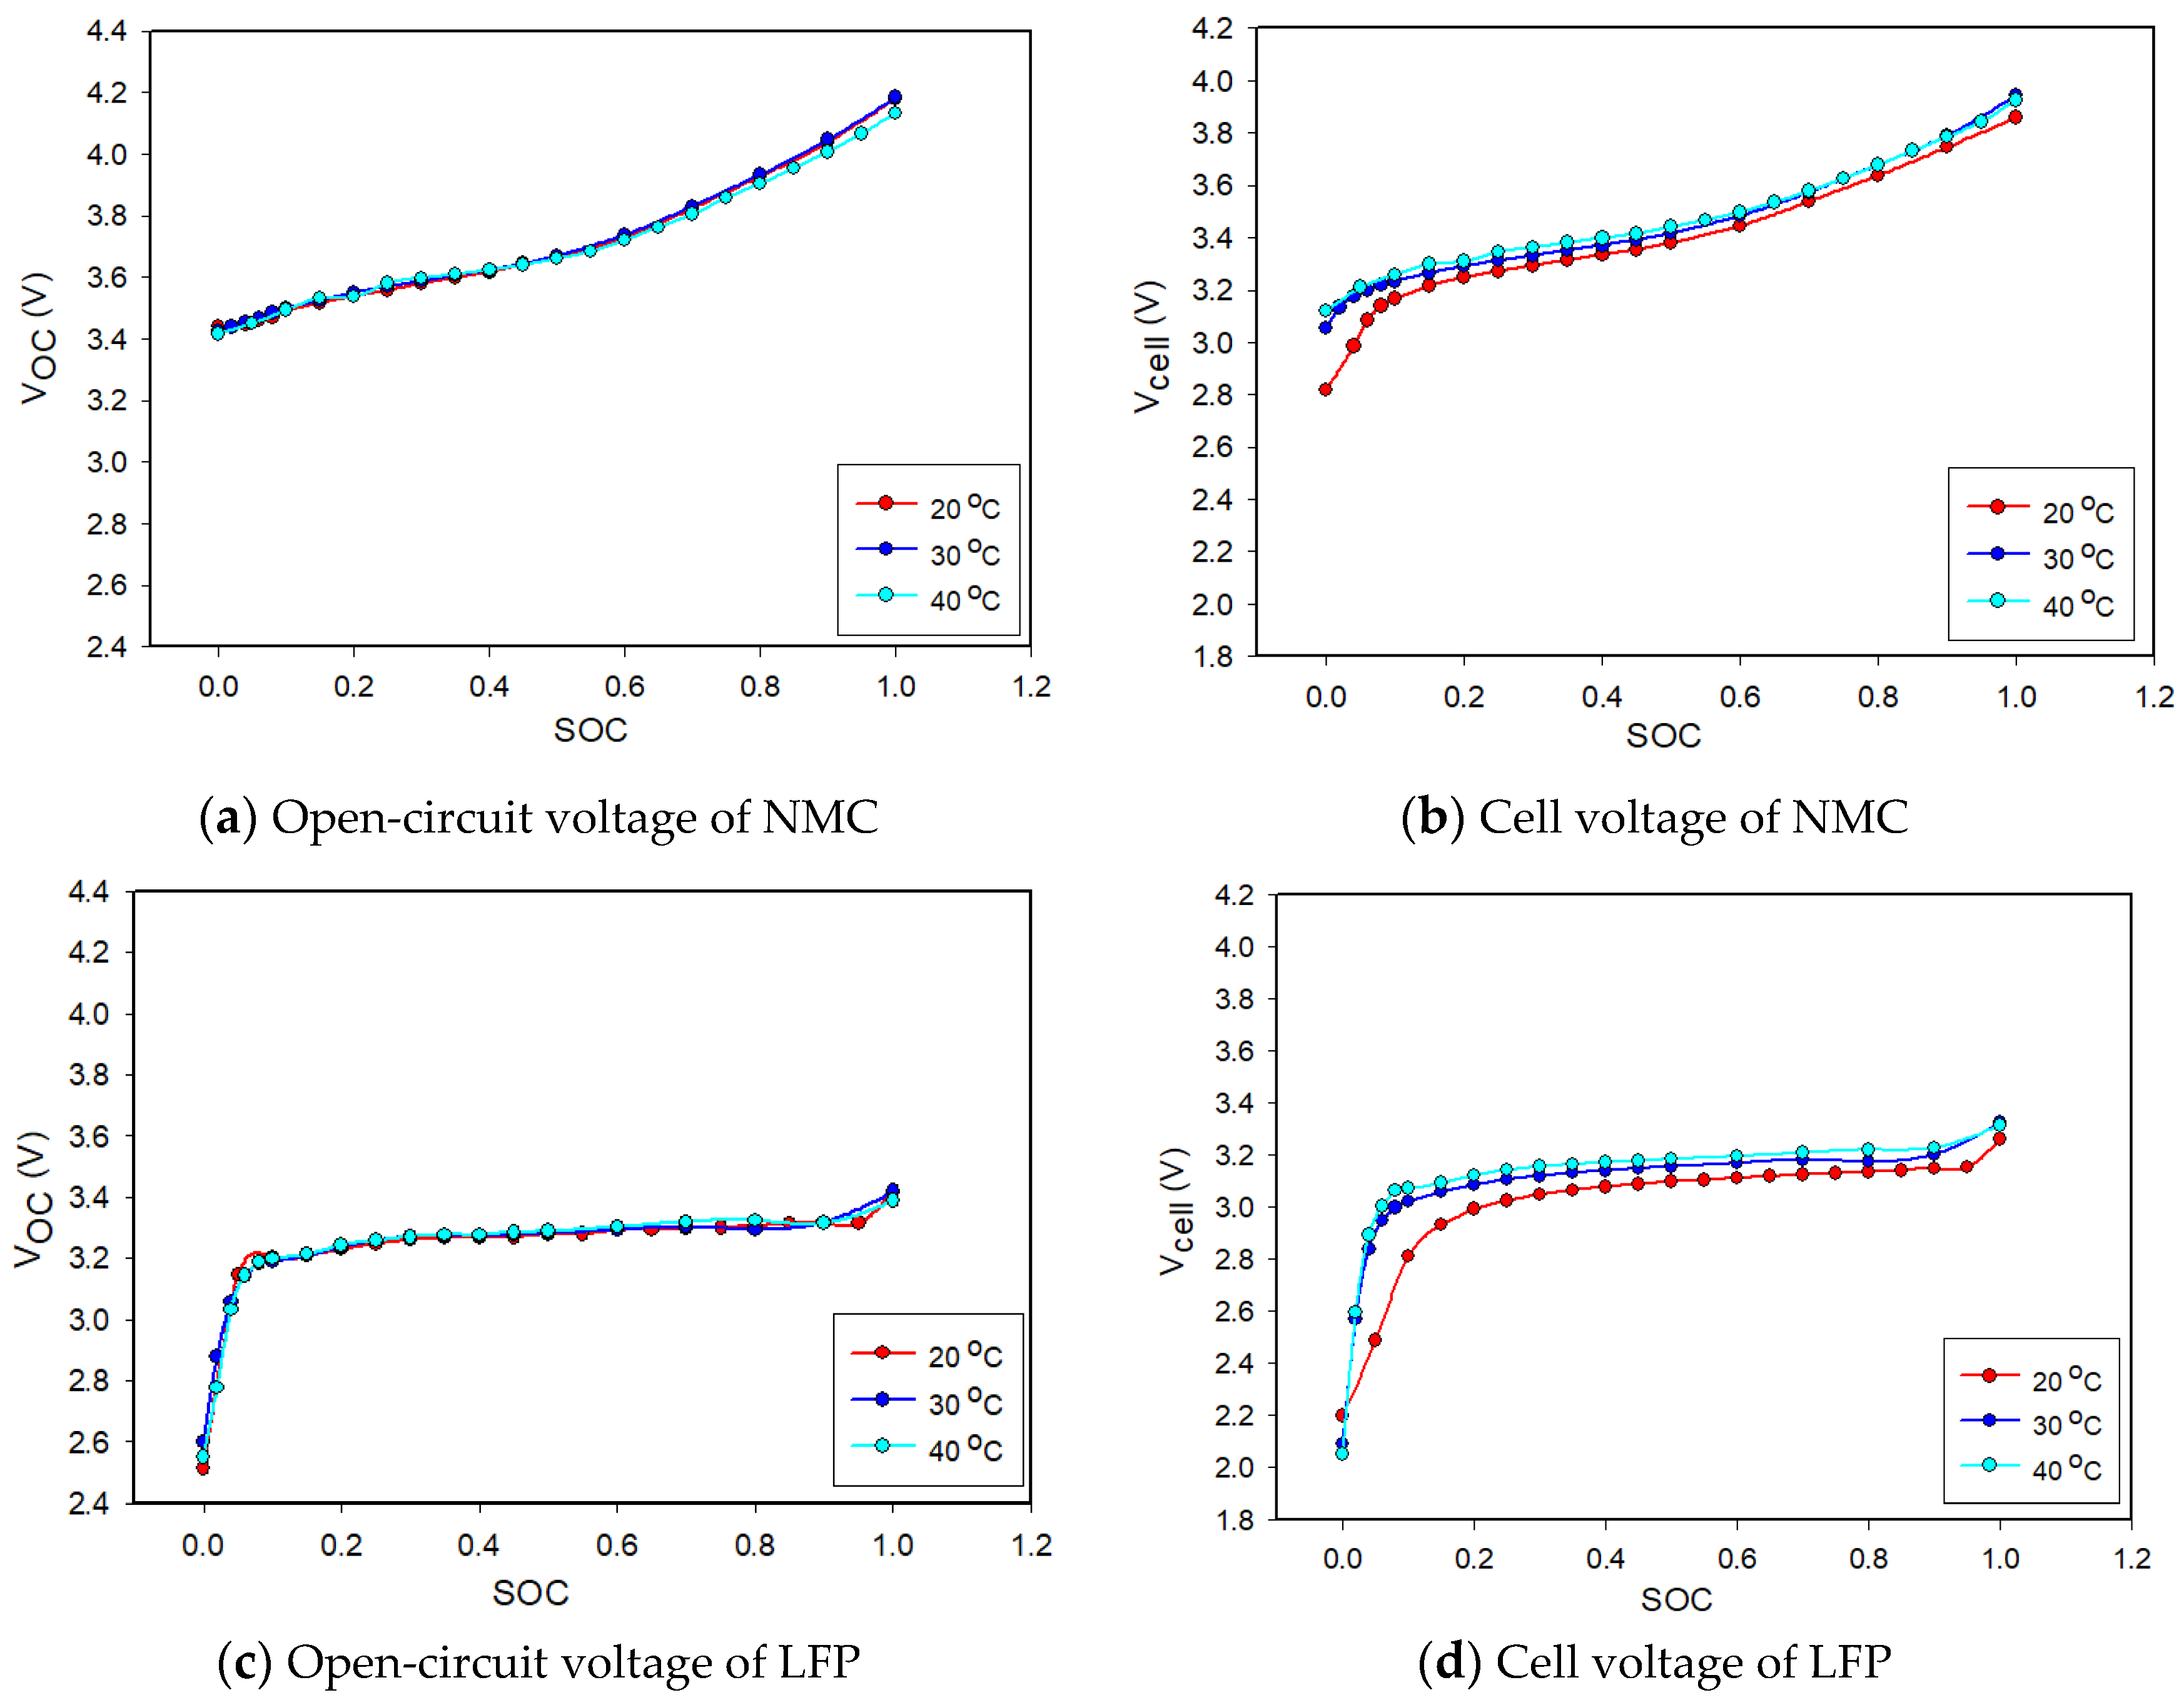
Table 1. The first experiment was set up to gather data on open-circuit voltage and cell voltage at various SOCs at specified control points. After that, the internal resistance was calculated using Equation (15) to be used as the ECM input parameters. 
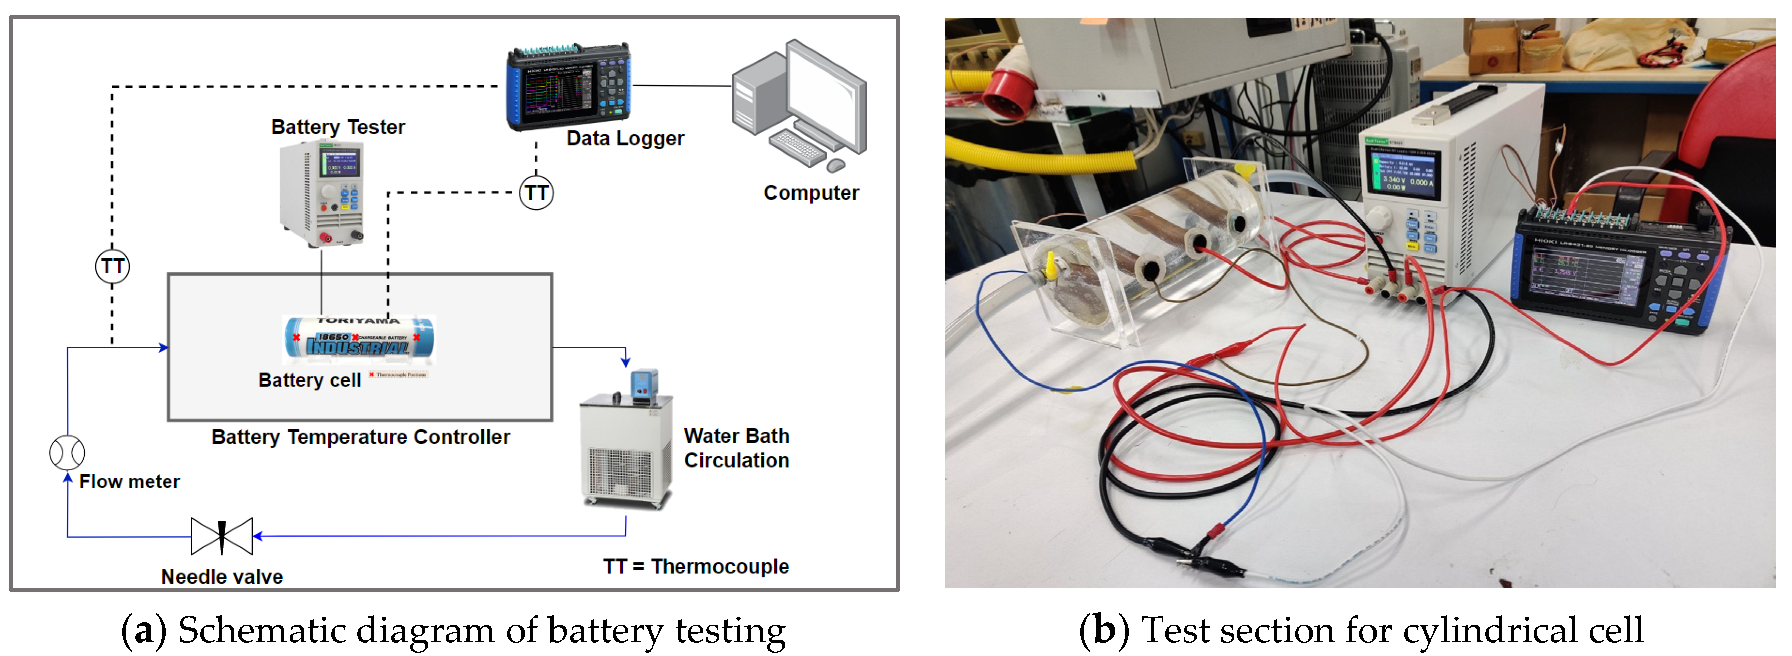
Figure 2a illustrates the schematic diagram of the battery testing and Figure 2b presents the equipment used to measure the discharging electrical characteristics of the cylindrical battery. The battery tester (ET5410) worked as the electric load for the battery. The battery’s surface temperature was measured by thermocouples type T and recorded by a datalogger (HIOKI LR8431). The experiments were carried out while discharging at a constant current of 1C-rate. The battery cell was stored in the temperature controller set, with cold water flowing through the temperature controller set to remove the heat and maintain the battery temperature at a certain condition. The open-circuit voltage and the cell voltage were measured during discharging operation. The test conditions were kept constant at the temperature of 20, 30, and 40 °C, respectively, to investigate the effect of temperature on internal resistance. When the battery was discharged from 0% to 100% depth of discharge (DOD), the experimental data of V o c and V c e l l   were collected with a 5% DOD interval. DOD is used to explain the amount of discharge current that has been depleted from the battery relative to the overall capacity. DOD is the opposite of SOC. When DOD is 100%, or 1.0 DOD, this corresponds to an SOC of 0%, or 0.0 SOC, indicating that the battery is completely empty, and SOC equals 1.0 when DOD is 0%. In this study, the term of SOC was commonly used in the analysis.
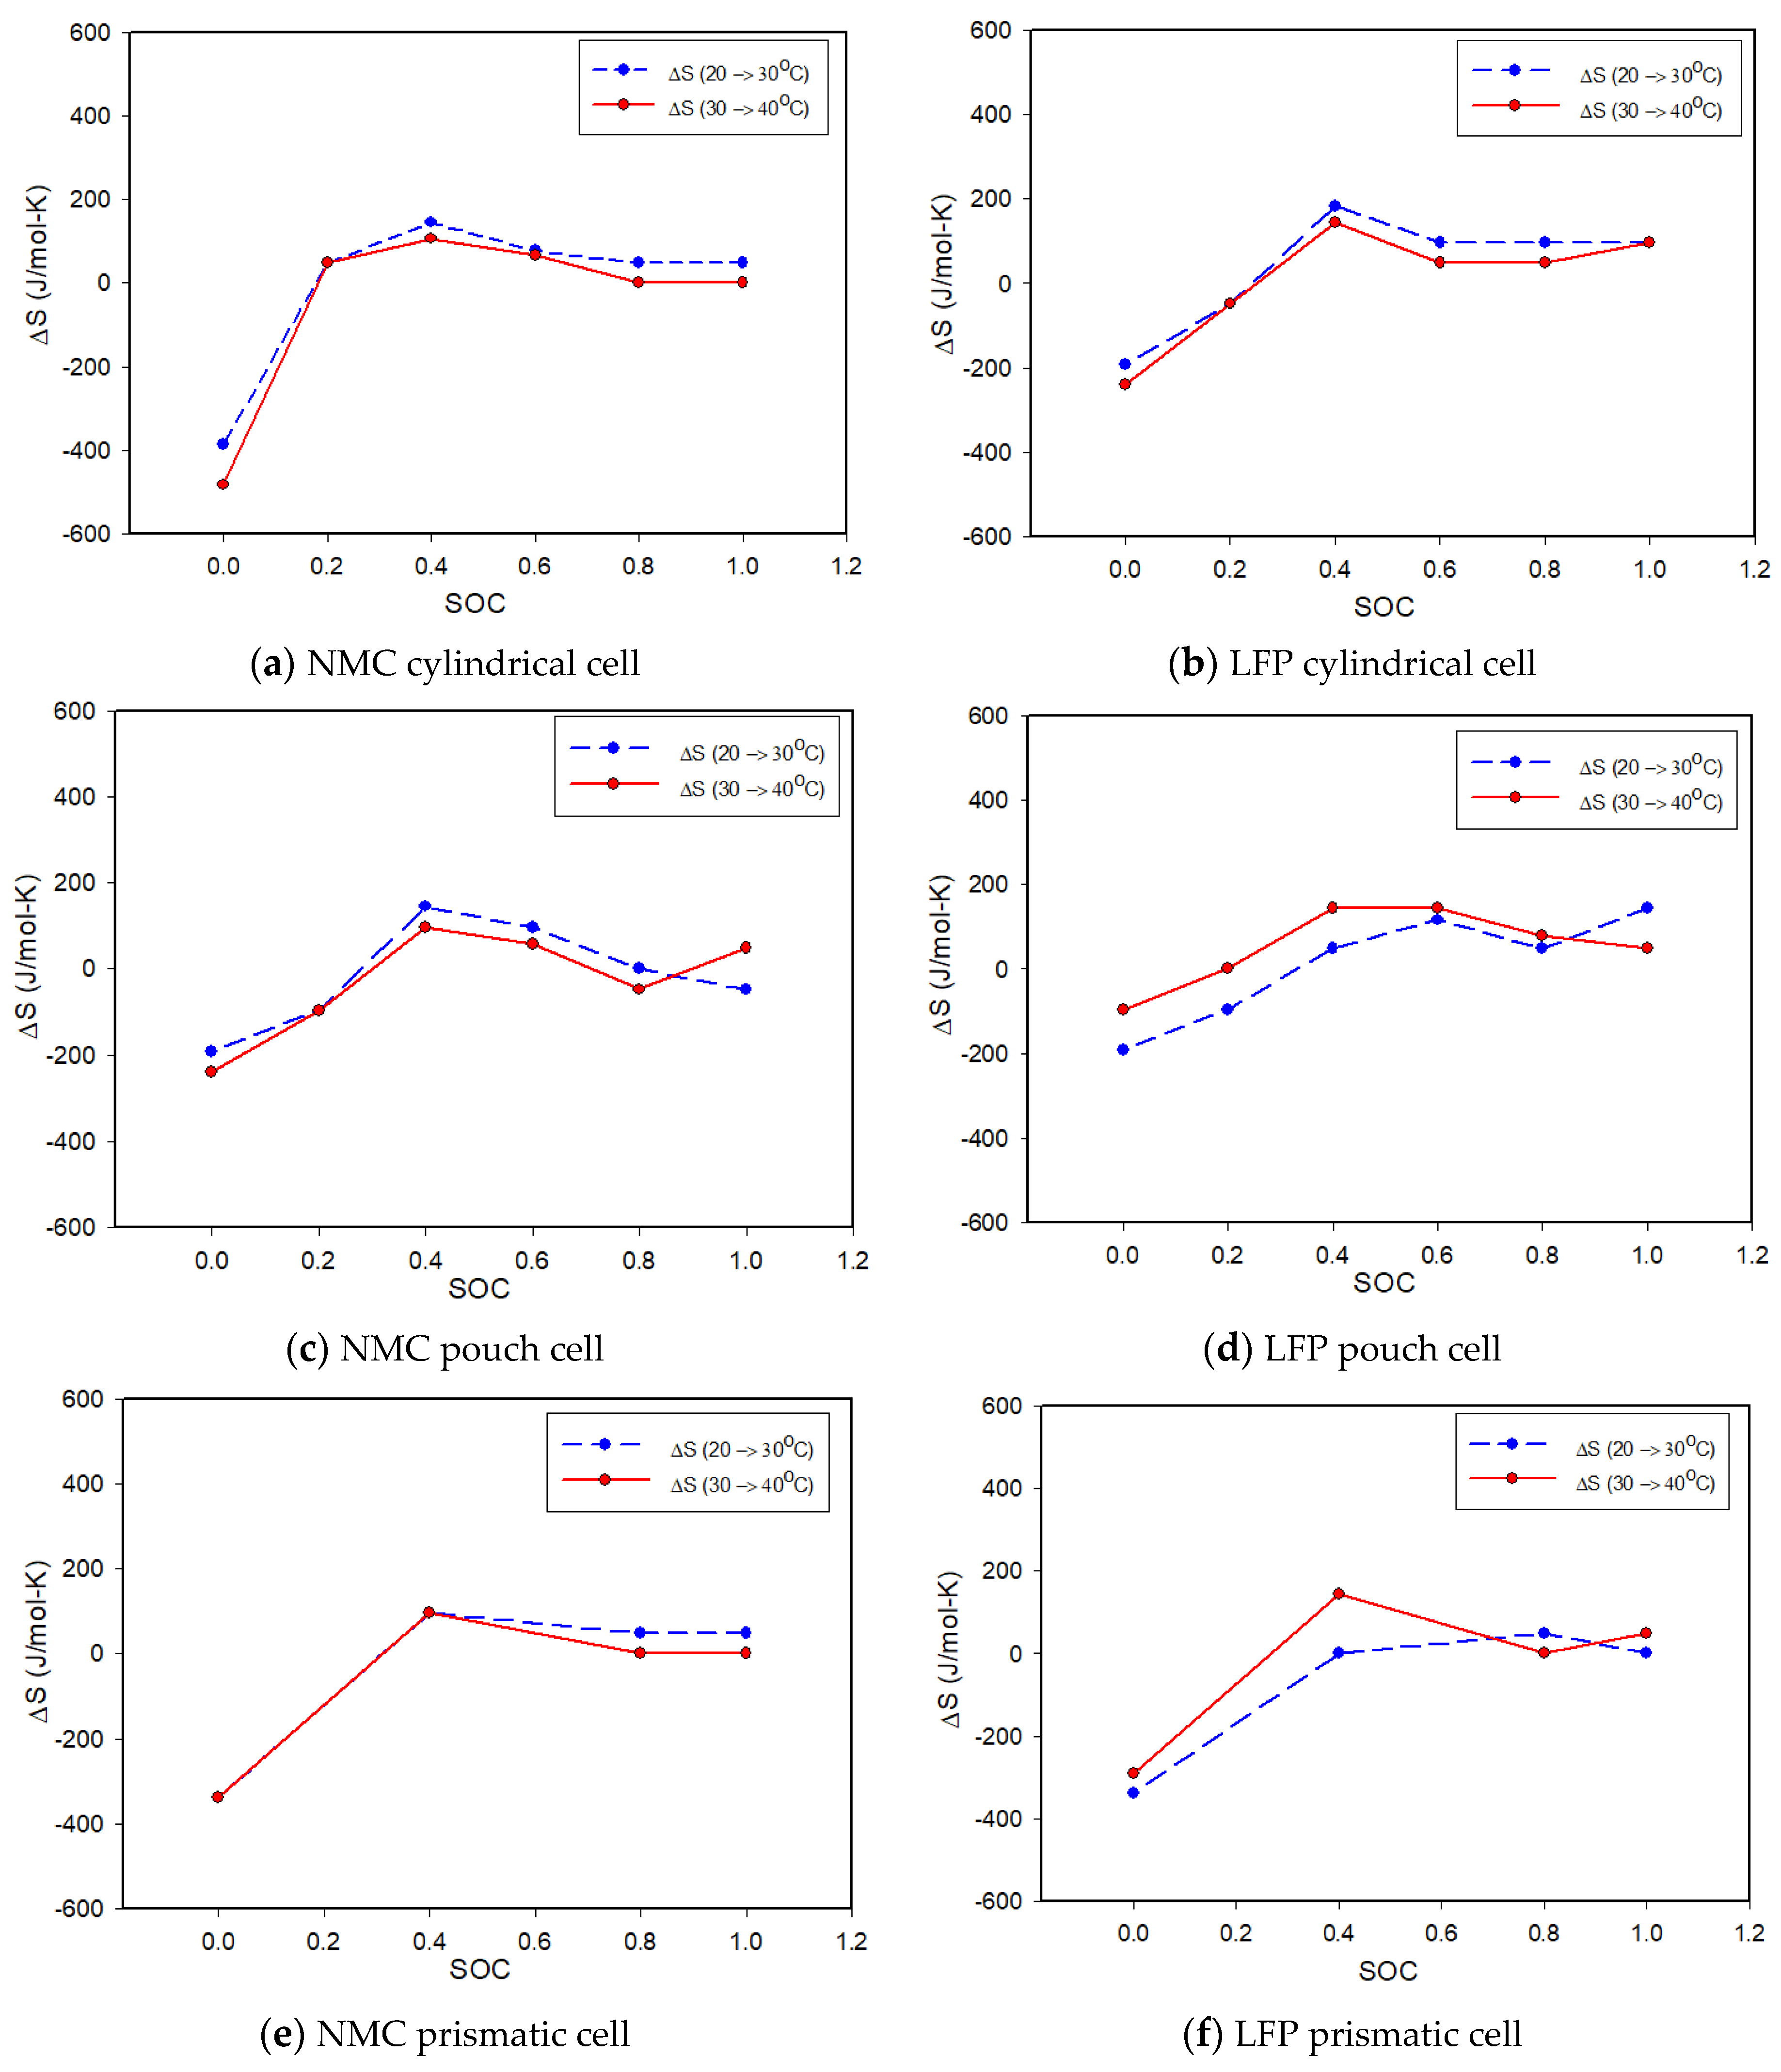
The battery was controlled to a certain SOC and maintained at a constant temperature of 20 °C to measure the entropy change; then, the change in open-circuit voltage was corrected. The experiment was repeated at different temperatures by changing the controlled temperature to 30 °C and 40 °C. Then, using Equation (17), the dependence of a battery’s open-circuit voltage on temperature in various SOCs was utilized to compute the entropy change. The experiment in this study was designed to assess not only the internal resistance and entropy change, but also the battery surface temperature. When the input parameters from the former experiment were employed, the experimental results of battery temperature during discharge at free stream temperature were used to assess the accuracy of the ECM model in ANSYS Fluent.

3.2. Numerical Modelling

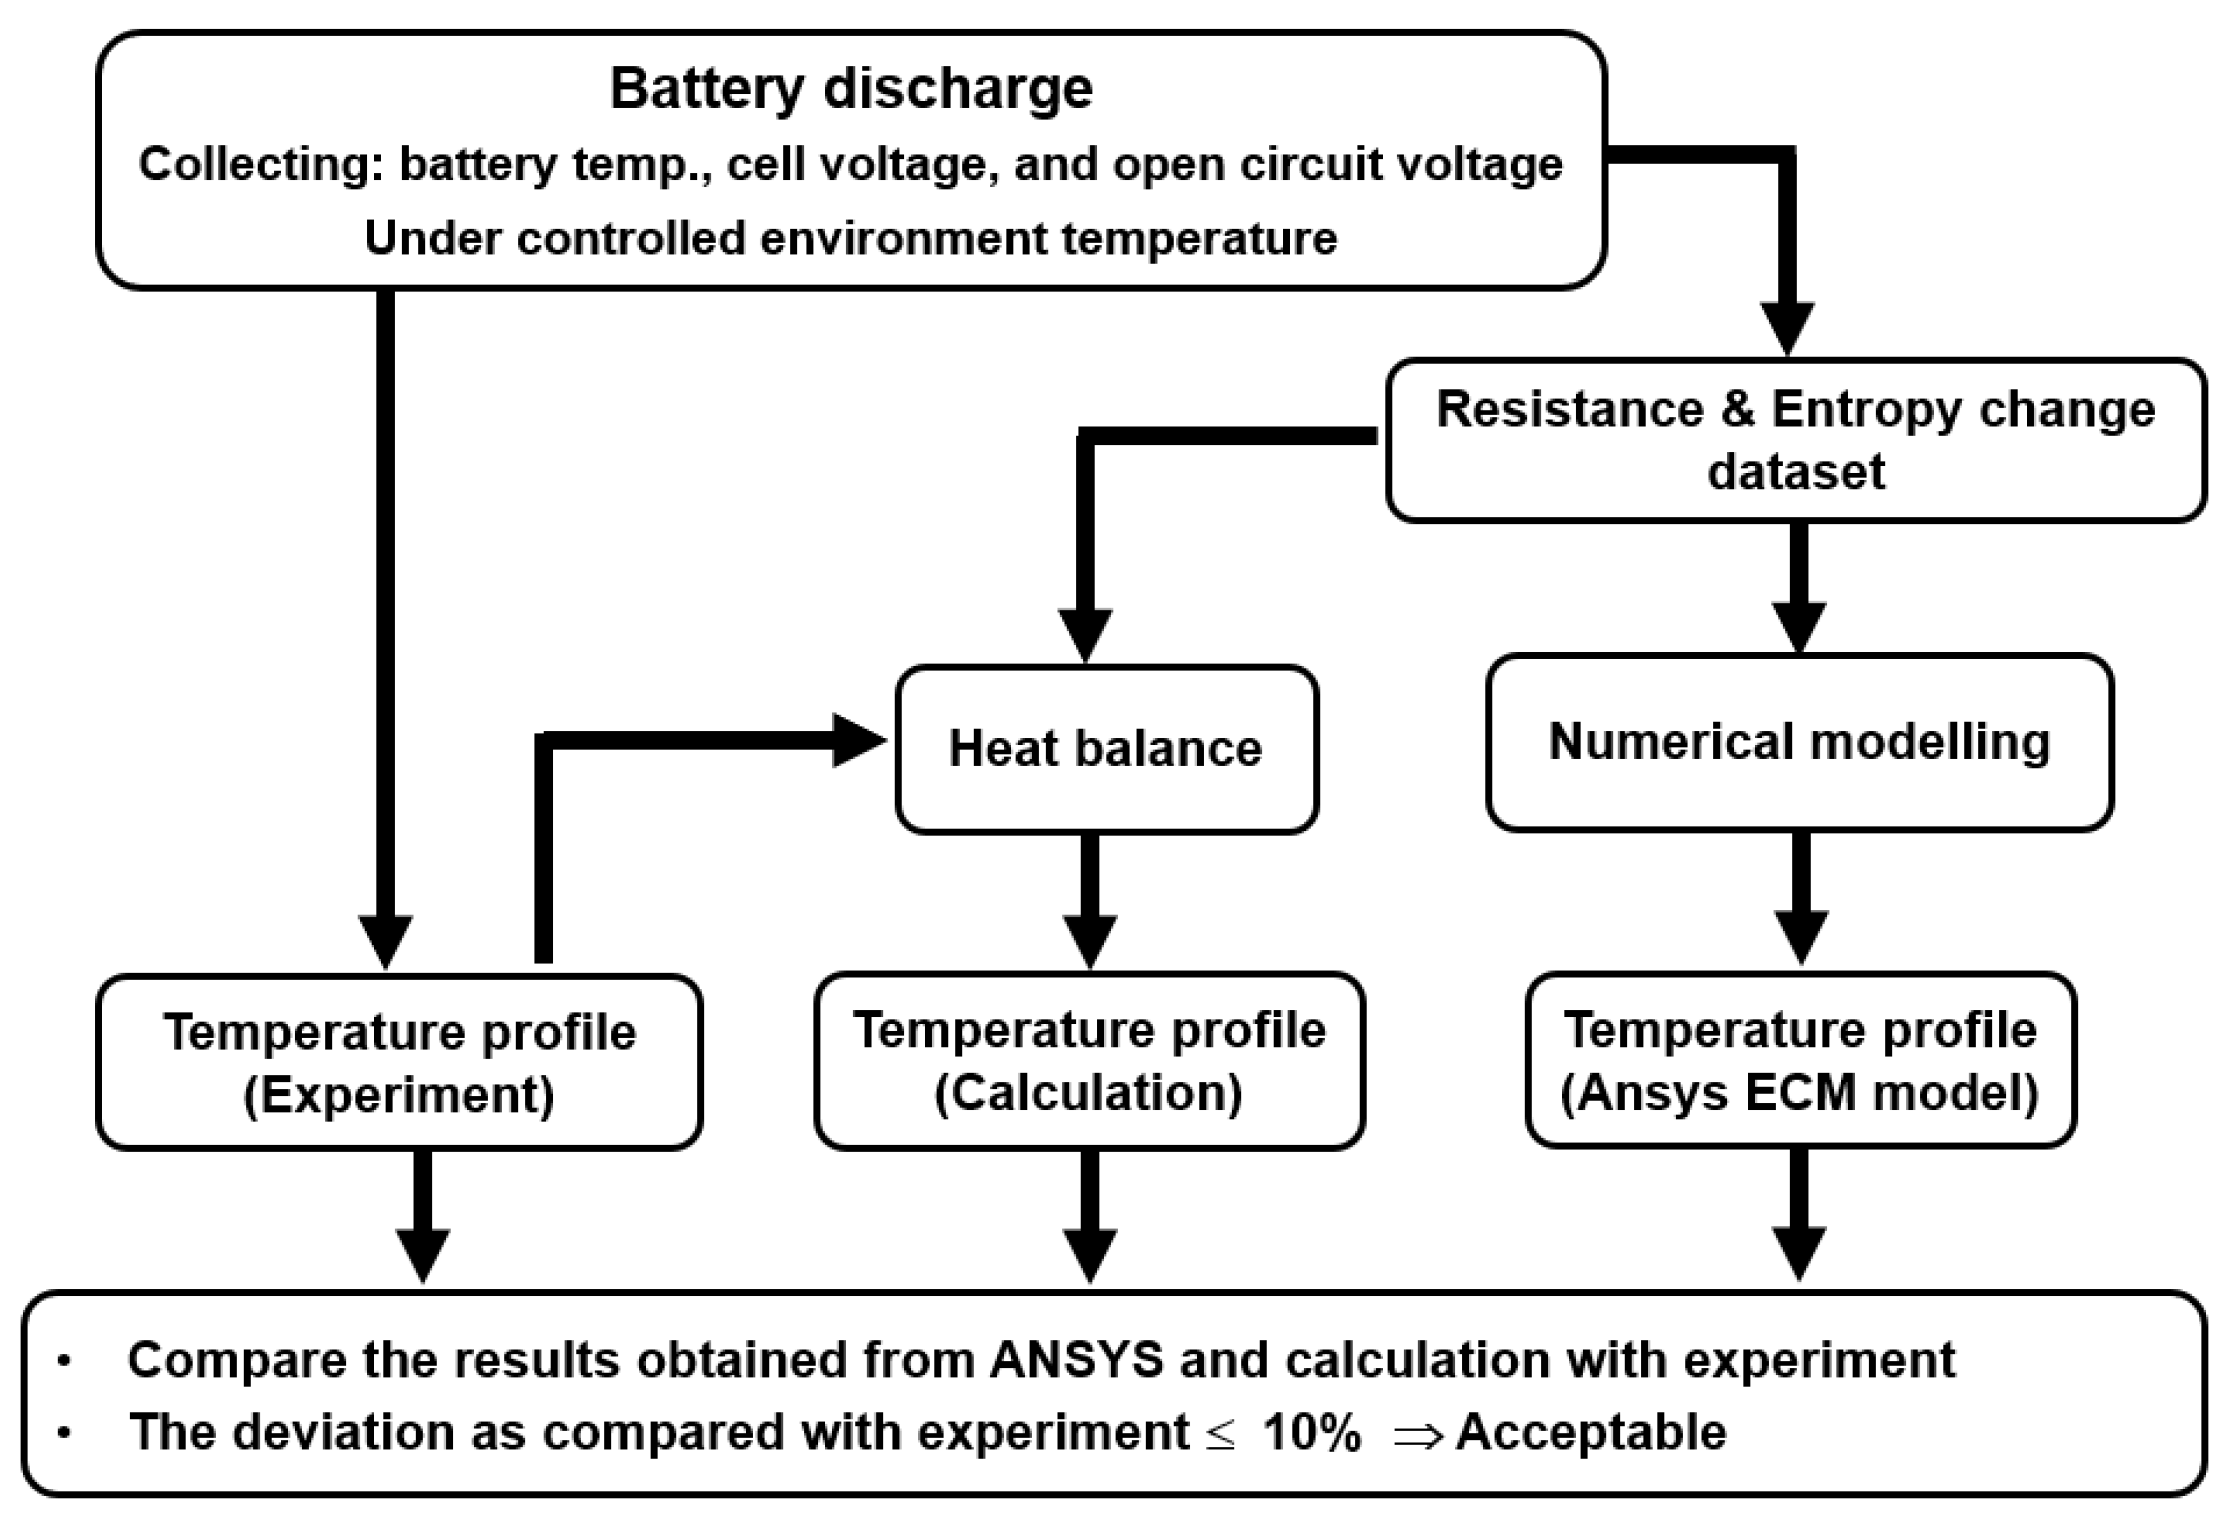
There were two numerical calculation approaches for analyzing the temperature profile of battery during current discharge: calculation and simulation through Ansys ECM model. Figure 3 illustrates the methodology employed in this investigation.
The multi-scale multi-dimensional (MSMD) solution method in Ansys Fluent model was activated. The ECM model, which is an electrochemical model, was used to study the battery behavior during the discharging process. The cell’s specifications, including nominal capacity, minimum and maximum shut-off voltages, and C-rate, were input as the electrical parameters. The cell geometry was split into two conductive zones: active and passive components, which were represented by negative and positive tabs. The initial state of charge and reference capacity of the tested battery were required as equivalent circuit model parameters. The ECM parameter data in table form was chosen to fill in the experimental finding of R s and V o c as the function of SOC and temperature dependence. To simplify the ECM model, the remaining four parameters, R 1 , R 2 , C 1 , and C 2 , were considered to be near to zero at 1 × 10 5 . The ambient temperature and initial temperature of battery were determined in accordance with the experiment. The battery’s boundary condition was set to heat convection mode, with a heat transfer coefficient of 20 W/m2·K. However, because the RC parameters were assumed to be relatively low, the anticipated temperature may be overestimated when compared to the experimental result. As a result, to compensate for the limited parameter data of two RC circuits, the simulation used a slightly higher heat transfer coefficient through natural convection.
Furthermore, the dataset comprising the resistances and entropy change from the experiment was used to calculate the temperature profile of the battery surface using the heat balance Equation (19) and compare its accuracy to the other methods.

4. Result and Discussion

4.1. Internal Resistance

Internal resistance is one of the sources of heat generation in a battery and it can be determined by dividing the difference between the V o c and the V c e l l by the charge or discharge current. In this study, two of the most commonly used Li-ion battery chemistries, NMC and LFP, were considered, with three shapes. Sampling of battery cells included a cylindrical cell type 18650 NMC with 2.5 Ah capacity, 18650 LFP with 2 Ah capacity, 10 Ah NMC pouch cell, 20 Ah LFP pouch cell, NMC prismatic cell with 6 Ah capacity, and 25 Ah LFP prismatic cell. The experiments were conducted with a discharge rate at 1C, and the cell temperature was controlled at a specific temperature of 20, 30, and 40 °C for each battery cell. The open-circuit voltage and cell voltage were recorded every 0.05 SOC, and then they were used to calculate the battery resistance. Figure 4 shows the temperature fluctuation of NMC cylindrical battery and cold water during the discharge current at 1C-rate when the cell temperature was held constant at 20 °C. The battery temperature increased as the current was discharged and gradually decreased after the discharge was stopped every 0.05 SOC. A greater increase in battery temperature can occur when the SOC is low.
The electrical characteristics of 18650 NMC cylindrical cells of both NMC and LFP batteries during the discharge at 1C-rate are illustrated in Figure 5. It was clear that the difference in chemical compounds played a significant role in the trend of decreasing V o c . For NMC cells, the V o c gradually declined along with the decreasing SOC, while those of the LFP cells slightly decreased and sharply dropped when the SOC was less than 0.1. The V o c of both cells was temperature-independent. The V c e l l of each chemical compound had a tendency similar to the V o c . Nevertheless, both batteries showed increased V c e l l aligning with increasing temperature, as shown in Figure 5b,d. Then, the internal resistances of all the batteries were calculated through Equation (15).
The resistances of three shapes of NMC and LFP batteries at various SOCs at temperatures of 20, 30, and 40 °C are shown in Figure 6. The tendency of the resistance was consistent in the range of 0.2–0.9 SOC and promptly increased when the SOC was lower than 0.2 for all battery types. Raising the temperature reduced resistance. In the range of 0.2–1.0 SOC, the resistance of the NMC was higher than that of the LFP battery for the cylindrical and pouch cells, as shown in Figure 6a–d. For the prismatic cell, the magnitude of resistance did not show a difference between the two chemistries, but the LFP prismatic cell displayed a significant change in resistance affected by the temperature, similar to the LFP cylindrical cell. In addition, cylindrical cells’ resistance was greater than that of the other two shapes.

4.2. Entropy Change

Another heat generation source in batteries is entropy change, which comes from a reversible process. Entropy change can be measured by changes in open-circuit voltage at miscellaneous temperatures and various SOCs. The experiment was performed by holding the battery in the temperature controller at 40 °C for 12 h and measuring the open-circuit voltage. Then, the temperature controller set was changed to 20, 30, and 40 °C, respectively, and maintained for 1.5 h at each temperature step. Afterwards, the entropy change was calculated from the voltage difference per unit change in temperature, as given in Equation (17).
Figure 7 shows the change in open-circuit voltage of the LFP prismatic cell at 0.6 SOC. The graph shows that the increase in battery temperature influenced the electrical characteristics by increasing open-circuit voltage. This happened because the deviation of temperature required diverse energy to drive the chemical reaction to the equilibrium state. At a higher temperature, the electrolyte was over-energized, resulting in a greater entropy change than that at a lower temperature in the same SOC. To investigate the entropy change, all battery cells were subjected to several SOC experiments. Figure 8 demonstrates the entropy change of six cells in various shapes and cathode materials with respect to SOC. The results showed that the entropy change was a negative value when the battery had less than 0.4 SOC of remaining capacity, and gradually increased to be positive after the SOC was beyond 0.4 for all cases. This was because of the electrolyte chemical-breakdown process for generating current, which behaved like an endothermic process. A larger negative at full discharge (0.0 SOC) was caused by the electrolyte being close to the equilibrium state. The amount of entropy heat can comprise a large portion of total heat generation when its capacity was shifted to a very low SOC. Most of the energy was reduced from the rebounding of the electrolyte in the battery cell. The degree of entropy change can be affected by the deviation of battery shapes and material chemistries, and the difference in chemical reactions released or required different energy. Pouch and prismatic cells, which had larger surface areas, tended to display a higher entropy change than the cylindrical cells. According to this study, the LFP battery achieved a higher entropy change because it had a lower heat capacity and higher thermal diffusion, which means that the LFP cell reached equilibrium faster than the NMC cell.

4.3. The Battery Surface Temperature

In this section, the battery surface temperature was considered as the main parameter to examine the heat generated from a Li-ion battery. The experiment was performed to measure the surface temperature. Then, the experimental data were used to validate the accuracy of the ECM simulation.

4.3.1. Experimental Results

The surface temperatures were measured at three positions for each cell: negative tab, center, and positive tab. The initial temperatures of battery and ambient air were set at roughly 25 °C. The test was performed under a discharge current of 1C-rate. Due to the battery’s heat dissipation to the surrounding, the ambient temperature fluctuation during the experiment might vary within 1 °C. Figure 9 shows the battery surface temperature with respect to the discharging time at the rate of 1C, with a clear increase in surface temperature over the discharging period. Temperature gradients between chemistry compounds and shapes did not deviate, except in the NMC prismatic cell. During the discharge cycle, the surface temperature of the NMC prismatic cell had increased slightly and then abated in 1500–2500 s. The magnitude of the temperature increase comparing the end of discharge and the initial stage was in the range of 6–10 °C, except for the NMC prismatic cell, which was about 2.3 °C. However, it can be argued that the difference in battery capacity may affect heat generation and the rising temperature in the NMC prismatic cell. Therefore, the normalization of the rising temperature by dividing it with the discharge current, called the ratio of rising temperature per unit current, was defined and investigated. The result was that the ratio of rising temperature per unit of battery capacity was the highest at 3.3–3.5 °C/Ah for cylindrical cells of both NMC and LFP batteries, while that of prismatic and pouch cells was 0.3–0.6 °C/Ah. These results correspond with the measured internal resistance in Figure 6. The internal resistance of the cylindrical cell was higher than that of other cells by about one order of magnitude.
The rate of rising temperature per unit capacity of the cylindrical cell was clearly higher than that for the pouch and prismatic cells, but the cylindrical cell’s capacity was distinctively lower than that of other shapes. Thus, the temperature at the end of discharge was not much different than the effect of the lower capacity. The ratio of surface area to battery capacity, which was implicit in the degree of heat loss to the environment, influenced the increase of battery temperature. Table 1 illustrates that the NMC prismatic cell had a surface area to capacity ratio of 34.33 mm2/Ah, which was larger than that of the pouch and other prismatic cells. Hence, the surface temperature of the NMC prismatic cell was not obviously increased, and it slightly decreased during the middle of the discharging period.

4.3.2. Mesh Sensitivity Study

The number of mesh elements of the battery model was varied to investigate the convergence of simulation results through the ANSYS Fluent model. The maximum temperature of the battery surface was the targeted parameter, which was compared until the given result became an insignificant change (under second-decimal digits). Skewness and orthogonal quality were considered the factors that identified the quality of mesh elements. Skewness can infer how the simulation model reached the ideal; excellent skewness should be close to zero. Figure 10a,b show the maximum battery temperature and skewness quality against the domain elements of NMC cylindrical cell. The convergence of temperature results with excellent skewness was around 6 × 10⁵ elements in this case. As a result, a mesh of 6 × 10⁵ elements was an appropriate mesh for a cylindrical model. The appropriate mesh number enables accurate simulation results and efficient computing resources. In the simulation model, the initial temperature of the battery was set at 25 °C, with the natural convective heat transfer coefficient of 20 W/m2·K. The surface temperature was calculated under the discharge current of 1C-rate. The appropriate domain elements for each battery model used in the simulation are shown in Table 2.

4.3.3. Simulation Validation and Verification Testing

The experimental results of maximum temperature on the battery surface during the discharging process were used to verify the accuracy of the ECM model. Figure 11a,b present the temperature profiles and electrical characteristics of NMC and LFP cylindrical cells with respect to discharge time. The simulation results of the surface temperature and the cell voltage offered good agreement with the experimental data. The maximum errors between the simulation and experiment were 3.60% for NMC and 3.69% for LFP cylindrical cells. The cell voltage dropped rapidly at the end of the discharging process, which caused a sharp increase in the cell temperature. This drop in voltage also corresponded to the internal resistance increasing sharply when the battery was nearly empty, as shown in Figure 6.
For the pouch shape, the simulation results were consistent with the experiment on the NMC pouch cell. However, there was a difference in temperature between the simulation and experiment at the end of discharge, as shown in Figure 11c. This inconsistency was due to the deviation of cell voltage. The simulated voltage was dropped to the cut-off point before the experiment, which resulted in a shorter time needed to accumulate the heat than during the experiment. In addition, the ambient temperature gradually increased over the discharging period. For the case of the LFP pouch cell, the voltage profile of the simulation started with a moderate decrease and then sharply declined after 3000 s until the cut-off voltage was reached, as shown in Figure 11d. A greater drop in the battery voltage caused more heat generation inside the battery, which led to a longer time for heat accumulation as it represented a very high temperature at the end of the discharge cycle.
The increase in the temperature profile during the 1C-rate discharge was not clearly visible in the case of the NMC prismatic cell, as shown in Figure 11e. At 1200 s, the temperature began to fall slightly because the NMC prismatic cell’s surface area to battery capacity ratio was greater than that of the LFP prismatic cell. Higher battery surface area per battery capacity enhanced heat loss to the surrounding area, which caused the temperature to fall. For the LFP prismatic cell, the simulated temperature aligned well with the experiment. At the beginning of the discharge, the cell voltage from the simulation dropped immediately, before declining more slowly. However, a deviation existed between the experimental voltage and the simulation. In an overall comparison, the maximum error of the surface temperature between the experiment and the simulation was 3.13% for the NMC and 2.28% for the LFP prismatic cell.

4.3.4. Validation of Mathematical Battery Temperature Modeling

The mathematical battery temperature equation in Equation (19), which was adopted from the heat balance equation, was implemented to comparatively evaluate the battery temperature with the experiment in this section. The result of entropy change from Section 4.2 was substituted in Equation (19). The numerical and experimental results of battery temperature for all cells are illustrated in Figure 12. The tendency of the battery temperature based on the calculation of the heat balance equation was similar to that of the experiment, with gradual difference over time. A large deviation was observed in both NMC and LFP pouch cells because of the limitation on the use of a single-dataset internal resistance input. However, this approach still had a restriction on the temperature prediction, because it required the entropy change as the input parameter, and it did not consider that the temperature affected the internal resistance, resulting in the deviation between the calculation and experimental results.

5. Conclusions

The internal resistance and the entropy change are two main factors that influenced the battery temperature during charging and discharging processes. The shape and material chemistry of Li-ion batteries were compared in terms of their effects on heat generation. The internal resistance of the various types of batteries was manipulated, resulting in varying magnitudes of irreversible heat production, or Joule heating. This study found that the cylindrical form generated a higher level of heat than the other two shapes, which corresponded to the experimental results of internal resistance. The term of rising temperature per unit of battery capacity was proposed to normalize the effect of heat generation in various battery capacities. The value was dependent on the battery shape, which was about 3.3–3.5 °C/Ah for the cylindrical form, while that of the prismatic and pouch cells was in the range of 0.3–0.6 °C/Ah. However, the increase of overall surface temperature during the discharging process due to heat generation was dependent not only on the rising temperature per unit capacity, but also the battery capacity and the surface area to capacity ratio. This study did not find differences in the way that material chemistry (NMC and LFP) affected the battery’s heat generation by the effect of Joule heating. Nevertheless, lower internal resistance was found in the LFP battery than in the NMC battery. Temperature can affect the internal resistance of both NMC and LFP cells.
To predict the battery surface temperature through ANSYS Fluent: ECM Battery model, the internal resistance and the open-circuit voltage of the battery, which are its own individual characteristics, are important as the input parameters. The surface temperature of all batteries, obtained via numerical modeling by ANSYS Fluent, corresponded well with the experimental results, with an error less than 10%. The chemistry and shape of the batteries had insignificant effect on entropy change. Variations in SOC, on the other hand, had a direct influence on entropy change. The magnitude of the entropy change depends on the behavior of the chemical reaction in the battery cell. When most of the reaction is an endothermic process, the entropy change is positive. The numerical results of heat generation calculated via the heat balance equation showed that Joule heating accounted for a greater proportion than the heat caused by entropy change. Even though this method includes entropy change, it does not cover the effect of temperature on internal resistance, which results in an inaccurate calculated temperature.

Author Contributions

Conceptualization, P.T.; methodology, W.O., N.S., C.S. and P.J.; writing—original draft preparation and validation, P.T., W.O., N.S. and C.S.; investigation, writing—review and editing, visualization, and supervision, P.T. and S.W.; formal analysis, P.T.; funding acquisition, P.T. and S.W. All authors have read and agreed to the published version of the manuscript.

Funding

This research was funded by Thailand Science Research and Innovation (TSRI) Basic Research Fund: Fiscal year 2022 under project number FRB650048/0164 and National Science and Technology Development Agency (NSTDA) under the Research Chair Grant.

Institutional Review Board Statement

Not applicable.

Informed Consent Statement

Informed consent was obtained from all subjects involved in the study.

Data Availability Statement

Data sharing is not applicable to this article.

Acknowledgments

The authors acknowledge the supported provided by Thailand Science Research and Innovation (TSRI) Basic Research Fund: Fiscal year 2022 under project number FRB650048/0164 and National Science and Technology Development Agency (NSTDA) under the Research Chair Grant.

Conflicts of Interest

The authors declare no conflict of interest.

References

  1. Chitta, S.D.; Akkaldevi, C.; Jaidi, J.; Panchal, S.; Fowler, M.; Fraser, R. Comparison of lumped and 1D electrochemical models for prismatic 20Ah LiFePO4 battery sandwiched between minichannel cold-plates. Appl. Therm. Eng. 2021, 199, 117586. [Google Scholar] [CrossRef]
  2. Hwang, F.S.; Confrey, T.; Scully, S.; Callaghan, D.; Nolan, C.; Kent, N.; Flanney, B. Modelling of heat generation in an 18650 lithium-ion battery cell under varying discharge rates. In Proceedings of the 5th Thermal and Fluids Engineering Conference, New Orleans, LA, USA, 5–8 April 2020; pp. 333–341. [Google Scholar] [CrossRef]
  3. Ma, S.; Jang, M.; Tao, P.; Song, C.; Wu, J.; Wang, J.; Deng, T.; Shang, W. Temperature effect and thermal impact in lithium-ion batteries: A review. Prog. Nat. Sci. Mater. Int. 2018, 28, 653–666. [Google Scholar] [CrossRef]
  4. Zhang, F.; Feng, X.; Xu, C.; Jiang, F.; Ouyang, M. Thermal runaway front in failure propagation of long-shape lithium-ion battery. Int. J. Heat Mass Transf. 2022, 182, 121928. [Google Scholar] [CrossRef]
  5. Onda, K.; Kameyama, H.; Hanamoto, T.; Ito, K. Experimental study on heat generation behavior of small lithium-ion secondary batteries. J. Electrochem. Soc. 2003, 150, A285–A291. [Google Scholar] [CrossRef]
  6. Jeon, D.H.; Baek, S.M. Thermal modeling of cylindrical lithium-ion battery during discharge cycle. Energy Convers. Manag. 2011, 52, 2973–2981. [Google Scholar] [CrossRef]
  7. Srinivasan, V.; Wang, C.Y. Analysis of electrochemical and thermal behavior of Li-ion cells. J. Electrochem. Soc. 2003, 150, A98–A106. [Google Scholar] [CrossRef] [Green Version]
  8. Chen, M.; Rincon-Mora, G.A. Accurate electrical battery model capable of predicting runtime and I–V performance. IEEE Trans. Energy Convers. 2006, 21, 504–511. [Google Scholar] [CrossRef]
  9. ANSYS. ANSYS Fluent Battery Module Manual Release 15, November 2013. Available online: https://www.yumpu.com/en/document/read/38452430/ansys-fluent-battery-module-manual (accessed on 4 December 2022).
  10. Thomas, K.E.; Bogatu, C.; Newman, J. Measurement of the entropy of reaction as a function of state of charge in doped and undoped lithium manganese oxide. J. Electrochem. Soc. 2001, 148, A570–A575. [Google Scholar] [CrossRef]
  11. Zhang, Y.; Song, W.; Feng, Z. An energy efficiency evaluation research based on heat generation behavior of lithium-ion battery. J. Electrochem. Soc. 2013, 160, A1927. [Google Scholar] [CrossRef]
  12. Karimi, G.; Li, X. Thermal management of lithium-ion batteries for electric vehicles. Int. J. Energy Res. 2013, 37, 13–24. [Google Scholar] [CrossRef]
  13. He, F.; Li, X.; Ma, L. Combined experimental and numerical study of thermal management of battery module consisting of multiple Li-ion cells. Int. J. Heat Mass Trans. 2014, 72, 622–629. [Google Scholar] [CrossRef]
  14. Nazari, A.; Farhad, S. Heat Generation in Lithium-ion Batteries with different nominal capacities. Appl. Therm. Eng. 2017, 125, 1501–1517. [Google Scholar] [CrossRef]
  15. Lin, C.; Wang, F.; Fan, B.; Ren, S.; Zhang, Y.; Han, L.; Liu, S.; Xu, S. Comparative study on the heat generation behavior of lithium-ion batteries with different cathode materials using accelerating rate calorimetry. Energy Procedia 2017, 42, 3369–3374. [Google Scholar] [CrossRef]
  16. Chen, K. Heat Generation Measurements of Prismatic Lithium Ion Batteries. Master’s Thesis, University of Waterloo, Waterloo, ON, Canada, 2013. [Google Scholar]
  17. Estevez, M.A.P.; Caligiuri, C.; Renzi, M. A CFD thermal analysis and validation of a Li-ion pouch cell under different temperatures conditions. E3S Web Conf. 2021, 238, 09003. [Google Scholar] [CrossRef]
  18. Mahboubi, D.; Gavzan, I.J.; Saidi, M.H.; Ahmadi, N. Developing an electro-thermal model to determine heat generation and thermal properties in a lithium-ion battery. J. Therm. Anal. Calorim. 2022, 147, 12253–12267. [Google Scholar] [CrossRef]
  19. Mevawalla, A.; Panchal, S.; Tran, M.; Fowler, M.; Fraser, R. Mathematical heat transfer modeling and experimental validation of lithium-ion battery considering: Tab and surface temperature, separator, electrolyte resistance, anode-cathode irreversible and reversible heat. Batteries 2020, 6, 61. [Google Scholar] [CrossRef]
  20. Carlos, V.H. Comparative Study of Therr Electrochemical Cell Models for the CFD Simulation of a Battery Module. Bachelor’s Thesis, University Politecnica De Valencia, Valencia, Spain, 2021. [Google Scholar]
  21. Ren, H.; Jia, L.; Dang, C.; Qi, Z. An electrochemical-thermal coupling model for heat generation analysis of prismatic lithium battery. J. Energy Storage 2022, 50, 104277. [Google Scholar] [CrossRef]
Figure 1. Diagram of Equivalent Circuit Model [9].
Energies 16 00264 g001
Figure 2. Experimental setup (a) schematic diagram of battery testing, and (b) test section for cylindrical cell.
Energies 16 00264 g002
Figure 3. Diagram of methodology.
Energies 16 00264 g003
Figure 4. The experimental results of battery temperature and cold water temperature under the controlled condition of 20 °C during the discharging process.
Energies 16 00264 g004
Figure 5. Electrical characteristics of the cylindrical cells with respect to SOC at various temperatures: (a) open-circuit voltage of NMC, (b) cell voltage of NMC, (c) open-circuit voltage of LFP, and (d) cell voltage of LFP.
Energies 16 00264 g005
Figure 6. Internal resistance of the experimental batteries: (a) NMC cylindrical, (b) LFP cylindrical, (c) NMC pouch, (d) LFP pouch, (e) NMC prismatic, and (f) LFP prismatic.
Energies 16 00264 g006
Figure 7. The change in open-circuit voltage of the LFP prismatic cell at 0.6 SOC.
Energies 16 00264 g007
Figure 8. The entropy change of six batteries in various SOCs: (a) NMC cylindrical, (b) LFP cylindrical, (c) NMC pouch, (d) LFP pouch, (e) NMC prismatic, and (f) LFP prismatic.
Energies 16 00264 g008
Figure 9. The experimental results of battery temperature located at three positions (body, negative tab, and positive tab) during the discharge rate of 1C: (a) NMC cylindrical, (b) LFP cylindrical, (c) NMC pouch, (d) LFP pouch, (e) NMC prismatic, and (f) LFP prismatic.
Energies 16 00264 g009
Figure 10. The mesh sensitivity study of NMC cylindrical cell (a) the calculated results of maximum temperature, and (b) skewness quality with respected domain elements.
Energies 16 00264 g010
Figure 11. The validation of simulation with experimental results of the battery surface temperature and cell voltage characteristics: (a) NMC cylindrical, (b) LFP cylindrical, (c) NMC pouch, (d) LFP pouch, (e) NMC prismatic, and (f) LFP prismatic.
Energies 16 00264 g011aEnergies 16 00264 g011b
Figure 12. The prediction of battery surface temperatures using the heat balance equation as compared with the experimental results: (a) NMC cylindrical, (b) LFP cylindrical, (c) NMC pouch, (d) LFP pouch, (e) NMC prismatic, and (f) LFP prismatic.
Energies 16 00264 g012
Table 1. The specification of Li-ion battery cells.
Type of BatteryCylindricalPouchPrismatic
NMCLFPNMCLFPNMCLFP
Nominal capacity (Ah)2.521020625
Nominal voltage (V)3.63.23.73.23.63.2
Cut-off voltage (V)2.752.003.002.52.72.5
Limited charging voltage (V)4.203.654.203.654.13.65
Dimension (mm)R: 18
H: 65
R: 18
H: 65
L: 59
W: 9
H: 156
L: 133
W: 7.8
H: 202
L: 120
W: 10
H: 70
L: 148
W: 26
H: 90
Surface area to capacity ratio (mm2/Ah)37.5546.9322.2829.5034.3315.61
Note: R = radius, H = height, L = length, W = width.
Table 2. Domain elements for simulation model.
Battery TypeAppropriate Domain Elements
NMC cylindrical cell6 × 105
LFP cylindrical cell6 × 105
NMC pouch cell3 × 105
LFP pouch cell4.5 × 105
NMC prismatic cell6 × 105
LPF prismatic cell1.5 × 106
Disclaimer/Publisher’s Note: The statements, opinions and data contained in all publications are solely those of the individual author(s) and contributor(s) and not of MDPI and/or the editor(s). MDPI and/or the editor(s) disclaim responsibility for any injury to people or property resulting from any ideas, methods, instructions or products referred to in the content.

