Article

Substrate Characteristics Fluctuations in Full-Scale Anaerobic Digesters Treating Food Waste at Marginal Organic Loading Rates: A Case Study

1
Department of Energy Engineering, Future Convergence Technology Research Institute, Gyeongsang National University, 33 Dongjin-ro, Jinju 52828, Korea
2
Department of Energy System Engineering, Gyeongsang National University, 33 Dongjin-ro, Jinju 52828, Korea
3
Division of Environmental Science and Engineering, Pohang University of Science and Technology, 77 Cheongam-ro, Pohang 37673, Korea
4
Institute for Convergence Research and Education in Advanced Technology (I-CREATE), Yonsei University, 85 Songdogwahak-ro, Yeonsu-gu, Incheon 21983, Korea
*
Author to whom correspondence should be addressed.
Energies 2022, 15(9), 3471; https://doi.org/10.3390/en15093471
Submission received: 5 April 2022 / Revised: 5 May 2022 / Accepted: 6 May 2022 / Published: 9 May 2022
(This article belongs to the Topic Anaerobic Digestion Processes)

Abstract

:
The design of a full-scale bioprocess is typically based on parameters derived from smaller-scale experiments from a previous study. However, disagreements often occur at up-scaling of waste-to-energy processes due to the fluctuations of the substrate characteristics, etc. Therefore, once a commercial-scale waste digester has been built and operated, it is essential to test if the performance of the process agrees with its design value; during this process, fluctuations might occur in digesters operated at marginal organic loading rates. In this study, triplicate full-scale anaerobic digesters treating food waste were monitored for five months. The digesters, operated at the design feeding ratio, showed increasing volatile fatty acid (VFA) trends (per total alkalinity) due to a 30% higher chemical oxygen demand of the influent, than the design. The organic loading rate was adjusted on a daily basis until a stable performance was observed. Significant shifts of methanogen populations from Methanobacteriales to Methanomicrobiales and Methanosarcinales were observed during the stable operation period.

Graphical Abstract

1. Introduction

Food waste (FW) accounts for one of the largest portions of organic wastes disposed worldwide. More than 600 million tons of FW is discarded annually, accounting for one-fifth to one-third of the food supply chain [1]. Composting and energy recovery are among the sustainable treatment options for FW. Anaerobic digestion (AD) provides a method to reduce environmental footprints of organic pollutants with the production of energy-rich biogas [2]. AD is considered as an attractive option to treat FW, especially in populated regions such as East Asia, due to the high calorific value of FW. However, FW has highly variable levels of easily biodegradable organics, which may cause overloading and/or operational problems for its AD treatment [3]. In the anaerobic food chain, methanogens are responsible for the final methanogenesis step, directly or syntrophically utilizing volatile fatty acids (VFAs) and hydrogen (H2) produced by bacteria. Thus, maintaining the population and the activity of methanogens is critical for the stability of AD performance.
Typically, the design of a full-scale bioprocess is based on biokinetics, hypothesis tests, and optimized parameters such as hydraulic retention time (HRT) and organic loading rate (OLR) from laboratory- and/or pilot-scale studies [4]. Due to its commercial nature and relatively large capital investment, a full-scale bioprocess may undergo adjustments of the operational parameters to avoid failure. For example, both HRT and OLR of a continuous stirred-tank reactor (CSTR) are important parameters for AD. While the two parameters are interrelated, the former governs the washout conditions and the growth rate at steady states, and the latter refers to the nutrient availability and activity of the AD food chain [5]. An adequate range of HRT and OLR could be estimated by modeling, and experiments at smaller-scale. However, errors can arise from: (1) the change and/or fluctuation of substrate characteristics, (2) different rheological properties among scales, and (3) different pretreatment and/or particle size, etc. [4,6]. Therefore, adjustments of the operating conditions are often necessary to find a specific solution for a given full-scale process.
This paper was conducted to test whether empirical adjustment of the operating conditions can lead to a stable operation of FW AD when the substrate characteristics vary significantly. Between HRT and OLR, keeping a stable OLR was prioritized, leaving HRT varying with respect to substrate characteristics fluctuations. A full-scale AD plant treating FW was monitored for this purpose. While a mild instability was observed initially, the process was stably operated in the longer-term, suggesting that the proposed operation strategy was successful.

2. Materials and Methods

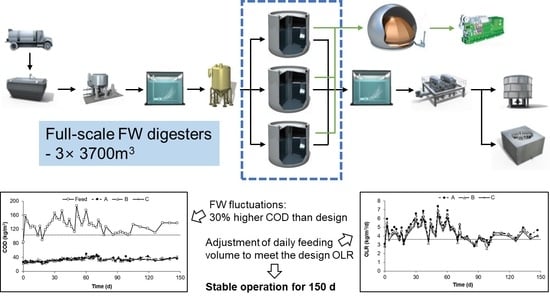
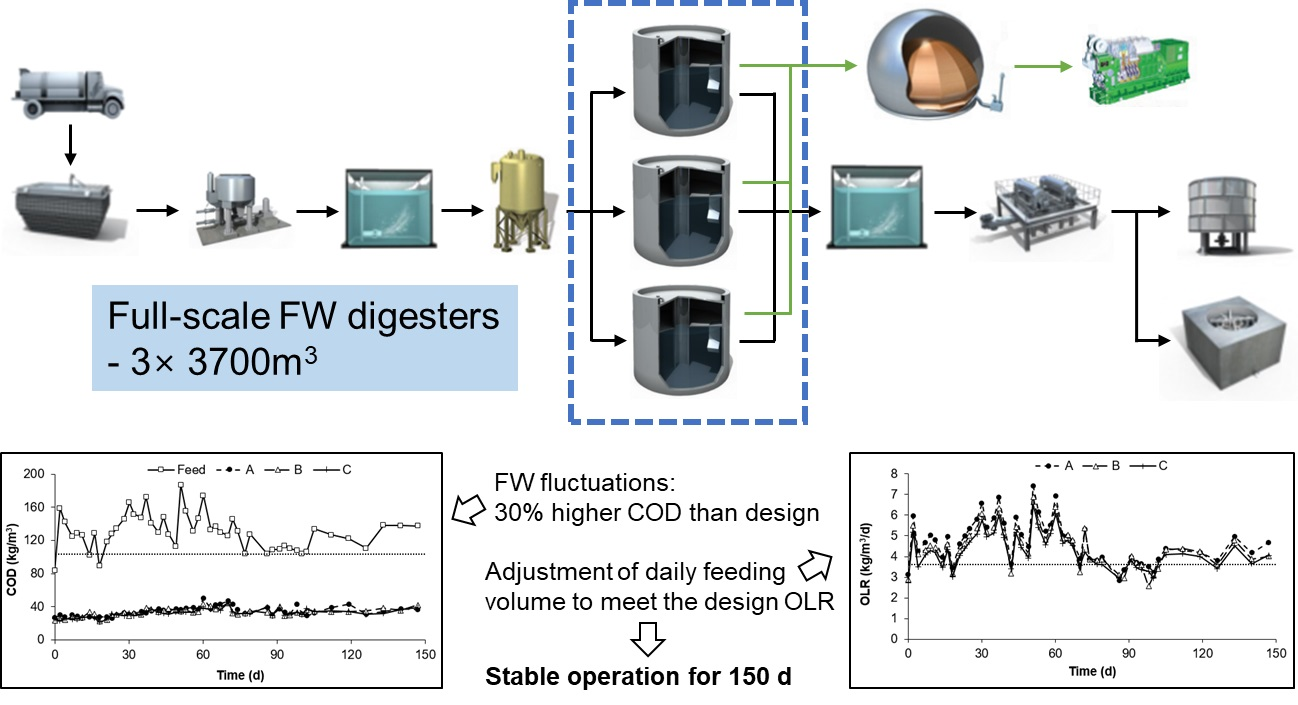
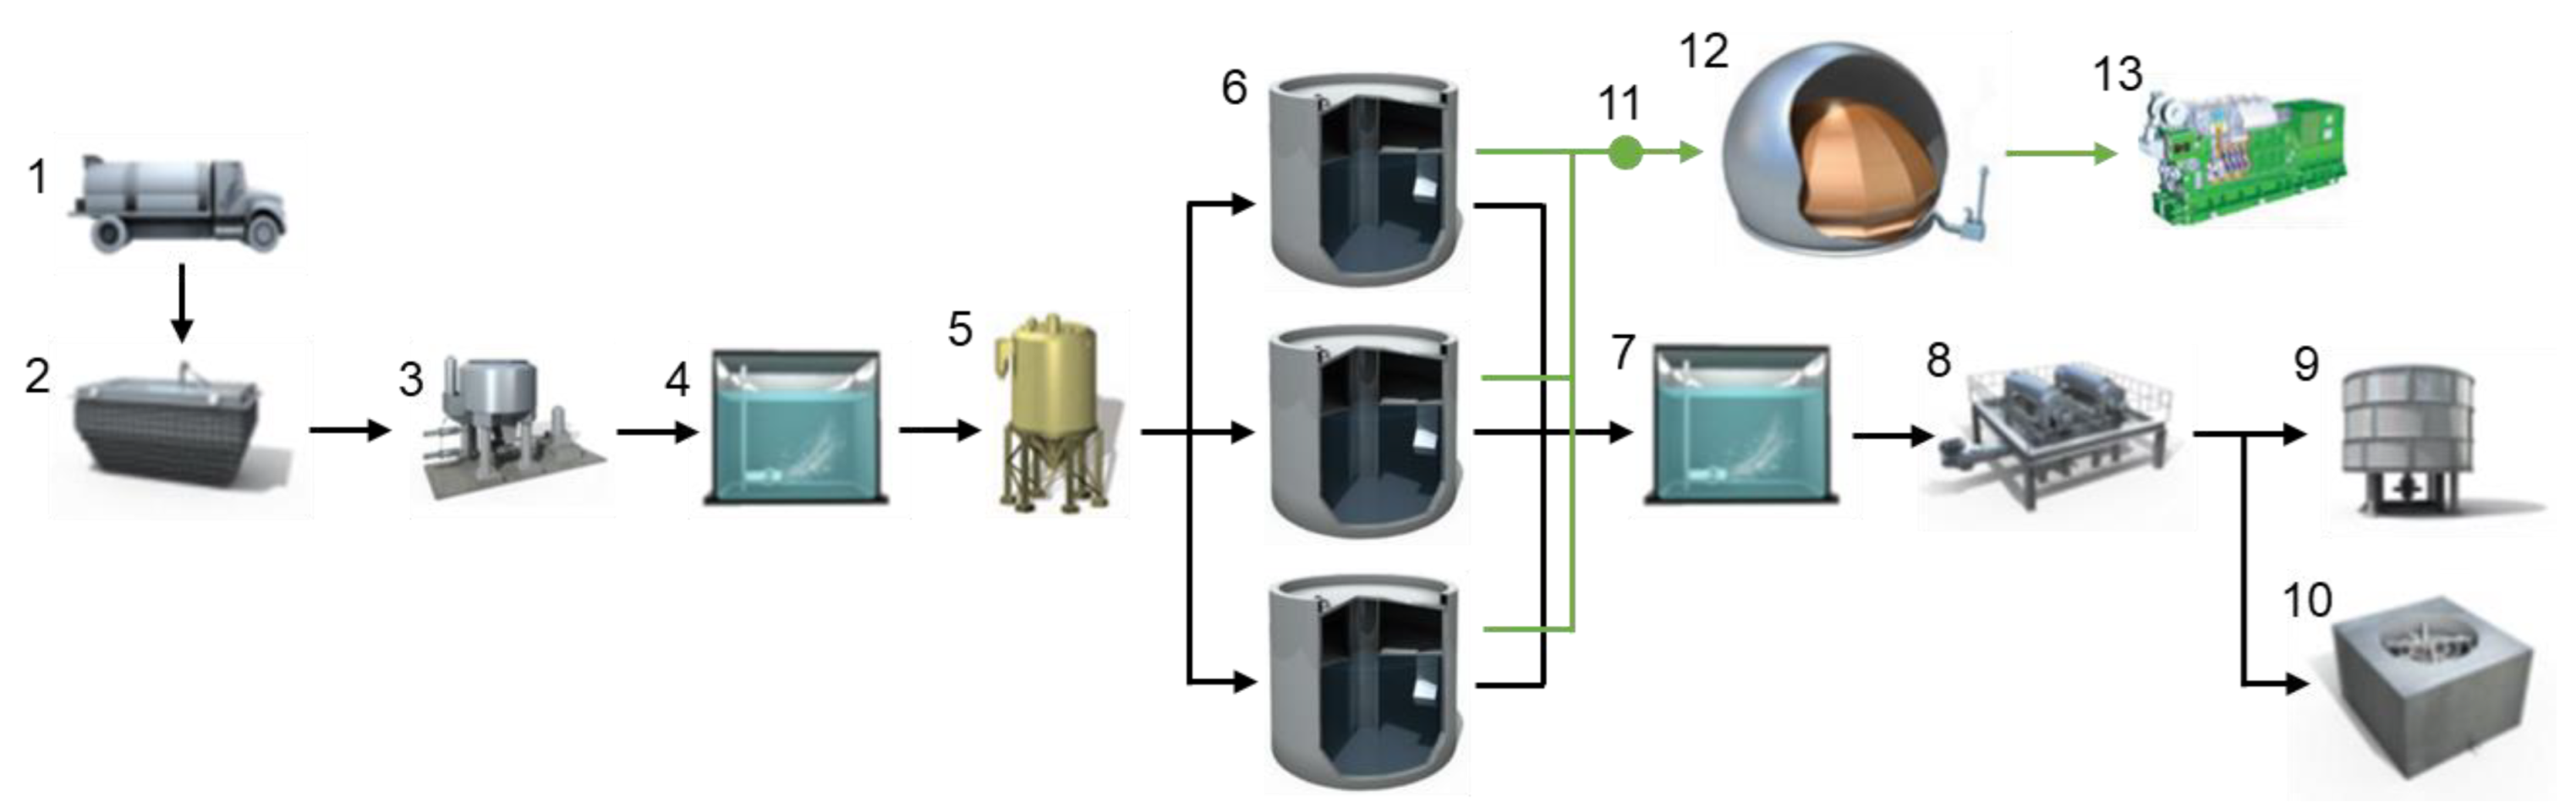
2.1. Operation and Monitoring of the Full-Scale Anaerobic Digesters

The full-scale digesters treated approximately 250 tons of local FW daily in Goyang, South Korea. The fresh FW, with total solids (TS) of 15–20%, was screened for impurities, mixed with water, and pre-acidified for 2.5 d in a mesophilic (37 °C) CSTR before fed into the triplicate digesters (A, B, and C; Figure 1). The digesters were operated at 37 °C with a recirculation heating system. The digesters were semi-continuously fed 16 times per day, at which time pressurized biogas held inside the digester was used to mix the fluid. Each digester was a CSTR with a working volume of 3700 m3 and a design feeding volume of 136 m3/d, therefore a HRT of 27.2 d. The design chemical oxygen demand (COD), TS, and volatile solids (VS) values were 100, 75, and 60 kg/m3, respectively (Table 1); consequently, the design OLR was 3.7 kg COD/m3/d.
Feeding amount and the gross (A, B, and C summed) biogas production volume were recorded online; the biogas production volume of individual digesters was not separately monitored due to lack of instrumentation. Methane (CH4) composition in the biogas was monitored daily with a portable gas meter (SA-Multi3, Shi’An, China). Approximately one-liter samples were taken from the communal influent and the individual (A, B, and C) recirculation heating lines three times a week. Each sample was taken twice with a 12 h interval and pooled before analysis.

2.2. Physicochemical Analyses

COD, TS, and VS were measured according to standard methods [7] to estimate the overall feedstock strength and the digestion efficiency. Soluble COD, a parameter to estimate the solubilization efficiency, was measured using samples filtered through 0.45 μm syringe filters. The pH is a core parameter governing the biochemical activities and was measured using a benchtop pH meter (Cole Parmer, Vernon Hills, IL, USA). Total alkalinity (TA) indicates the resistance of the liquor to acid addition or production; TA was analyzed using a TitroLine 5000 instrument (SI Analytics, Mainz, Germany) by titrating down to pH 4.3. Ethanol and VFA (C2–C6) concentrations were quantified using a gas chromatograph (6890 plus, Agilent, Palo Alto, CA, USA) equipped with an Innowax capillary column (Agilent, USA) and a flame ionization detector [3]. These parameters reflect the balance between the acidogenic and the acid-consuming, such as the methanogenesis, activities. Total Kjeldahl nitrogen (TKN) and total ammonia nitrogen (TAN) concentrations were measured using the Kjeldahl method [7]. Organic nitrogen was estimated as the difference between TKN and TAN; for 1 g of organic nitrogen, 6.25 g of proteins was assumed. The carbohydrate concentration was measured using the phenol–sulfuric acid method [3]. The lipids concentration was analyzed using the gravimetric method following extraction of lipids by solvent (chloroform: methanol, 1:2 v/v) [3]. Proteins, carbohydrates, and lipids are among the major organic constituents of FW [8]. All physicochemical analyses were conducted in duplicate.

2.3. Real-Time Polymerase Chain Reaction (PCR)

For each digester sample, a 0.2 mL sub-sample was centrifuged twice and the supernatant was removed each time to minimize concentrations of possible PCR inhibitors and DNA from cell debris. Total DNA was extracted using an automated nucleic acid extractor (Magtration System 12GC, Precision System Science, Matsudo, Japan). The purified DNA was eluted with nuclease-free water and stored at −20 °C. All extractions were carried out in duplicate.
Real-time PCR was performed using a LightCycler 480 (Roche, Basel, Switzerland) as described previously [9]. The primer and probe sets used in this study target the domain Archaea (ARC) and the methanogenic orders Methanobacteriales (MBT), Methanococcales (MCC), Methanomicrobiales (MMB), and Methanosarcinales (MSL) [10]. The 20 µL reaction mixture contained 10 µL of the master mix in LightCycler 480 Probes Master kit (Roche), 5 µL of PCR-grade water, 1 µL each of primer (final concentration 500 nM), 1 µL of the TaqMan probe (final concentration 100 nM), and 2 µL of template DNA.

3. Results

3.1. FW Characteristics

The influent FW contained high levels of organics as represented by COD and VS (Table 1). Interestingly, while the experimental TS (72.7 ± 7.3 kg/m3) and VS (58.6 ± 7.3 kg/m3) values were similar to the design values (75 and 60), there was a 30% gap between the measured (130.1 ± 21.4 kg/m3) and the design (100) values for COD. This was due to the discrepancy in the COD/VS ratios assumed for the design (i.e., 1.67 kg COD/kg VS) and obtained from the measurements (i.e., 2.22 kg COD/kg VS). The carbohydrates, proteins, and lipids accounted for 16.7%, 30.1%, and 31.3% of the VS in the influent FW, respectively; the sum of the three organic categories including lipids constituted 78.1% of the VS. The influent FW was partially acidified, as evidenced by low pH (4.3 ± 0.5) and high ethanol and VFA concentrations (Table 1). These results were similar to the characteristics of FW and FW derivatives (i.e., food waste-recycling wastewater) reported previously [8,11].

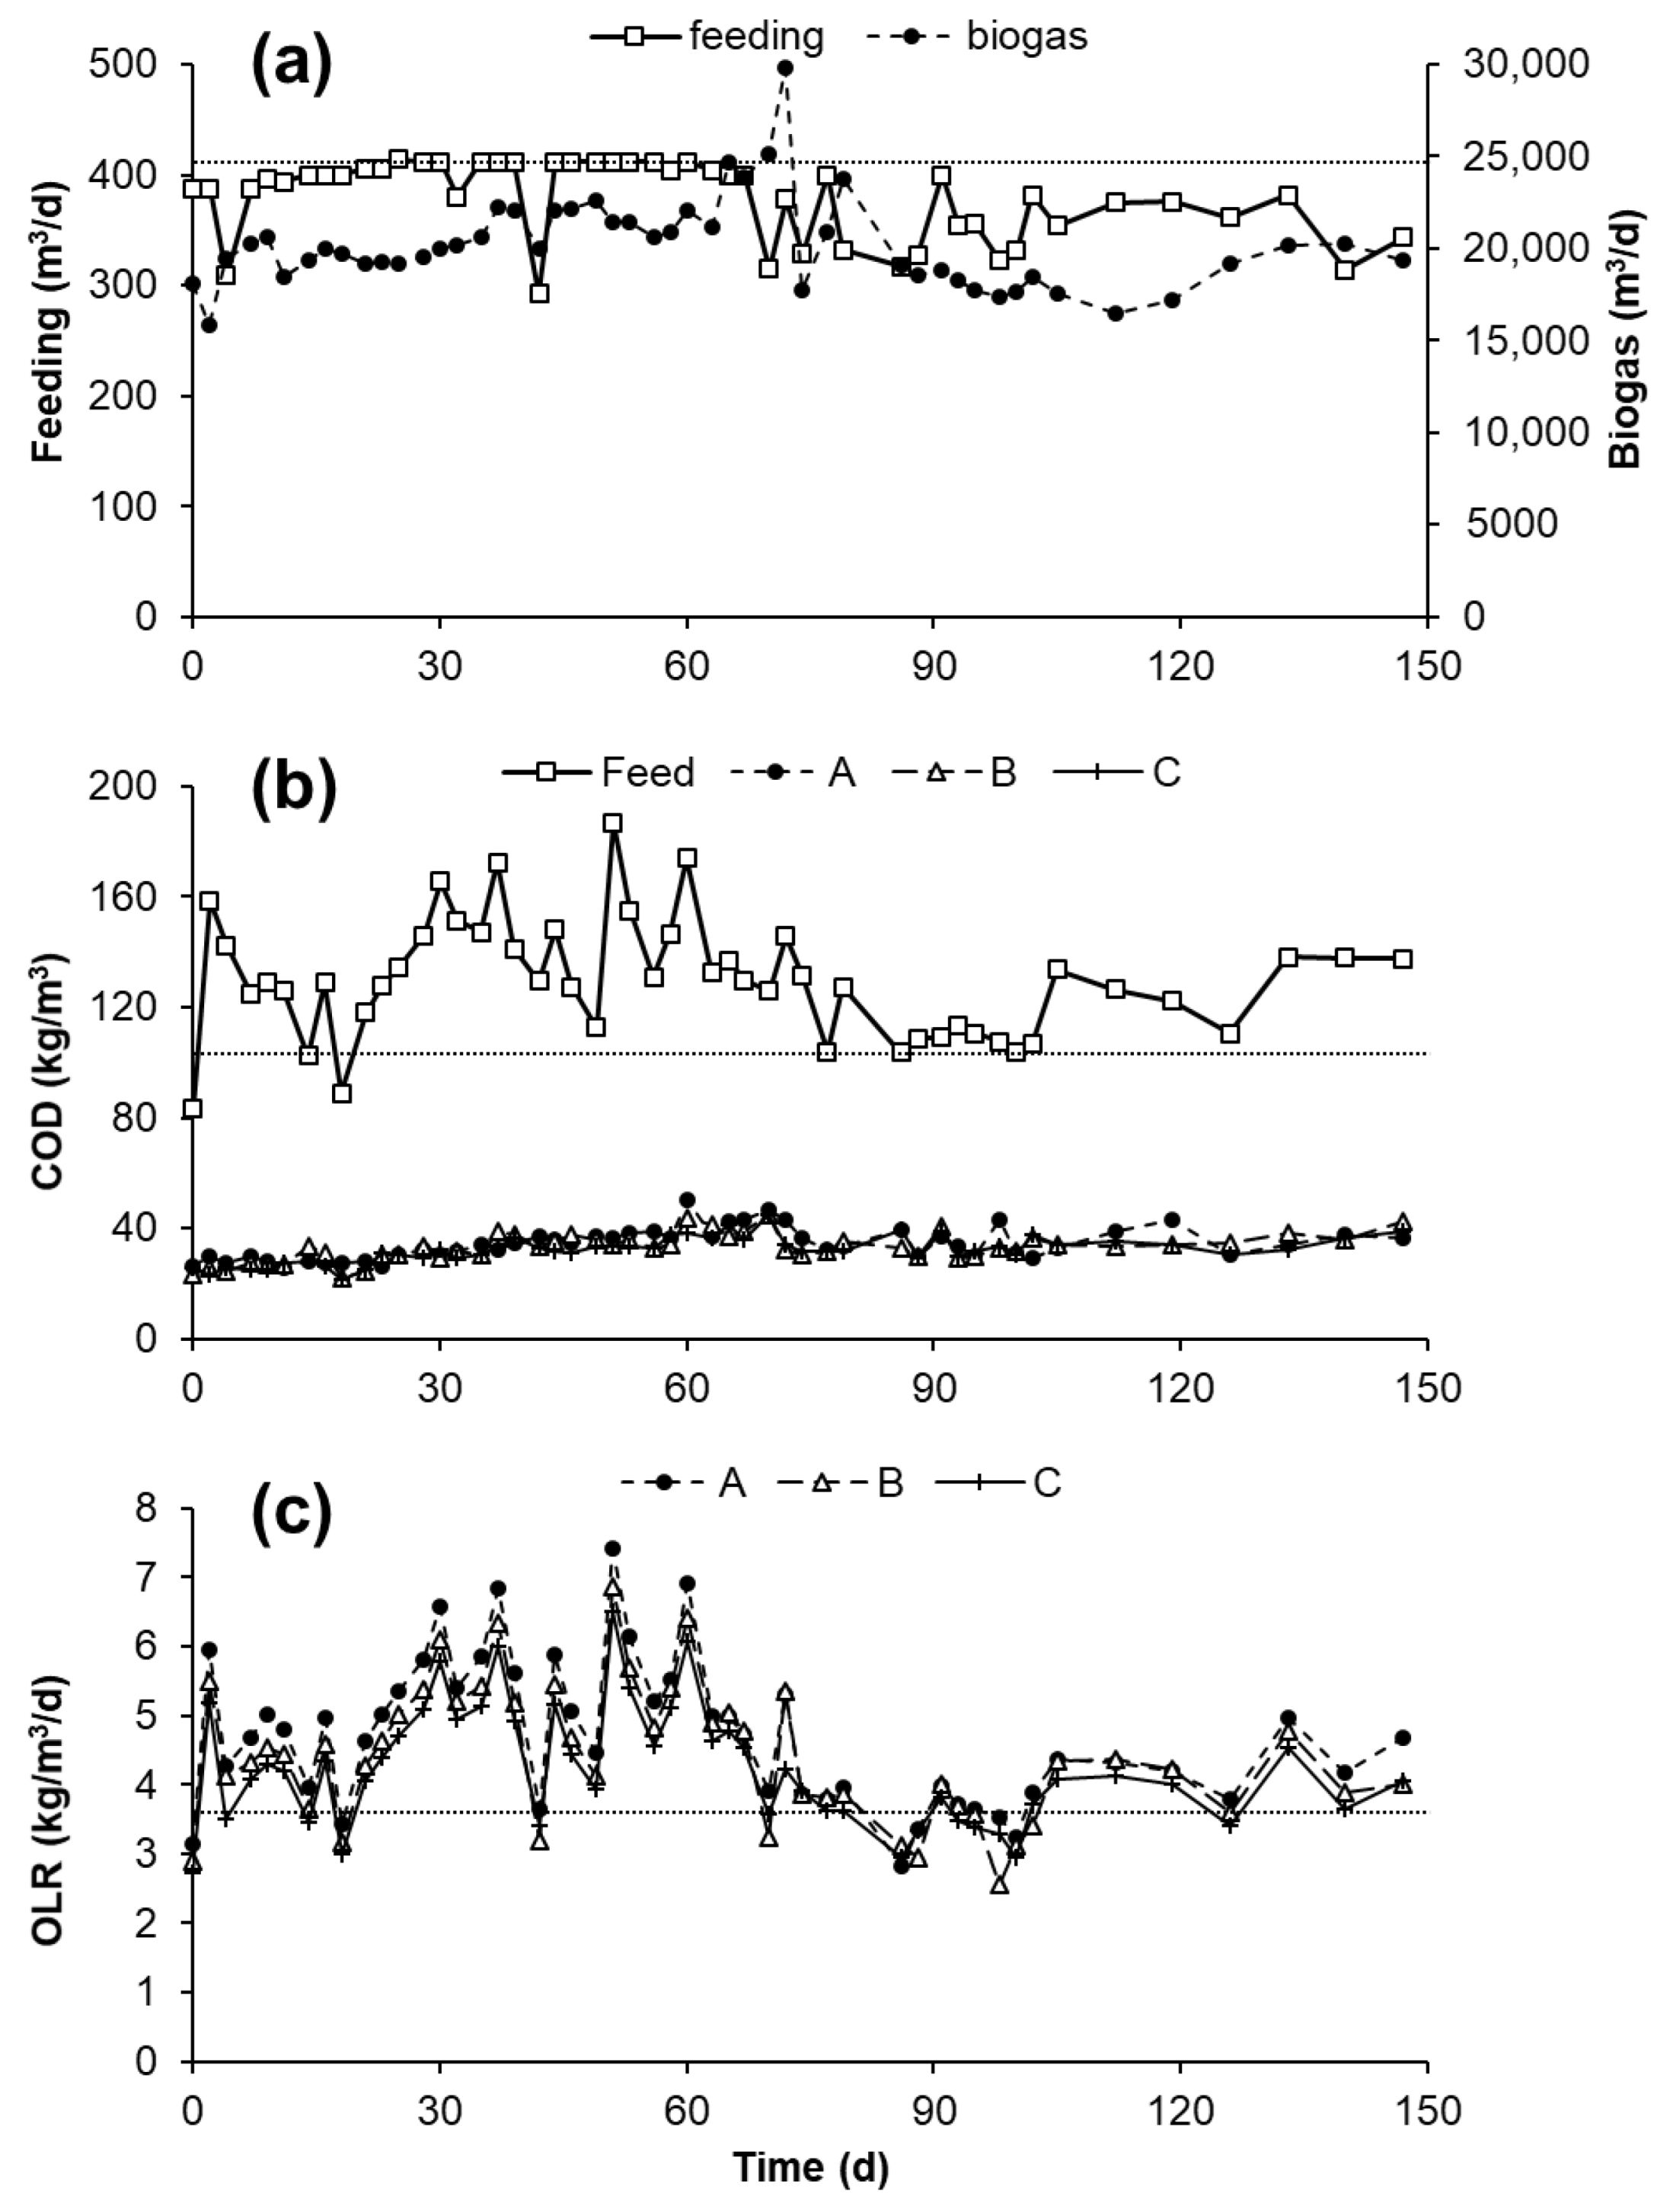
3.2. Digester Operation and Parameter Adjustments

Before 0 d, the three FW digesters were at a startup period with a stepwise increase in the daily feeding volume (data not shown). In this study, the digesters were monitored for 147 d until a stable performance was observed (Figure 2 and Figure 3). During the first 60 d, the daily feeding volume started as 95% and reached the design value (i.e., 136 m3/digester/d or 27.2 d HRT) (Figure 2a). Due to the higher influent COD than the design (Figure 2b), the average OLR was 4.9 kg COD/m3/d, 33% higher than the design OLR of 3.7 kg COD/m3/d (Figure 2c). During this period, the average COD removal efficiency, pH, and TA were respectively 75.9–77.7%, 7.6–7.7, and 10.5–10.7 kg CaCO3/m3 for the three digesters (Figure 2b and Figure 3a,b). Although these process indicators were within the range for untroubled AD performance [4], they showed clear decreasing trends until 60 d. Similarly, VFAs in the digesters increased up to 5 kg/m3 during this period (Figure 3c). The VFA concentration and VFA/TA (also referred to as FOS/TAC) ratio are regarded as key indicators of AD stability; the VFA/TA ratio increased to 0.43, which was above the reported criterion of 0.3 for stable reactor operation [12,13].
Due to the increasing trends of VFA and VFA/TA values, the feeding volume for the digesters were temporarily reduced to 80% of their design during 41–42 d, corresponding to a temporary drop of OLR to 3.4 kg COD/m3/d (Figure 2a,c). At this point, TA recovered from 9.7 to 10.9 kg CaCO3/m3 and VFA decreased from 3.7 to 2.5 kg/m3 (Figure 3b,c). After 63 d, the design parameters were reconsidered and the feeding volume was adjusted on a daily basis until 147 d (Figure 2a). During 105–147 d, the OLR was maintained at 4.2 ± 0.5 kg COD/m3/d and stable VFA and VFA/TA were achieved (Figure 2c and Figure 3b,c). Therefore, this OLR range was assumed as the marginal OLR applicable to this system. The corresponding feeding volume was 120 ± 16 m3/digester/d at 27.7–35.1 d HRT using the averaged FW strength. However, the actual feeding amount must be calculated based on the daily COD concentration of the FW influent.
Biogas production from the three digesters were collectively recorded as 20,200 ± 2500 m3/d throughout the study (Figure 2a). The average CH4 content was 63.3%, corresponding to CH4 yield of 0.27 ± 0.05 m3 CH4/kg CODadded. Carbohydrates, proteins, and lipids removal efficiencies were kept relatively stable during the experiment (data not shown). The average removal efficiencies were 78.7 ± 8.3% (carbohydrates), 53.9 ± 9.9% (proteins), and 79.8 ± 3.9% (lipids). The TAN in the digesters were at 2.0 ± 0.1 kg/m3 (data not shown).

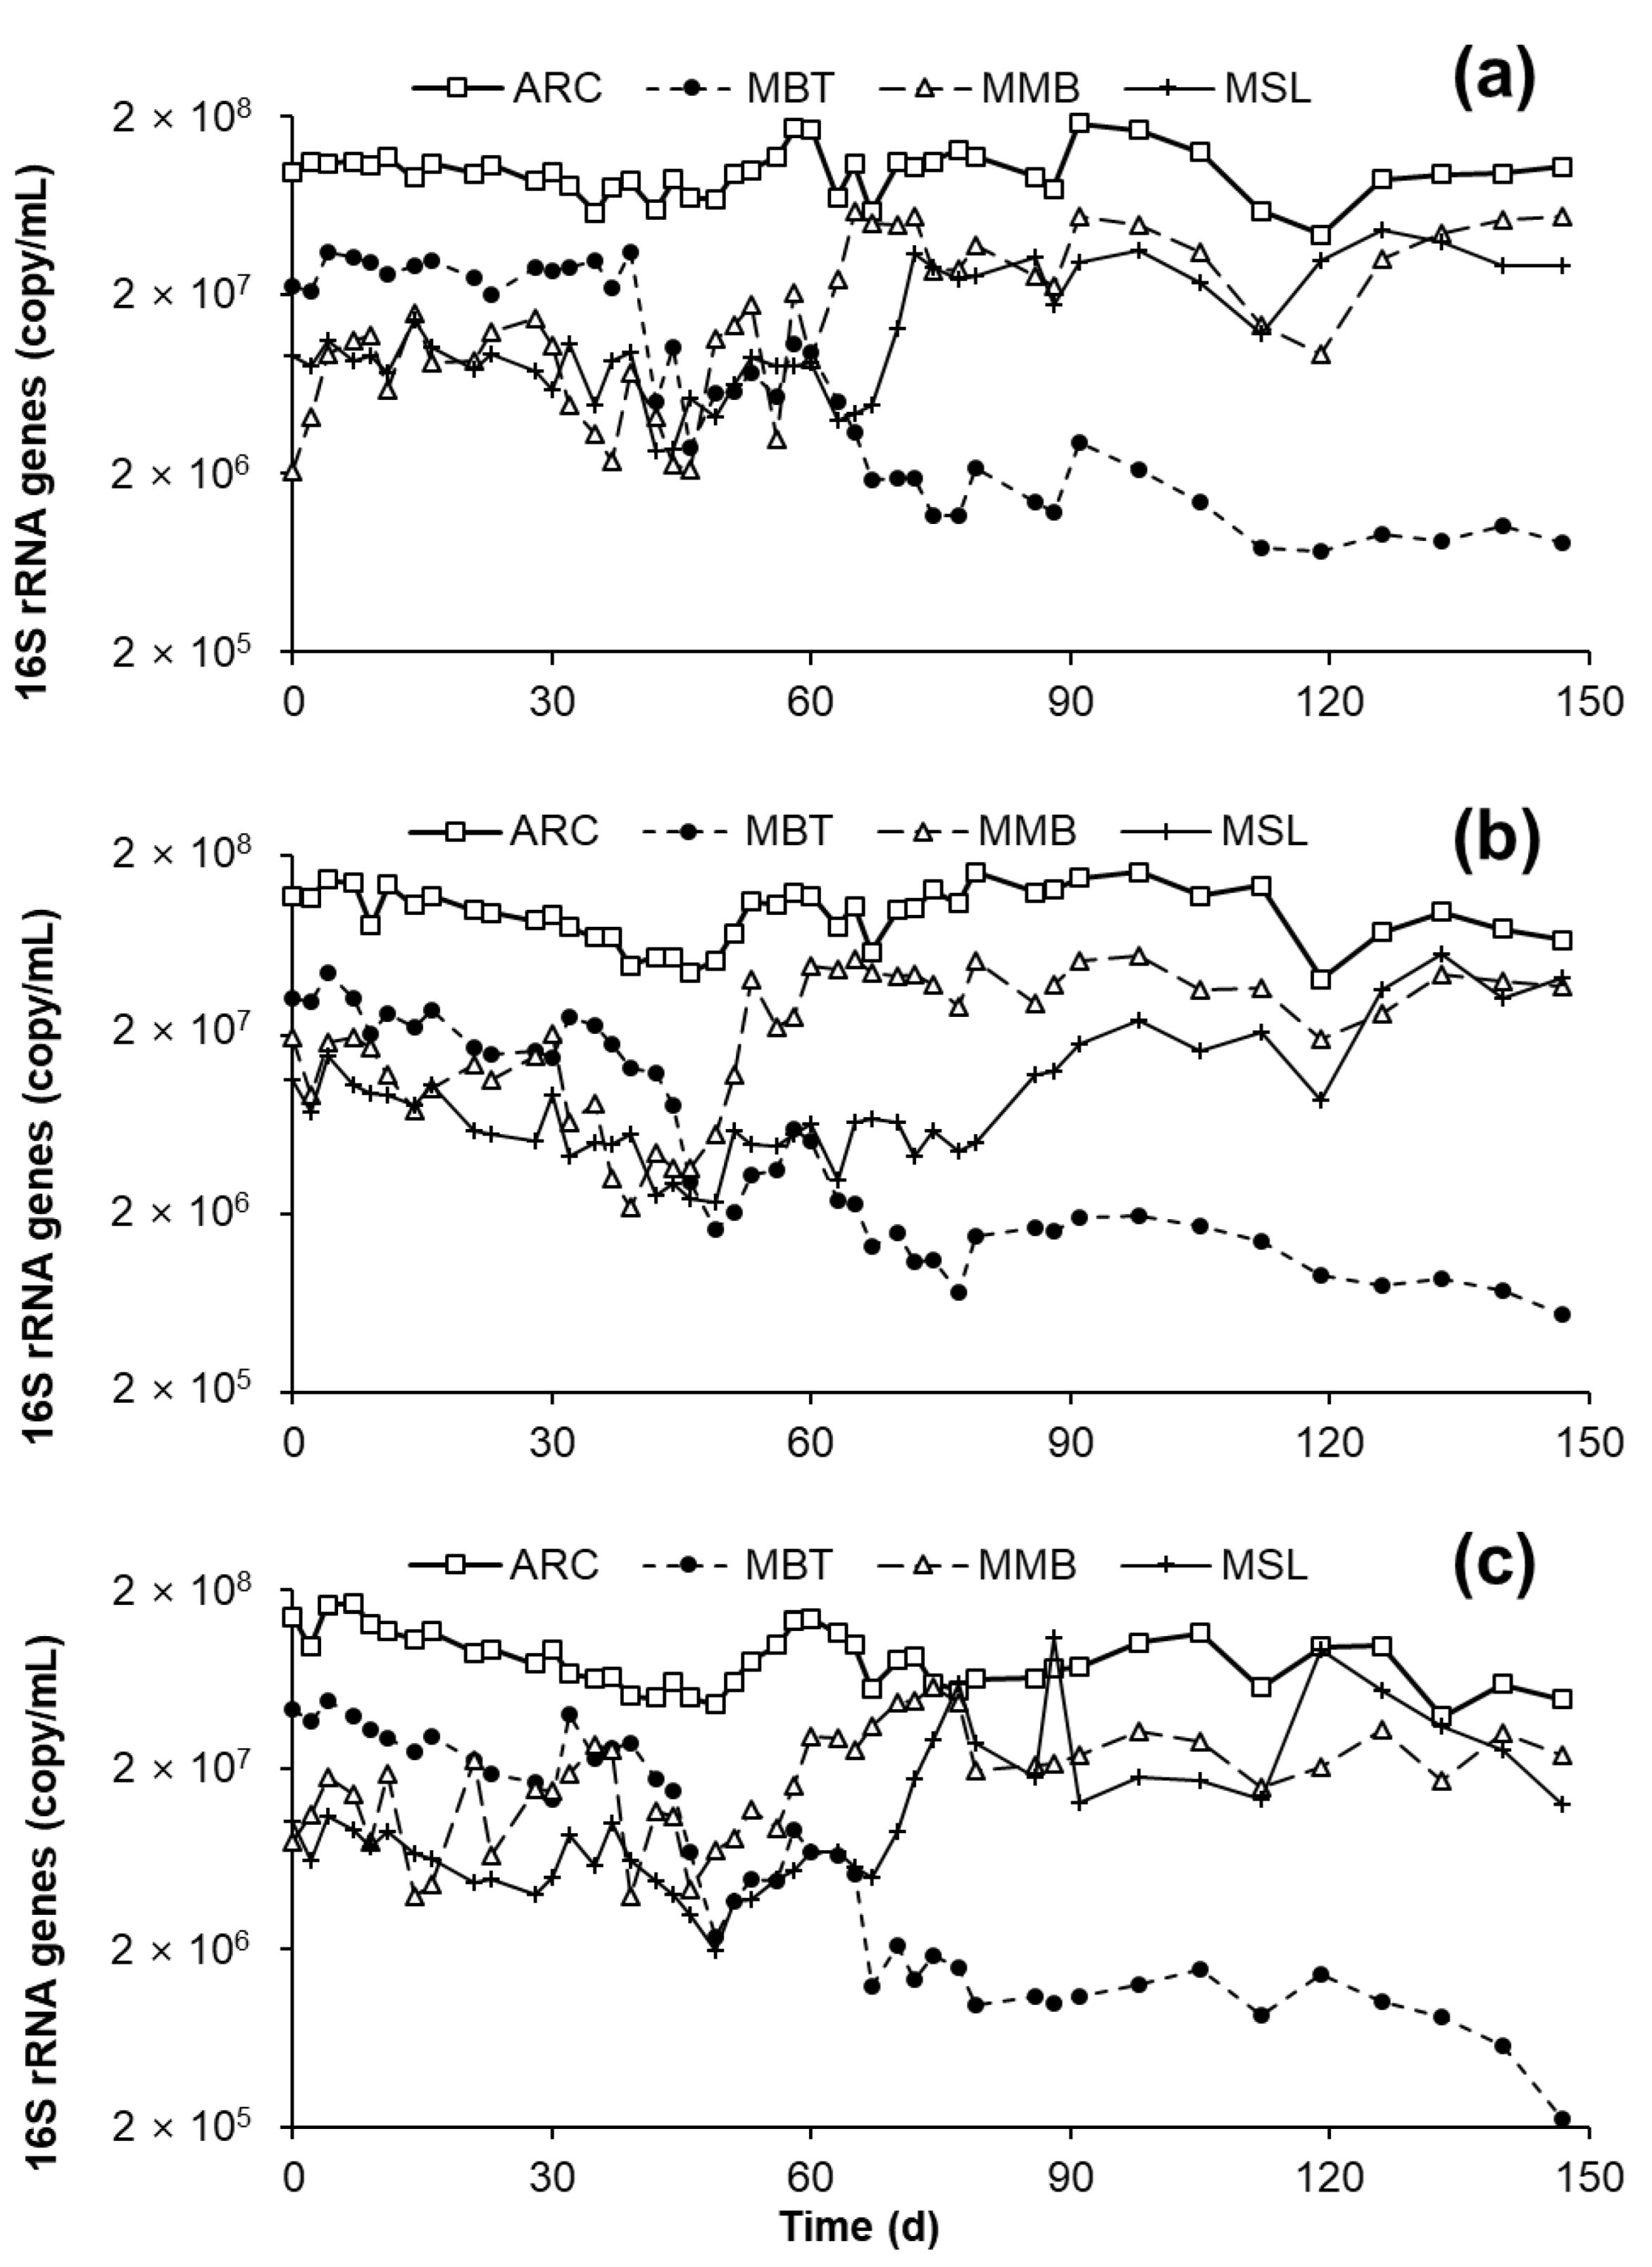
3.3. Methanogen Population Shift

Methanogen populations were quantified using real-time PCR (Figure 4). The ARC population was relatively stable throughout the study. However, significant shifts were observed from MBT to MMB and MSL in all three digesters. MBT was the most abundant methanogen order at 0 d; however, MBT population decreased more than one degree of magnitude between 30 and 75 d. After 75 d, MMB and MSL were identified as the major methanogen orders, while the proportion of MBT became <3%. MCC was not detected in this study.

4. Discussion

The FW digesters in this study experienced a mild (VFA up to 5 kg/m3) but consistent increase in VFA and VFA/TA values during the operation (Figure 3b,c). Fluctuation of OLR was attributable to this trend; between the OLR and the acetate, a Pearson correlation constant r of 0.32 (p value 0.002) and a Spearman rank correlation constant ρ of 0.34 (p value < 0.001) were calculated; between the OLR and the total VFA, r of 0.21 (p value 0.04) and ρ of 0.23 (p value 0.02) were derived. These results confirm that OLR is a critical factor influencing the VFA level, because OLR determines the overall mass flow in anaerobiosis [14]. Initially, the plant operation was guided to meet the design feeding volume of 136 m3/digester/d. However, the influent FW contained constantly higher COD level (130.1 ± 21.4 kg/m3; Table 1) than the design, resulting in the increase in OLR up to 7.4 kg COD/m3/d (Figure 2c). The COD/VS ratio observed from the influent (2.22 kg COD/kg VS) was similar to the COD/VS values reported previously for FW (1.78–1.88; average 1.83) [15] and processed FW (1.21–3.16; average 1.88) [8]. The high COD/VS ratios of the influent in this study can be attributable to the high lipids content (31.3% VS; Table 1), because lipids represent higher energy density than carbohydrates and proteins [16].
The VFA/TA (FOS/TAC) ratio has been widely used to evaluate the conditions of AD bioreactors [17]. A VFA/TA ratio below 0.3 is generally accepted as an indicator for a stable digester, and above 1.0 as an alarm for instability [12]. Between these values remains as a grey area; however, an increasing trend should be regarded as a clear warning. In this study, a decrease in OLR (approximately below 4.2 kg COD/m3/d) reversed the increasing VFA/TA trend (Figure 2c and Figure 3b,c). Therefore, delicate monitoring of both feeding ratio and the influent strength (and thus the OLR) would be beneficial to ensure stable, long-term AD operation.
Among the four steps (hydrolysis, acidogenesis, acetogenesis, and methanogenesis) of the AD food chain, the former two are responsible for the production of VFAs while the latter two for the degradation of VFAs (except acetogenesis to produce acetate). In AD of solid wastes with enzymatically resistant structures, such as waste activated sludge, the rate-limiting step is typically the hydrolysis step [18]. In contrast, FW is relatively an easily biodegradable substrate, in which case methanogenesis could be the key pathway because methanogens are slow-growing and susceptible to environmental conditions [19]. In this study, the initially MBT-rich methanogen populations have undergone significant shifts to MMB- and MSL-dominant ones (Figure 4). Although members of MBT have been isolated from different environments [20], MBT population in some AD processes has been reported as minor populations [9,21] and even insignificant to the process [22]. MMB and MSL are often claimed as dominant methanogens in AD of FW [23], sewage sludge [24], and agricultural wastes [25]. The increase in VFAs could be partly responsible for this shift because acetate could be directly utilized by members of MSL; however, a further study is required to elucidate this point.

5. Conclusions

The FW digesters operated at the design feeding ratio (or 27.2 d HRT) showed increasing VFA and VFA/TA trends due to a 30% higher COD strength of the influent than the design. The OLR was adjusted on a daily basis and a stable performance was observed at 4.2 ± 0.5 kg COD/m3/d with 27.7–35.1 d HRT. While the overall ARC population was relatively stable, significant shifts of methanogen populations from MBT to MMB and MSL were observed during the stable operation period. These results suggest that maintaining an adequate OLR level should be prioritized over keeping the design HRT when the substrate characteristics fluctuate. Considering that the characteristics of the waste feedstock such as FW likely deviate in practice, keeping enough safety factor for operating parameters would be appropriate. Finally, providing a rapid method for on-site determination of the substrate and the digestate characteristics can help make decisions against system instability.

Author Contributions

Conceptualization, S.H. methodology, S.G.S. and S.H.P.; formal analysis, S.G.S.; investigation, S.G.S. and S.H.P.; writing—original draft preparation, S.G.S.; writing—review and editing, all authors; supervision, S.H.; funding acquisition, S.H. All authors have read and agreed to the published version of the manuscript.

Funding

This work was supported by Korea Institute of Energy Technology Evaluation and Planning (KETEP) and the Ministry of Trade, Industry and Energy (MOTIE) of the Republic of Korea (No. 20183010092790). This research was also supported by the Korea Ministry of Environment as Waste to Energy Recycling Human Resource Development Project (No. YL-WE-21-002).

Institutional Review Board Statement

Not applicable.

Informed Consent Statement

Not applicable.

Conflicts of Interest

The authors declare no conflict of interest.

References

  1. Jeon, D.; Chung, K.; Shin, J.; Min Park, C.; Shin, S.G.; Mo Kim, Y. Reducing food waste in residential complexes using a pilot-scale on-site system. Bioresour. Technol. 2020, 311, 123497. [Google Scholar] [CrossRef] [PubMed]
  2. Shin, S.G.; Lee, J.; Do, T.H.; Kim, S.I.; Hwang, S. Application of response surface analysis to evaluate the effect of concentrations of ammonia and propionic acid on acetate-utilizing methanogenesis. Energies 2019, 12, 3394. [Google Scholar] [CrossRef] [Green Version]
  3. Han, G.; Shin, S.G.; Lee, J.; Shin, J.; Hwang, S. A comparative study on the process efficiencies and microbial community structures of six full-scale wet and semi-dry anaerobic digesters treating food wastes. Bioresour. Technol. 2017, 245, 869–875. [Google Scholar] [CrossRef]
  4. Speece, R.E. Anaerobic Biotechnology for Industrial Wastewaters, 1st ed.; Archae Press: Nashville, TN, USA, 1996. [Google Scholar]
  5. Batstone, D.J.; Keller, J.; Angelidaki, I.; Kalyuzhnyi, S.V.; Pavlostathis, S.G.; Rozzi, A.; Sanders, W.T.M.; Siegrist, H.; Vavilin, V.A. The IWA Anaerobic Digestion Model No 1 (ADM 1). Water Sci. Technol. 2002, 45, 65–73. [Google Scholar] [CrossRef] [PubMed]
  6. Lindmark, J.; Thorin, E.; Bel Fdhila, R.; Dahlquist, E. Effects of mixing on the result of anaerobic digestion: Review. Renew. Sustain. Energy Rev. 2014, 40, 1030–1047. [Google Scholar] [CrossRef]
  7. Eaton, A.D.; Clesceri, L.S.; Greenberg, A.E. Standard Methods for the Examination of Water and Wastewater, 21st ed.; American Public Health Association: Washington, DC, USA, 2005; pp. 2–56. [Google Scholar]
  8. Shin, S.G.; Han, G.; Lee, J.; Cho, K.; Jeon, E.-J.; Lee, C.; Hwang, S. Characterization of food waste-recycling wastewater as biogas feedstock. Bioresour. Technol. 2015, 196, 200–208. [Google Scholar] [CrossRef] [PubMed]
  9. Koo, T.; Shin, S.G.; Lee, J.; Han, G.; Kim, W.; Cho, K.; Hwang, S. Identifying methanogen community structures and their correlations with performance parameters in four full-scale anaerobic sludge digesters. Bioresour. Technol. 2017, 228, 368–373. [Google Scholar] [CrossRef]
  10. Yu, Y.; Lee, C.; Kim, J.; Hwang, S. Group-specific primer and probe sets to detect methanogenic communities using quantitative real-time polymerase chain reaction. Biotechnol. Bioeng. 2005, 89, 670–679. [Google Scholar] [CrossRef]
  11. Zhang, R.; El-Mashad, H.M.; Hartman, K.; Wang, F.; Liu, G.; Choate, C.; Gamble, P. Characterization of food waste as feedstock for anaerobic digestion. Bioresour. Technol. 2007, 98, 929–935. [Google Scholar] [CrossRef]
  12. Biernacki, P.; Steinigeweg, S.; Borchert, A.; Uhlenhut, F. Application of Anaerobic Digestion Model No. 1 for describing anaerobic digestion of grass, maize, green weed silage, and industrial glycerine. Bioresour. Technol. 2013, 127, 188–194. [Google Scholar] [CrossRef]
  13. Li, L.; He, Q.; Wei, Y.; He, Q.; Peng, X. Early warning indicators for monitoring the process failure of anaerobic digestion system of food waste. Bioresour. Technol. 2014, 171, 491–494. [Google Scholar] [CrossRef] [PubMed]
  14. Batstone, D.J. Anaerobic Digestion Model No. 1, 1st ed.; IWA Publishing: London, UK, 2002. [Google Scholar]
  15. Jang, H.M.; Lee, J.W.; Ha, J.H.; Park, J.M. Effects of organic loading rates on reactor performance and microbial community changes during thermophilic aerobic digestion process of high-strength food wastewater. Bioresour. Technol. 2013, 148, 261–269. [Google Scholar] [CrossRef] [PubMed]
  16. Sophonsiri, C.; Morgenroth, E. Chemical composition associated with different particle size fractions in municipal, industrial, and agricultural wastewaters. Chemosphere 2004, 55, 691–703. [Google Scholar] [CrossRef] [PubMed]
  17. Scano, E.A.; Asquer, C.; Pistis, A.; Ortu, L.; Demontis, V.; Cocco, D. Biogas from anaerobic digestion of fruit and vegetable wastes: Experimental results on pilot-scale and preliminary performance evaluation of a full-scale power plant. Energy Convers. Manag. 2014, 77, 22–30. [Google Scholar] [CrossRef]
  18. Kavitha, S.; Rajesh Banu, J.; Subitha, G.; Ushani, U.; Yeom, I.T. Impact of thermo-chemo-sonic pretreatment in solubilizing waste activated sludge for biogas production: Energetic analysis and economic assessment. Bioresour. Technol. 2016, 219, 479–486. [Google Scholar] [CrossRef]
  19. Demirel, B.; Scherer, P. The roles of acetotrophic and hydrogenotrophic methanogens during anaerobic conversion of biomass to methane: A review. Rev. Environ. Sci. Biotechnol. 2008, 7, 173–190. [Google Scholar] [CrossRef]
  20. Garrity, G.M. Bergey’s Manual of Systematic Bacteriology; Springer: New York, NY, USA, 2005. [Google Scholar]
  21. Klocke, M.; Nettmann, E.; Bergmann, I.; Mundt, K.; Souidi, K.; Mumme, J.; Linke, B. Characterization of the methanogenic Archaea within two-phase biogas reactor systems operated with plant biomass. Syst. Appl. Microbiol. 2008, 31, 190–205. [Google Scholar] [CrossRef]
  22. Cho, K.; Shin, S.G.; Kim, W.; Lee, J.; Lee, C.; Hwang, S. Microbial community shifts in a farm-scale anaerobic digester treating swine waste: Correlations between bacteria communities associated with hydrogenotrophic methanogens and environmental conditions. Sci. Total Environ. 2017, 601–602, 167–176. [Google Scholar] [CrossRef]
  23. Jang, H.M.; Kim, J.H.; Ha, J.H.; Park, J.M. Bacterial and methanogenic archaeal communities during the single-stage anaerobic digestion of high-strength food wastewater. Bioresour. Technol. 2014, 165, 174–182. [Google Scholar] [CrossRef]
  24. Kobayashi, T.; Yasuda, D.; Li, Y.-Y.; Kubota, K.; Harada, H.; Yu, H.-Q. Characterization of start-up performance and archaeal community shifts during anaerobic self-degradation of waste-activated sludge. Bioresour. Technol. 2009, 100, 4981–4988. [Google Scholar] [CrossRef]
  25. Nettmann, E.; Bergmann, I.; Pramschüfer, S.; Mundt, K.; Plogsties, V.; Herrmann, C.; Klocke, M. Polyphasic analyses of methanogenic archaeal communities in agricultural biogas plants. Appl. Environ. Microbiol. 2010, 76, 2540–2548. [Google Scholar] [CrossRef] [PubMed] [Green Version]
Figure 1. The schematic diagram of the system. 1, FW transportation; 2, FW storage tank; 3, pretreatment system to remove indigestible parts and to add some water; 4, storage tank; 5, pre-acidification tank; 6, triplicate digesters; 7, digestate storage tank; 8, solid-liquid separator; 9, composter; 10, wastewater treatment system; 11, gas flowmeter; 12, biogas storage tank; 13, biogas purification and utilization system. Black and green arrows indicate mass and gas flows, respectively.
Energies 15 03471 g001
Figure 2. Profiles of selected operational parameters for the full-scale digesters: (a) daily feeding and biogas production, (b) chemical oxygen demand (COD), and (c) organic loading rate (OLR). Dotted lines represent design values for daily feeding, input COD, and OLR.
Energies 15 03471 g002
Figure 3. Profiles of selected indicator parameters for the full-scale digesters: (a) pH, (b) total alkalinity, and (c) ethanol and volatile fatty acids (summed). Ethanol was only detected in the influent.
Energies 15 03471 g003
Figure 4. Profiles of 16S rRNA gene concentrations for the full-scale digesters: (a) digester A, (b) digester B, and (c) digester C. Abbreviations: ARC, total archaea; MBT, Methanobacteriales; MMB, Methanomicrobiales; MSL, Methanosarcinales.
Energies 15 03471 g004
Table 1. The characteristics of the food waste fed into the bioreactors.
ParameterDesign ValueMeasured Value *n **
pH4.3 ± 0.550
COD (kg/m3)100130.1 ± 21.450
Soluble COD (kg/m3)62.4 ± 5.950
TS (kg/m3)7572.7 ± 7.350
VS (kg/m3)6058.6 ± 7.350
Carbohydrates (kg/m3)9.5 ± 2.323
Proteins (kg/m3)16.9 ± 3.023
Lipids (kg/m3)17.6 ± 2.223
Total Kjeldahl nitrogen (kg/m3)2.4 ***2.9 ± 0.623
Total ammonia nitrogen (kg/m3)0.6 ± 0.223
Ethanol and VFAs (kg/m3)11.4 ± 4.550
Acetate (kg/m3)5.3 ± 3.050
Propionate (kg/m3)0.8 ± 0.850
Ethanol (kg/m3)4.0 ± 1.450
* Average ± standard deviation. ** Number of measurements. *** As total nitrogen.
Publisher’s Note: MDPI stays neutral with regard to jurisdictional claims in published maps and institutional affiliations.

