Article

Aging Detection of 110 kV XLPE Cable for a CFETR Power Supply System Based on Deep Neural Network

1
Institutes of Plasma Physics, Chinese Academy of Sciences, Hefei 230031, China
2
Scinece Island Branch, Graduate School of USTC, Hefei 230026, China
*
Author to whom correspondence should be addressed.
Energies 2022, 15(9), 3127; https://doi.org/10.3390/en15093127
Submission received: 25 March 2022 / Revised: 22 April 2022 / Accepted: 22 April 2022 / Published: 25 April 2022
(This article belongs to the Topic Power Distribution Systems)

Abstract

:
To detect the aging of power cables in the TOKAMAK power supply systems, this paper proposed a deep neural network diagnosis model and algorithm for power cable aging, based on logistic regression according to the characteristics of different high-order harmonics generated by different aging parts of the power cable. The experimental results showed that the model has high diagnostic accuracy, and the average error is only 2.35%. The method proposed in this paper has certain application potential in the CFETR power cable auxiliary monitoring system.

1. Introduction

The CFETR is China’s implementation of major science and engineering. Its goal is to build a tokamak fusion reactor that can realize self-maintained combustion, provide engineering feasibility verification for thermonuclear fusion reaction, and lay a solid theoretical and experimental foundation for the commercialization of fusion reactors in the future [1,2]. The tokamak is a toroidal vessel that uses magnetic confinement to achieve controlled nuclear fusion. It was originally invented in the 1950s by Azimovich et al. at the Kurchatov Institute in Moscow, Soviet Union.
There are many semiconductor switching devices in the tokamak power supply system, which can produce many harmonics. The 110 kV XLPE cable, which is responsible for the power supply of the tokamak device, will produce a large amount of loss and heat in the harmonic environment for a long time, resulting in accelerated aging and affecting the safety of electrical equipment related to the tokamak device.
Some progress has been made recently in cable aging mechanisms, and a large number of scholars’ research results show that the aging of power cables is the result of the combined action of multiple factors, such as electricity, heat, and the environment. Shaw M T analyzed the generation principle of water trees in the insulation layer of power cables and studied the existing forms of a series of cables [3]. Nikolayevich compared and analyzed several groups of water tree experiments and the results revealed the influence process of water trees on the power cable insulation layer from a multidimensional perspective [4]. Tanaka studied the water tree development process of 3.3 kV and 6.6 kV power cables in Japan and analyzed the influencing factors in detail [5]. Chen discussed the formation process of water trees in detail from chemical potential, mechanical action, and partial discharge [6]. Based on the experimental platform of a short cable electrode system established by Chongqing University, Chen observed the shape of electric twigs, studied the influence of voltage, temperature, voltage boost speed, and other different conditions on the development trend of electric twigs, and analyzed its characteristics [7]. In reference [8], a comparative test of ultralow frequency dielectric loss and microscopic physical and chemical properties was conducted on the new and returned aging cables. The test found that the returned cable was in a serious aging state, and there were continuous sheet-like aging defects inside the insulator on the shielding layer side of the cable conductor. With the help of an isothermal surface potential decay (ISPD) test system, Rao studied the effect of the thermal aging process at different temperatures on the surface trap parameters of XLPE cable insulation [9]. Cao tested XLPE and EPR power cables aged by 5000 and 10,000 switching impulses and showed degradation after the completion of the switching impulses [10].
Based on the above theory, cable insulation aging detection and diagnosis technology have also made progress. Nagao, applied standard sine excitation voltage to standard capacitors, and XLPE test products realized the test of the harmonic component of loss current through the bridge circuit and realized the judgment of cable water tree aging according to the amplitude and phase of the harmonic component [11,12,13,14]. However, the above test method is susceptible to the effect of lightning arresters and voltage transformers. To solve this problem, Tsujimoto proposed a new test circuit to suppress the adverse effect of the lightning arrester and voltage transformer on the loss current by adding a current transformer and achieved good results [15,16]. Liu built a 10 kV cable aging experimental platform at Tianjin University. He added AC voltage (converting sinusoidal AC voltage into ramp voltage) to the cable used in the test and predicted the insulation level of the cable by measuring the value of residual charge after applying the voltage [17]. Zhao’s model at the Wuhan University of Technology is very different from Liu’s in that he uses temperature to determine the level of insulation. Following IEC standards, a unique thermal circuit cable platform has been established to measure the transient temperature change of cables in the working process and judge the aging state of cables [18].
All the above studies were completed in the laboratory and provided a theoretical basis for cable insulation aging detection but did not realize cable insulation aging detection of cables in operation. In response to this problem, this paper proposes a power cable aging diagnosis model based on logistic regression deep neural network (L-R-DNN).
In recent years, deep learning neural networks have achieved some progress and success in the field of fault diagnosis [19,20,21]. There are many deep learning neural network models, but most of them are obtained by making corresponding changes based on convolutional neural networks (CNN), recurrent neural networks (RNN), and fully connected neural networks, according to specific problems. The CNN focuses on the relationship between adjacent features in the input feature vector or feature matrix, and is mainly applicable to the field of image processing [22]. The output of the RNN is determined by the current input and the output of the previous moment, so it is suitable for time series related problems such as text and speech processing [23]. A fully connected neural network is a classical feedforward neural network that has been proven to fit functions of arbitrary complexity with arbitrary precision [24]. The logistic regression model is a multivariate analysis method to study the relationship between observations and their influencing factors, and it has a strong regression ability [25]. Due to the different aging parts of the power cable, the harmonic content in the current is different, so the aging part can be diagnosed by analyzing the harmonic content in the power cable, and the logistic regression model is very suitable to solve this problem.
The rest of this paper is organized as follows. Section 2 analyzes the mechanism of higher harmonics caused by power cable aging. Section 3 builds a power cable aging diagnosis model based on L-R-DNN. Section 4 trains, tests and validates the power cable aging diagnosis model. The conclusions are presented in Section 5.

2. Theoretical Background

2.1. Analysis of Aging Mechanisms for Cables

When the cable is in normal operation, the current will flow through the cable conductor. At this point, the conductor will first be affected by the tension along the direction of the electric field and the compression force perpendicular to the direction of the electric field, and the tension and compression force, namely, the Maxwell scissors force, increase in a quadratic relationship, so the cable will always be subjected to mechanical pressure during normal operation. Second, due to the interaction between atoms of different substances, there will be a contact potential on the contact surface of the conductor and insulator, thus forming a voltaic effect, which further generates voltage pressure. Third, insulators have the property of storing energy in their interior, and this energy will produce an elastic effect on the exterior, leading to the loss of voltage and pressure in the interior of the insulators, namely, the phenomenon of heating. In addition, the complex external environment and changeable internal factors will make the cable in operation subjected to the joint action of electricity, heat, environment, external forces, and other factors. These factors interact, restrict, and correlate with each other, together constituting the influencing reason of cable aging [26].
When the cable is abnormal, the magnetic pole inside the conductor changes (magnetization of the medium), leading to the rearrangement of the magnetic moment orientation under the action of the current magnetic field of the cable core so that the abnormal state of the cable will be reflected in the high-order harmonic components of the current.
A rotating current will be generated where the magnetic flux changes inside the conductor, and this rotating current presents vortex flow in the body, as shown in Figure 1, and is the main source of odd harmonics in the current flowing through the conductor. When current I 0 passes through the conductor, magnetic flux ϕ a , ϕ b , ϕ c ... ϕ n will be generated by the conductor. The change of magnetic flux produces eddy currents, I a 1 , I b 1 , I c 1 I n 1 and I a 2 , I b 2 , I c 2 I n 2 . In Figure 1, the current I 0 is I = I 0 + I 1 + I 2 + + I n and represents the synthesis currently. Due to the symmetry of the electric field and the external magnetic field, the eddy current I 0 also becomes an asymmetric wave. Through its increase and decrease, the synthetic current I 0 becomes a synthetic current wave containing only odd harmonics.
When the inside of the cable is uniform, the alternating currents in the conductor produce the same magnetic flux, and the eddy currents generated can cancel each other out. Figure 2 shows the the internal magnetic flux of the cable when the cable is uneven inside, through such conditions as voids, foreign matter, insulation aging, etc., or if dust and moisture are attached to the cable surface. The magnetic flux B and C are different from the normal magnetic flux A, resulting in a vortex current that cannot cancel each other in the cable conductor. This situation will be reflected in the components of the high-order harmonics of the cable, which can reflect the aging state of the cable conductor [26].
The vibration of the conductor caused by mechanical stress will produce eddy current, which is the main source of current and even harmonics. The eddy current caused by mechanical factors is shown in Figure 3. When the conductor is impacted by the impulse pulse caused by mechanical factors, the conductor will make small movements in the magnetic field, which will generate eddy currents A and B. The eddy current flows through the conductor current I , but the impact pulse generated by mechanical factors is at right angles to the magnetic flux f in the magnetic field, and the conductor moves in the direction indicated by the arrow. At this point, the direction of the conductor’s motion, the direction of the magnetic field, and the direction of the current accord with Fleming’s right-hand rule. Therefore, the current flowing through the conductor is I = I 0 + I 1 , where I 1 is composed of eddy current A and eddy current B. Since I 1 contains even harmonics, the current P flowing through the conductor includes even harmonics.
When stress aging occurs in the cable, the magnetic flux in the conductor changes, and the conductor vibrates, resulting in high-order harmonics. Stress aging mainly includes thermal aging, voltage stress aging, environmental stress aging, and mechanical stress aging [26,27,28].
Through the above analysis and summary of the relationship between cable aging and higher-order harmonics, it can be concluded that the distribution of the magnetic field and the internal current flowing during the operation of the defective cable is as shown in Figure 4. Therefore, the cable aging status can be obtained by analyzing the current harmonics of the cable.

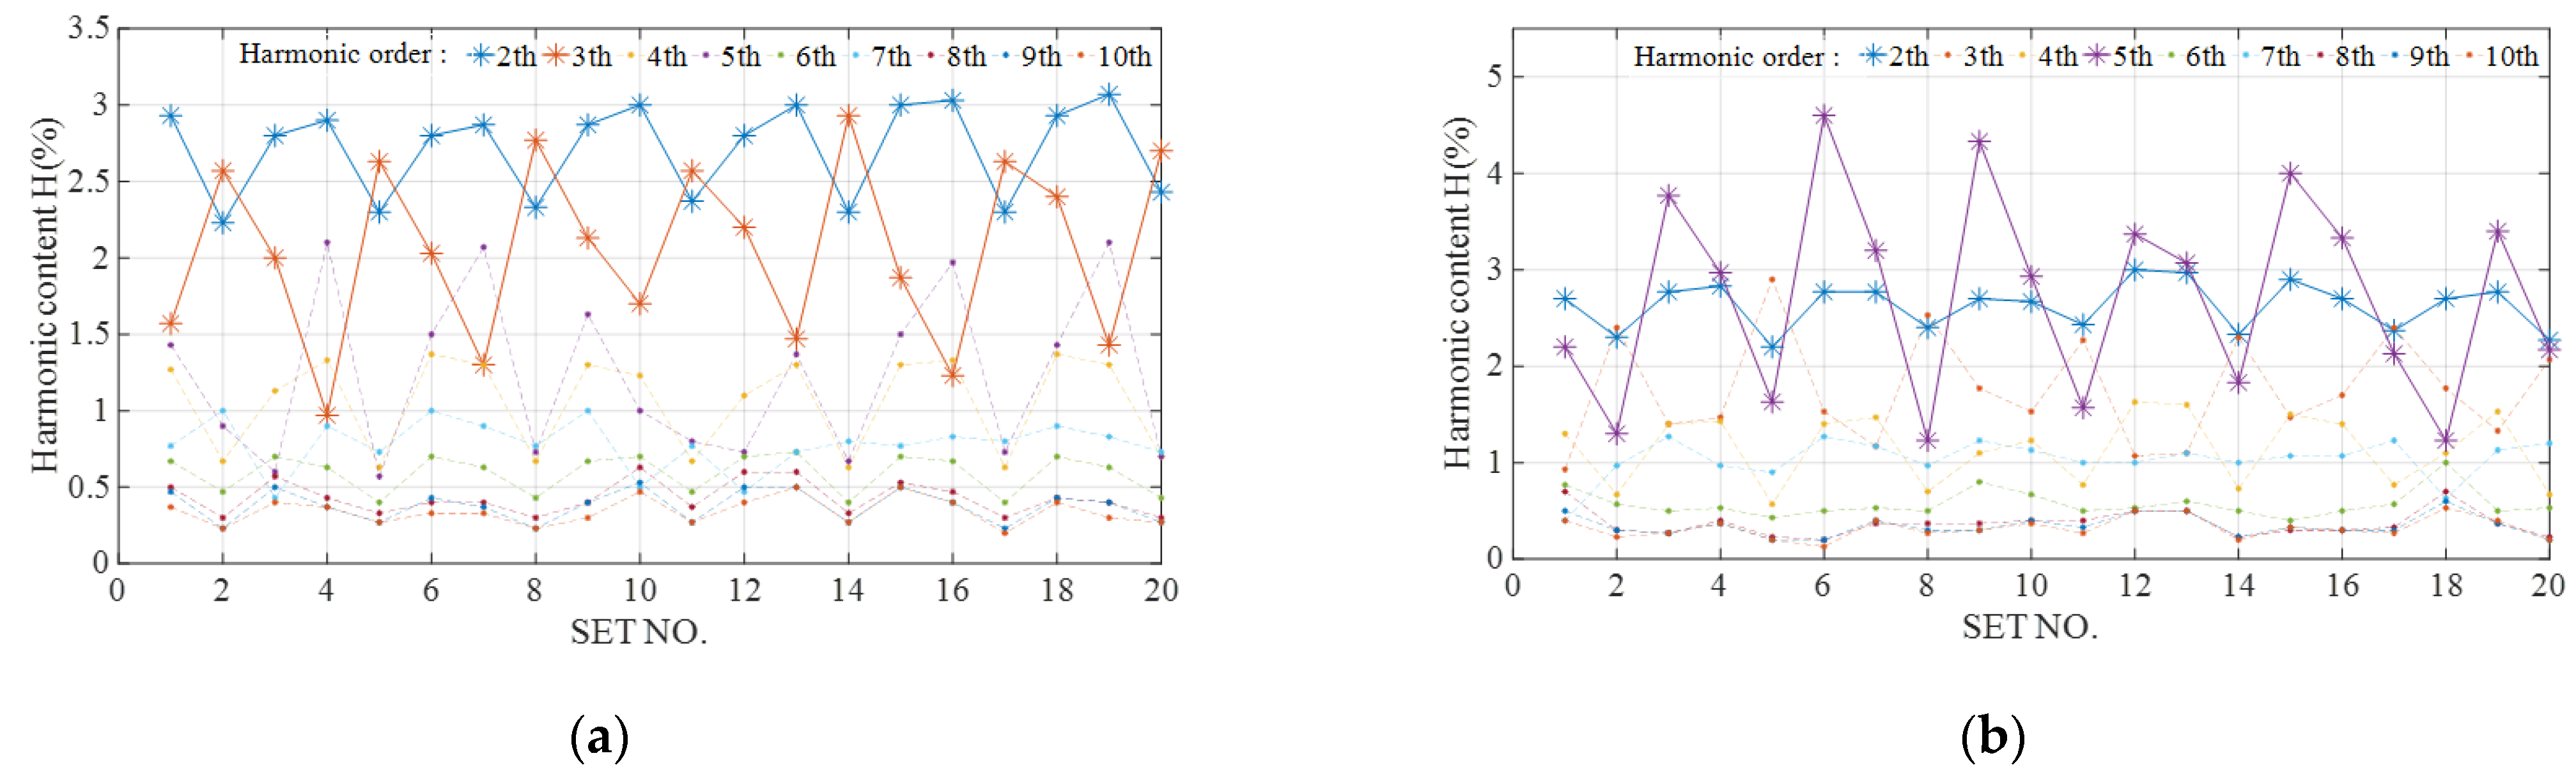
2.2. Harmonic Analysis of Power Cable

Because the measured harmonic current is composed of multiple periodic current components with different frequencies, the analysis of harmonic content requires Fourier decomposition of the measured harmonic current. The relation between the harmonic current of the power cable and each harmonic is shown in Equation (1).
I ˙ = n = 1 I n sin n ( ω t + θ n ) ,
According to Equation (1), the effective value of the total harmonic current I h is
I h = I 2 2 + I 3 2 + I 4 2 + + I n 2 ,
The proportion H of each harmonic in the total harmonics is
H = I n I h × 100 % ,
The measured power cable harmonic current is decomposed according to Equation (1), and then the proportion H of each harmonic is calculated according to Equation (3). The relationship between the cable insulation aging state and current harmonic components is statistically analyzed, and the historical data of power cable aging are established. The relationship between the aging position of the cable and the harmonic content of the current is shown in Table 1 [27,28]. The first row in Table 1 shows that when the cable is an early aging type of insulation layer, the third harmonic content is about 41%, the fifth harmonic content is about 41%, the fourth harmonic content is about 6%, and the second harmonic content is about 6%, with a total content of about 94%.

3. Construction of Cable Aging Diagnosis Model Based on Deep Learning

The logistic regression model is a multivariate analysis method to study the relationship between observation results and influencing factors [29]. In recent years, it has been widely used in medicine, finance, and other similar dichotomies, with strong regression ability [30]. Therefore, this paper chooses to construct a deep learning neural network based on a regression model to realize the aging diagnosis of cables according to the proportion H of each harmonic in the total harmonics and its cumulative contribution rate.

3.1. Logistic Regression Model

Y represents the observed value of the sample. A positive Y = 1 indicates the proportion H of each harmonic in the total harmonics, and the contribution rate of each harmonic accumulation reaches the aging threshold. A negative Y = 0 indicates the proportion H of each harmonic accumulation in the total harmonics, and the contribution rate of each harmonic accumulation does not reach the aging threshold. Logistic regression is a probabilistic nonlinear regression model. If X represents the characteristics of the power cable harmonic current input sample, then the probability of power cable aging can be expressed by the logistic regression model, as shown in Equation (4).
h θ ( x ) = P ( y = 1 | x ) = 1 1 + e g ( θ , x ) ,
where: θ is the model parameter; G is the classification boundary, and its specific calculation formula is determined by the function form to be fitted. Then the aging probability of the corresponding parts of the cable is calculated as follows:
P ( y = 0 | x ) = 1 h θ ( x ) = 1 1 + e g ( θ , x ) ,
Given N samples, the observed values are y 1 , y 2 …, y i …, y N , and the corresponding sample features are vectors X 1 , X 2 …, X i …, X N . By combining Equations (4) and (5), the probability of obtaining the observed value Y i is shown as follows:
P ( y i | x i ) = h θ ( X i ) y i [ 1 h θ ( X i ) ] 1 y i ,
If the samples are independent of each other, the maximum likelihood estimation is used to adjust the model parameter θ , and then the likelihood function can be obtained from Equation (6) as follows:
L ( θ ) = i = 1 N P ( y i | x i ) = i = 1 N h θ ( X i ) y i [ 1 h θ ( X i ) ] 1 y i ,
The logarithmic form is as follows:
ln L ( θ ) = i = 1 N ( y i ln h θ ( X i ) + ( 1 y i ) ln [ 1 h θ ( X i ) ] ) ,

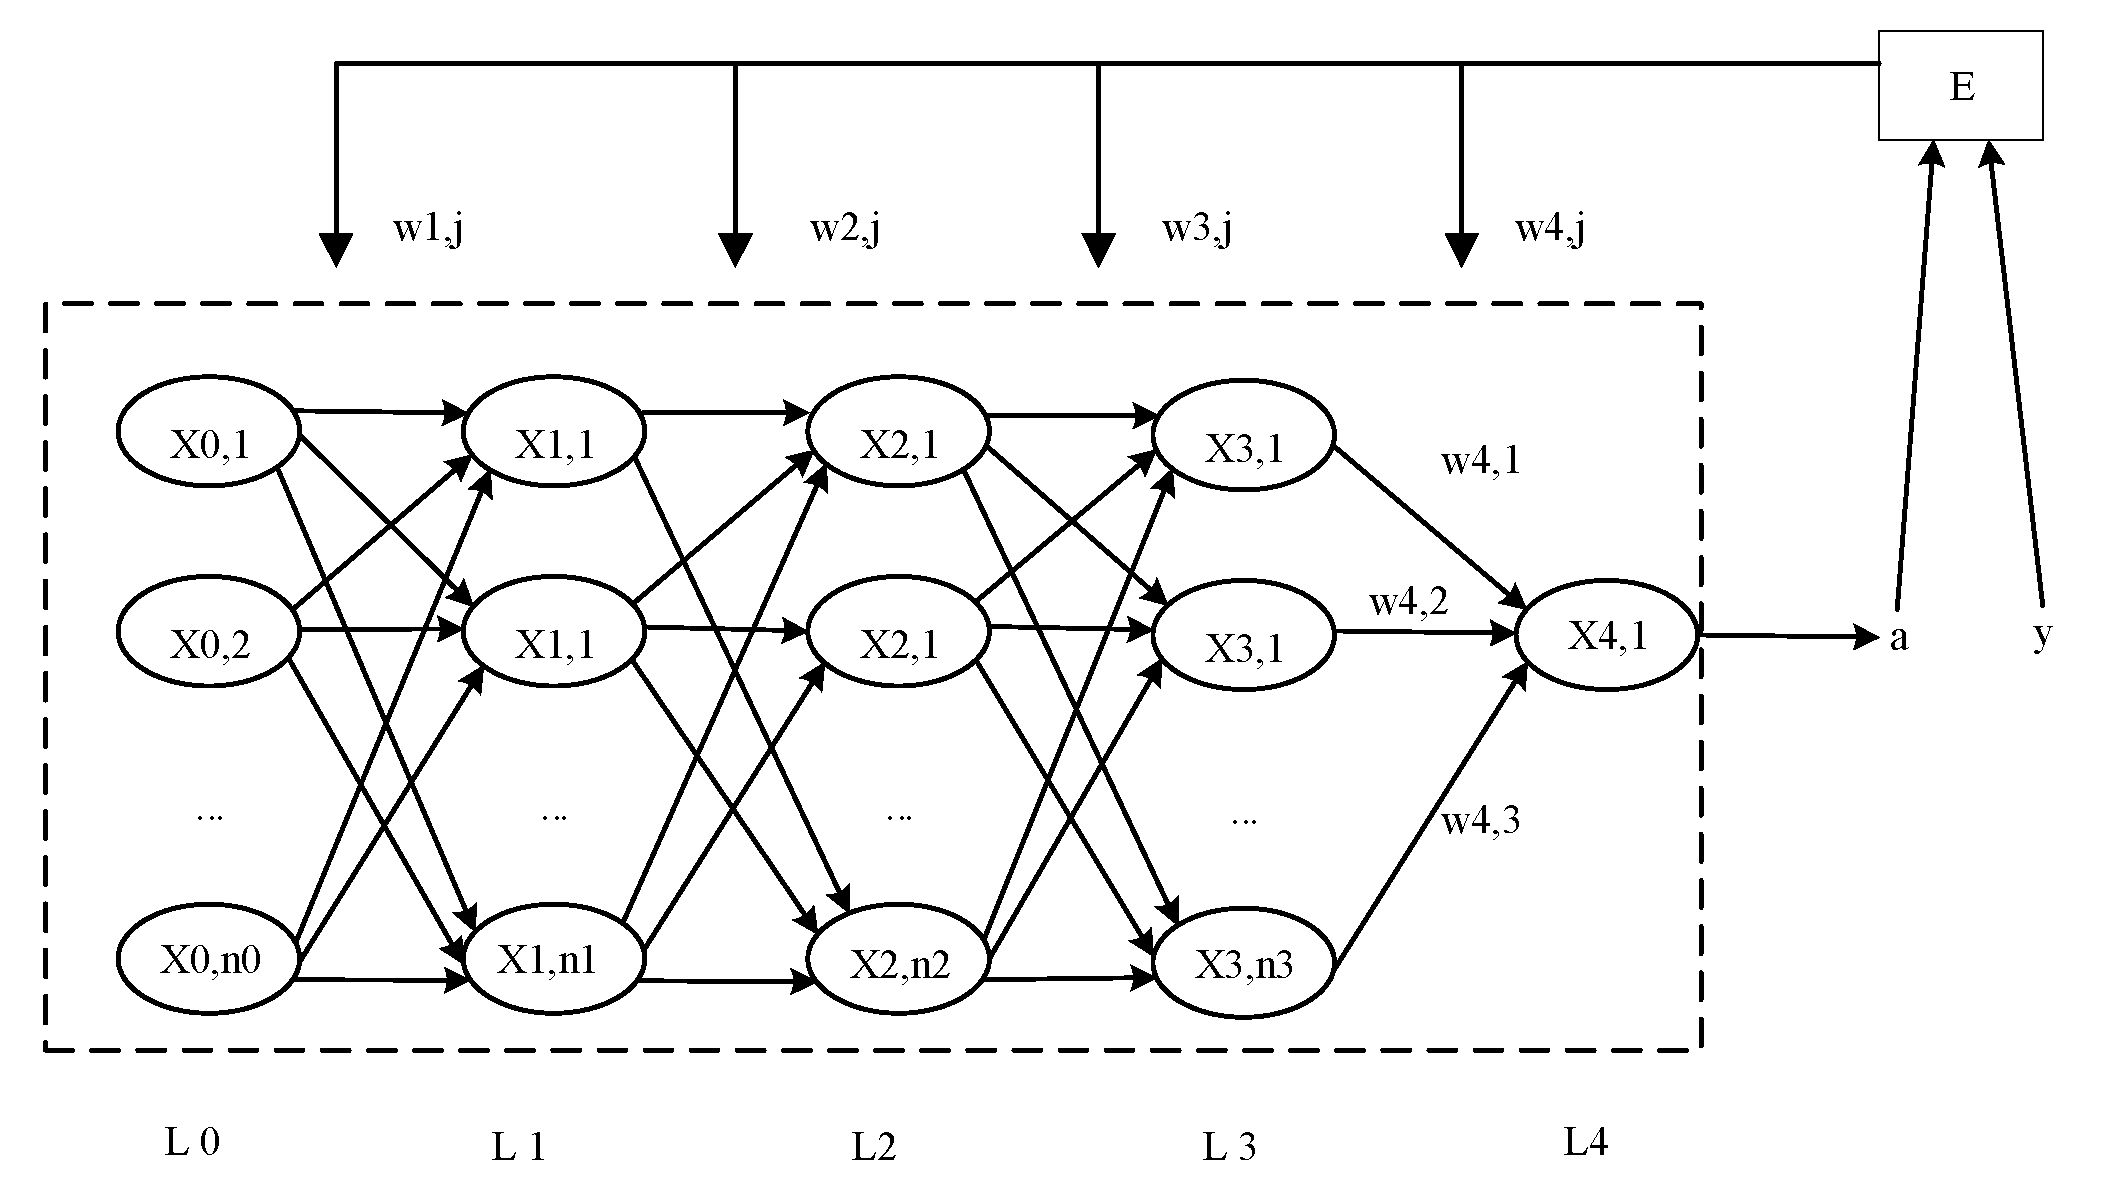
3.2. Construction of Deep Neural Network Based on Logistic Regression

In this paper, a deep learning neural network based on logistic regression (L-R-DNN) is constructed to achieve the accurate fitting of the functional relationship between the content of various harmonics of cables and the aging probability of various parts of power cables. The input of the deep neural network (DNN) is the input X of the regression model, and the output of DNN is the output of the regression model. The weight and bias between the connected neurons are the parameters θ to be adjusted in the regression model. The negative number of the logarithmic likelihood function in Equation (8) is the network loss function E. Taking the minimization loss function E as the goal, the training, and learning of the neural network, namely, the optimization and adjustment of parameter θ, were carried out to establish the logistic regression model. Then the trained neural network is used to diagnose the aging of the cable according to its harmonics. The structure of the logistic regression deep neural network (L-R-DNN) is shown in Figure 5.
In Figure 5, the L 0 layer is the input layer, and the number of neurons in this layer is equal to the number of eigenvectors of the constructed sample. L 0 L 3 is the hidden layer, and L 4 is the output layer. Each neuron in the L i layer is linked to each neuron in L i 1 , and its connection weight is w i , j . The activation function of L 0 L 3 neurons in the hidden layer is the ReLU function, as shown in Equation (9). The activation function of neurons in the output layer is the logistic function, as shown in Equation (4). Its output a is the output of the L-R-DNN, which represents the probability of events corresponding to the sample. The input of X 4 , 1 is the weighted sum of X 3 , 1 ,…, X 3 , n 3 , namely g ( θ , x ) in Equation (6).
Re l u = { z z > 0 0 z 0 ,
The minimization objective of L-R-DNN, namely the loss function E, can be calculated as follows:
E = 1 n i = 1 n [ y i ln a i + ( 1 y i ) ln ( 1 a i ) ] ,
where: n is the number of samples, a i and y i represent the network output and sample label respectively, corresponding to the i t h sample.

3.3. Training Methods

The training process of the neural network is the updating and optimization process of ownership weight and bias in the network. The parameter optimization method in this paper is the RMSProp method [30]. If the parameter gradient of target E with respect to all parameters θ ( w i , j , b i , j ) is expressed by E θ , the updating process for the tth parameter correction is as follows:
Step 1: Calculate the current gradient ( E θ ) t of all parameters according to the chain rule of differentiation.
Step 2: Calculate the squared weighted sum Δ S of the current parameter gradient and the previous parameter gradient.
Δ S = β ( E θ ) t 1 + ( 1 β ) [ ( E θ ) t ] 2 ,
where β is an adjustable parameter, and this paper takes 0.9.
θ t = θ t 1 α Δ S + ε ( E θ ) t ,
where: α is the adjustable parameter, 0.001 is taken in this paper; ε is the smoothing term, which is used to avoid denominator 0, In this paper, we set it as 10 6 .

4. Experimental

Based on the Anhui Power Grid Cable Harmonic Monitoring Project, this paper calculates the high-order harmonic content rate of the 110 kV XLPE cable with an operating life of less than 25 years by detecting the high-order harmonic current flowing through the power cable. The deterioration degree of the power cable is evaluated, the relationship between the aging part and the higher harmonics is analyzed, and a sample database corresponding to the aging part of the power cable and the higher harmonic content is obtained. We use this database to train, validate and test the diagnostic model established in this paper.

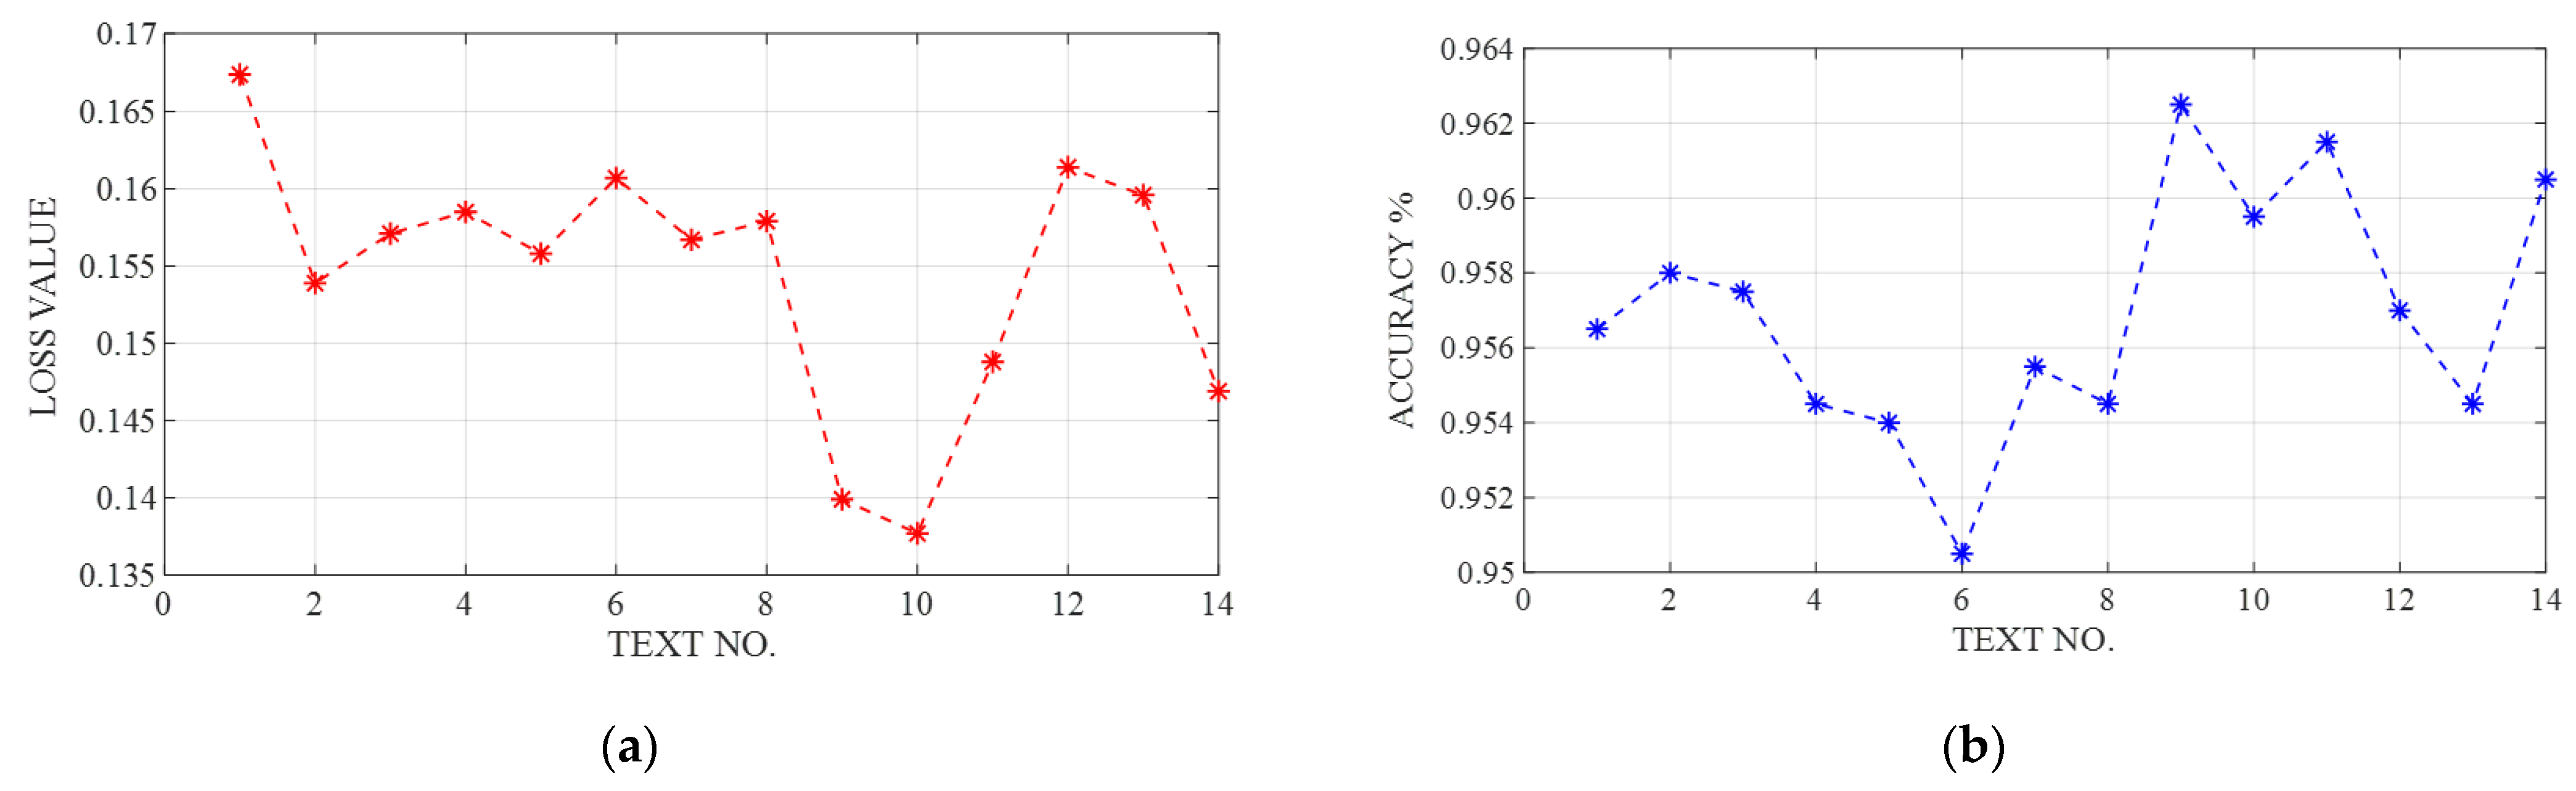
4.1. Selection of Structural Parameters of Network Model
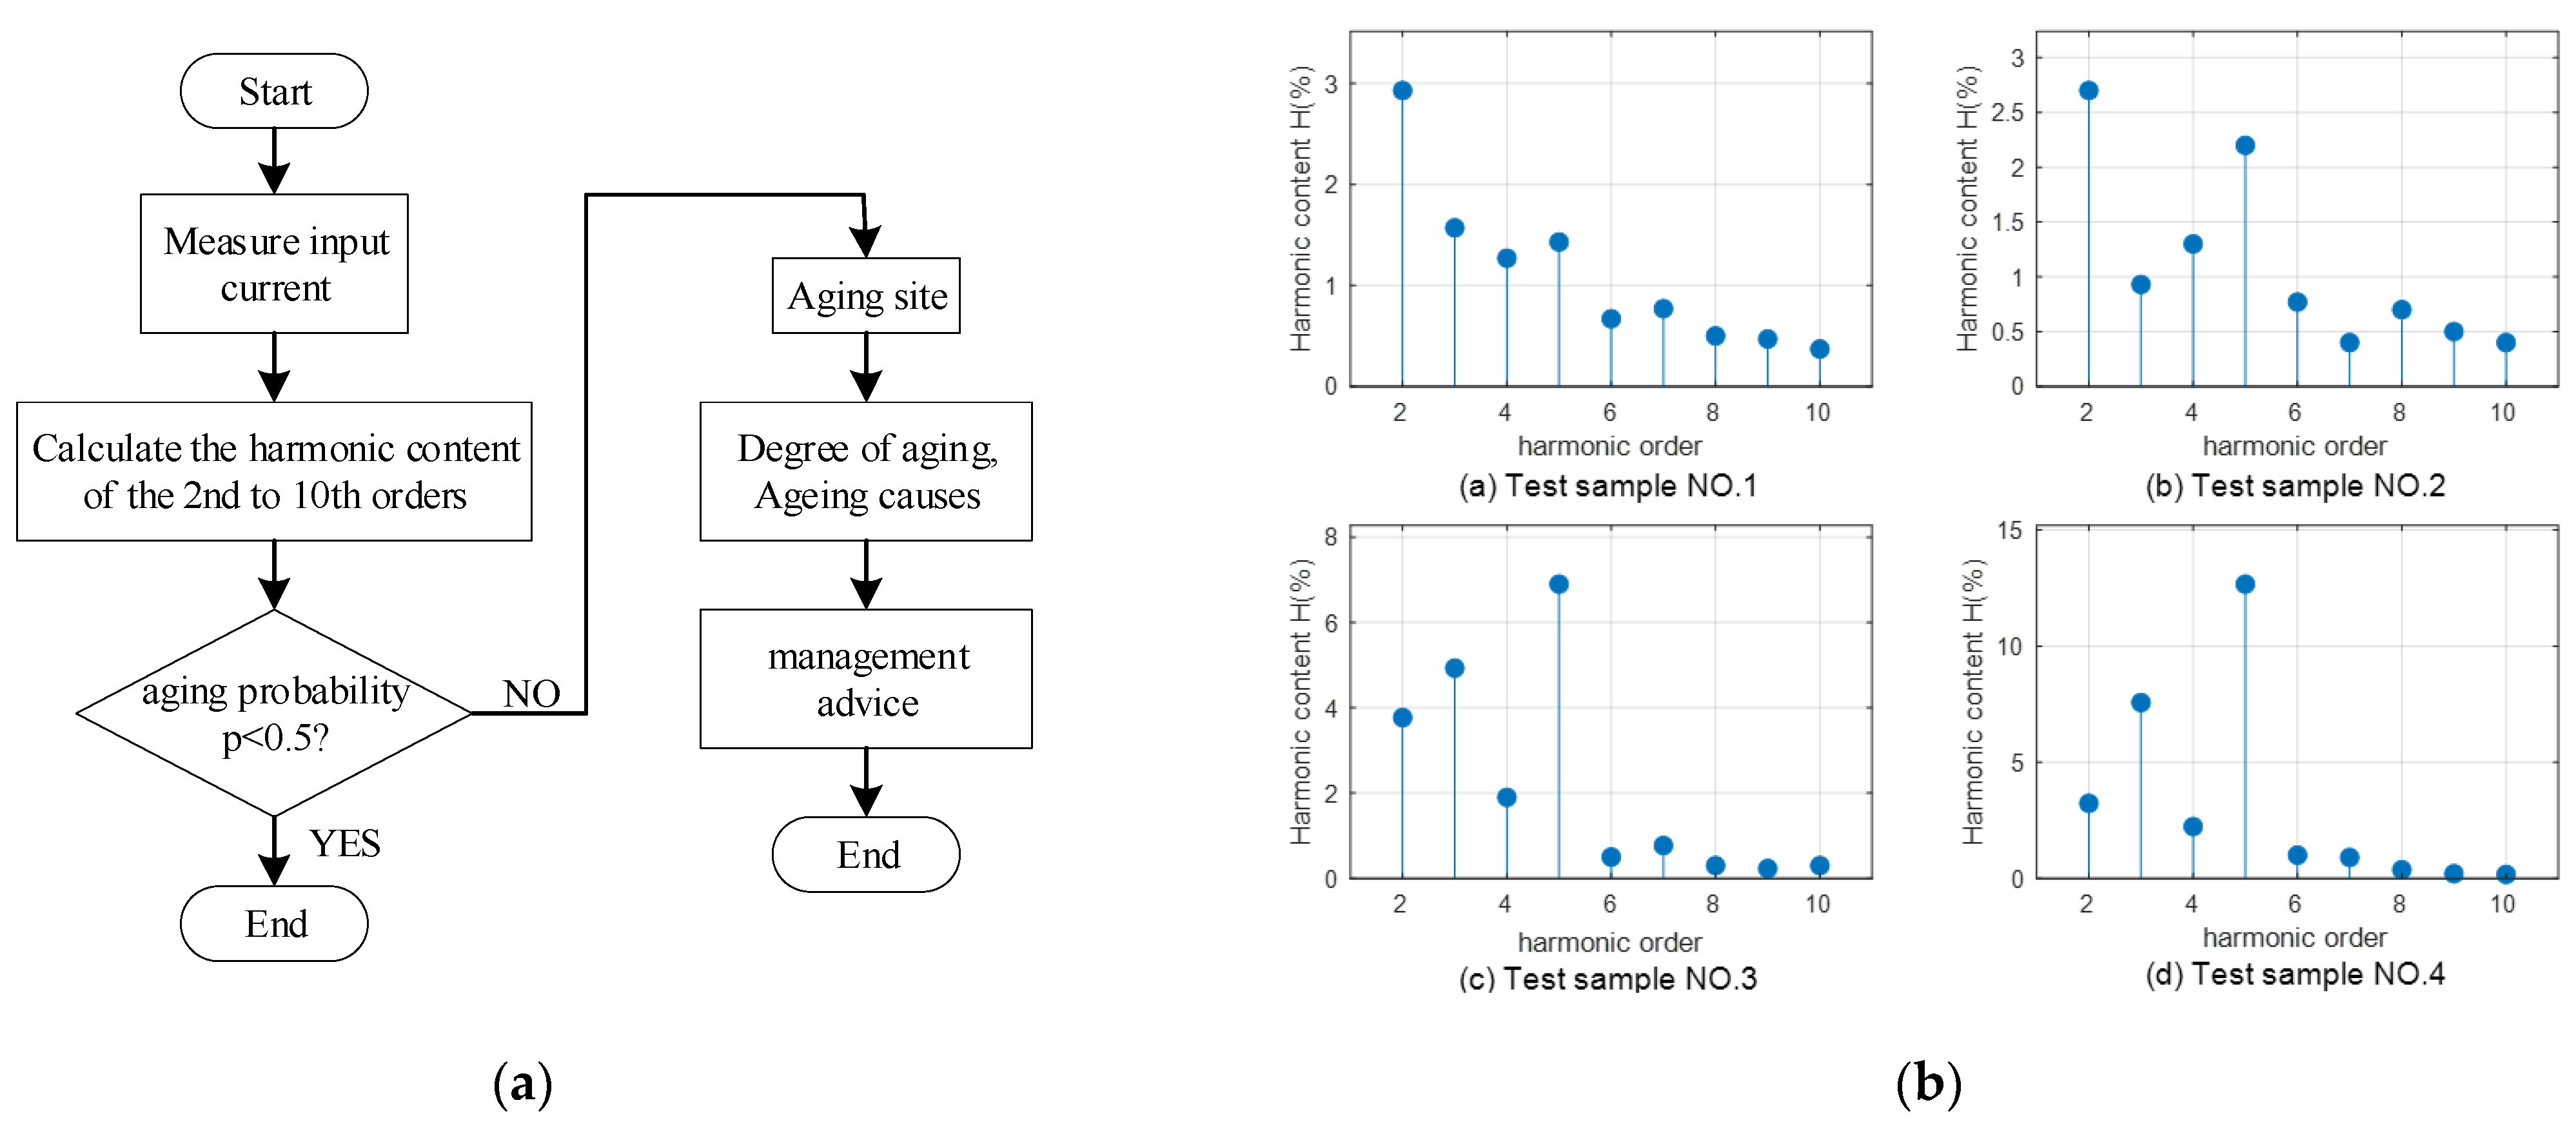
For L-R-DNN parameters to be determined, namely, the number of hidden layers and neurons in the network, within a certain value range, multiple sets of parameter values are separated to establish L-R-DNN, and the obtained samples are trained to convergence respectively. The parameter setting and test results are shown in Table 2, and the parameter settings and test results are shown in Figure 6.
The number of neurons in Table 2 represents the number of neurons in each hidden layer of the network. For example, (60, 30, 15) indicates that the number of neurons in the three hidden layers is 60, 30, and 15, respectively. The loss value represents the value of the loss function on the test set, and the accuracy rate represents the corresponding test accuracy. By comprehensive comparison, in this paper, the network with the highest accuracy (i.e., the number of neurons is (40, 20, 10)) was selected as the model for subsequent diagnostic test experiments.

4.2. Test

The theoretical aging probability of the test samples can be calculated by Equation (13).
P ( y = 1 | x ) = P ( y = 1 ) P ( x | y = 1 ) [ P ( y = 0 ) P ( x | y = 0 ) + P ( y = 1 ) P ( x | y = 1 ) ] ,
where P ( y = 1 ) and P ( y = 0 ) represent the prior probability of the aging sample set and the non-aging sample set of power cables, respectively. The number of the aging samples ( N 1 ) and non-aging samples ( N 0 ) set are both 2100, then
{ P ( y = 1 ) = N 1 N 1 + N 0 = 0.5 P ( y = 0 ) = N 0 N 1 + N 0 = 0.5 ,
where P ( x | y = 0 ) and P ( x | y = 1 ) represent the probability of input in the sample under aging and non-aging conditions, respectively, and the calculation formula is shown in Equation (15).
{ P ( x | y = 1 ) = i = 1 11 { X i P ( X i = 1 | y = 1 ) + ( 1 X i ) [ 1 P ( X i = 1 | y = 1 ) ] } P ( x | y = 0 ) = i = 1 11 { X i P ( X i = 1 | y = 0 ) + ( 1 X i ) [ 1 P ( X i = 1 | y = 0 ) ] } ,
where X i represents the i t h feature bit in the input signal feature vector. A total of 120 training samples were used to test the ability of the model to acquire probabilistic features. By substituting x into Equations (13)–(15), the theoretical probability P ( y = 1 | x | ) of power cable aging diagnosed when the feature vector is X can be obtained, which is similar to the selection and calculation of other test samples.
The error between the model output probability and the theoretical probability is defined as the absolute value of the difference between the model output probability and the calculated probability. Four of the test samples were randomly selected, as shown in Figure 7, and the theoretical aging probability and network output results are shown in Table 3. The flow chart of cable aging detection is shown in Figure 7a.

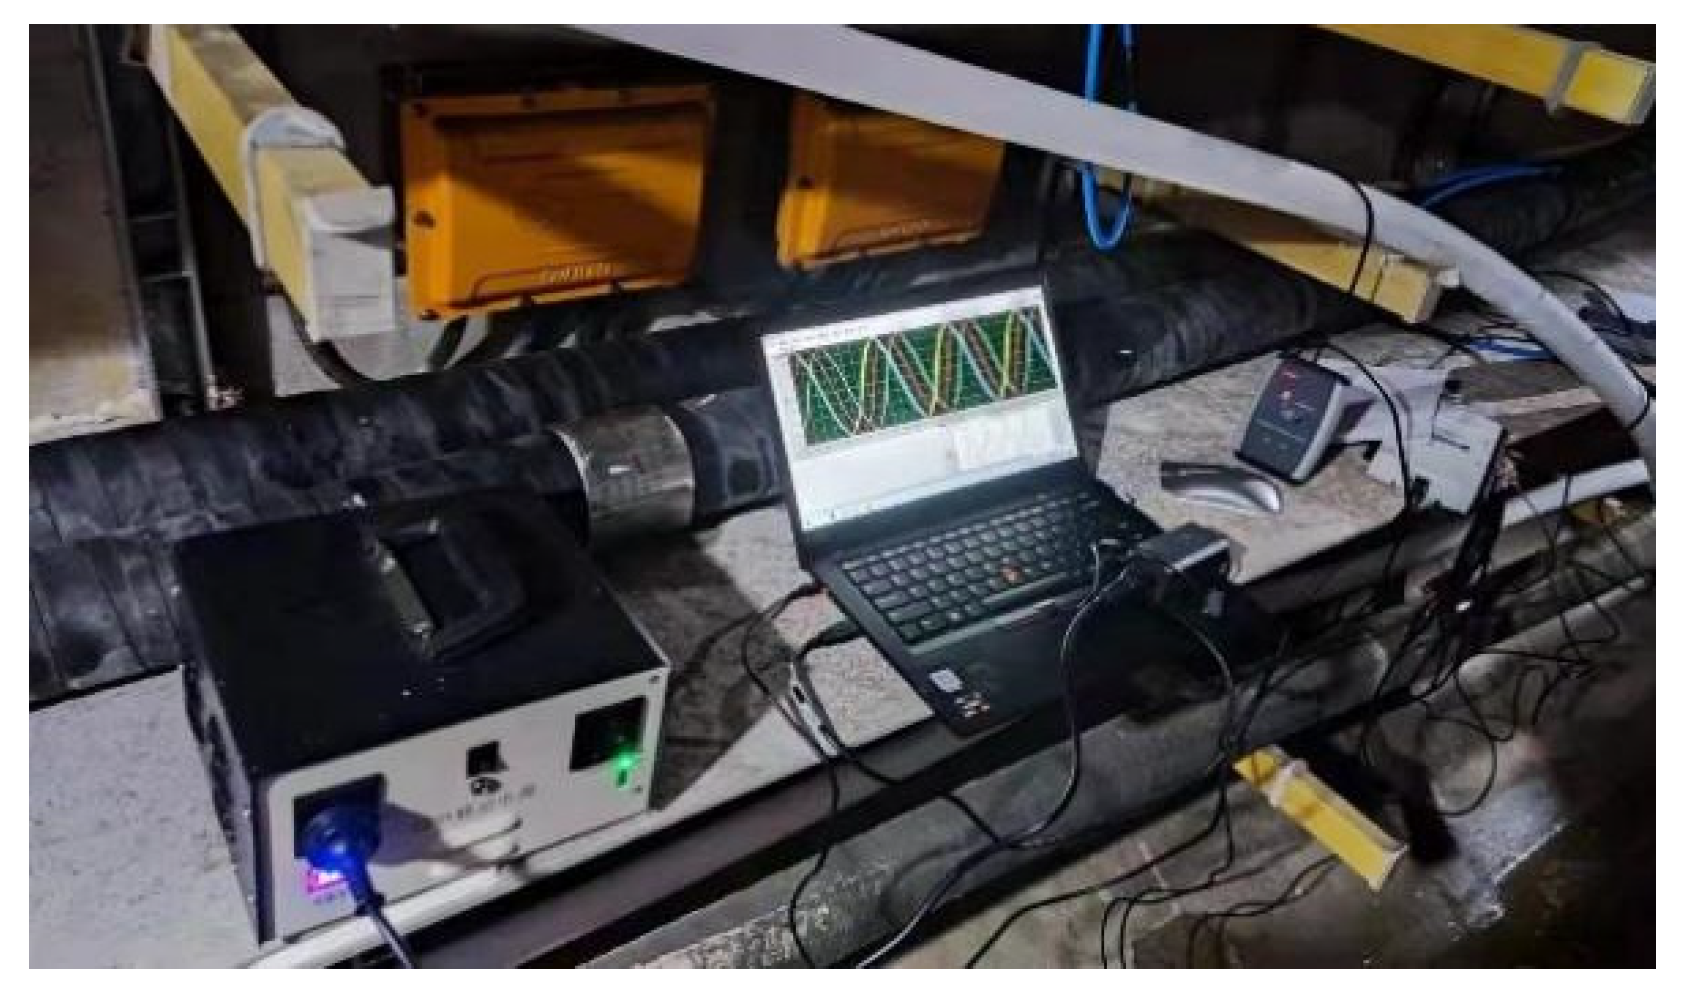
4.3. Experimental Verification

To verify the correctness of the diagnosis results, we conducted several field harmonic data tests on the 110 kV cable power supply line corresponding to the first sample and the second sample. The field test is shown in Figure 8, and 20 sets of harmonic data are tested on each line, as shown in Figure 9. According to the diagnosis results, the cable aging position was found, as shown in Figure 10.

5. Discussion

As seen from the Figure 6, as the number of network layers increases, the value of the loss function gradually becomes smaller, which indicates that a proper deep network structure can achieve better diagnostic performance than a shallow network with a single hidden layer. However, when the number of hidden layers of the network is four, the value of the loss function begins to increase, and overfitting occurs. When the number of hidden layers of the network is three and the number of neurons in each hidden layer is (60, 30, 15), the loss value is the smallest, and when the number of neurons is (40, 20, 10), the precision value is the largest. Therefore, when the number of neurons is (40, 20, 10), it is the best choice of network structure for the diagnosis model.
The test results in Table 3 show that the network model is more accurate in predicting the failure probability of the test samples, with an average error of only 2.35%, and the failure probability errors of the four samples are all less than 5%. Therefore, the network model constructed in this paper has strong data feature extraction and diagnostic capabilities.
Figure 9a shows that in the harmonic data of cable line 1, the second harmonic content always occupies the main component, and the fourth, third, and fifth harmonic contents are higher among other major components. The components of the harmonic data are related to the mechanical damage type in Table 2. The cable protective layer is verified on-site, and the damage is shown in Figure 10a. Figure 9b shows that in the harmonic data of cable line 2, the fifth harmonic content always occupies the main component, and the second, third, and fourth harmonic contents are higher among other major components. Harmonic data components are related to the natural aging type in Table 2. The cable protection layer is checked on site, and the damage is shown in Figure 10b. Experiments have verified that the diagnostic results of the diagnostic model are consistent with the actual aging of the cable, which proves the reliability of the model.

6. Conclusions

It can be seen from the test results that the network model is more accurate in predicting the aging probability of test samples, and the average error is only 2.35%, and Table 3 shows that the probability error of four samples is less than 5%. Therefore, the deep neural network based on logistic regression constructed in this paper has a strong capability of data feature extraction and diagnosis, and can quickly and accurately obtain the probability of power cable aging, and has certain potential to be applied in CFETR power cable auxiliary monitoring system.

Author Contributions

Conceptualization, H.C. and Y.H.; Data curation, H.C. and H.H.; Formal analysis, X.L.; Investigation, H.C. and J.W.; Methodology, H.C.; Project administration, H.C.; Software, H.C. and H.H. All authors have read and agreed to the published version of the manuscript.

Funding

This research was funded by “The Comprehensive Research Facility For Fusion Technology Program Of China Under Contract, Grant Number 2018-000052-73-01-001228” and “The Hefei Institutes Of Physical Science Fund, Chinese Academy Of Sciences, Grant Number Yzjj2021qn16”.

Institutional Review Board Statement

Not applicable.

Informed Consent Statement

Not applicable.

Conflicts of Interest

The authors declare no conflict of interest.

Nomenclature

CFETRChina Fusion Engineering Test Reactor
TOKAMAKIts name Tokamak comes from toroidal, kamera, magnet, kotushka
DNNDeep neural network
CNNConvolutional neural network
RNNRecurrent neural network
L-R-DNNLogistic regression deep neural network

References

  1. Song, Y.T.; Wu, S.T.; Li, J.G.; Wan, B.N.; Wan, Y.X.; Fu, P.; Ye, M.Y.; Zheng, J.; Lu, K.; Gao, X.; et al. Concept Design of CFETR Tokamak Machine. IEEE Trans. Plasma Sci. 2014, 42, 503–509. [Google Scholar] [CrossRef]
  2. Wang, J.; Huang, Y.; Chen, H.; Li, X. Stability Analysis of CFETR Distribution Network. J. Fusion Energy 2021, 40, 12. [Google Scholar] [CrossRef]
  3. Shaw, M.T.; Shaw, S.H. Water Treeing in Solid Dielectrics. IEEE Trans. Dielectr. Electr. Insul. 1984, 19, 419–452. [Google Scholar] [CrossRef]
  4. Nikolajevic, S.V.; Drca, R. Effect of water on aging of XLPE cable insulation. Electr. Power Syst. Res. 2002, 60, 9–15. [Google Scholar] [CrossRef]
  5. Tanaka, T.; Fukuda, T.; Suzuki, S. Water tree formation and lifetime estimation in 3.3 kV and 6.6 kV XLPE and PE power cables. IEEE Trans. Power Appar. Syst. 1976, 95, 1892–1900. [Google Scholar] [CrossRef]
  6. Chen, T.; Wei, N.; Chen, S.E. Mechanism, detection and prevention of water tree in XLPE power cable. Wire Cable 2009, 4, 6–10. [Google Scholar]
  7. Chen, S.J. Study on Growth Characteristics of XLPE Cable Electric Branches under Different Conditions. Master’s Thesis, Chongqing University, Chongqing, China, 2009. [Google Scholar]
  8. Zhou, K.; Li, S.; Yin, Y.; Lin, S.; Yu, H. Analysis of Aging Characteristics of Returned Medium Voltage XLPE and EPR Cables. Trans. China Electrotech. Eng. 2020, 35, 171–180. [Google Scholar]
  9. Yan, Q.; Li, H.; Zhai, S.; Hu, L.; Chen, J. Effect of Thermal Aging at Different Temperatures on the Surface Trap Parameters of XLPE Insulation of HV Distribution Network. Proc. CSEE 2020, 40, 692–701. [Google Scholar]
  10. Cao, L.; Grzybowski, S. Accelerated aging study on 15 kV XLPE and EPR cables insulation caused by switching impulses. IEEE Trans. Dielectr. Electr. Insul. 2015, 22, 2809–2817. [Google Scholar] [CrossRef]
  11. Nagao, M.; Tokoro, T.; Yokoyama, A.; Kosaki, M. New approach to diagnostic method of water trees. In Proceedings of the IEEE International Symposium on Electrical Insulation, Toronto, ON, Canada, 3–6 June 1990; pp. 296–299. [Google Scholar]
  12. Hvidsten, S.; Ildstad, E.; Sletbak, J.; Faremo, H. Understanding water treeing mechanisms in the development of diagnostic test methods. IEEE Trans. Dielectr. Electr. Insul. 1998, 5, 754–760. [Google Scholar] [CrossRef]
  13. Yagi, Y.; Tanaka, H.; Kimura, H. Study on diagnostic method for water treed XLPE cable by loss current measurement. In Proceedings of the 1998 Annual Report Conference on Electrical Insulation and Dielectric Phenomena, Atlanta, GA, USA, 25–28 October 1998; pp. 653–656. [Google Scholar]
  14. Bulinski, A.T.; So, E.; Bamji, S.S. Measurement of the harmonic distortion of the insulation loss current as a diagnostic tool for high voltage cable insulation. In Proceedings of the IEEE Power Engineering Society Winter Meeting, Singapore, 23–27 January 2000; pp. 1615–1620. [Google Scholar]
  15. Tsujimoto, T.; Nakade, M.; Yagi, Y.; Ishii, N. Approach for Wide Use of Diagnostic Method for XLPE Cables Using Harmonics in AC Loss Current. IEEJ Trans. Power Energy 2006, 126, 421–426. [Google Scholar] [CrossRef] [Green Version]
  16. Tsujimoto, T.; Nakade, M.; Yagi, Y.; Ishii, N. Development of Harmonic-Noise Reduction Technology in Diagnostic Method using AC Loss Current for Water Treed XLPE Cable. IEEJ Trans. Power Energy 2005, 125, 1237–1244. [Google Scholar] [CrossRef] [Green Version]
  17. Liu, Y.J. Research on XLPE Cable Water Tree Aging Diagnosis Based on Residual Charge Method. Master’s Thesis, Tianjin University, Tianjin, China, 2008. [Google Scholar]
  18. Zhao, Y.Y. Research on On-Line Monitoring System of Power Cable Based on Grating Fiber Sensing. Master’s Thesis, Wuhan University of Technology, Wuhan, China, 2011. [Google Scholar]
  19. Xu, Y.; Sun, Y.; Liu, X.; Zheng, Y. A Digital-Twin-Assisted Fault Diagnosis Using Deep Transfer Learning. IEEE Access 2019, 7, 19990–19999. [Google Scholar] [CrossRef]
  20. Amiruddin, A.A.A.M.; Zabiri, H.; Taqvi, S.A.A.; Tufa, L.D. Neural network applications in fault diagnosis and detection: An overview of implementations in engineering-related systems. Neural Comput. Appl. 2020, 32, 447–472. [Google Scholar] [CrossRef]
  21. Iannace, G.; Ciaburro, G.; Trematerra, A. Fault Diagnosis for UAV Blades Using Artificial Neural Network. Robotics 2019, 8, 59. [Google Scholar] [CrossRef] [Green Version]
  22. Lee, M.; Lee, J.; Kim, J.; Kim, B.; Kim, J. The Sparsity and Activation Analysis of Compressed CNN Networks in a HW CNN Accelerator Model. In Proceedings of the 2019 International SoC Design Conference (ISOCC), Jeju, Korea, 6–9 October 2019; pp. 255–256. [Google Scholar]
  23. Xiao, J.; Zhou, Z. Research Progress of RNN Language Model. In Proceedings of the 2020 IEEE International Conference on Artificial Intelligence and Computer Applications (ICAICA), Dalian, China, 27–29 June 2020; pp. 1285–1288. [Google Scholar]
  24. Wang, W.; Dong, W.; Yu, T.; Du, Y. Research on PRS/IRS Time Registration Based on Fully connected Neural Network. In Proceedings of the 2020 IEEE 9th Joint International Information Technology and Artificial Intelligence Conference (ITAIC), Chongqing, China, 11–13 December 2020; pp. 942–947. [Google Scholar]
  25. Ali, E.A.H.; Mohamed, A.Y.S. Modeling of human hand fingers states using electromyography and logistic regression. In Proceedings of the 2016 Conference of Basic Sciences and Engineering Studies (SGCAC), Khartoum, Sudan, 20–23 February 2016; pp. 38–42. [Google Scholar]
  26. Zhao, S.; Canling, B.; Anzhu, X.; Gao, B. The Relationship between Eddy Current and Harmonics in HDS Electrical Equipment On-Line Condition Diagnosis Technology and Application; Publishing House of Electronics Industry: Beijing, China, 2017; Volume 3, pp. 57–59. [Google Scholar]
  27. Ko, H. Method for Diagnosing Working Condition and Anomalous Degradation of Electric Equipment. Japan Patent No. 118928, 5 November 2006. [Google Scholar]
  28. Ko, H. Method for Diagnosing Abnormality in Electric Equipment. Japan Patent No. 189064, 5 July 2002. [Google Scholar]
  29. Zou, X.; Hu, Y.; Tian, Z.; Shen, K. Logistic Regression Model Optimization and Case Analysis. In Proceedings of the 2019 IEEE 7th International Conference on Computer Science and Network Technology (ICCSNT), Dalian, China, 19–20 October 2019; pp. 135–139. [Google Scholar]
  30. Tieleman, T.; Hnton, G. Lecture 6.5-Rmsprop: Divide the gradient by a running average of its recent magnitude. COURSERA Neural Netw. Mach. Learn. 2012, 4, 26–31. [Google Scholar]
Figure 1. Schematic diagram of eddy current.
Energies 15 03127 g001
Figure 2. Schematic diagram of uneven magnetic beam in medium.
Energies 15 03127 g002
Figure 3. The eddy current caused by impulse pulse.
Energies 15 03127 g003
Figure 4. Schematic diagram of eddy current when the power cable is abnormal.
Energies 15 03127 g004
Figure 5. The structure of the logistic regression deep neural network.
Energies 15 03127 g005
Figure 6. Parameter settings and test results (a) loss value; (b) accuracy.
Energies 15 03127 g006
Figure 7. Survey photos: (a) The flowchart of cables aging detection; (b) Four of the test samples.
Energies 15 03127 g007
Figure 8. Measurement of harmonic data.
Energies 15 03127 g008
Figure 9. Test Data: (a) The twenty 20 sets of harmonic data statistics for line 1; (b) The twenty sets of harmonic data statistics for line 2.
Energies 15 03127 g009
Figure 10. Survey photos: (a) The mechanical damage type.; (b) The natural aging type.
Energies 15 03127 g010
Table 1. The relationship between cable aging position and higher harmonics.
Deterioration Part of CableHigh Harmonic and Its Content (%)Cumulative Contribution Rate
The First Major IngredientOther Main Ingredients
Body partsinsulatorsEarly deterioration type3th5th4th2th 94
414166
Environmental aging type (mechanical damage)2th4th3th5th 86
411696
Environmental aging type (electrical damage)5th3th4th2th 93
592086
Natural aging type5th3th4th2th 93
522876
shielding layer3th5th2th4th 90
25242318
Protective layer2th4th3th5th 85
3929107
junctioncable jointheating7th10th9th8th6th91
53151175
stained8th7th9th10th6th95
352913117
crack9th8th7th10th6th92
33252185
deformation10th7th8th9th6th91
302317156
Table 2. Units and corresponding symbols.
Test No.Number of NeuronsTest No.Number of Neurons
1408(120, 60)
2809(40, 20, 10)
312010(60, 30, 15)
416011(80, 40, 20)
520012(40, 20, 10, 5)
6(40, 20)13(80, 40, 20, 10)
7(80, 40)14(120, 60, 30, 15)
Table 3. The theoretical fault value and output value of the network.
The Sample No.Theoretical
Probability
Network OutputErrorAverage Error
10.99950.99240.00710.0235
20.99850.98410.0144
30.98350.95320.0303
40.02720.06950.0423
Publisher’s Note: MDPI stays neutral with regard to jurisdictional claims in published maps and institutional affiliations.

