Article

Experimental Evaluation of a Full-Scale HVAC System Working with Nanofluid

Department of Engineering for Innovation, University of Salento, 73100 Lecce, Italy
*
Author to whom correspondence should be addressed.
Energies 2022, 15(8), 2902; https://doi.org/10.3390/en15082902
Submission received: 17 March 2022 / Revised: 4 April 2022 / Accepted: 12 April 2022 / Published: 15 April 2022
(This article belongs to the Topic Applications of Nanomaterials in Energy Systems)

Abstract

:
Nowadays, energy saving is considered a key issue worldwide, as it brings a variety of benefits: reducing greenhouse gas emissions and the demand for energy imports and lowering costs on a household and economy-wide level. Researchers and building designers are looking to optimize building efficiency by means of new energy technologies. Changes can also be made in existing buildings to reduce the energy consumption of air conditioning systems, even during operational conditions without dramatically modifying the system layout and have as low an impact as possible on the cost of the modification. These may include the usage of new heat transfer fluids based on nanofluids. In this work, an extended experimental campaign (from February 2020 to March 2021) has been carried out on the HVAC system of an educational building in the Campus of University of Salento, Lecce, Italy. The scope of the investigation was comparing the COP for the two HVAC systems (one with nanofluid and the other one without) operating concurrently during winter and summer: simultaneous measurements on the two HVAC systems show that the coefficient of performance (COP) with nanofluid increased on average by 9.8% in winter and 8.9% in summer, with average daily peaks of about 15%. Furthermore, the comparison between the performance of the same HVAC system, working in different comparable periods with and without nanofluids, shows a mean increase in COP equal to about 13%.

1. Introduction

Decreasing the energy consumption of heating, ventilation and air conditioning (HVAC) systems is a very important issue, due to their high environmental and energy costs, together with a significant actual increase in their demand from the market. Several studies have described various technologies and techniques that can be used to reduce HVAC energy consumption, one of which is nanofluids [1,2].
Nanofluids are engineered heat transfer fluids which can be used to improve heat transfer, thus increasing energy efficiency in a variety of applications based on chillers, heat pumps and other hydronic HVAC systems. They are suspensions of nanoparticles dispersed in a liquid that are formulated to achieve higher heat transfer performance than their base-fluids. Numerous studies have demonstrated that nanofluid thermal conductivity can be improved based on some variables, such as nanoparticle volume concentration, size, morphology, etc.
In early experiments on nanofluids, Lee et al. [3] measured thermal conductivity with the transient hot-wire method, demonstrating that a small amount of nanoparticles was enough to increase the thermal conductivity of the base fluid.
Beck et al. [4] presented data for the thermal conductivity enhancement in seven nanofluids containing 8–282 nm diameter alumina nanoparticles in water or ethylene glycol. They found that the thermal conductivity enhancement in these nanofluids decreases as the particle size decreases below about 50 nm. This finding could be attributed to phonon scattering at the solid–liquid interface.
To confirm this result, Colangelo et al. [5,6] designed, built and tested a new experimental setup to investigate the physical phenomena involved in the thermal conductivity enhancement of nanofluids.
In recent years, experimental investigations on the effects of nanofluids on convective heat transfer coefficients in laminar and turbulent conditions were developed, demonstrating a significant improvement with respect to conventional heat transfer fluids [7].
Balla et al. [8] studied several suspensions of Cu and Zn nanoparticles with a size of 50 nm in water base fluid. They found that the heat transfer coefficient of nanofluids was higher than its base fluid. Similar results were found by Kai et al. [9] studying nanofluid heat transfer in a mini-tube using SiO2 nanoparticles.
Recently, several numerical and experimental studies on nanofluids and their applications have been developed, such as solar thermal systems. Lee et al. [10] and Alsalame et al. [11] studied photovoltaic thermal systems based on nanofluids. Colangelo et al. [12,13] experimentally investigated the use of nanofluids in flat solar thermal collectors: tests on traditional solar flat panels revealed some technical issues, due to the nanoparticles’ sedimentation. Therefore, the modification of the panel shape allowed this problem to be fixed. Flat plate solar collectors based on nanofluids were also studied by Chaji et al. [14]. Furthermore, the application of nanofluids on different solar thermal energy conversion systems was investigated in [15,16,17,18].
Different studies have been carried out to increase the performance of internal combustion engines. Zhang et al. [19] improved the heat-transfer performance of a diesel-engine cylinder head by means of a nanofluid coolant.
Micali et al. [20] developed an experimental campaign related to the use of CuO nanofluid as the coolant in a biodiesel four-strokes engine. They measured reductions in temperature up to 13.6% on the exhaust valve seat and up to 4.1% on the exhaust valve spindle.
Further studies related to the use of nanofluid within electronic devices [21], geothermal heat exchangers [22,23], and a cooling system for wind turbines [24], demonstrated a significant increase in heat transfer performance versus traditional fluids.
Considering these thermal performance improvements, the use of fluids containing suspended solid particles in HVAC systems is expected to show significant enhancements of their efficiency.
Devdatta et al. [25] observed that the use of nanofluids inside the heating system of the building is a suitable solution to reduce the size of the heat transfer system, and, in particular, the size of the heat exchangers, heat pumps and other components as well. This will reduce energy consumption and will, thus, indirectly reduce environmental pollution.
Ahmed and Ahmed Khan [26] used nanofluids in the external cooling jacket around the condenser of an air conditioner. In particular, they studied the benefits of two types of nanofluids, made of copper and aluminum oxide, respectively, on the performance of an air/water conditioner. Their experimental results showed a significant enhancement in the coefficient of performance (COP), up to 22.1% with Al2O3 nanofluid and 29.4% with CuO nanofluid.
Hatami et al. [27] experimentally tested three types of nanoparticles (SiO2, TiO2 and Carbon Nanotubes), dispersed in water inside HVAC systems. They found the best result, in terms of energy consumption reduction, with SiO2-based nanofluid.
In order to use nanofluids as a heat transfer fluid within full-scale HVAC systems, different problems have to be solved, such as nanoparticle stability in suspension [28] and increment of viscosity [29]. Regarding the first issue and according to Awais et al. [29], sedimentation and agglomeration of nanoparticles within nanofluids can produce fouling on heat transfer surfaces and, therefore, higher pressure drops and damages in ducts, pumps, etc. On the other hand, the use of nanoparticles, having an optimal shape, size and volume fraction in the base-fluid coupled with the addition of surfactants can improve the suspension stability, avoiding the above problems [30].
The electrical potential at the shear slippage plane is called the zeta potential (ZP), and its value aids in evaluating nanoparticles’ (NPs) stability in suspension [31,32], according to Bogdan [33] and Lee [34]: indeed, particles in colloidal suspension tend to develop a surface charge by the adsorption of ions from the base fluid. This superficial charge is double-layer-structured, with a sliding surface located beyond the first layer. In the nanofluid formulation used in this investigation, an anionic surfactant was used in order to improve the stability. The stability of the aluminum oxide suspension depends on the dispersant to modify the ZP and the surface repulsion between particles. In cases with anionic dispersant, a ZP value higher than 25 mV (absolute value) is necessary to achieve enough repulsion forces.
In the case of a sample at rest, the settling occurs over a long time, with 50% of particles settled in 6 months.
Regarding the second issue (viscosity), it is important to remark that the variation in nanofluid viscosity is directly proportional to the particles’ concentration in suspension. In the nanofluid formulation, a volume of only 2% nanoparticles has been added to achieve a very limited viscosity increment. Furthermore, the test campaign was carried out in a large HVAC system, where the relevant diameter of the pipes and relevant size of the heat exchangers limited the impact of viscosity increment on the pressure drop in the system. Pantzali et al. [35] studied nanofluid use in industrial applications, mainly focusing on the pressure drop increment related to the viscosity of the nanofluid. They concluded that in the case of industrial heat exchangers and large pipes with turbulent flow, usually developed inside, the substitution of conventional fluids by nanofluids had no relevant incidence on pressure drops in the system.
In order to overcome the above discussed problems, this work was based on a nanofluid composed of water–glycol and aluminum oxide (Al2O3) nanoparticles, having a controlled size distribution (Dv90 = 617 nm) and good stability, that deliver efficient, reliable, and consistent performance over a wide temperature range, with little effect on viscosity, and, therefore, on system fluid pumping energy. Particularly, in [36] Colangelo et al. developed dynamic simulations in order to compare the efficiency of two full-scale HVAC systems (installed at the educational building “Corpo O” in the Campus of University of Salento, Lecce, Italy), working with a traditional water–glycol mixture and with Al2O3-nanofluid, they found a numerical increment in efficiency of about 10%. As a follow-up to that study, the objective of this work was to carry out an extended experimental campaign on the same building in order to quantify, over a long period of time and under real operating conditions, the increase in performance of the HVAC system due to the use of nanofluids. These results will also allow the validation of the numerical results previously found, verifying their congruence with the experimental measurements.

2. Test Conditions and Experimental Apparatus

The experimental campaign was carried out on an educational building, named “Corpo O” (Figure 1), at the Campus of University of Salento, which is in Lecce, Italy at latitude 40°21′ and longitude 18°10′.
The building consists of two symmetrical wings (left and right wings), each of which has its own HVAC system. Each wing is composed of three floors: ground floor, first floor and second floor, with a total area of 2400 m2 and a total volume of 13,163 m3. The HVAC systems are used for air conditioning of offices and labs inside the building.
The experimental test campaign was focused on data acquisition during winter (heating mode) and summer (cooling mode).

2.1. Description of the Thermal System

Two symmetrical HVAC systems (named HVAC-1 and HVAC-2 in the following) are installed on the roof of the building, and each system is used for thermal conditioning of half of the building. Both systems are equipped with heat pumps (model CLIVET WSAN-XEE 302 [37]), having the following technical specifications (Table 1).
Finally, each HVAC unit supplies three pipelines, through which the heat transfer fluid is pumped:
  • Fan coils and radiator lines;
  • AHU line.

2.2. Nanofluid Characteristics

In order to evaluate the increase in performance due to the use of a nanofluid as a heat transfer fluid, in this study an aluminum oxide-based nanofluid has been loaded inside the HVAC-1 system. This nanofluid has been chosen taking into account its high stability and its low viscosity, which are comparable to the base fluid ones. Table 2 summarizes the main specifications of the nanofluid.
The nanofluid was made of aluminum oxide nanoparticles at 2% in volume concentration and size distribution with Dv90 = 617 nm, with a density of 1079 g/L. Density is strictly related to the particle concentration, therefore sample density has been measured over the test campaign to monitor sedimentation phenomena inside the system. According to regulation and restrictions, the use of propylene glycol in the composition of the nanofluid for the test campaign comes from the necessity to avoid a toxic grade of glycol, as ethylene glycol is.
The remaining 2% in weight are dispersants, anti-corrosion inhibitors and aluminum oxide nanoparticles.

2.3. Test Instrumentation and Data Acquisition System

The coefficient of performance (COP) of each HVAC unit was calculated as the ratio between thermal (Eth) and electrical (Eel) energy:
COP = Eth/Eel
Therefore, the energy monitoring system required the installation of several instrumentations, such as electricity meters, temperature sensors and mass flow rate meters:
  • electricity meters were used to measure current, tension, and electrical power absorbed by the HVAC systems. Data were collected for all pumps and heat pumps by means of the energy meter IME—NEMO D4—three phase (Figure 2). It measures active energy and energy/power, with an accuracy of ±1% for active energy, conforming to IEC62053-23, and ±2% for reactive energy, conforming to IEC61557-12;
  • thermal energy was evaluated by measuring the heat transfer fluid mass flow rate and its temperature at the heat pump inlet and outlet. In particular, the energy meter Caleffi—Conteca Easy is an ultrasonic direct heat meter with two temperature probes, with an accuracy of ≤0.05 °C and one flowmeter with an accuracy of ±2% according to EN 1434 (Figure 3);
  • environmental measurements (indoor and outdoor air temperature and RH) were carried out in order to analyze the heat pump performance under different meteorological conditions;
  • all data were recorded using a dedicated PLC to acquire and to store the data, sampled every 60 s by sensors, through the communication bus. Using the integrated web interface, it was possible to monitor consumption and other data and review data history (Figure 4).

2.4. Nanofluid Loading Procedure

The volume of heat transfer fluid within each HVAC thermal line was 1460 L. As the final step in preparing the building for experimental testing, the concentration of propylene glycol within the HVAC system (left and right wings of the building) was measured: it was the same in both systems and equal to 30% vol.
Therefore, the nanofluid was loaded within the HVAC-1 system (left wing) only, up to reach a nanoparticle concentration of 2% vol, leaving the right wing of the building (HVAC-2) loaded with the conventional water–propylene glycol heat transfer fluid: this approach allowed comparison of the performance of two identical systems, working with different heat transfer fluids at the same time.

3. Experimental Results

This paper summarizes and compares the heat pump performance, recorded in three experimental tests, carried out from February 2020 to March 2021, according to the following scheduling:
  • first test (heating mode): 10 February 2020–9 March 2020;
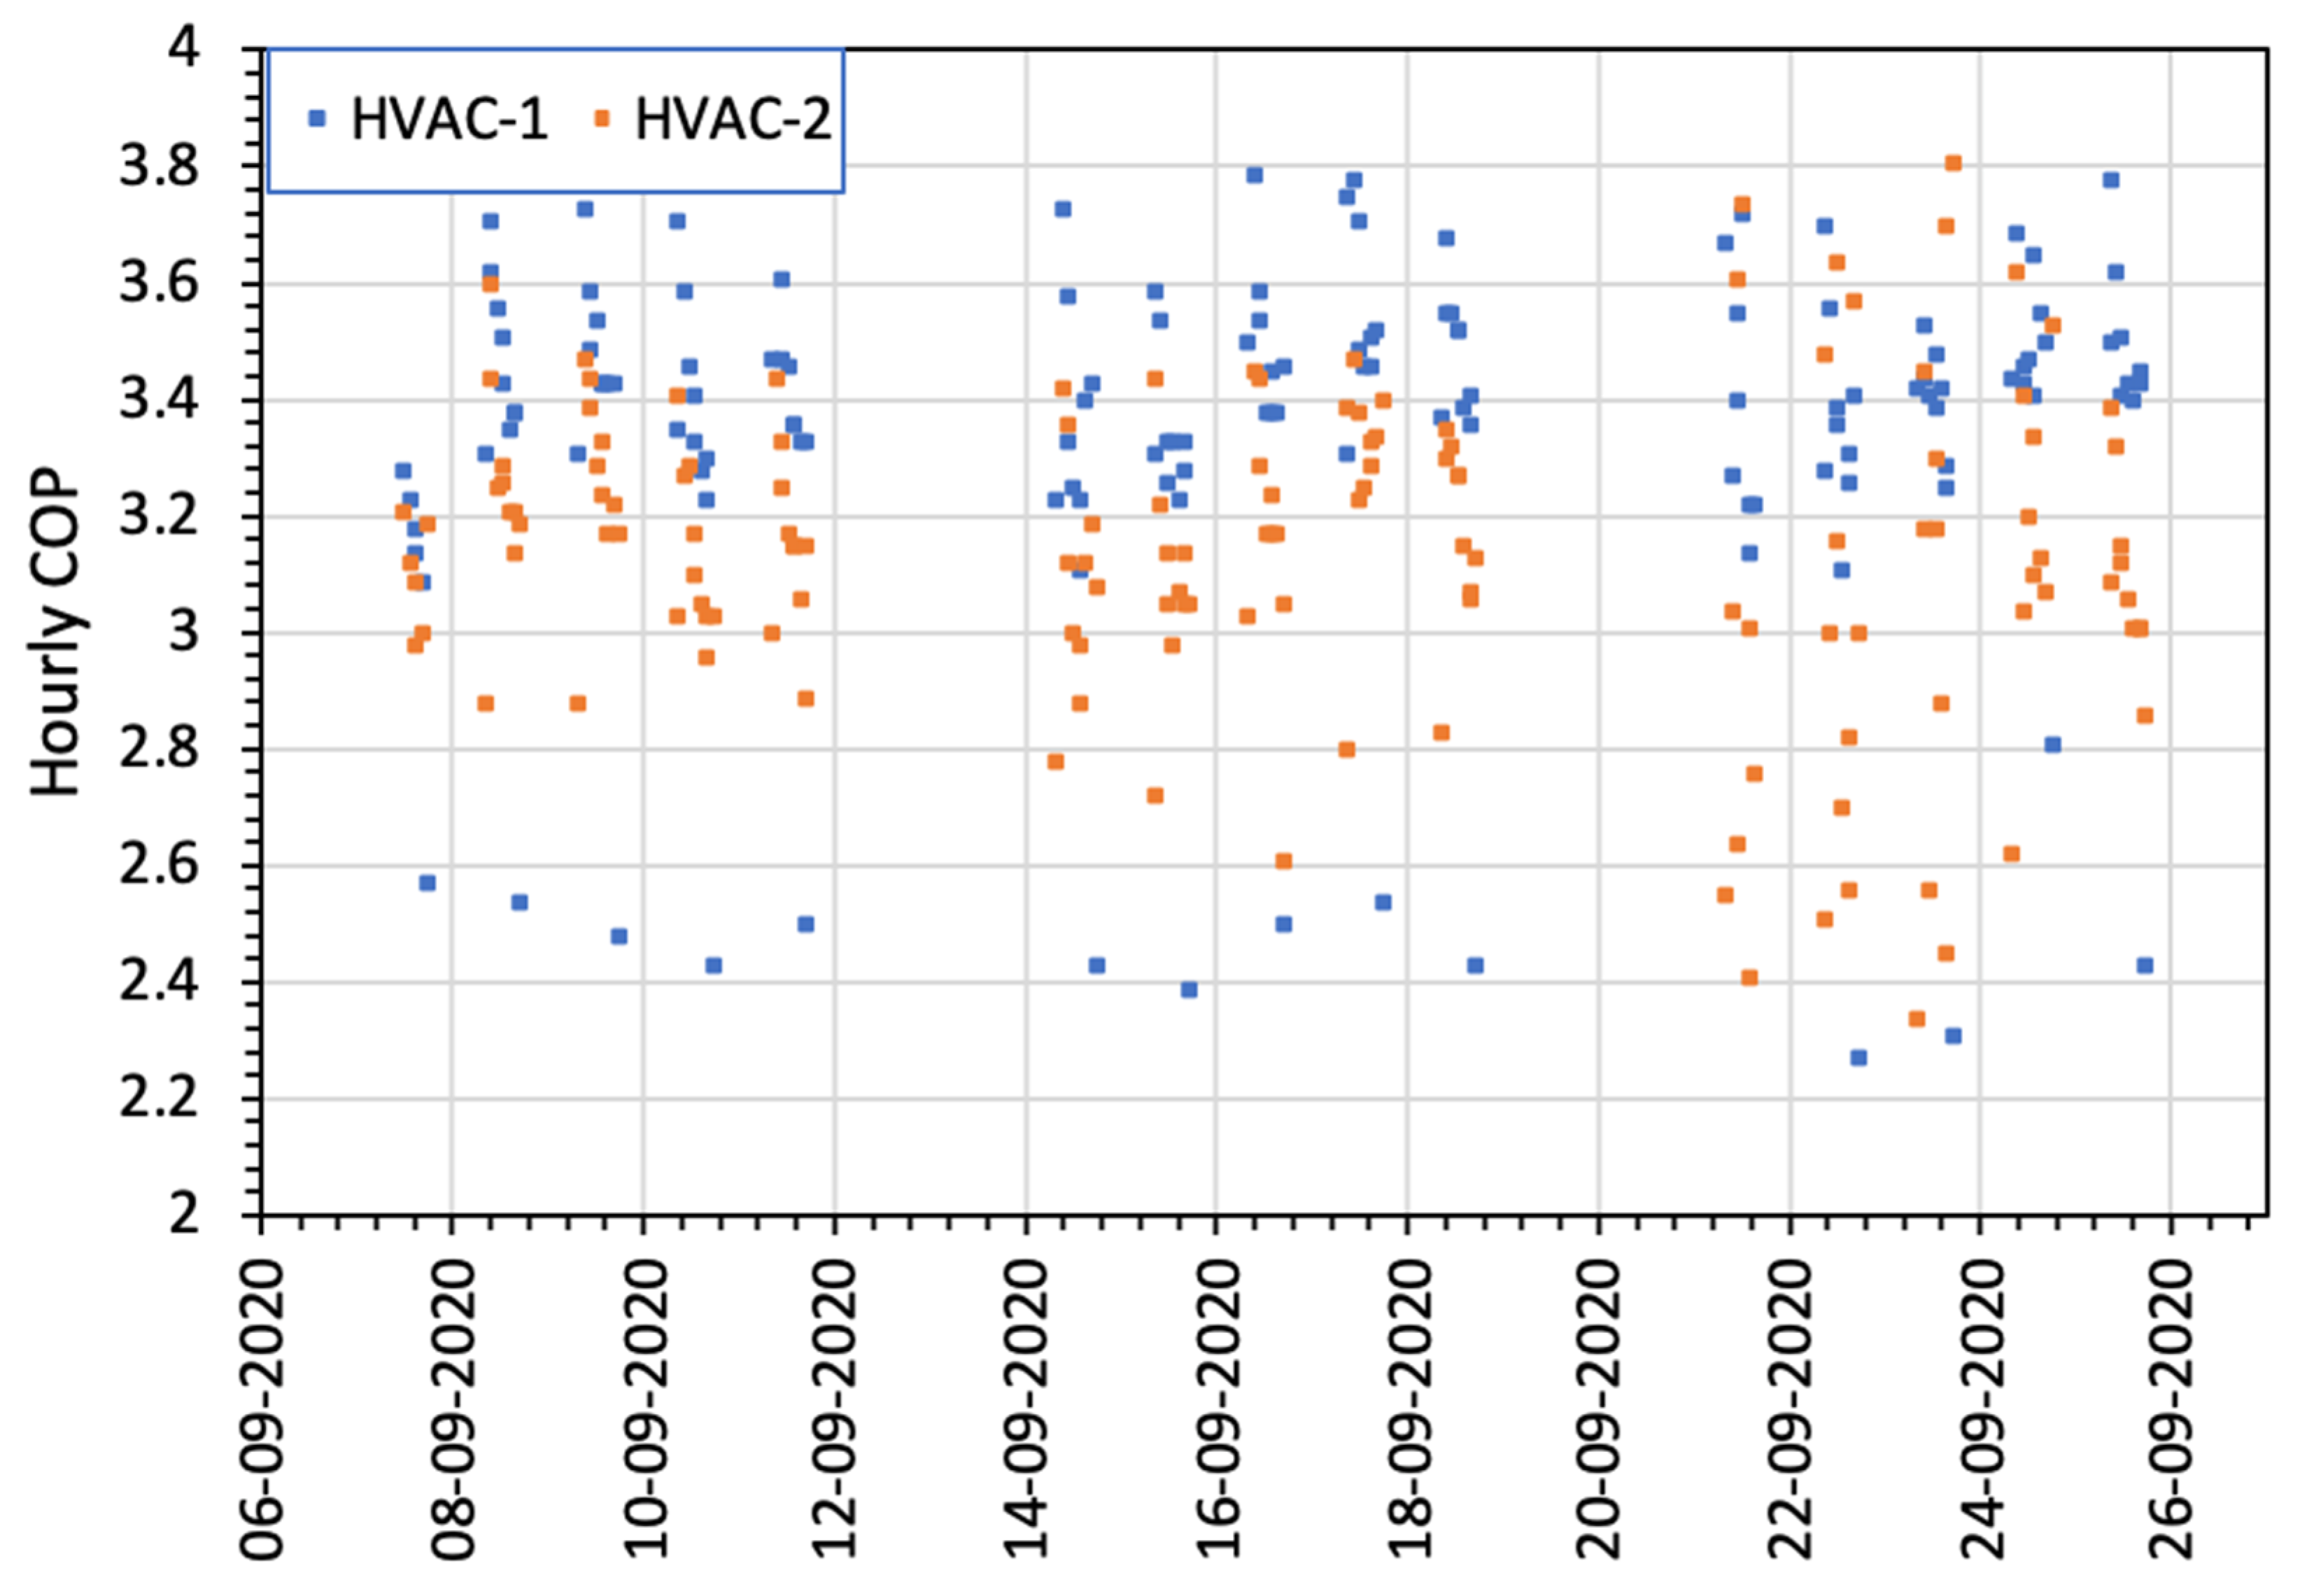
  • second test (cooling mode): 7 September 2020–25 September 2020;
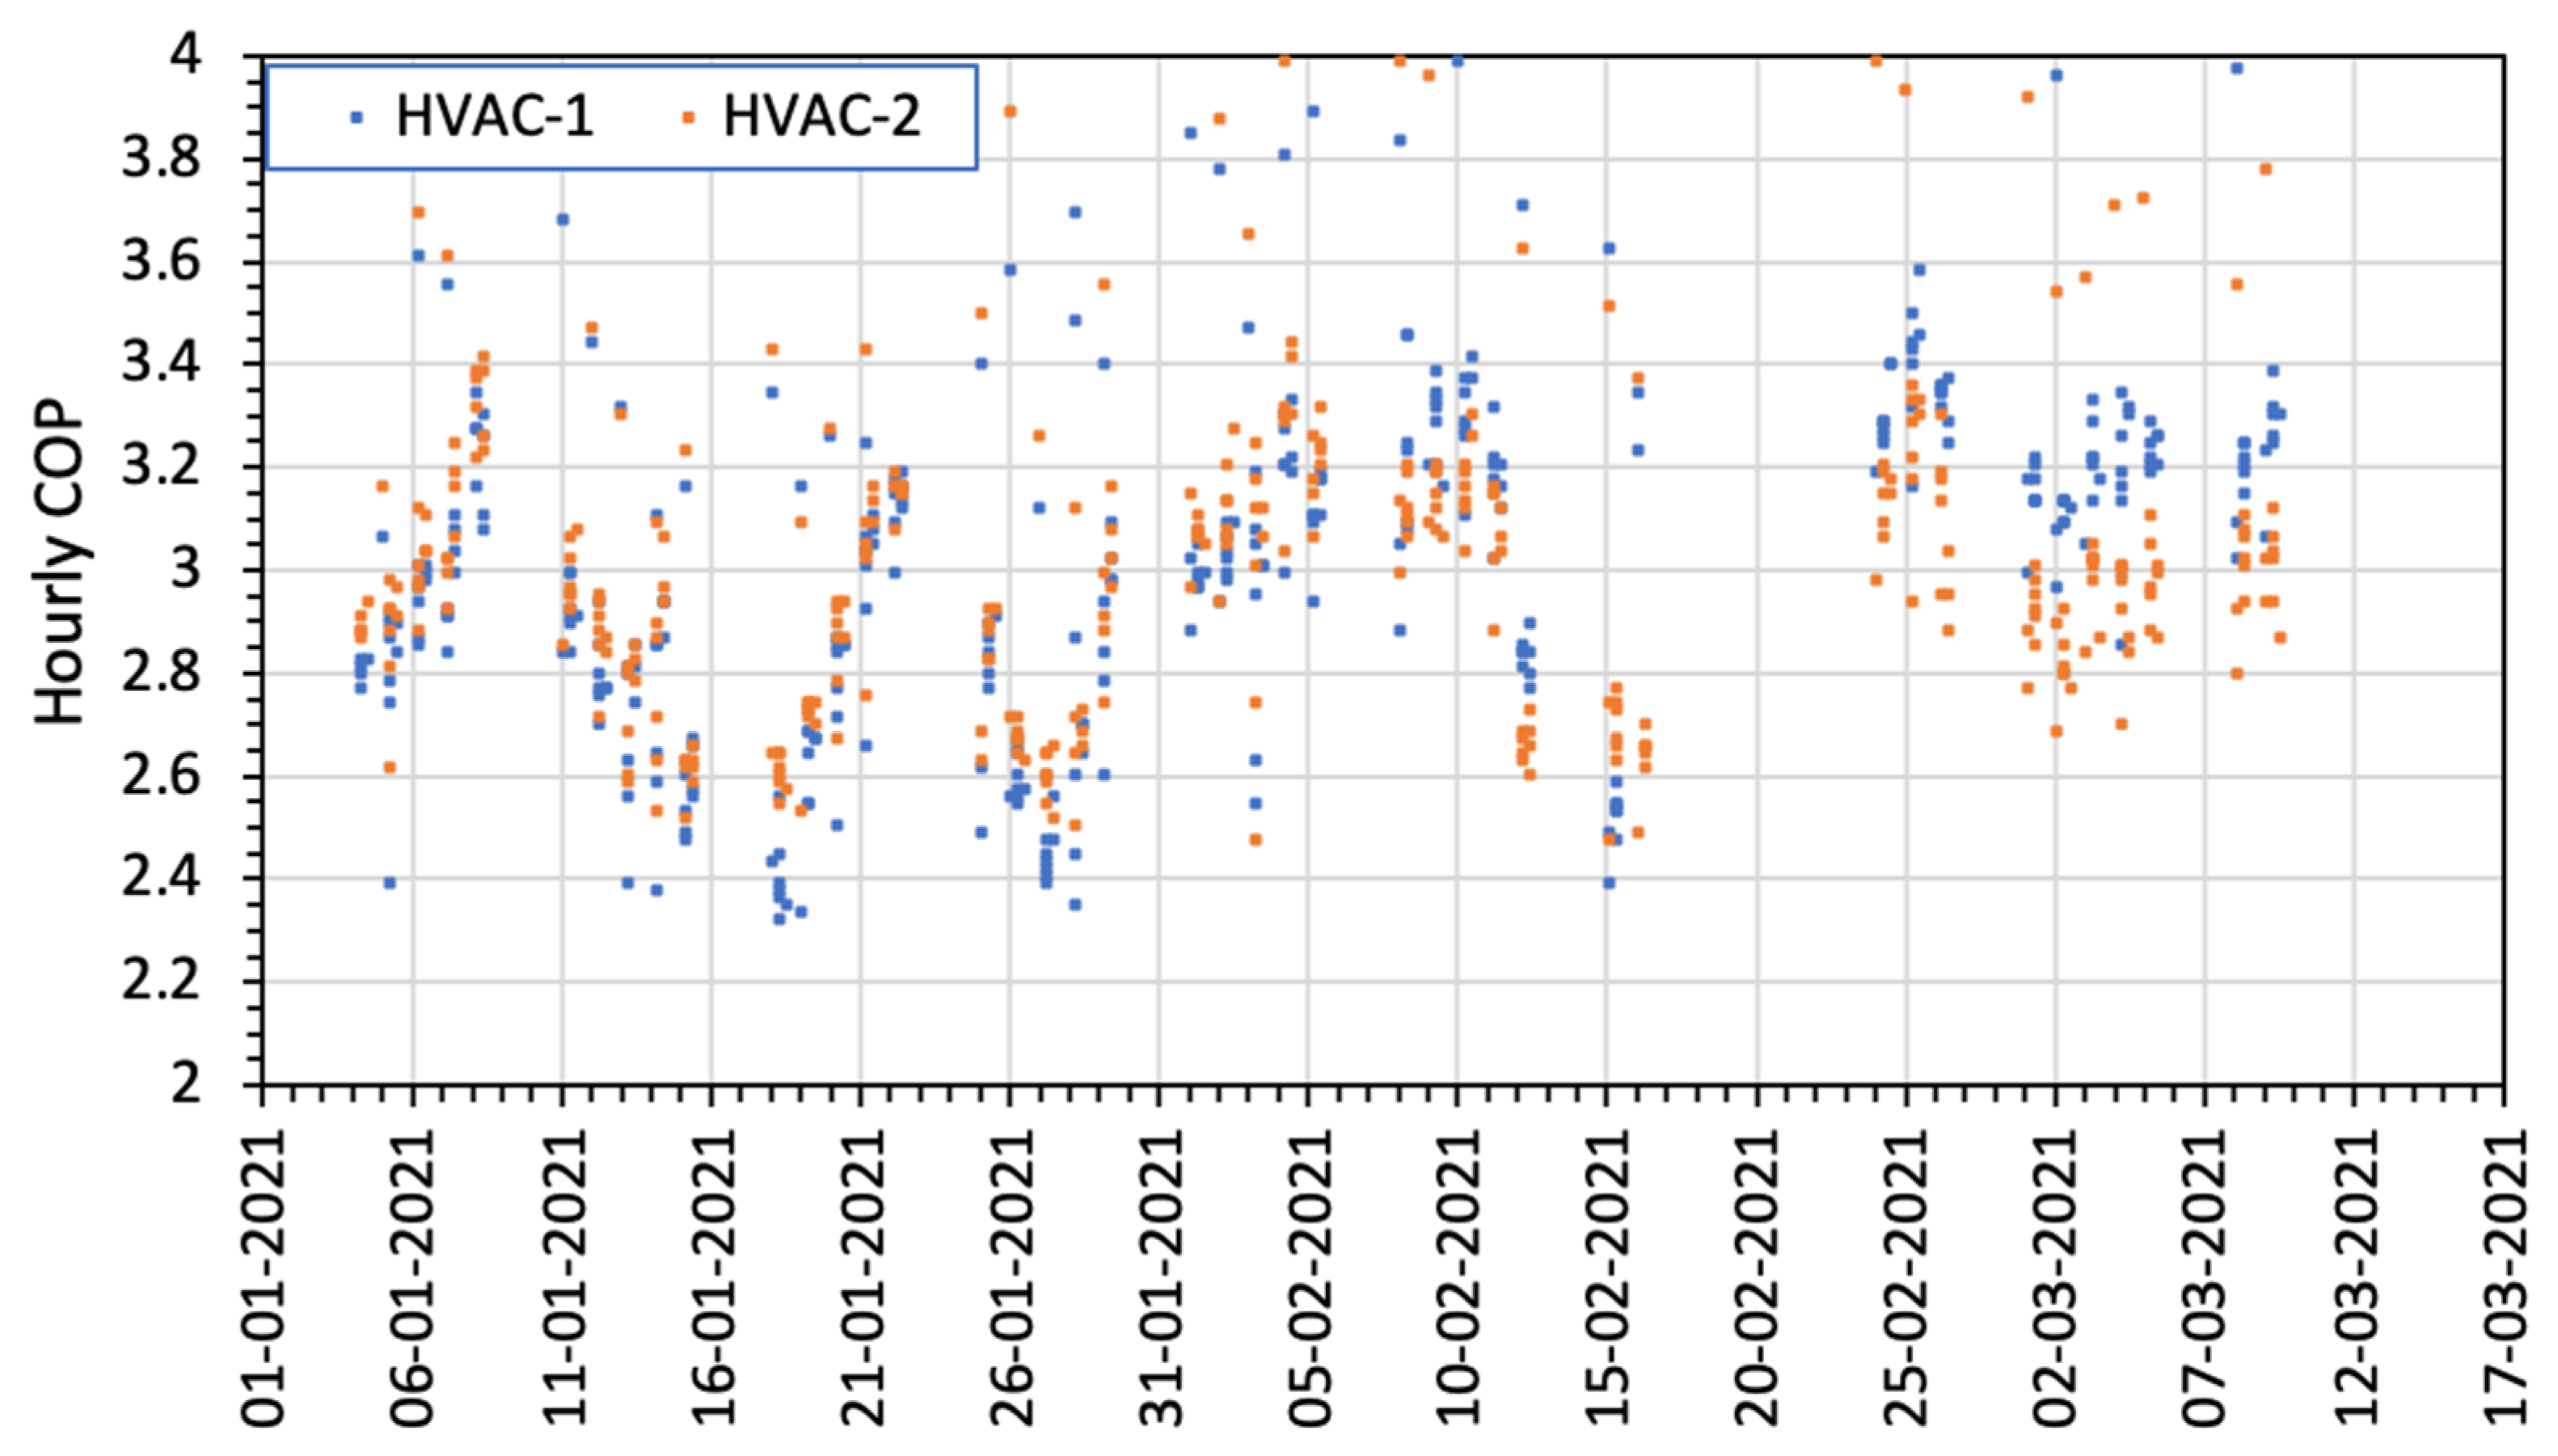
  • third test (heating mode): 27 November 2020–9 March 2021.
As this study referred to a real building, the parameters which can affect the performance of the HVAC systems cannot be fully controlled. For this reason, in order to minimize their effects, in this study the performance has been evaluated over a long period of time, balancing as much as possible, oscillations related to stochastic variables.

3.1. February–March 2020 Results

In the first week of monitoring (from 10 February 2020 to 14 February 2020), the HVAC-1 and HVAC-2 systems were loaded with the same heat transfer fluid (water–glycol 30% vol). During this period, a short database was acquired, to be used as reference data for the experiment. Then, on 17 February, nanofluid was loaded in the HVAC-1 and the next 7 working days were used to balance both the heat pumps by performing preliminary tests. After such balance, energy consumption comparison between both the machines was restarted on 26 February and continued until 9 March.
Figure 5 shows the hourly COP comparison between HVAC-1 and HVAC-2, while Figure 6 shows the average daily COP comparison and the daily COP ratio between HVAC-1 and HVAC-2.
In the first 3 days of monitoring (from 26 February to 28 February), after nanofluid loading, the mean increase in performance was 9.36%. However, the best performances were achieved in the last two weeks of experimental data acquisition, when the average increase in performance was 10.8%. On 12 March 2020, the HVAC systems were shut off.
During the acquisition period, the density of the nanofluid was measured weekly by sampling from the system in operation. Since it was 1079 g/L over the test period, a constant concentration of 2% of nanoparticles was ensured inside the system fluid.

3.2. September 2020 Results

Figure 7 and Figure 8 show the experimental results in terms of mean hourly COP and average daily COP obtained in September 2020. In this period, the HVAC machines worked as chillers in cooling mode.
It can be seen that increments in terms of COP were recorded during the entire period of experimentation, with lower values in the first week (average weekly increment equal to 6.7%), middle values in the second week (average weekly increment equal to 7.7%), and maximum values in the final week (average weekly increment equal to 11.2%), with a mean value of 8.9% over the entire period.
Nanoparticle concentration was measured before the data acquisition, in September. In fact, before the test period, the system was stopped from April to September. In that period, nanoparticle sedimentation occurred in the system. Density measured before the test campaign was 1065 g/L, therefore concentration was 1.7% in volume. Total re-dispersion of the nanoparticles was achieved after 29 h of the pumps being in operation, and the density was again 1079 g/L, therefore the concentration was again 2% (Figure 9).

3.3. February–March 2021 Results

In order to confirm the results acquired during winter 2020, the previous heat transfer fluid (water–glycol 30% vol) was reloaded within the HVAC-1 system and a long data set was acquired, in order to compare the performance of the two systems over a long time period (from 27 November 2020 to 5 February 2021). Therefore, on 8 February, the nanofluid was reloaded again within the HVAC-1 system and the performance was monitored until 9 March 2021. Figure 10 shows the hourly COP comparison between HVAC-1 and HVAC-2, from 1 January 2021 to 9 March 2021.
It can be seen that the hourly COP values related to the HVAC-2 (orange dots), until 5 February are mainly higher than the HVAC-1 values. After loading the nanofluid (8 February) the trend reverses, with blue dots over orange ones.
This effect is particularly visible in Figure 11, where a comparison of the instantaneous COP is shown, following the loading of the nanofluid around noon. A significant increase in HVAC-1 performance is evident, due to the heat transfer fluid change.
Finally, Figure 12 shows the average daily COP comparison and the daily COP ratio between HVAC-1 and HVAC-2 from 27 November 2020 to 9 March 2021. Clearly, it can be observed that during the entire experimental period, in which the two plants operated with the same fluid (from 27 November to 5 February), the performance of HVAC-1 was worse than HVAC-2, with an average COP1/COP2 ratio of 0.970. After the nanofluid loading, for the period from 9 February to 9 March 2021, the COP1/COP2 ratio was 1.078, with a peak of 1.121 and an average increase of 10.5%.
All the results shown in the above graphs demonstrate that the increased performance of the HVAC-2 system is not due to favorable environmental conditions, but only to the positive action of the nanofluid. The above discussed experimental results essentially agree with the numerical results found by Colangelo et al. [36].
In order to better understand the results described above, the performances of the HVAC-1 working with the base fluid and nanofluid have been investigated in depth and compared. In particular, the data related to the period January–March 2021 have been collected as a function of outside air temperature and fluid temperature at the inlet of HVAC-1. These parameters have been chosen since they directly affect the heat pump COP. Figure 13 shows the results.
As it can be seen, the COP was strongly influenced by the operating conditions of the heat pump. Nevertheless, the performance growth between the base fluid (data until 5 February) and nanofluid (data related to the following days) seems quite constant during the whole period of experimentation and equal to 13% on average.

3.4. Practical Significance/Usefulness

The results of this work suggest that the use of nanofluids within hydronic HVAC systems can have a big impact from an environmental, energetic and economic perspective. In fact, taking into account the annual energy consumption of the building “Corpo O” [36], it was possible to calculate annual energy savings equal to 50.2 MWh. According to the Italian CO2 emission factor [38], it was possible to preliminarily evaluate an annual avoided CO2 emission equal to 21.8 tons related to the use of the nanofluid.
Finally, it is important to remark that the replacement of the traditional heat transfer fluid with a high performance nanofluid does not require important modification to the HVAC plant, resulting in an easy and effective retrofitting of old systems.

4. Conclusions

In this work, we investigated the performances of two full-scale HVAC systems, installed at the educational building “Corpo O” in the Campus of University of Salento, Lecce, Italy, working with a conventional water–glycol mixture and with Al2O3-nanofluid. In particular, the nanofluid was composed of water–glycol and 2% vol aluminum oxide (Al2O3) nanoparticles, having a controlled size distribution between 100 nm and 600 nm and a controlled stable suspension during the operation in the system. Long term stability of the nanofluid caused reliable and consistent thermal performance over a wide temperature range with limited effects on viscosity.
The results obtained in three experimental campaigns allowed both to quantify the performance increase due to the use of nanofluid instead of the conventional water and glycol mixture:
(1)
under real operating conditions, the increase in energy efficiency due to the nanofluid of HVAC-1 with respect to HVAC-2, working simultaneously, has been on average equal to 9.8% in winter and 8.9% in summer, with average daily peaks of about 15%.
(2)
the comparison between the performance of the same HVAC system, working in different comparable periods with and without nanofluid, shows a mean increase in COP equal to about 13%
(3)
nanofluid density was monitored over the period of the test. Constant density was measured, and therefore a stable suspension of the nanofluid was found inside the distribution system of HVAC-1.
Although the relationship between the HVAC system performance and the use of nanofluids needs to be better investigated, the results of this work suggest that nanofluids can significantly improve the performance of air conditioning systems.

Author Contributions

Conceptualization, M.M. and A.d.R.; methodology, M.M., F.M. and G.C.; validation, M.M. and G.C.; writing—original draft preparation, M.M. and F.M.; writing—review and editing, M.M. and G.C.; supervision, A.d.R.; project administration, A.d.R.; funding acquisition, A.d.R. All authors have read and agreed to the published version of the manuscript.

Funding

This research received no external funding.

Conflicts of Interest

The authors declare no conflict of interest.

References

  1. Saidur, R.; Leong, K.Y.; Mohammed, H.A. A review on applications and challenges of nanofluids. Renew. Sustain. Energy Rev. 2011, 15, 1646–1668. [Google Scholar] [CrossRef]
  2. Lomascolo, M.; Colangelo, G.; Milanese, M.; de Risi, A. Review of heat transfer in nanofluids: Conductive, convective and radiative experimental results. Renew. Sustain. Energy Rev. 2015, 43, 1182–1198. [Google Scholar] [CrossRef]
  3. Lee, S.; Choi, S.U.S.; Li, S.; Eastman, J.A. Measuring thermal conductivity of fluids containing oxide nanoparticles. J. Heat Transf. 1999, 121, 280–289. [Google Scholar] [CrossRef]
  4. Beck, M.P.; Yuan, Y.; Warrier, P.; Teja, A.S. The effect of particle size on the thermal conductivity of alumina nanofluids. J. Nanopart. Res. 2009, 11, 1129–1136. [Google Scholar] [CrossRef]
  5. Colangelo, G.; Milanese, M.; Iacobazzi, F.; De Risi, A. Experimental setup for low temperature thermal conductivity analysis of micro and nano suspensions. AIP Conf. Proc. 2019, 2191, 020050. [Google Scholar]
  6. Colangelo, G.; Favale, E.; Miglietta, P.; Milanese, M.; de Risi, A. Thermal conductivity, viscosity and stability of Al2O3-diathermic oil nanofluids for solar energy systems. Energy 2016, 95, 124–136. [Google Scholar] [CrossRef]
  7. Colangelo, G.; Diamante, N.F.; Milanese, M.; Starace, G.; de Risi, A. A critical review of experimental investigations about convective heat transfer characteristics of nanofluids under turbulent and laminar regimes with a focus on the experimental setup. Energies 2021, 14, 6004. [Google Scholar] [CrossRef]
  8. Balla, H.; Abdullah, S.; Faizal, W.M.W.; Zulkifli, R.; Sopian, K. Enhancement of heat transfer coefficient multi-metallic nanofluid with ANSIS modeling for thermophysical properties. Therm. Sci. 2015, 9, 1613–1620. [Google Scholar] [CrossRef]
  9. Kai, L.C.; Abdullah, M.Z.; Ismail, M.Z.; Mamat, H. Enhancement of nanofluid heat transfer in a mini-tube using SiO2 nanoparticles. Adv. Mater. Process. Technol. 2019, 5, 607–616. [Google Scholar] [CrossRef]
  10. Lee, J.H.; Hwang, S.G.; Lee, G.H. Efficiency improvement of a photovoltaic thermal (PVT) system using nanofluids. Energies 2019, 12, 3063. [Google Scholar] [CrossRef] [Green Version]
  11. Colangelo, G.; Favale, E.; Miglietta, P.; de Risi, A. Innovation in flat solar thermal collectors: A review of the last ten years experimental results. Renew. Sustain. Energy Rev. 2016, 57, 1141–1159. [Google Scholar] [CrossRef]
  12. Colangelo, G.; Favale, E.; de Risi, A.; Laforgia, D. A new solution for reduced sedimentation flat panel solar thermal collector using nanofluids. Appl. Energy 2013, 111, 80–93. [Google Scholar] [CrossRef]
  13. Alsalame, H.A.M.; Hee Lee, J.; Hyun Lee, G. Performance Evaluation of a Photovoltaic thermal (PVT) system using nanofluids. Energies 2021, 14, 301. [Google Scholar] [CrossRef]
  14. Milanese, M.; De Risi, A.; Colangelo, G. Energy simulation of a nanofluid solar cooling system in Italy. Proc. Inst. Civ. Eng. Eng. Sustain. 2018, 172, 32–39. [Google Scholar]
  15. Marefati, M.; Huang, W. Energy, exergy, environmental and economic comparison of various solar thermal systems using water and Thermic Oil B base fluids, and CuO and Al2O3 nanofluids. Energy Rep. 2020, 6, 2919–2947. [Google Scholar]
  16. Sattar, A.; Faroop, M.; Amjad, M.; Saeed, M.; Nawaz, S.; Mujataba, M.A.; Anwar, S.; Ali, Q.; Imran, M.; Pettinau, A. Performance evaluation of a direct absorption collector for solar thermal energy conversion. Energies 2020, 13, 4956. [Google Scholar] [CrossRef]
  17. Colangelo, G.; D’Andrea, G.; Franciosa, M.; Milanese, M.; De Risi, A. Dynamic simulation of a solar cooling HVAC system with nanofluid solar collector. In Proceedings of the International Conference ZEMCH, Lecce, Italy, 22–24 September 2015. [Google Scholar]
  18. Chaji, H.; Ajabshirchi, Y.; Esmaeilzadeh, E.; Heris, S.Z.; Hedayatizadeh, M.; Kahani, M. Experimental study on thermal efficiency of flat plate solar collector using TiO2/Water nanofluid. Appl. Sci. 2013, 7, 60–70. [Google Scholar] [CrossRef]
  19. Zhang, Z.D.; Zheng, W.; Su, Z.G. Study on diesel cylinder-head cooling using nanofluid coolant with jet impingement. Therm. Sci. 2015, 19, 2025–2037. [Google Scholar]
  20. Micali, F.; Milanese, M.; Colangelo, G.; de Risi, A. Experimental investigation on 4-strokes biodiesel engine cooling system based on nanofluid. Renew. Energy 2018, 125, 319–326. [Google Scholar] [CrossRef]
  21. Colangelo, G.; Favale, E.; Milanese, M.; de Risi, A.; Laforgia, D. Cooling of electronic devices: Nanofluids contribution. Appl. Therm. Eng. 2017, 127, 421–435. [Google Scholar] [CrossRef]
  22. Du, R.; Jiang, D.; Wang, Y. Numerical investigation of the effect of nanoparticle diameter and sphericity on the thermal performance of geothermal heat exchanger using nanofluid as heat transfer fluid. Energies 2020, 13, 1653. [Google Scholar] [CrossRef] [Green Version]
  23. Hui Sun, X.; Yan, H.; Massoudi, M.; Chen, Z.H.; Wu, W.T. Numerical simulation of nanofluid suspension in a geothermal heat exchanger. Energies 2018, 11, 1919. [Google Scholar] [CrossRef] [Green Version]
  24. De Risi, A.; Milanese, M.; Colangelo, G.; Laforgia, D. High Efficiency Nanofluid Cooling System for Wind Turbines. Therm. Sci. 2014, 18, 543–554. [Google Scholar]
  25. Kulkarni, D.P.; Das, D.K.; Vajjha, R.S. Application of nanofluids in heating buildings and reducing pollution. Appl. Energy 2009, 86, 2566–2573. [Google Scholar] [CrossRef]
  26. Ahmed, F.; Khan, W.A. Efficiency enhancement of an air-conditioner utilizing nanofluid: An experimental study. Energy Rep. 2021, 7, 575–583. [Google Scholar] [CrossRef]
  27. Hatami, M.; Domairry, G.; Mirzababaei, S.N. Experimental investigation of preparing and using the H2O based nanofluids in the heating process of HVAC system model. Int. J. Hydrogen Energy 2017, 42, 7820–7825. [Google Scholar] [CrossRef]
  28. Ghadimi, A.; Saidur, R.; Metsetaar, H.S.C. A review of nanofluid stability properties and characterization in stationary conditions. Int. J. Heat Mass Transf. 2011, 54, 4051–4068. [Google Scholar] [CrossRef]
  29. Awais, M.; Ullah, N.; Ahmad, J.; Sikandar, F.; Ehsan, M.M.; Salehin, S. Bhuiyan, A.A. Heat transfer and pressure drop performance of Nanofluid: A state-of-the-art review. Int. J. Thermofluids 2021, 9, 100065. [Google Scholar] [CrossRef]
  30. Hwang, Y.; Lee, J.K.; Lee, C.H.; Jung, Y.M.; Cheong, S.I.; Lee, C.G.; Ku, B.C.; Jang, S.P. Stability and thermal conductivity characteristics of nanofluids. Thermochim. Acta 2007, 455, 70–74. [Google Scholar] [CrossRef]
  31. Iacobazzi, F.; Colangelo, G.; Milanese, M.; De Risi, A. Thermal conductivity difference between nanofluids and micro-fluids: Experimental data and theoretical analysis using mass difference scattering. Therm. Sci. 2019, 23, 3797–3807. [Google Scholar] [CrossRef]
  32. Iacobazzi, F.; Milanese, M.; Colangelo, G.; de Risi, A. A critical analysis of clustering phenomenon in Al2O3 nanofluids. J. Therm. Anal. Calorim. 2019, 135, 371–377. [Google Scholar] [CrossRef]
  33. Bogdan, N.; Vetrone, F.; Ozin, G.A.; Capobianco, J.A. Synthesis of ligand-free colloidally stable water dispersible brightly luminescent lanthanide-doped upconverting nanoparticles. Nano Lett. 2011, 11, 835–840. [Google Scholar] [CrossRef] [PubMed]
  34. Lee, J.; Kim, M.; Hong, C.K.; Shim, S.E. Measurement of the dispersion stability of pristine and surface-modified multiwalled carbon nanotubes in various nonpolar and polar solvents. Meas. Sci. Technol. 2007, 18, 3707. [Google Scholar] [CrossRef]
  35. Pantzali, M.N.; Mouza, A.A.; Paras, S.V. Investigating the efficacy of nanofluids as coolants in plate heat exchangers (PHE). Chem. Eng. Sci. 2009, 64, 3290–3300. [Google Scholar] [CrossRef]
  36. Colangelo, G.; Raho, B.; Milanese, M.; de Risi, A. Numerical evaluation of a HVAC system based on a high-performance heat transfer fluid. Energies 2021, 14, 3298. [Google Scholar] [CrossRef]
  37. Available online: https://www.clivet.com (accessed on 16 March 2022).
  38. Available online: https://www.isprambiente.gov.it/files2020/pubblicazioni/rapporti/Rapporto317_2020.pdf (accessed on 16 March 2022).
Figure 1. Building “Corpo O” at Campus Ecotekne of the University of Salento in Lecce, Italy.
Energies 15 02902 g001
Figure 2. Acquisition system for the electrical energy measurements IME—NEMO D4.
Energies 15 02902 g002
Figure 3. Drawing of the acquisition system for thermal energy Caleffi—Conteca Easy—Ultra.
Energies 15 02902 g003
Figure 4. HVAC system with data sensors positions and flowchart of test methodology.
Energies 15 02902 g004
Figure 5. Hourly COP comparison between HVAC-1 and HVAC-2 (10 February 2020–9 March 2020).
Energies 15 02902 g005
Figure 6. Average daily COP comparison and daily COP ratio between HVAC-1 and HVAC-2 (10 February 2020–9 March 2020).
Energies 15 02902 g006
Figure 7. Hourly COP comparison between HVAC-1 and HVAC-2 (7 September 2020–25 September 2020).
Energies 15 02902 g007
Figure 8. Average daily COP comparison and daily COP ratio between HVAC-1 and HVAC-2 (7 September 2020–25 September 2020).
Energies 15 02902 g008
Figure 9. Nanofluid dispersion during weight measurements in lab. (a) Density = 1065 g/L before pumps switched on. Concentration (1.7%); (b) Density = 1079 g/L after 29 h of running pumps. Concentration (2.0%).
Energies 15 02902 g009
Figure 10. Hourly COP comparison between HVAC-1 and HVAC-2 (1 January 2021–9 March 2021).
Energies 15 02902 g010
Figure 11. Instantaneous COP comparison between HVAC-1 and HVAC-2. Data acquired on 8 February 2021.
Energies 15 02902 g011
Figure 12. Average daily COP comparison and daily COP ratio between HVAC-1 and HVAC-2 (27 November 2020–9 March 2021).
Energies 15 02902 g012
Figure 13. Average COP of HVAC-1 working with base fluid and nanofluid (January 2021–March 2021).
Energies 15 02902 g013
Table 1. Characteristics of the heat pump CLIVET WSAN-XEE 302 [37].
CharacteristicsValue
Compressor
Type2 Scroll
Refrigerant charge8.28 L
Internal heat exchanger
Water flow3.4 L/s
Maximum water flow5.4 L/s
Pressure drop41.9 kPa
Useful pump discharge131 kPa
External heat exchanger
Fans6
Standard air flow6971 L/s
Installed power unit0.18 kW
Expansion vessel
Capacity5 l
Maximum pressure on the water 550 kPa
Storage tank
Inertial tank130 L
Table 2. Specifications of the nanofluid.
CharacteristicsValue
Composition (% by weight):
Propylene Glycol37
Performance Additives2
Water61
ColorWhite
OdorOdorless
pH10
Specific Weight (kg/m3) at 25 °C1.079
Operating Range (°C)−22 to 65
Freeze Point (°C)−22
Burst Point (°C)−51
Boiling Point (°C)105
Thermal Conductivity (W/m K) at 20 °C0.471
Specific Heat (kJ/kg K) at 20 °C3.51
Viscosity (mPa s) at 20 °C4.74
Publisher’s Note: MDPI stays neutral with regard to jurisdictional claims in published maps and institutional affiliations.

