Article

Two-Stage Energy Management Strategies of Sustainable Wind-PV-Hydrogen-Storage Microgrid Based on Receding Horizon Optimization

1
State Grid Jilin Electric Power Research Institute, Changchun 130000, China
2
Institute of Electrical Engineering, Chinese Academy of Sciences, Beijing 100190, China
*
Author to whom correspondence should be addressed.
Energies 2022, 15(8), 2861; https://doi.org/10.3390/en15082861
Submission received: 1 March 2022 / Revised: 31 March 2022 / Accepted: 5 April 2022 / Published: 14 April 2022
(This article belongs to the Special Issue Situation Awareness for Smart Distribution Systems)

Abstract

:
Hydrogen and renewable electricity-based microgrid is considered to be a promising way to reduce carbon emissions, promote the consumption of renewable energies and improve the sustainability of the energy system. In view of the fact that the existing day-ahead optimal operation model ignores the uncertainties and fluctuations of renewable energies and loads, a two-stage energy management model is proposed for the sustainable wind-PV-hydrogen-storage microgrid based on receding horizon optimization to eliminate the adverse effects of their uncertainties and fluctuations. In the first stage, the day-ahead optimization is performed based on the predicted outpower of WT and PV, the predicted demands of power and hydrogen loads. In the second stage, the intra-day optimization is performed based on the actual data to trace the day-ahead operation schemes. Since the intra-day optimization can update the operation scheme based on the latest data of renewable energies and loads, the proposed two-stage management model is effective in eliminating the uncertain factors and maintaining the stability of the whole system. Simulations show that the proposed two-stage energy management model is robust and effective in coordinating the operation of the wind-PV-hydrogen-storage microgrid and eliminating the uncertainties and fluctuations of WT, PV and loads. In addition, the battery storage can reduce the operation cost, alleviate the fluctuations of the exchanged power with the power grid and improve the performance of the energy management model.

1. Introduction

In order to protect the environment and cope with the energy crisis, the renewable energies, such as wind and solar, are being exploited in a more widespread way. However, the randomness and intermittency of renewable electricity are still challenging issues for the large-scale connection to the power grid [1].
Since hydrogen has the advantages of high-energy density, being environmentally friendly and easy storage, it has been regarded as a promising energy carrier and electricity storage medium to reduce carbon emission, improve the sustainability of the energy system, promote the consumption of renewable energies and alleviate their volatility [2]. Hydrogen can either be produced centrally from renewable electricity through electrolyzers situated close to wind or PV power plants and then transported to hydrogen consumers or can be directly generated on sites close to hydrogen consumers [3]. Though mass production in a central manner is more economical, the high transportation cost may erase the advantages of this hydrogen production mode. Consequently, the distributed hydrogen production mode based on a renewable energy microgrid is considered to be an effective way to reduce hydrogen production and transportation costs and promote the consumptions of distributed renewable energies [4]. The distributed hydrogen production mode based on a renewable energy microgrid has attracted more attention, and research is focused on the aspects of modeling, techno-economic analysis, cooperative operation and optimal planning, etc. For example, the accurate modeling method of the advanced alkaline electrolyzer system is proposed and demonstrated in [5]. The techno-economic feasibility of the production of hydrogen from the PV-wind microgrid has been evaluated in [6]. A cooperative operation method to increase profits for wind turbines and onsite hydrogen production and fueling stations has been proposed in [7]. A Nash-bargaining-based cooperative planning and operation method for a wind-hydrogen-heat multi-agent energy system has been proposed in [8]. In addition, optimal capacity planning of an isolated, batteryless, hydrogen-based microgrid is proposed in [9].
Due to the stochastic volatility of renewable electricity, such as wind power and PV, not only affecting the stable operation of the hydrogen production system, but also affecting hydrogen purity, the question of how to relieve the adverse effects of the uncertainties and volatility of the renewable energies is still a critical challenge and an open problem, which has drawn more and more attention. The energy management strategy based on model predictive controller or receding horizon optimization is considered to be one of the promising methods. For instance, an energy management strategy is proposed for a renewable hydrogen-based microgrid in [10], and both the long- and short-term optimal operation schedules are obtained by the model predictive controller. In [11], an energy management strategy based on the receding-horizon stochastic optimization method is proposed to increase renewable penetration and improve operational flexibility of the PV-hydrogen microgrids. In [12], a flexible weighted model predictive control energy management strategy is proposed for a multi-energy microgrid with the hydrogen energy storage system and the heat storage system. In [13], a real-time energy management method based on model predictive control is proposed for a microgrid composed of PV, battery, electrolyzer and fuel cell. In [14], in order to maximize the operational benefit of the microgrid and minimize the degradation causes of each storage system, energy management based on the model predictive control method is proposed. The energy management strategies proposed above all show good performance in relieving the uncertainties of renewable energies or loads. Furthermore, the energy storage as well as the demand response technologies is also helpful in mitigating the power fluctuations of the renewable energy microgrid. For example, in [15], the conventional operation strategy, demand response strategy for peak shaving, has been comparatively studied for grid-connected photovoltaic (PV)-hydrogen/battery systems and the battery storage has an important role in reducing the operation cost and mitigating the power fluctuation. In [16], the accurate model of a hybrid energy system including solar energy, lithium-ion battery and hydrogen is proposed; the coordinated operations of the short-term lithium-ion battery and long-term hydrogen storage show great advantage in keeping energy balanced and mitigating the power fluctuation of renewable energies. In [17], the advantages in reducing operation cost and relieving the intermittent use of a pumped-storage system with a dynamic tariff demand response strategy have been demonstrated in a system consisting of wind turbines, a photovoltaic array and a pumped hydro energy storage system. In order to improve the reliability and mitigate the stochastic volatility of wind farms, an optimal coordination operation and planning method of kinetic energy storage is proposed in [18]; simulation results show that the proposed method is effective in identifying the minimum capacity of kinetic energy storage and improving power supply reliability. Likewise, an optimization energy management method is proposed in [19] to reduce the operation cost of a wind power plant-flywheel energy storage system; simulation results show that the flywheel energy storage method is effective in relieving the stochastic fluctuation of wind power. In [20], a planning method is proposed to optimize the structure of the PV-wind-electrochemical storage system, and the energy storage system has been shown to play an important role in improving the power supply reliability.
These research results have laid a good foundation for the energy management problem of the renewable-energy-based microgrid. However, the energy management problem for the wind-PV-hydrogen-battery microgrid is still an open problem; the questions of how to mitigate the adverse effects of the stochastic and uncertain factors of renewable electricity and how to coordinate the operation of the whole system still need further investigation.
In order to alleviate the uncertainties and fluctuations of outpower of WT and PV, and the power and hydrogen demands, this paper proposes a two-stage energy management model for the sustainable wind-PV-hydrogen-storage microgrid based on receding horizon optimization, and the role of energy storage has also been explored. The main contributions are as follows.
(1)
A two-stage energy management model based on receding horizon optimization is proposed to tackle the uncertainties and randomness of renewable energies and loads, as well as to minimize the operation cost.
(2)
The day-ahead optimization is performed to minimize the overall operation cost, while the intra-day optimization model is carried out to trace the day-ahead schemes and minimize the deviations of the intra-day and the day-ahead operation strategies.
(3)
The roles of battery storage in reducing operation cost and improving the performance of the energy management model have been explored and demonstrated.
The remainder of this paper is organized as follows. Section 2 introduces the structures and the subsystem models of the sustainable wind-PV-hydrogen-storage microgrid. Section 3 proposes the two-stage energy management model. Section 4 presents the simulation and result analysis. At last, Section 5 draws the conclusion.

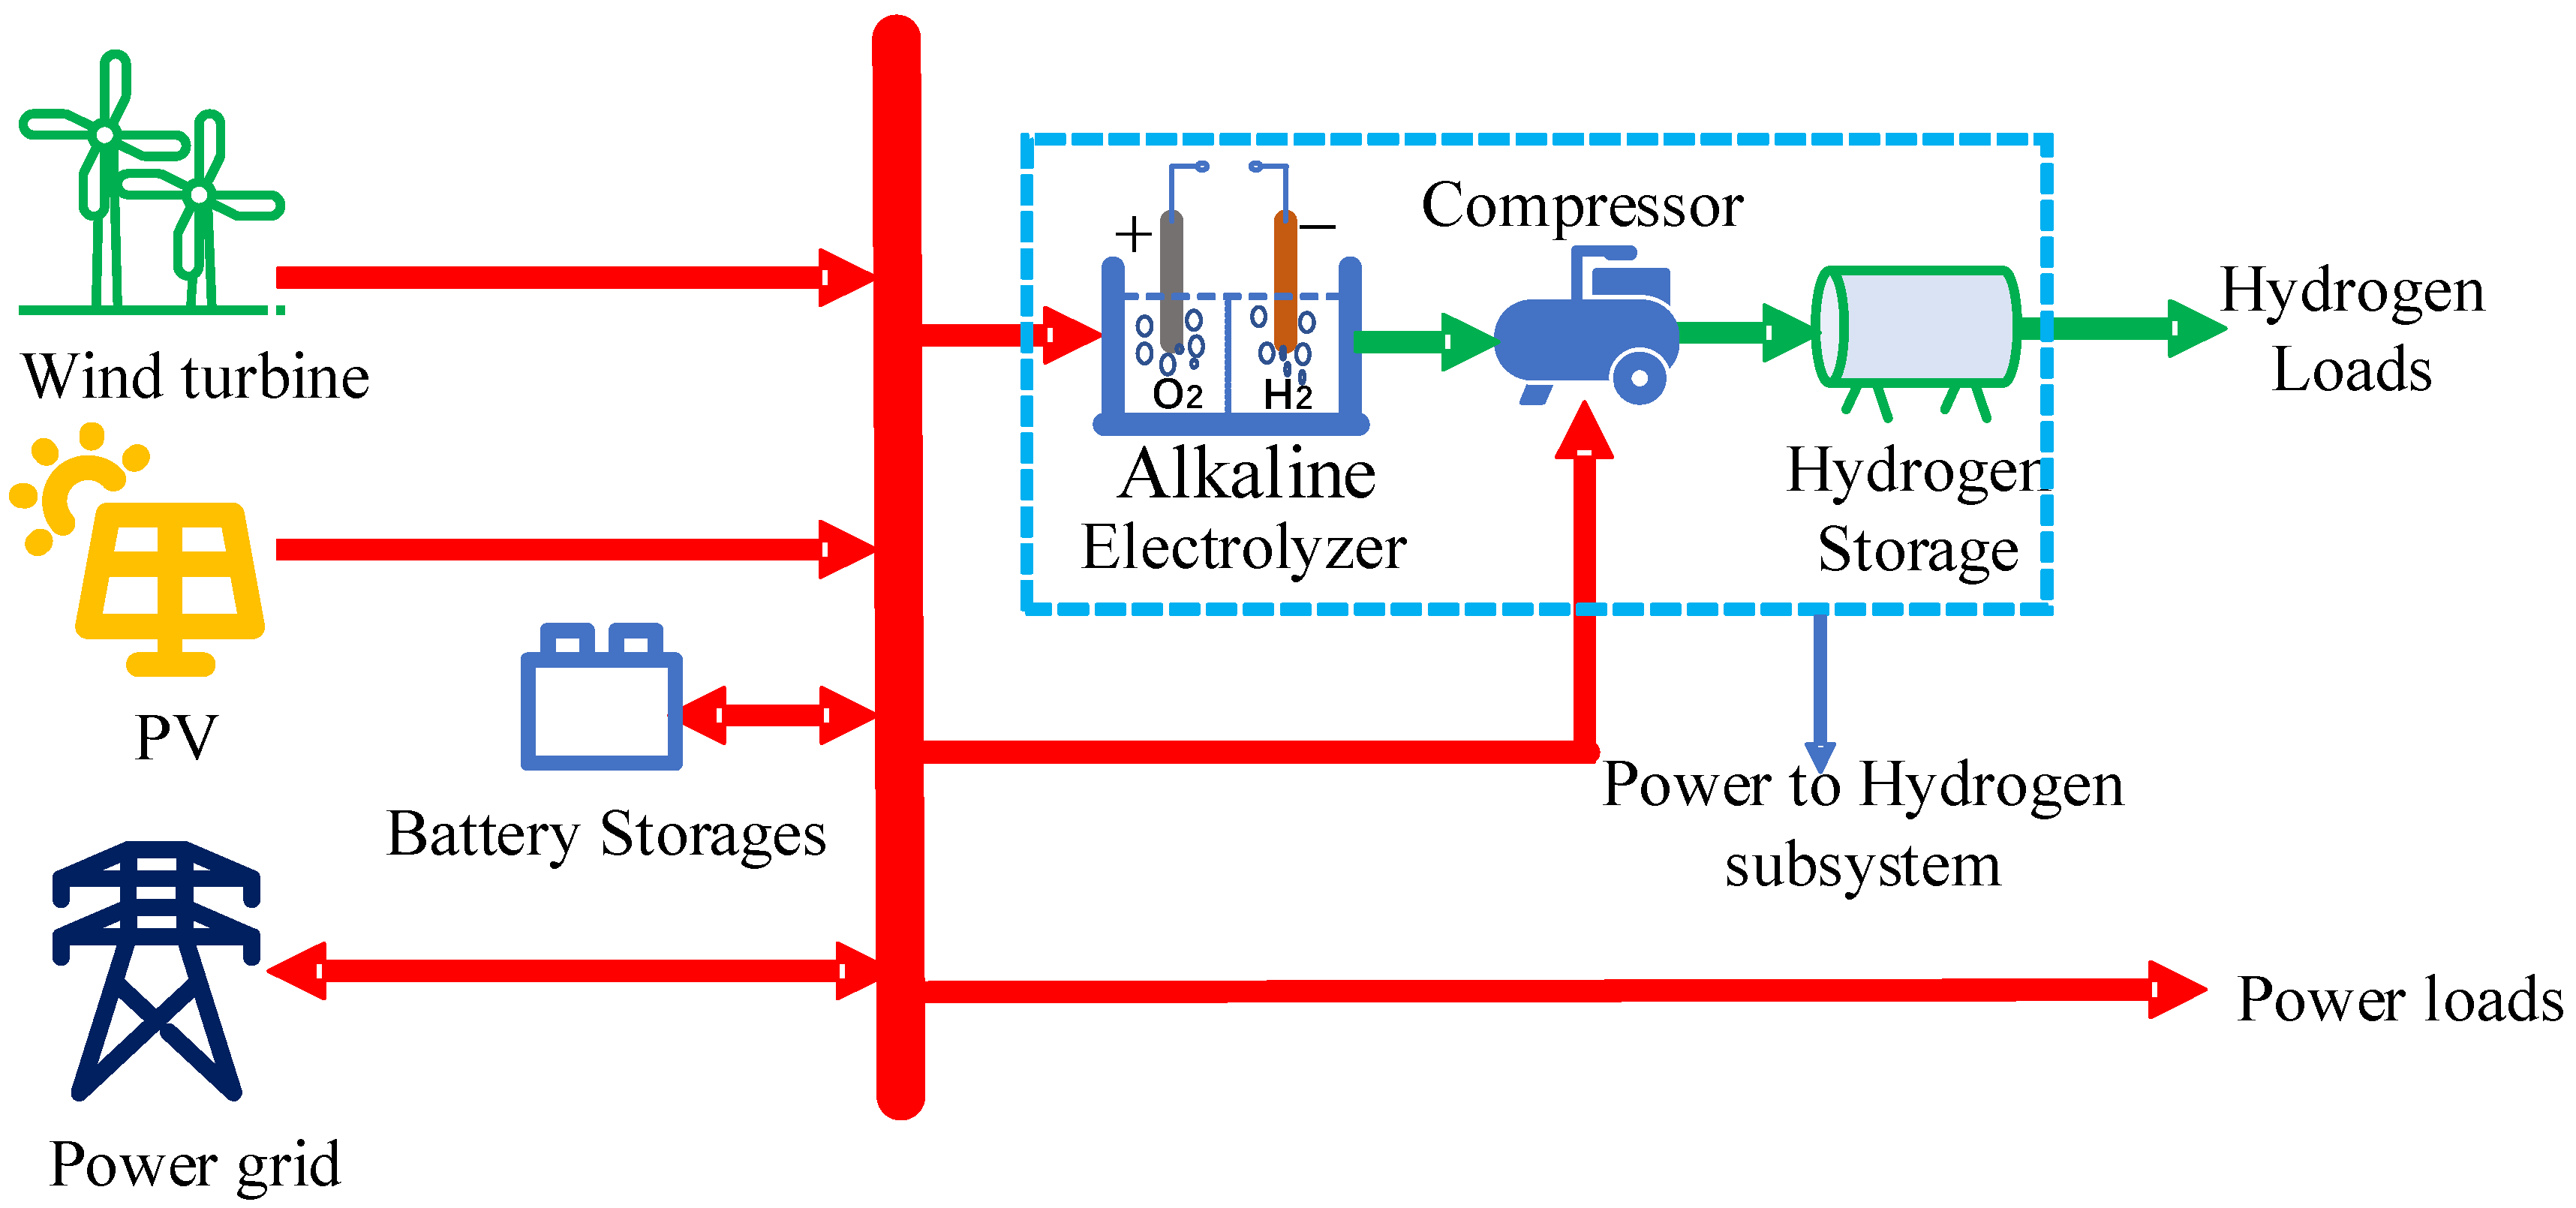
2. The Sustainable Wind-PV-Hydrogen-Storage Microgrid

Figure 1 illustrates the sustainable wind-PV-hydrogen-storage (WPHS) microgrid. It is mainly composed of wind turbines (WT), photovoltaics (PV), battery storage and the power-to-hydrogen (P2H) subsystem. The WPHS microgrid is responsible for meeting the hydrogen demands and power demands of the end users. The sustainable WPHS microgrid is connected to the upstream power grid, and the renewable electricity is mainly consumed locally to produce hydrogen and meet the power loads. Bilateral power exchange with the power grid is supported, the surplus power can be fed back to the power grid to make profit and the insufficient electricity can also be purchased from the power grid. Therefore, the WPHS microgrid comprises a high proportion of renewable energy systems, which can realize the sustainability of energy supply. The models of WT, PV, battery storage and the power-to-hydrogen subsystem are as follows.

2.1. The Wind Turbine Model

The outpower of wind turbine can be expressed as the function of wind speed [15].
P W T t = { 0 v t v i n , v t v o u t v t v i n v r v i n P R W T v i n v t v r P R W T v r v t v o u t
where P W T t is the outpower of wind turbine at time slot t; v t is the wind speed at time slot t; v i n and v o u t are cut-in and cut-out wind speed, respectively; v r is the rated wind speed of wind turbine; P R W T is the rated power of wind turbine.

2.2. The PV Model

The outpower of PV panels can be expressed as the function of solar radiation intensity and the cell temperature [21].
P P V t = N P V P r S T C I t I S T C [ 1 + 0.005 ( T t 25 ) ]
where P P V t is the outpower of PV array; N P V is the number of PV panes; I S T C is the standard irradiance, 1000 W/m2; P r S T C is the rated power of each PV panel at standard test conditions (cell temperature is 25 °C, irradiance is 1000 W/m2); I t and T t are irradiance and cell temperature (which approximates to the ambient temperature) at time slot t.

2.3. The Battery Storage Model

The battery storages are helpful in alleviating the volatility of renewable energies. Let E b a t t be the energy stored in the batteries at time slot t ; E b a t min and E b a t max denote the minimum and maximum capacity of battery storages, respectively. Let P b a t , c t and P b a t , d t denote the charging and discharging power, respectively, and let P b a t , c max and P b a t , d max denote the maximum values of charging and discharging power, respectively. Then, the battery storage model can be formulated as follows [22].
{ E b a t t = E b a t t 1 + ( P b a t , c t e b a t , c P b a t , d t e b a t , d ) Δ t 0 P b a t , c t u b a t t P b a t , c max 0 P b a t , d t ( 1 u b a t t ) · P b a t , d max E b a t min E b a t t E b a t max E b a t T = E b a t 1
where the first equation of Equation (3) denotes the stored energy variation during time interval Δ t before and after charging or discharging. The second and third items of Equation (3) indicate that the charging and discharging power cannot exceed their maximums. u b a t t is a binary variable to avoid charging and discharging power simultaneously. The fourth item of Equation (3) denotes that the stored energy should be constrained between the minimum and maximum capacity. The last item of Equation (3) shows that the stored energy at the end of the dispatch period is to be equal to its initial value.

2.4. The Power-to-Hydrogen Subsystem Model

The power-to-hydrogen production system mainly consists of alkaline electrolyzer, hydrogen compressor and hydrogen storage tank.

2.4.1. The Model of Electrolyzer

Currently the alkaline electrolyzer (AE) and proton exchange membrane (PEM) are two major ways to produce hydrogen from electricity. The alkaline electrolyzer technology is more mature and economic, and was thus chosen to produce hydrogen in this paper. Since the start and response speed of the electrolyzer is quick [16], the ramp up/down constraints are assumed to be satisfied in this paper. The mass of hydrogen production of AE is approximately linear to the consumed power [23].
{ m H 2 t = η H 2 P el t Δ t 0 P el t P el max
where m H 2 t is the hydrogen mass produced at time slot t , kg ; η H 2 is hydrogen production rate, kg / kW h ; P el t denotes the power consumed by electrolyzer at time slot t , kW ; Δ t is the time step; P el max is the maximum power of electrolyzer.

2.4.2. The Model of Hydrogen Compressor

A hydrogen compressor is used to compress the hydrogen into high-pressure hydrogen. The power consumption of the hydrogen compressor can be expressed as follows [24]:
{ P c o m t = C H 2 m c o m t T i n κ η c o m ( κ 1 ) [ ( P o u t P i n ) κ 1 κ 1 ] 0 P c o m t P c o m max
where P c o m t is the electric power consumed by compressor at time t ; C H 2 is the specific heat of hydrogen at constant pressure, 14.304 kJ / kg K ; m c o m t is the hydrogen flow rate through compressor at time t , kg / s ; T i n is the inlet hydrogen temperature (293 K); η c o m is the efficiency of compressor (0.7); κ is the isentropic exponent of hydrogen (1.4); P c o m max is the maximum power of hydrogen compressor.

2.4.3. The Model of Hydrogen Storage Tank

The compressed hydrogen is stored in the hydrogen storage tank. The pressure of the hydrogen tank can be formulated as follows [25].
{ M H 2 t + 1 = M H 2 t + m H 2 t L H 2 t M H 2 min M H 2 t M H 2 max M H 2 min = γ min C t a n k R ,   M H 2 max = γ max C t a n k R M H 2 0 = M H 2 T = γ 0 C t a n k R ,
where M H 2 t is the stored hydrogen mass in the hydrogen tank at time slot t , kg ; L H 2 t is the hydrogen load at time slot t , kg ; C t a n k R is the capacity of hydrogen tank, kg ; γ min and γ max denote the minimum and maximum ratio of the rated capacity of hydrogen tank; M H 2 0 and M H 2 T are the stored hydrogen at the initial and end time slot, respectively.

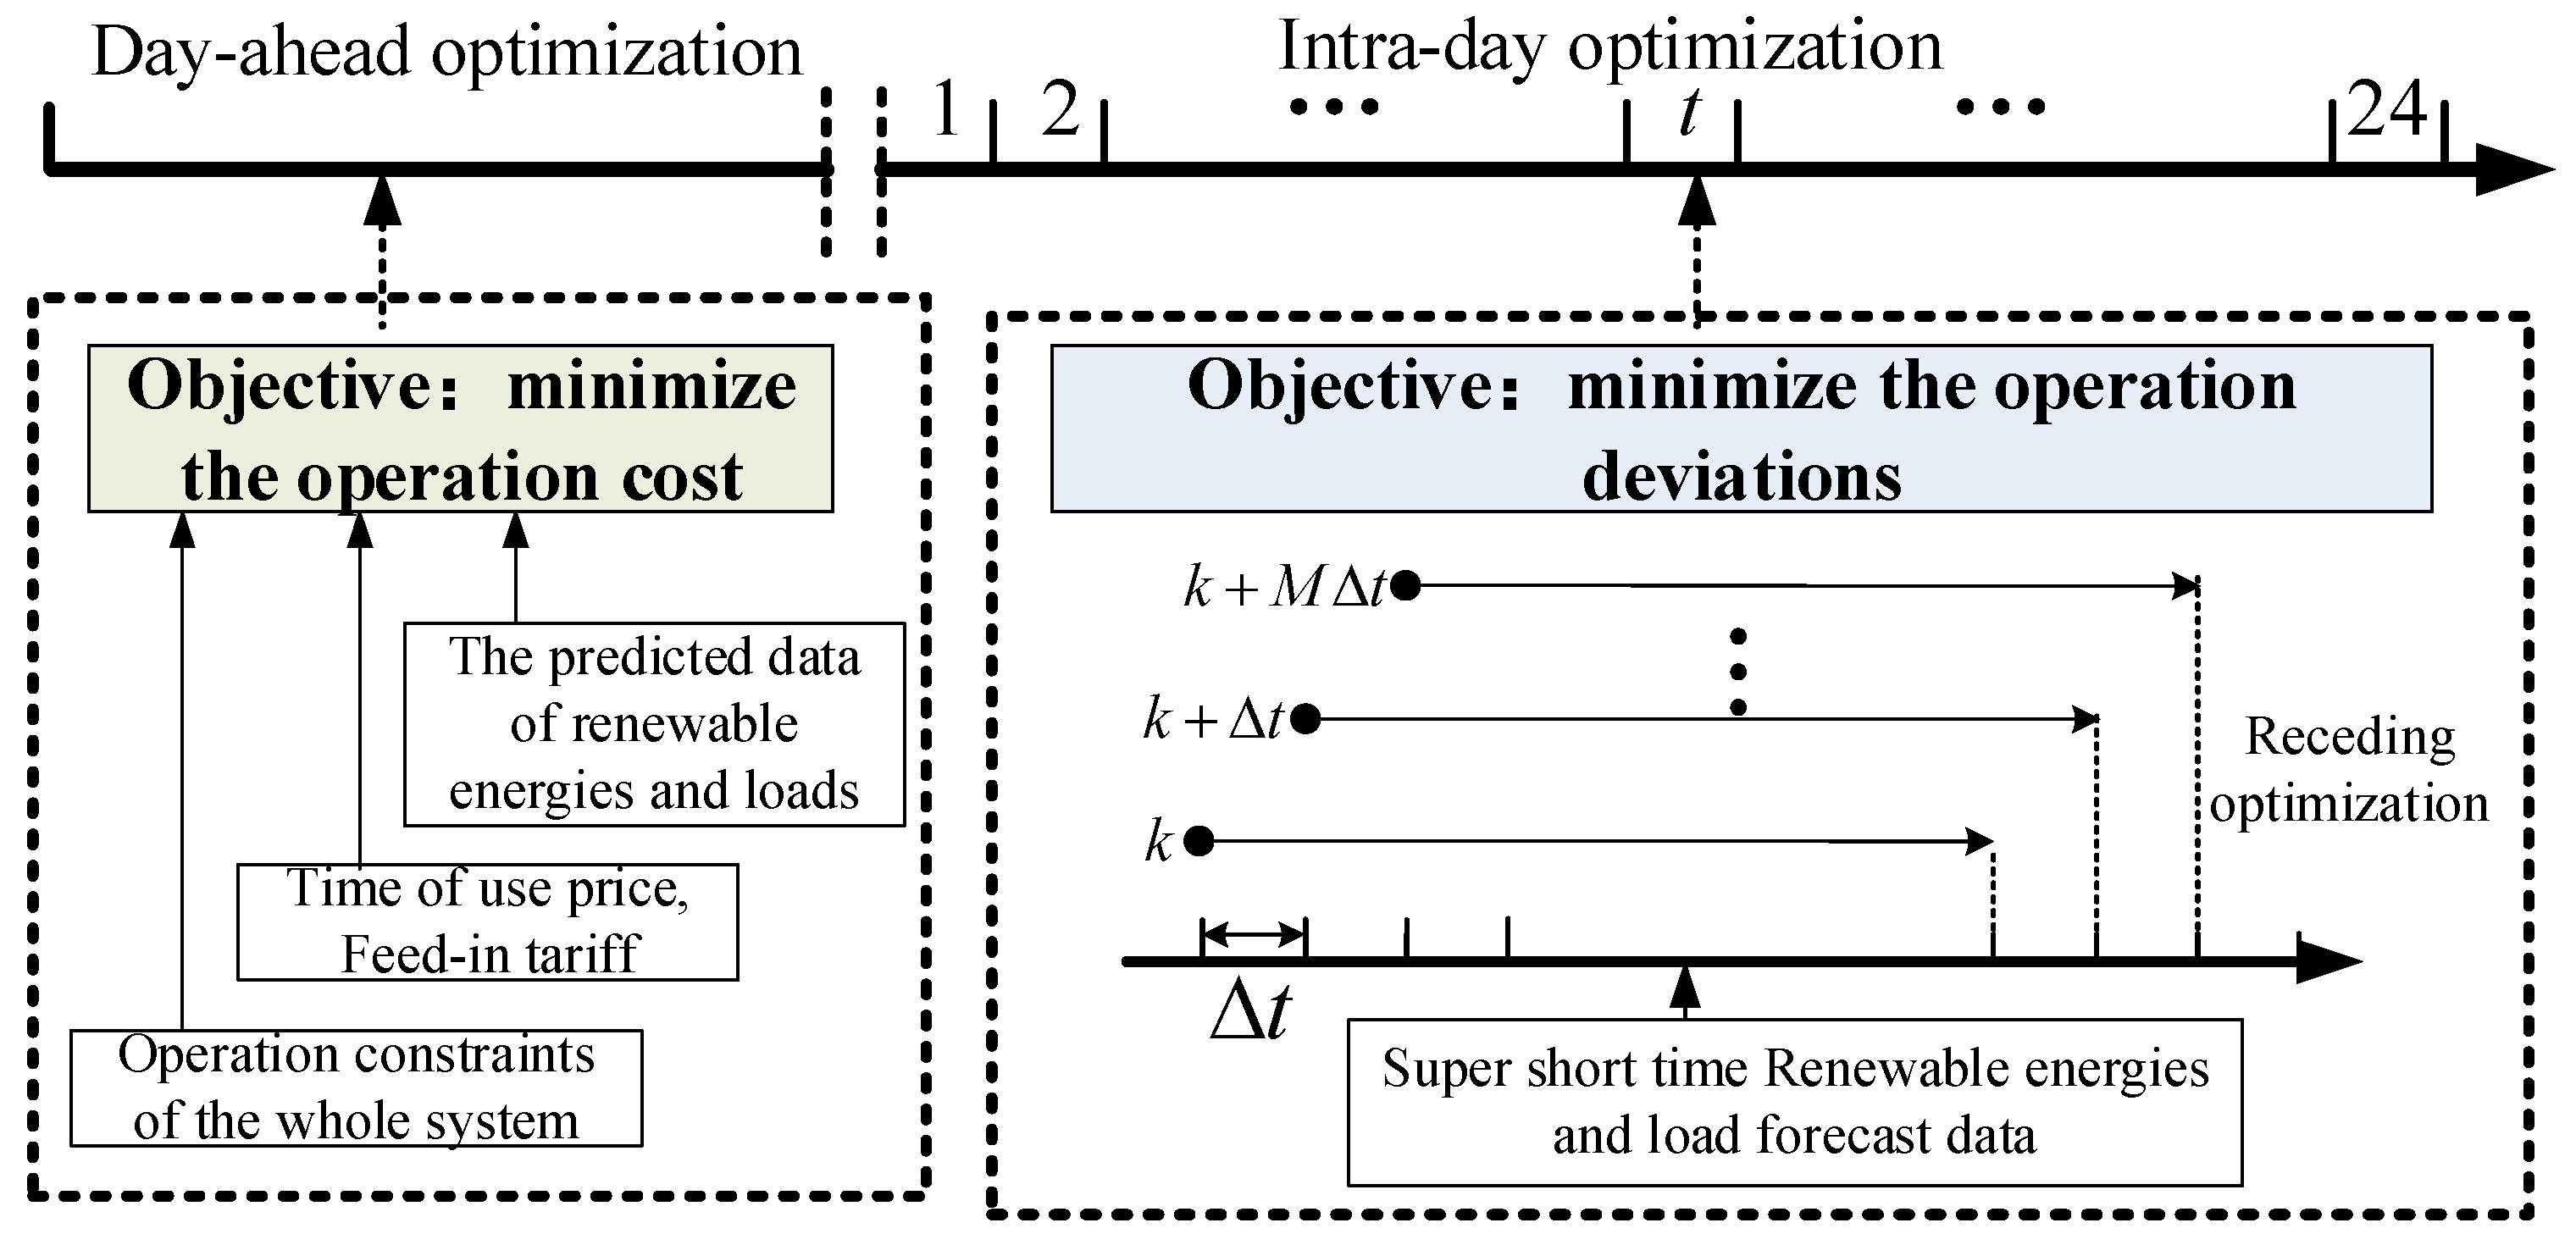
3. The Two-Stage Energy Management Model

The randomness and uncertainty of the outpower of WT and PV will affect the stable operation of the whole system and may reduce the hydrogen purity. As illustrated in Figure 2, in order to alleviate these adverse effects, a two-stage energy management model based on receding horizon optimization is proposed for the wind-PV-hydrogen-storage microgrid. In the first stage of the energy management model, the day-ahead optimization is performed to minimize the total operational cost based on the predicted outpower of WT and PV, as well as the predicted power and hydrogen demands, the time-of-use price, the feed-in tariff and the operation constraints of the whole system. In the second stage of the energy management model, the intra-day optimization model based on the receding horizon optimization is executed to eliminate the power fluctuations caused by the forecast errors. The specific day-ahead optimization and intra-day optimization models will be formulated in the following subsections.

3.1. The Day-Ahead Optimization Model

The objective of the day-ahead operation is to minimize the comprehensive operation cost C D A C , which is composed of the operational and maintenance costs of PV ( C P V ) and WT ( C W T ); the degradation costs of batteries ( C b a t ) and electrolyzer ( C e l ); and the net energy cost ( C e ).
The operational and maintenance costs of PV and WT are formulated as the functions of their output power.
{ C P V = t = 1 T λ P V P P V t Δ t C W T = t = 1 T λ W T P W T t Δ t
where T is the total number of time slots, λ P V and λ W T are maintenance cost coefficients of PV and WT, respectively; their values are assumed to be 0.005 ¥/kWh and 0.0045 ¥/kWh, respectively [26]. P P V t and P W T t are output power of PV and WT at time slot t , respectively.
The degradation of energy storage is caused by charging and discharging, as well as the depth of discharge. Refs. [27,28] have shown that the degradation density function of the state of charge (SoC) is almost flat between minimum and maximum of Soc. Thus, as in the model in [29,30,31], the amortized battery degradation cost C b a t can be computed by the power of discharging and charging (Equation (8)), while the degradation cost of battery considering the depth of discharge can be found in [17,32].
C b a t = t = 1 T λ b a t ( P b a t , c t +   P b a t , d t ) Δ t
where P b a t , c t and P b a t , d t are the charging and discharging power of battery, respectively. λ b a t denotes the degradation cost coefficient.
Similarly, the amortized degradation cost C e l of electrolyzer can be expressed as follows.
C e l = t = 1 T λ e l P e l t Δ t
where P e l t and λ e l are the consumed power and degradation cost coefficient of electrolyzer, respectively.
The microgrid is allowed to buy electricity from the utility grid when its electricity is insufficient and it may sell power back to the grid when its power is surplus. Then, the net energy cost is formulated as the electricity purchasing cost minus the revenue from selling electricity.
C e = t = 1 T ( π b P b t π s P s t ) Δ t
where π b and π s denote the electricity buying and selling prices, respectively. P b t and P s t are the power purchased from and sold to the utility grid, respectively.
Then, the objective of the day-ahead optimization model can be expressed as follows.
min   C D A C = min ( C P V + C W T + C b a t + C e l + C e )
The power balance should be satisfied at each time slot.
P P V t + P W T t + P b t + P b a t , d t = P b a t , c t + P e l t + P c o m t + P s t + P l o a d t
where P b t and P s t are the power buying from and selling to the power grid at time slot t, respectively. P l o a d t is the predicted power load at time slot t.
The buying and selling power cannot happen simultaneously. Let P g r i d max denote the maximum power allowed when selling to or buying from the power grid, and χ b s t denote the binary variable; then, the constraints of power exchanged with the power grid can be formulated as follows.
{ 0 P b t χ b s t P g r i d max 0 P s t ( 1 χ b s t ) P g r i d max
Furthermore, the operation constraints of WT, PV, battery storage and the power-to-hydrogen subsystem should be satisfied. Then, the day-ahead optimization model in compact form can be expressed as follows.
min   C D A C = min { t = 1 T λ P V P P V t + t = 1 T λ W T P W T t + t = 1 T λ b a t ( P b a t , c t +   P b a t , d t ) + t = 1 T λ e l P e l t   + t = 1 T ( π b P b t π s P s t )     } s . t .   ( 1 ) ( 6 ) , ( 12 ) ( 13 )

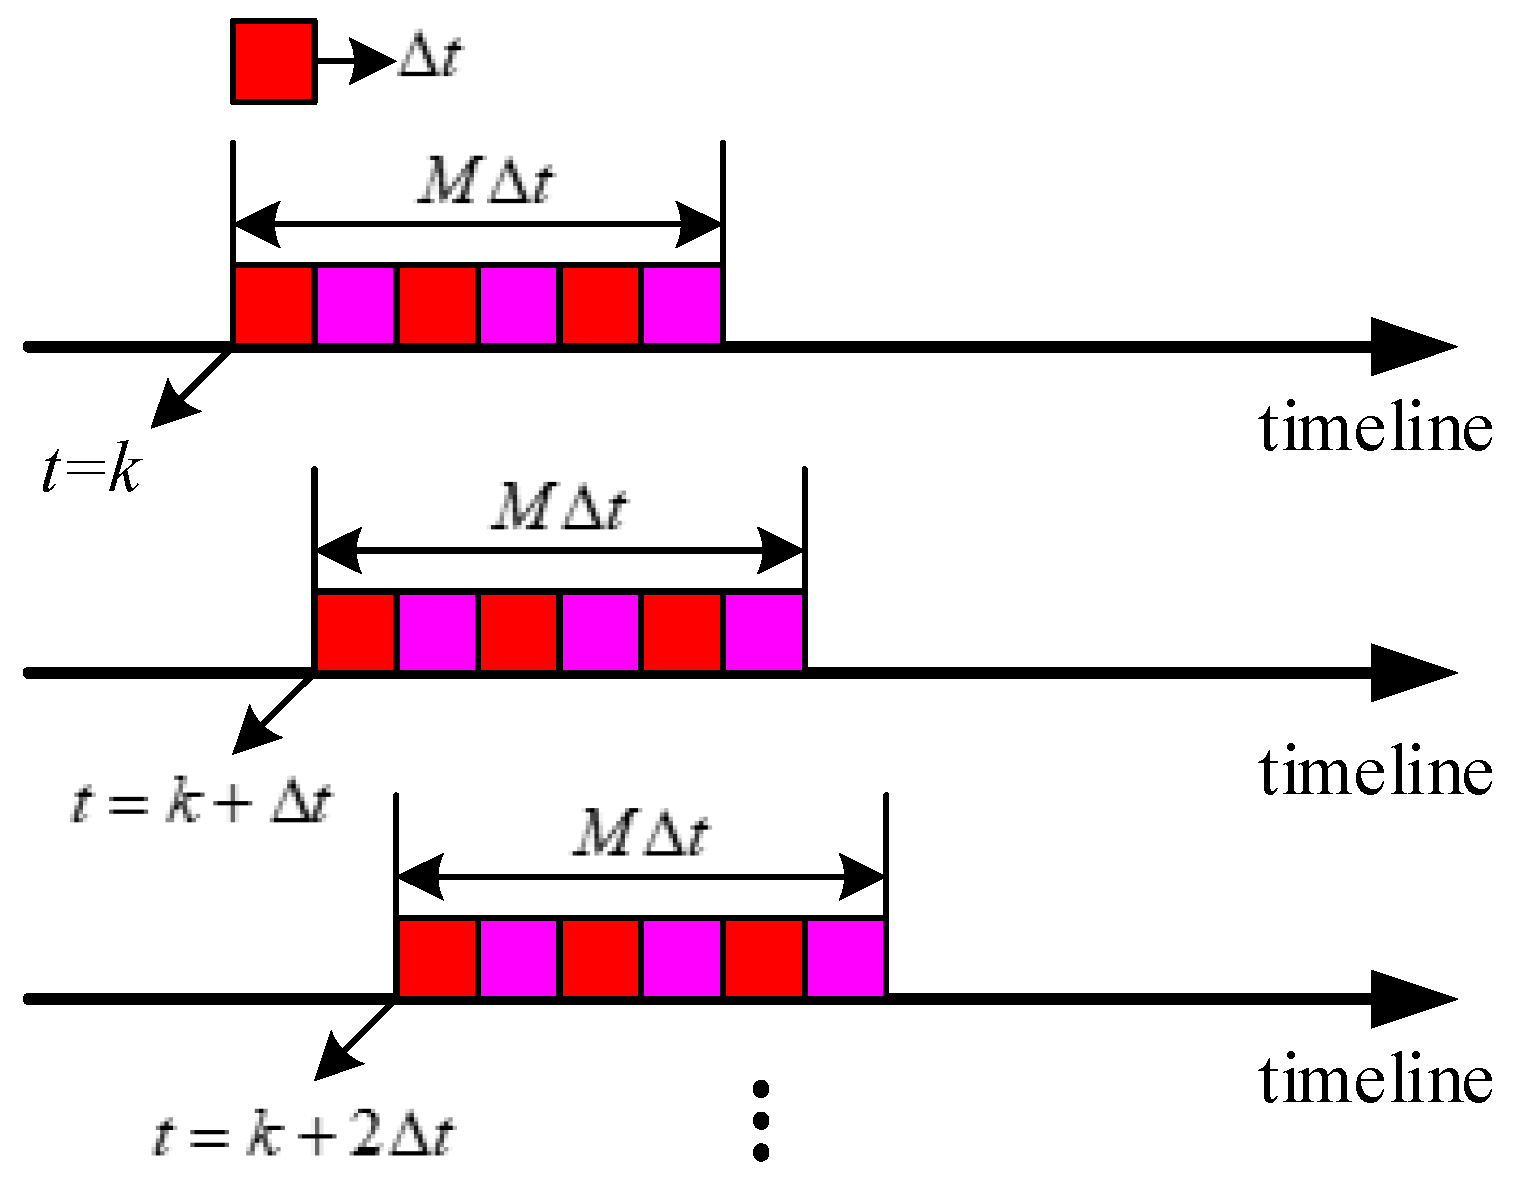
3.2. The Intra-Day Optimization Model

According to the day-ahead operation schemes, the intra-day optimization model will be performed to minimize the operation errors based on the ultra-short-term prediction data of WT, PV, power and hydrogen demands. The intra-day optimization model is built based on the receding horizon optimization, which is an effective method to tackle the uncertainty and volatility of renewable energies and loads. The main idea of the receding horizon operation is illustrated in Figure 3. It mainly contains the following three steps [3]. (1) Take the day-ahead operation schemes as set points; at the time slot k, solve the intra-day operation strategies during the receding horizon based on the real-time predicted values of renewable energy generation, power loads and hydrogen loads. (2) From the first step, obtain the operation strategies over the k-th to the (k + M − 1)-th time slot. Only the operation strategies at the k-th slot are implemented. (3) Move to the k + 1-th time slot, update the prediction data and repeat the first two steps. It is obvious that by means of receding horizon optimization, the operation strategies are updated step-by-step to alleviate the impacts of the uncertainty and volatility of renewable energies and loads.
The objective of the intra-day energy management is to trace the day-ahead operation schemes based on the updated predicted data for the output power of PV and WT, the power loads and hydrogen loads. Take the day-ahead operation strategies as set points and the objection function intra-day energy management can be expressed as follows.
min   C I D C = min { t = k k + M 1 [ w 1 ( P g r i d t P ^ g r i d t ) 2 + w 2 ( P e l t P ^ e l t ) 2 + w 3 ( P c o m t P ^ c o m t ) 2 + w 4 ( P b a t t P ^ b a t t ) 2 ] } s . t .   { ( 1 ) ( 6 ) , ( 12 ) ( 13 ) Δ P g r i d t = | P g r i d t P ^ g r i d t | Δ P g r i d max Δ P e l t = | P e l t P ^ e l t | Δ P e l max Δ P c o m t = | P c o m t P ^ c o m t | Δ P c o m max Δ P b a t t = | P b a t t P ^ b a t t | Δ P b a t max
where P g r i d t = P b t P s t , P b a t t = P b a t , c t P b a t , d t , P ^ g r i d t , P ^ e l t , P ^ c o m t and P ^ b a t t denote the day-ahead operation schemes of buying power, electrolyzer, compressor and battery storage. w 1 , w 2 , w 3 and w 4 are weight factors; they can be optimized based on their significance. In this paper, they are assumed to have equal weights. Δ P g r i d max , Δ P e l max , Δ P c o m max and Δ P b a t max are the admissible maximum errors of exchanged power, the power of electrolyzer, the power of compressor and the net charging power of battery storage, respectively. The objective function (15) of the intra-day operation model is to minimize the operation deviation between the intra-day strategies and the day-ahead strategies. The constraints are the operation limitations of each component and the power exchange with the power grid. The decision variables are the operation strategies of each component and the power exchange with the power grid; the decision variable vector is x = [ P g r i d t , P e l t , P c o m t , P b a t t ] . More details about the input and output variables of the two-stage energy management model can be found in Appendix A.

4. Numerical Analysis

4.1. Basic Parameter Settings

The microgrid in Figure 1 is taken as an example to demonstrate the proposed two-stage energy management method. In the first stage, the day-ahead optimization is performed based on the predicted outpower of WT and PV, the predicted power and hydrogen loads. In the second stage, the intra-day optimization is performed based on the actual data. Without loss of generality, the actual data are assumed to be the sum of predicted data and the forecast error. Assume that the day-ahead forecast errors of wind power, PV, power and hydrogen demands follow standard normal distribution. The standard deviation for the day-ahead forecast errors of wind power, PV, power and hydrogen demands is set as 25%, 20%, 15% and 15% of their day-ahead forecast data, respectively. In fact, the ultra-short-term prediction data of WT, PV, power and hydrogen demands can be predicted by the long short-term memory (LSTM), neural network or other artificial intelligence methods [33]. In this paper, the prediction cycle is 1 h, and the control cycle is 30 min and the receding horizon optimization is performed once per 5 min. Therefore, the intra-day optimization model will be executed 288 times during the 24 h.
The predicted and actual output power of WT and PV is shown in Figure 4 and Figure 5 [34], respectively. The predicted and actual power load and hydrogen load are illustrated in Figure 6 and Figure 7 [7,34], respectively. Table 1 gives the power prices of the power grid [35]; the buying price is time-of-use price and the feed-in price is fixed price. The other parameters of the micro are given in Table 2 [34,35]. The maximum of the deviations for P g r i d t , P ^ e l t , P ^ c o m t and P ^ b a t t are 200 kW.

4.2. The Analysis and Discussions of the Simulation Results

Figure 8, Figure 9, Figure 10 and Figure 11 show the day-ahead schemes and the intra-day operation strategies of buying or selling power, charging and discharging power of battery storage, electrolyzer and compressor, respectively. Figure 12 and Figure 13 illustrate the storage states of battery storage and hydrogen tank, respectively.

4.2.1. The Day-Ahead Simulation Results

The simulation results of Figure 8 and Figure 9 show that the sustainable WPHS microgrid buys more electricity from the power grid during the valley periods and flat periods than the peak periods. This is because the buying power price is low during the valley and flat periods; in order to reduce the operation cost, the microgrid buys more electricity to meet the demands of power loads, produce hydrogen or charge the batteries. During the peak periods, the required power of the WPHS microgrid is mainly met by the battery storage, the WT and PV. In addition, it can be seen from Figure 10, Figure 11 and Figure 13 that the hydrogen is produced and stored in the tank during the valley periods, and the tank discharges hydrogen during the flat and peak periods to satisfy hydrogen demand. Figure 9 and Figure 12 show that the battery storage mainly stores the electricity during the valley or flat periods and discharges power during the peak periods to reduce the operation cost. Therefore, the day-ahead optimization can effectively coordinate the operation of the WT, PV, battery storage and power-to-hydrogen subsystems, and realize high-efficiency operation.

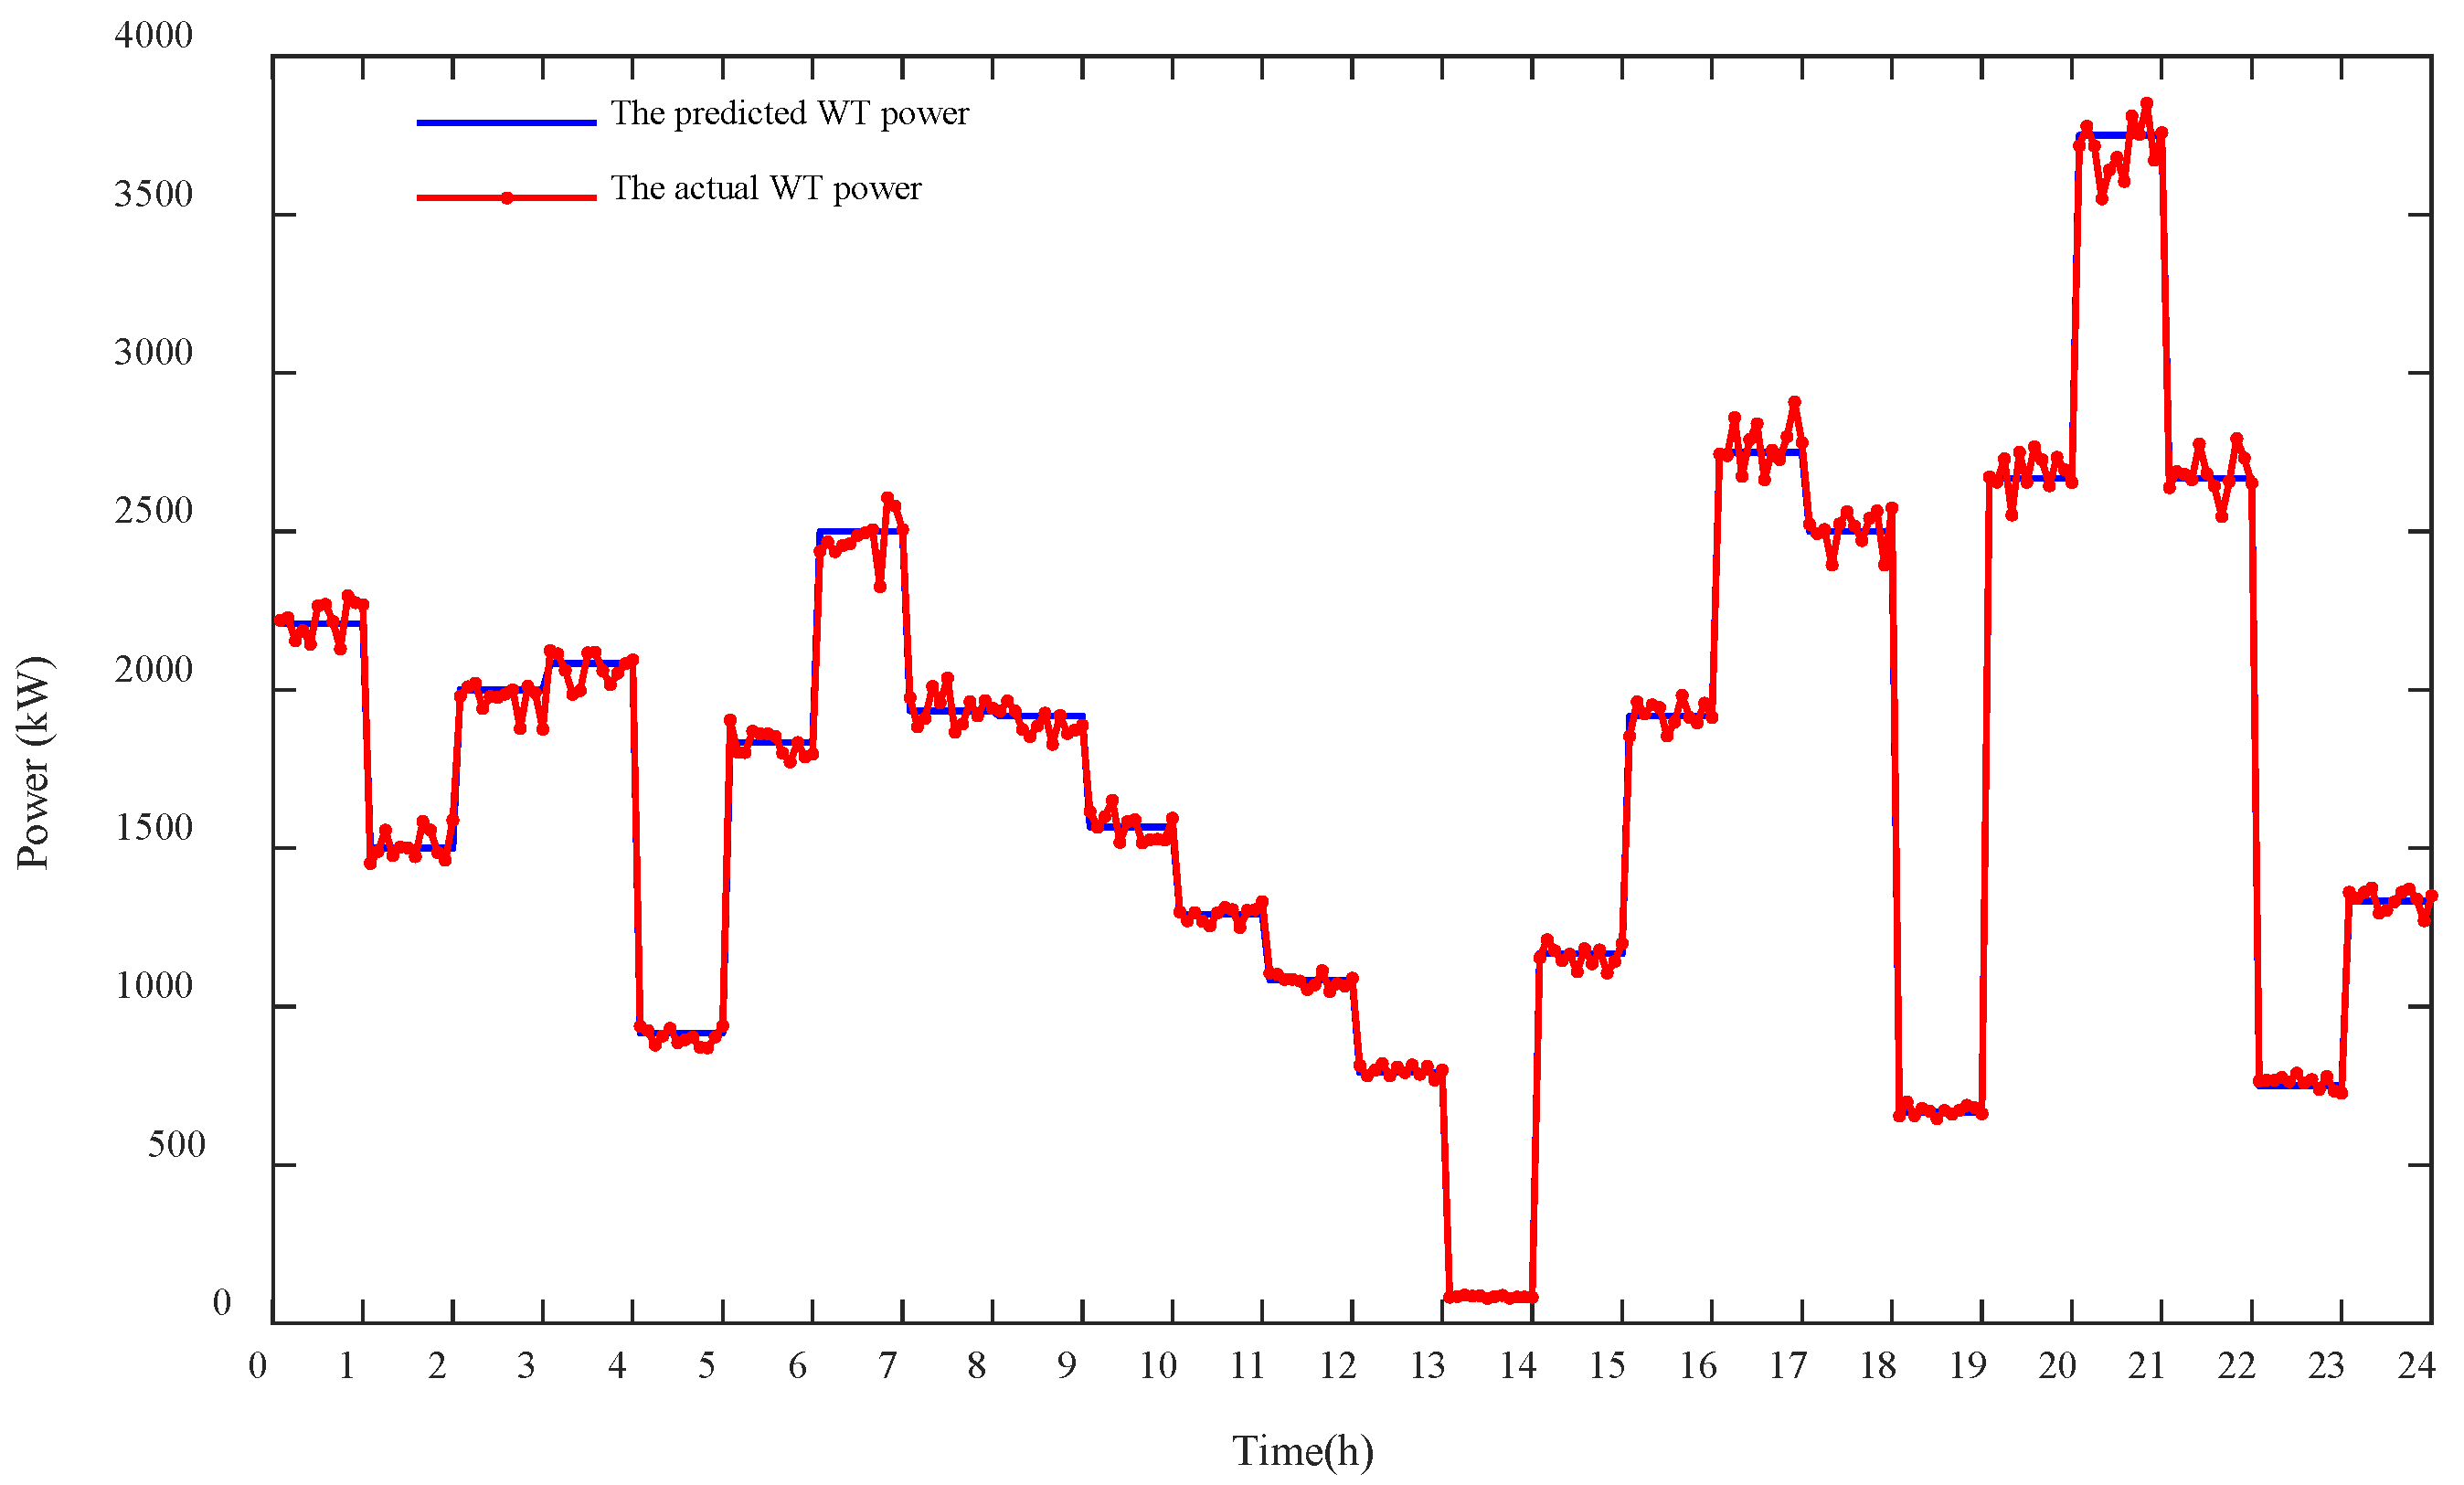
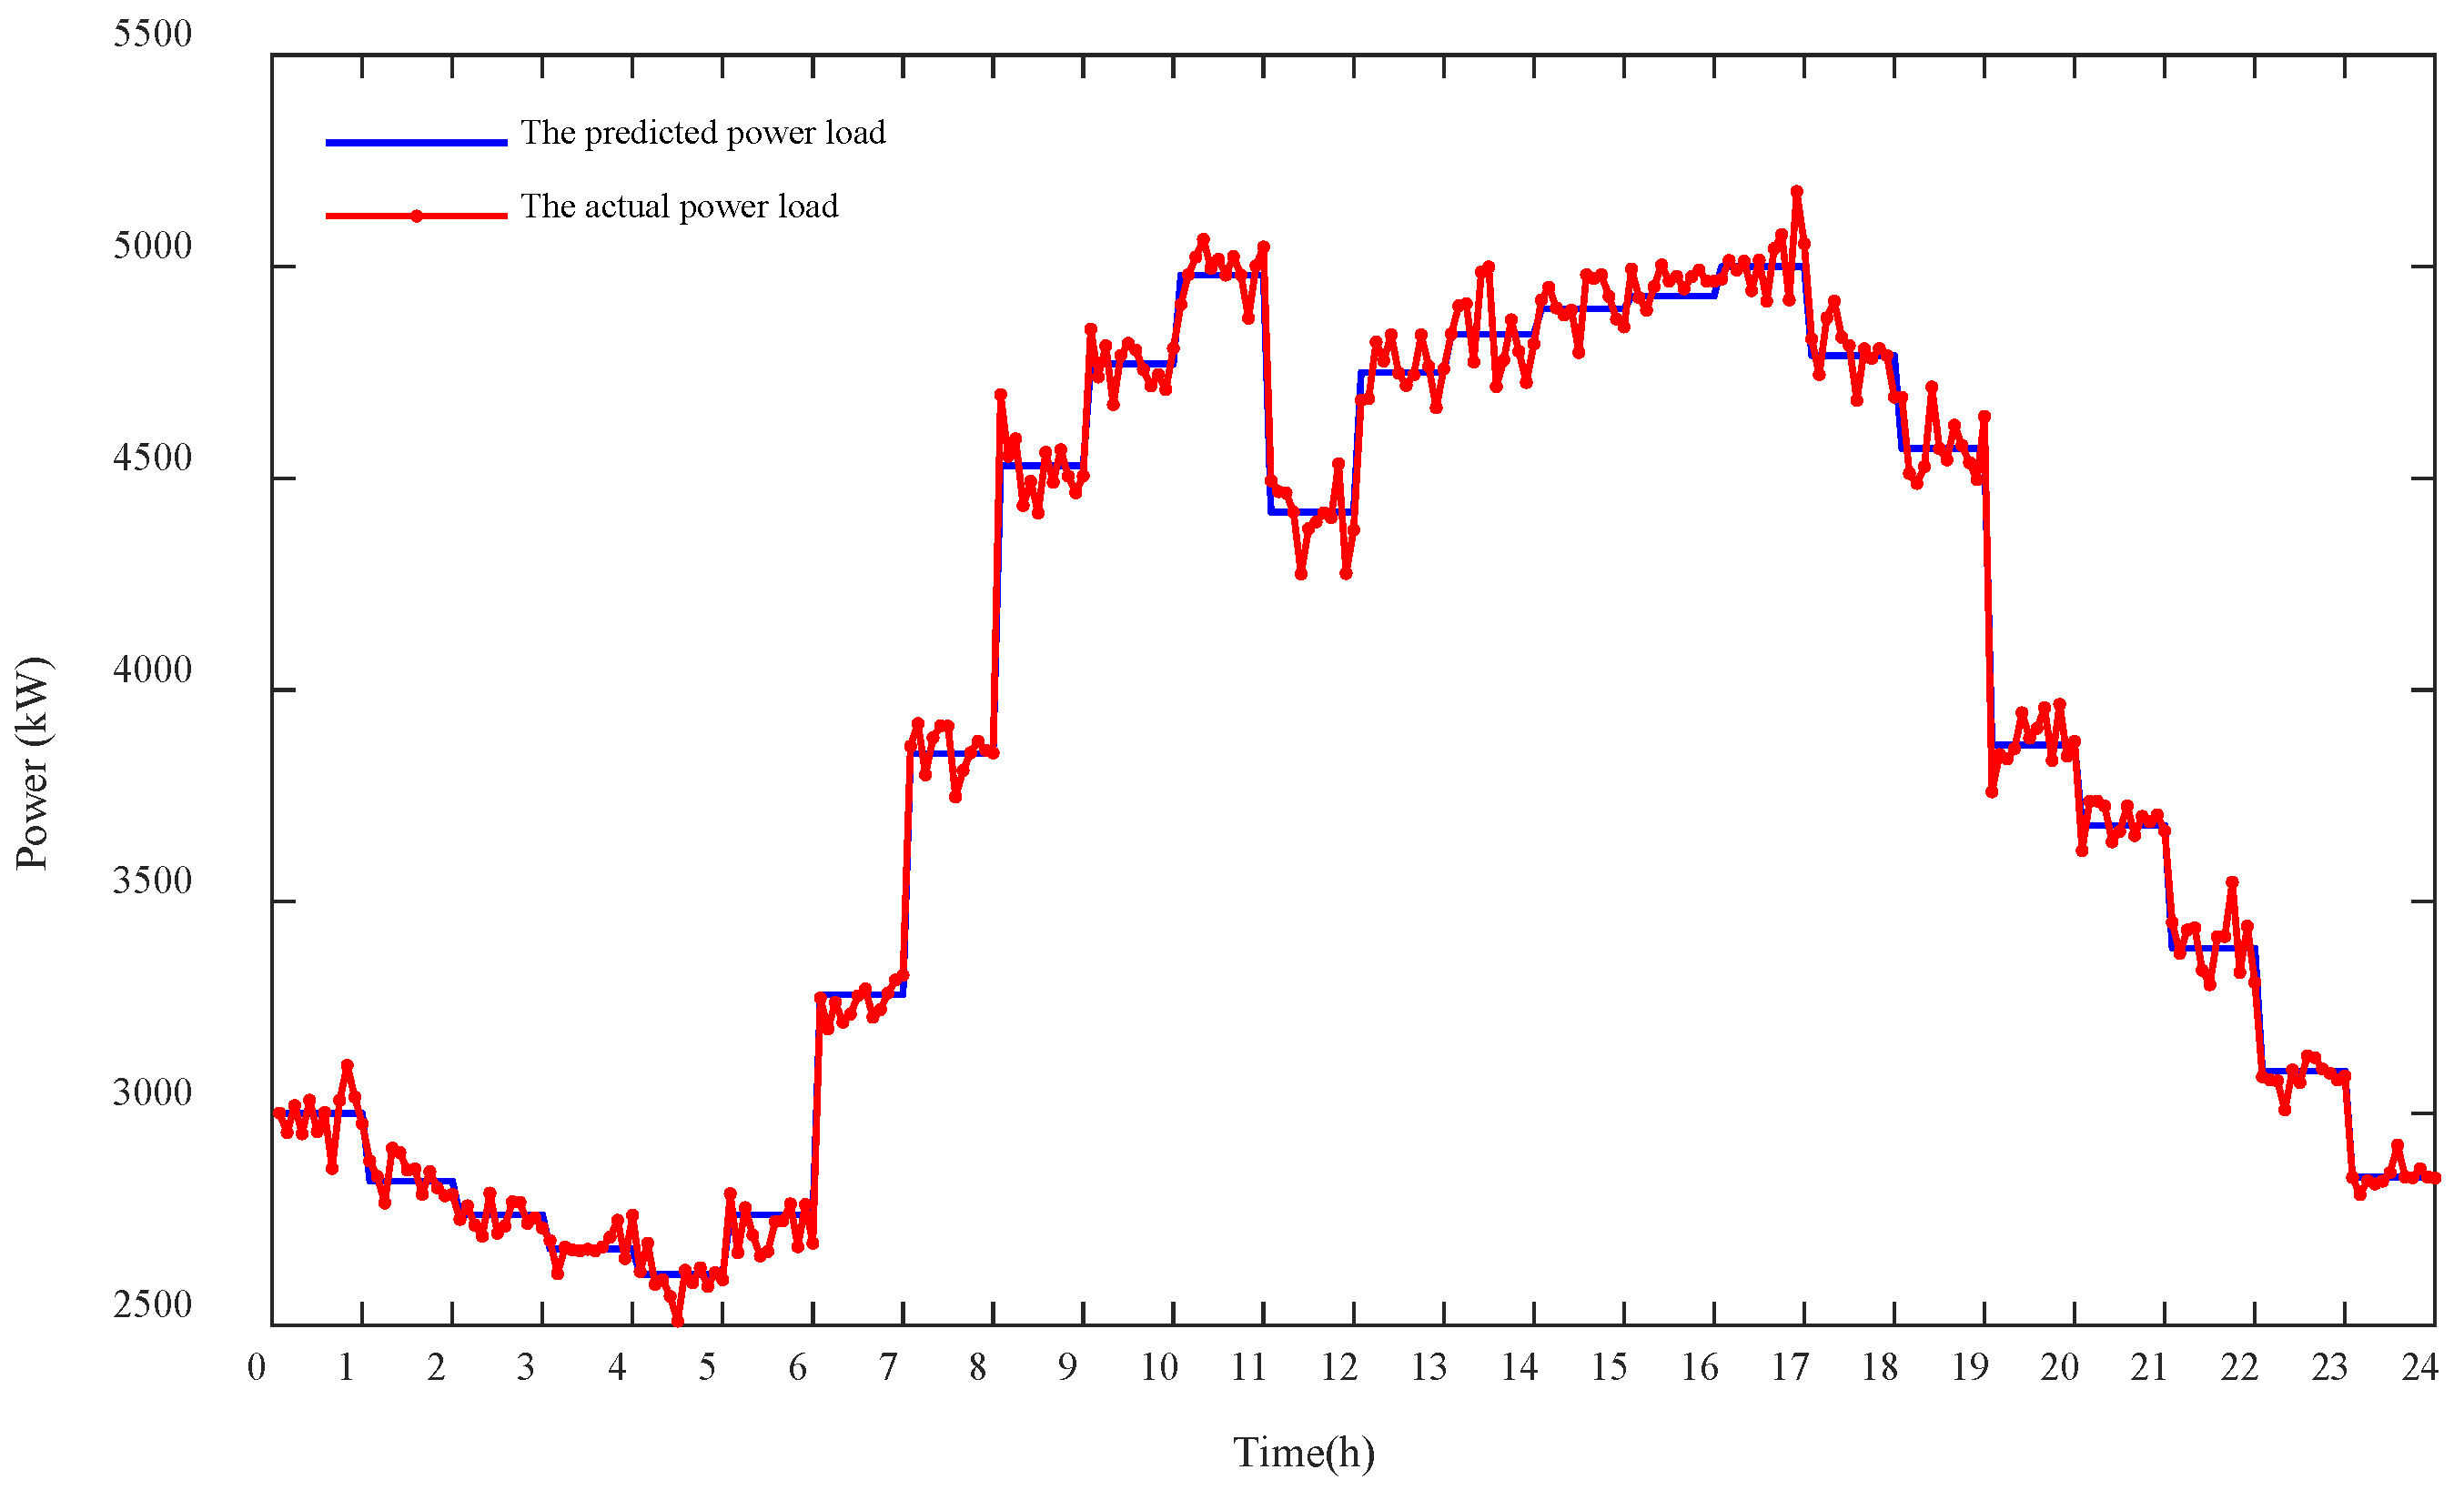
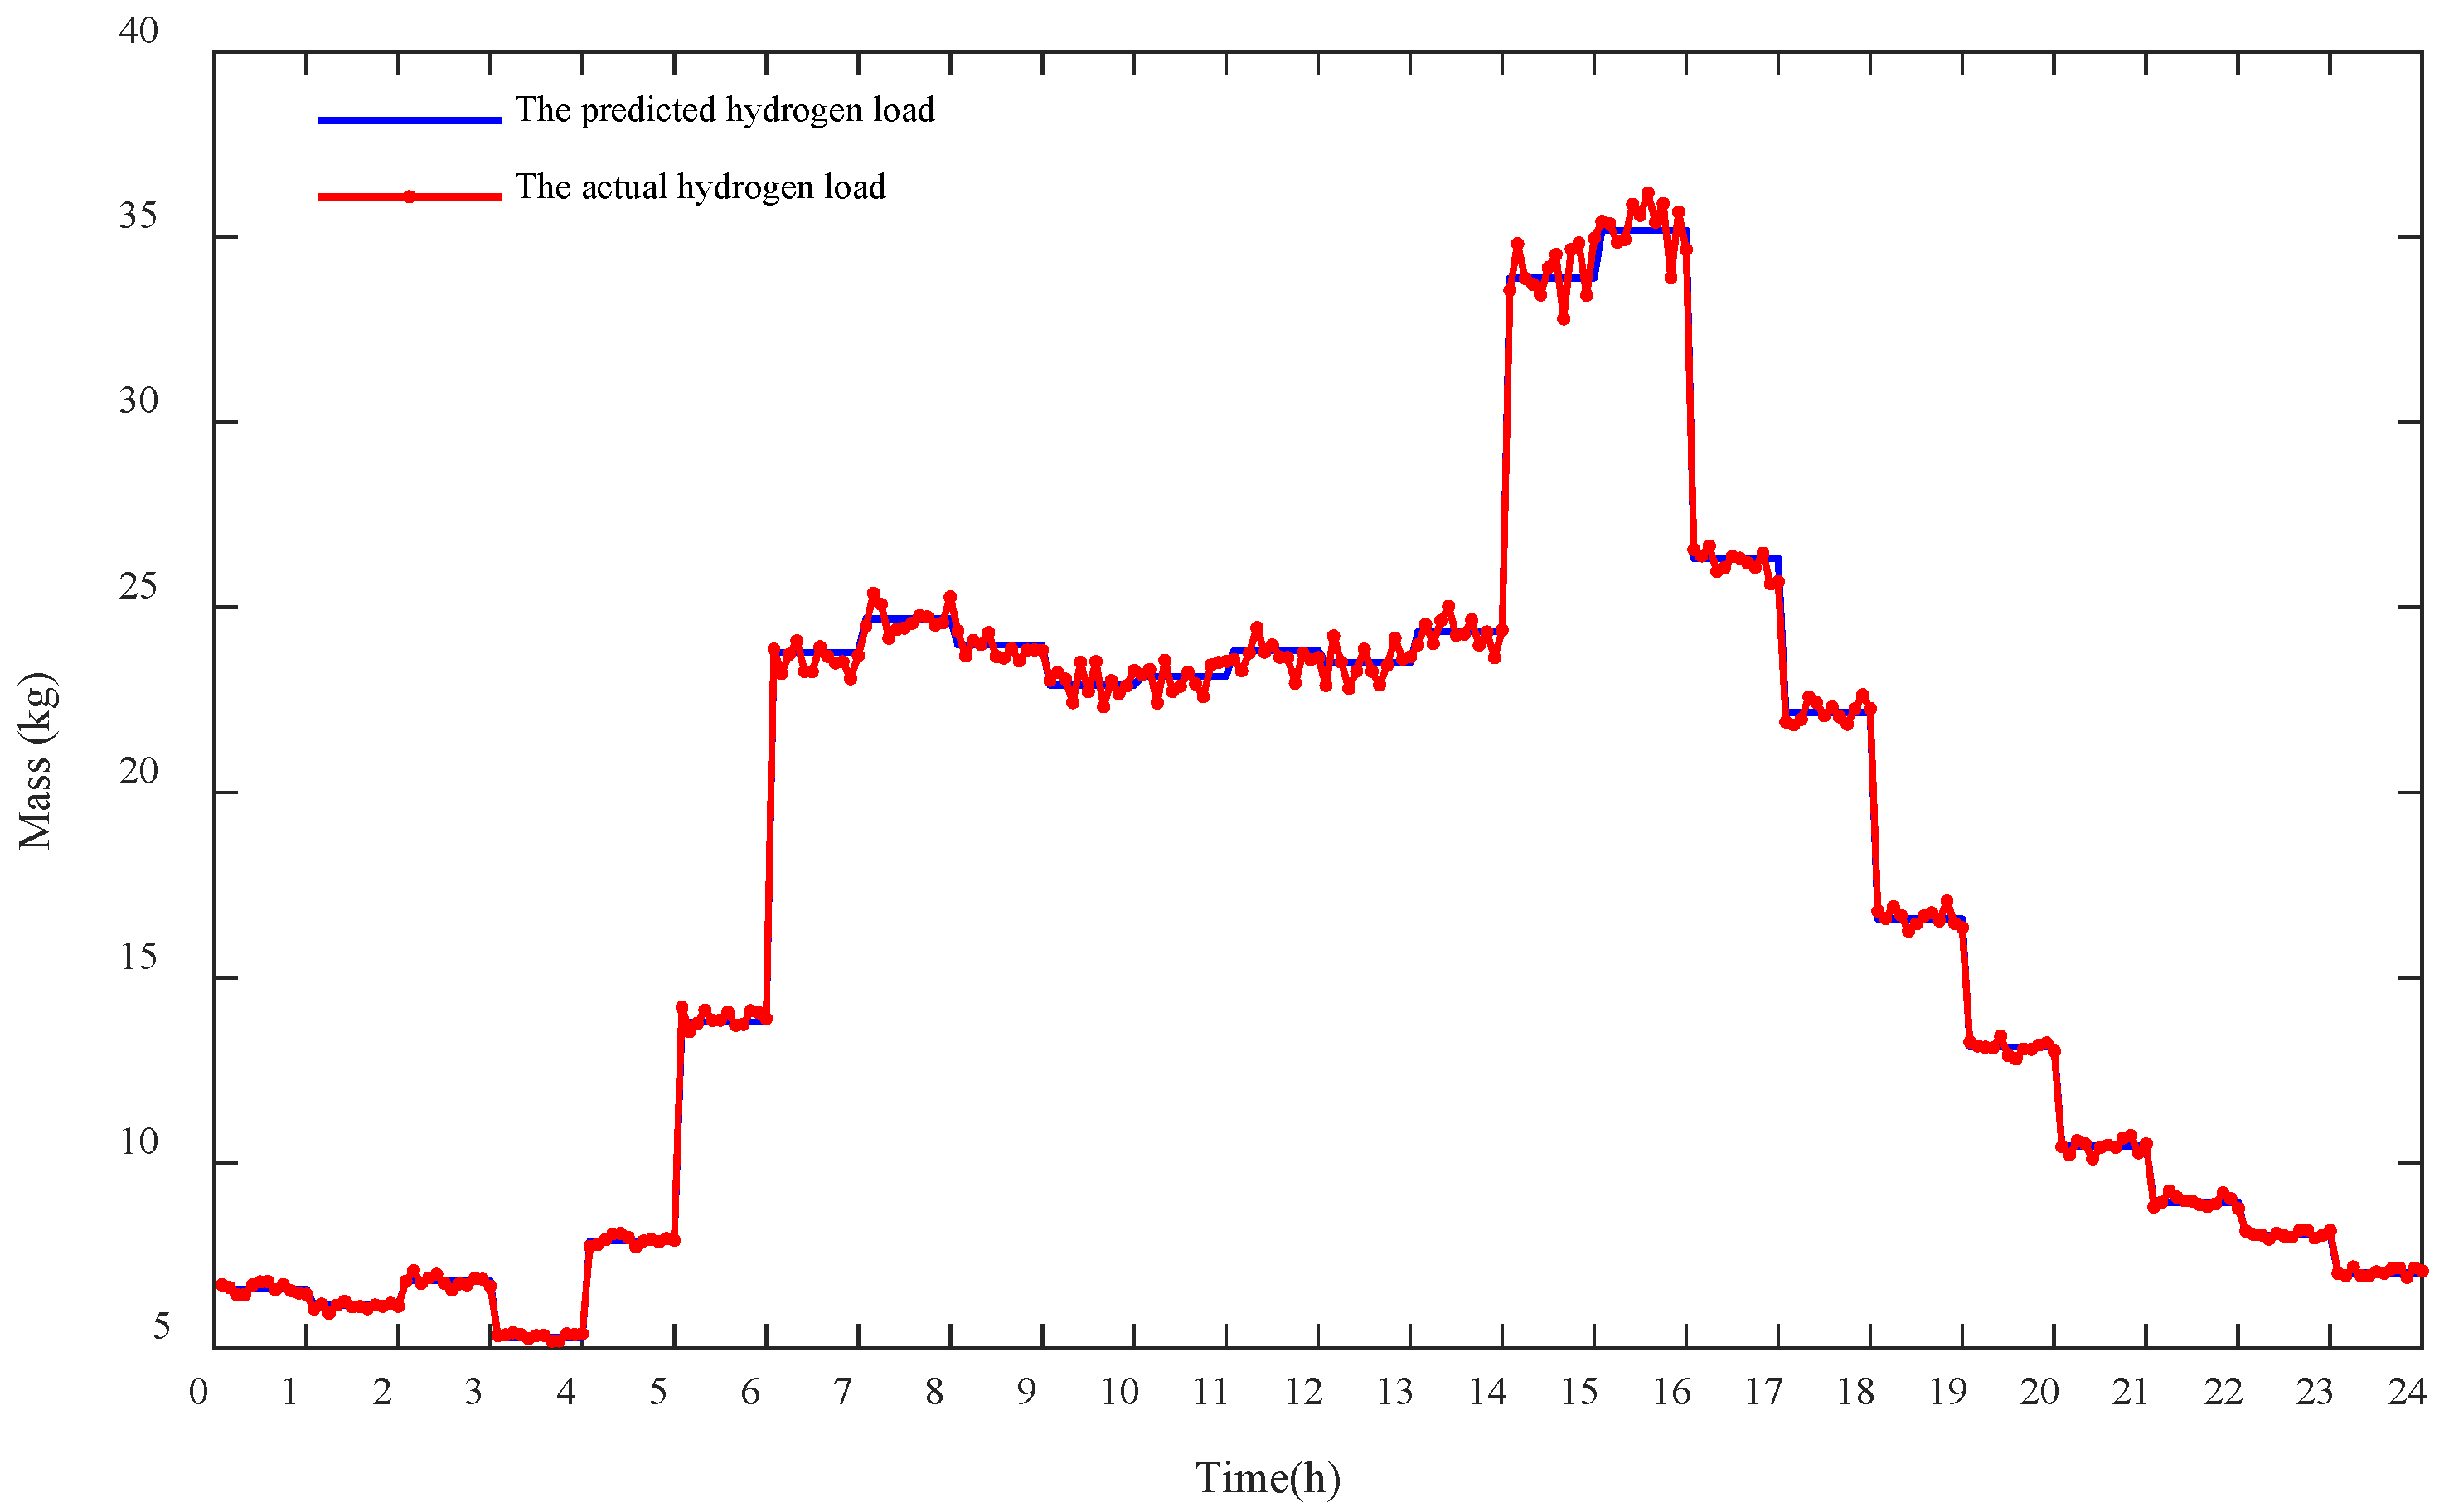
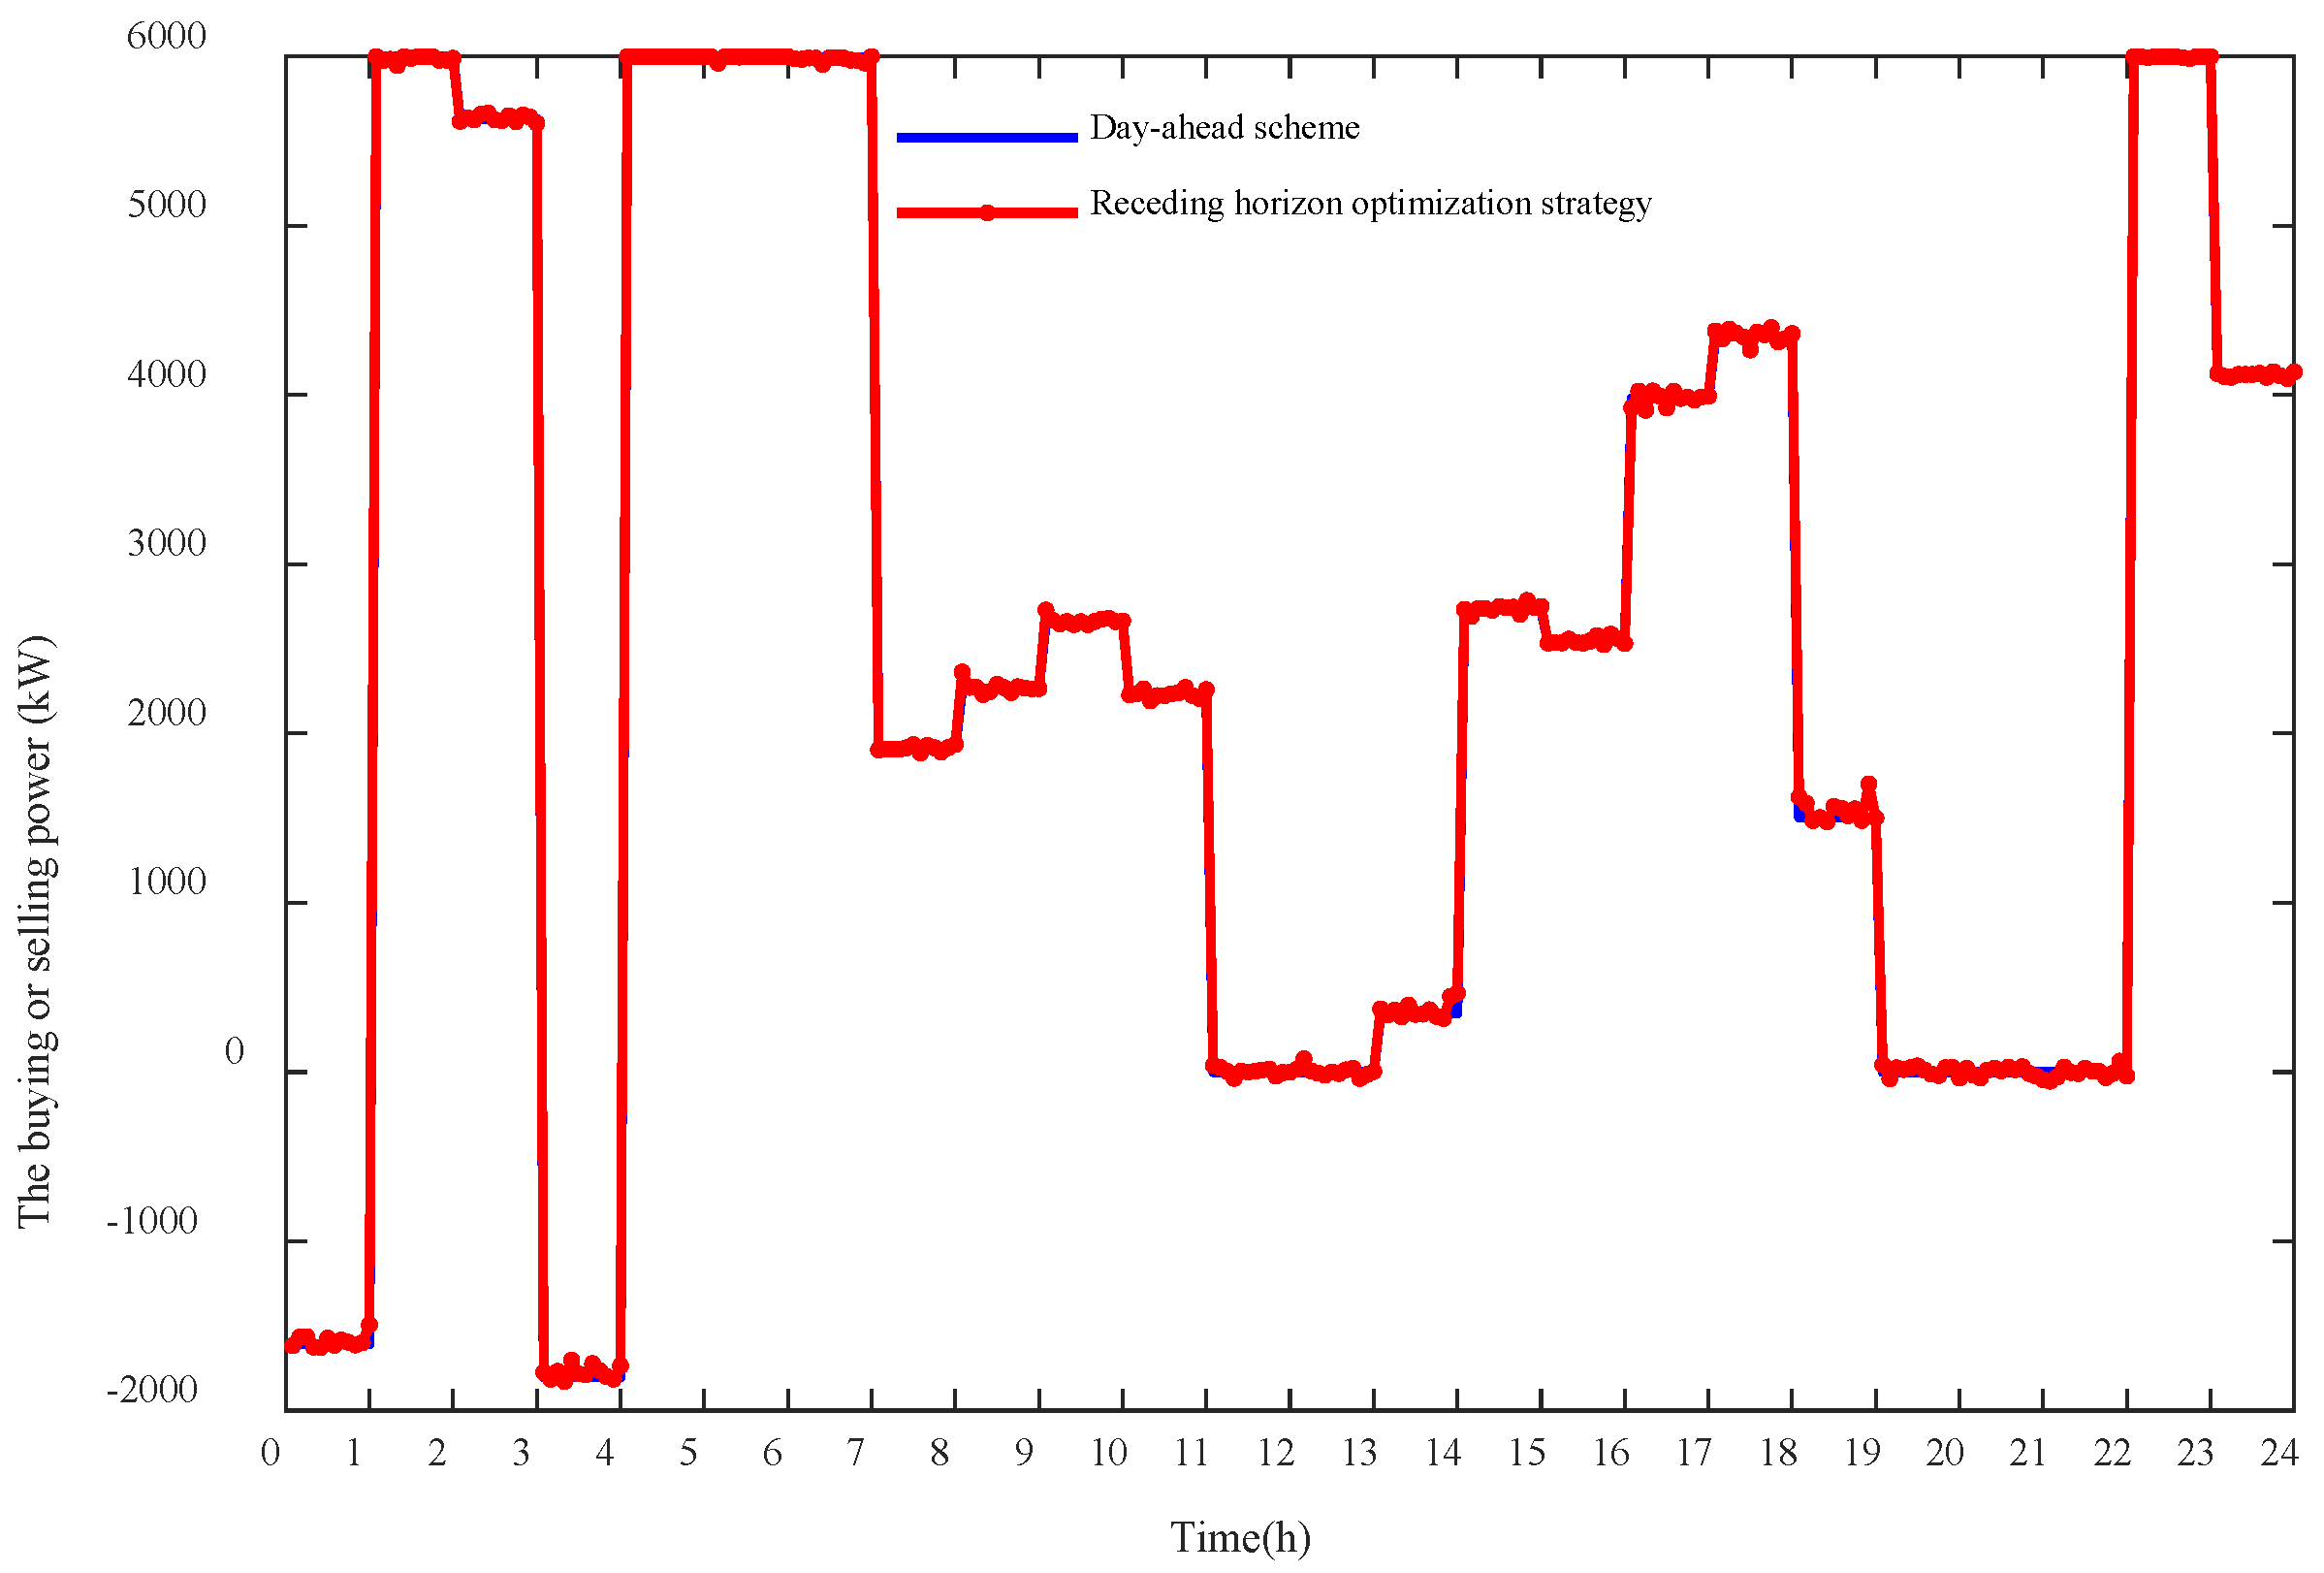
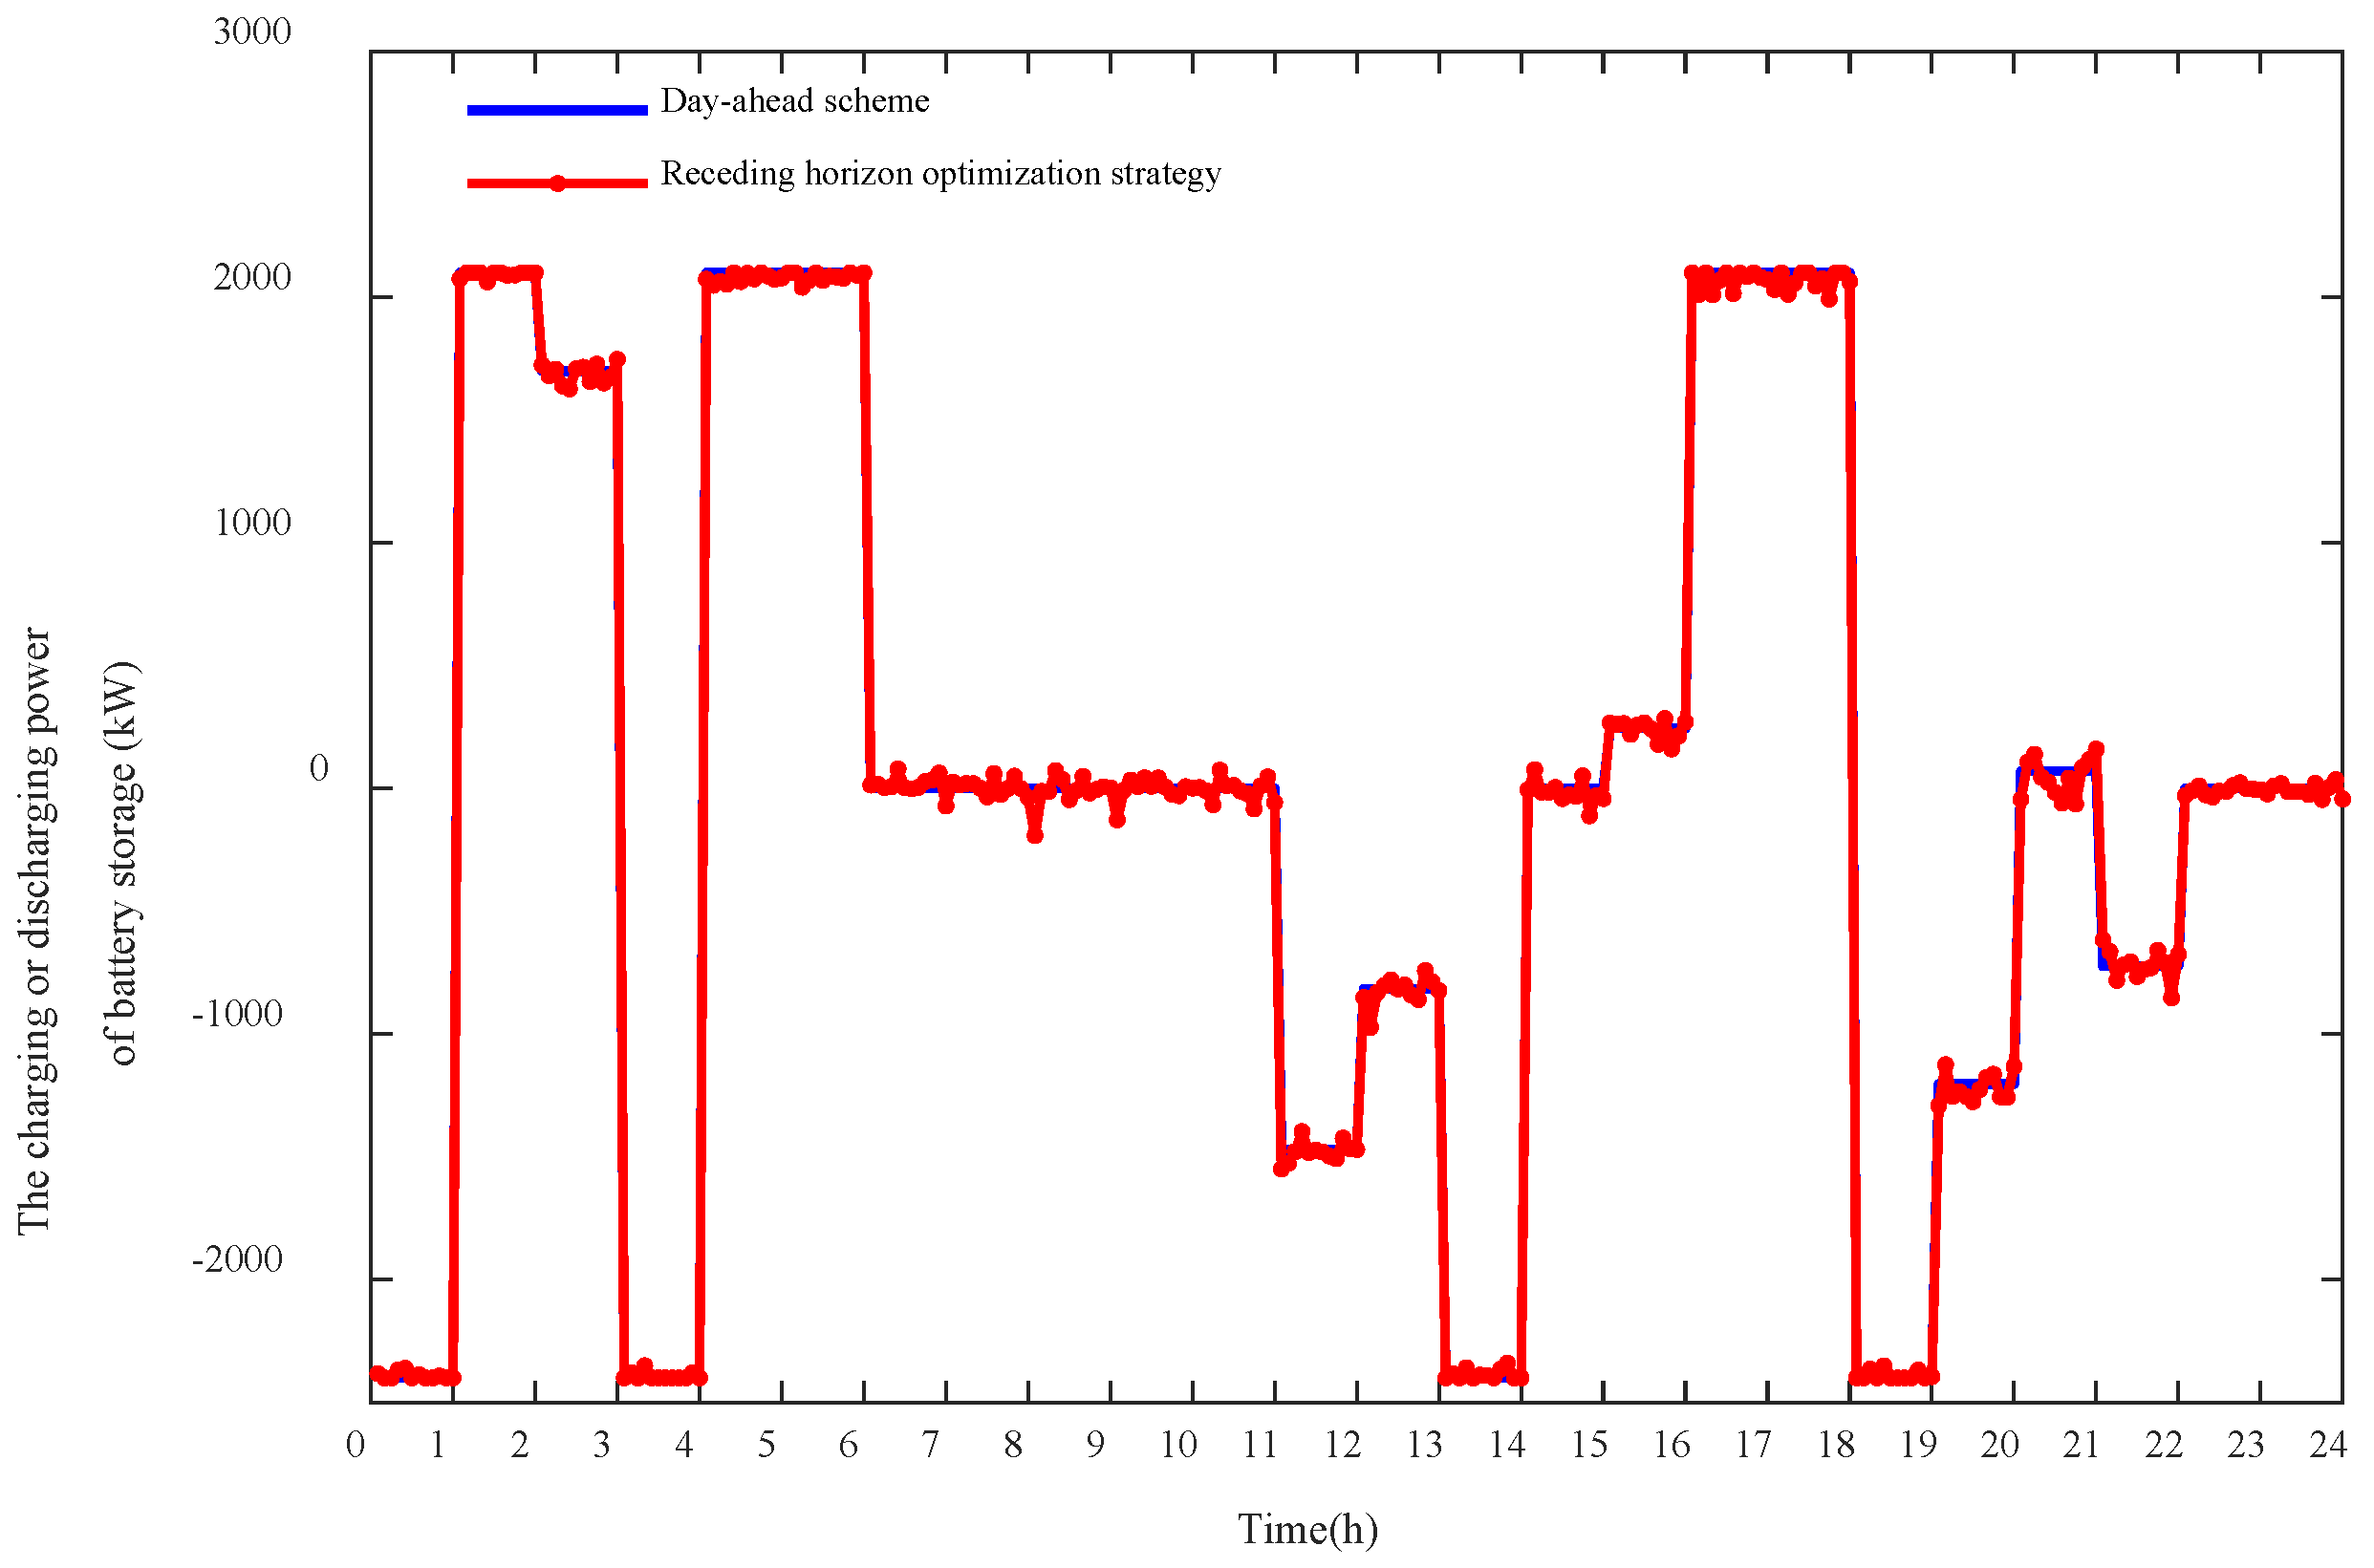
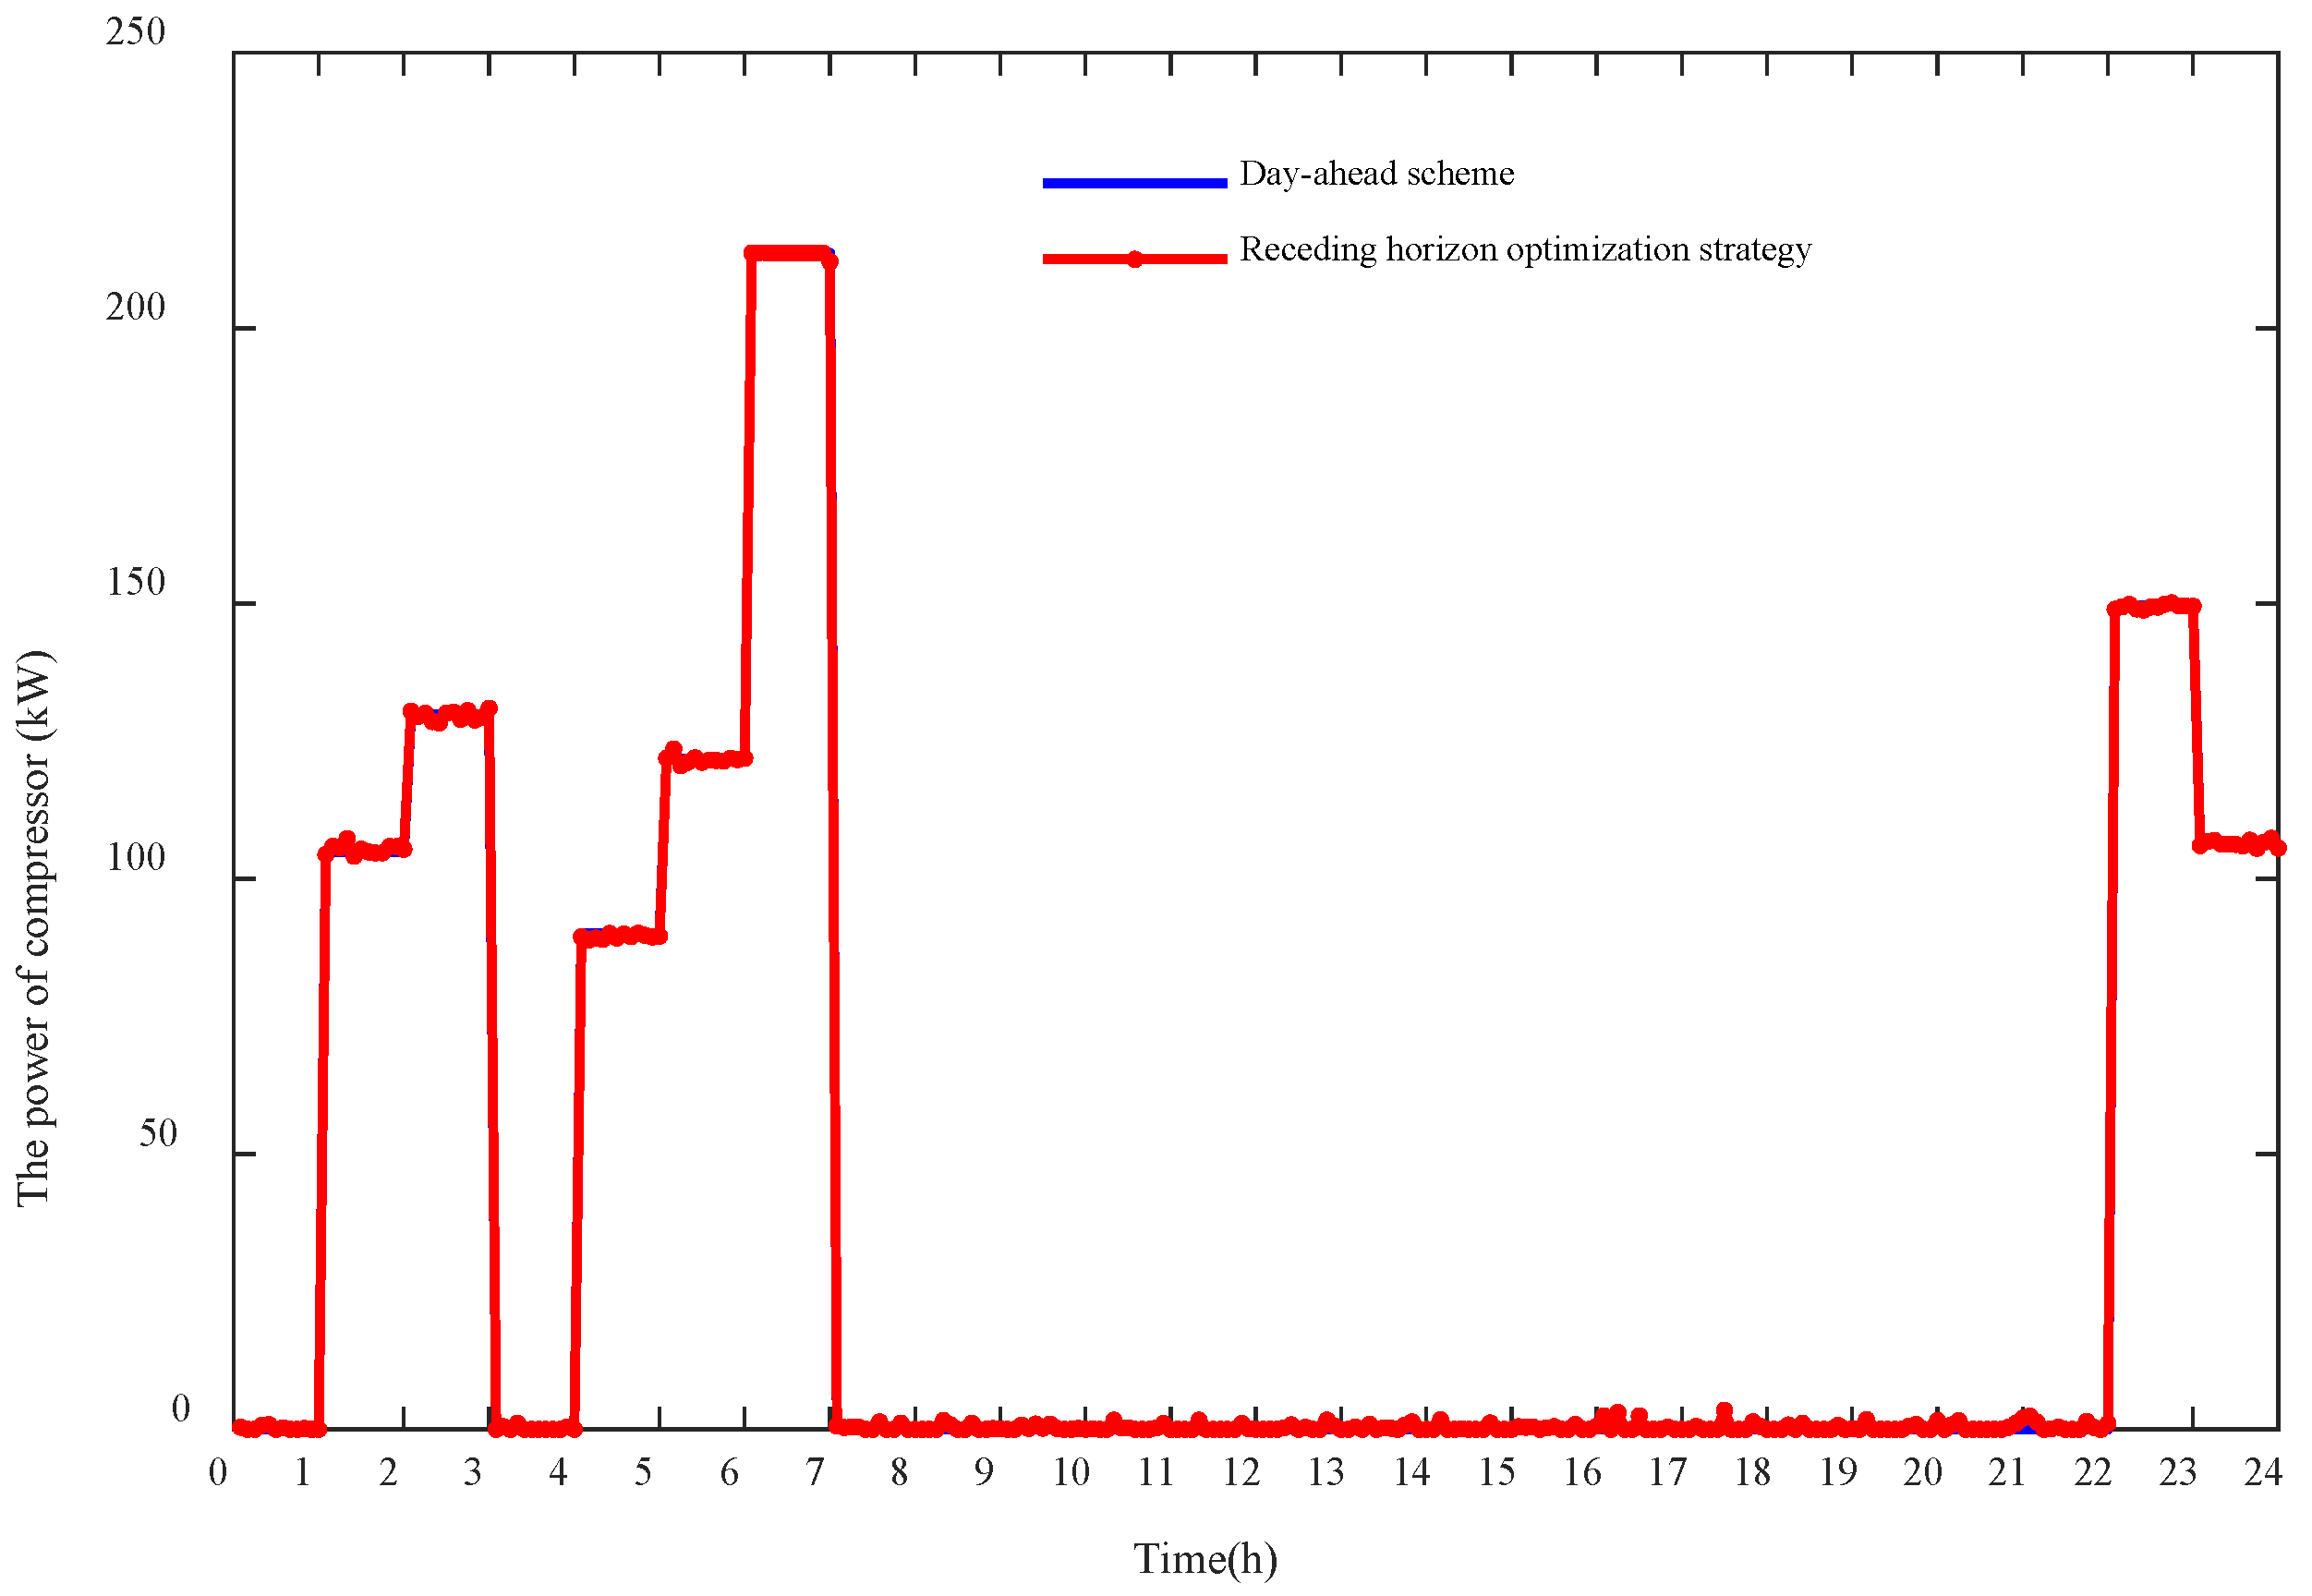
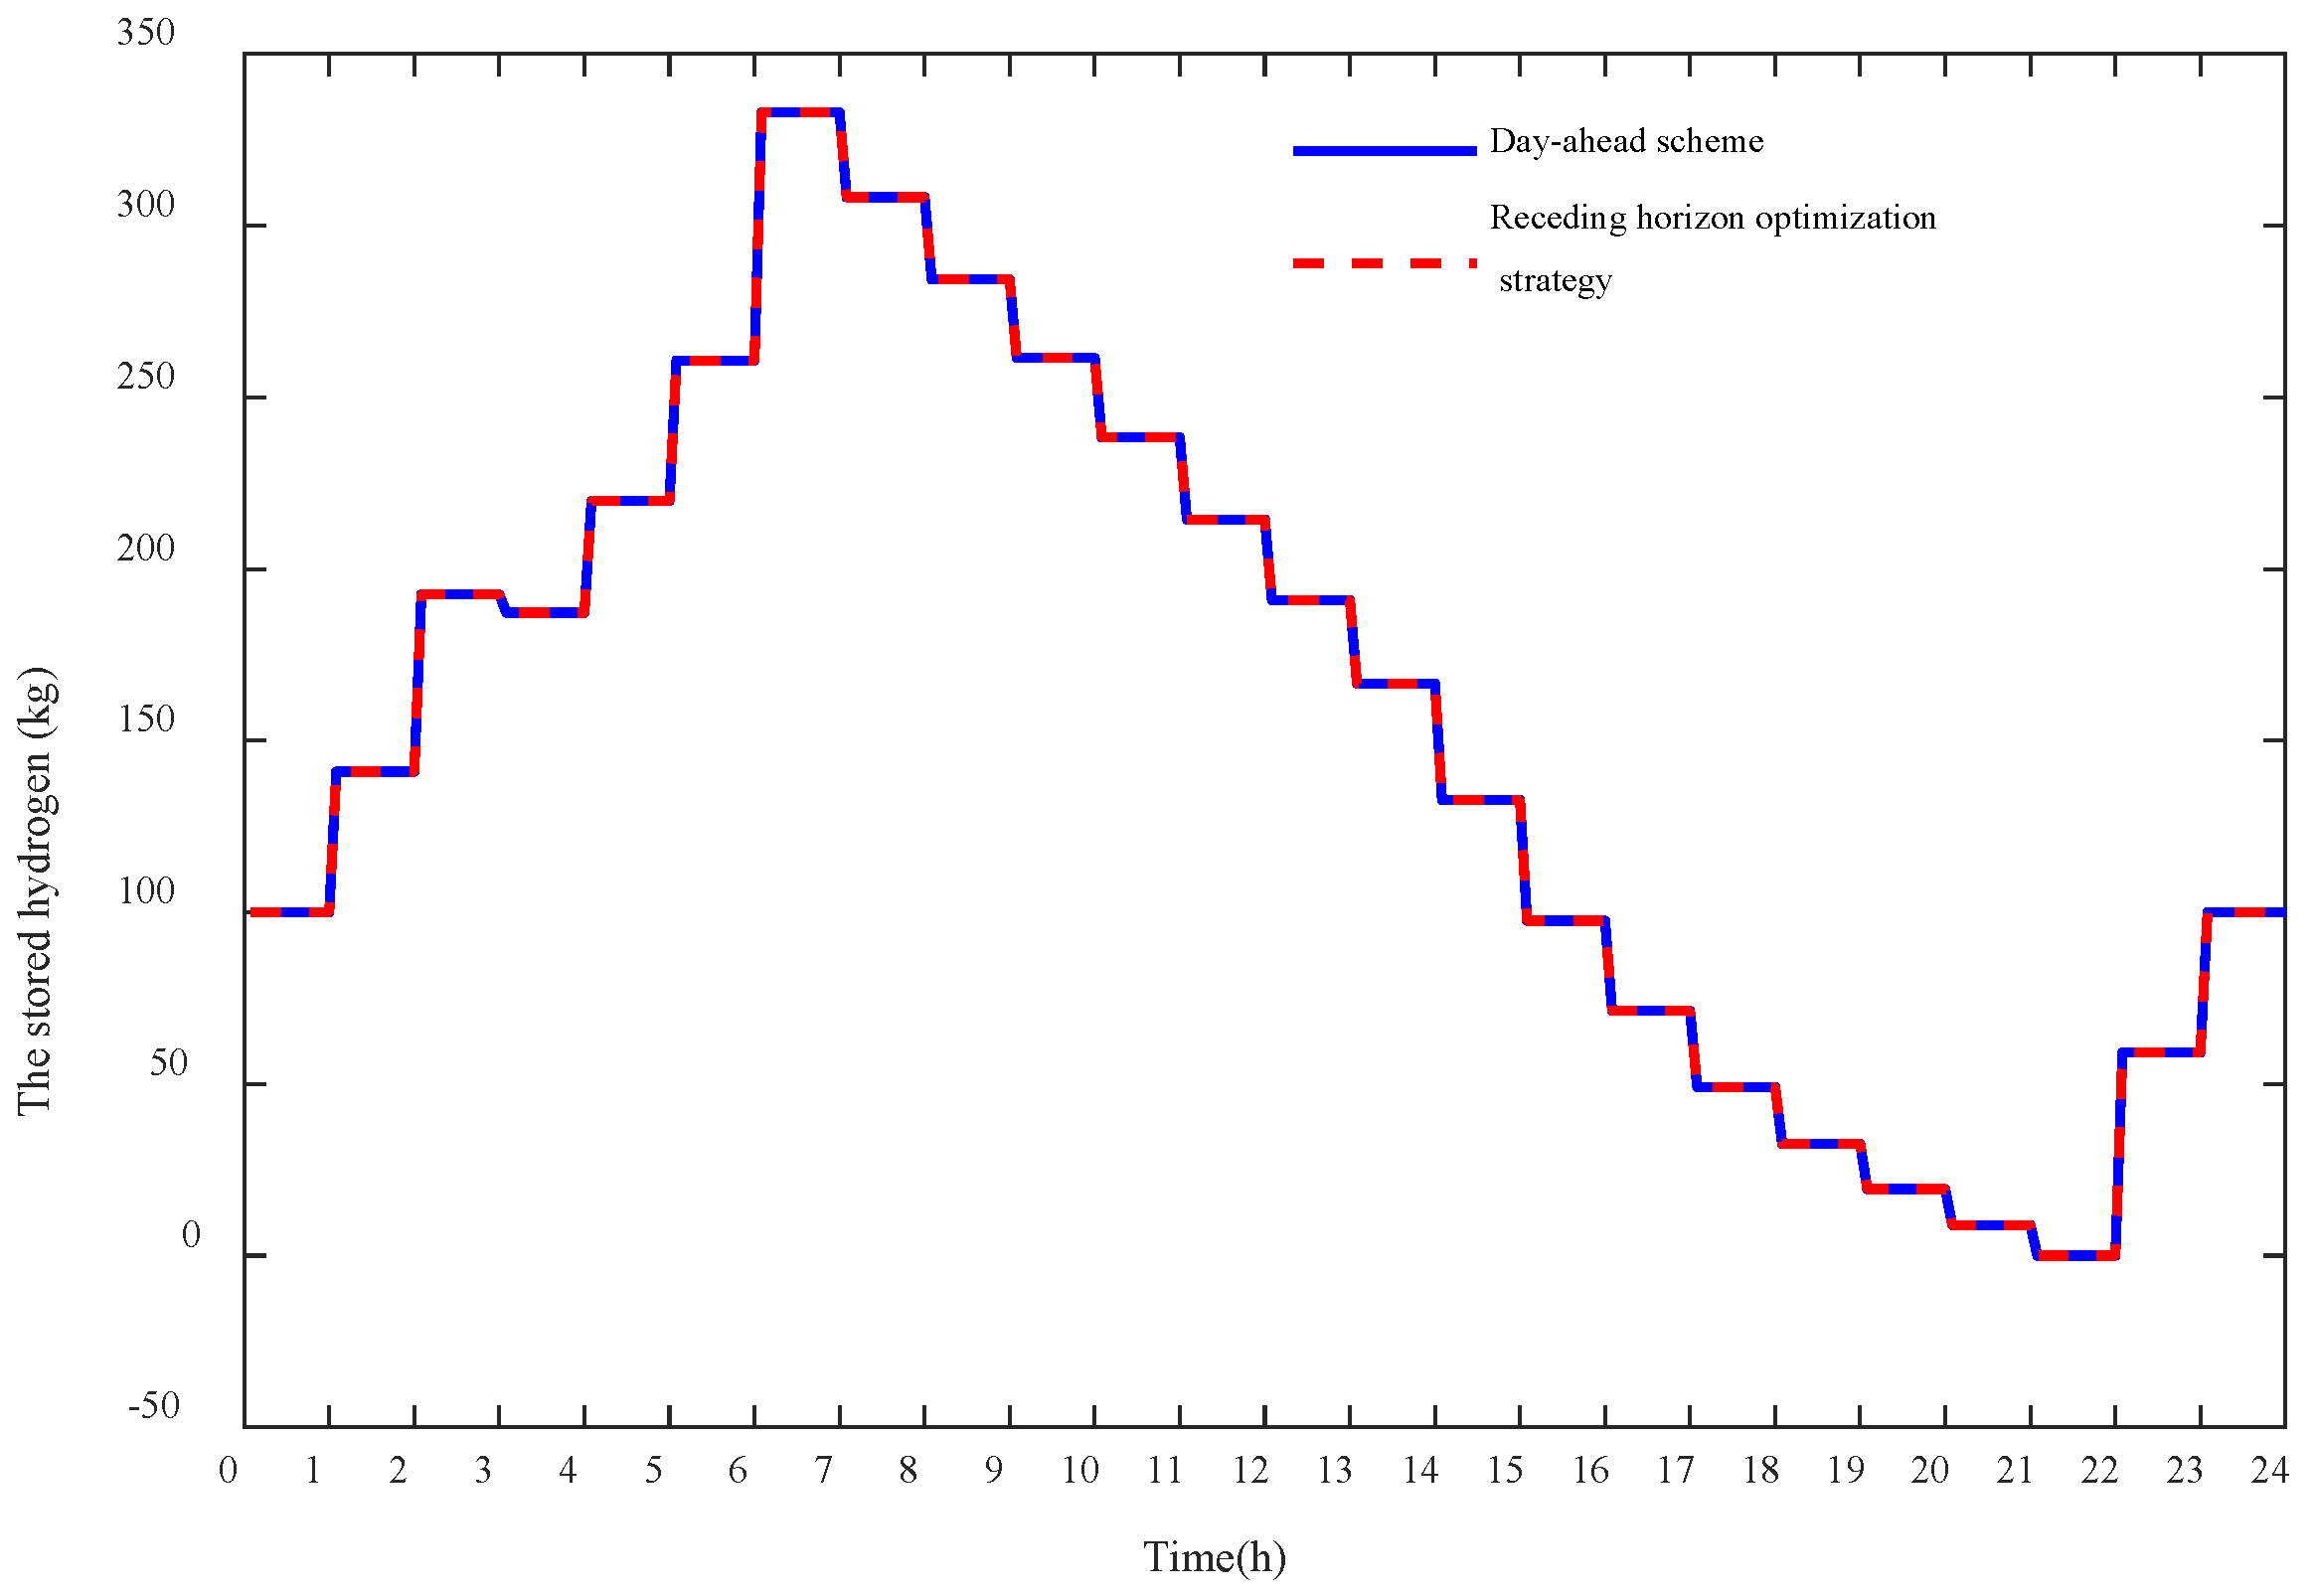
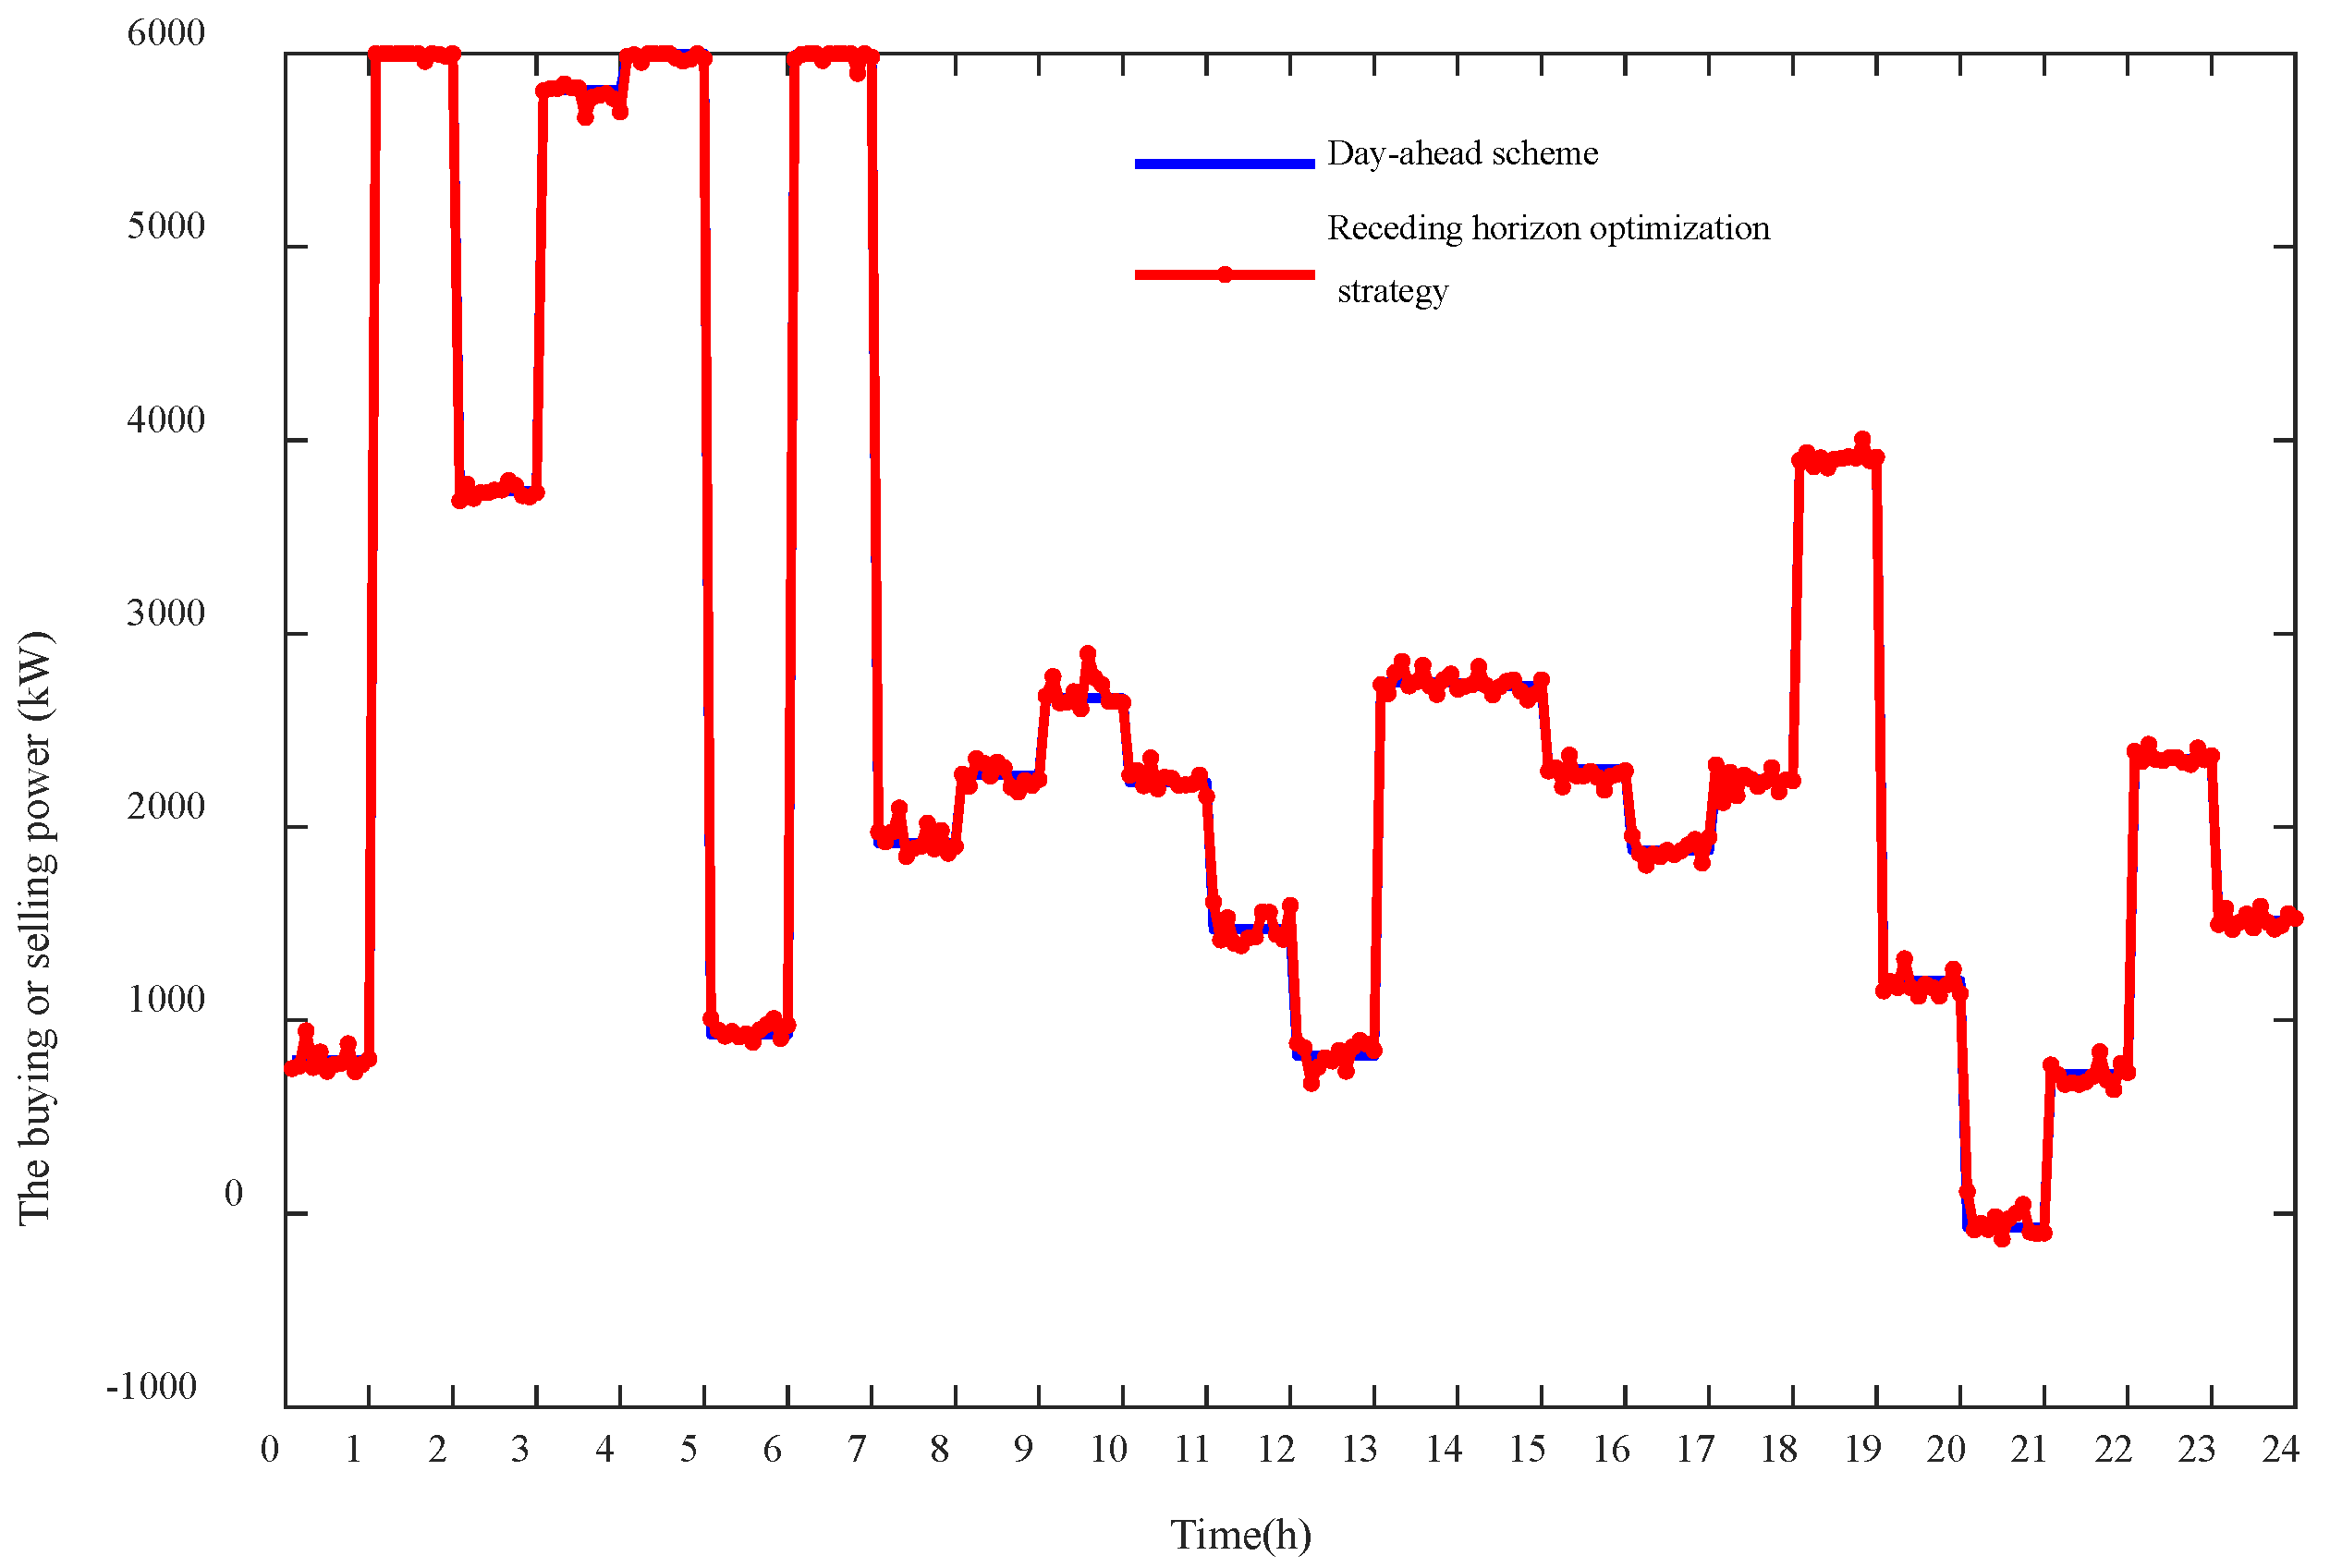
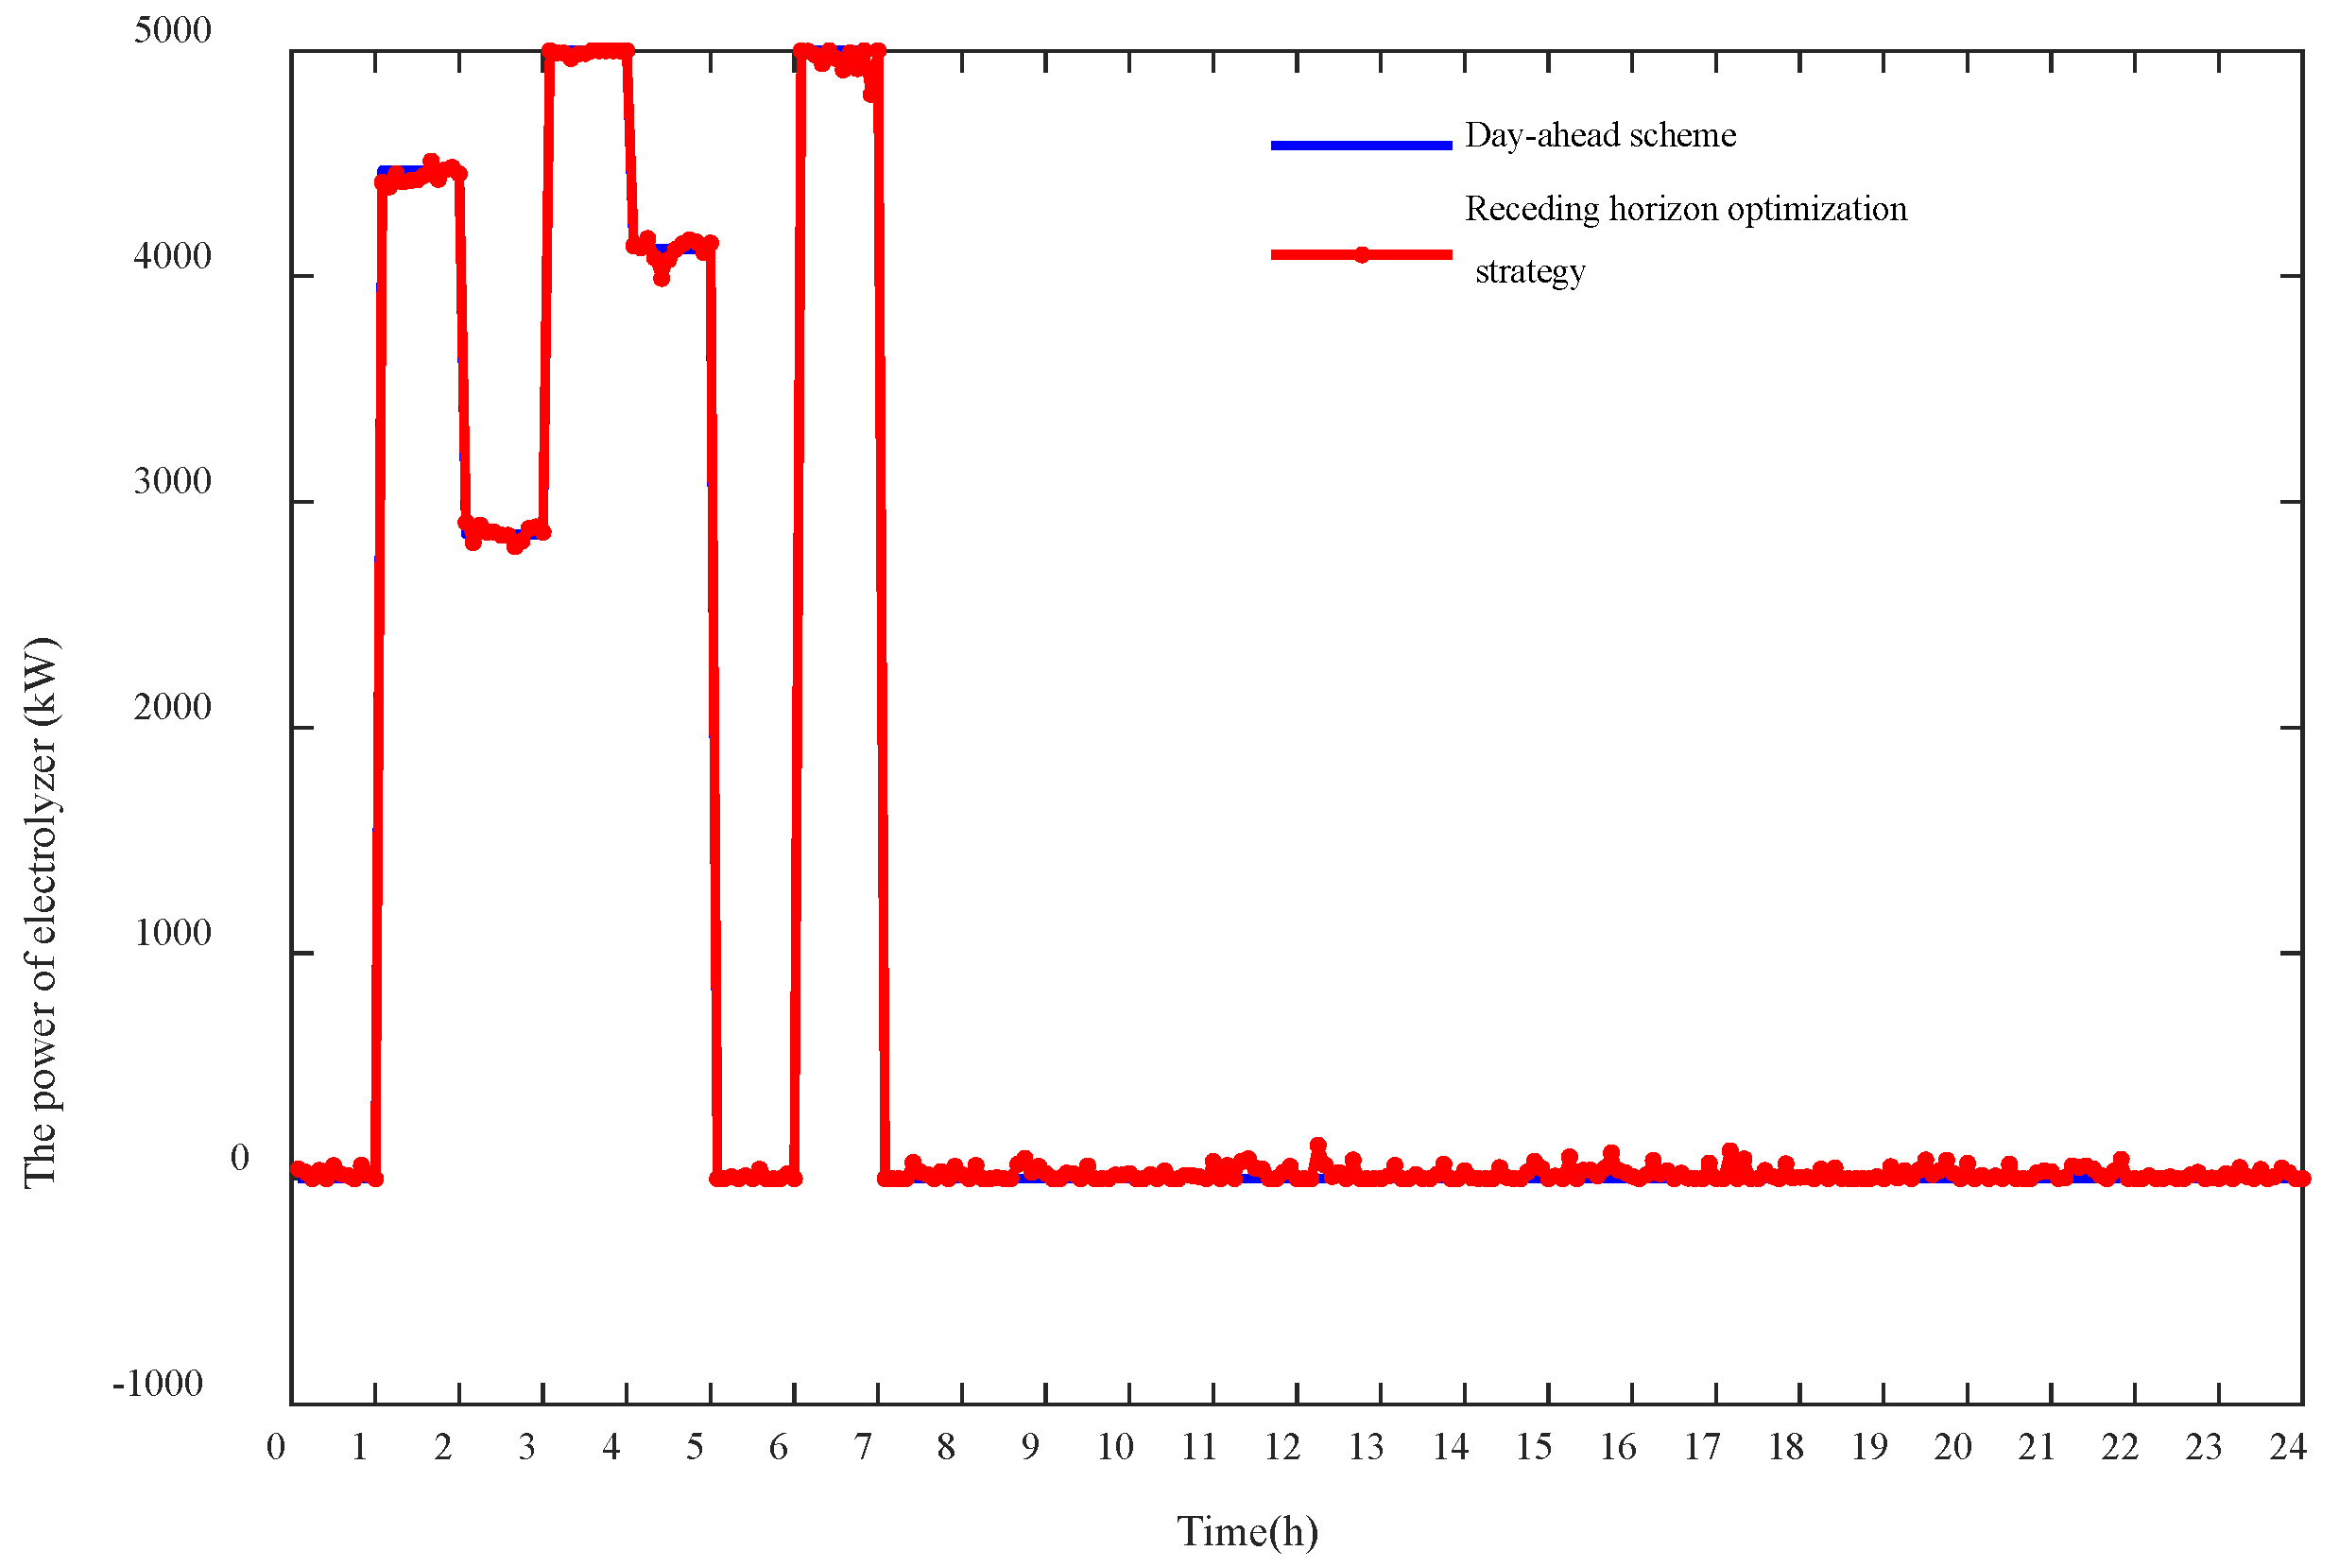
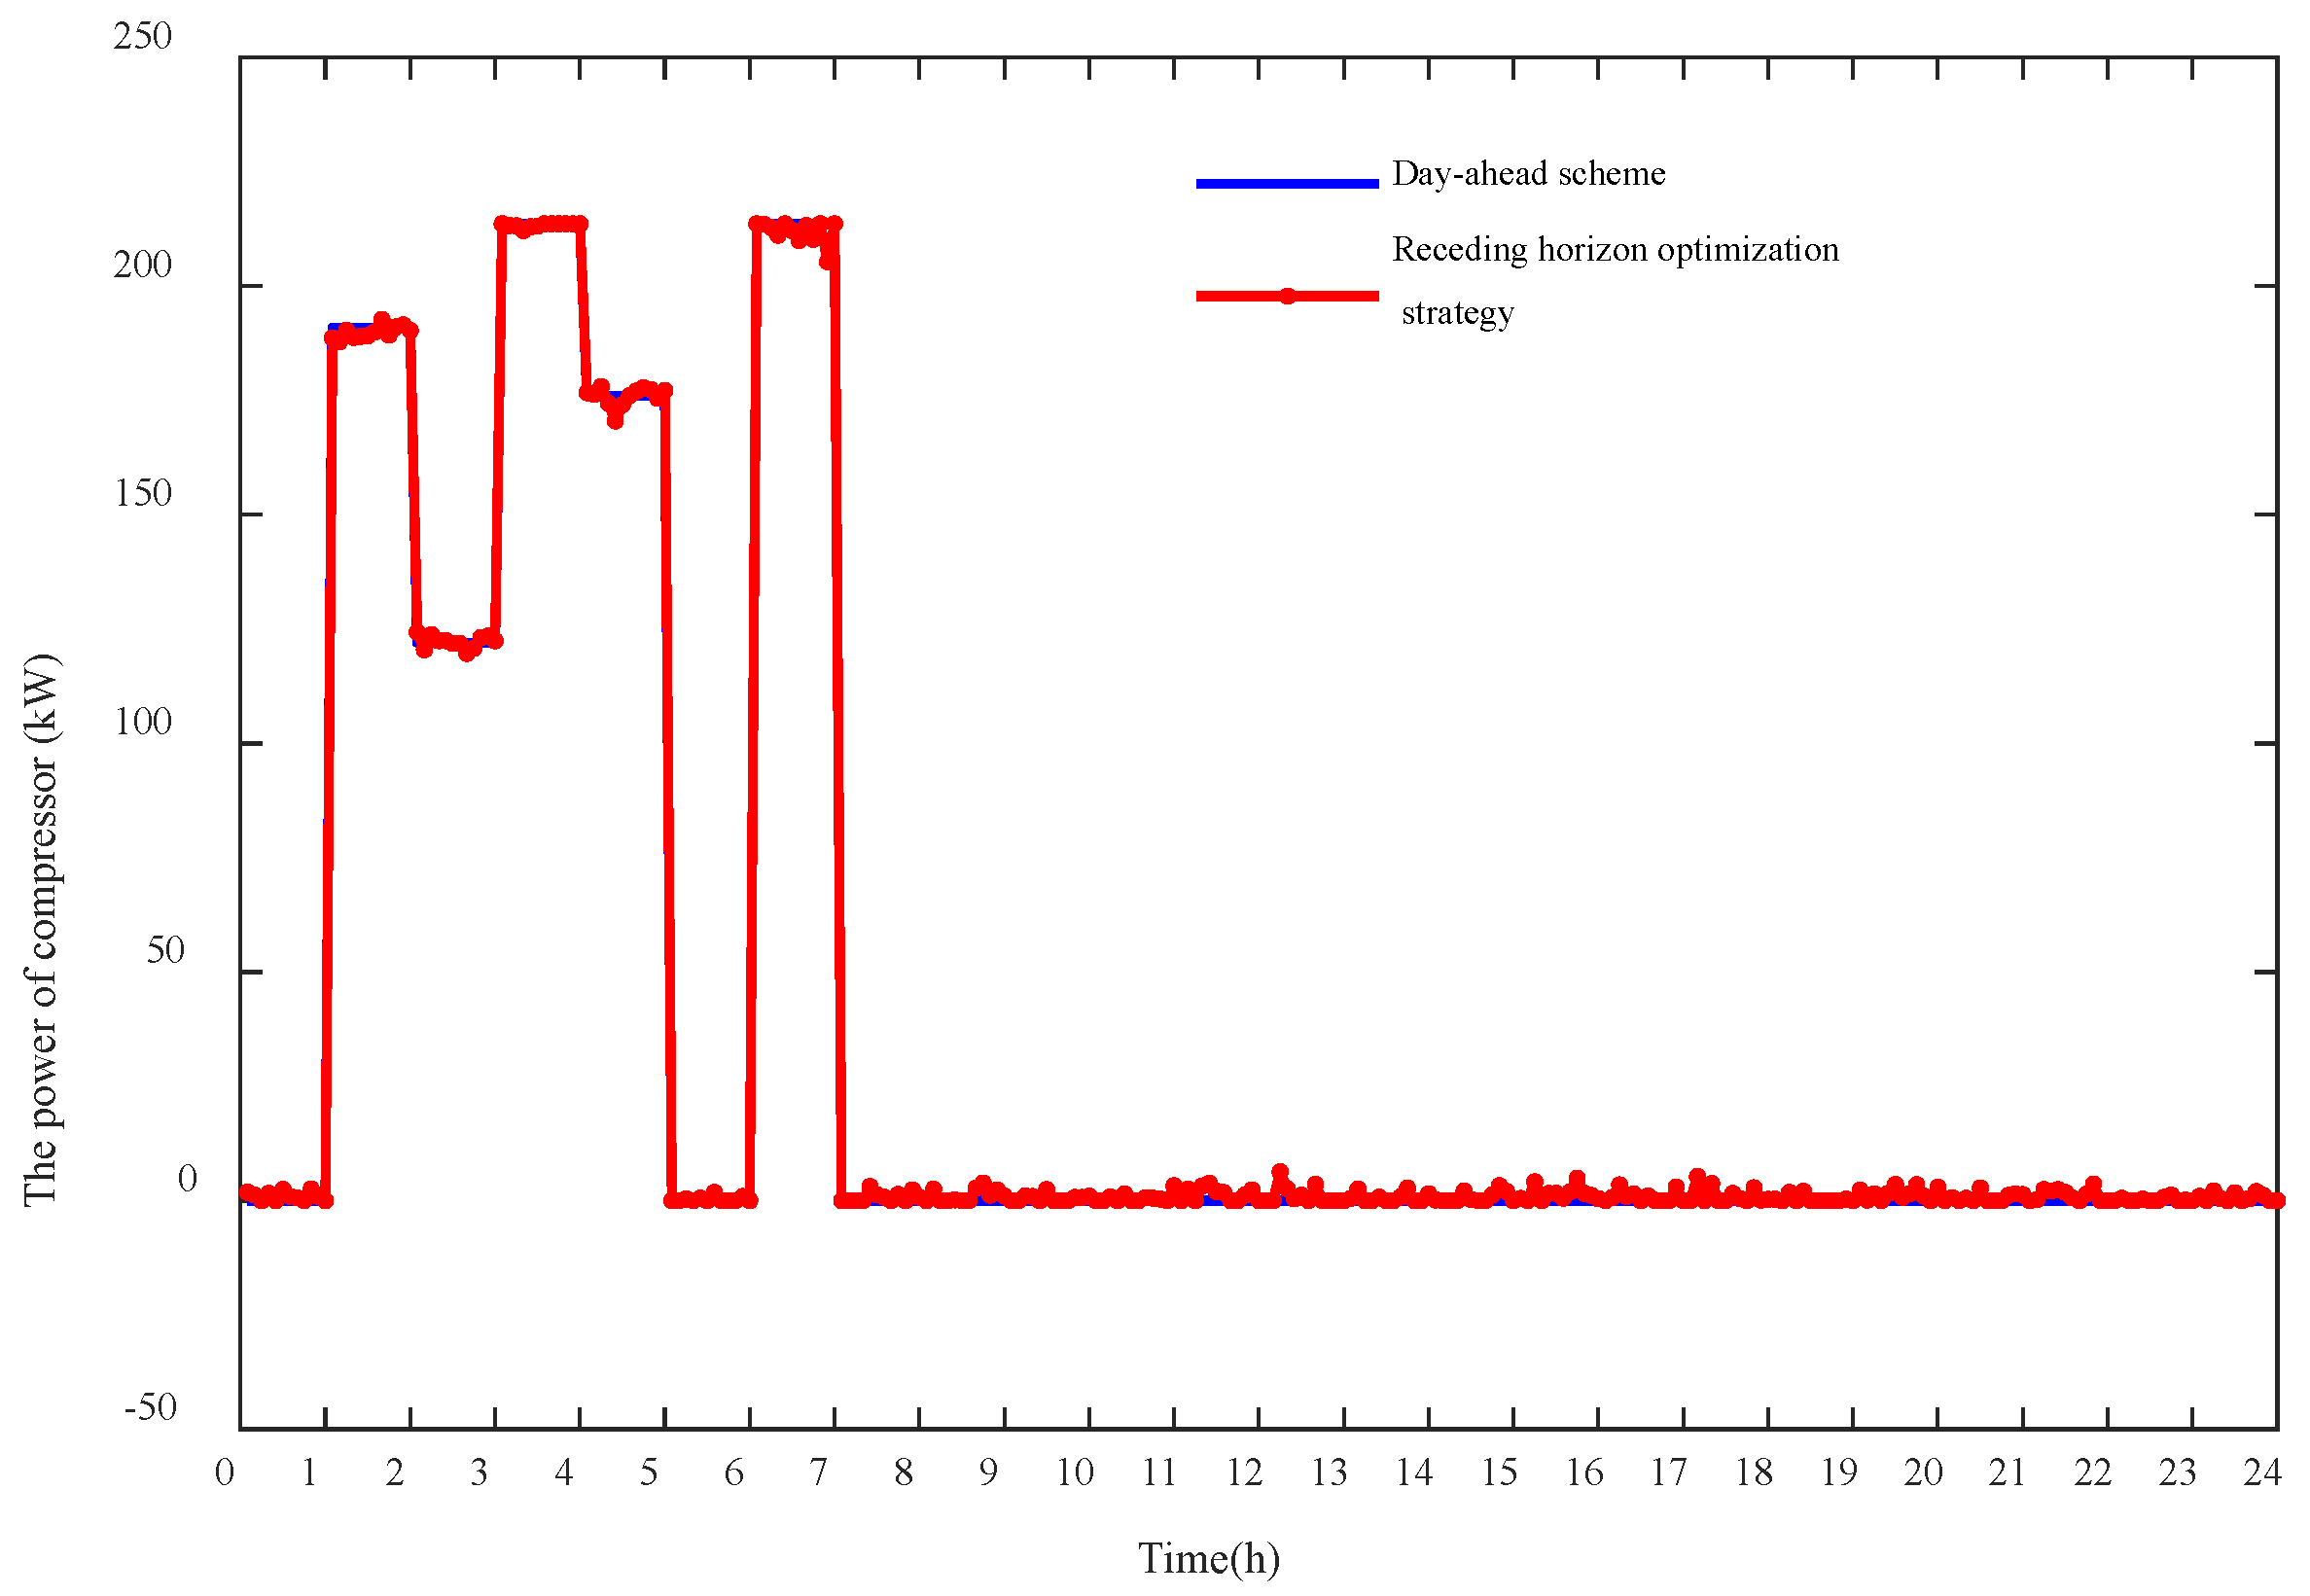
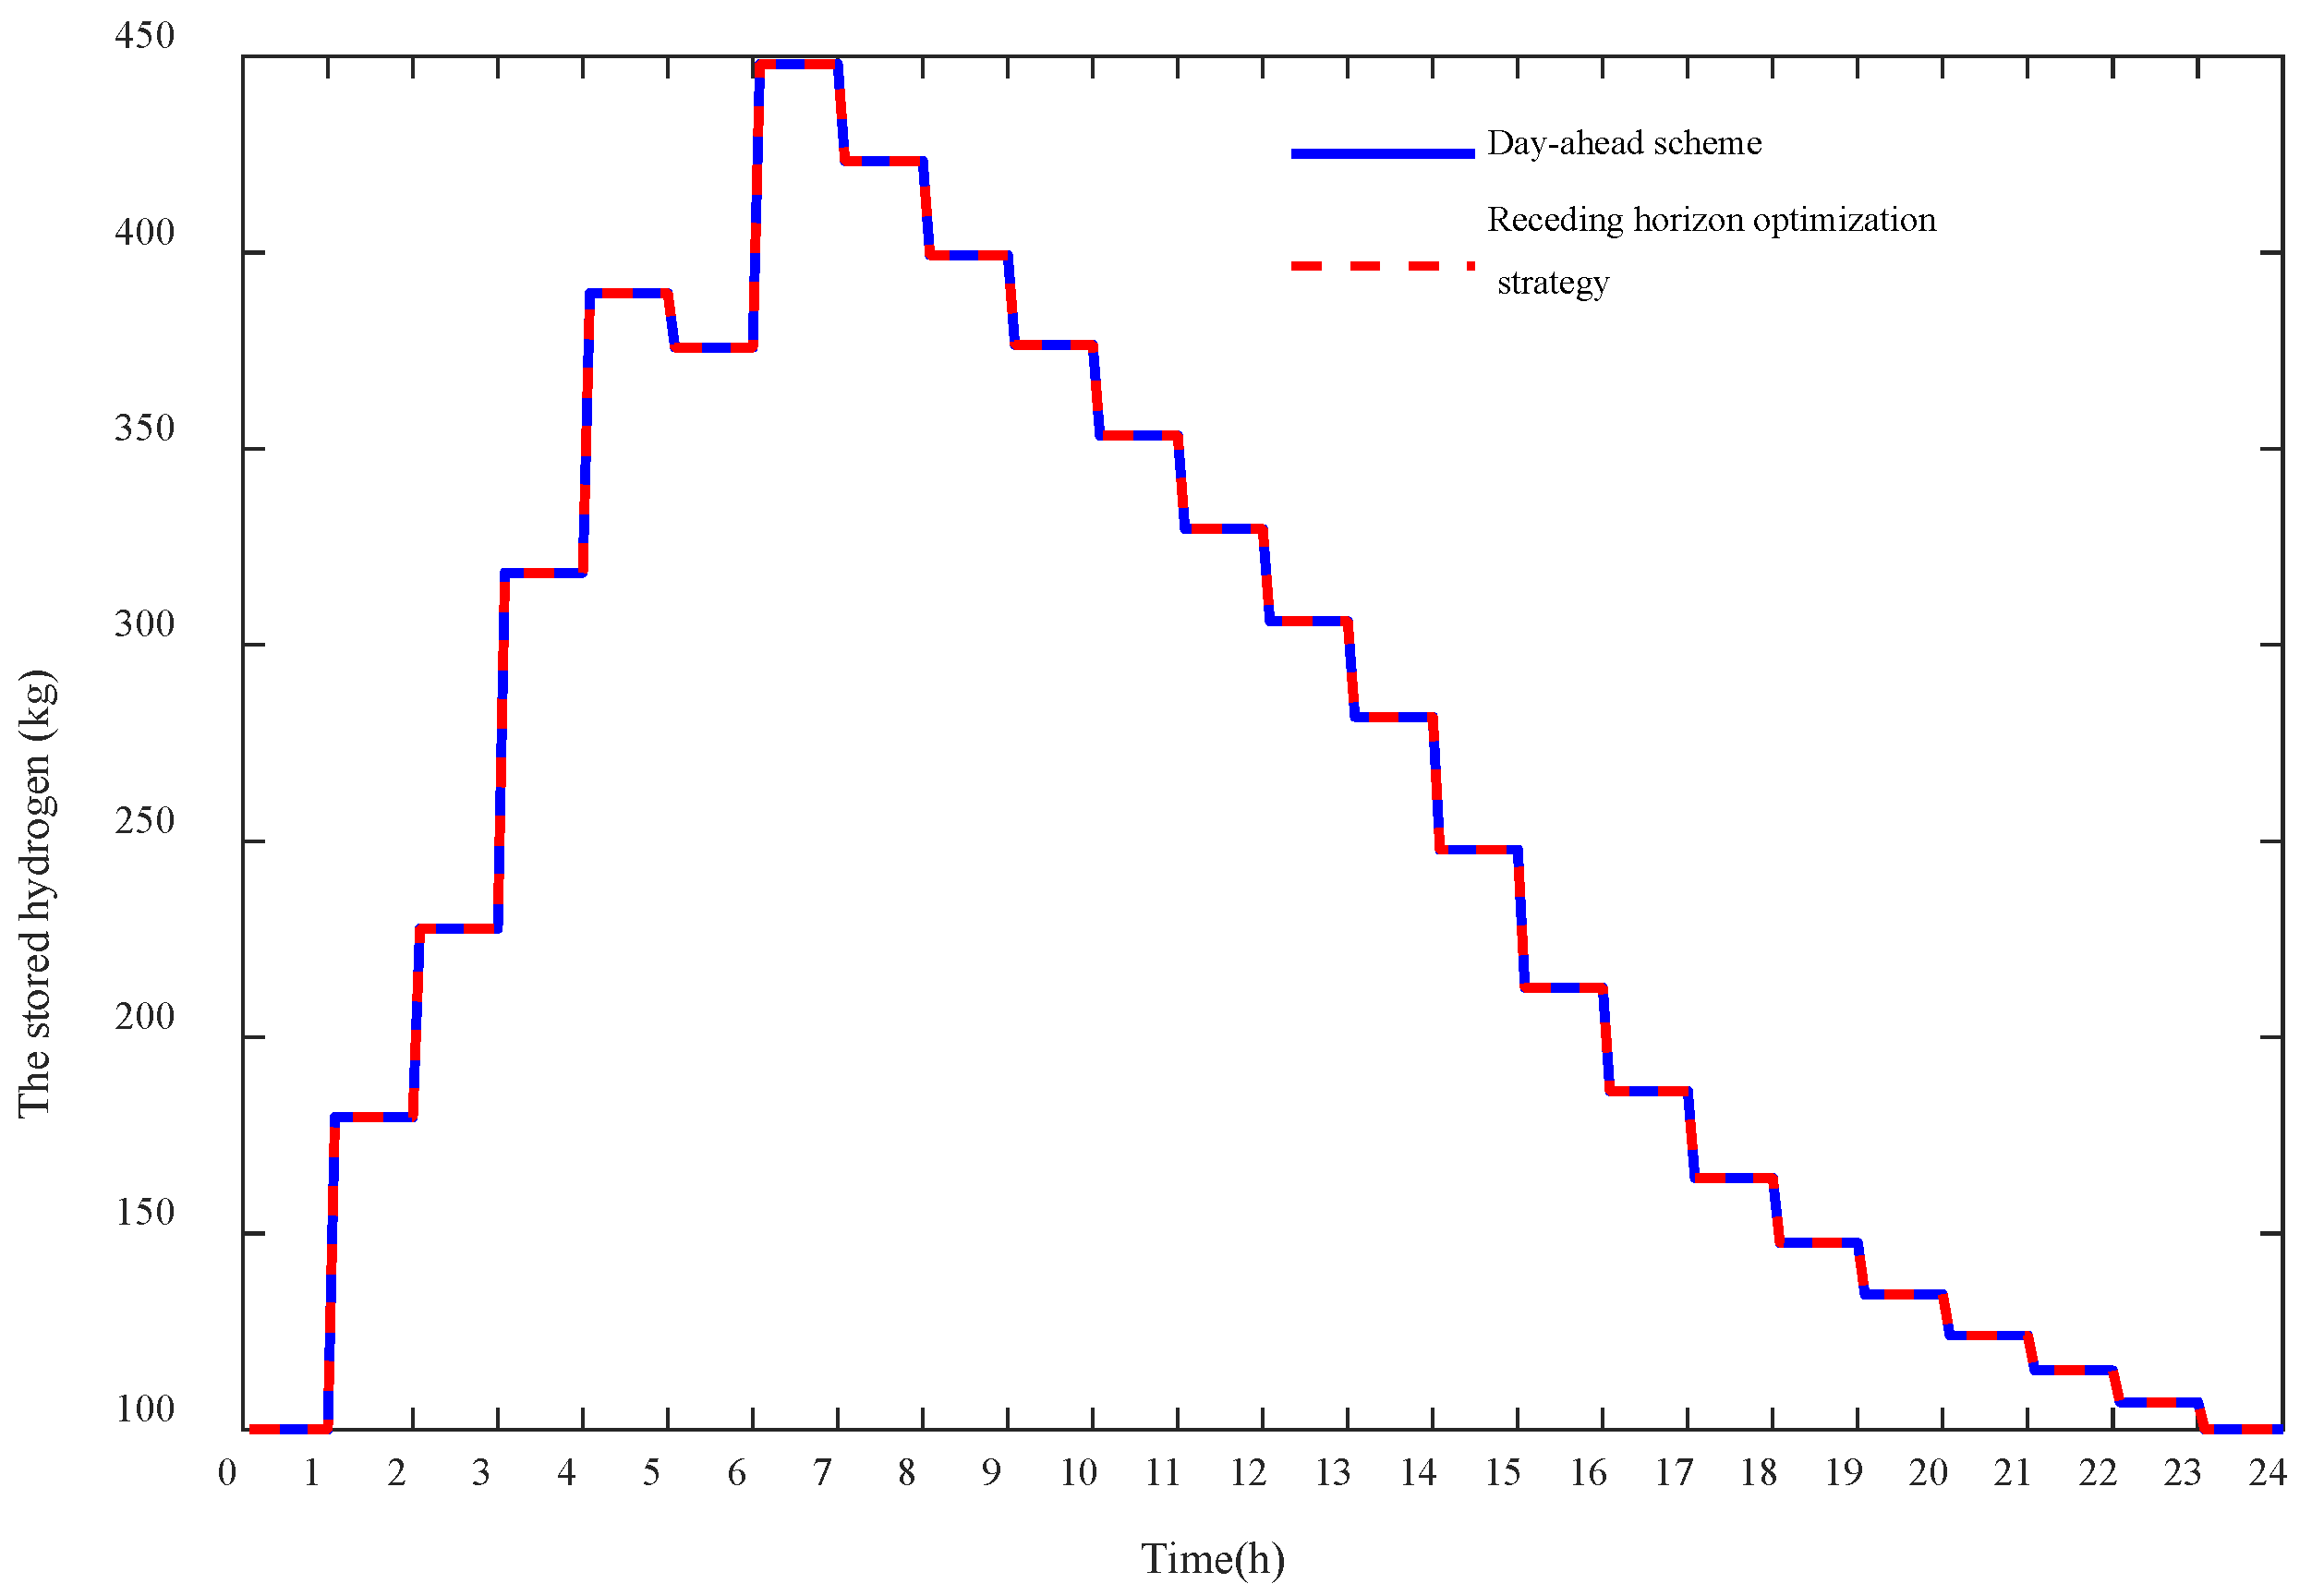
4.2.2. The Intra-Day Simulation Results

Figure 8, Figure 9, Figure 10, Figure 11, Figure 12 and Figure 13 show that the intra-day operation strategies are effective in tracing the day-ahead operation schemes and eliminating the effects of the volatility of renewable energies, power and hydrogen loads. Furthermore, the intra-day operation strategies of battery storage and hydrogen tank can completely trace their day-ahead states. The maximum deviations of exchanged power, the power of electrolyzer, the power of compressor and the power of battery storage are 199.45 kW, 81.34 kW, 3.48 kW and 191.62 kW, respectively. They all satisfy their maximum error constraints. Therefore, the intra-day optimization model is able to improve the operation stability of the WPHS microgrid and eliminate the adverse influence of the fluctuations of WT, PV, power and hydrogen demands.

4.2.3. The Simulation Results of WPHS Microgrid without Battery Storage

In this section, the sustainable WPHS microgrid in Figure 1 without battery storage is taken as the comparative microgrid (WPH microgrid) to demonstrate the roles of battery storages. Figure 14, Figure 15, Figure 16 and Figure 17 illustrate the day-ahead schemes and the intra-day operation strategies of buying or selling power, electrolyzer and compressor, respectively. Figure 17 illustrates the storage states of hydrogen tank. It can be seen that the proposed two-stage energy management model is robust and effective in coordinating the operation of the sustainable WPH microgrid, and intra-day receding horizon optimization strategies can effectively trace the day-ahead schemes. The operation costs for the microgrid with and without battery storage are 27,727 CNY and 31,815 CNY, respectively. The battery storage can reduce the operation cost dramatically by 12.85%. Furthermore, the maximum of the deviation of the receding horizon optimization strategy and the day-ahead scheme is 202.0123 kW and 231.5762 kW for the microgrid with and without battery storage, respectively. This deviation is reduced by 12.77% when the battery storage is considered. Therefore, the battery storage can also alleviate the fluctuations of the exchanged power with power grid and improve the performance of the intra-day optimization model.
Remark 1:
Though other methods, such as the scenario-based stochastic programming method and robust optimization [36], can also tackle the uncertainties, the former needs the probability distribution of uncertain factors and a huge number of scenario simulations, which may be a heavy burden. While the robust optimization can incorporate the uncertainties with a range without underlying probability distributions, and the optimal solutions in the worst case can be obtained, however, these solutions are very conservative [36]. The two-stage energy management method needs neither probability distribution nor huge scenario simulations; the robust solutions can be obtained based on the updated predicted data.

5. Conclusions

A two-stage energy management model is proposed for the sustainable wind-PV-hydrogen-storage microgrid based on receding horizon optimization. In the first stage, the day-ahead optimization is performed based on the predicted outpower of WT and PV, the predicted demands of power and hydrogen loads. In the second stage, the intra-day optimization is performed based on the actual data to trace the day-ahead operation schemes. The following conclusions are drawn.
(1)
The proposed two-stage optimization is effective in managing the operation of the micro and eliminating the uncertainties and fluctuations of WT, PV and loads. The day-ahead optimization can effectively coordinate the operations of the WT, PV, battery storage and power-to-hydrogen subsystems, and realize the high-efficiency operations. The intra-day optimization model is able to improve the operation stability of the WPHS microgrid and eliminate the adverse influence of the fluctuations of WT, PV, power and hydrogen demands.
(2)
The proposed two-stage energy management model is robust and effective in coordinating the operation of the sustainable WHP microgrid, and intra-day receding horizon optimization strategies can effectively trace the day-ahead schemes. In addition, the battery storage can reduce the operation cost dramatically by 12.85%, as well as alleviate the fluctuations of the exchanged power with the power grid, and the maximum deviation of the exchanged power between the day-ahead and intra-day strategies is reduced by 12.77% when the battery storage is considered.
Furthermore, in the future work, more accurate models of each component, including consideration of the startup cost and ramp time of the green hydrogen system will be considered. The demand side management issue is another interesting topic, which can be integrated in the two-stage energy management model. The mean efficiency of the whole process of the system can also be discussed and analyzed in the future work.

Author Contributions

Conceptualization, W.P.; methodology, H.X.; investigation, T.M. and J.W.; resources, D.L.; writing—original draft preparation, J.W. and T.M.; writing—review and editing, X.L.; supervision, X.M.; project administration, J.Z.; funding acquisition, J.W. All authors have read and agreed to the published version of the manuscript.

Funding

This research was funded by the Science and Technology Project of State Grid JILIN Electric Power Supply Company (NO. B7234220002J).

Institutional Review Board Statement

Not applicable.

Informed Consent Statement

Not applicable.

Conflicts of Interest

The authors declare no conflict of interest.

Abbreviations

PVPhotovoltaic WTWind turbine
WPHSWind-PV-hydrogen-storageWPHWind-PV-hydrogen
Parameters and variables of wind turbine model
P W T t Outpower of WT at time slot t P R W T Rated power of WT
v t Wind speed at time slot t v i n Cut-in wind speed
v o u t Cut-out wind speed v r Rated wind speed of wind turbine
Parameters and variables of PV model
P P V t Outpower of PV array N P V Number of PV panes
I S T C Standard irradiance P r S T C Rated power of each PV panel at standard test conditions
I t Irradiance at time slot t T t Temperature at time slot t
Parameters and variables of battery storage model
E b a t t Energy stored in the batteries at time slot t E b a t min Minimum capacity of battery storages
E b a t max Maximum capacity of battery storages P b a t , c t Charging power at time slot t
P b a t , d t Discharging power at time slot t P b a t , c max Maximum charging power
P b a t , d max Maximum discharging power u b a t t Binary variable
Parametersand variables of power-to-hydrogen system
η H 2 Hydrogen production rate P el max Maximum power of electrolyzer
m H 2 t Hydrogen mass-produced at time slot t P el t Power consumed by electrolyzer at time slot t
C H 2 Specific heat of hydrogen at constant pressure T in Inlet hydrogen temperature
η com Efficiency of compressor P out / P in Compression ratio of hydrogen
P c o m max Maximum power of compressor m c o m t Hydrogen flow rate through compressor at time
κ Isentropic exponent of hydrogen M H 2 t Stored hydrogen mass in the hydrogen tank at time slot t
L H 2 t Hydrogen load at time slot t  C t a n k R Capacity of hydrogen tank
γ min Minimum ratio of the rated capacity of hydrogen tank γ max Maximum ratio of the rated capacity of hydrogen tank
Variables of the two-stage energy management model
C D A C Day-ahead comprehensive operation cost C P V Operational and maintenance costs of PV
C W T Operational and maintenance costs of WT C b a t Degradation costs of battery storage
C e l Degradation costs of electrolyzer C e Net energy cost
λ P V Maintenance cost coefficient of PV λ W T Maintenance cost coefficient of WT
λ b a t Degradation cost coefficient of battery storage λ e l Degradation cost coefficient of electrolyzer
P b t Buying power from the power grid at time slot t P s t Selling power to the power grid at time slot t
P l o a d t Predicted power load at time slot t χ b s t Binary variable
P H 2 , f s t , 0 Hydrogen production at time slot t P el , f s t , 0 Power consumed by electrolyzer device at time slot t

Appendix A

Take the exchanged power with power grid, the power of electrolyzer, the power of compressor, the charging/discharging power of battery storage, the power storage state of battery storage and the hydrogen storage state of hydrogen tank to constitute state vector x ( k ) = [ P g r i d ( k ) P e l ( k ) P c o m ( k ) P b a t ( k ) E b a t ( k ) M H 2 ( k ) ] T ; take the increment power of electrolyzer, the increment power of compressor and the increment charging/discharging power of battery storage to constitute the control variables u ( k ) = [ Δ P e l ( k ) Δ P c o m ( k ) Δ P b a t ( k ) ] T ; take the increment power of the ultra-short-term predicted power of wind turbine, PV, power load and hydrogen load as disturbance input vector r ( k ) = [ Δ P W T ( k ) Δ P P V ( k ) Δ P l o a d ( k ) Δ L H 2 ( k ) ] T ; take the exchanged power with power grid, the power of electrolyzer, the power of compressor and the charging/discharging power of battery storage as the output variable vector y ( k ) = [ P g r i d ( k ) P e l ( k ) P c o m ( k ) P b a t ( k ) ] T ; then the multi-input and multi-output state space model can be formulated in the following matrix form [34]:
x ( k + Δ t ) = [ P g r i d ( k + Δ t ) P e l ( k + Δ t ) P c o m ( k + Δ t ) P b a t ( k + Δ t ) E b a t ( k + Δ t ) M H 2 ( k + Δ t ) ] = [ 1 0 0 0 0 0 0 1 0 0 0 0 0 0 1 0 0 0 0 0 0 1 0 0 0 0 0 0 1 0 0 0 0 0 0 1 ] [ P g r i d ( k ) P e l ( k ) P c o m ( k ) P b a t ( k ) E b a t ( k ) M H 2 ( k ) ]   + [ 1 1 1 1 0 0 0 1 0 0 0 1 0 0 η b s η H 2 0 0 ] [ Δ P e l ( k ) Δ P c o m ( k Δ P b a t ( k ) ] + [ 1 1 1 0 0 0 0 0 0 0 0 0 0 0 0 0 0 0 0 0 1 1 1 1 ] [ Δ P W T ( k ) Δ P P V ( k ) Δ P l o a d ( k ) Δ L H 2 ( k ) ]
y ( k ) = [ P g r i d ( k ) P e l ( k ) P c o m ( k ) P b a t ( k ) ] = [ 1 0 0 0 0 0 0 1 0 0 0 0 0 0 1 0 0 0 0 0 0 1 0 0 ] [ P g r i d ( k ) P e l ( k ) P c o m ( k ) P b a t ( k ) E b a t ( k ) M H 2 ( k ) ]

References

  1. Lux, B.; Pfluger, B. A supply curve of electricity-based hydrogen in a decarbonized European energy system in 2050. Appl. Energy 2020, 269, 115011. [Google Scholar] [CrossRef]
  2. Rabiee, A.; Keane, A.; Soroudi, A. Technical barriers for harnessing the green hydrogen: A power system perspective. Renew. Energy 2021, 163, 1580–1587. [Google Scholar] [CrossRef]
  3. El-Taweel, N.A.; Khani, H.; Farag, H.E.Z. Hydrogen Storage Optimal Scheduling for Fuel Supply and Capacity-Based Demand Response Program under Dynamic Hydrogen Pricing. IEEE Trans. Smart Grid 2019, 10, 4531–4542. [Google Scholar] [CrossRef]
  4. Wu, X.; Qi, S.; Wang, Z.; Duan, C.; Wang, X.; Li, F. Optimal scheduling for microgrids with hydrogen fueling stations considering uncertainty using data-driven approach. Appl. Energy 2019, 253, 113568. [Google Scholar] [CrossRef]
  5. Ulleberg, Ø. Modeling of advanced alkaline electrolyzers: A system simulation approach—ScienceDirect. Int. J. Hydrogen Energy 2003, 28, 21–33. [Google Scholar] [CrossRef]
  6. Bernal-Agustín, J.L.; Dufo-López, R. Techno-economical optimization of the production of hydrogen from PV-Wind systems connected to the electrical grid. Renew. Energy 2010, 35, 747–758. [Google Scholar] [CrossRef]
  7. Wu, X.; Li, H.; Wang, X.; Zhao, W. Cooperative Operation for Wind Turbines and Hydrogen Fueling Stations with On-Site Hydrogen Production. IEEE Trans. Sustain Energy 2020, 11, 2775–2789. [Google Scholar] [CrossRef]
  8. Ma, T.; Pei, W.; Deng, W.; Xiao, H.; Yang, Y.; Tang, C. A Nash bargaining-based cooperative planning and operation method for wind-hydrogen-heat multi-agent energy system. Energy 2022, 239, 122435. [Google Scholar] [CrossRef]
  9. Mohseni, S.; Brent, A.C.; Burmester, D. A comparison of metaheuristics for the optimal capacity planning of an isolated, battery-less, hydrogen-based micro-grid. Appl. Energy 2020, 259, 114224. [Google Scholar] [CrossRef]
  10. Petrollese, M.; Valverde, L.; Cocco, D.; Cau, G.; Guerra, J. Real-time integration of optimal generation scheduling with MPC for the energy management of a renewable hydrogen-based microgrid. Appl. Energy 2016, 166, 96–106. [Google Scholar] [CrossRef]
  11. Appino, R.R.; Wang, H.; Ordiano, J.G.; Faulwasser, T.; Mikut, R.; Hagenmeyer, V.; Mancarella, P. Energy-based stochastic MPC for integrated electricity-hydrogen VPP in real-time markets. Electr. Power Syst. Res. 2021, 195, 106738. [Google Scholar] [CrossRef]
  12. Shi, M.; Wang, H.; Lyu, C.; Xie, P.; Xu, Z.; Jia, Y. A hybrid model of energy scheduling for integrated multi-energy microgrid with hydrogen and heat storage system. Energy Rep. 2021, 7, 357–368. [Google Scholar] [CrossRef]
  13. Li, Q.; Member, S.; Zou, X.; Pu, Y.; Member, S.; Chen, W. A real-time energy management method for electric-hydrogen hybrid energy storage microgrid based on DP-MPC. CSEE J. Power Energy Syst. 2020. [Google Scholar] [CrossRef]
  14. Garcia-Torres, F.; Bordons, C. Optimal Economical Schedule of Hydrogen-Based Microgrids With Hybrid Storage Using Model Predictive Control. IEEE Trans. Ind. Electron. 2015, 62, 5195–5207. [Google Scholar] [CrossRef]
  15. Zhang, Y.; Campana, P.E.; Lundblad, A.; Yan, J. Comparative study of hydrogen storage and battery storage in grid connected photovoltaic system: Storage sizing and rule-based operation. Appl. Energy 2017, 201, 397–411. [Google Scholar] [CrossRef]
  16. Möller, M.C.; Krauter, S. Hybrid Energy System Model in Matlab/Simulink Based on Solar Energy, Lithium-Ion Battery and Hydrogen. Energies 2022, 15, 2201. [Google Scholar] [CrossRef]
  17. Alotaibi, M.A.; Eltamaly, A.M. A Smart Strategy for Sizing of Hybrid Renewable Energy System to Supply Remote Loads in Saudi Arabia. Energies 2021, 14, 7069. [Google Scholar] [CrossRef]
  18. Tomczewski, A.; Kasprzyk, L. Optimisation of the Structure of a Wind Farm—Kinetic Energy Storage for Improving the Reliability of Electricity Supplies. Appl. Sci. 2018, 8, 1439. [Google Scholar] [CrossRef] [Green Version]
  19. Tomczewski, A.; Kasprzyk, L.; Nadolny, Z. Reduction of Power Production Costs in a Wind Power Plant–Flywheel Energy Storage System Arrangement. Energies 2019, 12, 1942. [Google Scholar] [CrossRef] [Green Version]
  20. Kasprzyk, L.; Tomczewski, A.; Pietracho, R.; Mielcarek, A.; Nadolny, Z.; Tomczewski, K.; Trzmiel, G.; Alemany, J. Optimization of a PV-Wind Hybrid Power Supply Structure with Electrochemical Storage Intended for Supplying a Load with Known Characteristics. Energies 2020, 13, 6143. [Google Scholar] [CrossRef]
  21. Soroudi, A.; Aien, M.; Ehsan, M. A probabilistic modeling of photo voltaic modules and wind power generation impact on distribution networks. IEEE Syst. J. 2012, 6, 254–259. [Google Scholar] [CrossRef] [Green Version]
  22. Xu, L.; Ruan, X.; Mao, C.; Zhang, B.; Luo, Y. An improved optimal sizing method for wind-solar-battery hybrid power system. IEEE Trans. Sustain. Energy 2013, 4, 774–785. [Google Scholar]
  23. Korpas, M.; Holen, A.T. Operation planning of hydrogen storage connected to wind power operating in a power market. IEEE Trans. Energy Convers. 2006, 21, 742–749. [Google Scholar] [CrossRef]
  24. Gökçek, M.; Kale, C. Techno-economical evaluation of a hydrogen refuelling station powered by Wind-PV hybrid power system: A case study for İzmir-Çeşme. Int. J. Hydrogen Energy 2018, 43, 10615–10625. [Google Scholar] [CrossRef]
  25. El-Taweel, N.A.; Khani, H.; Farag, H.E.Z. Optimal Sizing and Scheduling of LOHC-Based Generation and Storage Plants for Concurrent Services to Transportation Sector and Ancillary Services Market. IEEE Trans. Sustain. Energy 2020, 11, 1381–1393. [Google Scholar] [CrossRef]
  26. Maleki, A.; Hafeznia, H.; Rosen, M.A.; Pourfayaz, F. Optimization of a grid-connected hybrid solar-wind-hydrogen CHP system for residential applications by efficient metaheuristic approaches. Appl. Therm. Eng. 2017, 123, 1263–1277. [Google Scholar] [CrossRef]
  27. Han, S.; Han, S.; Aki, H. A practical battery wear model for electric vehicle charging applications. Appl. Energy 2014, 113, 1100–1108. [Google Scholar] [CrossRef]
  28. Kim, K.; Choi, Y.; Kim, H. Data-driven battery degradation model leveraging average degradation function fitting. Electron. Lett. 2017, 53, 102–104. [Google Scholar] [CrossRef]
  29. Kim, H.; Lee, J.; Bahrami, S.; Wong, V.W.S. Direct Energy Trading of Microgrids in Distribution Energy Market. IEEE Trans. Power Syst. 2020, 35, 639–651. [Google Scholar] [CrossRef]
  30. Urgaonkar, R.; Urgaonkar, B.; Neely, M.J.; Sivasubramaniam, A. Optimal power cost management using stored energy in data centers. In Proceedings of the ACM SIGMETRICS, San Jose, CA, USA, 7–11 June 2011; pp. 221–232. [Google Scholar]
  31. Wang, H.; Huang, J. Incentivizing Energy Trading for Interconnected Microgrids. IEEE Trans. Smart Grid 2018, 9, 2647–2657. [Google Scholar] [CrossRef] [Green Version]
  32. Eltamaly, A.M.; Alotaibi, M.A.; Elsheikh, W.A.; Alolah, A.I.; Ahmed, M.A. Novel Demand Side-Management Strategy for Smart Grid Concepts Applications in Hybrid Renewable Energy Systems. In Proceedings of the 2022 4th International Youth Conference on Radio Electronics, Electrical and Power Engineering (REEPE), Moscow, Russian, 17–19 March 2022; pp. 1–7. [Google Scholar] [CrossRef]
  33. Xiao, H.; Pei, W.; Li, K. Multi-time Scale Coordinated Optimal Dispatch of Microgrid Based on Model Predictive Control. Autom. Electr. Power Syst. 2016, 40, 7–14. [Google Scholar]
  34. Ma, T.; Pei, W.; Xiao, H.; Li, D.; Lyu, X.; Hou, K. Cooperative Operation Method for Wind-solar-hydrogen Multi-agent Energy System Based on Nash Bargaining Theory. Proceeding CSEE 2021, 41, 25–39. [Google Scholar]
  35. Du, Y.; Pei, W.; Chen, N.; Ge, X.; Xiao, H. Real-time microgrid economic dispatch based on model predictive control strategy. J. Mod. Power Syst. Clean Energy 2017, 5, 787–796. [Google Scholar] [CrossRef]
  36. Zheng, Q.P.; Wang, J.; Liu, A.L. Stochastic Optimization for Unit Commitment—A Review. IEEE Trans. Power Syst. 2015, 30, 1913–1924. [Google Scholar] [CrossRef]
Figure 1. The schematic of wind-PV-hydrogen-storage microgrid.
Energies 15 02861 g001
Figure 2. The schematic of the two-stage energy management model.
Energies 15 02861 g002
Figure 3. Schematic of receding horizon optimization.
Energies 15 02861 g003
Figure 4. The predicted and actual outpower of WT.
Energies 15 02861 g004
Figure 5. The predicted and actual outpower of PV.
Energies 15 02861 g005
Figure 6. The predicted and actual power load.
Energies 15 02861 g006
Figure 7. The predicted and actual hydrogen load.
Energies 15 02861 g007
Figure 8. The exchanged power with power grid.
Energies 15 02861 g008
Figure 9. The charging and discharging power of battery storage.
Energies 15 02861 g009
Figure 10. The power of electrolyzer.
Energies 15 02861 g010
Figure 11. The power of compressor.
Energies 15 02861 g011
Figure 12. The storage state of battery storage.
Energies 15 02861 g012
Figure 13. The storage state of hydrogen tank.
Energies 15 02861 g013
Figure 14. The exchanged power with power grid of WPH microgrid.
Energies 15 02861 g014
Figure 15. The power of electrolyzer of WPH microgrid.
Energies 15 02861 g015
Figure 16. The power of compressor of WPH microgrid.
Energies 15 02861 g016
Figure 17. The storage state of hydrogen tank of WPH microgrid.
Energies 15 02861 g017
Table 1. Power prices (¥/kWh).
Time SlotsBuying PriceSelling Price
01:00–07:00, 23:00–24:000.33760.4
12:00–14:00, 19:00–22:000.86540.4
08:00–11:00, 15:00–18:000.59800.4
Table 2. The parameters of the WPHS microgrid.
η H 2 0.0192 η c o m 0.7 S B max 5700 kWh Δ P g r i d max 200 kW
P el max 5000 kWκ1.4 S B min 600 kWh Δ P e l max 100 kW
P g r i d max 6000 kW m H 2 min 0 kg S B t = 0 600 kWh Δ P c o m max 10 kW
R H 2 14.304 m H 2 max 1000 kg P bat , c max 2100 kW Δ P b a t max 200 kW
Tin40 °C P c o m max 500 kW P bat , d max 2400 kW
Publisher’s Note: MDPI stays neutral with regard to jurisdictional claims in published maps and institutional affiliations.

