1. Introduction
As renewable energy accounted for 26.2% of the global electricity generation in 2018 and is expected to rise to 45% by 2040, it can be deemed as the fastest growing energy source worldwide [
1]. Although renewable energy is essential for the electricity sector, some challenges have to be resolved when integrating a large amount of wind power into the grid. The increase in wind turbine penetration in electrical power systems will begin to influence the overall power system behavior, such as changing the average inertia of power systems, voltage stability, and wind power operation plannings [
2,
3]. The lower system inertia can increase the requirements for the primary frequency control reserves to cut off at the same minimum frequency due to sudden loss of generation [
4]. In the aspects of voltage stability, which refers to the power system’s capability to maintain constant voltage on all buses after the disturbance at a given initial operating point, due to voltage hollows and frequency fluctuations, production is often disconnected during network accidents. This disconnection can lead to a severe imbalance in production and consumption, which in turn can accelerate the occurrence of serious accidents in the network. Therefore, it is important to keep the voltage stable in the network for proper power system operation [
3,
5]. Likewise, as many previous studies focused on problems caused by the integration of wind power into the power system, this study also considered solving the variability and uncertainty caused by wind power generation.
Due to the variability and uncertainty of renewable energy, wind farms are affected by large fluctuations that can cause a potential disaster. These fluctuations can be defined as “ramp events”, which represent local events in a wind power time series and are characterized by a sharp variation in power. A positive power change event at every time interval is defined as a “ramp-up”, while the negative one is referred to as a “ramp-down” [
6]. According to the time and geographic scale over which the ramp event occurs, both ramp-ups and ramp-downs can exhibit variable levels of severity and can cause both financial and physical impacts. During ramp-ups, wind farms are often curtailed as the electricity surplus cannot be dispatched. This naturally triggers the loss of potential profits because wind farm owners have to compensate for additional costs, being unable to meet specific loads. Moreover, wind power ramps can negatively affect electric system stability and can cause drastic consequences such as power outages [
7]. Although the current power system can be used for managing small amounts of uncertainty and variability, ramp events are a critical issue, given the sudden and large changes in wind power [
8].
Generally, ramping events are characterized by the following features: ramping start/end, ramping duration, rate, and magnitude. Although the magnitude and duration may vary for each ramp, a ramp can notably maintain a certain large gradient during consecutive time steps of the time series [
9]. These key features have been used in numerous studies that attempted to define a ramp event. For instance, Ferreria et al. [
10] provided an overview of different ramp definitions and approaches in ramp event forecasting. In other words, ramp definitions and factors have to be comprehensively considered, while ramp forecasting should be accurate. Greaves et al. [
11] defined a ramp as a change in wind power output that is at least 50% of the installed wind capacity and occurs within a time span of ≤4 h. In addition, Gallego et al. [
12] defined four types of ramps based on the three characteristics: power change magnitude, direction, and duration. Using these definitions, the swinging door algorithm is also applied to extract ramp events from actual and forecasted wind power time series. The paper concluded that the wind power forecasts improved the accuracy of the wind power ramp forecasting, especially during the summer. In our study, similar but vice versa, we revealed that the wind power ramp forecasting has improved the accuracy of the wind power forecasts, especially during June. Zheng and Kusiak [
13] utilized the rate of change in wind power output over a 10-min interval to define ramps. The authors introduced the characteristics for ramp events, four ramp definitions and two ramp forecasting models. For the ramp forecasting methods, we focused on wind power ramp detection [
14], which utilizes an optimized swinging door algorithm (OpSDA) to efficiently detect ramp events. Furthermore, in [
15], a novel improved dynamic swinging door algorithm is applied to extract ramp segments. Then the dynamic programming method identifies ramp trend and combines ramp segments. Bossavy et al. [
16] suggested two methods for forecasting the uncertainty of the power production, which currently represent the state-of-the-art probabilistic forecasting model and ensembles. Also, a Gaussian process, which is based on linear program for forecasting ramp events was suggested by [
6]. Although these studies greatly advanced state-of-the art ramp event definition and detection, novel standards for ramp events need to be introduced.
To this end, our study proposed a new statistical approach for forecasting wind power ramp. This approach represents a practical metric to evaluate the forecasting performance of ramp events in wind generating sources and to enhance the security of smart energy systems. We used data from the wind farm ‘A’ in Taebaek, Gangwondo (South Korea). As the main objectives of this study, we (1) analyzed the seasonal and hourly characteristics of wind ramp in 2018, (2) provided the values that can be used as a standard when forecasting ramp events or ramp rates, (3) utilized the obtained values to forecast the ramp rate of wind power outputs, (4) conducted a power system review using the empirical data and the actual power system in Korea. These results will allow effective usage of the ramping information in power system operations. Notably, the efficiency of the wind power output ramp is important, as it can help wind farms prepare for ramping events. Moreover, improving the accuracy of wind power ramp forecasting can reduce the discrepancy between the forecast and actual wind power output, thereby enhancing the ramp forecasting performance and reducing wind integration costs.
The remainder of this paper is organized as follows. In
Section 2, ramp events and ramp rate are defined in a novel way. The new definition laid the foundation for the data analysis, performed with the data obtained from Taebaek, South Korea. Especially,
Section 2.3 uses the results from
Section 2.2 to quantify a new standard value for seasonal ramp rate. Then, wind power output ramp forecasting was performed using standard values that were newly established through this study. The practical metric for evaluating the ramp events is also suggested.
Section 3 describes the results for wind power output forecasting based on ramp event prediction. In addition, the results for the system review by applying the proposed methodology to the real power system were described and analyzed to verify the capability of the method. Finally,
Section 4 presents the conclusion and a discussion for future work.
2. Materials and Methods
Since wind power generators are basically uncertain and volatile, in order to apply their data to the operation and planning of the system, the need for improved understanding of variability in wind power production is increasingly pressing [
17]. This section provides a methodology for stable operation of the power system by overcoming problems related to variability and uncertainty of wind energy through ramp prediction.
2.1. Ramp Events and Ramp Rate
Wind power ramp events are large fluctuations in the wind power in a short time interval, which can cause unexpected variations in the electric power grid. Ramp is characterized by different time and geographic scales. From a directional perspective, ramps can be classified as upward (ramp-ups) and downward (ramp-downs) types.
Figure 1 illustrates the ramp curve that has ramp-up, ramp down and steady state. On one hand, an increase in wind power, being driven by intense low-pressure systems, low-level jets, and thunderstorms, may trigger upward ramps [
10]. On the other hand, downward ramps are driven by the reduction in wind power or when high-speed winds cause wind turbines to reach cut-out limits (22–25 m/s), and shut down to protect the wind turbine from damage [
18]. Generally, a downward ramp is riskier than an upward ramp due to the limited availability of reserve power [
19].
It is somewhat challenging to define a ramp event, which can be constrained by numerous parameters [
20,
21,
22]. Many studies have been defining ramp events continuously, and general definitions for ramp events are summarized refer to the current research [
8,
11,
23].
- A.
Ramp magnitude
The first definition of a ramp event considers the magnitude of the wind power change. In this definition, significant ramp is defined as a change in wind power that is larger than 30% of the installed wind capacity and is expressed as follows.
refers to the power signal. The parameter is related to the ramp duration, and it defines the size of the time interval considered to identify the ramp. The parameter is related to the ramp magnitude function, which provides a cut-off level of power changes. A ramp event is considered to occur at the start of the interval if the magnitude of the increase or decrease in the power signal at the time ahead preceding the interval is greater than a predefined threshold value. The values on the end points of the interval are only considered and the ramps occurred in the middle are ignored.
- B.
Ramp magnitude and Duration
The second definition defines important ramps based on both the magnitude and duration of wind power changes. An important ramp is defined as a change in wind power output that is greater than 25% of the installed capacity and that occurs within a time range 4 h or less, which can also be expressed through Equation (1). Here, , the duration of the ramp is less or equal to 4 h, and , the threshold value, is considered to be 25% of the installed capacity.
- C.
Ramp change rate
The third definition for important ramps is based on the ramp change rate of wind power. Ramp events are considered to occur when the ratio between the absolute difference of power measured at two points, initial and final points of time interval, and the magnitude of the time interval
is greater than a predefined reference value (i.e., power ramp rate value or
).
is the threshold value of change rate in wind power output.
The ramp type can be identified using the relative position of the extreme point in time within the interval. If the maximum output occurs after the minimum output, it becomes an upward ramp, otherwise it is defined as a downward ramp.
- D.
Ramp Direction, Magnitude, and Duration
The last general definition of important ramps considers the change direction, magnitude, and duration of wind power. Upward ramp is identified when the change in wind power is greater than 20% of installed capacity within the time span of 4 h or less. Downward ramp is defined when the change in wind power is greater than 15% of installed capacity within a time span of 4 h or less.
represents the upward ramp threshold value, and
represents the downward ramp threshold value. Ramp timing is defined as the point when the filtered signal achieves a local maximum.
Based on the definitions suggested by various research, we have newly defined the ramp event, which considers ramping duration and ramping magnitude. The ramp definitions proposed by this study are as follows. Let
be a ramp function. This function can be defined in several ways, all involving power production (
) criteria at the wind farm or wind turbine. The
used in this study is defined as a ratio between the power currently measured and the power measured time
ahead. Subscript “
r” stands for a ramp events. The time interval is assumed to be 1 h, which can be written as Equation (5).
After defining a ramp event, the ramp rate can also be defined. The ramp rate is the increase or reduction in output per minute. On this basis, the ramp rate can be calculated by using Equation (6):
The ramp rate is obtained through dividing the ramp value () by the installed capacity. Ramp is the value calculated by Equation (5), and the installed capacity of the power generation is defined as 16 MW in this study. The ramp rate derived every month by hour was averaged to determine the seasonal trend. The following section describes the data used in this study and the data analysis results.
2.2. Data Description
The historical wind power and wind speed data were collected from the Mountain Taebaek wind farm ‘A’ in Gangwon-do, South Korea for the 1 January–31 December 2018 period. It is a SCADA data obtained from a real wind farm in Taebaek. Since South Korea has a day-ahead market structure and the dispatch is made every hour, we have used the empirical wind data with the time interval 1 h for analysis. We have received the data from the transmission owner in South Korea, which has completed the data preprocessing so that the time interval of the data can be 1-h.
First, the analyzed data for 12 months were categorized by season, whereas March, April, and May data were considered as ‘Spring’; June, July, and August data were considered as ‘Summer’; September, October, and November data were considered as ‘Fall’; while December, January, and February data were considered as ‘Winter’. In addition, the temporal data analysis was conducted to evaluate trends over each 1 h.
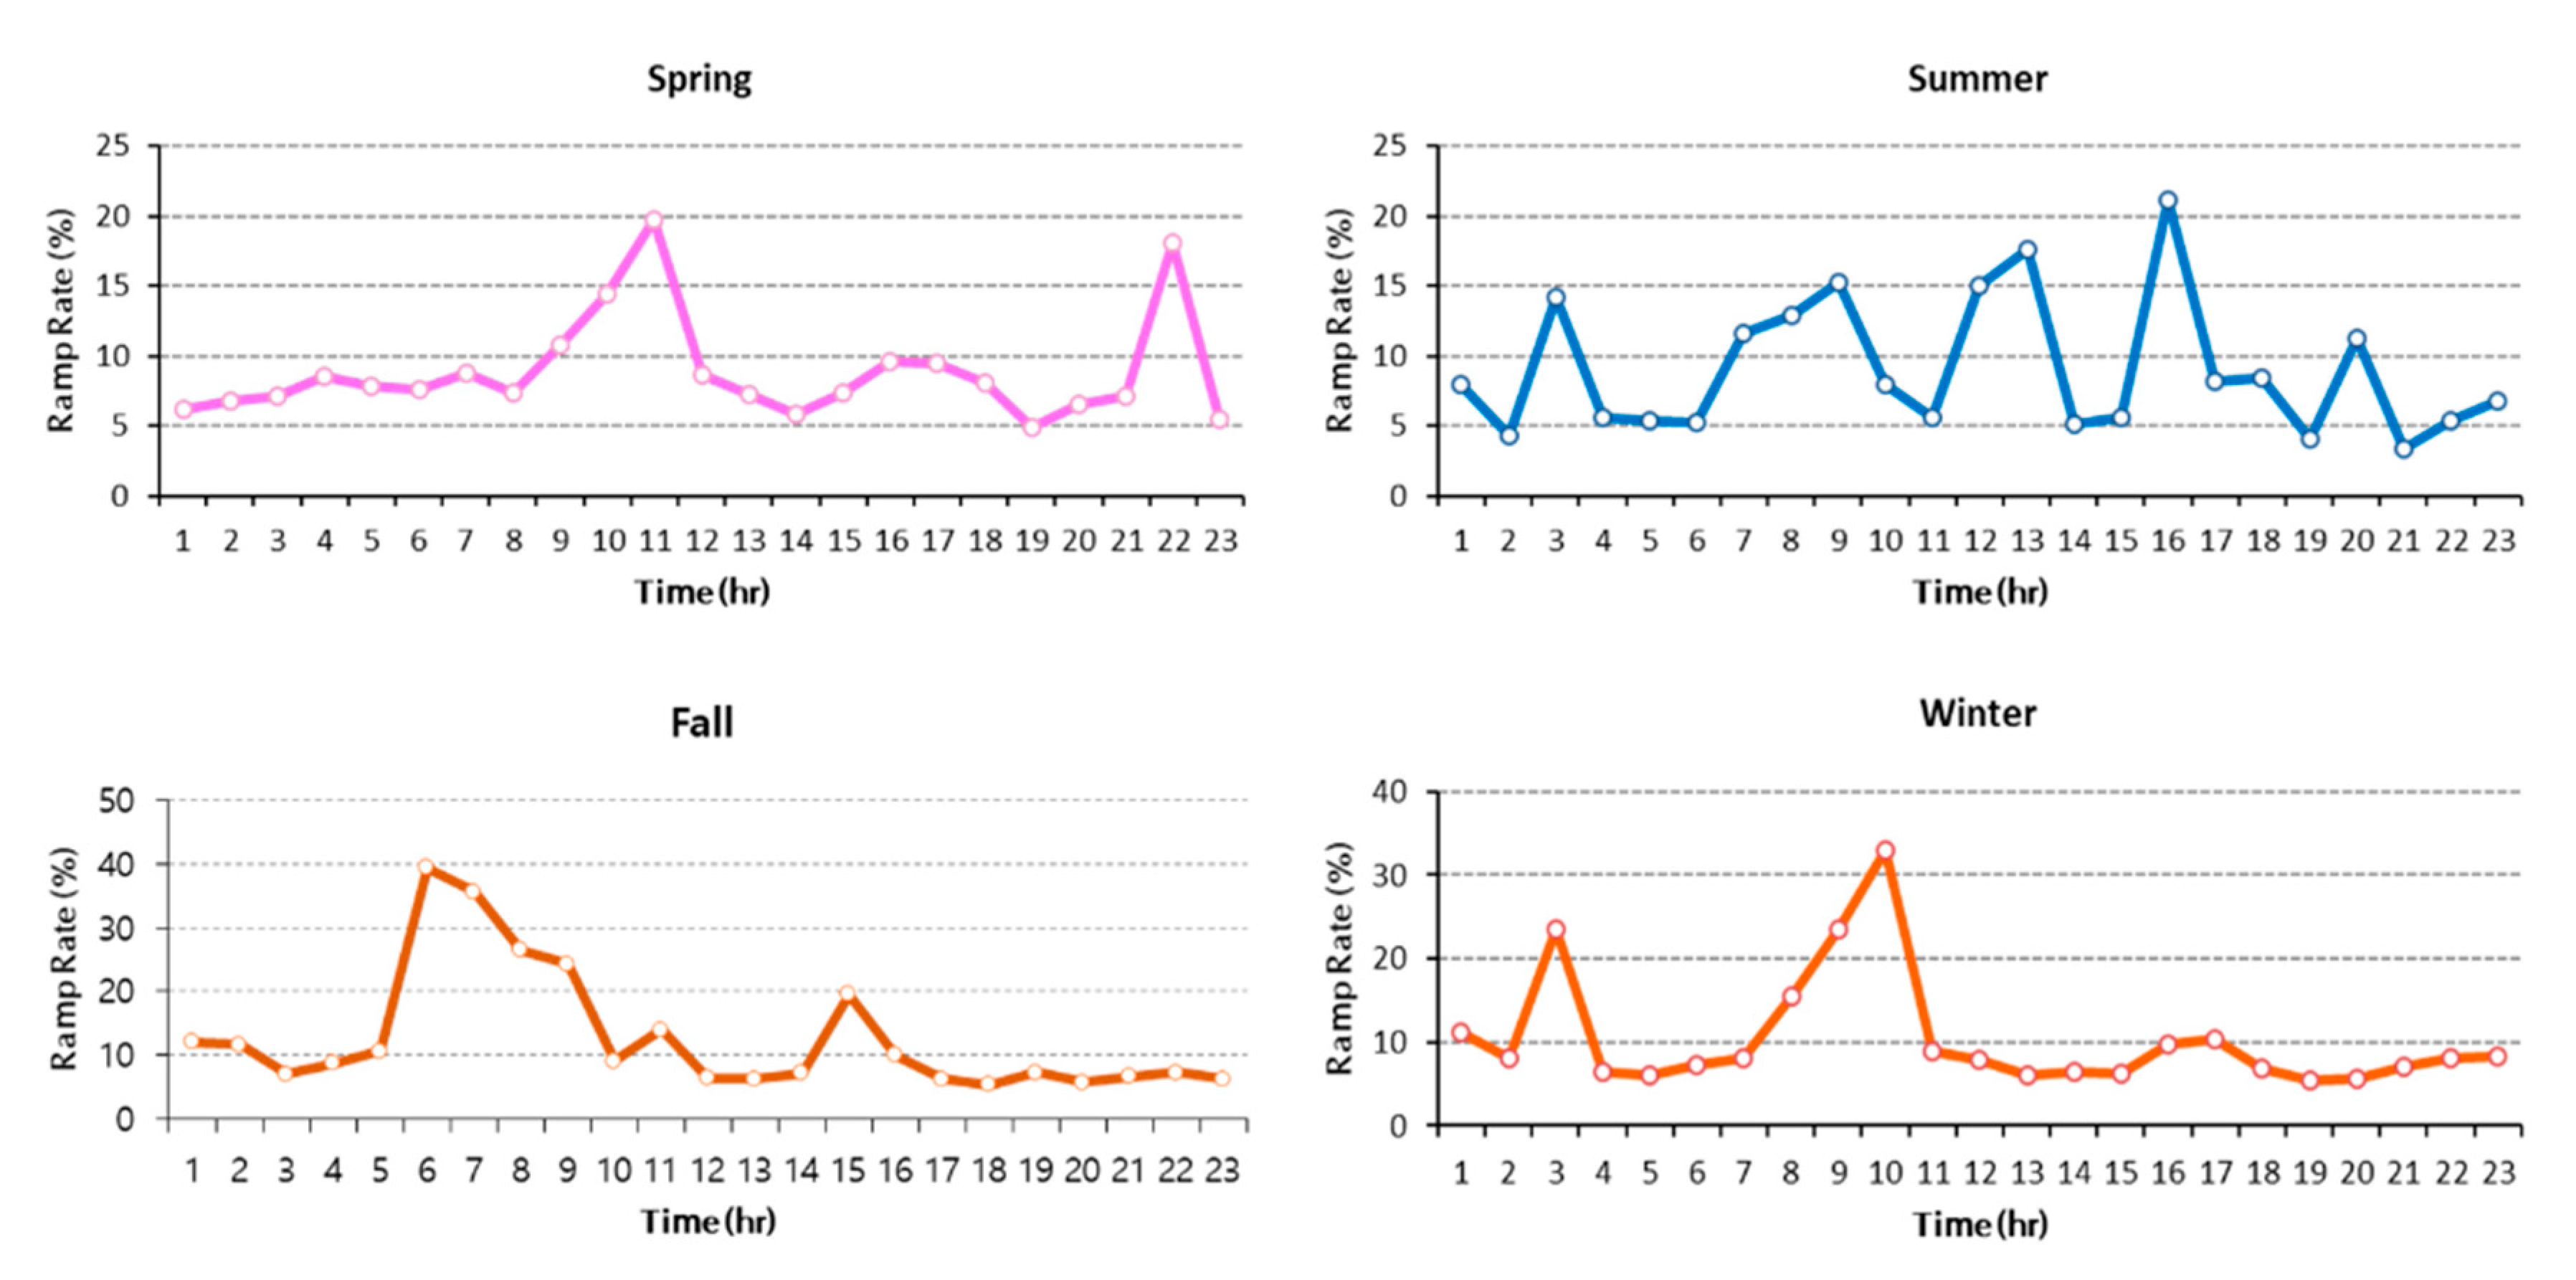
Figure 2 describes the seasonal trend of ramp rate. As seen, the ramp rate was higher during fall and winter than that in spring and summer. The average rates for fall and winter were found to be > 10%, while those for spring and summer were found to be 10%. The average ramp rates for spring, summer, fall and winter were estimated to be 8.85%, 9.03%, 12.79%, and 10.44%, respectively. Thus, the variability was stronger during fall and winter. Furthermore, we analyzed the hourly trends of ramp rates (
Figure 3).
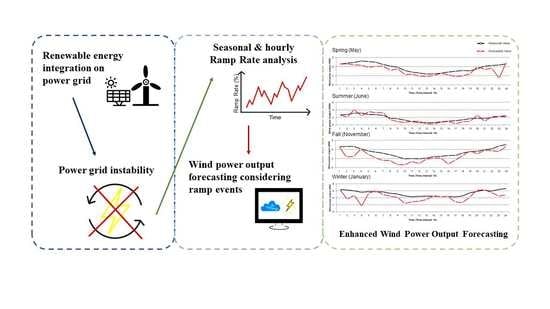
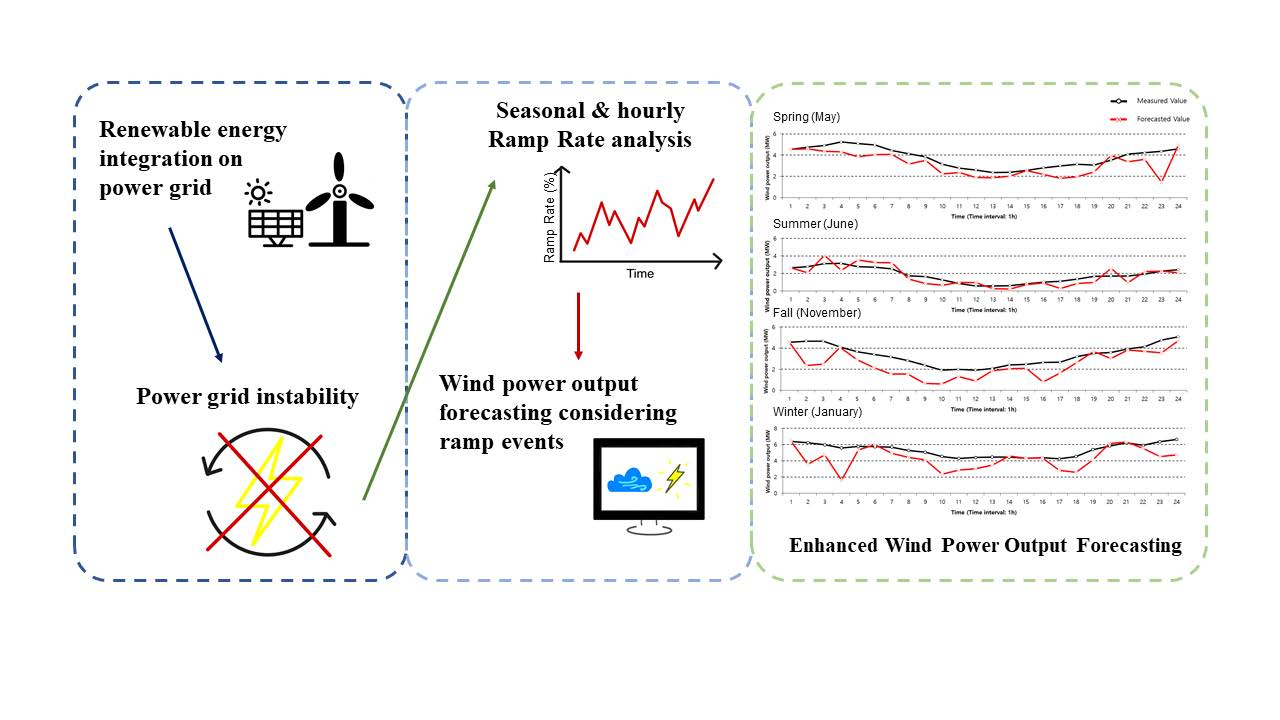
The analysis revealed that the ramp rates seemingly increased in the morning, compared with those in the night, as the values from 7–11 am were higher than those from 7–11 pm. We used the ramping information to develop new methods and present an improved version of our previous work. To this end, new methods for probabilistic ramp forecasting will be introduced, whereas the overall process for wind power forecasting considering ramp events is shown in
Figure 4, which is explained comprehensively through following section,
Section 2.3.
2.3. Ramp Forecasting Method
Given the characteristics of wind power output, we can improve the reliability of the wind power output forecast by an accurate prediction of a ramp. We introduce and describe a statistical approach to forecast wind power output by using the ramp rate. The ramp event data analysis in this section demonstrates a novel method to forecast the wind power output value of the next one hour. For the prediction, we calculated the hourly average of wind power output for every month and the hourly average of the ramp rate. Subsequently, we retrieved the average values for each season, spring, summer, fall, and winter to establish the seasonal standard ramp rate values.
Table 1 and
Table 2 provide an overview of the input data and the calculated standard ramp rate values. They reflect the seasonal characteristics and can be used for forecasting wind power outputs. In this study, the installed capacity of the wind farm is 16 MW.
We used the obtained values in the algorithm for forecasting wind power outputs based on ramp events prediction (see the Algorithm 1 below). In the algorithm,
stands for the ramp rate value at
i hour. For example, Winter
will be 1125.27 (MW) referred to
Table 2.
| Algorithm 1. Wind power forecasting based on standard seasonal RR values |
Input: Measured wind power output value, Standard seasonal RR values
Output: Forecasted value of wind power outputs based on ramp events (MW)
1: month = 1 to 12
2: if month = 1 to 2 and 12
3: Standard RR values for winter is used
4: for i = 0 to 23 (i = hour)
5:
6: Return forecasted value =
7: end if
8: if month = 3 to 5
9: Standard RR values for spring is used
10: for i = 1 to 24 (i = hour)
11:
12: Return forecasted value =
13: end if
14: if month = 6 to 8
15: Standard RR values for summer is used
16: for i = 1 to 24 (i = hour)
17:
18: Return forecasted value =
19: end if
20: if month = 9 to 11
21: Standard RR values for fall is used
22: for i = 1 to 24 (i = hour)
23:
24: Return forecasted value =
25: end if |
4. Conclusions
Numerous countries worldwide are exploring the development of renewable-energy-source-based power generation. This, in turn, increases the use of wind power in electricity. However, it has resulted in power production and load balancing difficulties. There were indications that ramp events can be one of the drivers of this undesirable variability. We argued that the improved ramp forecasting can help to maintain the stability of the power grid. To this end, a new statistical approach for forecasting wind power outputs based on ramp event detection was presented. First, a ramp trend was analyzed seasonally and hourly, then the ramp rate values were calculated from the data, obtained from the wind farm ‘A’ in Taebaek, South Korea in January–December 2018. The data we used for the analysis are historical wind speed (m/s) and wind power output data (MW). The seasonal analysis indicated that the ramp rate was higher during fall and winter than during spring and summer. The average rates for fall and winter were above the value 10%, while those for spring and summer were below 10%. The average ramp rate for spring was 8.85%, summer was 9.03, fall was 12.79%, and winter had a value of 10.44%. The hourly analysis revealed that the ramp rate was higher in the morning than at night. The ramp rate calculation provided the seasonal hourly ramp rate standard values, presented in
Table 3, which can be deemed as one of the contributions of this study. We found that the values were statistically significant, thereby realistically reflecting the seasonal and time-specific characteristics of ramps.
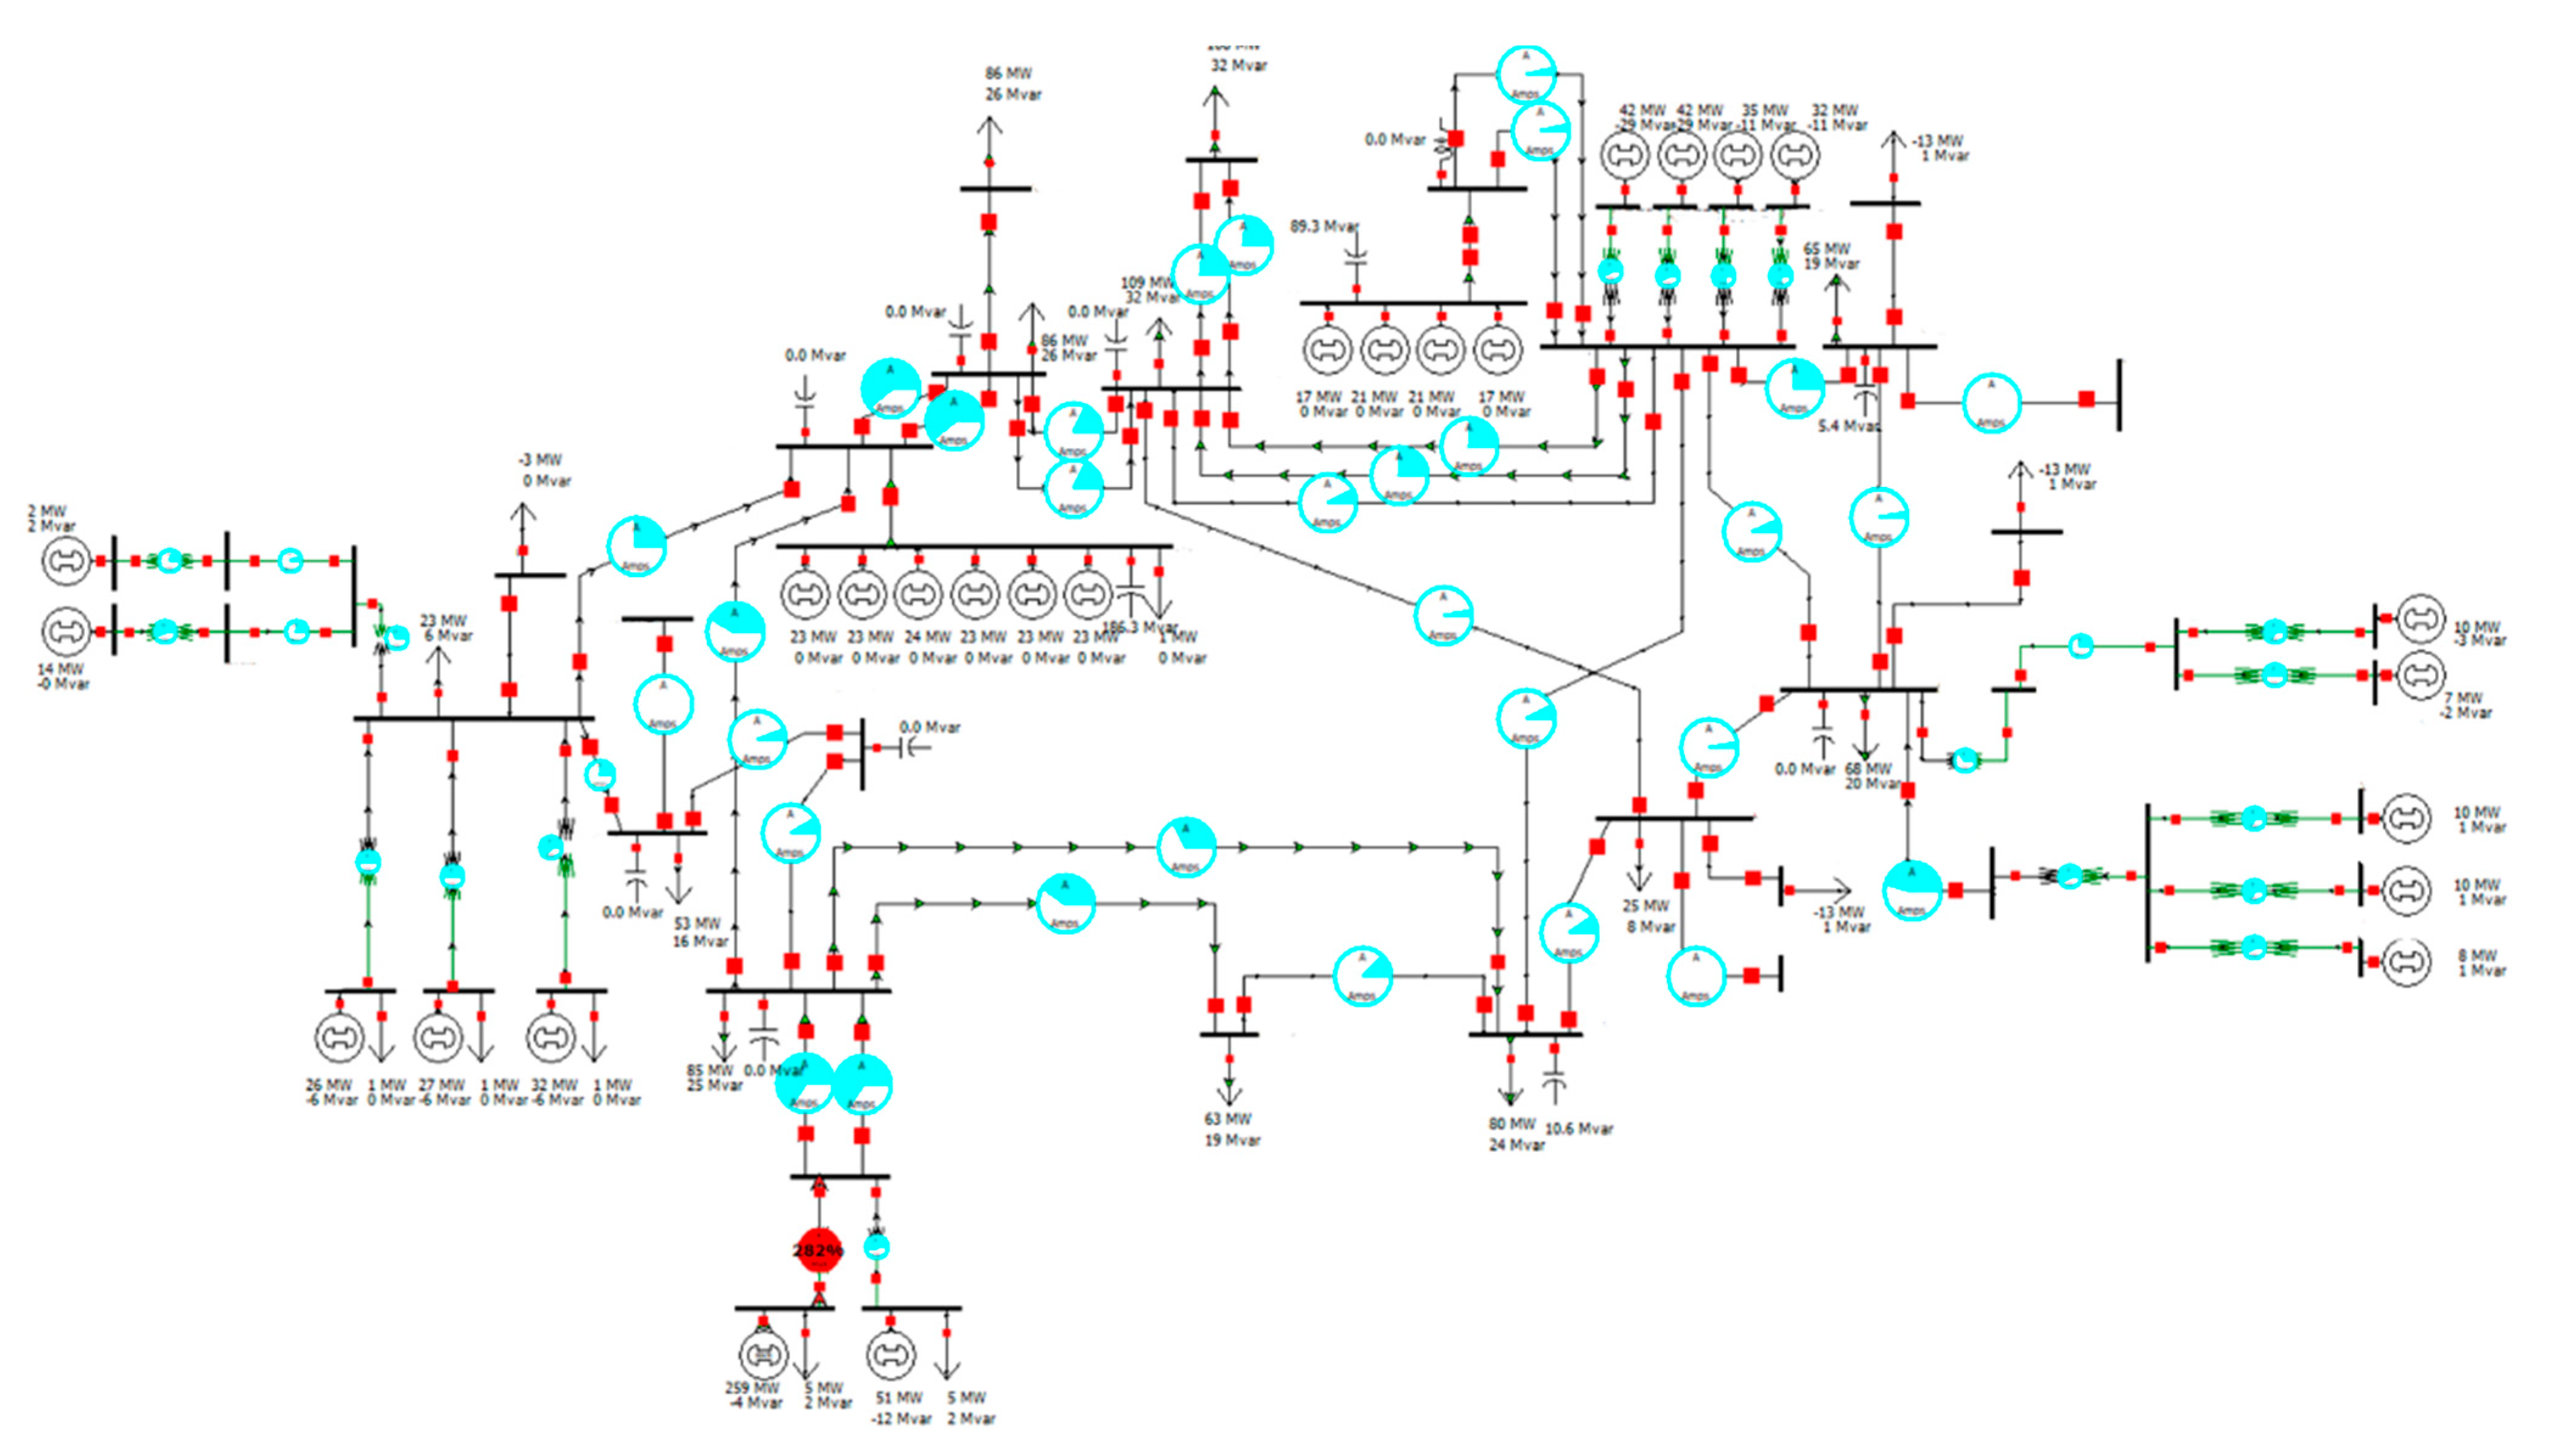
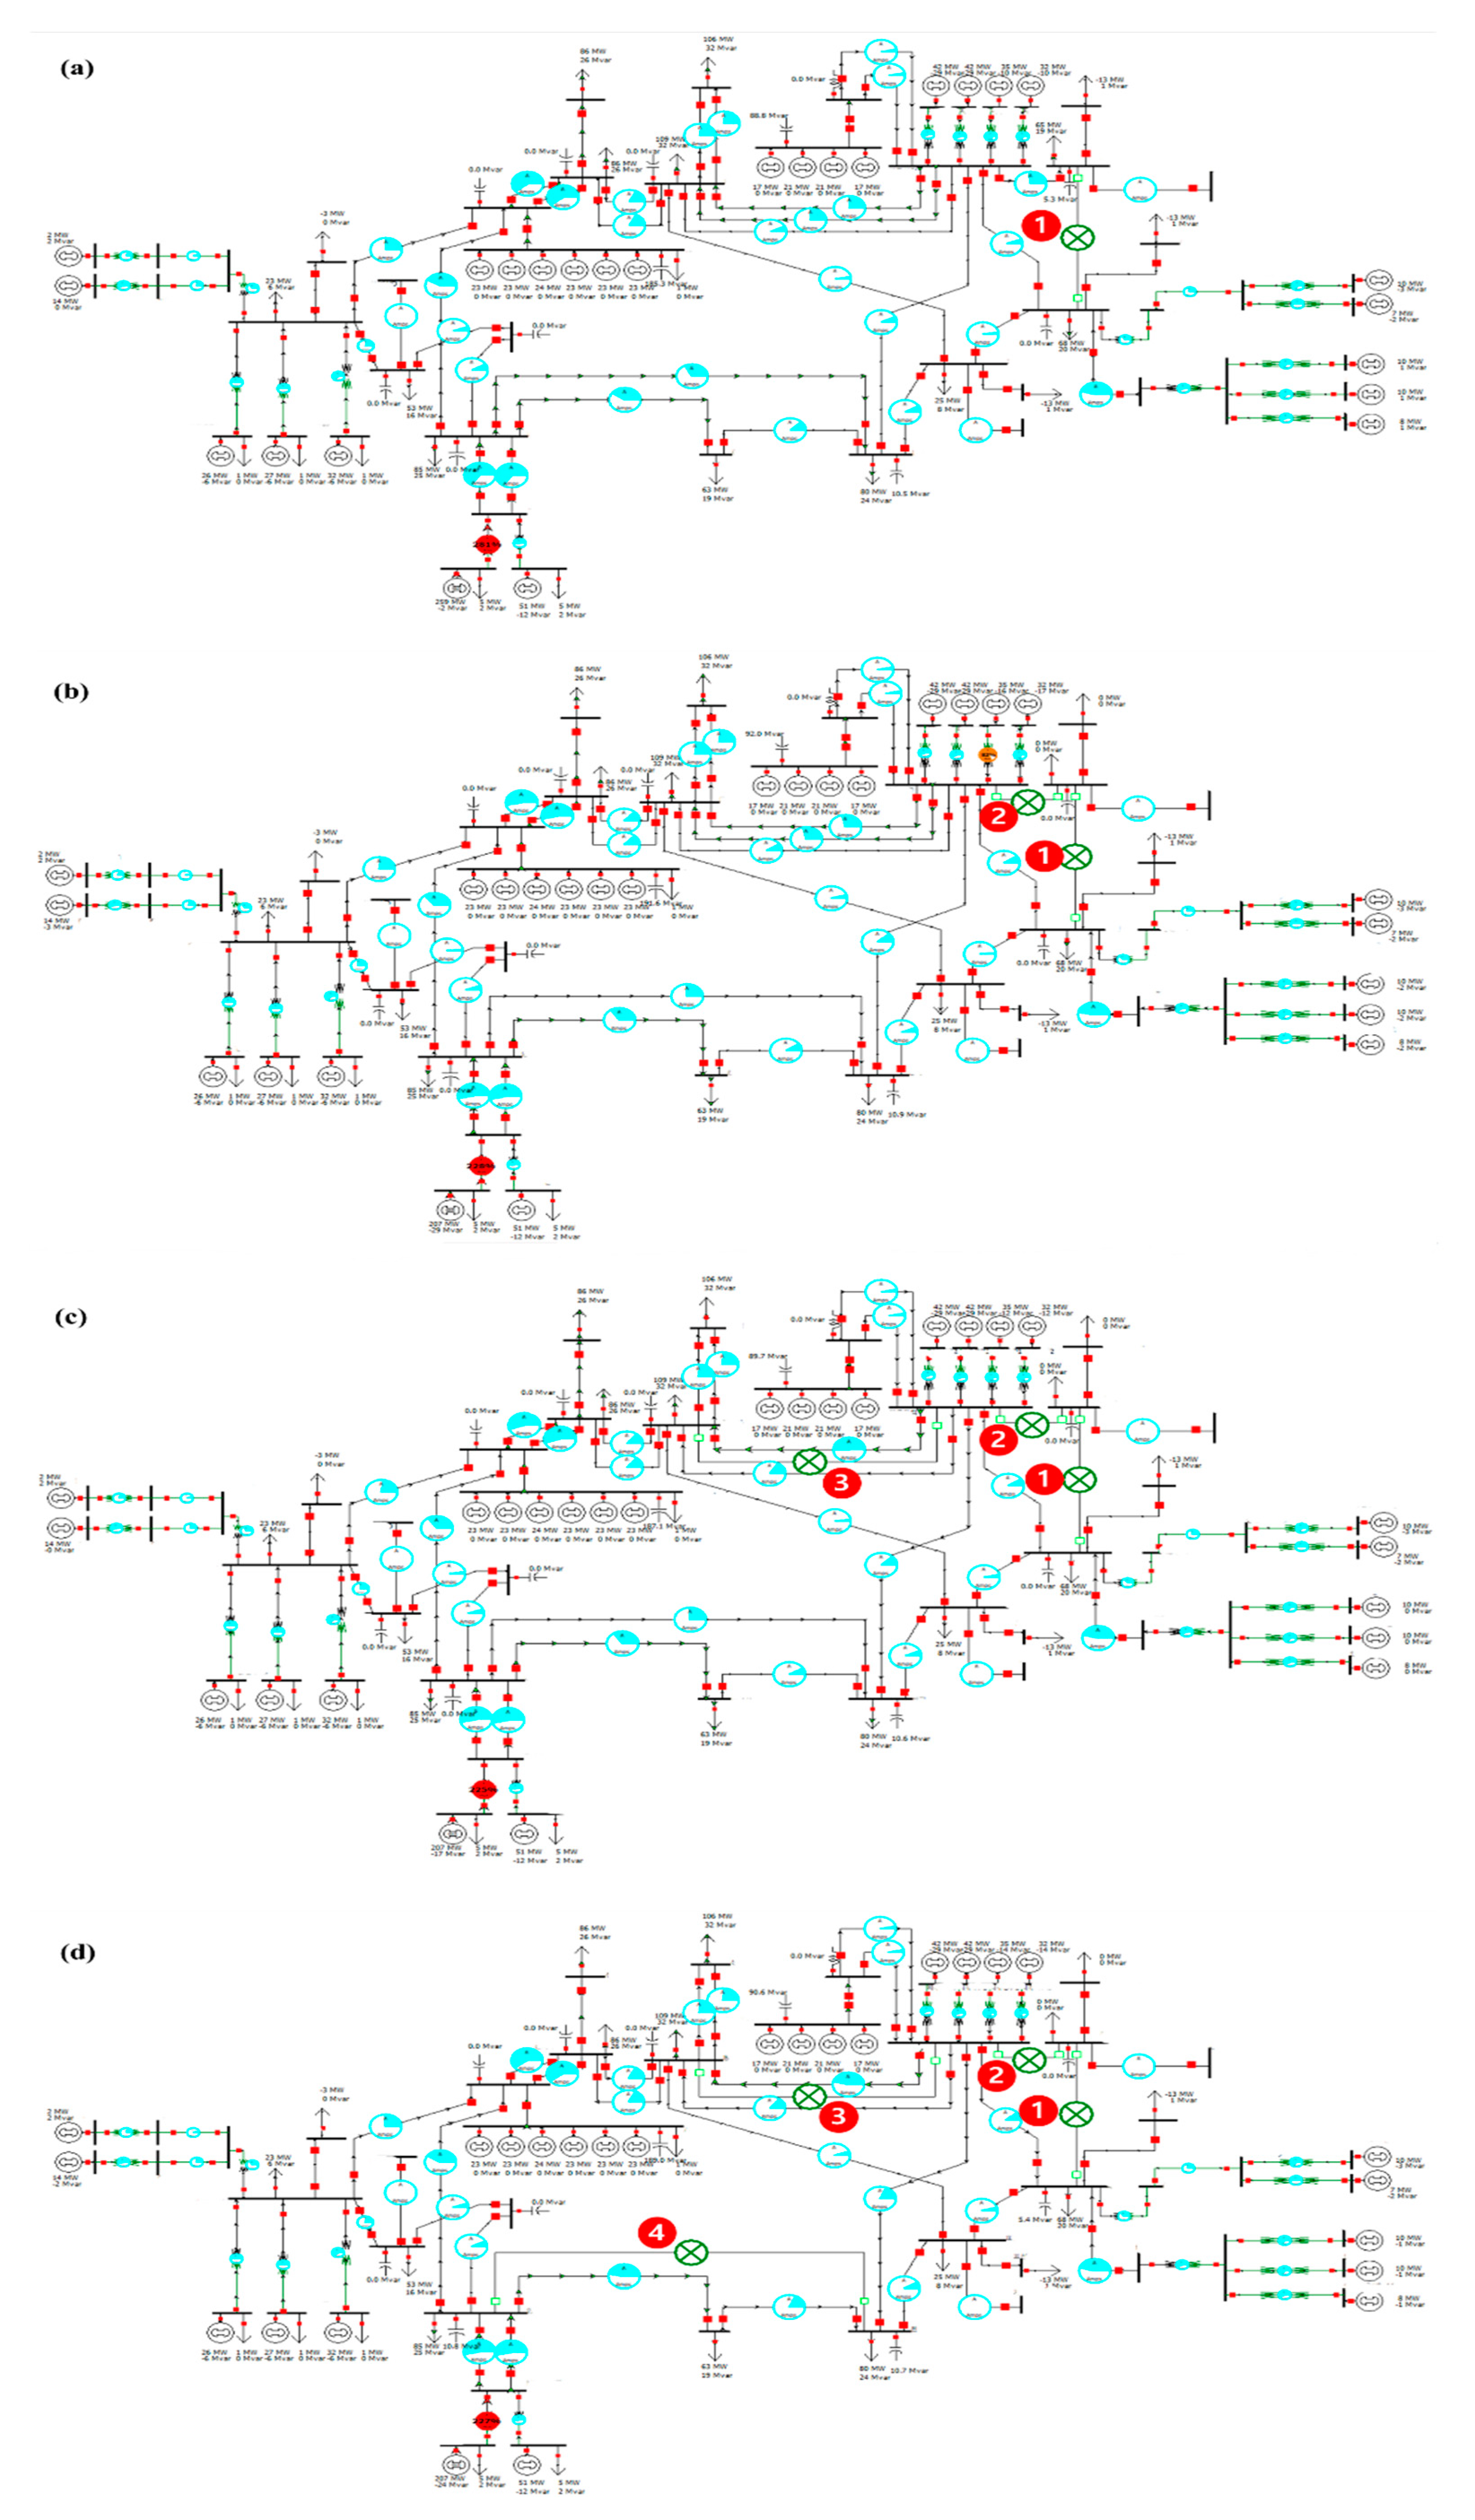
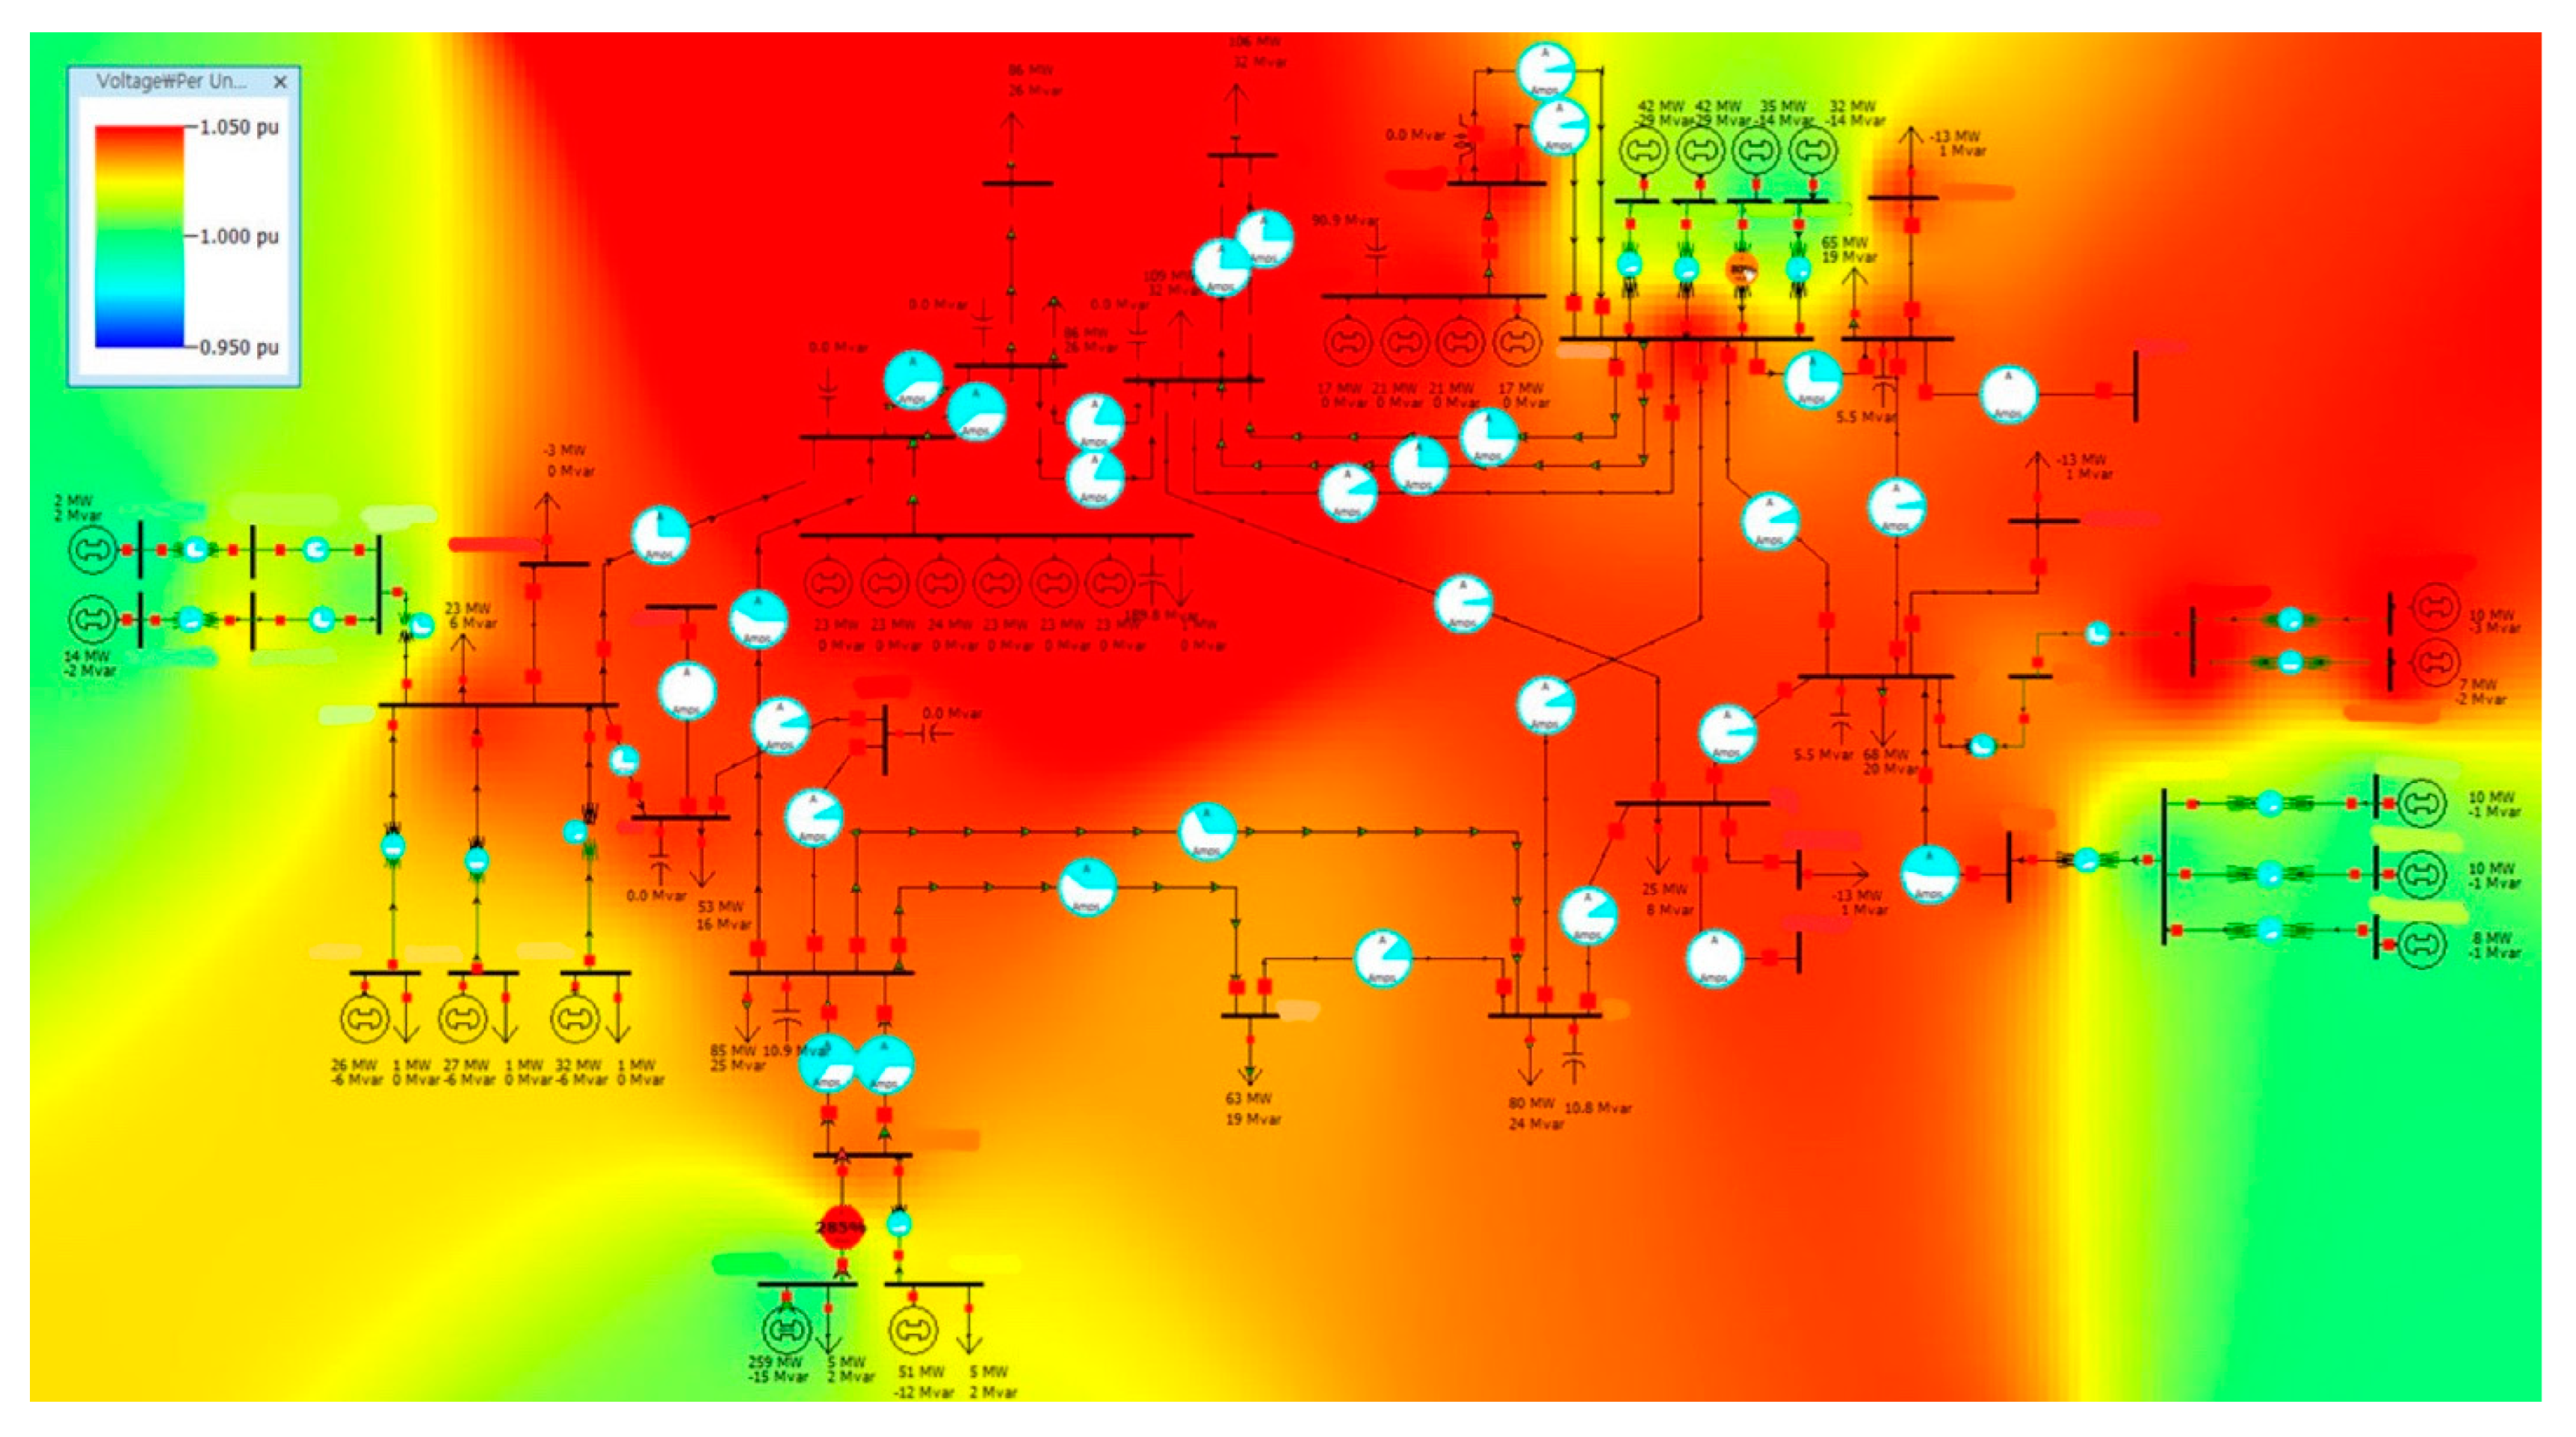
As the accurate identification of wind power ramps is important for wind power forecasting algorithms, this study proposed a novel algorithm based on ramp events detection, which is evaluated through various metrics, including BIAS, MAE, NMAE, and SDofAE. The evaluation of the metrics showed that NMAE values for all the months were < 10%. In addition, a total of four graphs, the most representative of each season, visualizing the comparison between measured and forecasted values are presented. The seasonal average NMAE values were 6.00%, 4.00%, 4.47%, and 7.89% for spring, summer, fall and winter, respectively. After evaluating the forecasting performance, the system review was conducted through PowerWorld Simulator to check if the proposed methodology can help enhance energy system security. Voltage profile and line overloading was analyzed for the system review. In this study, real power system in South Korea was used. For all N-1 contingency analysis, the system has operated stably. Among all N-1 contingency cases, two cases were presented in this paper. Furthermore, multiple contingency analysis was conducted. It can be concluded that the proposed method enables stable operation of the system because the system operated without any overloading status even in unstable situations where several lines were cut off. In addition, in case of voltage profile review, the system voltage variation was within the reliability criterion, the range of 0.95 p.u to 1.05 p.u, when the proposed methodology was applied to the real system.
Likewise, the proposed methodology will play an important role as an indicator that can resolve the volatility and uncertainty that occur when renewable energy is integrated into the power system. While developing the methodology, variability was analyzed based on one year of training data and, therefore, annual distribution of power generation was all analyzed. Consequently, the forecasted results and information presented in this paper include all the changes of the wind power generator for a year, and are the error calculation results considering the variability of the sufficient data set. To this end, the advanced work was carried out to predict wind power generation by predicting a ramp event. By verifying the results based on the empirical data with real system review, this methodology can be applied directly to Independent System Operator in South Korea and Transmission Owner in South Korea. Despite the fact that it is a practical methodology, since the analysis has still been conducted on the 1-h interval basis, it is considered that further analysis will be needed in the future using higher resolution data such as 15-min interval data.
Our future work can also combine our novel algorithm with a swinging door algorithm (SDA), proposed by [
14,
15,
26], which has already been used for ramp event detection, as this study needs more accurate ramp detection. The SDA algorithm is characterized with simple structure and high computing efficiency, thereby paving the way toward more in-depth analysis of ramp event detection. The combined algorithm’s goal is not only to improve forecast performance, but also to establish a model that performs online forecasting in a shorter time. To conclude, as evaluating and considering the ramp events improved the accuracy of wind power output forecasting, our results can lay the foundation for a new metric for ramp forecasting in our future work.


