Article

Neural Ordinary Differential Equations for Grey-Box Modelling of Lithium-Ion Batteries on the Basis of an Equivalent Circuit Model

Institute of Sustainable Energy Systems, Offenburg University of Applied Sciences, Badstraße 24, 77652 Offenburg, Germany
*
Author to whom correspondence should be addressed.
Energies 2022, 15(7), 2661; https://doi.org/10.3390/en15072661
Submission received: 24 February 2022 / Revised: 24 March 2022 / Accepted: 25 March 2022 / Published: 5 April 2022
(This article belongs to the Topic Artificial Intelligence and Sustainable Energy Systems)

Abstract

:
Lithium-ion batteries exhibit a dynamic voltage behaviour depending nonlinearly on current and state of charge. The modelling of lithium-ion batteries is therefore complicated and model parametrisation is often time demanding. Grey-box models combine physical and data-driven modelling to benefit from their respective advantages. Neural ordinary differential equations (NODEs) offer new possibilities for grey-box modelling. Differential equations given by physical laws and NODEs can be combined in a single modelling framework. Here we demonstrate the use of NODEs for grey-box modelling of lithium-ion batteries. A simple equivalent circuit model serves as a basis and represents the physical part of the model. The voltage drop over the resistor–capacitor circuit, including its dependency on current and state of charge, is implemented as a NODE. After training, the grey-box model shows good agreement with experimental full-cycle data and pulse tests on a lithium iron phosphate cell. We test the model against two dynamic load profiles: one consisting of half cycles and one dynamic load profile representing a home-storage system. The dynamic response of the battery is well captured by the model.

1. Introduction

Lithium-ion batteries are a key technology for electric vehicles, portable devices and stationary applications such as home-storage systems. With the increasing usage of lithium-ion batteries in complex fields of application, the demand for battery models is growing as well. Battery models are necessary to predict the dynamic voltage and current behaviour and to monitor internal states, particularly the state of charge (SOC) and the state of health (SOH). There are many different types of battery models [1,2]. Depending on the required purpose, they can be selected as a compromise between accuracy and simplicity. We introduce here a grey-box (GB) modelling approach that uses a simple equivalent circuit model (ECM) as a basis.
Digitisation has been progressing rapidly in the past decades, and with it the amount of available data increases. This has boosted the development of artificial intelligence and especially neural networks. Neural networks are an important representative of black-box (BB) models. They learn relations between inputs and outputs of systems based on data [3,4,5,6]. However, BB models require a huge amount of training data. Therefore, it is reasonable to consider other modelling techniques. White-box (WB) modelling uses prior physical, chemical or engineering knowledge in the form of mathematical equations to describe the behaviour of the corresponding system. WB models are therefore limited to the understanding of the underlying processes. GB models combine WB and BB modelling techniques to benefit from their respective advantages [3,4,5,6].
There are many examples in current research where neural networks are used to model lithium-ion batteries. In Ref. [7] a feedforward network with two hidden layers approximates the SOC of a battery based on the actual voltage, current and time. The authors of Ref. [8] predict the SOC of a battery with a recurrent neural network (RNN). The last three values of SOC, battery current, battery voltage and the values of four temperature sensors are taken into account. RNNs enable time series prediction. The authors of Ref. [9] perform online predictions of the remaining capacity of a lithium-ion battery with a long short-term memory network, a special form of RNN. The measured voltages during constant current (CC) charging above a certain battery voltage and the charge throughput till reaching the charge cut-off voltage serve as inputs. The authors of Ref. [10] use neural networks for battery design. They generate their training data with a pseudo-two-dimensional model of a lithium-ion battery by varying different design parameters. The first neural network classifies whether the given parameter combination leads to a possible battery configuration or not. A second neural network estimates the specific energy and the specific power of the battery with the chosen parameters. In Ref. [11] a feedforward network is used for end-of-line prediction. The unmeasured physical battery parameters are estimated by a neural network. The aforementioned approaches represent BB models. The following articles focus on GB modelling of lithium-ion batteries. The authors of Ref. [12] estimate the SOH of a battery with a neural network that takes the fitted parameters of an ECM as input. In Ref. [13] a reduced-order physics-based model is supplemented with two neural networks to predict what the authors call "nonideal voltages" of the positive and negative electrode. An additional Bayesian network approximates the influence of ageing on the battery resistance and the amount of cyclable lithium. The authors of Ref. [14] build GB models of dynamic systems including external variables with neural ordinary differential equations (NODEs). In contrast to the original contribution [15], they call the combination of NODEs and differential equations “universal differential equations”. In Refs. [16,17] NODEs are used for GB modelling of lithium-ion batteries. The authors of Ref. [16] focus on physical battery modelling in combination with NODEs. They consider ageing effects such as solid electrolyte interface formation, lithium plating and active material isolation as well as the increase in the internal resistance. NODEs approximate the remaining deviation between the physical model and the experiment. In our previous work [17] an ECM serves as a basis for a GB model of a lithium-ion battery. NODEs model the voltage drop across the included resistor–capacitor (RC) circuit.
In the present contribution, we continue our previous work [17] by further improving the GB model. For this purpose, we increased the amount of physical knowledge in the model. In contrast to the former contribution, the focus of the current study is on modelling the dynamic properties of the battery. We used additional training data from charging and discharging with pulsed currents to train the time constant of battery dynamics. Furthermore, we tested the trained GB model against two test profiles covering more realistic battery operation. So far we have neither considered temperature dependencies nor ageing effects.
The target battery studied here is a large-format 180 Ah prismatic commercial lithium-ion cell with lithium iron phosphate (LFP)/graphite chemistry. This type of cell is used in stationary storage systems. We have previously investigated the experimental properties of this cell in great detail [18]. LFP cells are attractive for stationary storage applications because they have shown a high cyclic and calendaric lifetime [19,20]. However, their state diagnosis is challenging due to a flat, plateau-like discharge voltage curve and charge–discharge voltage hysteresis [21]. One of the goals of the present study is therefore to investigate the applicability of GB models to this type of cell.
The paper is organised as follows. In Section 2, we describe the fundamentals of the ECM, the NODEs and the combination of both for GB modelling of lithium-ion batteries. In Section 3, we show and discuss the application of the proposed GB model to the simulation of lithium-ion batteries. The training and test results are given as well as their dependencies on hyperparameters, the user-defined parameters of a neural network. Hyperparameters such as the learning rate or the number of hidden layers of a neural network control the learning process. At the end of the paper, we summarise the results and give an outlook.
The measurement data and the code are available in Zenodo. See ‘Data Availability Statement’ for further information.

2. Methodology

In this section, we introduce NODEs and explain how to use them for modelling dynamic systems. We present an ECM of a lithium-ion battery and derive the GB model from the ECM. Furthermore, we describe the initialisation, normalisation and training procedures as well as the experimental basis used for training and testing.

2.1. Background: Neural Ordinary Differential Equations

Besides the standard feedforward network, a number of other neural network architectures have been developed for different areas of application. The interested reader is referred to Ref. [22] for a detailed overview of neural networks.
RNNs are used for time series prediction. In contrast to feedforward networks, RNNs have recurrent connections. The outputs of a neuron can be used as inputs of a neuron in the same or a previous layer. In Ref. [23] RNNs learn multivariate time series with missing values. The authors of Ref. [24] include external variables in RNNs.
The authors of Ref. [25] introduce residual neural networks (ResNets) to overcome problems with the degradation of the training loss with an increasing number of hidden layers in deep neural networks. ResNets have additional short-cut connections which allow direct addition of the input of a neuron to its output.
In Ref. [26] the connection between ResNets with shared weights (the same weights are used in each layer of the neural network) and special forms of RNNs is established. ResNets can be used for time series prediction as well.
The following recursive formula applies to the state transformation from layer t to layer t + 1 in a ResNet [25]:
z t + 1 = z t + f z t , θ t , t = 0 , . . . , T 1
where, z t R d is the vector of the hidden states at layer t, θ t the learned parameters of layer t and f : R d R d a learnable function. The vector θ t of learned parameters summarises the learned weights and biases. Parameter sharing across the layers ( θ t = θ for t = 0 , . . . , T 1 ) results in the explicit Euler discretisation of the initial value problem [15,27,28,29,30,31,32],
d z t d t = f z t , t , θ , z 0 = z 0 .
Herein the continuous change in the states z t is given by the learnable function f that represents a neural network. Therefore, the differential equation according to Equation (2) is called NODE. Starting from the initial state z 0 a differential equation solver can calculate the output state z T [15,29,30,32].
Originally, NODEs were developed for initial-value problems. The authors of Ref. [14] expanded the approach to solving differential equations with constraints. In our previous work [17], we showed how to consider external variables u t (here, the dynamic battery current as input variable) directly based on a simple application example. The differential equation according to Equation (2) is generalised:
d z t d t = f z t , u t , t , θ , z 0 = z 0 .
The external variables are inputs of the NODE. Therefore, we have to provide a function describing the change in the external variables with time. We could for example interpolate the measured data [17]. Figure 1 illustrates how to use NODEs with external variables schematically.
As stated in Refs. [14,17], NODEs can be used for GB modelling. The differential equations derived from physical insights in the system and NODEs can be combined in one equation system. A WB model is used as a basis for GB modelling. Single dependencies or entire equations in the differential equation system are then replaced with learnable parameters and neural networks. The respective ODEs are transformed into NODEs. Additional assumptions going beyond the physical insights in the system can be added. A differential equation solver delivers the corresponding values of the state variables at the considered time points. Additional algebraic model equations can also be modified using learnable parameters and neural networks.

2.2. Equivalent Circuit Model

Equivalent circuit modelling is a common approach to model lithium-ion batteries. ECMs describe battery dynamics with only a few states and parameters. Due to their simplicity, they are often used to predict the SOC or the SOH of batteries [33,34]. There is no agreement in the literature about the type of equivalent circuit to be used for lithium-ion batteries [2]: Simple empirically oriented versions of ECMs model battery dynamics with a voltage source, a serial resistor and one or more RC elements [33,35,36,37,38,39,40]. Electrochemically oriented models will typically include a Warburg diffusion element (either in series with the RC element or within the RC element). A more detailed analysis, particularly in the context of the present combination with NODEs, is out of the scope of the present study.
One can take into account that the circuit parameters may depend on SOC, temperature, the battery current, and the cycle number [36,40].
As in Ref. [17], we used a simple ECM as a basis for battery modelling. The chosen ECM is shown in Figure 2. It is composed of an SOC-dependent voltage source, a serial resistor, and one RC circuit. The open-circuit voltage of phase-change active materials such as LFP is known to exhibit a path dependency [21]: The measured voltage is different after discharge with a subsequent rest phase or after charge with a subsequent rest phase at the same SOC. To describe this effect with our model, we included a hysteresis voltage drop representing the particular feature of the studied LFP cell.
The following equation system describes the chosen ECM including parameter dependencies on battery current and SOC:
dSOC d t = 1 C bat i bat
d v RC 1 d t = 1 C 1 · i bat 1 R 1 SOC , i bat · v RC 1
v bat = v OC SOC v hys · sgn i bat R S · i bat v RC 1 ,
where C bat is the battery capacity, R S the serial resistance, R 1 SOC , i bat the charge-transfer resistance in the RC circuit depending on SOC and battery current, and C 1 the double-layer capacitance (which, in our case, may include other physical contributions to voltage dynamics, for example, solid-state diffusion). It should be noted that considering a non-constant C 1 could improve the approximation capability of the model. However, we decided to use a constant double-layer capacitance at the present stage because we wanted to focus on the most important effects which we expect from the charge-transfer resistance and its dependency on the battery current and the SOC. The SOC-dependent open-circuit voltage (OCV) is labelled v OC SOC and the hysteresis voltage drop is given by v hys times the signum function of the battery current sgn i bat . The hysteresis voltage drop could have also been modelled by the current- and SOC-dependent resistance R 1 . However, we did not include the voltage hysteresis into R 1 to maintain the physical characteristics of both v hys and R 1 . The battery voltage v bat is the output of the dynamic system and the battery current i bat is the external variable. We define the current positive for battery discharge and negative for battery charge. Note that Equations (4) and (5) represent ‘standard’, physics-derived ordinary differential equations (ODEs).

2.3. Grey-Box Model

We took the ECM given by Equations (4) to (6) as a basis for GB modelling. The nominal capacity of a battery is usually given by the manufacturer. It indicates the capacity of a fresh cell. However, the real (experimentally observed) battery capacity C bat can deviate from the manufacturer’s claims. For this reason, we considered the capacity C bat in Equation (4) as a learnable parameter. In Equation (5) the double-layer capacitance C 1 and the charge-transfer resistance R 1 , as well as its dependency on SOC and battery current, are unknown. Therefore, we introduced a second learnable parameter to represent the capacitance C 1 . As we wanted to take into account that the charge-transfer resistance may have different values and characteristics during charging and discharging (as observed experimentally [18]), R 1 is described by two learnable functions. Depending on the sign of the battery current, one of these functions is chosen; at zero current i bat = 0   A the mean is taken. In the output Equation (6) we had to establish a link between OCV and SOC. The manufacturer usually only provides finite-rate charge/discharge curves. Therefore, we derived v OC SOC from dedicated measurements (so-called quasi-OCV measurements). The hysteresis voltage drop v hys and the serial resistance R S are assumed constant in Equation (6). We introduced two more learnable parameters to approximate these two values. Overall, using these assumptions, the ECM according to Equations (4) to (6) leads to the following GB model:
dSOC d t = 1 ω 0 i bat
d v RC 1 d t = 1 ω 1 · i 1 R 1 SOC , i bat · v RC 1
R 1 SOC , i bat = f SOC , i bat , θ f i bat < 0 g SOC , i bat , θ g i bat > 0 1 2 f SOC , i bat , θ f + g SOC , i bat , θ g else
v bat = v OC SOC ω 2 · sgn i bat ω 3 · i bat v RC 1 .
Here, ω 0 , ω 1 , ω 2 and ω 3 represent learnable parameters. The functions f and g represent feedforward networks with their respective learnable parameters θ f and θ g . We chose neural networks with one hidden layer and rectified linear unit (ReLU) activation for f and g. We varied the number of neurons in the hidden layer between 10 and 300. Both networks had two inputs, the SOC and the battery current, and one output, the ohmic resistance R 1 .
It is worthwhile recognising that, mathematically, this model combines physics-based ODEs and machine-learning-based NODEs in one equation system. The combined equations are solved simultaneously within a single numerical framework.

2.4. Experiments

We applied the proposed GB modelling approach to a single lithium-ion battery cell. All experiments were carried out using a commercial single cell of the Chinese manufacturer CALB, model CA180FI. The large-format prismatic cell has a nominal capacity of 180 Ah and a nominal voltage of 3.2 V. It uses LFP at the positive electrode and graphite at the negative electrode. The cell was investigated experimentally under a controlled laboratory environment (climate chamber CTS 40/200 Li) using a battery cycler with four-wire measurement (Biologic VMP3). Details on the cell and characterisation methods can be found in our previous publication [18]. Here we carried out additional measurements for GB model parameterisation and testing.
We measured experimental data sets representing several different operation scenarios. Constant current constant voltage (CCCV) charge and discharge curves were measured with different C-rates of 0.1 C, 0.28 C and 1 C (corresponding to 18 A, 50 A and 180 A, respectively) during the CC phase. The upper and lower cut-off voltages were 3.65 V and 2.5 V, respectively, and a cut-off current of the CV phase of C/20 was used. Additionally, one charge and one discharge curve were acquired with included current pulses: During 50 A CC operation, every two SOC-percent the current was reduced to 25 A for 30 s. This gives rise to two dynamic voltage answers, one at beginning and one at end of pulse.
Furthermore, two independent measurements for model testing were carried out. Firstly, the cell was cycled with 50 A between 25% and 75% SOC for around 44h after fully charging, in the following referred to as half cycles. We started from a fully-charged cell and a first discharge to 25% SOC. The SOC cycling range was controlled by Coulomb counting. After 40 half cycles it was fully charged again. Secondly, the cell was fully charged and afterwards subjected to a dynamic load profile over 48 h representing a home storage battery in a single-family house. The synthetic load profile was taken from Ref. [41] (obtained with a load profile generator [42]), where a battery system of 5 kWh was investigated, and downscaled to the energy of the present cell (576 Wh). All measurements were carried out at an ambient temperature of T = 25 °C.
The number of data points per measurement series was large. Therefore, beginning from the first value, we decided to only keep measurement values if the current varied by | Δ i bat | 0.5   A or the measured voltage varied by | Δ v bat | 0.5   mV between two subsequent values. Table 1 summarises the characteristics of the used measurement data. The number of used measurement values and the total duration are given for the different series. It is worth mentioning that these values vary widely. The shortest data set for training only spans t = 3932 s. The longest training data set takes t = 41846 s. The test data sets cover much longer durations.
The measurement data were made available and used as voltage versus time and current versus time series. The measured battery current served as the external input of the model. As proposed in [17], we interpolated the measured current values linearly for providing values at arbitrary times as required by the numerical solver (cf. below).

2.5. Normalisation and Initialisation

The normalisation and initialisation are crucial for the training of the GB model with NODEs. It is recommended to scale the inputs of neural networks [43]: The average of the input variables over the training set should be close to zero (note that this condition is fulfilled for a rechargeable battery, as negative currents for charge and positive currents for discharge integrate to zero). Additionally, their covariances should be about the same.
As the SOC is in the range of 0 to 1, we decided to scale all inputs to values between −1 and 1. Additionally, we normalised the output values of the neural networks to the same value range. We did not use different learning rates for different parameters. Therefore, we also scaled the learnable parameters according to the respective value range and the expected deviation from the chosen initial value.
According to the manufacturer, the cell has a nominal capacity CN = 180 Ah. However, integration of the measured current over time for a whole charging or discharging process leads to an approximate charge throughput of Q ≈ 91.5 Ah. As the manufacturers usually give lower values for the nominal capacity to be on the safe side, we decided to set the initial value to ω 0 = 191.5 Ah. In the model, we used SI units. Therefore, we had to include a conversion factor.
To get more information about the ohmic resistances and the capacitance in Equations (5) and (6), or rather their learnable representation in Equations (8) to (10), we examined the measurement data from the pulse tests more closely. Figure 3 shows a detailed view of the current versus time and voltage versus time plot for the charging process with a pulsed current. At t = 7264 s, there is a current step of Δ i bat = 25   A during charging. The battery follows this current step with an ohmic voltage drop Δ v bat , serial 7   m V . The ohmic voltage drop is modelled through the serial resistance in Equation (6), or rather the learnable parameter ω 3 in Equation (10). For discharging we found similar absolute values. Therefore, ω 3 = M M | Δ v bat , serial | / | Δ i bat | = 0.28   m Ω should be a good starting point for the learnable parameter. We introduced the normalised parameter ω 3 * = 1000 · ω 3 instead and initialised it as ω 3 * = 0.28   Ω . The value for ω 3 , which is the approximation of R S , is then calculated according to ω3 = 1/100 · ω 3 * . The further course of the battery voltage following the ohmic voltage drop is modelled through the RC circuit in the ECM. We estimated the time constant τ of the RC circuit by applying a tangent to the voltage curve. We found τ 15 s. The final battery voltage drop caused by the RC circuit is Δ v bat , RC 8   m V . In the ECM the ohmic resistance R 1 models this voltage drop. It can be approximated as R 1 = | Δ v bat , RC | / | Δ i bat | = 0.32   m Ω . The capacitance C 1 was estimated according to C1 = τ/R1 = 15s/320μΩ = 47 kF. One has to take into account that the ohmic resistance R 1 in Equation (5) or (8) depends on SOC and battery current. Therefore, this is only a rough reference point. We expected it to be much higher than the estimated value for low and high values of SOC. Again, we introduced normalisation factors to simplify the later training process. The current input to the neural networks f * and g * was normalised in relation to the maximum absolute current. The outputs of the neural networks f and g were generated as follows: f SOC , i bat , θ f = 1 / 100 · f * SOC , i bat / 180 , θ f * , and g SOC , i bat , θ g = 1 / 100 · g * SOC , i bat / 180 , θ g * . We initialised the weights and biases of f * and g * from the uniform distribution U k , k , where k = 1 l with l N the number of inputs to the respective layer (cf. Ref. [43]). The learnable parameter ω 1 was represented by ω 1 = 10 5 · ω 1 * , where the normalised parameter ω 1 * was initialised as ω 1 * = 0.5 F . We implemented the non-linear v OC SOC curve according to the measurements of Ref. [18] as look-up table. The v OC SOC relationship needed in Equation (10) was obtained from the look-up table via linear interpolation. Due to inaccuracies of the current measurement and the choice of the initial SOC value it could be possible that the calculated SOC was sometimes slightly larger than 1 or slightly lower than 0. In these cases we provided the OCV values for SOC = 1 or SOC = 0 , respectively. We approximated the hysteresis voltage drop to find a good initial value as follows. We subtracted the voltage drops over the resistances R S and R 1 from the difference between the OCV and the measured battery voltage at a medium SOC for i bat = 50   A , yielding v hys 15   m V . We introduced the respective normalised learnable parameter ω 2 * = 10 · ω 2 . We initialised it to ω 2 * = 0.15   V .
Applying these modifications, the following equations describe the final GB model:
dSOC d t = 1 3600 s / h ω 0 i bat
d v RC 1 d t = 1 10 5 · ω 1 * · i 1 R 1 SOC , i bat · v RC 1
R 1 SOC , i bat = 1 100 · f * SOC , i bat / 180 , θ f * i bat < 0 1 100 · g * SOC , i bat / 180 , θ g * i bat > 0 1 200 f * SOC , i bat / 180 , θ f * + g * SOC , i bat / 180 , θ g * else
v bat = v OC SOC 1 10 · ω 2 * · sgn i bat 1 1000 · ω 3 * · i bat v RC 1 ,
where ω 0 , ω 1 * , ω 2 * , and ω 3 * are learnable parameters and the functions f * and g * represent neural networks. They were built in analogy to the neural networks f and g in Equation (9). We used feedforward networks with one hidden layer and ReLU activation. The number of hidden neurons was varied.

2.6. Simulation and Optimisation Methodology

We implemented our model in Python (version 3.7.6). We used the open-source machine learning framework PyTorch (version 1.9.0) [44]. PyTorch provides two main features: Tensor computing and automatic differentiation for deep neural networks. Furthermore, we used the torchdiffeq library (version 0.2.1) [45] which builds on PyTorch. It allows solving ODEs and backpropagation through the solutions of the ODEs.
The differential Equations (11) and (12) were solved with the Dopri8 method. Backpropagation was performed with the standard odeint method from torchdiffeq. Finally, an Adam optimiser minimised the loss function.

2.7. Training

The model has a large number of unknown parameters that need to be identified by mathematical optimisation: The four learnable parameters ω 0 to ω 3 * , and 4 · n + 1 parameters θ f * and θ g * each in the two learnable functions f * and g * with n the number of hidden neurons.
Due to the small amount of available training data, we split the training into two consecutive steps: First, we trained a static network with the CCCV data. Afterward, we used the pulsed data to take the battery dynamics into account. One has to keep in mind that all current flows through the charge-transfer resistance R 1 of the RC circuit at steady-state operation. The double-layer capacitance C 1 is used to capture transient phenomena.
In detail, in the first step we neglected the double-layer capacitance. Therefore, the differential Equation (12) was converted into the algebraic equation
v RC 1 = R 1 SOC , i bat · i bat .
We trained the resulting simplified GB model using the data covering the six CCCV charging and discharging processes with different C-rates. We initialised the learnable parameters ω 0 , ω 2 * , and ω 3 * and the learnable functions f * and g * of the simplified model as discussed above. As we have chosen a constant hysteresis voltage for non-zero battery currents, it is important to provide appropriate values for low currents. We decided to set currents with an absolute value | i bat | < 0.25   A to zero. Additionally, we had to provide the initial SOC value. As there was a rest phase before the start of each data set, we assumed that the battery is initially at equilibrium and therefore represented by the OCV curve. We inverted the OCV(SOC)-curve to determine the respective SOC value from the initial voltage. As mentioned above, the Dopri8 method was used to solve Equation (11) with an absolute tolerance of 10 5 and relative tolerance of 10 3 . We performed backpropagation with the standard odeint method from torchdiffeq. An Adam optimiser with a decaying learning rate between 10 2 and 10 3 minimised the loss function. The loss function was defined as the sum of the root mean squared error (RMSE) between the simulated battery voltage and the measured battery voltage and an additional penalisation term. Approximated SOC values lower than 0 or higher than 1 were taken into account. Their hundredfold absolute deviation from 0 or 1 was used as the penalisation term. As we had already initialised the other learnable parameters according to the insights from the measurement data, we only optimised θ f * and θ g * during the first 50 training epochs. The total number of training epochs was varied. It is a hyperparameter of the training process that controls the number of complete passes through the training data set. During each training epoch, the six data sets were given to the model in random order. All time series were used completely. The optimisation steps were carried out with stochastic gradient descent. The parameters were stored when the total training loss during one epoch decreased.
In the second step, we used the complete GB model according to Equations (11) to (14) for further training. Therefore, we initialised ω 1 * as stated previously. The other parameters were taken from the pre-trained model. The initial SOC was determined as before. Additionally, we had to provide an initial value for the voltage drop v RC 1 across the RC circuit. Due to the proceeding rest phase we assumed v RC 1 t = 0 = 0   V . The standard odeint backpropagation was used again. We chose Dopri8 as differential equation solver with an absolute tolerance of 10 5 and relative tolerance of 10 3 . As before, the loss function was defined as the sum of the RMSE loss of the model output compared to the measured voltage and the penalisation term. The training loss was minimised by an Adam optimiser with a learning rate of 10 3 . During the first ten training epochs, we only considered the data from the charging and discharging processes with a pulsed battery current. Afterwards we also considered the data from charging and discharging with the CCCV protocol. Additionally, we froze all learnable parameters except ω 1 * during the first 20 training epochs. Overall, we carried out 30 training epochs with batch gradient descent.
To further test our approach, we investigated GB models with different numbers of neurons in f * and g * . Furthermore, we varied the number of training epochs in the first training step between 100 and 1000, leaving training step two unchanged. The results of this study will be discussed in Section 3. We decided to take the trained model with 100 hidden neurons in f * and g * and 300 training epochs in training step one as the final version.

2.8. Test

We tested the final GB model against the two remaining experimental data sets (half cycles and synthetic load profile). Again, we used the standard odeint backpropagation method from torchdiffeq. We tried to solve the differential equation system using Dopri8 with an absolute tolerance of 10 5 and relative tolerance of 10 3 . However, for the half cycles, this resulted in a step size underflow. Therefore, we changed the absolute tolerance to 10 3 for the half cycles.
For both test data sets, we had to provide initial values for the SOC and v RC 1 . We initialised these values as before during training: We set v RC 1 t = 0 = 0   V and derived the initial SOC from the battery voltage.

3. Results and Discussion

The training and test results are discussed in the following sections. First, the focus is on the training results, with the goal of selecting an appropriate number of hidden neurons in f * and g * and of training epochs. Secondly, we compare the training results to the measurement data. Finally, simulations with the GB model are compared against the further test data sets.

3.1. Training

In total, eight experimental time series of the LFP cell were available and used for training the GB model. In particular, six time series represent charge and discharge with a CCCV protocol at different C-rates, and two time series represent charge and discharge with pulsed current.
The neural networks representing the functions f * and g * were used to approximate the dependency of the charge-transfer resistance R 1 on current and SOC. We performed the training with different network sizes for f * and g * . Additionally, we varied the number of training epochs in the first training step. Training step two was not changed. Figure 4 shows the results after completing the whole training process. Here the obtained value for R 1 is plotted as a function of SOC for charging with i bat = 50   A . The results shown in the left panel of Figure 4 were obtained from the evaluation of function f * with different numbers of neurons in the hidden layer and 100 epochs during the first training part.
With only 10 hidden neurons, the result takes the form of a combination of two linear branches representing the charge-transfer resistance over the whole range of SOC. With an increasing number of neurons, the dependency of R 1 on SOC gets more complicated. The results vary only slightly when increasing the number of hidden neurons from 100 to up to 300, however at the cost of longer training times. Using a standard notebook and training on the CPU the training time for the first training part with 100 epochs increased from about 15.5 min to about 16.8 min when changing the number of hidden neurons from 100 to 300. Therefore, we decided to choose 100 hidden neurons for f * and g * .
We additionally varied the number of training epochs in the first training step. The right panel of Figure 4 illustrates the final results for R 1 at a battery current i bat = 50   A obtained with the neural network f * with 100 hidden neurons and a varying number of training epochs. With an increasing number of training epochs, the neural network produces more complex behaviour of R 1 as function of SOC.
After training with more than 300 training epochs, the right panel of Figure 4 shows changes in R 1 for low SOC values. We believe that this is due to overfitting. As there were few data available, we did not split off a validation data set. However, we took a closer look at the training and test losses (note that the test results will be discussed in more detail in Section 3.3). We calculated the RMSE between the measured and the approximated battery voltage for all training and test data sets. The overall training and test losses were defined as the average of the RMSE losses of the individual data sets. Figure 5 shows the results as a function of the number of training epochs. The training loss decreases with an increasing number of training epochs in the first training step. However, the test loss reaches a minimum at around 300 training epochs. These results made us choose 300 training epochs in the first training step.
As a final result from this analysis, we represented f * and g * with neural networks with one hidden layer with 100 hidden neurons each. We carried out 300 training epochs in the first and another 30 epochs in the second training step.
Figure 6 illustrates the final training results for R 1 . The left panel shows the results for charging ( i bat < 0   A ) as evaluated with f * . The right panel shows the results for discharging ( i bat > 0   A ) as evaluated with g * . The charge-transfer resistance is in the range of up to several milliohms. It decreases with an increasing absolute battery current for both charging and discharging, and reaches higher values for low and high SOC values compared to a medium SOC. The resistance shows a pronounced asymmetry between charge and discharge: During charge the highest values occur when the cell is (nearly) full. During discharge the highest values occur when the battery is (nearly) empty. This is a typical behaviour observed from lithium-ion batteries with LFP cathode [18]. However, it is difficult to interpret electrochemical details into a simple equivalent circuit. In Ref. [46] the overpotentials of a lithium-ion cell were deconvoluted. The results show that lithium-ion batteries are co-limited by reaction, diffusion, and ohmic losses. In the present paper, the battery is operated at rather low currents (up to 1 C), where diffusion limitations are expected to be not dominant. For a single charge-transfer reaction, the charge-transfer resistance decreases exponentially with increasing direct current in the Tafel region [47]. Therefore, the observed decrease in resistance with increasing current is physically realistic.
After completing the training procedure, the learnable parameters had the following values:
ω 0 = 191.5   A h ω 1 * = 0.5069   F ω 2 * = 0.1125   V ω 3 * = 0.2814   Ω .
This results in the following ECM parameters:
C bat = 191.5   A h C 1 = 50.69   k F v hys = 11.25   m V R S = 281.4   μ Ω .

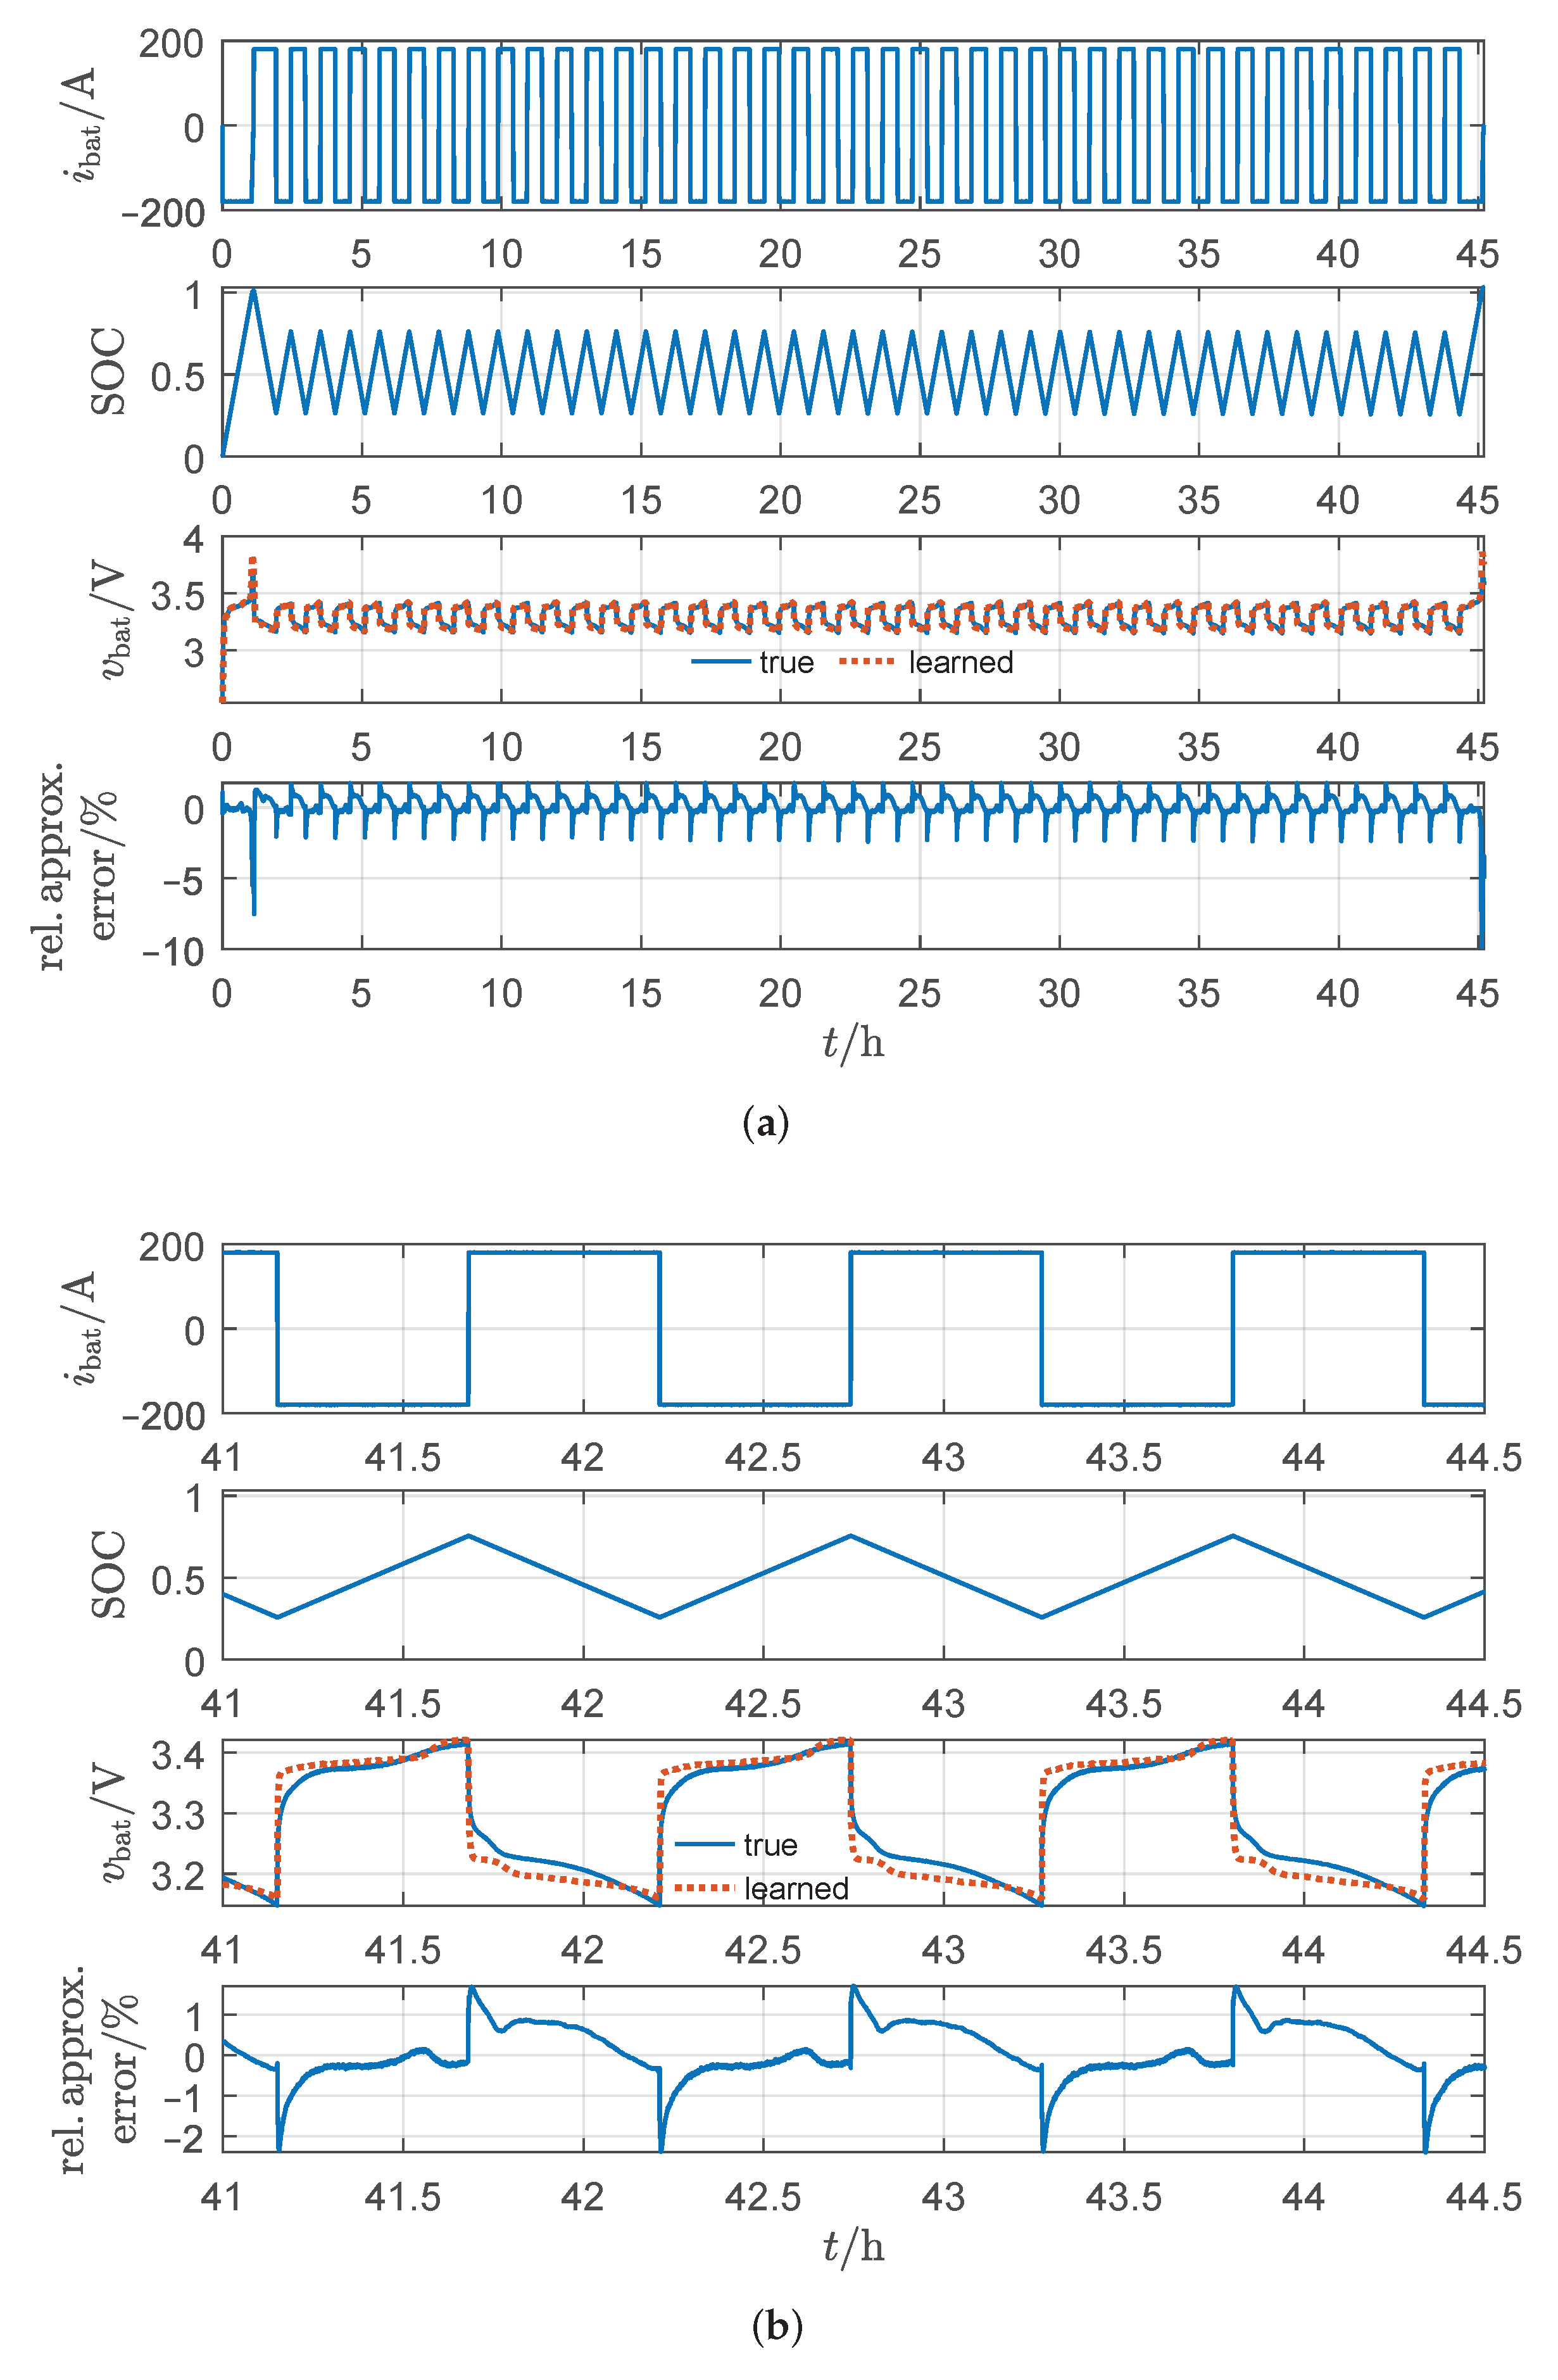
3.2. Comparison of Model against Training Data

The measurement data are given as current versus time and voltage versus time series. The current served as the external input of the model which approximated the battery voltage. Figure 7 shows the training results in the form of voltage versus SOC, which allows a better comparison for different C-rates than a voltage versus time plot. The left panel shows the measured and the learned battery voltage as a function of SOC. The right panel shows the approximation error relative to the measured voltage. Figure 7a shows the complete SOC range while Figure 7b focuses on a medium SOC. The simulation results are in good agreement with the experiments over the complete SOC range and for all investigated C-rates. The absolute value of the deviation is smaller than 1% relative to the measured voltage for a wide range of SOC. Only for very low and very high SOC values, the absolute value of the relative approximation error reaches up to around 3%, which is still acceptable. In these ranges the OCV(SOC) curve (shown in blue in Figure 7a,b) is very steep. Therefore, higher approximation errors can be expected.
Figure 3 compares the training results for a pulsed current charge with the measured voltage. Here, we have chosen a temporal representation. The pulses in Figure 3 are in the area of a medium SOC. The model reproduces the dynamic voltage response of the battery following a current step in a qualitatively correct way. Quantitatively, the absolute voltage drop after the pulse is underestimated by the model. The characteristics of the time behaviour are also different in the simulation compared to the experiment. While the simulation shows an exponential behaviour resulting from the first-order dynamics of the RC element (Equation (12)), the experiment shows a t behaviour resulting from the solid-state diffusion inside the electrode materials, also referred to as Warburg diffusion [48]. Still, given the relative simplicity of the GB model, the comparison between model and experiment is adequate. Note that we also achieved similar results for other SOC values and for the discharge branch.
In conclusion, the training results show that the GB model can reproduce the training data very well.

3.3. Comparison of Model against Test Data

After finishing the training process we wanted to test the model against data not included in the training. The first test data set consists of consecutive half cycles. The results are shown in Figure 8. Figure 8a shows the test results for the complete time series. In this complete view, the test results are very good. In Figure 8b the focus is on the last three half cycles of the time series. One can see that the dynamics of the battery voltage are modelled well on this scale, although there are deviations between simulation and experiment particularly at the beginning of each half cycle.
We tested the model against a second test data set, a synthetic load profile of a home-storage battery. The results are shown in Figure 9. Figure 9a covers the complete time series, whereas Figure 9b focuses on the segment in the middle covering faster dynamics. The simulations show good agreement with experimental data for the complete load profile. The highest relative approximation errors occur in the area of high SOC values. This was expected because the training error is high at high values of SOC. It is worth mentioning that this synthetic load profile covers the longest measuring time with t = 190,231 s. The longest training time series spanned only t = 41,846 s. Nevertheless, the test results are good for the complete time series.

4. Summary and Conclusions

In this article we have presented the development and application of a GB modelling framework for lithium-ion batteries based on a coupling of NODEs and physics-based ODEs. The model was trained and tested using experimental data of an LFP battery cell used in home-storage applications. The main findings can be summarised as follows.
We showed how to derive a GB model from a physics-based ECM with appropriate choice of learnable functions and parameters. We emphasised the importance of normalisation and initialisation of the parametric parts of the model. The training was split into two training steps: first, a simplified static model was trained where the capacitance of the RC element was neglected. In the second step, the pre-trained parameters were used to train the short-term battery dynamics. When choosing the hyperparameters, especially the number of hidden neurons in f * and g * and the number of training epochs, care had to be taken to avoid long training times and overfitting.
The model trained this way was able to reproduce the complete set of training data (CCCV charge and discharge curves as well as pulse tests) with good accuracy (typically < 1% deviation between predicted and measured voltage). In contrast to the GB model proposed in our previous work [17], the present model can approximate the fast (1 s to 30 s) dynamics of the battery. The model was tested against two data sets, half cycles and a synthetic load profile. The simulations showed good agreement with the experimental data. The highest but still acceptable errors occur in the area of low and high SOC values where the OCV curve is very steep. It is worth mentioning that the training database was rather small: only eight time series covering charging and discharging processes were available for training; and the test data sets spanned a much longer time duration than the training data sets.
As an outlook it would be interesting to use more training data, especially from pulse tests with different current steps. Additional data would also improve model validation. For example, a k-fold cross validation could deliver insights into the robustness of the model against the chosen training data. Moreover, the comparison of a WB model and a GB model using NODEs would be of interest.
In conclusion, we have shown that the use of NODEs can be a powerful methodology for modelling lithium-ion batteries.

Author Contributions

Conceptualisation, J.B., W.G.B. and R.G.; methodology, J.B., W.G.B. and R.G.; software, J.B.; validation, J.B., W.G.B. and R.G.; formal analysis, J.B.; investigation, J.B. and R.B.; resources, J.B.; data curation, J.B. and R.B.; writing—original draft preparation, J.B.; writing—review and editing, J.B., R.B., W.G.B. and R.G.; visualisation, J.B.; supervision, W.G.B. and R.G.; project administration, R.G.; funding acquisition, R.G. All authors have read and agreed to the published version of the manuscript.

Funding

J.B. and R.G. acknowledge funding from the Carl Zeiss Foundation and R.B. acknowledges funding from the State of Baden-Württemberg in the framework of the Mittelbauprogramm 2019. Experiments were carried out in the Enerlab 4.0 laboratory which was funded by the Federal Ministry of Education and Research (BMBF) under grant no. 13FH091IN6. The article processing charge was funded by the Baden-Württemberg Ministry of Science, Research and Culture and the Offenburg University of Applied Sciences in the funding programme Open Access Publishing.

Institutional Review Board Statement

Not applicable.

Informed Consent Statement

Not applicable.

Data Availability Statement

The code and measurement data presented in this study are openly available in Zenodo at https://doi.org/10.5281/zenodo.6138075.

Acknowledgments

J.B. is an associated member of the Research Training Group GRK 2218 SiMET—Simulation of mechano-electro-thermal processes in lithium-ion batteries, project number: 281041241. She thanks the German Research Foundation (DFG) for the cooperative support. The authors thank Simone Schede (Offenburg University of Applied Sciences) for proofreading.

Conflicts of Interest

The authors declare no conflict of interest. The funders had no role in the design of the study; in the collection, analyses, or interpretation of data; in the writing of the manuscript, or in the decision to publish the results.

Abbreviations

The following abbreviations are used in this manuscript:
BBBlack-box
CCConstant current
CCCVConstant current constant voltage
ECMEquivalent circuit model
GBGrey-box
LFPLithium iron phosphate
NODENeural ordinary differential equation
OCVOpen-circuit voltage
ODEOrdinary differential equation
RCResistor–capacitor
ReLURectified linear unit
ResNetResidual neural network
RMSERoot mean squared error
RNNRecurrent neural network
SOCState of charge
SOHState of health
WBWhite-box

References

  1. Franco, A.A.; Doublet, M.L.; Bessler, W.G. (Eds.) Physical Multiscale modelling and Numerical Simulation of Electrochemical Devices for Energy Conversion and Storage: From Theory to Engineering to Practice, 1st ed.; Green Energy and Technology; Springer: London, UK, 2016. [Google Scholar] [CrossRef]
  2. Seaman, A.; Dao, T.S.; McPhee, J. A survey of mathematics-based equivalent-circuit and electrochemical battery models for hybrid and electric vehicle simulation. J. Power Sources 2014, 256, 410–423. [Google Scholar] [CrossRef] [Green Version]
  3. Estrada-Flores, S.; Merts, I.; de Ketelaere, B.; Lammertyn, J. Development and validation of “grey-box” models for refrigeration applications: A review of key concepts. Int. J. Refrig. 2006, 29, 931–946. [Google Scholar] [CrossRef]
  4. Oussar, Y.; Dreyfus, G. How to be a gray box: Dynamic semi-physical modelling. Neural Netw. 2001, 14, 1161–1172. [Google Scholar] [CrossRef]
  5. Duarte, B.; Saraiva, P.M.; Pantelides, C.C. Combined Mechanistic and Empirical Modelling. Int. J. Chem. React. Eng. 2004, 2. [Google Scholar] [CrossRef]
  6. Hamilton, F.; Lloyd, A.L.; Flores, K.B. Hybrid modelling and prediction of dynamical systems. PLoS Comput. Biol. 2017, 13, e1005655. [Google Scholar] [CrossRef] [Green Version]
  7. Almeida, G.C.S.; de Souza, A.C.Z.; Ribeiro, P.F. A Neural Network Application for a Lithium-Ion Battery Pack State-of-Charge Estimator with Enhanced Accuracy. Proceedings 2020, 58, 33. [Google Scholar] [CrossRef]
  8. Jiménez-Bermejo, D.; Fraile-Ardanuy, J.; Castaño-Solis, S.; Merino, J.; Álvaro-Hermana, R. Using Dynamic Neural Networks for Battery State of Charge Estimation in Electric Vehicles. Procedia Comput. Sci. 2018, 130, 533–540. [Google Scholar] [CrossRef]
  9. Li, W.; Sengupta, N.; Dechent, P.; Howey, D.; Annaswamy, A.; Sauer, D.U. Online capacity estimation of lithium-ion batteries with deep long short-term memory networks. J. Power Sources 2021, 482, 228863. [Google Scholar] [CrossRef]
  10. Wu, B.; Han, S.; Shin, K.G.; Lu, W. Application of artificial neural networks in design of lithium-ion batteries. J. Power Sources 2018, 395, 128–136. [Google Scholar] [CrossRef]
  11. Turetskyy, A.; Laue, V.; Lamprecht, R.; Thiede, S.; Krewer, U.; Herrmann, C. Artificial Neural Network enabled P2D Model Deployment for End-of-Line Battery Cell Characterization. In Proceedings of the IEEE 17th International Conference on Industrial Informatics (INDIN), Helsinki-Espoo, Finland, 22–25 July 2019; IEEE: Piscataway, NJ, USA, 2019; pp. 53–58. [Google Scholar] [CrossRef]
  12. Yang, D.; Wang, Y.; Pan, R.; Chen, R.; Chen, Z. A Neural Network Based State-of-Health Estimation of Lithium-ion Battery in Electric Vehicles. Energy Procedia 2017, 105, 2059–2064. [Google Scholar] [CrossRef]
  13. Nascimento, R.G.; Corbetta, M.; Kulkarni, C.S.; Viana, F.A. Hybrid physics-informed neural networks for lithium-ion battery modelling and prognosis. J. Power Sources 2021, 513, 230526. [Google Scholar] [CrossRef]
  14. Rackauckas, C.; Ma, Y.; Martensen, J.; Warner, C.; Zubov, K.; Supekar, R.; Skinner, D.; Ramadhan, A.; Edelman, A. Universal Differential Equations for Scientific Machine Learning. arXiv 2020, arXiv:2001.04385. [Google Scholar]
  15. Chen, R.T.Q.; Rubanova, Y.; Bettencourt, J.; Duvenaud, D. Neural Ordinary Differential Equations. arXiv 2018, arXiv:1806.07366. [Google Scholar]
  16. Bills, A.; Sripad, S.; Fredericks, W.L.; Guttenberg, M.; Charles, D.; Frank, E.; Viswanathan, V. Universal Battery Performance and Degradation Model for Electric Aircraft. ChemRxiv 2020. [Google Scholar] [CrossRef]
  17. Brucker, J.; Bessler, W.G.; Gasper, R. Grey-box modelling of lithium-ion batteries using neural ordinary differential equations. Energy Inform. 2021, 4, 1–13. [Google Scholar] [CrossRef]
  18. Yagci, M.C.; Behmann, R.; Daubert, V.; Braun, J.A.; Velten, D.; Bessler, W.G. Electrical and Structural Characterization of Large–Format Lithium Iron Phosphate Cells used in Home–Storage Systems. Energy Technol. 2021, 9, 2000911. [Google Scholar] [CrossRef]
  19. Dubarry, M.; Truchot, C.; Liaw, B.Y. Cell degradation in commercial LiFePO4 cells with high-power and high-energy designs. J. Power Sources 2014, 258, 408–419. [Google Scholar] [CrossRef]
  20. Kupper, C.; Weißhar, B.; Rißmann, S.; Bessler, W.G. End-of-Life Prediction of a Lithium-Ion Battery Cell Based on Mechanistic Aging Models of the Graphite Electrode. J. Electrochem. Soc. 2018, 165, A3468–A3480. [Google Scholar] [CrossRef]
  21. Dreyer, W.; Jamnik, J.; Guhlke, C.; Huth, R.; Moskon, J.; Gaberscek, M. The thermodynamic origin of hysteresis in insertion batteries. Nat. Mater. 2010, 9, 448–453. [Google Scholar] [CrossRef]
  22. Goodfellow, I.; Bengio, Y.; Courville, A. Deep Learning; Adaptive Computation and Machine Learning; MIT Press: Cambridge, MA, USA, 2016. [Google Scholar]
  23. Che, Z.; Purushotham, S.; Cho, K.; Sontag, D.; Liu, Y. Recurrent Neural Networks for Multivariate Time Series with Missing Values. Sci. Rep. 2018, 8, 6085. [Google Scholar] [CrossRef] [Green Version]
  24. Bailer-Jones, C.A.; MacKay, D.J.; Withers, P.J. A recurrent neural network for modelling dynamical systems. Netw. Comput. Neural Syst. 1998, 9, 531–547. [Google Scholar] [CrossRef]
  25. He, K.; Zhang, X.; Ren, S.; Sun, J. Deep Residual Learning for Image Recognition. In Proceedings of the 29th IEEE Conference on Computer Vision and Pattern Recognition, Las Vegas, NV, USA, 26 June–1 July 2016; IEEE: Piscataway, NJ, USA, 2016; pp. 770–778. [Google Scholar]
  26. Liao, Q.; Poggio, T. Bridging the Gaps Between Residual Learning, Recurrent Neural Networks and Visual Cortex. arXiv 2016, arXiv:1604.03640. [Google Scholar]
  27. Haber, E.; Ruthotto, L. Stable architectures for deep neural networks. Inverse Probl. 2017, 34, 014004. [Google Scholar] [CrossRef] [Green Version]
  28. Ruthotto, L.; Haber, E. Deep Neural Networks Motivated by Partial Differential Equations. J. Math. Imaging Vis. 2020, 62, 352–364. [Google Scholar] [CrossRef] [Green Version]
  29. Dupont, E.; Doucet, A.; Teh, Y.W. Augmented Neural ODEs. In Advances in Neural Information Processing Systems 32; Curran Associates, Inc.: Red Hook, NY, USA, 2019; pp. 3140–3150. [Google Scholar]
  30. Zhang, T.; Yao, Z.; Gholami, A.; Keutzer, K.; Gonzalez, J.; Biros, G.; Mahoney, M.W. ANODEV2: A Coupled Neural ODE Evolution Framework. arXiv 2019, arXiv:1906.04596. [Google Scholar]
  31. Haber, E.; Ruthotto, L.; Holtham, E.; Jun, S.H. Learning across scales - Multiscale Methods for Convolution Neural Networks. In Proceedings of the AAAI Conference on Artificial Intelligence, New Orleans, LA, USA, 2–7 February 2018; AAAI Press: Palo Alto, CA, USA, 2018; Volume 32. [Google Scholar]
  32. Gholami, A.; Keutzer, K.; Biros, G.; Gholaminejad, A. ANODE: Unconditionally Accurate Memory-Efficient Gradients for Neural ODEs. In Proceedings of the Twenty-Eighth International Joint Conference on Artificial Intelligence, Macao, China, 10–16 August 2019; pp. 730–736. [Google Scholar]
  33. He, H.; Xiong, R.; Fan, J. Evaluation of Lithium-Ion Battery Equivalent Circuit Models for State of Charge Estimation by an Experimental Approach. Energies 2011, 4, 582–598. [Google Scholar] [CrossRef]
  34. Wang, Y.; Fang, H.; Zhou, L.; Wada, T. Revisiting the State-of-Charge Estimation for Lithium-Ion Batteries: A Methodical Investigation of the Extended Kalman Filter Approach. IEEE Control Syst. 2017, 37, 73–96. [Google Scholar] [CrossRef]
  35. Fleischer, C.; Waag, W.; Heyn, H.M.; Sauer, D.U. On-line adaptive battery impedance parameter and state estimation considering physical principles in reduced order equivalent circuit battery models: Part 1. Requirements, critical review of methods and modelling. J. Power Sources 2014, 260, 276–291. [Google Scholar] [CrossRef]
  36. Chen, M.; Rincón-Mora, G.A. Accurate Electrical Battery Model Capable of Predicting Runtime and I–V Performance. IEEE Trans. Energy Convers. 2006, 21, 504–511. [Google Scholar] [CrossRef]
  37. Haifeng, D.; Xuezhe, W.; Zechang, S. A new SOH prediction concept for the power lithium-ion battery used on HEVs. In Proceedings of the 2009 IEEE Vehicle Power and Propulsion Conference, Dearborn, MI, USA, 7–10 September 2009; pp. 1649–1653. [Google Scholar] [CrossRef]
  38. Hu, Y.; Yurkovich, S.; Guezennec, Y.; Yurkovich, B.J. A technique for dynamic battery model identification in automotive applications using linear parameter varying structures. Control Eng. Pract. 2009, 17, 1190–1201. [Google Scholar] [CrossRef]
  39. Tong, S.; Klein, M.P.; Park, J.W. On-line optimisation of battery open circuit voltage for improved state-of-charge and state-of-health estimation. J. Power Sources 2015, 293, 416–428. [Google Scholar] [CrossRef]
  40. Krewer, U.; Röder, F.; Harinath, E.; Braatz, R.D.; Bedürftig, B.; Findeisen, R. Review—Dynamic Models of Li-Ion Batteries for Diagnosis and Operation: A Review and Perspective. J. Electrochem. Soc. 2018, 165, A3656–A3673. [Google Scholar] [CrossRef]
  41. Weißhar, B.; Bessler, W.G. Model-based lifetime prediction of an LFP/graphite lithium-ion battery in a stationary photovoltaic battery system. J. Energy Storage 2017, 14, 179–191. [Google Scholar] [CrossRef]
  42. Pflugradt, N.; Platzer, B. Verhaltensbasierter Lastprofilgenerator für Strom- und Warmwasser-Profile. In Thermische Solarenergie; Vajen, K., Ed.; Wissen für Profis, Ostbayerisches Technologie-Transfer-Institut e.V. (OTTI): Regensburg, Germany, 2012; pp. 250–251. [Google Scholar]
  43. LeCun, Y.; Bottou, L.; Orr, G.B.; Müller, K.R. Efficient BackProp. In Neural Networks: Tricks of the Trade; Orr, G.B., Müller, K.R., Eds.; Springer: Berlin/Heidelberg, Germany, 1998. [Google Scholar]
  44. Paszke, A.; Gross, S.; Massa, F.; Lerer, A.; Bradbury, J.; Chanan, G.; Killeen, T.; Lin, Z.; Gimelshein, N.; Antiga, L.; et al. PyTorch: An Imperative Style, High-Performance Deep Learning Library. In Advances in Neural Information Processing Systems 32; Curran Associates, Inc.: Red Hook, NY, USA, 2019; pp. 8024–8035. [Google Scholar]
  45. Chen, R.T.Q. Torchdiffeq. 2021. Available online: https://github.com/rtqichen/torchdiffeq (accessed on 23 February 2022).
  46. Quarti, M.; Bessler, W.G. Model-Based Overpotential Deconvolution, Partial Impedance Spectroscopy, and Sensitivity Analysis of a Lithium-Ion Cell with Blend Cathode. Energy Technol. 2021, 9, 2001122. [Google Scholar] [CrossRef]
  47. Pilla, A.A. A Transient Impedance Technique for the Study of Electrode Kinetics: Application to Potentiostatic Methods. J. Electrochem. Soc. 1970, 117, 467–477. [Google Scholar] [CrossRef]
  48. Barsoukov, E.; Macdonald, J.R. Impedance Spectroscopy: Theory, Experiment, and Applications, 2nd ed.; Wiley-Interscience: Hoboken, NJ, USA, 2005. [Google Scholar] [CrossRef]
Figure 1. NODEs with external variables; z t represents the state variables at time t and u t represents the respective external variables. Adapted from Figure 1 in [17], which is licensed under CC BY 4.0 (https://creativecommons.org/licenses/by/4.0/, accessed on 23 February 2022).
Energies 15 02661 g001
Figure 2. ECM of a battery consisting of an SOC-dependent voltage source, a hysteresis voltage drop, a series resistor, and an RC circuit.
Energies 15 02661 g002
Figure 3. Simulation results using NODEs for grey-box modelling of a lithium-ion battery in comparison to experimental data at T = 25 °C. The focus is on charging with a pulsed current at a medium SOC; (left): battery current versus time; (right): battery voltage versus time.
Energies 15 02661 g003
Figure 4. Simulation results: approximation results for R 1 for i bat = 50   A derived from evaluation of function f * ; (left): results for a varying number of hidden neurons in f * and 100 training epochs in the first training part; (right): results for 100 hidden neurons in f * and a varying number of training epochs in the first training part.
Energies 15 02661 g004
Figure 5. Average training and test losses as a function of the number of training epochs in the first training part.
Energies 15 02661 g005
Figure 6. Simulation results: approximation results for R 1 as a function of SOC for different battery currents; (left): charging, (right): discharging.
Energies 15 02661 g006
Figure 7. Simulation results using NODEs for grey-box modelling of a lithium-ion battery in comparison to experimental data; left: charge and discharge curves for different C-rates at T = 25 °C. The lower branches represent discharge (time progresses from right to left), while the upper branches represent charge (time progresses from left to right); right: relative approximation error; (a) the whole SOC range (b) focus on medium SOC.
Energies 15 02661 g007
Figure 8. Test results in comparison to experimental data at T = 25 °C for half cycles; (a) the complete time series; (b) focus on the last three half cycles.
Energies 15 02661 g008
Figure 9. Test results in comparison to experimental data at T = 25 °C for a synthetic load profile; (a) the complete time series (b) focus on the segment in the middle.
Energies 15 02661 g009
Table 1. Measurement data for training and testing the model.
Data SetNumber of ValuesTime Duration/s
discharge 0.1 C501438,148
charge 0.1 C449241,846
discharge 0.28 C217713,787
charge 0.28 C218117,418
discharge 0.1 C8983932
charge 0.1 C31203936
pulsed discharge15,57514,479
pulsed charge12,66016,300
half cycles77,548162,754
synthetic load profile69,541190,231
Publisher’s Note: MDPI stays neutral with regard to jurisdictional claims in published maps and institutional affiliations.

