Article

Cuckoo Search Combined with PID Controller for Maximum Power Extraction of Partially Shaded Photovoltaic System

by
Ibrahim Al-Wesabi
1,2,3,
Zhijian Fang
1,2,3,*,
Hassan M. Hussein Farh
4,
Abdullrahman A. Al-Shamma’a
5,
Abdullah M. Al-Shaalan
5,
Tarek Kandil
6 and
Min Ding
1,2,3
1
School of Automation, China University of Geoscience, Wuhan 430074, China
2
Hubei Key Laboratory of Advanced Control and Intelligent Automation for Complex Systems, Wuhan 430074, China
3
Engineering Research Center of Intelligent Technology for Geo-Exploration, Ministry of Education, Wuhan 430074, China
4
Department of Building and Real Estate, Faculty of Construction and Environment, Hong Kong Polytechnic University, Hung Hom, Kowloon 999077, Hong Kong, China
5
Electrical Engineering Department, College of Engineering, King Saud University, Riyadh 11421, Saudi Arabia
6
Department of Electrical and Computer Engineering, College of Engineering and Computing, Georgia Southern University, Statesboro, GA 30460, USA
*
Author to whom correspondence should be addressed.
Energies 2022, 15(7), 2513; https://doi.org/10.3390/en15072513
Submission received: 6 March 2022 / Revised: 26 March 2022 / Accepted: 27 March 2022 / Published: 29 March 2022
(This article belongs to the Special Issue Photovoltaic Generation Systems and Power Conditioning)

Abstract

:
In the case of partial shading conditions (PSCs), normal equations cannot be completely implemented. The mathematical model of the Photovoltaic (PV) array needs to be modified and re-established with the existence of bypass diodes connected to the PV module, which can alleviate the negative effects of the PSCs and generate several peaks on the PV output characteristics curve. The first aim of this study is to modify and re-establish the mathematical model of the PV array under PSCs. Second, it aims to improve and validate the reliable Cuckoo Search Algorithm (CSA) by integrating it with PID (hybrid CSA-PID) to diminish the impact of PSCs problems. The hybrid CSA-PID was proposed to both track the global maximum power point (GMPP) of PV systems and reduce the tracking time to eliminate the fluctuations around the GMPP. Further, the PID controller was used to eliminate the error percentage obtained by CSA under PSCs to generate the required duty cycle, which provides the required and desired maximum voltage accordingly. The proposed CSA-PID technique has been implemented using both Matlab/Simulink and Hardware-In-Loop experiments on the MT real-time control platform NI PXIE-1071. For validation, the Hybrid CSA-PID method is evaluated and compared with CSA, modified particle swarm optimization (MPSO), PSO, and modified perturb and observe (MP&O) methods under similar conditions. Finally, the obtained findings demonstrated the efficacy and superiority of the proposed hybrid CSA-PID technique, demonstrating its resilience, fast reaction, and good performance in terms of tracking time and GMPP tracking.

1. Introduction

Energy is currently becoming one of the most important factors, which plays a critical role in the global economy, political matters, and security issues. All countries desire to cultivate their resources and policies involving energy and related environmental contaminants for better future planning. The significant concern for energy consumption trends is linked to carbon dioxide emissions if fossil fuels are dominant in energy use. The rising tendency of emissions around the world and global warming is reducing energy and its associated developments [1].
The use of the photovoltaic system has been developed to address the growing demand for electrical energy. The non-linear features of the PV system, high production cost, low efficiency, and the dependency on the output power of the array terminal voltage for the same environmental conditions make the mission of efficiently employing the power generated by the PV array to be very challenging. Besides, PSCs affect the characteristics of solar PV systems and lead to the reduction of their output power. In addition, the presence of partially shaded conditions generates several peaks on PV features and reduces the efficiency of traditional MPPT techniques, such as P&O and IC. These peaks contain only one global point called the global peak (GP), and the remaining peaks are the local peaks (LP). Moreover [2,3,4,5], there are two methods, which can be used separately or jointly, to improve the extracted power in photovoltaic systems, which are the MPPT techniques and sun tracking. To implement these methods, they require certain controllers or techniques, which may be conventional techniques, such asP&O and IC methods, or intelligent methods, such as the Cuckoo Search Algorithm (CSA), Modified Particle Swarm Optimization, ANN, and fuzzy logic controller, to enhance the output power of the photovoltaic system. The main purpose of this paper is to propose an innovative optimization method to decrease the Partial Shading effect and competently track the GMPP.
Many traditional MPPT approaches, such as fractional short-circuit current and open-circuit voltage [6], perturbation and observation (P&O) [7], and incremental conduction (IncCon) [8], can be used to increase energy-harvesting capabilities. These tracking systems, on the other hand, have limitations such as insufficient MPP tracking precision, a delayed reaction, and excessive fluctuations around the MPP. To solve the previous shortcomings, numerous modifications to the typical MPPT algorithms have recently been created by employing artificial intelligence techniques such as fuzzy logic [9], neural networks [10], and neuro-fuzzy [11]. However, implementing these strategies in large-scale PV systems makes the control system difficult to implement. Other research projects, such as the voltage-oriented loop (VO-MPPT) [12,13,14,15] and the current-oriented loop (CO-MPPT) [16,17,18,19], are devoted to the development of MPPT without the usage of artificial intelligence approaches. Under abrupt irradiation changes, the VO-MPPT displays a quick MPP tracking. Nonetheless, it exhibits inaccuracy in tracking, particularly when the irradiation is suddenly changed and there are significant power fluctuations in steady-state conditions. In addition to excellent tracking, the CO-MPPT provides a significant decrease in oscillations around the MPP. This method is based on a variety of current control approaches, including traditional PI [15], predictive [16,17,18,19,20], and sliding mode [21] current controllers. In contrast to the VO-MPPT, the CO-MPPT progressively reaches the new MPP under abrupt irradiation changes. In [19], the authors developed a modified VO-MPPT with a rapid current controller loop to improve tracking performance, particularly during step changes in irradiance.
Several studies [22,23] suggested that a two-stage method is implemented based on the adaptive salp swarm and P&O methods under PSCs and load variations, but the tracing time is relatively long and has very high oscillations around GP. In [24], a hybrid method based on butterfly particle swarm optimization and P&O algorithms for tracking the GP under PSCs was proposed, but this hybrid spent a great deal of time for convergence and has oscillation around MPP. In [25], a modified fuzzy logic control method was proposed, which consists of both the fuzzy logic control method and the scanning method. Although this algorithm is relatively simple, under the conditions of partial shadings, scanning is required to check more than 60% of the power–voltage characteristic curve to effectively obtain the GP. Added to that, during the scanning process, it was observed that the output power had large oscillations. Particle swarm optimization (PSO) is a search technique based on an improved population randomization algorithm. It can retain the population of each particle to represent the candidate solution. The best solution to this problem can be represented by the location in the optimal particle space where the direction and velocity of the particle are determined by the velocity vector of the particle. Every particle follows the present optimum particle, and the search for the optimization in the solution is based on its own flight experience [26,27,28,29,30]. In [26], a genetic algorithm is combined with a particle swarm optimization algorithm to obtain an improved method, which has a quicker tracking speed and less fluctuation than the unadjusted technique. In [27], the output current of the solar system under PSCs is predicted and calculated, and then the traditional PSO algorithm is implemented to achieve the global maximum point excellently. Although the PSO algorithm is characterized by robustness, flexibility, and rapidity, it is easy to drop into the local optimum in the tracking process, resulting in an inability to reach the global peak. In [28,29,30], the authors applied PSO to track the GP under PSCs. In [31], the authors used a cuttlefish algorithm to tune a second-order amplifier to enhance the performance of the PV system under PSCs.
The Cuckoo Search Algorithm (CSA) is an optimization method, which is motivated by the natural parasitic reproduction strategy of cuckoo birds. This method is similar to the genetic algorithm (GA) and particle PSO depending on the population algorithm; also, it has some similarities to the harmony search in the selection procedure. The randomization is made much more effective by Lévy flight, which provides quicker convergence. In addition, the number of tuning parameters (two parameters) in this method is less than that in GA and PSO (three parameters and more). Again, the characteristic of the CSA does not depend on providing the samples’ initial values [32]. When the CSA method is used to obtain the global peak of the maximum power of PV arrays under partial shading conditions, the search process has to be conducted by choosing suitable variables for it. The output voltage and step size are the two parameters of the CSA. If the current sample is bigger than the previous sample, the maximum power given by the new sample is selected as the current best sample. If the quantity of the current sample is smaller than that of the previous sample, we maintain the maximum power. The course continued until all samples reached MPP [32,33,34,35,36,37]. Although the CSA has the features of robustness, flexibility, and rapidity, its tracking time is lengthy and it has slight output oscillation during the tracking process under PSCs.
In [38], another updated CSA was developed. This approach suggests adaptive movement based on big movement for low-power nests and modest movement for high-power nests by eliminating any random movement in the original CSA optimization process. CSA’s search mechanism was enhanced because of this method. The problem of high steady-state oscillations was handled at the cost of a longer convergence time and greater controller complexity (increasing installation cost). Another research study [39] was conducted to enhance the performance of the CSA to achieve both quick startup and decreased oscillations in steady-state circumstances. The conventional CSA [40] was employed, which produces large oscillations in steady-state circumstances. The maximum power for the PV system utilized to pump the water for the water pump system was tracked using this technique. Another technique for enhancing the CSA was presented in [41], this time employing the static penalty function (SPF). The infeasible solutions are penalized with a continuous penalty on this method. In [42], a hybridization of the CSA and golden section search (GSS) algorithms was presented to minimize the convergence time and oscillations around the GP. The CSA was employed in this technique to capture the region containing the GP, and then the logic passes control signals to the GSS, which uses it to carefully track the GP and decrease oscillations around it. This decreased the failure rate, convergence time, and oscillations while increasing the cost and complexity of the controller hardware; however, as shown in [43,44,45], this can be readily avoided, and this is the strategy followed in this research.
The aim of this paper is to improve and validate the reliable CSA by integrating it with the PID (hybrid CSA-PID) to diminish the impact of PSCs problems. The hybrid CSA-PID was proposed to track the global maximum power point (GMPP) of PV systems in addition to reducing the tracking time and eliminating the fluctuations around the GMPP. The maximum voltage is provided by the proposed CSA tracker. The provided voltage is compared with the output voltage of the boost converter to obtain the error voltage as a result. The error voltage is provided to the PID controller to produce a control signal, which is used to fire the switching device of the converter and obtain the required outputs. Therefore, the PID control was used to eliminate the error percentage obtained by CSA to generate the desired duty cycle, which provides the desired maximum voltage accordingly. Simulation and experimental results demonstrate that the proposed CSA-PID technique can extract the GMPP rapidly with high efficiency and negligible oscillations around the GMPP under PSCs for various scenarios.
The main contributions of this work can be summarized as follows:
  • Modify and re-establish the mathematical model of PV array under PSCs.
  • Outline a unique, simple, and rapid metaheuristic soft computing method called CSA to detect GMPP under various PSCs while the convergence speed and output fluctuations are minimized during the tracking period.
  • Utilizing a dynamic global MPPT approach that combines a CSA optimizer with PID control to treat PSCs, with the goal of putting it into a realistic PV system and improving the performance of the conventional CSA.
  • Evaluate the proposed CSA-PID that utilized Matlab/Simulink and the Hardware-In-Loop experiment on the MT real-time control platform NI PXIE-1071 and compare it with CSA, MPSO, PSO, and MP&O methods under similar scenarios.

2. Description of the Proposed Photovoltaic Energy System

Photovoltaic cells are made of semiconductor material PN and generate DC voltage when receiving photovoltaic light. They can be represented by the parallel connection of the constant current source and forward diode. The equivalent circuit of the solar cell is shown in Figure 1, where Iph is the current provided by photons, and its value is directly proportional to the light-receiving area of the photovoltaic cell, the illumination intensity of the incident light, and the ambient temperature; ID is the reverse current in the photovoltaic cell; Ish is the shunt current through the bypass resistor Rsh, which is caused by the leakage of the metal bridge on the edge of the battery and the metal electrode; Rs is the series resistance, which is related to the contact resistance and resistivity of the material itself; IPV and VPV are the current and voltage of solar cells, respectively.
In this work, the schematic diagram of the proposed system, which shows the overall PV system connected in series and parallel, is presented in Figure 2. It consists of a 10 × 2 PV array. For PV array simulation, the simulated PV module has the same parameters as the UP-S250 module in the standard test condition (STC) as shown in Table 1. The PV system has been modeled using MATLAB/Simulink to provide the required output voltage and output currents. The inputs of the PV system are the radiation and temperature, as well as other parameters that have been taken into consideration. Four subsystems have been modeled in MATLAB/Simulink to mimic the PV system when it runs under PSCs. Each subsystem is made up of five modules that are linked together in a series. To decrease power losses, bypass diodes were also attached to each subsystem. All subsystems obtain varied quantities of radiation and a constant temperature as the input. As a result, every two subsystems are linked in series, and then the entire subsystem is connected in parallel, as shown in Figure 2, to obtain the entire system as suggested in the model related to our experimental platforms.
In the case of PSCs, the standard equation of PV modules cannot be completely implemented, and the mathematical model of the PV array needs to be modified and re-established. In this paper, the rate of the optical shading, E, is introduced to indicate the degree of light shading and the area of the PV array as follows:
E = 1 G a f t e r G b e f o r e
where Gafter is the solar irradiation received by the PV cell after it is blocked and Gbefore is the solar irradiation received before the PV cell is blocked. For easier calculation, Gbefore is considered as the reference irradiation, which is equal to 1000 W/m2. The photon current becomes the following:
I p h = I p h o ( 1 E )
where Ipho is the photon-generated current at the typical test condition (TTC), which is equal to 1000 W/m2 and 25 °C.
As shown in Figure 3, an example of a single-string array consisting of two photovoltaic cells, which are wired in series, is presented. In this example, one cell is shaded while the other is not, therefore both photon and output currents of the shaded cell are less than the unshaded cell as Ipha < Iphb, and Ia < Ib. In addition, the specific operation modes have the following conditions:
  • When RL is relatively large and the load current IL ≤ Ia, then both cell (a) and cell (b) can work normally and provide the output current. The output voltage and power are the summations of the output voltage and power of each cell.
  • When RL is relatively small and the load current IL > Ia, then cell (a) will be short-circuited by the diode Da and will not provide the corresponding current. The output current and power of the array will only be provided by cell (b).
The mathematical model corresponding to this case is expressed as the following segment function:
I L = { I p h a I [ e q ( V L + 2 I L R s ) 2 A K T 1 ] I f 0 < I L I a I p h b I [ e q ( V L + I L R s ) A K T 1 ] I f I a < I L I b
The output current of each PV module, which consists of Ns cells under the partially shaded condition, is Ia, Ib, Ic …… INs, respectively, and each photon current is represented as Ipha < Iphb < Iphc < …… < IphNs in the following output characteristic equation:
I L = { I p h a I [ e q ( V L + N s I L R s ) N s A K T 1 ] I f 0 < I L I a I p h b I [ e q ( V L + ( N s 1 ) I L R s ) ( N s 1 ) A K T 1 ] I f I a < I L I b I p h N s I [ e q ( V L + I L R s ) A K T 1 ] I f I ( N s 1 ) < I L I N s
When NP is considered to be connected to the array structure in parallel, the output characteristics can be obtained as the following:
{ I L = x = 1 N p I x V L = m a x { V x } x = 1 , 2 , , N p
where Ix and Vx are the output current and voltage of a single string array, respectively.
The PV system consists of (10 × 2) arrays, the temperature is 25 °C, and the system is exposed to two different irradiance levels, 1000 W/m2 and 400 W/m2, respectively. The output power under different shading cases is shown in Figure 4, and the position and value of the corresponding maximum PV power and voltage are presented in Table 2. The theoretical output power of the PV array greatly varies under different shadow distributions. The best shadow distribution is (4:0) and the corresponding maximum output power is 3.27 kW. The worst shadow distribution is (6:3) and the corresponding maximum output power is 2.27 kW. The difference between the optimal distribution and the worst distribution is 1 kW, which is almost 30.5% of the maximum power in the optimal case. The distribution is more diverse, and the difference between the best distribution and the worst distribution will continue to grow. As shown in Figure 4, the maximum output power is proportional to the magnitude of the solar irradiation. Moreover, with the decrease in the solar irradiation level received by the shaded photovoltaic cell, the global maximum power point is gradually shifted to the voltage drop direction.

3. Hybrid CSA-PID Technique Based MPPT

3.1. MPPT Based on CSA

In 2009, Yang and Deb proposed a natural optimization algorithm CSA. This is a new metaheuristic algorithm, which has already been applied in many optimization types of the research area. In addition, the inspiration for CSA comes from the parasitic behavior of cuckoo chicks, which have strong reproductive abilities when laying eggs in the host nest. As a result, the optimization technique is based on determining cuckoo egg-laying and body form breeding. There are two formulations of cuckoos in the optimization process: The egg and the mature cuckoo. If adult cuckoos lay eggs in their nests and the host bird does not find or kill the eggs, they will grow into mature cuckoos. The environmental characteristics and migration of the cuckoo community are helpful for the cuckoo to gather and discover the greatest environment for breeding. This optimal residential area is the global maximum (GM) of the objective function [46].
The most important part of the cuckoo’s breeding strategy is to find a convenient host nest. In general, looking for a nest is similar to looking for food, and it takes the form of random or quasi-random. When animals are looking for food, they will choose the direction or track that can be simulated by a specific mathematical function. Lévy flight is one of the most prevalent modes. Lévy flight is a type of random walk in which the step size follows a Lévy probability distribution. In the cuckoo bird’s search, the bird-nest search is categorized by Lévy flight. Statistically speaking, Lévy flight is a kind of random walk. According to power law [32], the step size is extracted from the Lévy distribution as follows:
y = l λ
where l is the flight length and λ is the variance, because 1 < λ < 3 so y has infinite variance.
Figure 5 is an instance of Lévy flight in a two-dimensional area. Because of the advantages of tax distribution, these steps are composed of many small steps, big steps, and long-distance jumps. Moreover, compared to other heuristics algorithms, these long-distance jumps can meaningfully improve the efficiency of the cuckoo search, especially for multimodal and nonlinear problems.
The algorithm starts with a premier population of cuckoos. The original cuckoo lays its eggs in the host bird’s nest. Therefore, some of the eggs that have more similarity to the eggs of the host bird will grow and hatch into mature cuckoos. Other eggs found by the host birds are destroyed. Mature eggs can detect the quality of nests in that area. The more eggs a region has, the more profit it makes. Therefore, the optimization of CSA refers to where more eggs survive [47].
To improve the rate of survival of cuckoo eggs, cuckoos should look for the best area to lay eggs. When the remaining eggs grow into mature cuckoos, they will form other societies. Every society has its own environmental area to live in and reproduce. The best environment for all societies will be the aim of other societies. Then, cuckoos migrate to their best environments. They will live close to the best habitat [47].
According to the nest parasitism actions of cuckoo birds, CSA has three idealized rules: (1) Each cuckoo must lay one egg at a time and then put it inside a randomly selected nest; (2) the nest with the best quality and best chance of survival of the cuckoo will move to the following generation; and (3) the number of nests obtainable is fixed, and the probability of keeping cuckoo eggs distinguished by host birds is Pa, of which 0 < Pa < 1 [32].
For the maximization problem, the value of the objective function is directly proportional to the fitness of the solution. For simplicity, we use the following signal: All eggs in a nest characterize a solution, and cuckoo eggs characterize a new solution. The aim is to use new and potentially better solutions (such as cuckoo) instead of worse solutions in the nest. If a cuckoo’s egg is detected, the host bird can leave its nest or destroy the cuckoo’s egg. On the other hand, if the number of nests is fixed, new nests will be built by the probability of Pa.
When a new solution is generated for a cuckoo, Lévy flight will be executed according to the following expression:
X i t + 1 = X i t + α L e v y ( λ )
where X i t is the sample/egg, i is the sample number, t is the iterations number, and α is the step size, which is associated with the scale of the problem of interest. In many cases, we could utilize α = 1, sometimes α > 0. The random walk is a Markov chain whose next location is determined only by the present position (the first component in the equation above) and the probability of transfer (the second term). Multiplication by entry is referred to as a product ⊕. In most circumstances, α is used to solve the following equation:
α = α 0 ( X j t X i t )
where α 0 is the primary step size, and in this calculation, the difference between the two samples is used to fix the subsequent step size.
Under the background of the MPPT algorithm, the structure of CSA in Formula (7) is similar to the HC/P&O method. Of course, this similarity does not include the step size of the Lévy flight. However, the main advantages of the CSA algorithm are more robust than the HC algorithm:
  • The CSA algorithm is a population-based algorithm (such as GA and PSO), but it shows advantages in the selection process (such as harmonious search).
  • The CSA algorithm has higher randomization efficiency because, in Lévy flight, the step size can become larger (long jump) and the convergence speed is faster.
  • There are only two parameters for parameter setting in CSA; GA and PSO need three or more parameters.
  • Unlike PSO, CSA performance does not depend on sample initialization.
To use CSA to design MPPT, it is necessary to select appropriate variables to search. First, in this case, all samples are defined as the value of photovoltaic voltage, i.e., Vi (i = 1,2, ……, n). The total number of samples is defined as (n). Secondly, the step size is expressed in (α). Then, the fitness function (J) is the photovoltaic power value of the maximum power point. Because (J) depends on PV voltage, J = f ( V ) . Initially, the resulting sample is applied to the PV module and the power is set to the initial adaptation value. The voltage corresponding to the maximum power count is considered to be the largest sample at present. Then, according to the Lévy flight executed in the next calculation [46], a new voltage sample is generated accordingly:
V i t + 1 = V i t + α L e v y ( λ )
where α = α 0 ( v b e s t v i ) .
A simplified structure of the Lévy supply can be explained by:
s = α 0 ( v b e s t v i ) L e v y ( λ ) K × ( u v 1 β ) ( v b e s t v i )
where β = 1.5 is the Lévy times the coefficient (at the designer’s option), while u and v are calculated from the usual distribution curve. We measure the specific power of the new voltage sample from the PV module. By comparing the power values, the maximum power given by the voltage is selected as the best new sample. In addition to the best sample, other samples are destroyed at random with a probability of Pa. This process stimulates the host bird’s behavior of discovering cuckoo eggs and destroying them. Then, a new random sample is generated to replace the broken sample. Therefore, the power of all samples is measured again, and the current optimal value is selected by calculating J. The iteration continues until all samples reach MPP.
u N ( 0 , σ u 2 ) , v N ( 0 , σ v 2 )
σ u = ( ( 1 + β ) × s i n ( π × β / 2 ) ( 1 + β 2 ) × β × ( 2 ) ( β 1 2 ) ) 1 β and   σ v = 1
Figure 6 displays the flow chart of the suggested technique, initializing all constants and variables, i.e., voltage, current, power, number of samples. We use the current value of voltage and current to compute the power. The new values of voltage and power are deposited in the voltage V i t and fitness arrays J i t , respectively. In addition, before each iteration begins, a check is performed to determine whether the sample has reached convergence or otherwise. If the samples are close to MPP, they will be merged into the same value, and the corresponding power will be merged into the same value [47]. If all samples do not converge, all power values of the corresponding samples are restrained and deposited in the fitness array. Through the estimation of the array, the sample with the largest power is selected as the best sample. After that, according to Equation (10), all other samples are enforced to keep moving to this optimal value. Performing Lévy flight will then calculate the steps described in Equations (11) and (12). Therefore, a new set of samples was found. Then, the corresponding power of these new samples is restrained from the photovoltaic panel. Besides, if any sample results in low power, the specific sample is ignored and a new sample is produced. This iteration will continue until all samples have reached the greatest MPP [47].
In general, under partial shading conditions, when using the method of cuckoo search to obtain the global peak of the maximum power of PV arrays, the search process has to be conducted by choosing suitable variables. The output voltage and step size are the two parameters of the Cuckoo Search Algorithm. If the new sample is more than the old sample, then the maximum power given by the new sample is selected as the best new sample. If the new sample has a smaller amount than the old sample, the maximum power is retained. The course continues until all samples have reached the MPP [46,47].

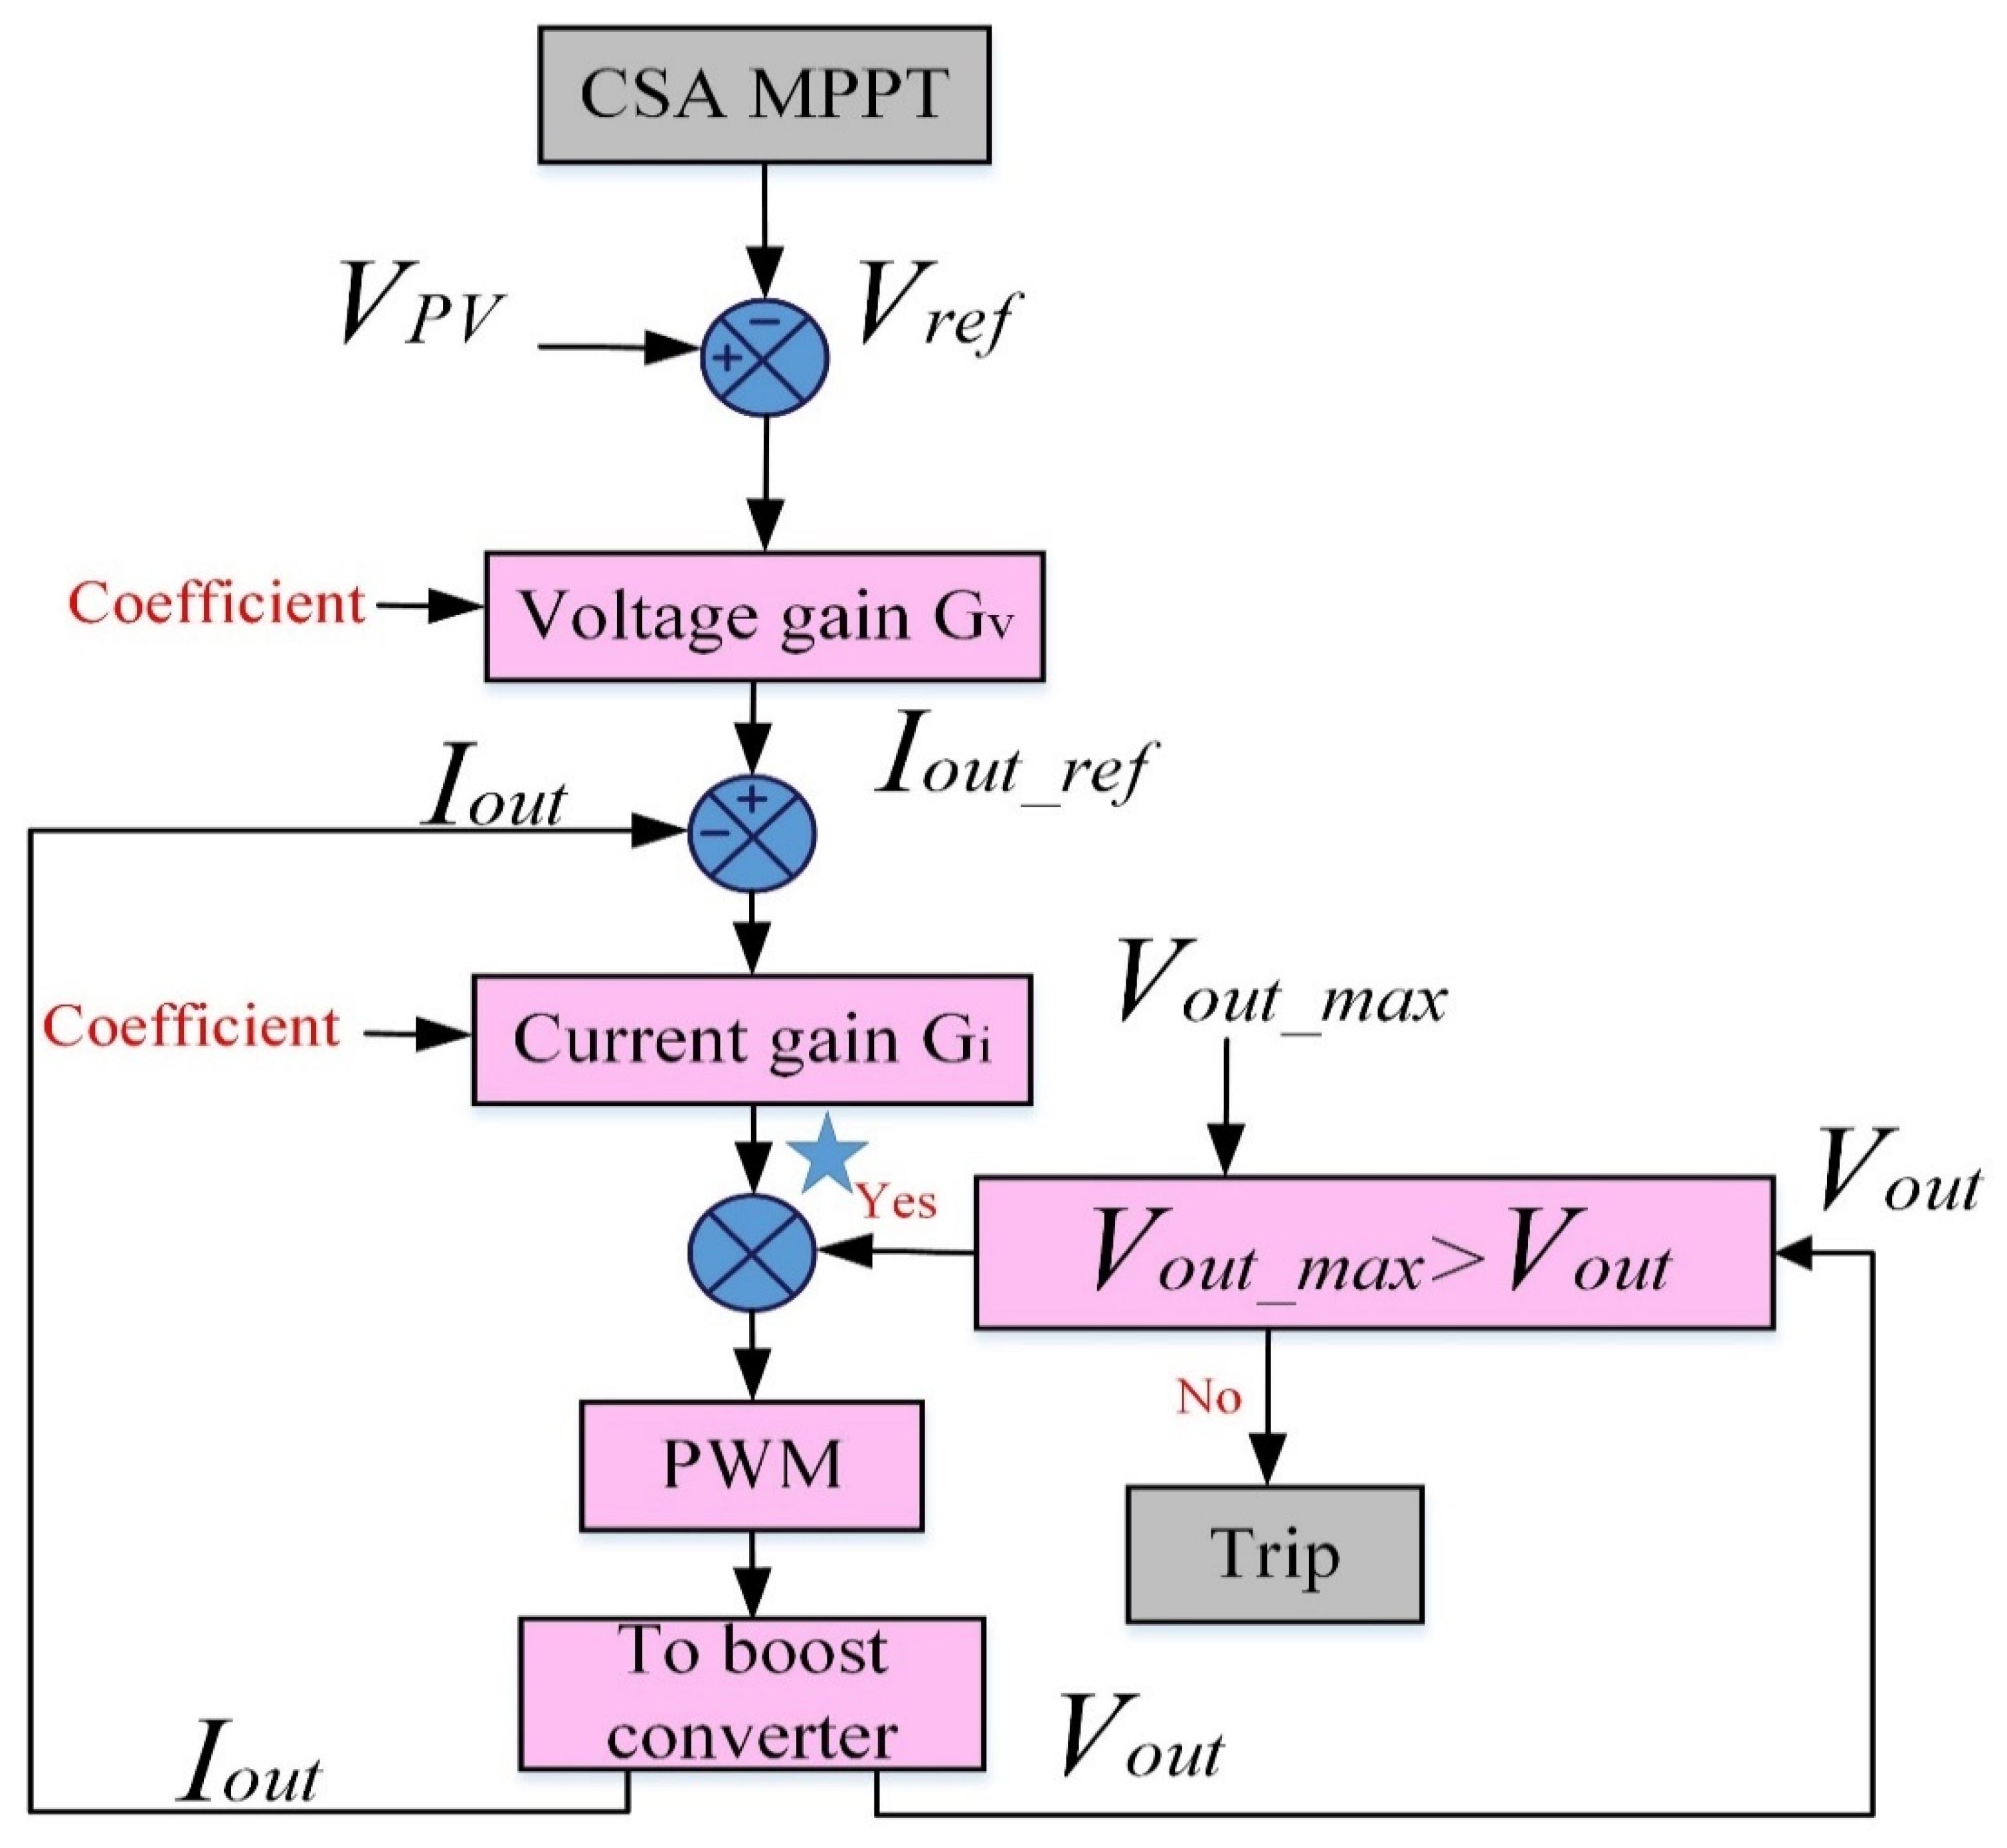
3.2. PID Control Method Based on MPPT

A PID controller, which is an abbreviation of the proportional-integral-derivative controller, is the most-applied feedback controller in different applications such as industrial controlling systems. The PID controller calculates the error value as a difference between the DC-DC converter output voltage and the maximum voltage generated by the CSA tracker. According to that, the PID controller tries to reduce the error value by adapting the process control inputs, and to obtain the best performance of the controller, all the controller coefficients should be tuned concerning the nature of the system.
The control action can be achieved by the controller for certain process requirements throughout the tuning of the three coefficients of the PID controller. The controller response can be presented related to the control responsiveness to the error, the degree to which the control overshoots the reference point, and the degree of the whole system oscillation. The duty cycle D is the control signal, which should be sent to the PWM circuit to trigger the switching device of the DC-DC converter to generate the output voltage of the convertor, the V o u t p u t is the measured output, and Vmax is the desired output; therefore, the tracking error e can be calculated as the following:
e ( t ) = V o u t p u t m a x
Hence, the duty cycle D can be obtained as the following:
D = K p e ( t ) + K i 0 t e ( t ) d t + K d d d t e ( t )
where Kp, Ki, and Kd are the coefficients of the PID controller.
The PID controller has been tuned with the parameters shown in Table 3. In addition, the performance and robustness of the PID controller are clearly explained in Table 4.

3.3. Hybrid CSA and PID

The proposed technique in this paper employs the integration of the CSA with PID. The idea behind this technique is to use the merits of these two techniques and avoid their demerits. The CSA is the most efficient and has fast convergence in catching the GP of PV systems, but it has low oscillations around the GP at steady-state conditions and very high oscillations under PSCs, while the tracking time is also very long in terms of caching the GP. The inputs of the CSA controller are the PV system voltage and current, while the output is the maximum voltage, which is subtracted from the DC-DC converter output voltage to send the difference to the PID controller, which reduces the error percentage gained by CSA and enhances the system efficiency by providing the exact value of the converter duty cycle. Moreover, the demerit of high oscillations is overcome by terminating CSA-PID operation and providing the opportunity for the system to work in very low oscillations at this GP under steady-state conditions and PSCs.
The idea behind using the PID controller lies in the lower transient overshoot and increased steady-state stability. Therefore, the PID controller is preferred over the PI or P controller. The demerits of the PID controller include the inclusion of the derivative term in the controller, which, on the other hand, may result in undesired noise at the input side, which can affect the output voltage to some extent. Therefore, a filter was built into the PID’s derivative portion to solve this problem. The filter coefficient is set to 35, which indicates where the filter’s pole is in the derivative action. The PID controller’s settings are fine-tuned using the trial-and-error approach.
The gain of the PID controller can be obtained by the trial-and-error method. Here, 2-pole 2-zero 50 KHz controllers are used to close the inner DC-DC boost current loop and the outer input voltage loop. The MPPT algorithm provides the reference input voltage VPV_ref to enable the panel operation at the maximum power point. Here the sensed input voltage of the panel VPV is compared with the reference voltage VPV_ref generated by the MPPT controller. The deviated output of the comparator is fed into the voltage control loop (Gv), which is an outer voltage loop that regulates the input voltage and current of the boost stage that can be controlled by an inner current loop. The output of the voltage controller Iout_ref is compared with the DC-DC converter output current Iout feedback in the current control loop (Gi). The output of the controller decides the amount of duty cycle to be instructed to the PWM so as to regulate the input voltage.
The voltage feedback is mapped to the internal comparators to avoid the output voltage from becoming higher than the maximum voltage of the boost converter, which trips the PWM. This process is repeated until the system reaches MPP. The steps involved in the feedback PID controller are illustrated in Figure 7.

4. Simulation and Experimental Results

4.1. Simulation Results and Discussions

First, a solar PV system is modeled and simulated. The specifications used are the same parameters of the UP-S250 module in the standard test condition (STC) as shown in Table 1. The PV system has been modeled using Matlab/Simulink to provide the required output voltage and output currents. The inputs of the PV system are both radiation and temperature, as well as the other parameters that have been taken into consideration as explained earlier in the equations of PV systems. To simulate the PV system when it operates under the conditions of partial shading, four subsystems have been modeled in the Matlab/Simulink. Each subsystem consists of five modules that are connected in series. The bypass diodes have also been connected to each subsystem to reduce the power losses. The input of all subsystems is the different levels of radiation and a constant temperature. Therefore, to obtain the whole system as the proposed model related to the experiment platforms, every two subsystems are connected in series, and then the whole subsystem is connected in parallel as seen in Figure 8.
The boost converter plays a very significant part as it boosts the PV array terminal voltage with the variation of the duty cycle. The duty cycle will be calculated depending on the signal of the MPPT, whether it is CSA-PID, CSA, MPSO, PSO, or MP&O. The Simulink model of the complete system used to estimate the capability of CSA and its performance is compared to the most popular MPPT techniques, i.e., MP&O (conventional) and CSA, MPSO, and PSO (soft computing), and the schematic diagram of the proposed system, which shows the overall PV system when connected to the proposed CSA-PID predictor, is clarified in Figure 8. It consists of a 10 × 2 PV array, an MPPT tracker, a DC-DC converter, and the load.

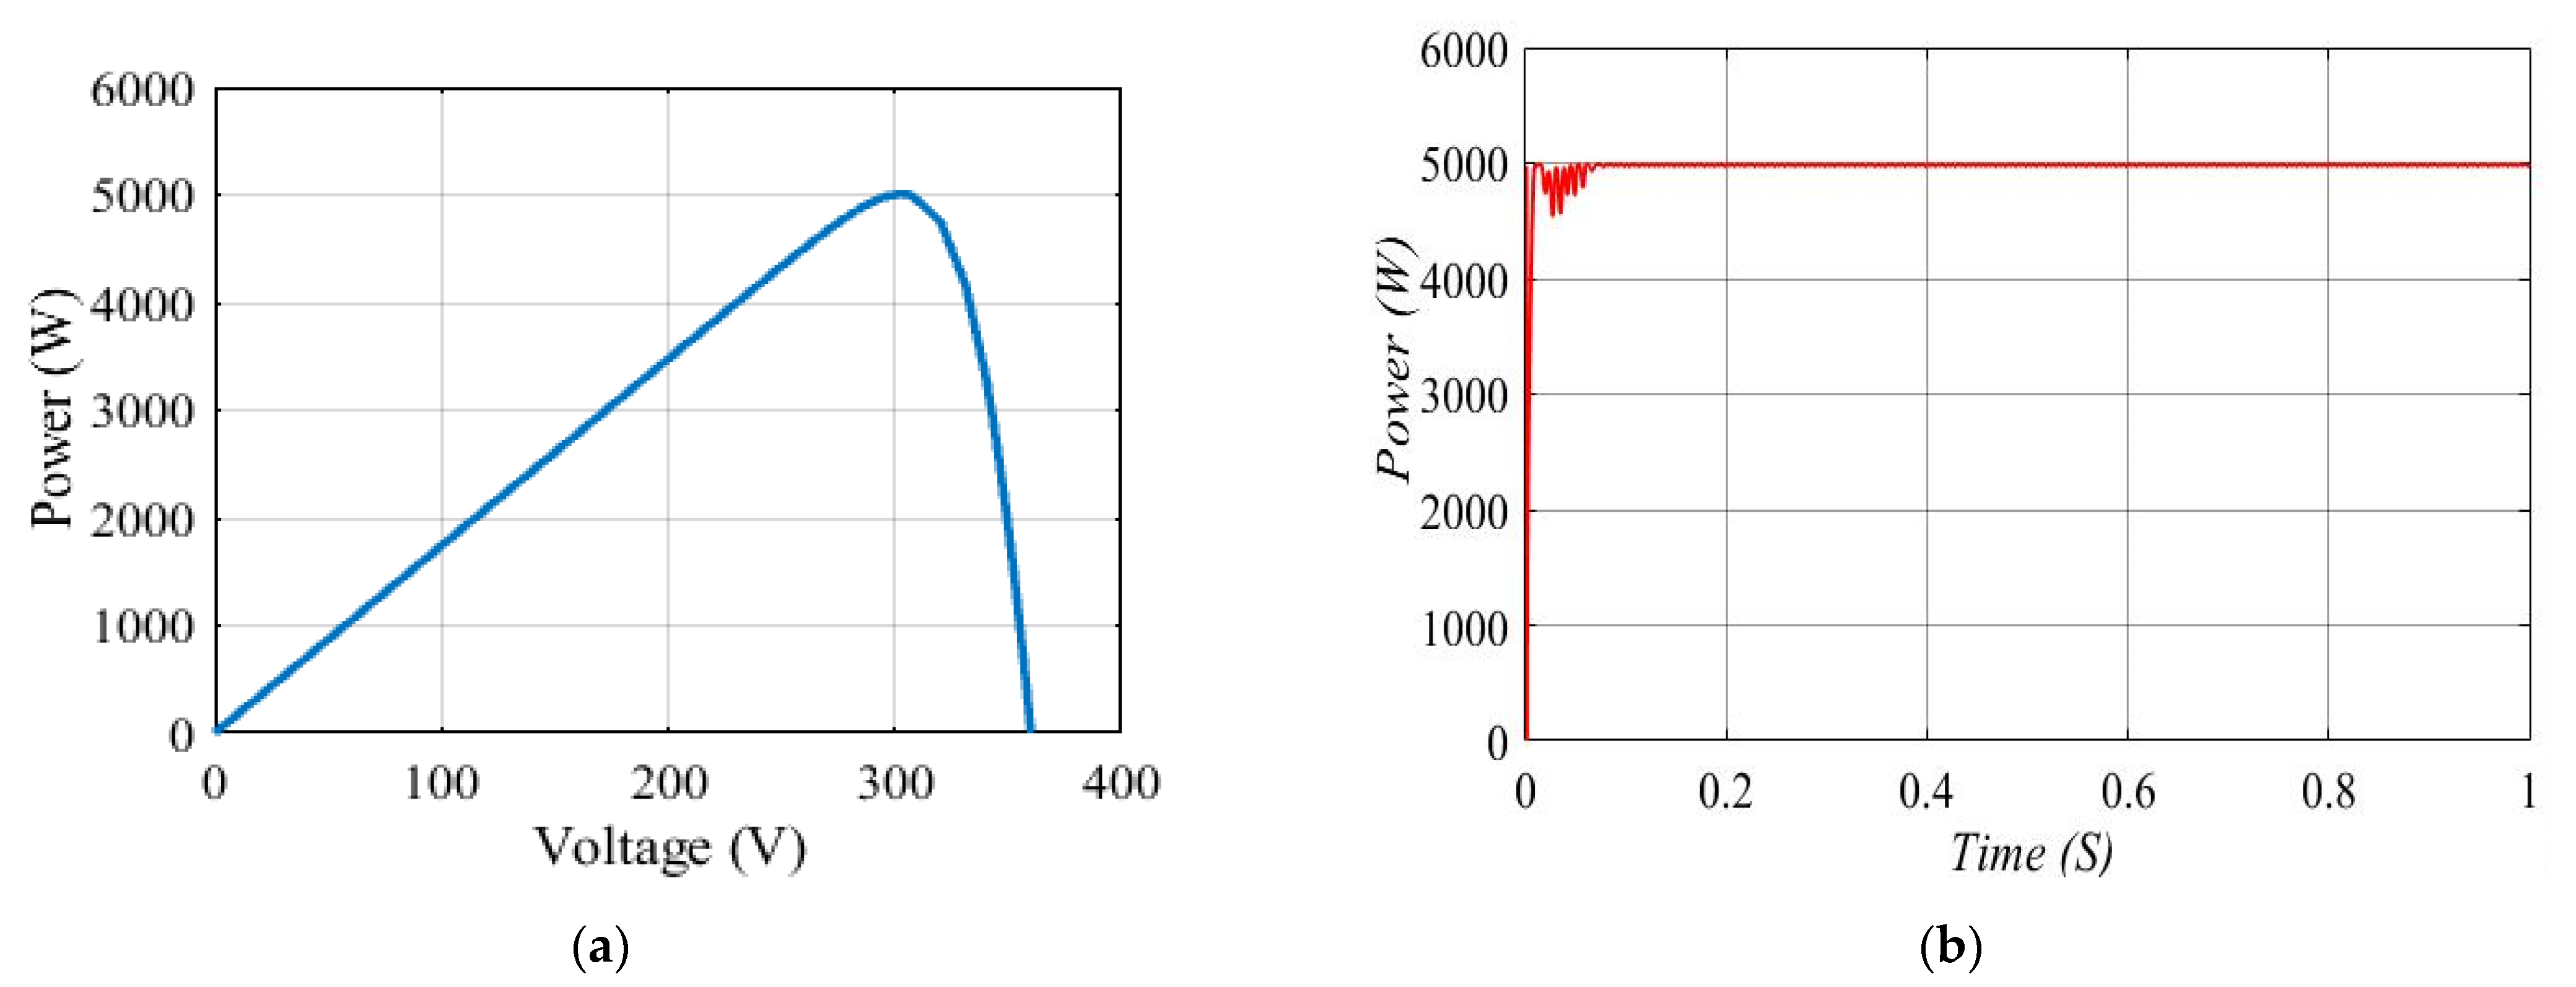
4.1.1. Test the Proposed CSA-PID under Standard Test Conditions (STC) and PSCs

The purpose of this test is to determine the speed at start-up (from zero). The PV array is constructed using the modules described in Table 1 and configured as two strings of 20 modules. The proposed CSA-PID controller is examined at STC, of which the GMPP at STC is 5000 W as seen in the PV curve in Figure 9a. The proposed method is simulated for 1 s. The response results of power are shown in Figure 9b. It can be observed that MPP is tracked within 0.1 s, which is quick enough to match the real atmospheric changes because the changes in irradiance and temperature take at least a few seconds. An important feature of CSA-PID is that it can track GMPP effectively without any error. The output power of the CSA-PID method is 5000 W without any power loss. Under steady-state conditions, the operating point is stable at MPP, that is, the oscillation is almost zero. This is in contrast to P&O (and other traditional methods), where oscillations around MPP are established.
In addition, we examined the proposed CSA-PID controller at PSCs in which the solar irradiance varied at 1 kW/m2, 0.6 kW/m2, and 0.4 kW/m2 and the GMPP at PSCs is 2240 W as seen in the PV curve in Figure 10a. The simulation of the proposed method is carried out for 1 s. The resulting response of power is shown in Figure 10b. In addition, the MPP is tracked within 0.1s. This is quick enough to match the real atmospheric changes and PSCs, while the CSA-PID-based MPPT method has a better response in terms of waveform harmonics distortion, and the global maximum power is effectively extracted via the CSA-PID tracker within a short period and free oscillations under PSCs.

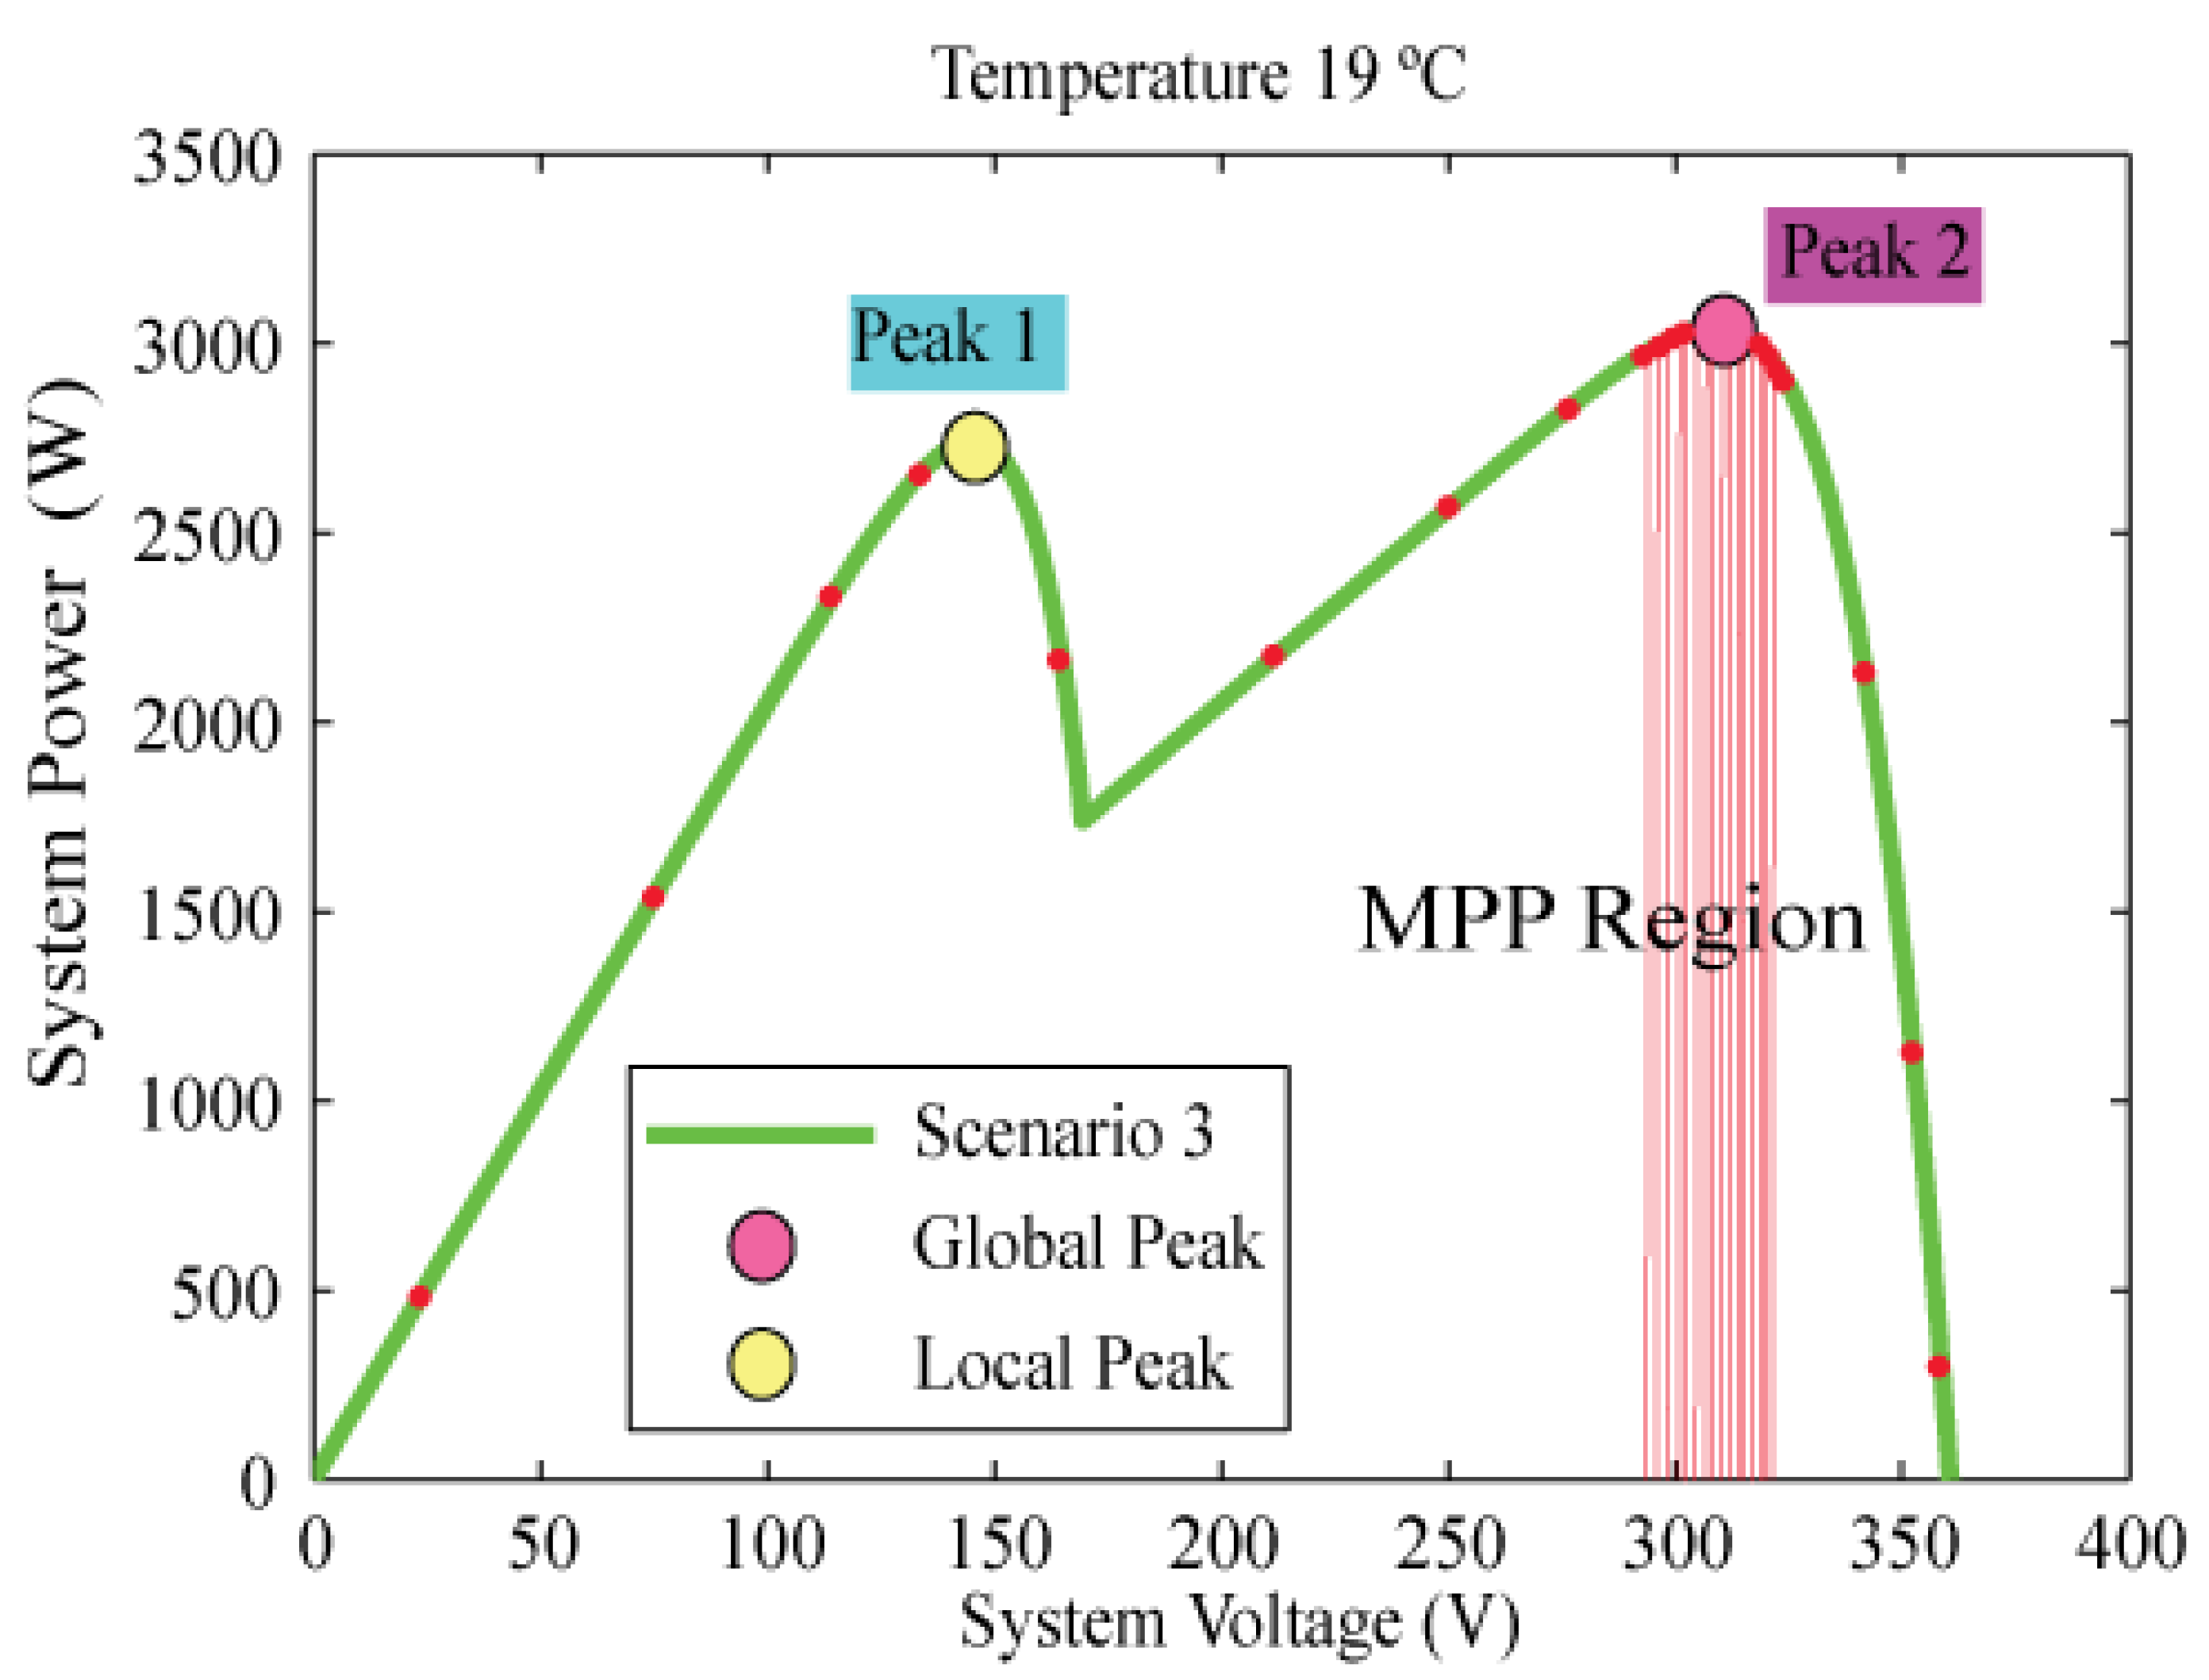
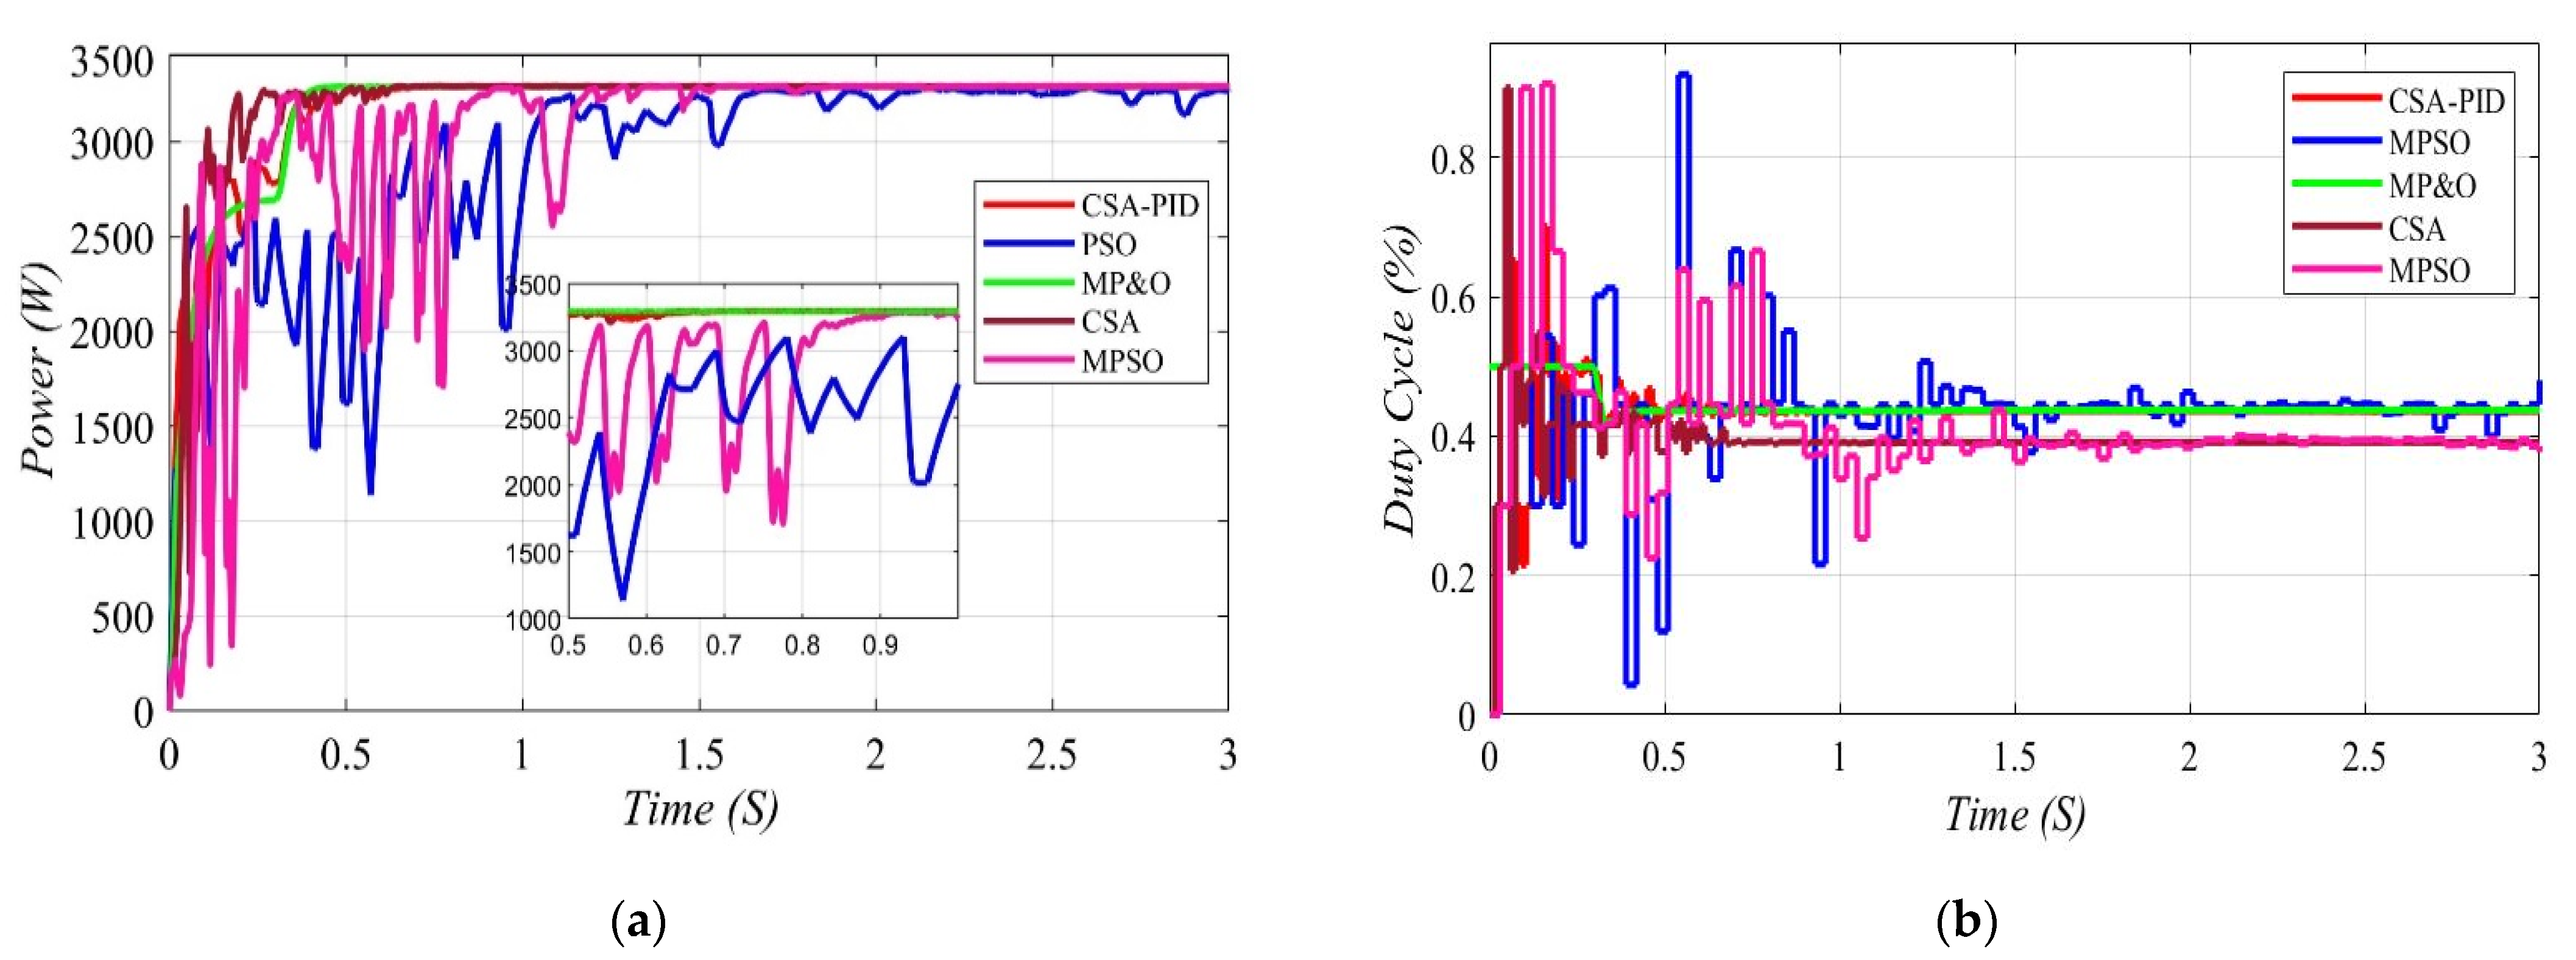
4.1.2. Partial Shading Distribution Scenarios of PV System

The efficiency of the proposed controlling method is investigated by assuming three shading scenarios, and the photovoltaic characteristic curves under partial shading conditions for all scenarios are presented below.
In scenario one, the PV system is exposed to three different levels of irradiation (1000, 600, 400 W/m2) and one constant level of temperature (19 °C), of which the shading patterns for scenario one can be seen in Figure 11, where the PV curve has two local peaks (1963, 2250 W) and one global peak (2285.09 W). Figure 12 and Figure 13 display the output power and duty cycle for CSA-PID, CSA, MPSO, PSO, and MP&O, which indicate that the proposed MPPT method (CSA-PID) is able to efficiently track the actual maximum power under non-uniform levels of irradiation and PSCs. The CSA-PID-based MPPT method provides the data points Pmax, Vmax, and Imax, which equal the measured data points achieved from the actual Simulink model concerning the lab experiment platform. Moreover, the output of CSA-PID is better than the output of the CSA, MPSO, PSO, and MP&O controllers under PSCs and non-uniform irradiation levels.
In scenario two, the PV system is examined under two patterns of partial shading in which the solar irradiation values are 350 and 900 W/m2 and the temperature is 19 °C, as shown in Figure 14. The PV curve for two different partial shading patterns, in which the PV curve has one local peak (1445.23 W) and only one global peak (1600.11 W), is illustrated in Figure 15. Therefore, the discrimination between the global and local peaks of the PV system requires an efficient controller such as CSA-PID, which is capable of catching and finding the global peak among all peaks in the case of partial shading conditions. Figure 16 displays the output power and duty cycle for the CSA-PID, CSA, MPSO, PSO, and MP&O, which indicates that the proposed MPPT method (CSA-PID) efficiently tracks the location of the global peak within a short time, as well as the free oscillations, in contrast to other designed MPPT controllers.
In scenario three, the PV system is examined under two patterns of partial shading in which the solar irradiation values are 1200 and 600 W/m2 and the temperature is 19 °C, as shown in Figure 17. As illustrated in Figure 18, the PV curve of scenario three has only one local peak (3000 W) and only one global peak (3300 W). Furthermore, as Figure 19 shows, the CSA-PID control method can track the maximum power successfully for any partial shading condition scenarios. The simulation results demonstrate that this technique can extract the actual maximum power point rapidly with high efficiency and negligible oscillations around the global point of maximum power under partial shading conditions for various scenarios.
Table 5 summarizes the partial shading distributions of each scenario, in which the global maximum power is effectively extracted within a short time of less than 0.5 s with free oscillations, as shown in the figures, which prove that the proposed method may easily track the global peak without any difficulty. As mentioned in Table 6, the proposed tracking method can distinguish between the local and global peaks for each scenario. As a result, the system performance was improved, and the output power values obtained by the proposed tracker were close to the maximum power and better than the output power values obtained by other trackers.

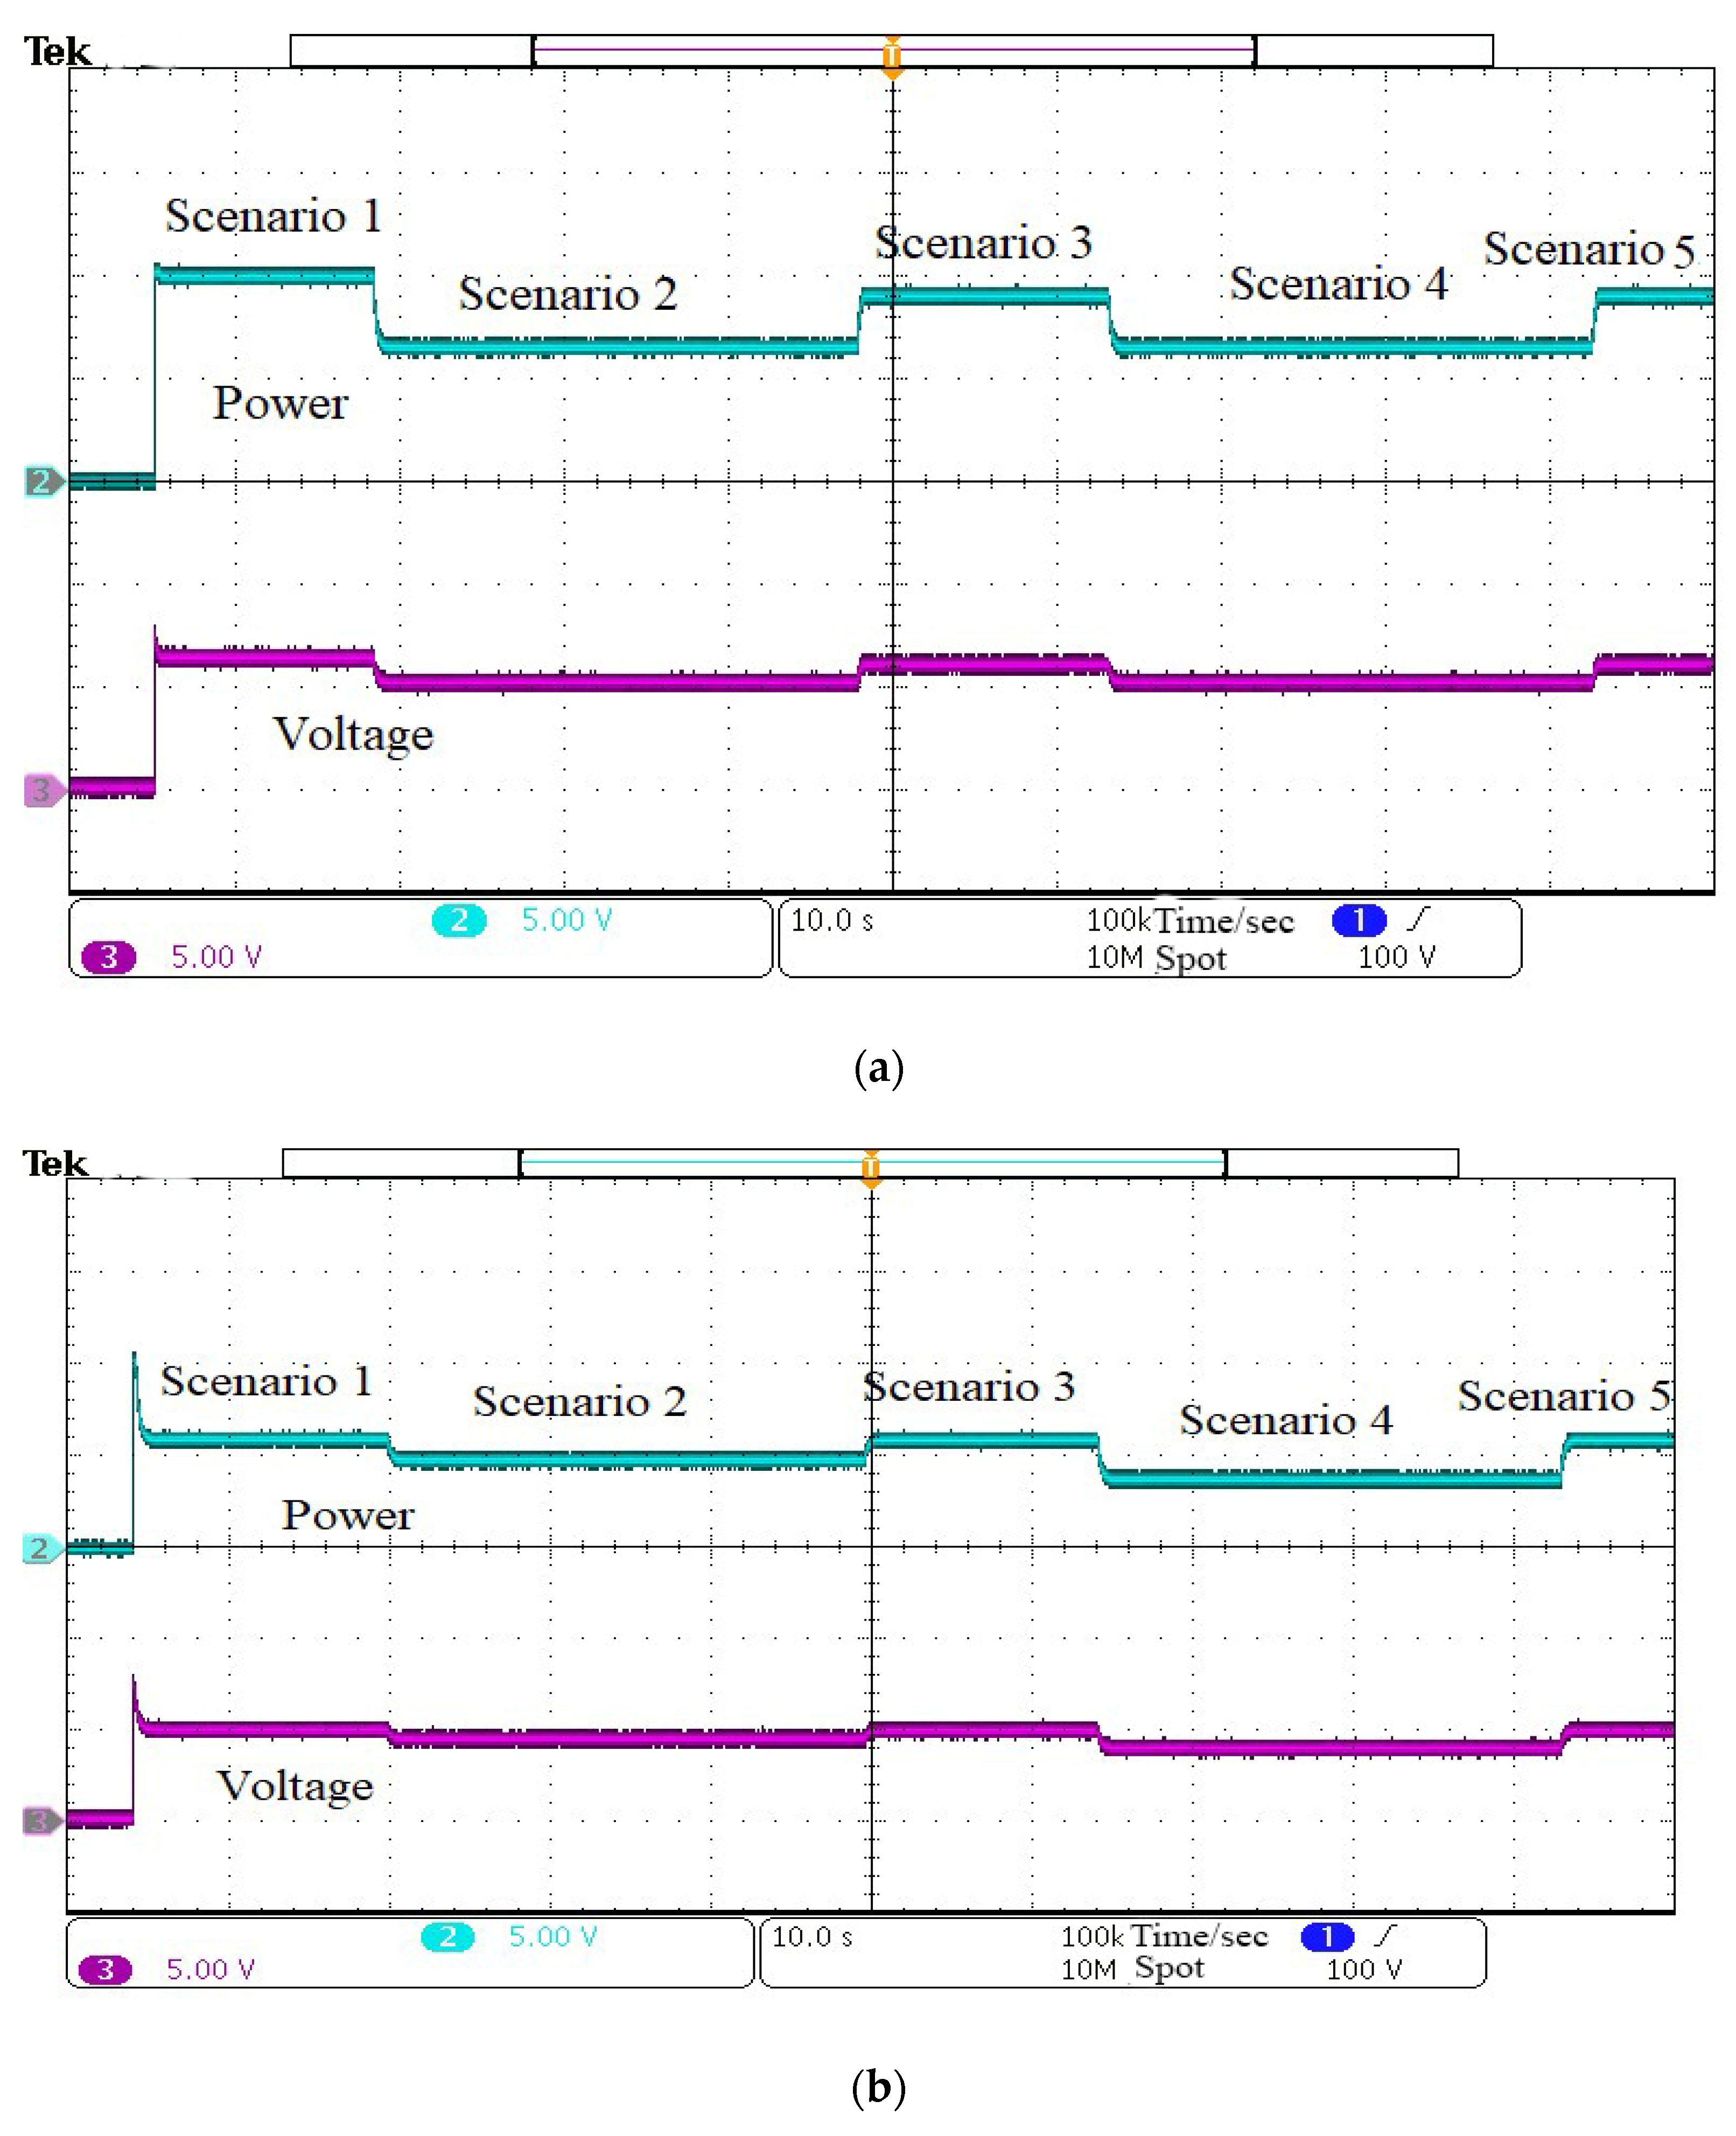
4.2. Hardware-in-the-Loop Experimental Results and Discussions

The experiment platform is set up to verify the effectiveness of the suggested CSA-PID approach. NI PXIE-1071 is used to implement the control technique. As illustrated in Figure 20, NI PXIE-1071 uses HIL software to perform hardware-in-the-loop simulation. The FPGA board of NI PXIE-1071 implements the system’s power circuit. The sampling and control circuit is transformed into a C program using Simulink’s NI standard C language code generation and is loaded into NI PXIE-1071′s control board; the sampling frequency is 10kHz. By connecting an external port board to a set of ports defined inside NI PXIE-1071, the experimental results are presented on the power analyzer.
Experiments were conducted for the UP-S250 PV configuration (Scenario 1 to Scenario 5), as shown in Figure 21, to test the efficacy of the proposed Hybrid CSA-PID for the UP-S250 PV configuration under severe, quickly changing insolation levels. In scenario one, the proposed Hybrid CSA-PID-based MPPT can converge to the GP in 0.5 s, CSA in 0.67 s, MPSO in 1.0 s, PSO in 3.5 s, and MP&O in 1.89 s, resulting in modest oscillations around the MPP. As a consequence of the aforementioned findings, it is concluded that the suggested method outperforms conventional MPPT tracking strategies under varying insolation patterns in terms of faster convergence to the GP and higher energy production.
According to the results of the experiments shown in Figure 21 and Table 7, the combination of CSA and PID algorithm results in faster convergence to the GP in the least time, enabling the highest possible maximum power from the solar PV system. Thus, it is concluded that the Hybrid-MPPT is capable of adapting itself towards sudden variation in insolation and any partial shading while improving the system efficiency. Table 8 compares the proposed CSA-PID controller to the other MPPT algorithms. Traditional algorithms such as (In-Cond) may have the advantage of simplicity. However, they are less efficient than the proposed algorithm, which can track the GP under partial shading conditions.

5. Conclusions

In this paper, a new CSA-PID algorithm is used to track the GP of the photovoltaic UP-S250 configuration, modulate the duty cycle of the converter, and improve the tracking speed of the original CSA under steady-state conditions and PSCs. The inputs of the CSA controller are the PV system voltage and current, while the output is the maximum voltage, which is subtracted from the DC-DC converter output voltage to send the difference to the PID controller and reduce the error percentage gained by CSA and enhances the system efficiency by providing the exact value of the converter duty cycle. The efficiency of the proposed control method is investigated and presented for three shading scenarios and the photovoltaic characteristics curves under partial shading conditions. The experimental results show that the algorithm can quickly and accurately respond to different partial shading conditions. This proposed CSA-PID method can track GP very accurately and quickly in comparison to the state-of-the-art methods, with a good dynamic and steady-state response in each type of environmental condition. Moreover, comparative studies of the Hybrid-MPPT with other rapidly converging techniques indicate that the proposed hybrid CSA-PID-based MPPT exhibits superior performance, such as a higher tracking speed and faster convergence towards the GP. Finally, the proposed CSA-PID has the highest efficiency and obtained almost 100% in both the simulation and experiment results.

Author Contributions

Conceptualization, I.A.-W., Z.F. and M.D.; methodology, I.A.-W. and H.M.H.F.; software, I.A.-W.; validation, H.M.H.F. and A.A.A.-S.; formal analysis, M.D.; investigation, A.M.A.-S. and T.K.; resources, Z.F.; data curation, I.A.-W.; writing—original draft preparation, I.A.-W., H.M.H.F. and A.A.A.-S.; writing—review and editing, I.A.-W., H.M.H.F. and A.A.A.-S.; visualization, T.K.; supervision, Z.F.; project administration, A.M.A.-S.; funding acquisition, A.M.A.-S. All authors have read and agreed to the published version of the manuscript.

Funding

This work was supported by the Researchers Supporting Project number (RSP-2021/337), King Saud University, Riyadh, Saudi Arabia.

Institutional Review Board Statement

Not applicable.

Informed Consent Statement

Not applicable.

Data Availability Statement

All of the data in this report come from the Hubei Key Laboratory of Advanced Control and Intelligent Automation for Complex Systems in China University of Geosciences, Wuhan 430074, China.

Acknowledgments

The authors would like to acknowledge the Researchers Supporting Project number (RSP-2021/337), King Saud University, Riyadh, Saudi Arabia and the National Natural Science Foundation of China under Grant 51707138.

Conflicts of Interest

The authors declare no conflict of interest.

References

  1. Council, G.W.E. Global Wind Statistics, 2017. Available online: https://gwec.net/wp-content/uploads/vip/GWEC_PRstats2017_EN-003_FINAL.pdf (accessed on 22 February 2022).
  2. Fekkak, B.; Menaa, M.; Boussahoua, B. Control oftransformerless grid-connected PV system using average models of power electronics converters with MATLAB/Simulink. Sol. Energy 2018, 173, 804–813. [Google Scholar] [CrossRef]
  3. Yaragatti, U.R.; Naik, A.; Shreesha, B.C. A novel method of fuzzy controlled maximum power point tracking in photovoltaic systems. In Proceedings of the 2005 IEEE International Conference on Industrial Technology, Hong Kong, China, 14–17 December 2005; pp. 1421–1426. [Google Scholar]
  4. Huang, Y.; Chen, X.; Ye, C. Research Article A Hybrid Maximum Power Point Tracking Approach for Photovoltaic Systems under Partial Shading Conditions Using a Modified Genetic Algorithm and the Firefly Algorithm. Int. J. Photoenergy 2018, 2018, 7598653. [Google Scholar] [CrossRef] [Green Version]
  5. Banu, I.V.; Beniug, R.Ă.; Istrate, M. Comparative Analysis of the Perturb-and-Observe and Incremental Conductance MPPT Methods. In Proceedings of the 2013 8th International Symposium on Advanced Topics in Electrical Engineering (ATEE), Bucharest, Romania, 23–25 May 2013; pp. 23–26. [Google Scholar]
  6. Hart, G.W.; Branz, H.M.; Cox, C.H. Experimental tests of open loop maximum-power-point tracking techniques. Sol. Cells 1984, 13, 185–195. [Google Scholar] [CrossRef]
  7. Belkaid, A.; Colak, I.; Kayisli, K. Implementation of a modifed P&O-MPPT algorithm adapted for varying solar radiation conditions. Electr. Eng. 2017, 99, 839–846. [Google Scholar]
  8. Safari, A.; Mekhilef, S. Simulation and hardware implementation of incremental conductance MPPT with direct control method using cuk converter. IEEE Trans. Ind. Electron. 2011, 58, 1154–1161. [Google Scholar] [CrossRef]
  9. Nabipour, M.; Razaz, M.; Seifossadat, S.G.; Mortazavi, S.S. A new MPPT scheme based on a novel fuzzy approach. Renew. Sustain. Energy Rev. 2017, 74, 1147–1169. [Google Scholar] [CrossRef]
  10. Ibrahim, A.W.; Ding, M.; Jin, X.; Dai, X.; Sarhan, M.A.; Shafik, M.B.; Zhou, H. Artificial neural network based maximum power point tracking for PV system. In Proceedings of the 2019 Chinese Control Conference (CCC), Guangzhou, China, 27–30 July 2019; pp. 6559–6564. [Google Scholar]
  11. Chaouachi, A.; Kamel, R.M.; Nagasaka, K. A novel multi-model neuro-fuzzy-based MPPT for three-phase grid-connected photovoltaic system. Sol. Energy 2010, 84, 2219–2229. [Google Scholar] [CrossRef]
  12. Al-Wesabi, I.; Fang, Z.; Wei, Z.; Dong, H. Direct Sliding Mode Control for Dynamic Instabilities in DC-Link Voltage of Standalone Photovoltaic Systems with a Small Capacitor. Electronics 2022, 11, 133. [Google Scholar] [CrossRef]
  13. Pradhan, R.; Subudhi, B. Double integral sliding mode MPPT control of a photovoltaic system. IEEE Trans. Control Syst. Technol. 2016, 24, 285–292. [Google Scholar] [CrossRef]
  14. De Brito, M.A.G.; Galotto, L.; Sampaio, L.P.; e Melo, G.A.; Canesin, C.A. Evaluation of the main MPPT techniques for photovoltaic applications. IEEE Trans. Ind. Electron. 2013, 60, 1156–1167. [Google Scholar] [CrossRef]
  15. Kollimalla, S.K.; Mishra, M.K. A novel adaptive P&O MPPT algorithm considering sudden changes in the irradiance. IEEE Trans. Energy Convers. 2014, 29, 602–610. [Google Scholar]
  16. Kakosimos, P.E.; Kladas, A.G. Implementation of photovoltaic array MPPT through fixed step predictive control technique. Renew Energy 2011, 36, 2508–2514. [Google Scholar] [CrossRef]
  17. Talbi, B.; Krim, F.; Rekioua, T.; Laib, A.; Feroura, H. Design and hardware validation of modifed P&O algorithm by fuzzy logic approach based on model predictive control for MPPT of PV systems. J. Renew Sustain. Energy 2017, 9, 043503. [Google Scholar]
  18. Kakosimos, P.E.; Kladas, A.G.; Manias, S.N. Fast photovoltaic system voltage-or current-oriented MPPT employing a predictive digital current-controlled converter. IEEE Trans. Ind. Electron. 2013, 60, 5673–5685. [Google Scholar] [CrossRef]
  19. Talbi, B.; Krim, F.; Rekioua, T.; Mekhilef, S.; Laib, A.; Belaout, A. A high-performance control scheme for photovoltaic pumping system under sudden irradiance and load changes. Sol. Energy 2018, 159, 353–368. [Google Scholar] [CrossRef]
  20. Laib, A.; Krim, F.; Talbi, B.; Sahli, A. A predictive control scheme for large-scale grid-connected PV system using high-level NPC inverter. Arab. J. Sci. Eng. 2020, 45, 1685–1701. [Google Scholar] [CrossRef]
  21. Bianconi, E.; Calvente, J.; Giral, R.; Mamarelis, E.; Petrone, G.; Ramos-Paja, C.A.; Spagnuolo, G.; Vitelli, M. A fast current based MPPT technique employing sliding mode control. IEEE Trans. Ind. Electron. 2013, 60, 1168–1178. [Google Scholar] [CrossRef]
  22. Mathi, D.K.; Chinthamalla, R. A hybrid global maximum power point tracking of partially shaded PV system under load variation by using adaptive salp swarm and differential evolution–perturb & observe technique. Energy Sources Part A Recovery Util. Environ. Eff. 2020, 43, 2471–2495. [Google Scholar]
  23. Mathi, D.K.; Chinthamalla, R. Global maximum power point tracking technique based on adaptive salp swarm algorithm and P&O techniques for a PV string under partially shaded conditions. Energy Sources Part A Recovery Util. Environ. Eff. 2020, 1–18. [Google Scholar] [CrossRef]
  24. Mathi, D.K.; Chinthamalla, R. A hybrid global maximum power point tracking method based on butterfly particle swarm optimization and perturb and observe algorithms for a photovoltaic system under partially shaded conditions. Int. Trans. Electr. Energy Syst. 2020, 30, e12543. [Google Scholar] [CrossRef]
  25. Liu, L.; Liu, C.; Wang, J.; Kong, Y. Simulation and hardware implementation of a hill-climbing modified fuzzy-logic for maximum power point tracking with direct control method using boost converter. J. Vib. Control 2015, 21, 335–342. [Google Scholar] [CrossRef]
  26. Liu, L. A Novel Combined Particle Swarm Optimization and Genetic Algorithm MPPT Control Method for Multiple Photovoltaic Arrays at Partial Shading. J. Energy Resour. Technol. 2013, 135, 012002. [Google Scholar] [CrossRef]
  27. Liu, L.; Liu, C.; Gao, H. A novel improved particle swarm optimization maximum power point tracking control method for photovoltaic array by using current calculated predicted arithmetic under partially shaded conditions. J. Renew. Sustain. Energy 2013, 5, 063139. [Google Scholar] [CrossRef]
  28. Ibrahim, A.W.; Shafik, M.B.; Ding, M.; Sarhan, M.A.; Fang, Z.; Alareqi, A.G.; Al-Rassas, A.M. PV maximum power-point tracking using modified particle swarm optimization under partial shading conditions. Chin. J. Electr. Eng. 2020, 6, 106–121. [Google Scholar] [CrossRef]
  29. Eltamaly, A.M.; Farh, H.M.; Abokhalil, A.G. A novel PSO strategy for improving dynamic change partial shading photovoltaic maximum power point tracker. Energy Sources Part A Recovery Util. Environ. Eff. 2020, 1–15. [Google Scholar] [CrossRef]
  30. Farh, H.M.; Eltamaly, A.M.; Ibrahim, A.B.; Othman, M.F.; Al–Saud, M.S. Dynamic global power extraction from partially shaded photovoltaic using deep recurrent neural network and improved PSO techniques. Int. Trans. Electr. Energy Syst. 2019, 29, e12061. [Google Scholar] [CrossRef]
  31. Sameh, M.A.; Badr, M.A.; Marei, M.I.; Attia, M.A. Enhancing the performance of photovoltaic systems under partial shading conditions using cuttlefish algorithm. In Proceedings of the 2019 8th International Conference on Renewable Energy Research and Applications (ICRERA), Brasov, Romania, 3–6 November 2019; pp. 874–885. [Google Scholar]
  32. Ahmed, J.; Salam, Z. A Maximum Power Point Tracking (MPPT) for PV system using Cuckoo Search with partial shading capability. Appl. Energy 2014, 119, 118–130. [Google Scholar] [CrossRef]
  33. Ljouad, T.; Amine, A.; Rziza, M. Author’s Accepted Manuscript A Hybrid Mobile Object Tracker Based on the Modified. Pattern Recognit. 2014, 47, 3597–3613. [Google Scholar] [CrossRef]
  34. Shlesinger, M.F.; Klafter, J. Lévy Walks Versus Lévy Flights; Springer: Dordrecht, The Netherlands, 1986. [Google Scholar]
  35. Yang, X.; Deb, S. Engineering Optimisation by Cuckoo Search. Int. J. Math. Model. Numer. Optim. 2010, 1, 330–343. [Google Scholar] [CrossRef]
  36. Yang, X.; Deb, S. Computers & Operations Research Multiobjective cuckoo search for design optimization. Comput. Oper. Res. 2013, 40, 1616–1624. [Google Scholar]
  37. Mantegna, R. Fast accurate algorithm for numerical simulation of levy stable stochastic processes. Phys. Rev. 1994, 49, 4677–4683. [Google Scholar] [CrossRef] [PubMed]
  38. Shi, J.-Y.; Xue, F.; Qin, Z.-J.; Zhang, W.; Ling, L.-T.; Yang, T. Improved Global Maximum Power Point Tracking for Photovoltaic System via Cuckoo Search under Partial Shaded Conditions. J. Power Electron. 2016, 16, 287–296. [Google Scholar] [CrossRef] [Green Version]
  39. Enany, M.A. Cuckoo search–based maximum power point tracking controller for PV water pumping system. J. Renew. Sustain. Energy 2017, 9, 063501. [Google Scholar] [CrossRef]
  40. Ibrahim, A.L.W.; Fang, Z.; Ameur, K.; Min, D.; Shafik, M.B.; Al-Muthanna, G. Comparative Study of Solar PV System Performance under Partial Shaded Condition Utilizing Different Control Approaches. Indian J. Sci. Technol. 2021, 14, 1864–1893. [Google Scholar] [CrossRef]
  41. Kalaam, R.N.; Muyeen, S.; Al-Durra, A.; Hasanien, H.M.; Al-Wahedi, K. Optimisation of controller parameters for grid-tied photovoltaic system at faulty network using artificial neural network-based cuckoo search algorithm. IET Renew. Power Gener. 2017, 11, 1517–1526. [Google Scholar] [CrossRef]
  42. Nugraha, D.A.; Lian, K.-L. A novel MPPT method based on cuckoo search algorithm and golden section search algorithm for partially shaded PV system. Can. J. Electr. Comput. Eng. 2019, 42, 173–182. [Google Scholar] [CrossRef]
  43. Alturki, F.A.; Al-Shamma’a, A.A.; Farh, H.M.H. Simulations and dSPACE Real-Time Implementation of Photovoltaic Global Maximum Power Extraction under Partial Shading. Sustainability 2020, 12, 3652. [Google Scholar] [CrossRef]
  44. Seyedmahmoudian, M.; Mekhilef, S.; Rahmani, R.; Yusof, R.; Renani, E.T. Analytical Modeling of Partially Shaded Photovoltaic Systems. Energies 2013, 6, 128–144. [Google Scholar] [CrossRef] [Green Version]
  45. Tahir, M.F.; Cheema, K.M.; Elavarasan, R.M. A Novel Algorithm for MPPT of an Isolated PV System Using Push Pull Converter with Fuzzy. Energies 2020, 13, 4007. [Google Scholar]
  46. Rajabioun, R. Cuckoo Optimization Algorithm. Appl. Soft Comput. J. 2011, 11, 5508–5518. [Google Scholar] [CrossRef]
  47. Yang, X.S.; Deb, S. Cuckoo search via Lévy flights. In Proceedings of the World Congress on Nature & Biologically Inspired Computing (NaBIC), Coimbatore, India, 9–11 December 2009; pp. 210–214. [Google Scholar]
  48. Miyatake, M. Maximum Power Point Tracking of Multiple Photovoltaic Arrays: A PSO Approach. IEEE Trans. Aerosp. Electron. Syst. 2011, 47, 367–380. [Google Scholar] [CrossRef]
  49. Liu, Y.; Huang, S.; Huang, J.; Liang, W. A Particle Swarm Optimization-Based Maximum Power Point Tracking Algorithm for PV Systems. IEEE Trans. Aerosp. Electron. Syst. 2012, 27, 1027–1035. [Google Scholar]
  50. Seyedmahmoudian, M.; Rahmani, R. Simulation and Hardware Implementation of New Maximum Power Point Tracking Technique for Partially Shaded PV System Using Hybrid DEPSO Method. IEEE Trans. Sustain. Energy 2015, 6, 850–862. [Google Scholar] [CrossRef]
  51. Kumar, N.; Ieee, M.; Hussain, I.; Singh, B.; Ieee, F. Rapid MPPT for Uniformly and Partial Shaded PV System by using JayaDE Algorithm in Highly Fluctuating Atmospheric Conditions. IEEE Trans. Ind. Inform. 2017, 3203, 2406–2416. [Google Scholar] [CrossRef]
  52. Mohanty, S.; Subudhi, B.; Member, S.; Ray, P.K. A Grey Wolf Assisted Perturb & Observe MPPT Algorithm for a PV System. IEEE Trans. Energy Convers. 2016, 8969, 340–347. [Google Scholar]
  53. Seyedmahmoudian, M.; Horan, B.; Rahmani, R.; Maung, A.; Oo, T. Efficient Photovoltaic System Maximum Power Point. Energies 2016, 9, 147. [Google Scholar] [CrossRef]
  54. Seyedmahmoudian, M.; Soon, T.K.; Horan, B. New ARMO-based MPPT Technique to Minimize Tracking Time and Fluctuation at Output of PV Systems under Rapidly Changing Shading Conditions. IEEE Trans. Ind. Inform. 2019, 3203, 1–12. [Google Scholar] [CrossRef]
Figure 1. PV cell equivalent circuit.
Energies 15 02513 g001
Figure 2. The schematic diagram of proposed PV system.
Energies 15 02513 g002
Figure 3. Equivalent circuit diagram of two PV modules connected in series.
Energies 15 02513 g003
Figure 4. Output P–V characteristic curves under different shadow distribution cases under study.
Energies 15 02513 g004
Figure 5. Lévy flight random walk in a two-dimensional plane.
Energies 15 02513 g005
Figure 6. Flowchart of Cuckoo Search Algorithm.
Energies 15 02513 g006
Figure 7. CSA MPPT with closed-loop PID Controller.
Energies 15 02513 g007
Figure 8. Modeled components of the proposed system.
Energies 15 02513 g008
Figure 9. Details of actual power and proposed CSA-PID power under STC. (a) PV curve under STC (1000 W/m2 and 25 °C). (b) The output power of proposed CSA-PID under STC.
Energies 15 02513 g009
Figure 10. Details of actual power and proposed CSA-PID power under PSCs. (a) PV curve at PSCs (1 kW/m2, 0.6 kW/m2, 0.4 kW/m2, and 19 °C). (b) The output power of proposed CSA-PID under PSCs.
Energies 15 02513 g010
Figure 11. Shading patterns for scenario one.
Energies 15 02513 g011
Figure 12. PV characteristics curve for scenario one.
Energies 15 02513 g012
Figure 13. Details of the duty cycle and power of proposed CSA-PID, CSA, MPSO, PSO, and MP&O controllers under scenario one. (a) The output power of proposed CSA-PID, CSA, MPSO, PSO, and MP&O. (b) The output duty cycle of proposed CSA-PID, CSA, MPSO, PSO, and MP&O.
Energies 15 02513 g013
Figure 14. Shading patterns for scenario two.
Energies 15 02513 g014
Figure 15. PV characteristics curve for scenario two.
Energies 15 02513 g015
Figure 16. Details of duty cycle and power for proposed CSA-PID, CSA, MPSO, PSO, and MP&O controllers under scenario two. (a) The output power of proposed CSA-PID, CSA, MPSO, PSO, and MP&O. (b) The output duty cycle of proposed CSA-PID, CSA, MPSO, PSO, and MP&O.
Energies 15 02513 g016
Figure 17. Shading patterns for scenario three.
Energies 15 02513 g017
Figure 18. PV characteristics curve for scenario three.
Energies 15 02513 g018
Figure 19. Details of duty cycle and power of proposed CSA-PID, CSA, MPSO, PSO, and MP&O controllers under scenario three. (a) The output power of proposed CSA-PID, CSA, MPSO, PSO, and MP&O. (b) The output duty cycle of proposed CSA-PID, CSA, MPSO, PSO, and MP&O.
Energies 15 02513 g019
Figure 20. Hardware-in-the-loop experiment hardware configuration.
Energies 15 02513 g020
Figure 21. Experimental results for UP-S250 configuration for extreme, rapidly changing insolation scenarios: (a) Hybrid CSA-PID; (b) CSA; (c) MPSO; (d) PSO; (e) MP&O.
Energies 15 02513 g021aEnergies 15 02513 g021b
Table 1. UP-S250 PV module electrical parameters.
ParametersTitle 3
Maximum Power (Pm)250 W
Open–circuit Voltage (Voc)36.0 V
Short–circuit Current (Isc)8.56 A
Maximum Power Voltage (Vmmp)30.2 V
Maximum Power Current (Immp)8.28 A
Number of Series Modules (Ns)10
Number of Parallel Modules (Np)2
Table 2. The maximum power point under different shadow distribution cases.
Shading DistributionUnshaded (0:0)Case1 (4:0):
GMPP at End
Case2 (6:3):
GMPP at Middle
Case3 (3:3):
GMPP at Beginning
Pm (kW)4.563.272.273.15
Vm (V)292.9293.8206.35203.65
Table 3. PID coefficients tuned parameters.
Control ParametersTuned
KP0.0059
Ki100.007
Kd8.74 × 10−9
Table 4. PID performance and robustness.
Control ParametersTuned
Rise Time (s)4.57 × 10⁻⁵
Settling Time (s)0.000146
Overshoot (%)8.99
Peak1.09
Table 5. Partial shading distributions of each scenario from the PV curves.
ScenarioModuleIrradiationMax. Power
Scenario 11–4, 11–1410002285.09
5, 6, 7, 15, 16, 176002250.82
8, 9, 10, 18, 19, 204001963.30
Scenario 21–5, 11–203501445.23
6, 7, 8, 9, 109001600.11
Scenario 31–5, 11–1512003300.01
6–10, 16–206003000.33
Table 6. Power, duty cycle tracking time, and the efficiency values comparison between the actual values of CSA-PID, CSA, MPSO, PSO, and MP&O.
Shading Scenario and Max. Power from P-V CurveTracking MethodActual Power (W)Duty CycleConvergence Time (s)% Tracking Efficiency
Scenario 1 (2285.09 W)CSA-PID2285.090.53830.28100
CSA2274.60.38420.6399.54
MPSO2283.80.61660.199.94
PSO2284.680.52522.399.98
MP&O2283.50.51950.399.93
Scenario 2 (1600.11 W)CSA-PID15980.38780.7199.99
CSA1590.10.61650.899.53
MPSO1580.30.34290.9299.386
PSO1596.80.38320.498.666
MP&O1258.10.51982.3297.496
Scenario 3 (3300.01 W)CSA-PID15980.38780.7199.99
CSA1590.10.61650.899.53
MPSO1580.30.34290.9299.386
PSO1596.80.38320.498.666
MP&O1258.10.51982.3297.496
Table 7. Performance evaluation of proposed CSA-PID with other MPPT methods for UP-S250 configuration.
Shading Scenario and Max. Power from P-V CurveTracking MethodPower (W)Convergence Time (s)% Tracking Efficiency
Scenario 1 (2285.09 W)CSA-PID2286.090.5100
CSA2274.60.7699.54
MPSO2283.81.0099.94
PSO2250.683.598.49
MP&O2190.51.8995.86
Scenario 2 (1600.11 W)CSA-PID15980.5199.99
CSA1590.730.9899.53
MPSO1588.30.9299.386
PSO1576.83.2398.666
MP&O1558.10.9397.496
Scenario 3 (3300.01 W)CSA-PID3299.60.599.97
CSA3285.91.399.57
MPSO3290.41.2199.708
PSO3230.83.5697.90
MP&O3089.32.1993.61
Scenario 4 (2100.66 W)CSA-PID2100.60.45100
CSA20961.5699.778
MPSO2086.90.89999.34
PSO2043.972.8997.301
MP&O2028.22.396.55
Scenario 5 (1903.6 W)CSA-PID1903.10.3299.97
CSA1902.42.0199.93
MPSO1890.31.2299.30
PSO18593.1097.657
MP&O1831.52.4696.212
Table 8. Comparison of the proposed technique with other MPPT methods.
Evaluated Parameter[48,49][50,51][52,53][54][32]InCProposed
CSA-PID
GMPP tracking capabilityYesYesYesYesYesNoYes
SimplicityMediumMediumMediumSimpleSimpleSimpleSimple
EfficiencyHighHighHighHighHighLowVery High
Tracking speedMediumMediumMediumMediumHighHighVery High
Steady-state oscillationNoNoNoNoNoYesNo
Initial location dependencyYesNoYesNoNoYesNo
ReliabilityMediumMediumMediumMediumHighLowVery High
Publisher’s Note: MDPI stays neutral with regard to jurisdictional claims in published maps and institutional affiliations.

