Article

Mitigating Capacity Decay by Adding Carbohydrate in the Negative Electrolyte of Vanadium Redox Flow Battery

1
School of Resource and Environmental Engineering, Wuhan University of Science and Technology, Wuhan 430081, China
2
State Environmental Protection Key Laboratory of Mineral Metallurgical Resources Utilization and Pollution Control, Wuhan University of Science and Technology, Wuhan 430081, China
3
Collaborative Innovation Center of Strategic Vanadium Resources Utilization, Wuhan University of Science and Technology, Wuhan 430081, China
4
Hubei Provincial Engineering Technology Research Center of High Efficient Cleaning Utilization for Shale Vanadium Resource, Wuhan University of Science and Technology, Wuhan 430081, China
5
School of Resource and Environmental Engineering, Wuhan University of Technology, Wuhan 430070, China
*
Author to whom correspondence should be addressed.
Energies 2022, 15(7), 2454; https://doi.org/10.3390/en15072454
Submission received: 21 February 2022 / Revised: 14 March 2022 / Accepted: 21 March 2022 / Published: 27 March 2022

Abstract

:
Glucose, sucrose, D(+)-xylose and α-lactose monohydrate are selected as additives relative to the negative electrolyte of Vanadium Redox Flow Battery (VRFB), with the aim of reducing vanadium permeation and improving electrochemical performance to mitigate capacity decay. The results of a charge–discharge test show that the cell with α-Lactose monohydrate in the negative electrolyte exhibits the best capacity retention. The capacity retention of a single cell employing 1 wt% α-Lactose monohydrate in the negative electrolyte was 71% after 30 cycles, which is 41.5% higher than 29.5% of the control group. Correspondingly, adding α-Lactose monohydrate into the negative electrolyte also significantly inhibits vanadium crossover and water transfer. Furthermore, the effects of additives on the performance of the negative electrolyte are studied by thermal stability experiments, cyclic voltammetry (CV) and electrochemical impedance spectroscopy (EIS). The stability experiments indicate that the introduction of 1 wt% α-Lactose monohydrate can elevate the stability of the negative electrolyte at low temperatures. The electrochemical measurements indicate that V(III) electrolyte with 1 wt% α-Lactose monohydrate obtains superior electrochemical activity and reversibility, which can be ascribed to the fact that the hydroxyl group carried by the additive provides more active sites for the redox reaction. Herein, the study provides a meaningful reference for mitigating the capacity decay of VRFB.

1. Introduction

Natural renewable energy sources, such as solar and wind, have gained increasing attention and are being utilized to replace dwindling fossil fuels to alleviate the pressure to combat environmental pollution [1,2]. However, the instability and intermittency of renewable energy sources make it difficult to integrate them directly into grid applications. Therefore, researchers had developed large-scale energy storage systems as an intermediate bridge to convert them reciprocally with electrical energy [3]. Proposed by Skyllas-Kazacos [4] in the 1980s, VRFB has received widespread attention and systematic research due to its independent power and capacity, long cycle life and high safety performance [5,6]. In addition, VRFB, using the same element in both half-cells, thereby reduces the problem of cross-contamination as much as possible, which differs from the chemistry of first-generation iron-chromium flow batteries with heterogeneous elements [6]. However, the significant capacity degradation of VRFB and its poor electrochemical performance during long-term operation shorten its cycle life and hinder its rapid commercialization [7,8].
Thus far, it has been found that the asymmetric transfer of vanadium ions on the cation/proton exchange membrane and its accompanying side reactions cause concentration imbalance and valence imbalance of active substances in the positive and negative electrolytes, resulting in a gradual decline of battery capacity [9]. Anion exchange membranes have a better ability to stop vanadium ions from crossing the membrane, but their poor electrical conductivity and stability still cause battery capacity loss [10]. In addition, electrolytes with poor electrochemical activity have a low vanadium ion utilization, which can bring about the loss of actual battery capacity [11]. Existing studies have reported that the capacity loss of VRFB can only be alleviated, but not completely eliminated. The strategies to deal with the capacity loss for VRFB are mainly based on the following three aspects: first, remixing the overly imbalanced positive and negative electrolytes directly [12,13] or rebalancing the valence state of vanadium in the electrolyte by reducing the oxidized active material [14,15] when the capacity loss reaches a certain level; second, inhibiting vanadium ions and water molecules through the ion exchange membrane to suppress the imbalanced of the positive and negative electrolytes [16,17]; third, improving the electrochemical activity and reversibility of the electrolyte and the electrode active specific surface to enhance the utilization of the active material and cell efficiency [18,19].
Zhang et al. [13] chose the appropriate current density and runtime to mix the electrolyte; thus, the cycle number of VRFB in this system increased from 145 to 598, but the problem of low capacity retention cannot be avoided by remixing the imbalanced electrolyte. In addition, the method of reducing the oxidized active material poses other problems, including the introduction of additional impurities and the hydrogen evolution in long-term operation [20]. Therefore, several researchers had attempted to modify membranes [21,22] and prepared membranes with high ion selectivity [23] to reduce vanadium ions transfer for mitigating capacity decay. On the basis of membrane modification, adding a soluble draw solute [17], which can narrow the osmotic pressure of the electrolyte on both sides during the cell operation into the negative electrolyte, also markedly reduced the crossover of vanadium ions. The charge capacity decay of the battery was suppressed from 60.7% to 27.5% within 55 h by adding the solute, but the solute seemed to have an adverse effect on the electrochemical performance of the electrolyte. However, the method provided a research idea to inhibit vanadium ions to cross the membrane to mitigate the capacity decay of VRFB.
To improve the electrochemical performance of the battery, the researchers treated graphite-felt electrodes by introducing oxygen-containing and nitrogen-containing functional groups on the electrode surface to enhance the kinetics of redox reactions in VFBR [24,25]. The modification of the electrodes improves vanadium ion utilization and then increases the actual charge and discharge capacity of the battery. However, the limitations of vanadium ion wettability on the electrode surface and vanadium ion diffusion ability lead to low interfacial activity between electrolyte and electrode, which still hinders the further increase in battery capacity. To increase the interfacial activity and contact area between electrolyte and electrode, hydrophilic functional groups such as -NH2/-SO3H/-OH/-COOH/=O were introduced into the electrolyte [26,27,28,29,30]. The addition of these additives provided more active sites for electrode reactions to enhance battery capacity and the additives could complex with vanadium ions to enhance the solubility and stability of the electrolyte. Therefore, adding appropriate additives to increase the osmotic pressure of the negative electrolyte and introduce beneficial functional groups to the negative electrolyte is a meaningful approach to mitigate the capacity decay of VRFB.
Carbohydrates, have been proved to improve the electrochemical performance of electrolytes due to their large number of oxygen-containing hydroxyl functional groups [29]. Moreover, in the field of medicine and biology, the ability of carbohydrates to regulate osmotic pressure is often mentioned [31]. In order to mitigate the capacity decay of VRFB from the perspective of the electrochemical performance and vanadium permeation, four carbohydrates including two kinds of monosaccharide (glucose and D(+)-xylose) and two types of disaccharide (sucrose and α-Lactose monohydrate) were selected for this study. The effects of the four additives on the electrochemical performance of negative electrolytes and vanadium ion permeation across membranes and battery capacity were comparatively investigated.

2. Experimental

2.1. Preparation of Electrolyte

The original V(IV) electrolytes containing 1.8 M V(IV) sulfate and 3.0 M H2SO4 were prepared by dissolving VOSO4 (99.9% purity, Panzhihua Iron and Steel Research Institute Co., Ltd., Panzhihua, China) into sulfuric acid. The V(III) electrolyte was prepared by placing the same concentration and volume of the V(IV) electrolyte in a two-chamber electrolytic cell, and then obtaining the V(III) electrolyte on the negative side. The V(II) electrolyte was prepared by placing the same volume of V(IV) electrolyte on the positive side and V(III) electrolyte on the negative side in the two-compartment electrolysis cell, and then the V(II) electrolyte was obtained on the negative side. The termination of the electrolytic reaction and valence state of vanadium ions that existed in the electrolyte were determined by UV-Vis spectrometry analysis. The concentration of total vanadium ions in the electrolyte was measured by chemical titration, and ammonium ferrous sulfate solution was used as a standard titration solution. The electrolyte containing additives was obtained by adding glucose, sucrose, D(+)-xylose and α-Lactose monohydrate at a concentration of 1 wt% (mass percentage of the additive to V(III) electrolyte) into the V(III) electrolyte, respectively.

2.2. Thermal Stability Experiments of V(III) Electrolyte

The prepared V(III) electrolytes containing 1.8 M V(III) sulfate and 3 M H2SO4 without and with different additives were sealed, respectively, into two 10 mL silica glass battles and statically deposited in the thermostatic water bath at 25 °C and low-temperature refrigeration thermostat at −20 °C. The above electrolytes were examined periodically, and the time when visible precipitation occurred was recorded.

2.3. Electrochemical Measurements

To ascertain the effects of negative electrolytes with the additives on the electrochemical performance, the electrochemical measurements were conducted with a CHI660E electrochemical workstation (Shanghai Chenhua Instrument Co. Ltd., Shanghai, China) in a three-electrode system at room temperature. The three-electrode system included a graphite electrode (1 cm × 1cm) as a working electrode, a platinum sheet electrode (1.5 cm × 1.5 cm) as a counter electrode and a saturated calomel electrode (SCE) accompanied by a salt bridge filled with saturated KCl solution as the reference electrode. Cyclic voltammetry (CV) measurements of negative electrolytes were tested with a voltage range of −0.2~−0.8 V and a scan rate of 20 mV s−1. Before the test, the graphite electrode needed to be polished carefully and then ultrasonically cleaned in ethanol and deionized water in sequence for 10 min to avoid the effect of ions attached to the electrode surface. Electrochemical impedance spectroscopy (EIS) was also measured on a CHI660E electrochemical workstation. The sinusoidal excitation voltage of 5 mV was exerted to the cells with a frequency range between 1 Hz and 105 Hz, and the relevant parameters of EIS were obtained by fitting the test results using a simplified equivalent circuit model.

2.4. Charge–Discharge Test

The charge–discharge tests were conducted in a VRFB single dynamic cell with two liquid storage tanks, and the key material of the cell consisted of two graphite felt electrodes (Dongguan Zhisheng Chemical Co., Ltd., Dongguan, China) and a proton exchange membrane (Nafion 117, DuPont, Suzhou, China) sandwiched between two electrodes. The area of the electrode is 25 cm2. The volume of the electrolyte on both sides was set to 30 mL and the prepared V(IV) and V(III) electrolyte served, respectively, as a positive electrolyte and negative electrolyte initially, which were conserved in two glass containers and were pumped persistently into the anode and cathode side, respectively, by two peristaltic pumps (DlPump550, Kamoer Fluild Tech Co., Ltd., Shanghai, China) under the flow rate of 60 mL min−1. The tests of cell performance were carried out on CT2001B-5V/10A battery test system (Wuhan Land Co. Ltd., Wuhan, China) at a constant current density of 40 mA cm−1, and the voltage range from 0.65 to 1.65 V.

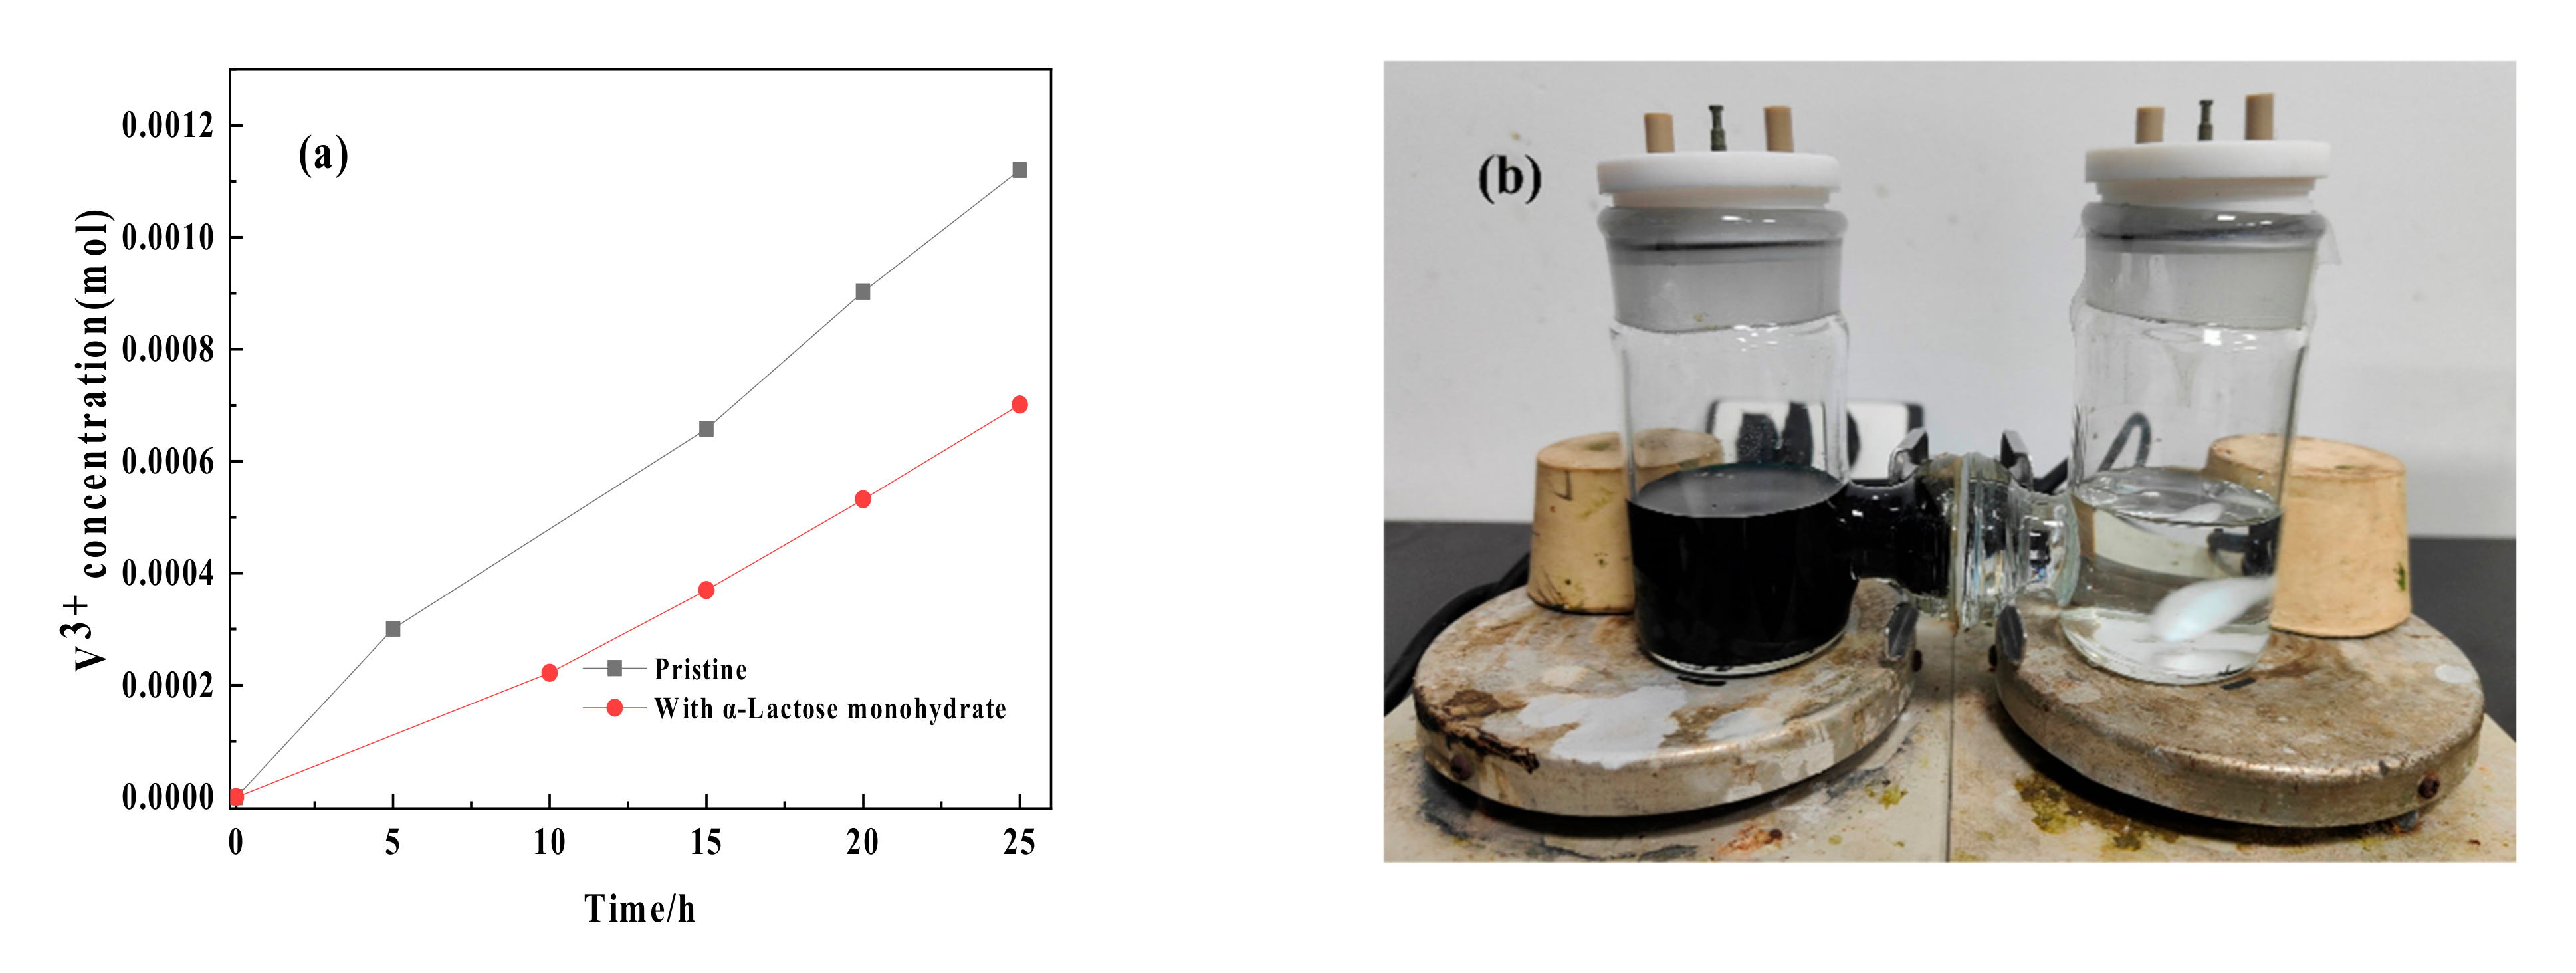
2.5. Vanadium Permeation Measurements

The amount of vanadium ions permeation was measured by using a two-compartment diffusion units separated by a proton exchange membrane (2.83 cm2, Nafion 117, DuPont, Suzhou, China). Before the test, one side of the unit was filled with 1.8 M V(III) sulfate in 3 M H2SO4 solution with or without additives, while another side was filled with a mixed solution of 1.8 M MgSO4 and 3 M H2SO4 for balancing the cation concentration, the volume of the solution on each side is 70 mL. The diffusion experiment was carried out by employing magnetic stirring apparatus stirring continuously both solutions of the unit to avoid concentration polarization. A sample from the side containing MgSO4 was taken periodically and the concentration of vanadium was determined by chemical titration, which employed ammonium ferrous sulfate solution as a standard titration solution. At the same time, aliquots of the solution were taken from both the vanadium-rich side and the receiving side at specified intervals to minimize osmotic effects.

2.6. Characterization

The UV-Vis spectrometry of the prepared V(III) electrolyte with and without additive was analyzed on a UNIC 4802S UV-Vis spectrophotometer (Shanghai, China) with the range of 190–1100 nm using 1.0 cm glass cells. H2SO4 measuring 3 M was selected as the referenced sample during the test. Furthermore, the V(IV) concentration of positive electrolyte after 30 cycles was worked out by the standard curve via absorbance measured by an ultraviolet spectrophotometer. The standard curve is shown in Figure 1.
The Raman spectroscopy of V(III) electrolytes with and without additives was conducted using a Labram-010 spectrophotometer, which was excited by using He-Ne Raman Renishaw image microscope (632.8 nm, 12798 cm−1, red), which provides a powerful monochromatic beam.
FT-IR (Fourier transform infrared spectroscopy) spectra of the graphite felt electrodes were measured at room temperature with vertex 70X Fourier transform spectrometer, and the absorption frequency range was 400–4000 cm−1. The potassium bromide tablet method was used to prepare samples.
The apparent morphology and elemental analysis of the graphite felt electrode obtained from charge–discharge tests were characterized with the scanning electron microscope (SEM) and energy dispersive spectrometer (EDS) tests (JEOL, JSM-6610, Japan) at an acceleration voltage of 20 KV.

3. Results and Discussion

3.1. Thermal Stability of the Electrolyte

To verify whether the addition of four carbohydrates would affect the stability of the negative electrolyte, 1.8 M V(II) ions and 1.8 M V(III) ions in 3 M sulfuric acid with and without additives were, respectively, placed and sealed in a temperature-controlled container at 25 °C and −20 °C. The time of visible precipitation formation is displayed in Table 1.
As demonstrated, the V(II) electrolyte with and without additives formed crystallization in a short time, while the V(III) electrolyte remained stable at −20 °C for 30 days. That meant that V(II) electrolytes are relatively less stable at low temperatures, which was related to the fact that V(II) requires fewer ions to form polymeric precipitation compared with V(III) [32]. Moreover, the V(II) electrolyte and V(III) electrolyte could all keep stable at 25 °C for 30 days. It could be found that the stability of the V(II) electrolyte with four additives was improved compared to the original electrolyte. The prolongation of the stability time of V(II) electrolyte could be explained by the fact that the hydroxyl and carbonyl groups in carbohydrate additives adhere to the surface of the nuclei to disperse V(II) ions by electrostatic repulsion, which could retard the polymerization of V(II) ions and the formation of crystals [33]. In contrast, the stability of the V(II) electrolytes containing disaccharide was better than that of the V(II) electrolytes containing monosaccharide at −20 °C, which may be due to the larger spatial structure of the disaccharide molecules, which is easier to disperse the V(II) ions complexed with them. Among them, the stability time of the V(II) electrolyte with α-lactose monohydrate was 15 h longer than that of the pristine sample, which indicates the best microthermal stability.

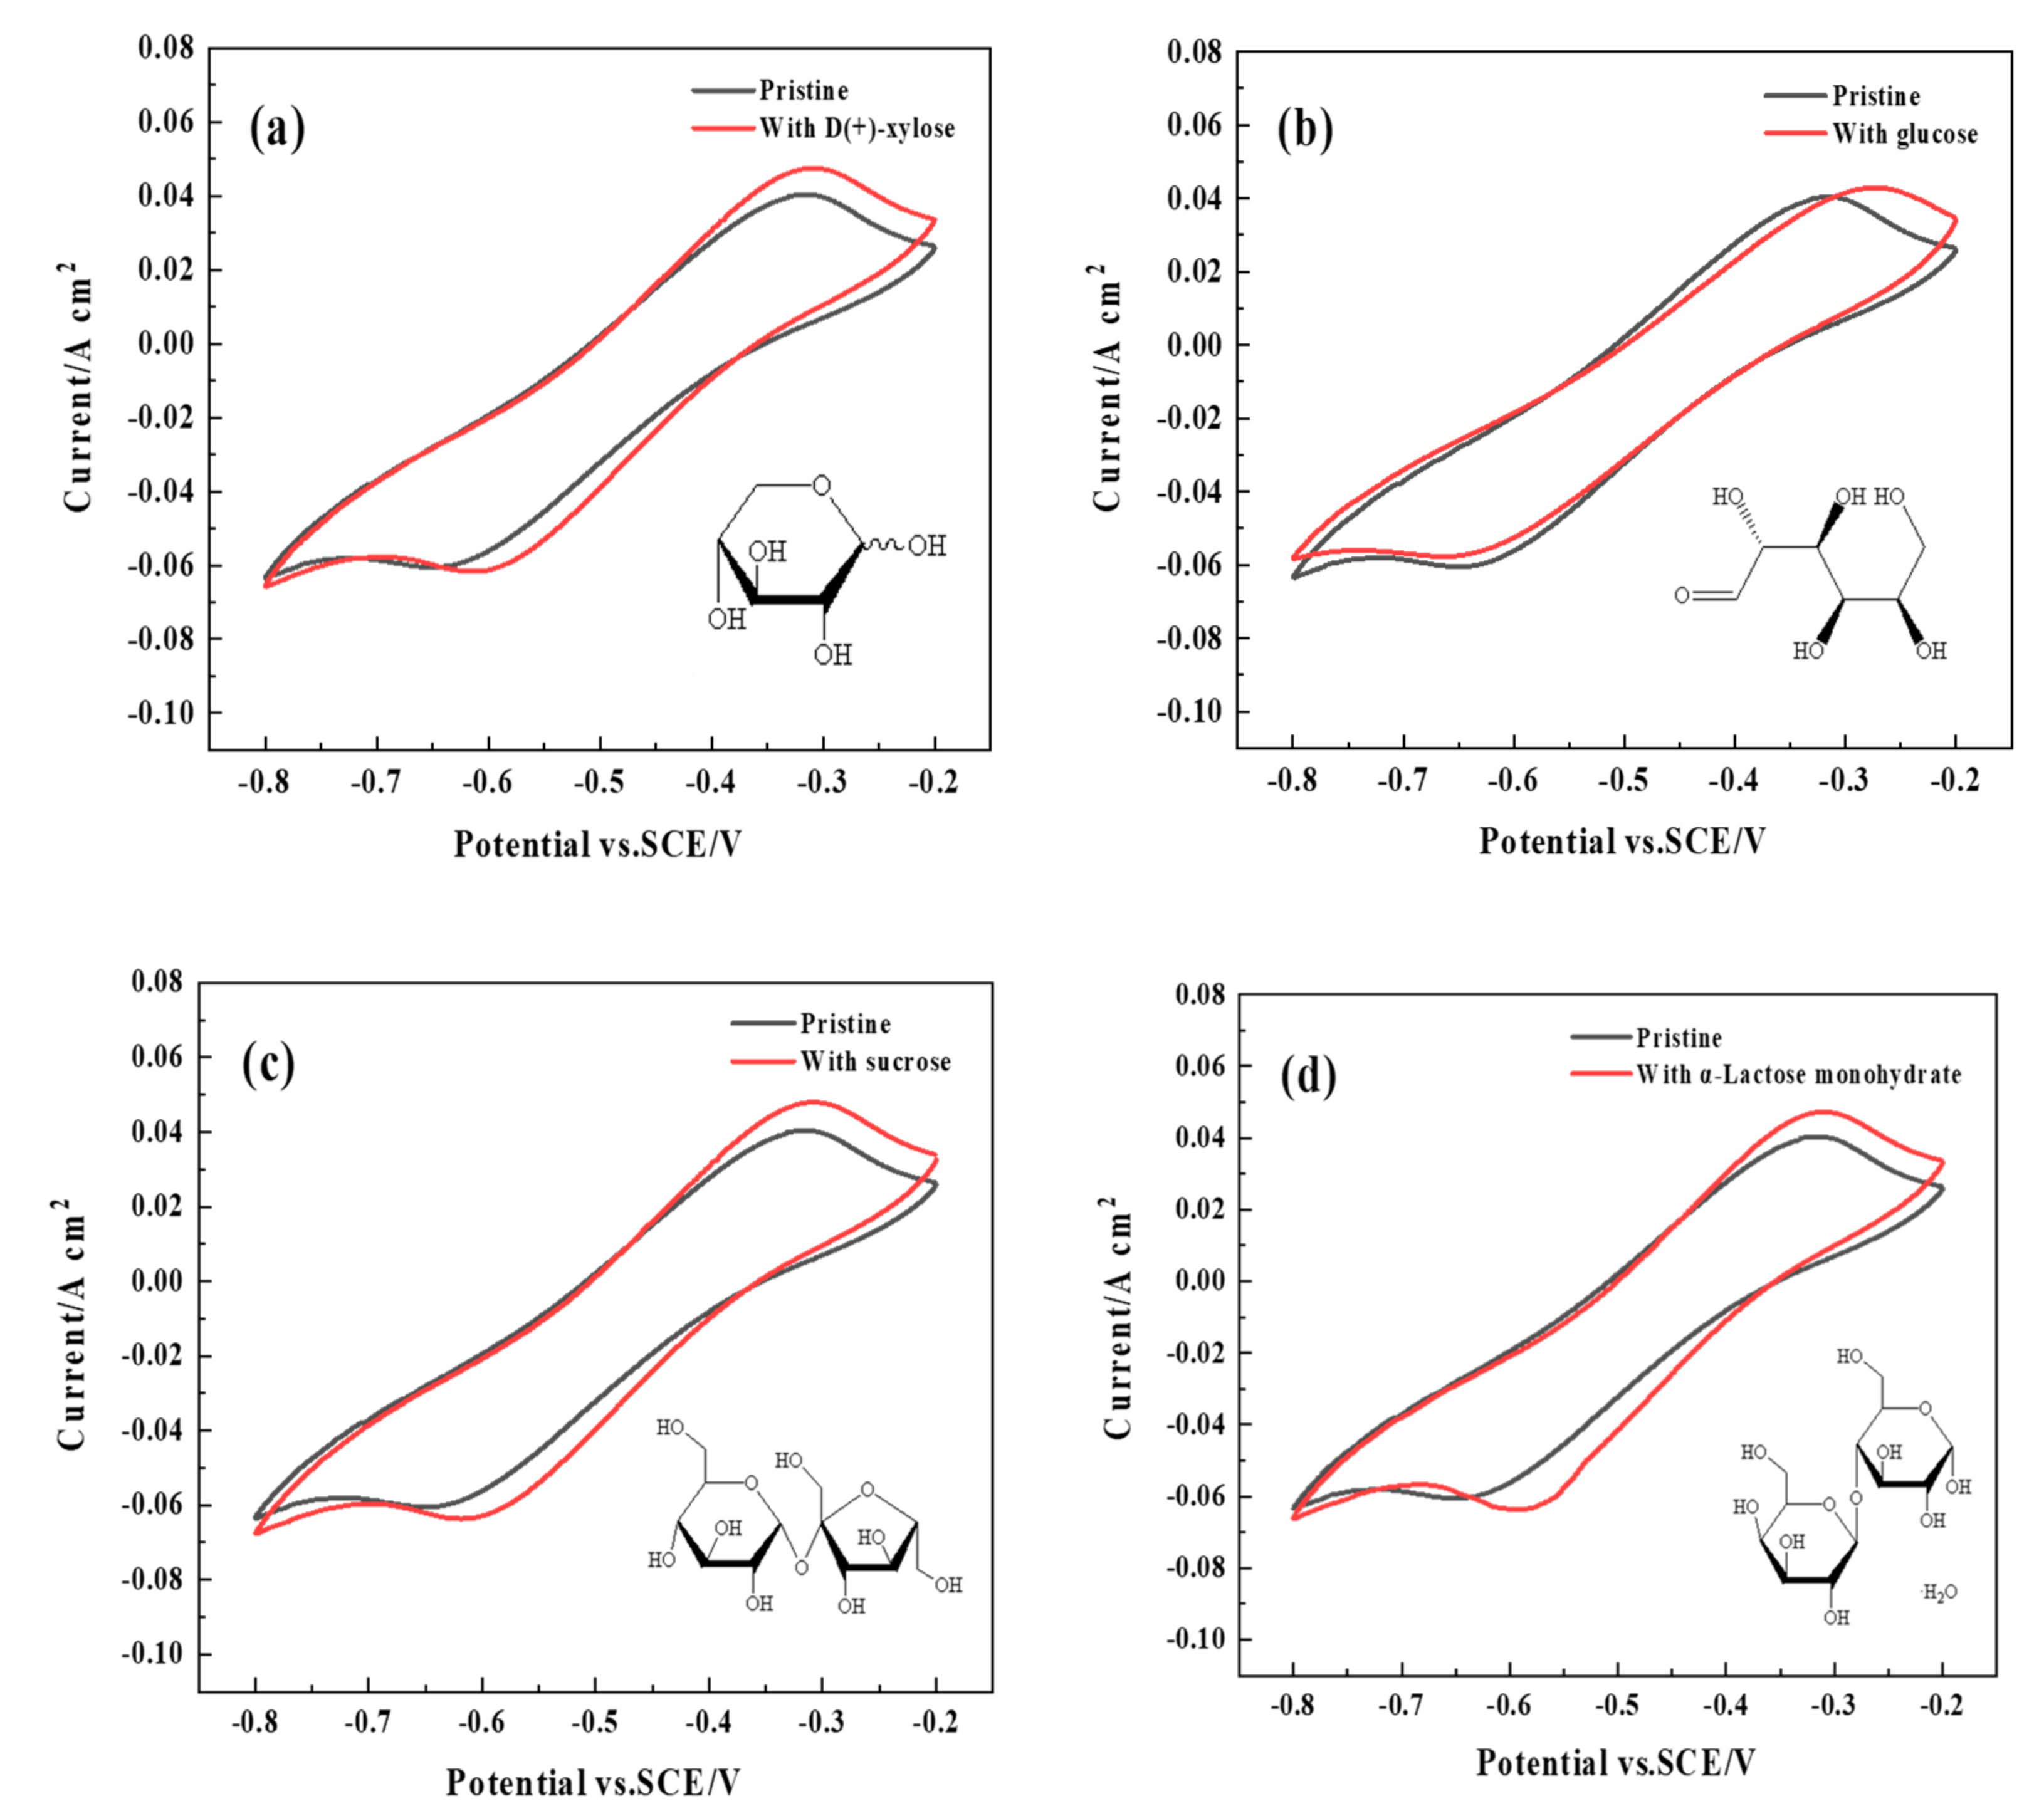
3.2. Cyclic Voltammetry

To obtain a deeper insight into the effect of four carbohydrate additives in the V(III) electrolytes containing 1.8 M V(III) sulfate and 3 M H2SO4 on the electrochemical performance, some comparative experiments were performed. Cyclic voltammetry (CV) tests with and without 1 wt% four carbohydrate additives were conducted, and the result of CV tests are displayed in Figure 2. Table 2 presents the main related parameter results of CV for describing in detail the effects of different carbohydrate additives on the V(III) electrolyte. As demonstrated in Figure 2, anodic peaks and cathodic peaks related to the oxidation and reduction in V2+/V3+ were detected at approximately −0.3 V and −0.65 V.
The test results show that the addition of carbohydrates increased the peak current of V(III) electrolytes, implying that electrochemical activity improved, especially for V(III) electrolytes with sucrose and α-Lactose monohydrate. Apparently, the electrolyte with α-Lactose monohydrate performed the best electrochemical behavior, the oxidation peak current increased by 15.5%, and the reduction peak current increased by 9.3%. Meanwhile, the peak current ratio is closest to 1, and the peak potential separation (ΔEp) reaches a minimum of 288 mV. From Figure 2b and Table 2, the oxidation peak current of the V(III) electrolytes decreased after adding glucose, which indicated that the aldehyde groups had a negative effect on the electrochemical properties. By comparing Figure 2a, Figure 2c, and Figure 2d, it was clear that the α-Lactose monohydrate and sucrose with disaccharide structure were more conducive than glucose with the monosaccharide structure relative to electron transfer. The result was probably due to the fact that the above disaccharide can accommodate more vanadium ions to complex with hydroxyl groups, and these hydroxyl groups could be adsorbed on electrode surfaces to provide more active sites for the redox reaction of V2+/V3+ under the same quality conditions, especially for α-Lactose monohydrate. The corresponding mechanism needs to be further investigated.

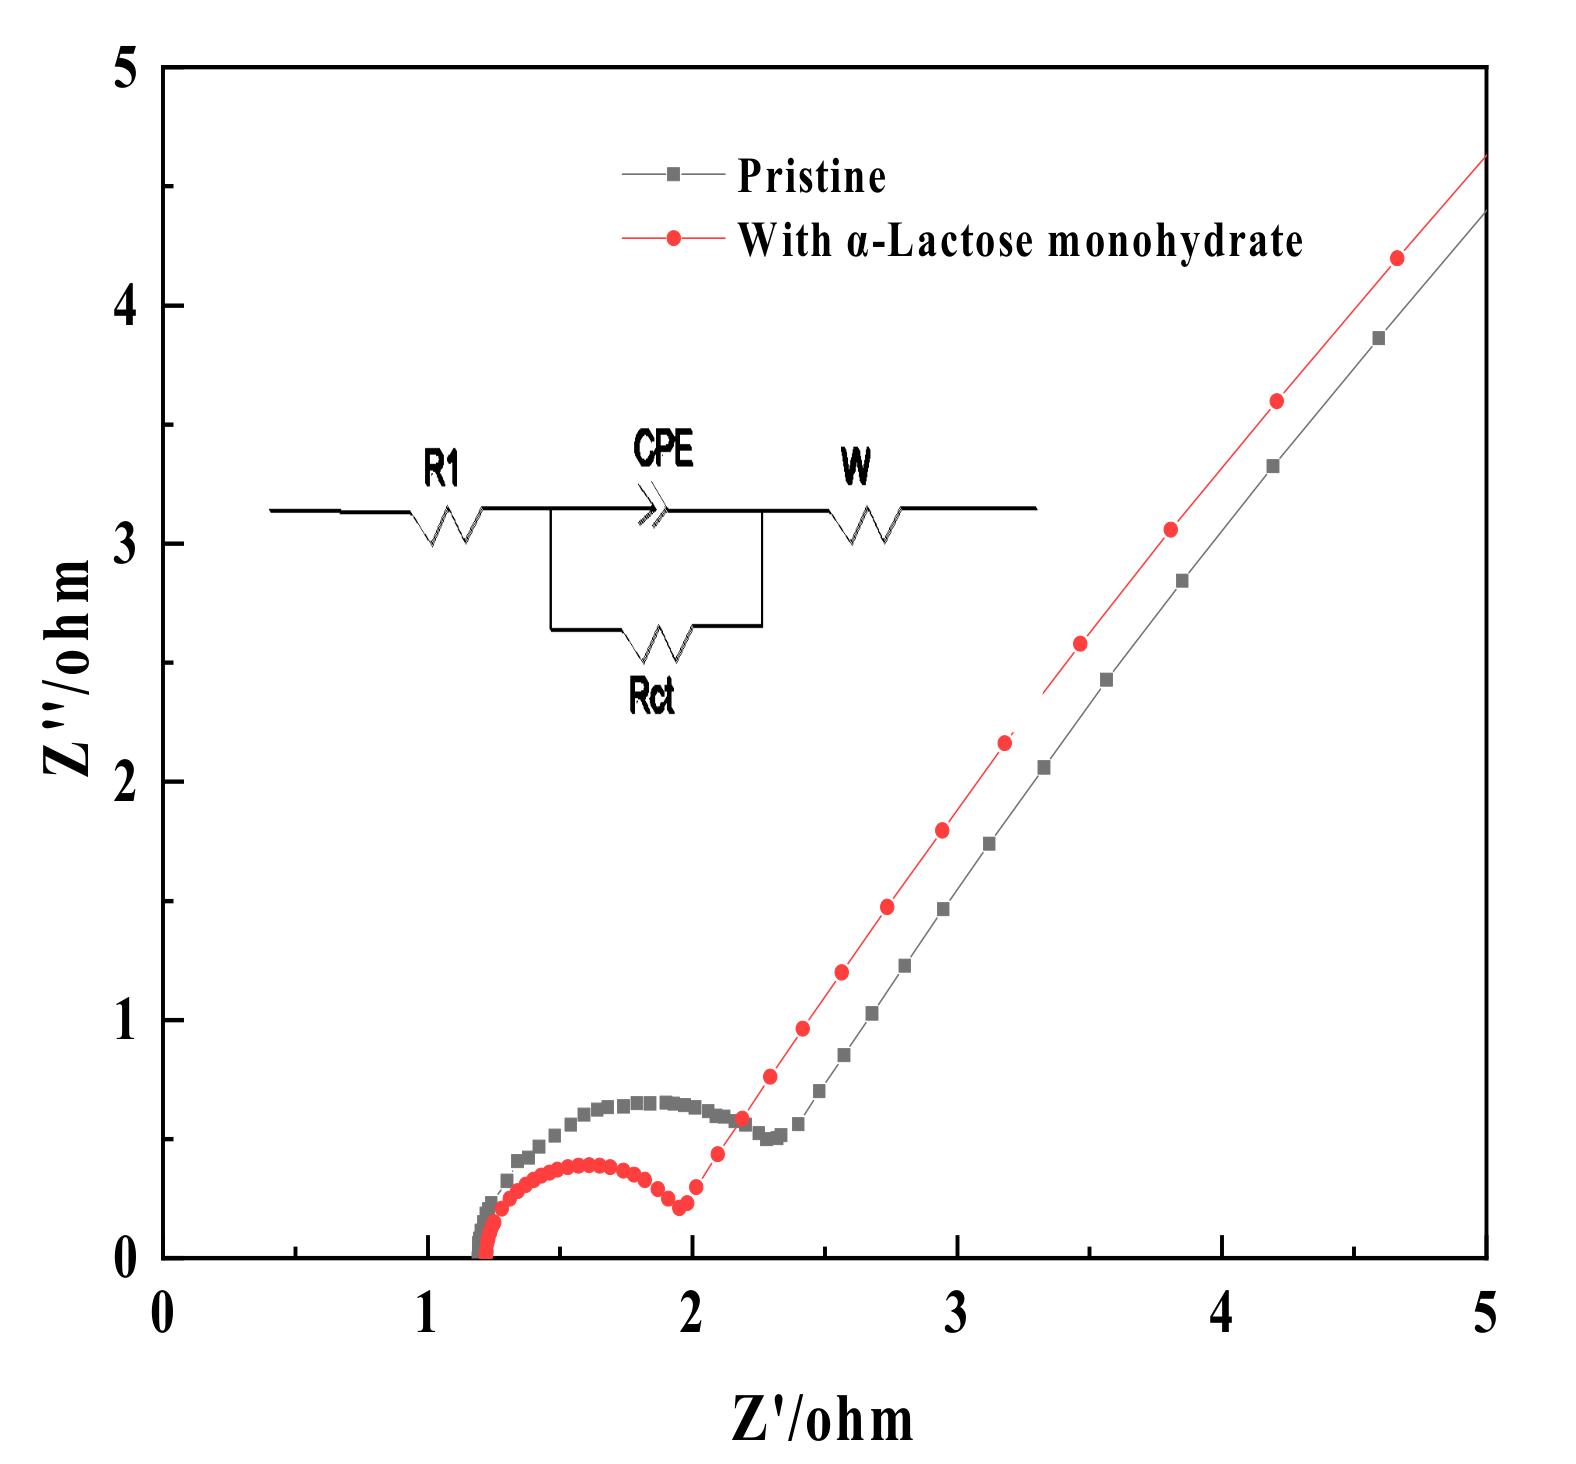
3.3. Electrochemical Impedance Spectroscopy

EIS was used to further analyze the effect of the α-Lactose monohydrate on the electrochemical performance of the V(III) electrolyte containing 1.8 M V(III) sulfate and 3 M H2SO4, and the corresponding Nyquist plots are exhibited in Figure 3.
As exhibited in Figure 3, each plot comprised a depressed semicircle in the high-frequency region and a straight line in the low-frequency region, indicating that the V2+/V3+ redox reaction should be controlled by a mixture of electrochemical reaction and diffusion steps. The radius of the semicircle was relevant to the charge–transfer resistance, while the linear part corresponds to the diffusion of vanadium ions in the electrode [34,35]. A simplified equivalent circuit model was employed to investigate the impedance spectra, where R1 stands for solution resistance, C means the constant phase element of the interface between the electrolyte and the electrode, Rct represents the charge–transfer resistance during the electrochemical process and W represents the Warburg diffusion impedance, respectively [36].
The simulation results of impedance parameters obtained from Zsimpwin software are displayed in Table 3. The electrolyte with α-Lactose monohydrate exhibited slightly higher solution resistance (R1) and diffusion impedance (W) compared with the pristine sample, which might be related to the slight increase in viscosity (with α-Lactose monohydrate 4.82 mm2/s VS the pristine 4.73 mm2/s). The reduced Rct indicated a faster electron transfer process, which could be attributed to the catalytic property of hydroxyl groups adhered to the electrode [34,35,36]. Furthermore, the hydrophilic nature of hydroxyl groups was beneficial for the electrode to absorb more vanadium ions and promoted the diffusion of vanadium ions on the electrode’s surface, which might account for the increase in the diffusion capacitance (C) of the ions and the electric double-layer capacitance at the electrode/electrolyte interface [34].

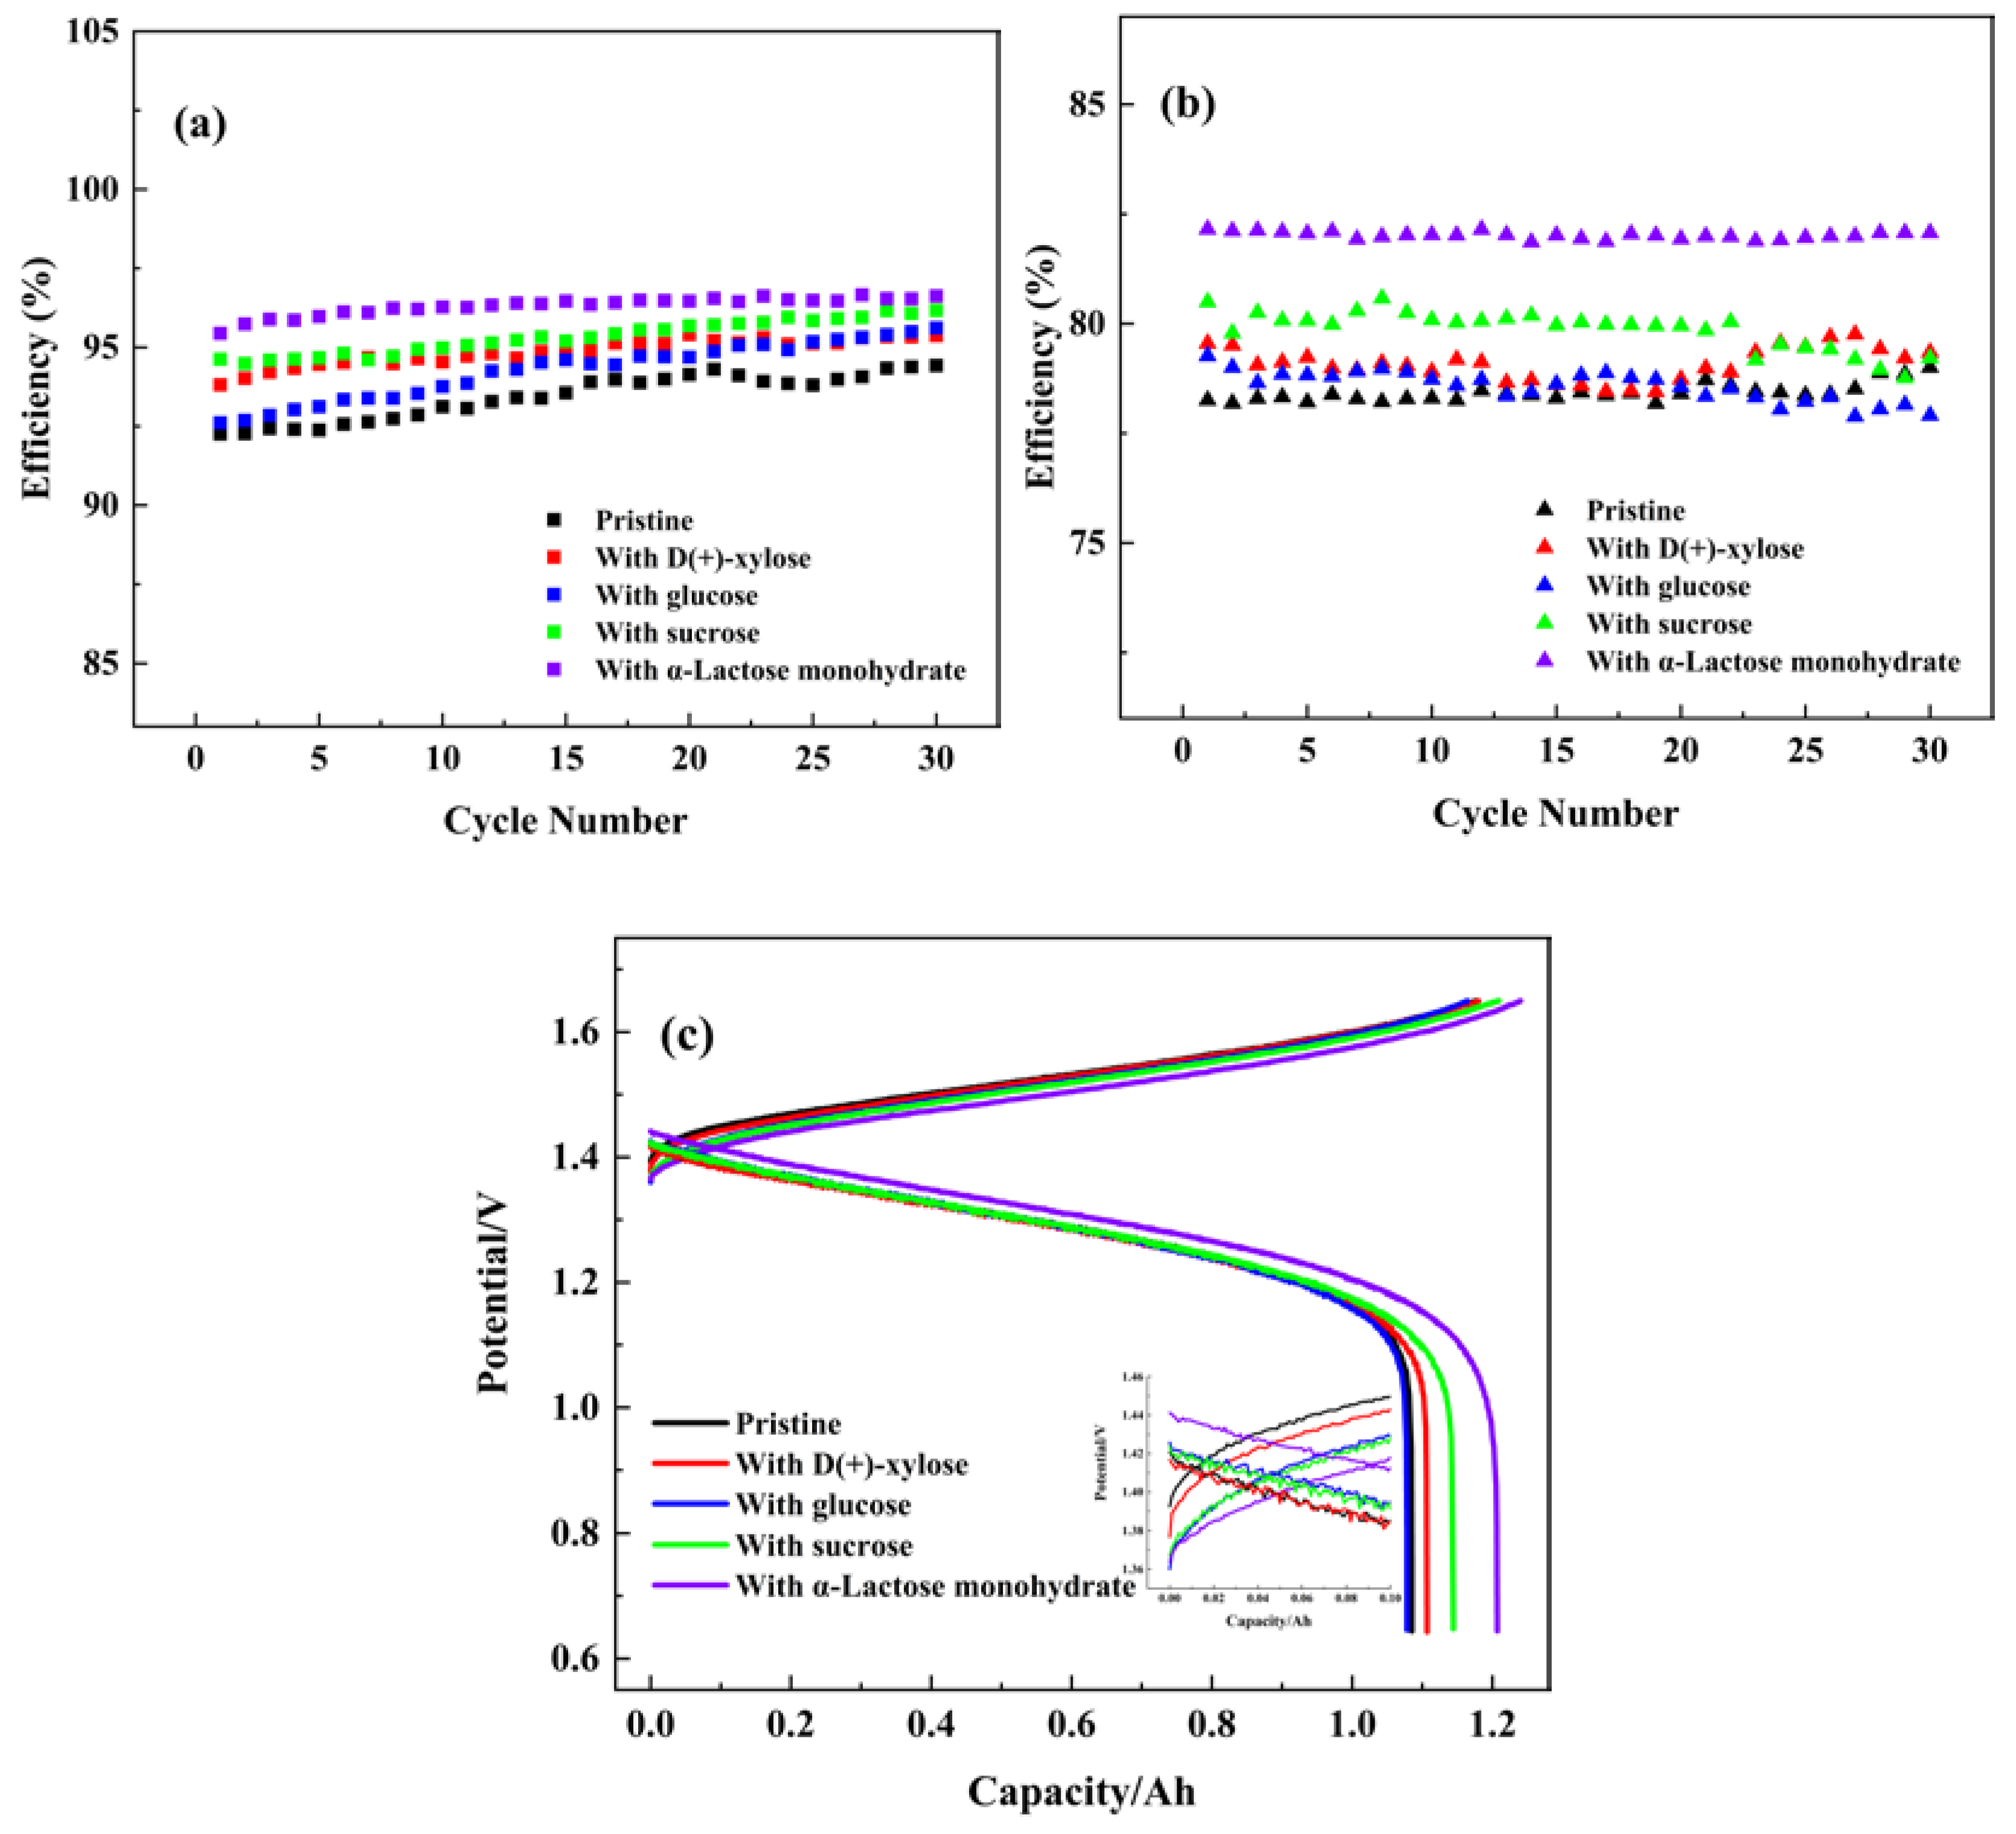
3.4. Charge–Discharge Tests

The charge–discharge measurements were conducted in a dynamic single cell using different negative electrolytes with and without 1 wt% four carbohydrate additives to further investigate the effect of battery performance. The coulombic efficiency (CE) and energy efficiency (EE) of the cells in 30 cycles are compared, respectively, in Figure 4a,b.
As observed, the introduction of the carbohydrates could improve the CE and EE of the cell, and the α-Lactose monohydrate sample exhibits the best results. The average coulombic efficiency of the cell with α-Lactose monohydrate in the negative electrolyte was 96.3%, which was a 2.8% increase over the pristine sample (93.5%), and the average energy efficiency increased from 78.5% to 82.0%. Figure 4c shows the typical charge–discharge curves of VRFB with and without carbohydrates in negative electrolyte at the current density of 40 mA cm−2 at 25 °C. As exhibited, the cell with carbohydrates in the negative electrolyte had a lower charging voltage and higher discharging voltage plateau as well as higher capacities than the pristine one, implying that the ohmic polarization of the electrolyte weakened. The sample with α-Lactose monohydrate exhibited the best largest capacity and the lowest value of charge–discharge overpotential, which indicated the enhancement of electrochemical reaction reversibility [29]. The above result revealed that the number of active species involved in the electrochemical reaction increased, and the battery’s capacity enhanced. It supports the results of CV and EIS.
The charge and discharge capacity changes for VRFB with and without carbohydrates at 25 °C in 30 cycles are presented in Figure 5. Obviously, the charge and discharge capacity decay of the cell with carbohydrates was significantly reduced, which demonstrated a higher capacity retention ratio compared with the pristine sample. As exhibited in Figure 5a, the cell with 1 wt% α-Lactose monohydrate had the highest discharge capacity retention ratio of 71.1% after 30 cycles, while the pristine cell was merely 29.5%. Similarly, Figure 5b exhibits that the discharge capacity of the cell also decreased gradually during operation, 69.8% decay from 1.065 to 0.322 Ah for the pristine cell and 38.0% decay from 1.207 to 0.869 Ah for the cell with 1 wt% α-Lactose monohydrate, respectively. The results indicated that the cell with 1 wt% α-Lactose monohydrate could obtain the best cycle performance and the most effective improvement of the utilization of the active material in the electrolyte compared with others.
The decay capacity of the cell is mainly due to the different diffusion rates of vanadium ions with different valences through the membrane, which eventually leads to the transfer of vanadium ions and water molecules from the negative side to the positive side [37]. The addition of α-Lactose monohydrate could increase the osmotic pressure of the negative electrolyte, and α-lactose monohydrate could more easily form coordination with vanadium ions, thus mitigating consequently the diffusion and migration of vanadium ions.
In order to verify that the addition of carbohydrates inhibited the diffusion of vanadium ions across the membrane, the amount of vanadium ions and the volume of the positive and negative electrolyte was tested and compared with the pristine sample, respectively, after 30 cycles, and the result is shown in Figure 6.
As observed in Figure 6, the imbalance of the vanadium amount and volume occurred between two half-cells after cycles finished, the specific phenomenon was that the negative electrolyte (NE) was diluted and the positive electrolyte (PE) became enriched. The osmotic pressure difference generated by the concentration gradient between the positive and negative electrolytes could further accelerate vanadium crossover (especially the migration of the negative electrolyte to the positive) and battery capacity decay [38,39]. The results shown that the introduction of the carbohydrates in the negative electrolyte effectively retarded the diffusion of vanadium ions and the imbalance of electrolyte volume, which was attributed to the decrease in osmotic pressure differences between the positive and negative electrolytes during the battery cycle. The α-lactose monohydrate sample exhibited the best cycle performance.

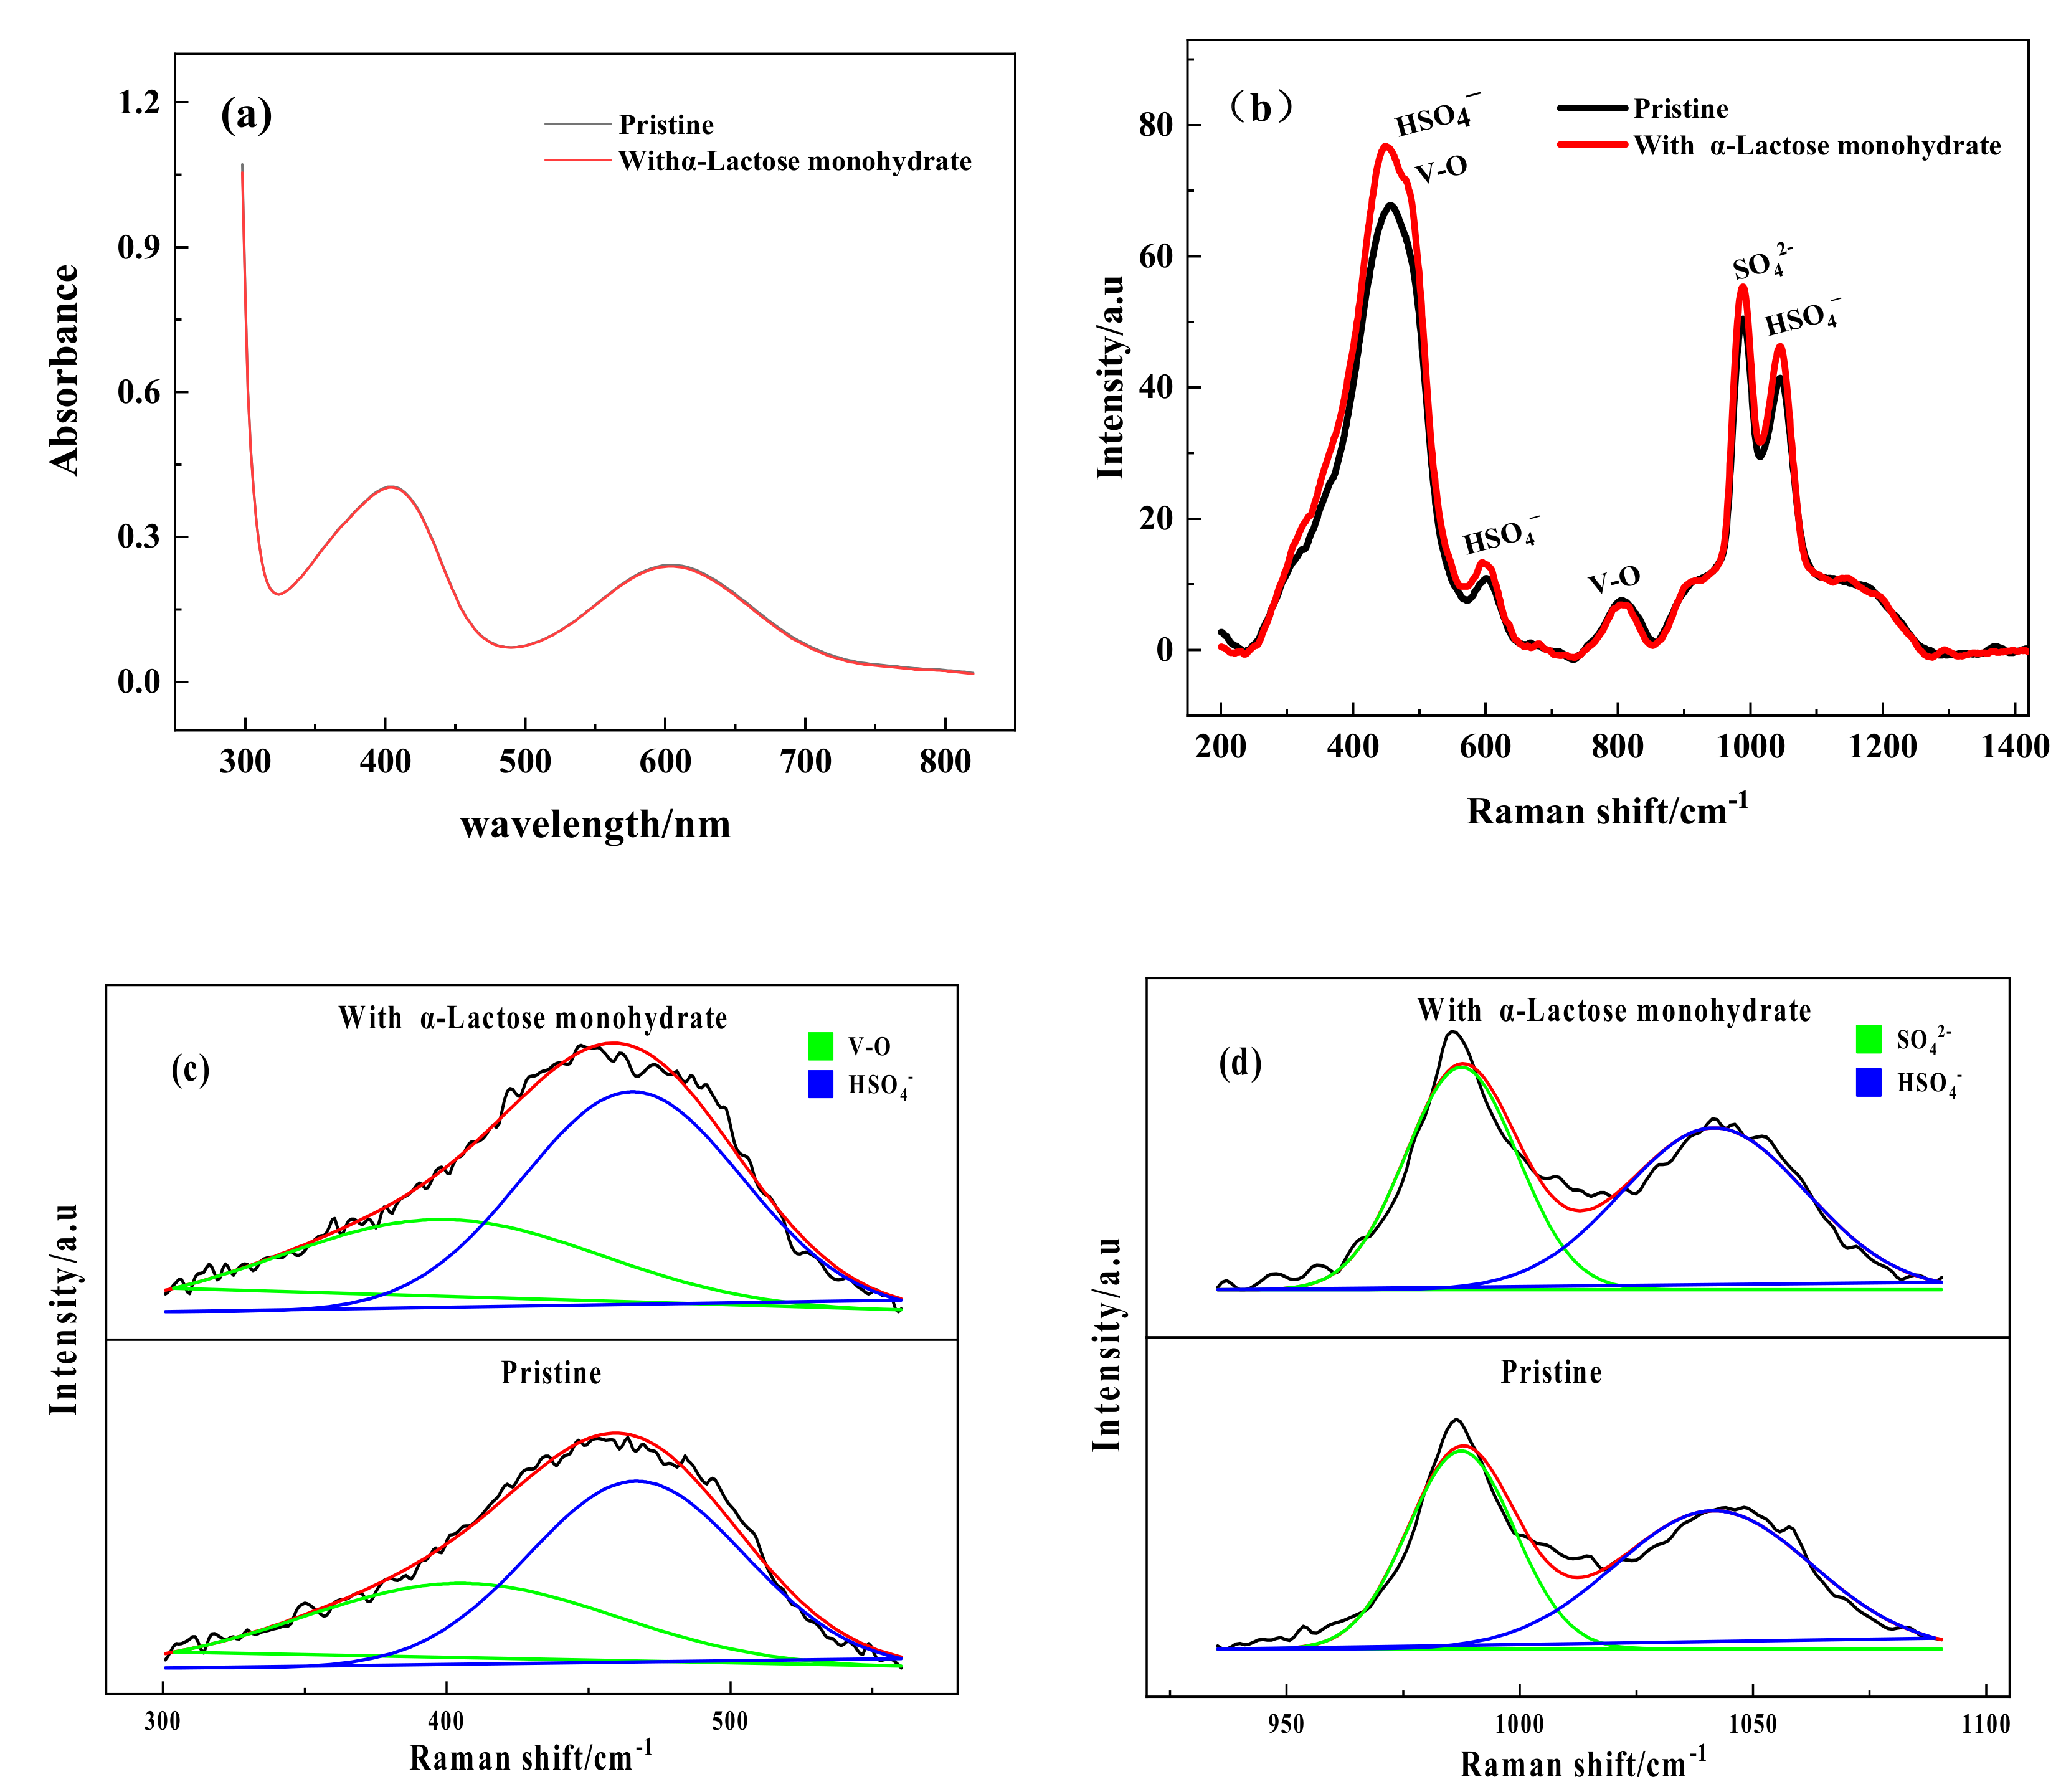
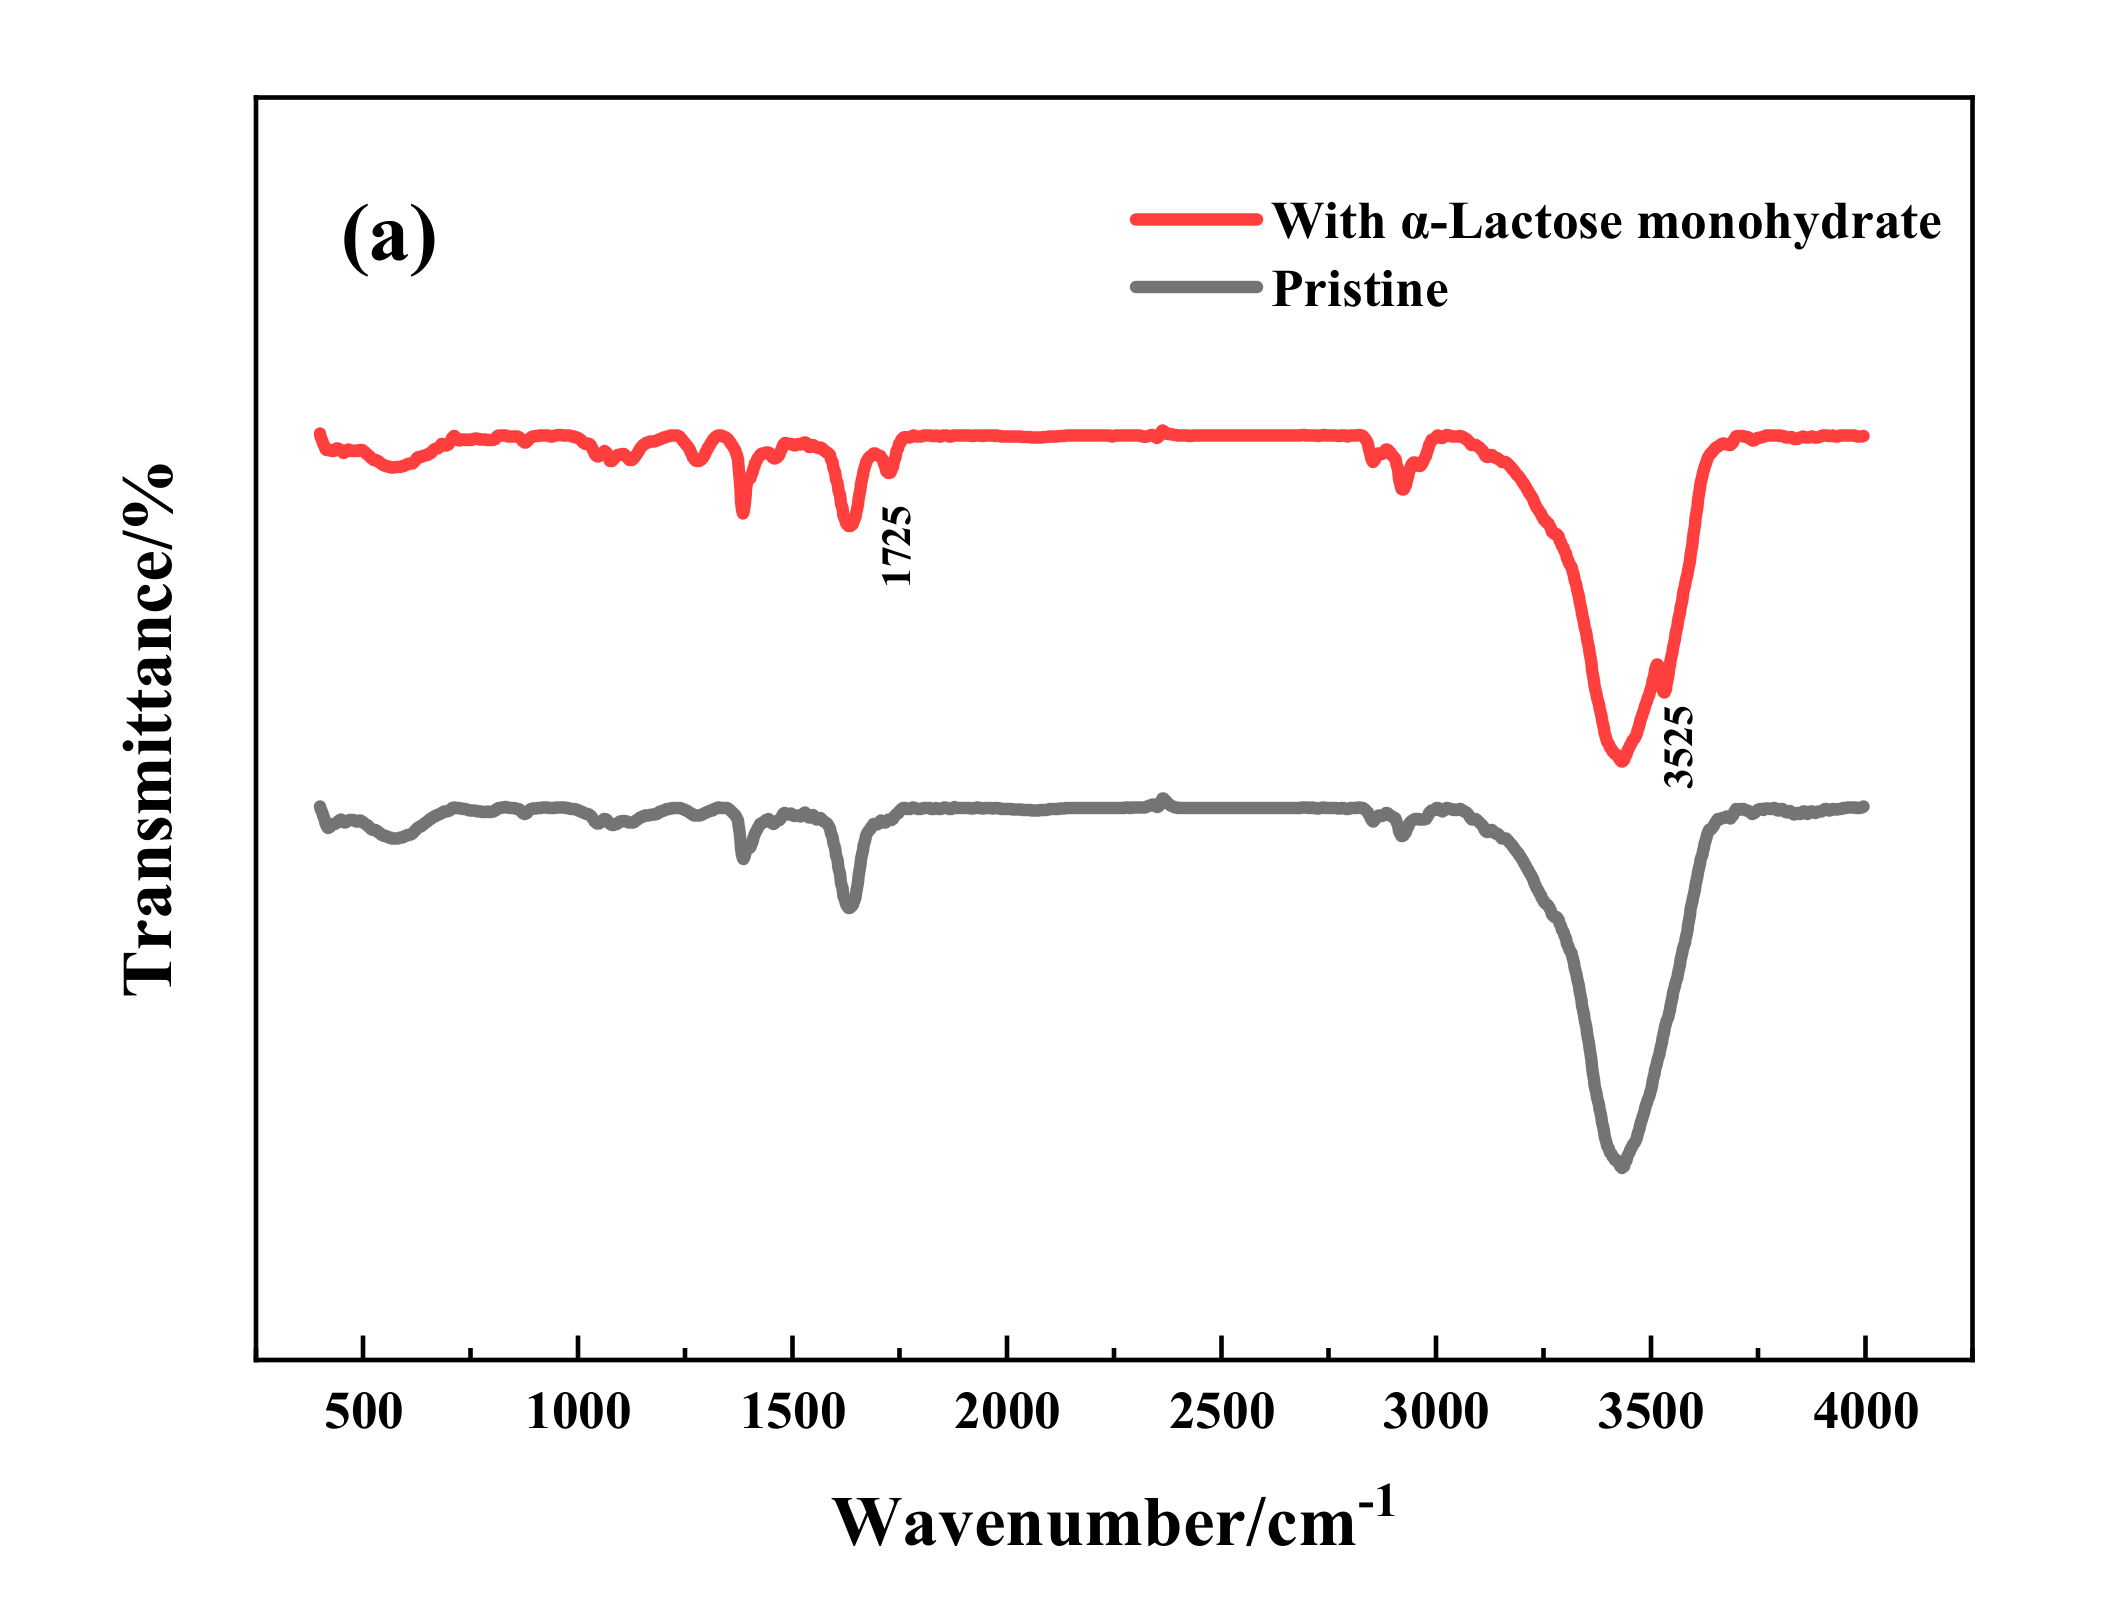
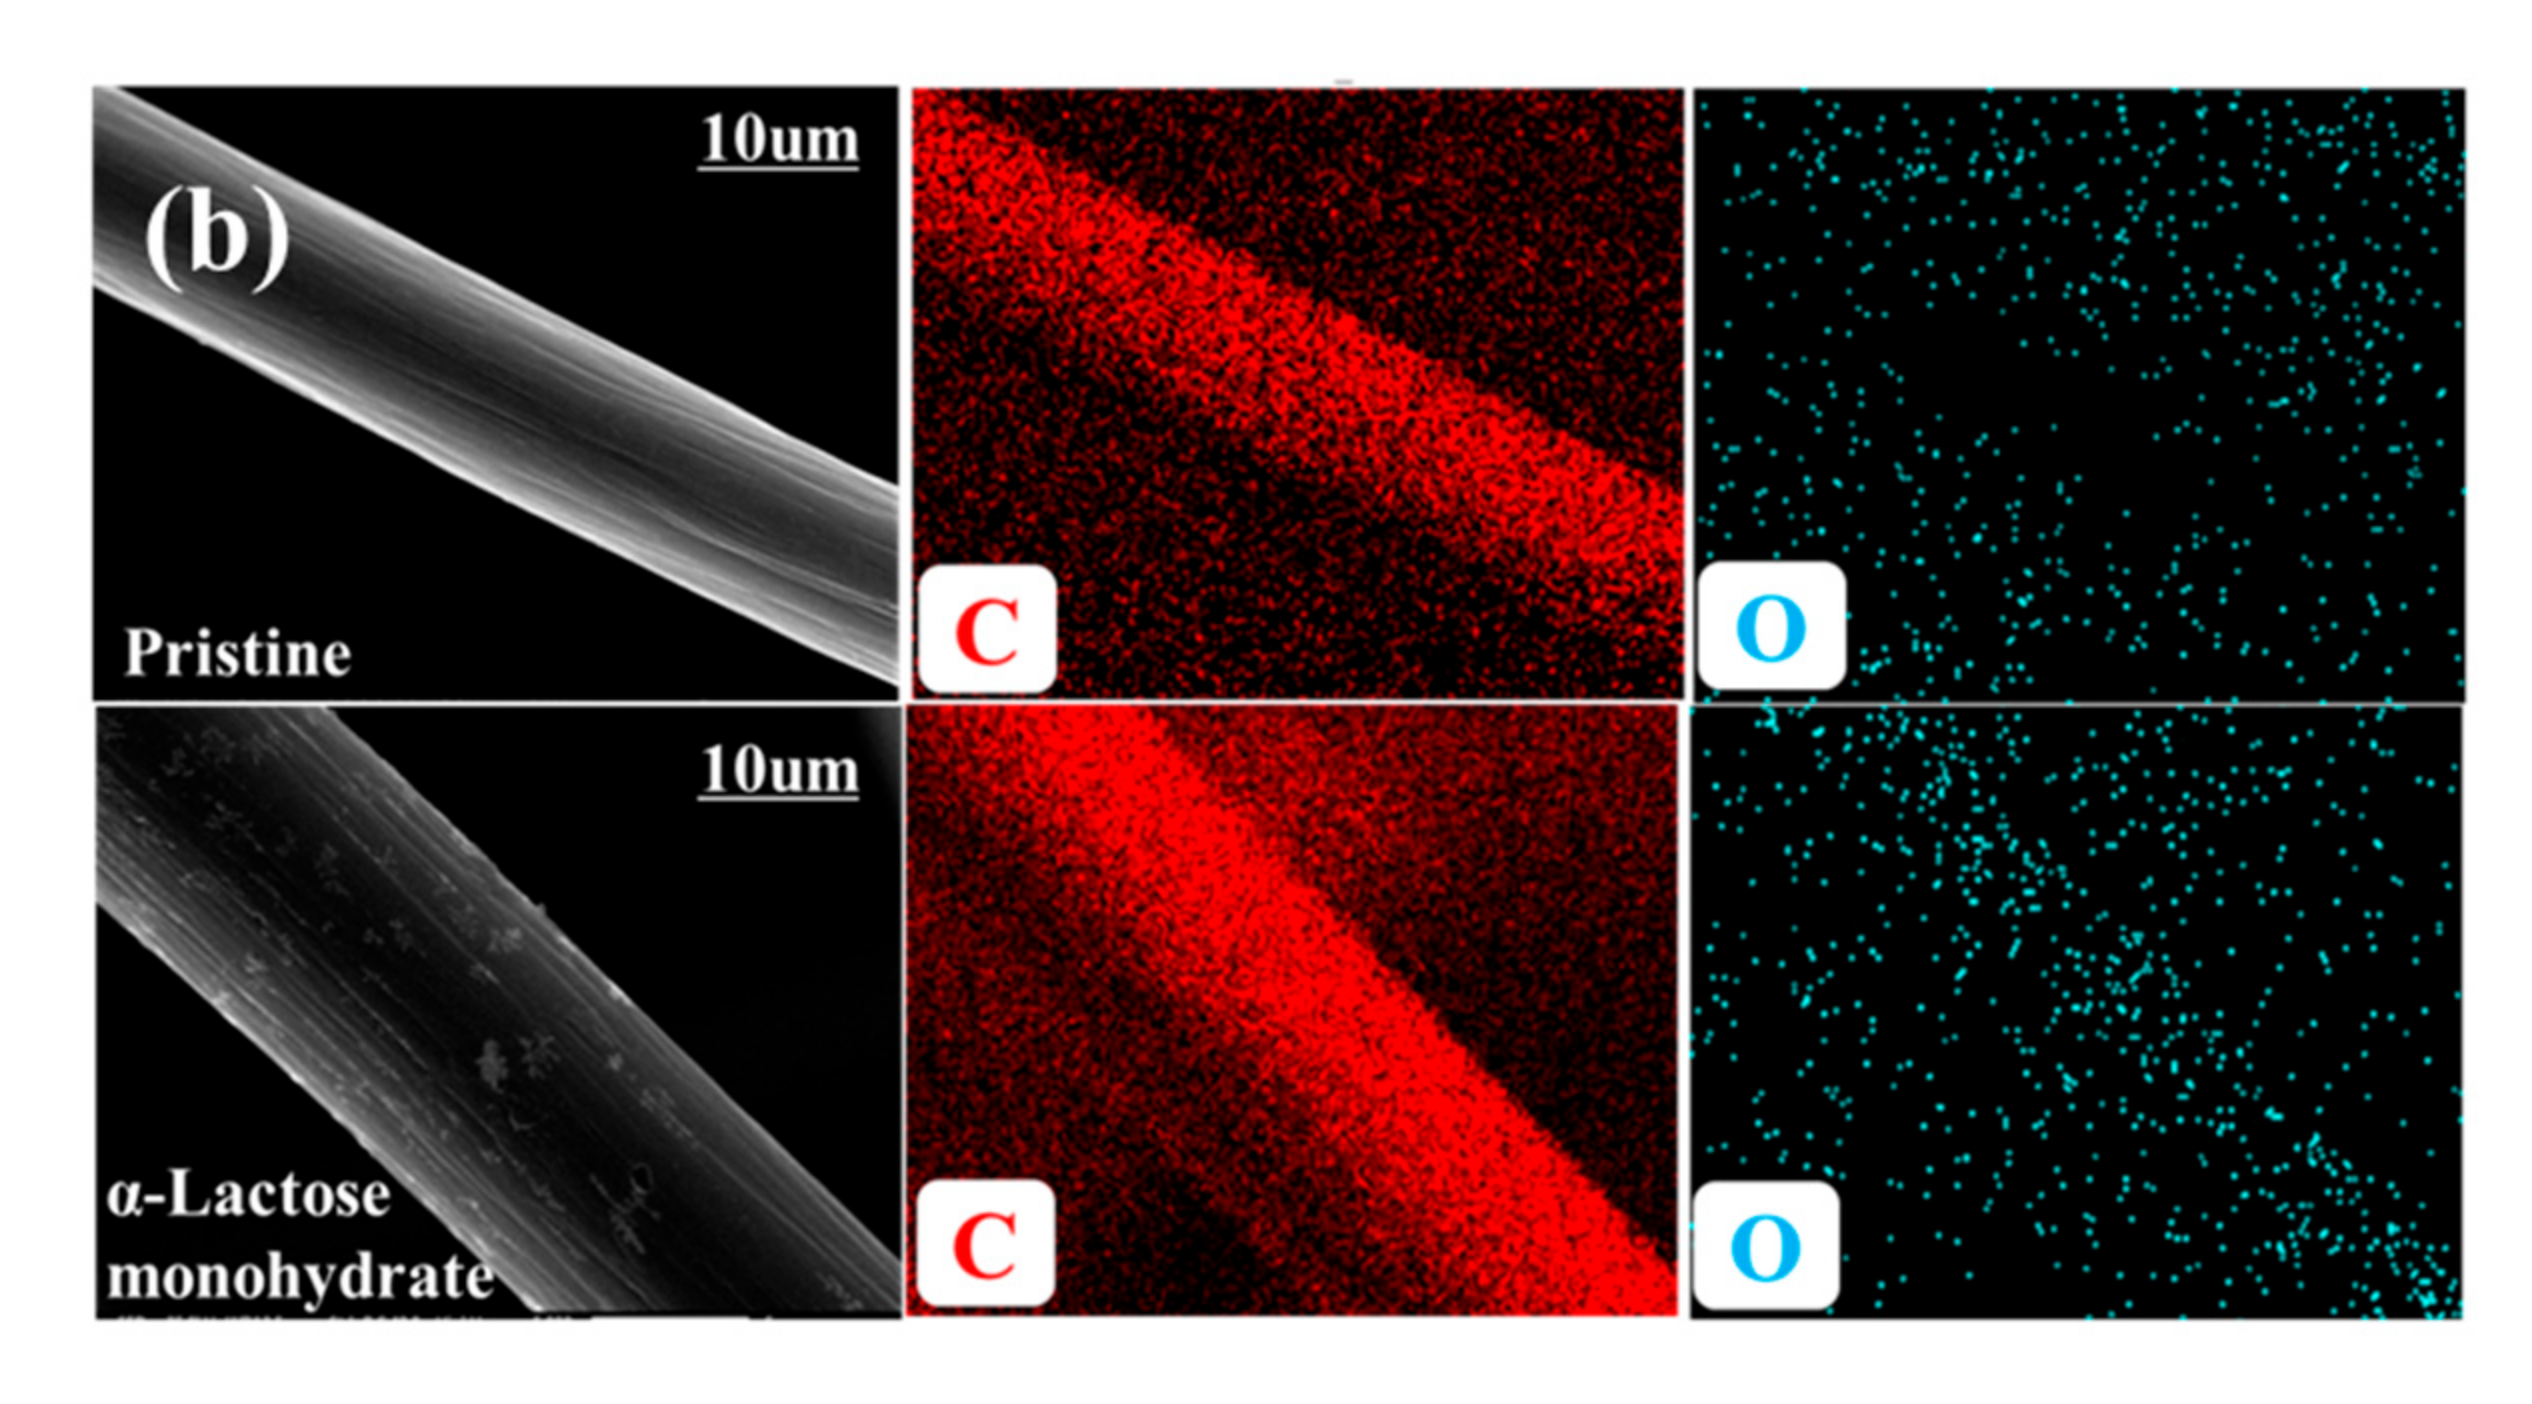
3.5. Mechanism Analysis

In order to further explain that the addition of α-Lactose monohydrate in the negative electrolyte could mitigate the diffusion of vanadium ion cross membrane, the transfer of vanadium ions was studied, and the results are shown in Figure 7.
As exhibited, the permeation of vanadium ion was obviously reduced when the α-Lactose monohydrate exists in the electrolyte, embodying the fact that the V3+ permeability of the group with added α-Lactose monohydrate (7.01 × 10⁻⁴ mol) was 37% less than that (1.12 × 10⁻³ mol) of the blank sample after 25 h. The addition of α-lactose monohydrate to the negative electrolyte could increase the number of particles per unit volume of electrolyte, thus increasing its osmotic pressure. From the above charge–discharge results, it could be seen that there was a decrease in the transfer number of vanadium ions from the negative to the positive electrolyte, which could be attributed to the increase in the osmotic pressure of the negative electrolyte. The corresponding change process is illustrated in Figure 8. The additional driving force of 95.94 KPa was provided by mixing 1 wt% α-Lactose monohydrate into the negative electrolyte, which can be obtained from the Van’t Hoff formula [23]:
π = β C R T
where π means the osmotic pressure, β means the Van’t Hoff factor, C means the concentration (mol·L−1) and R means the universal gas constant (8.31 KPa L mol−1·K−1).
In order to confirm how the α-Lactose monohydrate played a role in the electrolyte, UV-Vis spectrometry with and without 1 wt% α-Lactose monohydrate was measured, and the result is shown in Figure 9a. As exhibited, the UV-Vis test curves of the V(III) electrolyte exhibited two characteristic absorption peaks, respectively, at 604 nm and 404 nm. In addition, neither a new absorption peak nor peak shift appeared after adding 1 wt% α-Lactose monohydrate into V(III) electrolyte, which indicated that the valence state and the concentration of vanadium had not been affected by the coexistence of the α-Lactose monohydrate and V(III) ions.
The electrolyte sample measured in the UV-Vis test was a 50-fold diluted solution of the original electrolyte; thus, it is not possible to state the specifics in the electrolyte at high concentrations, and it is unclear whether new forms of vanadium ion structural bonding are formed. To further investigate whether the α-lactose monohydrate forms a new vanadium ion bonding structure with the V(III) electrolyte, the electrolyte with and without α-Lactose monohydrate was characterized by Raman spectra. The test result in the range of 200–1500 cm−1 is demonstrated in Figure 9b. Through the peak-differentiating and imitating the vibration peak at 400–500 cm−1, 986 cm−1 and 1047 cm−1, the areas of HSO4, V-O and SO42− in the Raman spectra were obtained, as exhibited in Figure 9c,d, and the corresponding result is displayed in Table 4. Based on the Raman spectra of vanadium oxide and the band frequencies of the electrolyte mentioned previously in the literature, the corresponding assignments of the main peaks [26,27] are displayed in Table 5.
Figure 9. (a) UV-Vis spectra and (b) Raman spectrum of V(III) electrolyte with and without α-Lactose monohydrate. Peak-differentiating and imitation of (c) HSO4 and V-O bonds between 400 cm−1 and 500 cm−1 and (d) SO42− and HSO4 at 986 cm−1 and 1047 cm−1 in the Raman spectra.
Energies 15 02454 g009
As seen from Figure 9b, no new peaks appeared and the original peak vanished in the Raman spectrum, which is consistent with the test results of UV-Vis spectrometry and indicates that a new valence state of vanadium ions had formed. Nevertheless, the intensity of peaks at 400–500, 603, 986 and 1047cm−1 enhanced slightly since α-Lactose monohydrate existed in the V(III) electrolyte; more SO42−, HSO4 and V-O structures formed correspondingly. This indicated that the hydroxyl group in α-Lactose monohydrate could combine with vanadium ions to form a stable V-O bridge structure and that it replaced a part of the SO42−/HSO4 ligand from the coordinated vanadium ions, resulting in increased SO42− and HSO4 ions presented in the electrolyte. In addition, the complex of α-lactose monohydrate with vanadium ions could hinder vanadium ions across the membrane to some extent.
The related study [40,41] pointed out that the improvement of V2+/V3+ redox reactions by hydroxyl groups included the interfacial transfer of vanadium ions between the bulk solution and electrode surface, their ion-exchange with hydroxyl groups or hydrogen ions on the graphite felt and the subsequent electron transfer reaction. From the results of the charge–discharge test and electrochemical test, it could be observed that the introduction of α-Lactose monohydrate promoted the electrochemical reaction that occurred on the surface of the electrode. To prove that α-Lactose monohydrate could be adsorbed on the surface of the electrode, FT-IR, SEM and EDS tests were conducted, and the results are exhibited in Figure 9.
It can be observed from Figure 10a that the bands at 3525 cm−1, which represents the stretching vibration of the hydroxyl group, and the bands at 1725 cm−1, which belongs to α-Lactose monohydrate [42], appeared. Moreover, Figure 10b shows that increased O elements were enriched on the surface of graphite–felt electrode, which was employed in the electrolyte with α-Lactose monohydrate compared with the pristine sample, implying that the hydroxyl functional groups in α-Lactose monohydrate could be adsorbed to the electrode during operation. The hydroxyl groups attached to the electrode surface did not change the structure of the electrode, but they supplied more available active sites for ion exchange and accelerated the process of V2+/V3+ redox reactions [43,44]. The hydroxyl functional groups provided more active specific surface area on the electrode’s surface, allowing more vanadium ions to participate in the redox reaction. As a result, vanadium utilization increased, and the cell was more adequately charged and discharged. Furthermore, this was due to the increase in osmotic pressure caused by the α-Lactose monohydrate in the electrolyte, which inhibited the decrease in active material in the negative electrolyte. More vanadium ions, thus, could be involved in the electrochemical reaction, leading to high output current density.

4. Conclusions

In this work, Glucose, sucrose, D(+)-xylose and α-Lactose monohydrate were applied as additives for the negative electrolyte of VRFB. Capacity decay was mitigated by adding additives in the negative electrolyte to enhance electrochemistry and inhibit vanadium ion diffusion. Moreover, the best performances were achieved by adding α-Lactose monohydrate among them.
According to the results of SEM, EDS and FT-IR, the enhancement on the electrochemical performance of V(III) electrolyte with α-Lactose monohydrate was attributed to the increased active sites for V2+/V3+ redox reactions by hydroxyl groups attached to the electrode and the enhanced hydrophilic property of the electrode. Meanwhile, the hydroxyl group in α-Lactose monohydrate easily formed coordination with vanadium ions, which is conducive to prolonging the low-temperature stability time of the negative electrolyte. More importantly, α-Lactose monohydrate can provide extra osmotic pressure to the negative electrolyte and form coordination with vanadium ions to reduce vanadium ions across the membrane.
Consequently, VRFB with α-Lactose monohydrate in the negative electrolyte performed excellent discharge capacity retention of 72.0% (29.5%) after 30 cycles, while the average coulombic efficiency is 96.3% (93.5%), and the average energy efficiency is 82.0% (78.5%).
Therefore, the α-Lactose monohydrate can be regarded as a promising additive for the negative electrolyte of VFRB.

Author Contributions

Conceptualization, L.C. and T.L.; methodology, L.C. and M.D.; software, L.C. and H.L.; validation, T.L. and H.L.; formal analysis, L.C., T.L. and H.L.; investigation, L.C. and T.L. resources, T.L. and Y.Z.; data curation, L.C., T.L., H.L. and M.D.; writing—original draft preparation, L.C.; writing—review and editing, L.C., T.L. and H.L.; visualization, D.P.; supervision, D.P. and T.L.; project administration, T.L. and Y.Z.; funding acquisition, Y.Z. All authors have read and agreed to the published version of the manuscript.

Funding

National Natural Science Foundation of China (NO. 51774216); Hubei technical innovation special project of China (NO. 2017ACA185); Outstanding Young and Middle-aged Science and Technology Innovation Team Project of Hubei Province (NO. T201802).

Institutional Review Board Statement

Not applicable.

Informed Consent Statement

Not applicable.

Data Availability Statement

No new data were created or analyzed in this study. Data sharing is not applicable to this article.

Acknowledgments

This work is financially supported by the National Natural Science Foundation of China (NO. 51774216), Hubei technical innovation special project of China (NO. 2017ACA185) and Outstanding Young and Middle-aged Science and Technology Innovation Team Project of Hubei Province (NO. T201802).

Conflicts of Interest

The authors declare no conflict of interest.

References

  1. Zecca, A.; Chiari, L. Fossil-fuel constraints on global warming. Energy Policy 2010, 38, 1–3. [Google Scholar]
  2. McEvoy, D.; Gibbs, D.C.; Longhurst, J.W.S. City-regions and the development of sustainable energy-supply systems. Int. J. Energy Res. 2000, 24, 215–237. [Google Scholar]
  3. Ma, X.K.; Zhang, H.M.; Sun, C.X.; Zou, Y.; Zhang, T. An optimal strategy of electrolyte flow rate for vanadium redox flow battery. J. Power Sources 2012, 203, 153–158. [Google Scholar] [CrossRef]
  4. Skyllas-Kazacos, M.; Grossmith, F. Efficient vanadium redox flow cell. J. Electrochem. Soc. 1987, 134, 2950. [Google Scholar] [CrossRef]
  5. Yang, Y.D.; Zhang, Y.M.; Tang, L. Improved energy density and temperature range of vanadium redox flow battery by controlling the state of charge of positive electrolyte. J. Power Sources 2020, 450, 227675. [Google Scholar] [CrossRef]
  6. Sun, C.Y.; Zhang, H. Review of the development of first-generation redox flow batteries: Iron-Chromium system. ChemSusChem 2022, 15, 202101798. [Google Scholar] [CrossRef]
  7. Nemani, V.P.; Smith, K.C. Assignment of energy loss contributions in redox flow batteries using exergy destruction analysis. J. Power Sources 2020, 447, 227371. [Google Scholar] [CrossRef]
  8. Wang, R.; Li, Y.S.; Wang, Y.N.; Fang, Z. Phosphorus-doped graphite felt allowing stabilized electrochemical interface and hierarchical pore structure for redox flow battery. Appl. Energy 2020, 261, 114369. [Google Scholar] [CrossRef]
  9. Yan, X.M.; Sun, J.H.; Gao, L.; Zheng, W.J.; Dai, Y.; Ruan, X.H.; He, G.H. A novel long-side-chain sulfonated poly (2,6-dimethyl-1,4-phenylene oxide) membrane for vanadium redox flow battery. Int. J. Hydrog. Energy 2018, 43, 301–310. [Google Scholar] [CrossRef]
  10. Liao, J.B.; Lu, M.Z.; Chu, Y.Q.; Wang, J.L. Ultra-low vanadium ion diffusion amphoteric ion-exchange membranes for all-vanadium redox flow batteries. J. Power Sources 2015, 282, 241–247. [Google Scholar]
  11. Duan, W.T.; Li, B.; Lu, D.P.; Wei, X.L.; Nie, Z.M. Towards an all-vanadium redox flow battery with higher theoretical volumetric capacities by utilizing the VO2+/V3+ couple. J. Energy Chem. 2018, 27, 1381–1385. [Google Scholar] [CrossRef] [Green Version]
  12. Luo, Q.T.; Li, L.Y.; Wang, W.; Nie, Z.M.; Wei, X.L.; Li, B.; Chen, B.W.; Yang, Z.G.; Sprenkle, V. Capacity Decay and Remediation of Nafion-based All-Vanadium Redox Flow Batterie. ChemSusChem 2013, 6, 268–274. [Google Scholar] [CrossRef] [PubMed]
  13. Zhang, Y.N.; Liu, L.; Xi, J.Y.; Wu, Z.H.; Qiu, X.P. The benefits and limitations of electrolyte mixing in vanadium flow batteries. Appl. Energy 2017, 204, 373–381. [Google Scholar] [CrossRef]
  14. Whitehead, A.H.; Harrer, M. Investigation of a method to hinder charge imbalance in the vanadium redox flow battery. J. Power Sources 2013, 203, 271–276. [Google Scholar] [CrossRef]
  15. Piwek, J.; Dennison, C.; Frackowiak, E.; Girault, H.; Battistel, A. Vanadium-oxygen cell for positive electrolyte discharge in dual-circuit vanadium redox flow battery. J. Power Sources 2019, 439, 227075. [Google Scholar] [CrossRef]
  16. Ding, M.; Ling, X.; Yuan, D.; Cheng, Y.H. SPEEK membrane of ultrahigh stability enhenced by functionalized carbon nanotubes for vanadium redox flow battery. Front. Chem. 2018, 6, 286. [Google Scholar] [CrossRef] [PubMed] [Green Version]
  17. Zeng, L.; Zhao, T.S.; Wei, L.; Jiang, H.R.; Wu, M.C. Anion exchange membranes for aqueous acid-based redox flow batteries: Current status and challenge. Appl. Energy 2019, 233–234, 622–643. [Google Scholar] [CrossRef]
  18. Hwang, J.; Kim, B.M.; Moon, J.; Mehmood, A.; Ha, H.Y. A highly efficient and stable organic additive for the positive electrolyte in vanadium redox flow batteries: Taurine biomolecules containing −NH2 and −SO3H functional groups. J. Mater. Chem. A 2018, 6, 4695–4705. [Google Scholar] [CrossRef]
  19. He, Z.X.; Li, M.M.; Li, Y.H.; Zhu, J.; Jiang, Y.Q.; Meng, W.; Zhou, H.Z.; Wang, L.; Dai, L. Flexible electrospun carbon nanofiber embedded with TiO2 as excellent negative electrode for vanadium redox flow battery. Electrochim. Acta 2018, 281, 601–610. [Google Scholar] [CrossRef]
  20. Zeng, Y.; Zhao, T.; Zhou, X.; Zou, J.; Ren, Y. hydrogen-ferric ion rebalance cell operating at low hydrogen concentrations for capacity restoration of iron-chromium redox flow batteries. J. Power Sources 2017, 352, 77–82. [Google Scholar] [CrossRef]
  21. Liu, S.; Wang, L.; Li, D.; Liu, B.; Wang, J.; Song, Y. Novel amphoteric ion exchange membranes by blending sulfonated poly (ether ether ketone)/quaternized poly (ether imide) for vanadium redox flow battery applications. J. Mater. Chem. A 2015, 3, 17590–17597. [Google Scholar] [CrossRef]
  22. Lobanova, M.S.; Postnov, V.N.; Mel’nikova, N.A.; Novikov, A.G.; Murin, I.V. Aquivion-based composite membranes with nanosized additives. Moscow Univ. Chem. Bull. 2020, 75, 121–124. [Google Scholar] [CrossRef]
  23. Yan, L.; Li, D.; Li, S.; Xu, Z.; Dong, J.; Jing, W.; Xing, W. Balancing osmotic pressure of electrolytes for nanoporous membrane vanadium redox flow battery with a draw solute. ACS Appl. Mater. Interfaces 2016, 8, 35289–35297. [Google Scholar] [CrossRef] [PubMed]
  24. Zhang, Q.; Liu, T.; Zhang, H.M.; Li, X.F. Highly Active Ag Nanoparticle Electrocatalysts toward V2+/V3+ Redox Reaction. ACS Appl. Energy Mater. 2021, 4, 3913–3920. [Google Scholar]
  25. Kwon, S.; Suharto, Y.; Kim, K.J. Facile preparation of an oxygen-functionalized carbon felt electrode to improve VO2+/VO2+ redox chemistry in vanadium redox flow batteries. J. Ind. Eng. Chem. 2021, 98, 231–236. [Google Scholar] [CrossRef]
  26. Wei, X.L.; Liu, S.Q.; Wang, J. Boosting the performance of positive electrolyte for VRFB by employing zwitterion molecule containing sulfonic and pyridine groups as the additive. Ionics 2020, 26, 3147–3159. [Google Scholar] [CrossRef]
  27. Wua, X.J.; Liua, S.Q.; Wang, N.F. Influence of organic additives on electrochemical properties of the positive electrolyte for all-vanadium redox flow battery. Electrochim. Acta 2012, 78, 475–482. [Google Scholar] [CrossRef]
  28. Liu, J.L.; Liu, S.Q.; He, Z.X.; Han, H.G.; Chen, Y. Effects of organic additives with oxygen- and nitrogen-containing functional groups on the negative electrolyte of vanadium redox flow battery. Electrochim. Acta 2014, 130, 314–321. [Google Scholar] [CrossRef]
  29. Li, S.; Huang, K.L.; Liu, S.Q. Effect of organic additives on positive electrolyte for vanadium redox battery. Electrochim. Acta 2011, 56, 5483–5487. [Google Scholar] [CrossRef]
  30. Wang, G.; Chen, J.; Wang, X.; Tian, J.; Kang, H.; Zhu, X.; Zhang, Y.; Liu, X.; Wang, R. Influence of several additives on stability and electrochemical behavior of V(V) electrolyte for vanadium redox flow battery. J. Electroanal. Chem. 2013, 709, 31–38. [Google Scholar] [CrossRef]
  31. Améglio, T.; Decourteix, M.; Alves, G.; Valentin, V.; Sakr, S.; Julien, J.L.; Petel, G.; Guilliot, A.; Lacointe, A. Temperature effects on xylem sap osmolarity in walnut trees: Evidence for a vitalistic model of winter embolism repair. Tree Physiol. 2004, 7, 785–793. [Google Scholar] [CrossRef] [Green Version]
  32. Jiang, Y.Q.; Du, M.C.; Cheng, G.; Gao, P.; Dong, T.T.; Zhou, J.; Feng, X.J.; He, Z.X.; Li, Y.H.; Dai, L.; et al. Nanostructured N-doped carbon materials derived from expandable biomass with superior electrocatalytic performance towards V2+/V3+ redox reaction for vanadium redox flow battery. J. Energy Chem. 2021, 59, 706–714. [Google Scholar] [CrossRef]
  33. Mousa, A.; Skyllas-Kazacos, M. Kinetics of V(III) and V(II) sulphate precipitation process in negative half-cell electrolyte of the vanadium redox flow battery. Chemelectrochem 2017, 4, 130–142. [Google Scholar] [CrossRef]
  34. Gao, C.; Wang, N.F.; Peng, S.; Liu, S.Q.; Lei, Y.; Liang, X.X.; Zeng, S.S.; Zi, H.F. Influence of Fenton’s reagent treatment on electrochemical properties of graphite felt for all vanadium redox flow battery. Electrochim. Acta 2013, 88, 193–202. [Google Scholar] [CrossRef]
  35. Zhang, R.C.; Li, K.; Ren, S.Z.; Chen, J.F.; Feng, X.J.; Jiang, Y.Q.; He, Z.X.; Dai, L.; Wang, L. Sb-doped SnO2 nanoparticle-modified carbon paper as a superior electrodefor a vanadium redox flow battery. Appl. Surf. Sci. 2020, 526, 146685. [Google Scholar] [CrossRef]
  36. Wei, G.J.; Jia, C.K.; Liu, J.G.; Yan, C.W. Carbon felt supported carbon nanotubes catalysts composite electrode for vanadium redox flow battery application. J. Power Sources 2012, 220, 185–192. [Google Scholar] [CrossRef]
  37. Skyllas-Kazacos, M.; Goh, L. Modeling of vanadium ion diffusion across the ion exchange membrane in the vanadium redox battery. J. Membr. Sci. 2012, 399, 43–48. [Google Scholar] [CrossRef]
  38. Poli, N.; Schäffer, M.; Trovò, A.; Noack, J.; Guarnieri, M.; Fischer, P. Novel electrolyte rebalancing method for vanadium redox flow batteries. Chem. Eng. J. 2021, 405, 126583. [Google Scholar] [CrossRef]
  39. Khaki, B.; Das, P. Sensorless parameter estimation of vanadium redox flow batteries in charging mode considering capacity fading. J. Energy Storage 2021, 33, 102033. [Google Scholar] [CrossRef]
  40. Li, W.Y.; Zhang, Z.Y.; Tang, Y.B.; Bian, H.D.; Ng, T.W.; Zhang, W.J.; Lee, C.S. Graphene-Nanowall-Decorated carbon felt with excellent electrochemical activity toward VO2+/VO2+ couple for all vanadium redox flow battery. Adv. Sci. 2015, 3, 1500276. [Google Scholar] [CrossRef] [Green Version]
  41. Zhang, J.H.; Zhou, T.; Xia, L.P.; Yuan, C.Y.; Zhang, W.D.; Zhang, A.M. Polypropylene elastomer composite for the all-vanadium redox flow battery: Current Collector Materials. J. Mater. Chem. A 2015, 3, 2387–2398. [Google Scholar] [CrossRef]
  42. Listiohadi, Y.; Arthur Hourigan, J.; Walter Sleigh, R.; John Steele, R. Thermal analysis of amorphous lactose and α-lactose monohydrate. Dairy Sci. Technol. 2009, 89, 43–67. [Google Scholar] [CrossRef]
  43. Li, W.Y.; Liu, J.G.; Yan, C.W. Reduced graphene oxide with tunable C/O ratio and its activity towards vanadium redox pairs for an all vanadium redox flow battery. Carbon 2013, 55, 313–320. [Google Scholar] [CrossRef]
  44. Shin, M.Y.; Noh, C.H.; Chung, Y.J.; Kim, D.H.; Kwon, Y.C. Vanadium redox flow battery working even at a high current density by the adoption of tris(hydroxymethyl) aminomethane functionalized acidified carbon nanotube catalyst. Appl. Surf. Sci. 2021, 550, 148977. [Google Scholar] [CrossRef]
Figure 1. The standard curve of (IV) concentration vs. absorbance.
Energies 15 02454 g001
Figure 2. CV curves of the negative electrolyte with and without four carbohydrate additives. (a) glucose; (b) D(+)-xylose; (c) sucrose; (d) α-Lactose monohydrate.
Energies 15 02454 g002
Figure 3. Nyquist plots of the graphite electrode in negative electrolyte with and without α-Lactose monohydrate and the corresponding equivalent circuit.
Energies 15 02454 g003
Figure 4. The performance of VRFB single-cell employing the anolyte with and without four carbohydrate additives at 40 mA cm−2 in 30 cycles: (a) Coloumbic efficiencies, (b) energy efficiencies and (c) the charge–discharge curves for the 1st cycle.
Energies 15 02454 g004
Figure 5. (a) Charge capacity degradation and (b) discharge capacity degradation of the VRFB employing negative electrolyte with and without four carbohydrate additives in 30 cycles.
Energies 15 02454 g005
Figure 6. (a) Amount of vanadium and (b) volume of the electrolytes with and without four carbohydrate additives after 30 cycles.
Energies 15 02454 g006
Figure 7. (a) Effect of the addition of α-Lactose monohydrate on the concentration of V3+ in the permeate side and (b) two-compartment diffusion unit.
Energies 15 02454 g007
Figure 8. The effect of osmotic pressure in the negative electrolyte increased during the cycles process.
Energies 15 02454 g008
Figure 10. (a) FT-IR spectra and (b) SEM images and EDS mappings of the graphite felt electrode after 30 cycles of the cell with and without α-Lactose monohydrate.
Energies 15 02454 g010aEnergies 15 02454 g010b
Table 1. Effect of types of additives on the stability of 1.8 M vanadium electrolyte.
V SpeciesAdditiveTime for Precipitation/h
25 °C−20 °C
V(II)PristineS5 ± 0.75
D(+)-xyloseS7 ± 0.5
GlucoseS8 ± 0.5
SucroseS12.5 ± 0.8
α-Lactose monohydrateS20 ± 0.4
V(III)PristineSS
D(+)-xyloseSS
GlucoseSS
SucroseSS
α-Lactose monohydrateSS
S means the electrolyte can remain stable for least 30 days.
Table 2. The parameters of CV tests of 1.8 M V(III) electrolyte with and without four carbohydrate additives.
SampleAnodic PeakCathodic PeakΔEp (mV)ipc/ipa
ipa (mA cm2)Epa (mV)ipc (mA cm2)Epc (mV)
Pristine42.5−31758.3−6503331.37
D(+)-xylose47.0−31061.7−6153051.31
Glucose42.9−27457.7−6643901.36
Sucrose48.6−30863.6−6183581.31
α-Lactose monohydrate49.1−31163.7−5962851.30
Table 3. Fitting results of EIS in electrolyte with and without α-Lactose monohydrate.
SampleR1 (Ω/cm2)C × 10−5 (F/cm2)Rct (Ω/cm2)W, Y0 (S/s5 cm2)
Pristine1.193.4044.9560.1830
α-Lactose monohydrate1.214.2603.9880.1775
Table 4. The results of peak-differentiating and imitating in Raman spectra for HSO4, SO42− and V-O bonds.
Samples400–500 cm−1986 cm−11047 cm−1
Area (HSO4)Area (V-O)Area (SO42−)Area (HSO4)
Pristine3021.994734.191264.271616.40
α-Lactose monohydrate3351.395638.761487.291765.79
Table 5. Band frequencies and corresponding assignments of main peaks in Raman spectrometry.
Raman Shift (cm−1)Assignment
400–500HSO4 and V-O (V-O bridging mode)
603HSO4, symmetric stretch
660–680V-O-S, bridging stretch
803V-O, bridging stretch
899V-O, terminal stretch
986SO42, symmetrical stretch
1047HSO4, asymmetrical stretch
Publisher’s Note: MDPI stays neutral with regard to jurisdictional claims in published maps and institutional affiliations.

