
A Study on Energy Tax Reform for Carbon Pricing Using an Input-Output Table for the Analysis of a Next-Generation Energy System


Abstract
:1. Introduction
2. Literature Review on the Method
3. Model
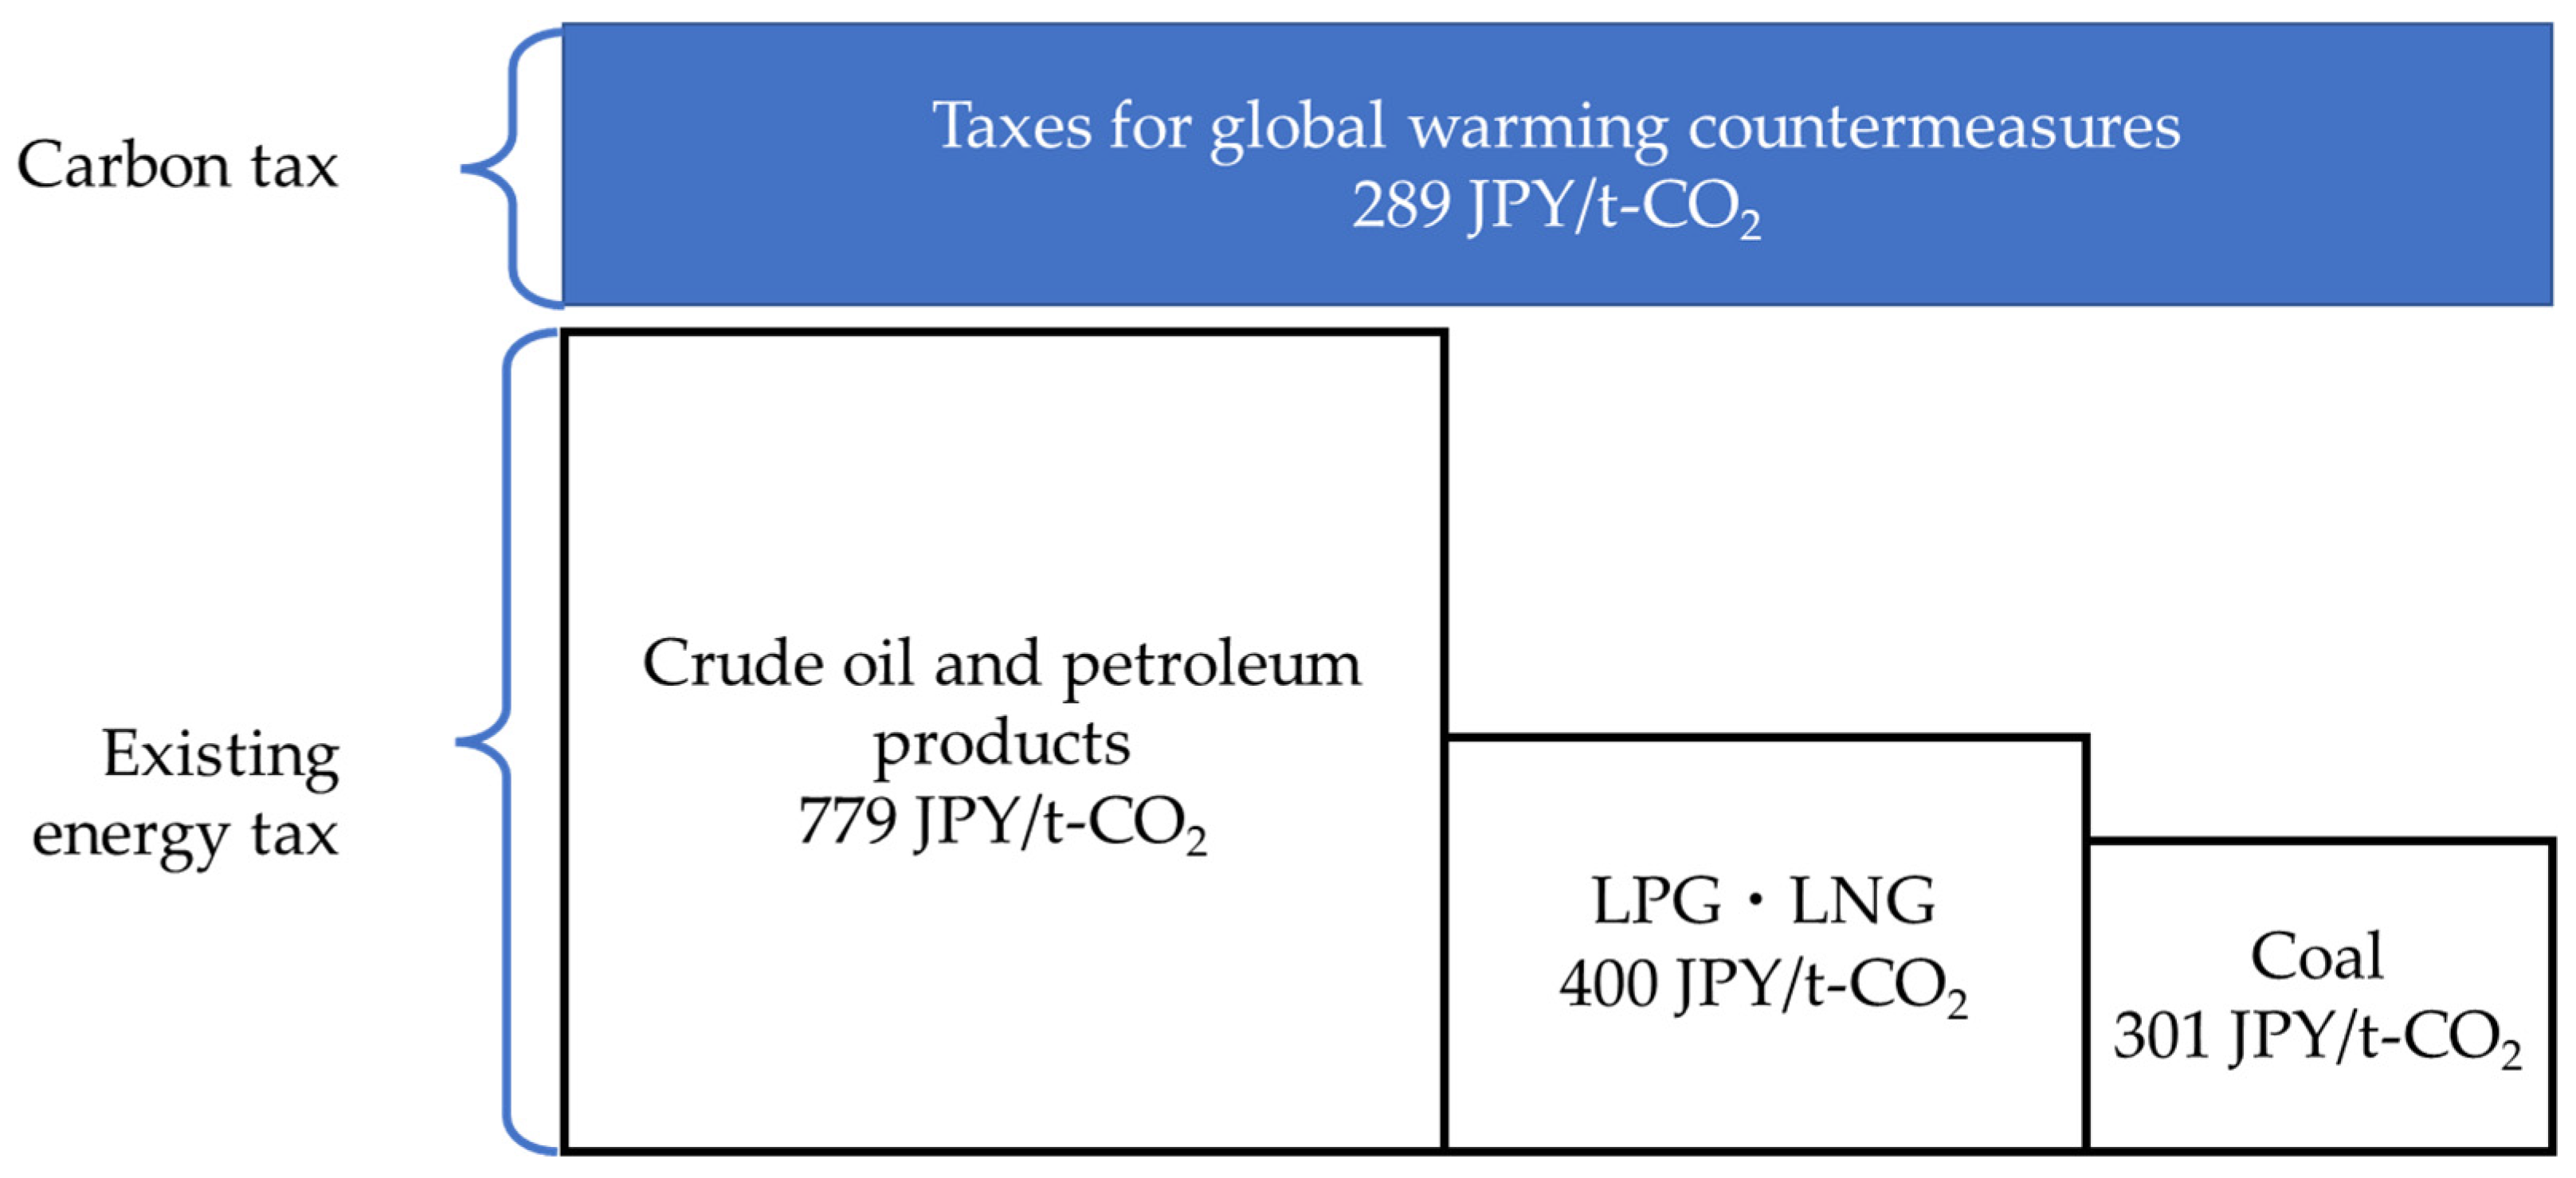
4. Data
5. Results and Discussion
5.1. Impact of Raising the TGWC in the PCT on Prices
5.2. Impact of Changes to the Main Tax Rate on the PCT on Prices
5.3. Contribution of Renewable Energy Power Generation to Curb Price Increases Due to Energy-Related Taxes
6. Conclusions
Author Contributions
Funding
Data Availability Statement
Conflicts of Interest
Appendix A. Creation of the 2015 Input-Output Table for Analysis of the Next-Generation Energy System
Appendix A.1. Power Transmission and Distribution Sectors
Appendix A.2. Private Power Generation Sector
Appendix A.3. Domestic Demand of the Power-Generation Equipment/Facility Construction Sector

| Million JPY | Composition Ratio | |
|---|---|---|
| Existing electric power incl. transmission and distribution facilities | 2,236,601 | 37.3% |
| Solar power (for residential use) | 318,342 | 5.3% |
| Solar power (for business) | 2,737,509 | 45.7% |
| Onshore wind power | 120,254 | 2.0% |
| Small- and medium-sized hydropower | 79,463 | 1.3% |
| Flash-type geothermal | - | 0.0% |
| Replenishment well of flash-type geothermal | 40,549 | 0.7% |
| Binary-type geothermal | 10,778 | 0.2% |
| Woody biomass (30,000 kW) | 34,593 | 0.6% |
| Woody biomass (5000 kW) | 82,510 | 1.4% |
| Woody biomass (2000 kW) | 1406 | 0.0% |
| Methane fermentation (raw garbage) | 13,972 | 0.2% |
| Methane fermentation (sewage sludge) | 588 | 0.0% |
| Methane fermentation (livestock manure) | 13,479 | 0.2% |
| Waste incineration (large-sized city) | 124,124 | 2.1% |
| Waste incineration (medium-sized city) | 179,879 | 3.0% |
| Total | 5,994,048 | 100.0% |
Appendix A.4. Domestic Demand of the Commercial Power-Generation Sector
| Million JPY | Composition Ratio | Composition Ratio for Renewable Energies | |
|---|---|---|---|
| Thermal power | 15,827,578 | 89.389% | |
| Nuclear power | 156,840 | 0.886% | |
| Hydropower (large-sized) | 1634,249 | 9.230% | |
| Solar power (for residential use) | 7888 | 0.045% | 8.99% |
| Solar power (for business) | 22,204 | 0.125% | 25.30% |
| Onshore wind power | 4359 | 0.025% | 4.97% |
| Offshore wind power | 12 | 0.00007% | 0.01% |
| Small and medium-sized hydropower | 1530 | 0.009% | 1.74% |
| Flash-type geothermal | 69 | 0.00039% | 0.08% |
| Binary-type geothermal | 64 | 0.00036% | 0.07% |
| Woody biomass (30,000 kW) | 7176 | 0.041% | 8.18% |
| Woody biomass (5000 kW) | 1487 | 0.008% | 1.70% |
| Woody biomass (2000 kW) | 48 | 0.00027% | 0.05% |
| Methane fermentation (raw garbage) | 9 | 0.00005% | 0.01% |
| Methane fermentation (sewage sludge) | 7 | 0.00004% | 0.01% |
| Methane fermentation (livestock manure) | 67 | 0.00038% | 0.08% |
| Waste incineration (large-sized city) | 19,570 | 0.111% | 22.30% |
| Waste incineration (medium-sized city) | 23,255 | 0.131% | 26.50% |
| Total | 17,706,412 | 100.000% |
Appendix A.5. Input Coefficient Vector of the Power-Generation Equipment/Facility Construction Sector
| For Residential Use | For Business | ||||||
|---|---|---|---|---|---|---|---|
| Details of BOS | Details of Others | ||||||
| Module | 0.397 | Module | 0.365 | ||||
| Invertor | 0.129 | Invertor | 0.610 | ||||
| BOS (balance of system) | 0.082 | Panel mount | 0.477 | Panel mount | 0.102 | ||
| H-shaped steel | 0.111 | Others | 0.086 | H-shaped steel | 0.083 | ||
| Junction box | 0.191 | Junction box | 0.142 | ||||
| Cubicle | 0.155 | Cubicle | 0.116 | ||||
| Data-measuring device | 0.042 | Data-measuring device | 0.032 | ||||
| Uninterruptible power system | 0.001 | Uninterruptible power system | 0.001 | ||||
| Display device | 0.023 | Display device | 0.017 | ||||
| PCS | 0.090 | ||||||
| Connection cost | 0.018 | ||||||
| Installation cost | 0.188 | Installation cost | 0.330 | ||||
| Margin | 0.203 | Others | 0.010 | ||||
| Total | 1.000 | 1.000 | 1.000 | 1.000 | |||
| Onshore Wind Power | Offshore Wind Power | ||
|---|---|---|---|
| Tower | 11.8% | Tower | 6.6% |
| Blade | 11.2% | Blade | 6.3% |
| Speed increaser (gear) | 10.1% | Speed increaser (gear) | 5.6% |
| Others | 8.9% | Others | 5.0% |
| Convertors | 3.0% | Convertor | 1.7% |
| Pitch and yaw mechanism | 3.0% | Pitch and yaw mechanism | 1.7% |
| Generator | 2.4% | Generator | 1.3% |
| Transformer | 2.4% | Transformer | 1.3% |
| Casting product | 1.8% | Casting product | 1.0% |
| Bearing | 1.8% | Bearing | 1.0% |
| Forged product | 1.8% | Forged product | 1.0% |
| Control device | 1.2% | Control device | 0.7% |
| Grid interconnection | 14.5% | Interconnection/submarine cable/substation, etc. | 12% |
| Survey cost and design | 2.9% | Project cost | 2% |
| Transportation and assembly | 23.4% | Transportation and installation | 19% |
| Construction and financing cost | 12% | ||
| Foundation work | 22% | ||
| Total | 100.0% | Total | 100.0% |
Appendix A.6. Input Coefficient Vector of the Power-Generation Equipment/Facility Construction Sector
References
- Arimura, T.H.; Matsumoto, S. Preface. In Carbon Pricing in Japan; Arimura, T.H., Matsumoto, S., Eds.; Economics, Law, and Institutions in Asia Pacific; Springer: Singapore, 2021; Available online: https://link.springer.com/content/pdf/bfm%3A978-981-15-6964-7%2F1.pdf (accessed on 7 February 2022).
- Ministry of the Environment, Central Environment Council Subcommittee on Utilization of Carbon Pricing Interim Arrangement. Available online: https://www.env.go.jp/council/06earth/setchukanseiri.pdf (accessed on 7 February 2022). (In Japanese)
- Kuranobu, T. A Study on the History of Gasoline Tax in Japan. Natl. Tax Coll. Ronsou 1981, 14, 52–135. Available online: https://www.nta.go.jp/about/organization/ntc/kenkyu/ronsou/14/123/ronsou.pdf (accessed on 7 February 2022). (In Japanese).
- Ministry of the Environment, Details on the Carbon Tax (Tax for Climate Change Mitigation). Available online: https://www.env.go.jp/en/policy/tax/env-tax/20121001a_dct.pdf (accessed on 7 February 2022).
- Kojima, S.; Asakawa, K. Expectations for Carbon Pricing in Japan in the Global Climate Policy Context. In Carbon Pricing in Japan; Arimura, T.H., Matsumoto, S., Eds.; Economics, Law, and Institutions in Asia Pacific; Springer: Singapore, 2021. [Google Scholar] [CrossRef]
- Ministry of the Environment, Subcommittee on Utilization of Carbon Pricing (13th) Document 2. Available online: https://www.env.go.jp/council/06earth/13_3.html (accessed on 7 February 2022). (In Japanese)
- Miller, R.E.; Blair, P.D. Input–Output Analysis Foundations and Extensions; Cambridge University Press: London, UK, 2009. [Google Scholar]
- Morgenstern, R.D.; Ho, M.; Shih, J.-S.; Zhang, X. The near-term impacts of carbon mitigation policies on manufacturing industries. Energy Policy 2004, 32, 1825–1841. [Google Scholar] [CrossRef] [Green Version]
- Grainger, C.A.; Kolstad, C.D. Who pays a price on carbon? Environ. Resour. Econ. 2010, 46, 359–376. [Google Scholar] [CrossRef] [Green Version]
- Sugino, M.; Arimura, T.H.; Morgenstern, R.D. The effects of alternative carbon mitigation policies on Japanese industries. Energy Policy 2013, 62, 1254–1267. [Google Scholar] [CrossRef]
- Jiang, Z.; Shao, S. Distributional effects of a carbon tax on Chinese households: A case of Shanghai. Energy Policy 2014, 73, 269–277. [Google Scholar] [CrossRef]
- Wu, S.; Lei, Y.; Li, S. Provincial carbon footprints and interprovincial transfer of embodied CO2 emissions in China. Nat. Hazards 2017, 85, 537–558. [Google Scholar] [CrossRef]
- Renner, S. Poverty and distributional effects of a carbon tax in Mexico. Energy Policy 2018, 112, 98–110. [Google Scholar] [CrossRef] [Green Version]
- Sugino, M. The Economic Effects of Equalizing the Effective Carbon Rate of Sectors: An Input-Output Analysis. In Carbon Pricing in Japan; Arimura, T.H., Matsumoto, S., Eds.; Economics, Law, and Institutions in Asia Pacific; Springer: Singapore, 2021. [Google Scholar] [CrossRef]
- Washizu, A.; Nakano, S. An Assessment of Carbon Taxation by Input–Output Analysis: Upstream or Downstream? In Carbon Pricing in Japan; Arimura, T.H., Matsumoto, S., Eds.; Economics, Law, and Institutions in Asia Pacific; Springer: Singapore, 2021. [Google Scholar] [CrossRef]
- Yan, J.; Yang, J. Carbon pricing and income inequality: A case study of Guangdong Province, China. J. Clean. Prod. 2021, 296, 126491. [Google Scholar] [CrossRef]
- Chen, W.; Qu, S.; Han, M.S. Environmental implications of changes in China’s inter-provincial trade structure. Resour. Conserv. Recycl. 2021, 167, 105419. [Google Scholar] [CrossRef]
- Fujikawa, K. About the burden of carbon tax by region and income group. Sangyo Renkan (Input-Output) 2002, 10, 35–42. Available online: https://www.jstage.jst.go.jp/article/papaios/10/4/10_35/_pdf/-char/ja (accessed on 7 February 2022). (In Japanese).
- Kameoka, R.; Arimura, T.H. The Impact of Carbon Tax and Feed-in Tariff on the Industry and Household Expenditure an Input-output Analysis. Soc.Env. Sci. JPN 2019, 32, 103–112. Available online: https://www.jstage.jst.go.jp/article/sesj/32/4/32_320401/_pdf/-char/ja (accessed on 7 February 2022). (In Japanese).
- Phungrassami, H.; Usubharatana, P. Fossil fuel carbon taxation policy effect on thai household expenditure using input–output price structural path model. Environ. Prog Sustain. Energy 2019, 38, 13183. [Google Scholar] [CrossRef]
- Saelim, S. Carbon tax incidence on household consumption: Heterogeneity across socio-economic factors in Thailand. Econ. Anal. Policy 2019, 62, 159–174. [Google Scholar] [CrossRef]
- Ma, N.; Li, H.; Wang, Y.; Zhang, J.; Li, Z.; Arif, A. The short-term roles of sectors during a carbon tax on Chinese economy based on complex network: An in-process analysis. J. Clean. Prod. 2020, 251, 119560. [Google Scholar] [CrossRef]
- Ma, N.; Li, H.; Zhang, J.; Han, X.; Feng, S.; Arif, A. The short-term price effects and transmission mechanism of CO2 cost pass-through in China: A partial transmission model. Resour. Policy 2021, 70, 101972. [Google Scholar] [CrossRef]
- Zou, Y.; Wang, S.; Mizunoya, T.; Yabar, H.; Higano, Y. Research on environmental tax with emphasis on developing renewable energy in Beijing, China. J. Sustain. Dev. 2014, 7, 78–88. [Google Scholar] [CrossRef] [Green Version]
- Zhang, H.; Hewings, G.J.D.; Zheng, X. The effects of carbon taxation in China: An analysis based on energy input-output model in hybrid units. Energy Policy 2019, 128, 223–234. [Google Scholar] [CrossRef]
- Nakano, K.; Yamagishi, K. Impact of carbon tax increase on product prices in Japan. Energies 2021, 14, 1986. [Google Scholar] [CrossRef]
- Huang, S.K.; Kuo, L.; Chou, K.L. The applicability of marginal abatement cost approach: A comprehensive review. J. Clean. Prod. 2016, 1127, 59–71. [Google Scholar] [CrossRef]
- Ministry of Finance, Materials on Automobile-Related Taxes and Energy-Related Taxes. Available online: https://www.mof.go.jp/tax_policy/summary/consumption/d10.htm (accessed on 7 February 2022). (In Japanese)
- Ministry of the Environment, Subcommittee on Utilization of Carbon Pricing (16th) Document 1–2. Available online: https://www.env.go.jp/council/06earth/16_3.html (accessed on 7 February 2022). (In Japanese)
- Cost Verification Committee Report. Available online: https://www.cas.go.jp/jp/seisaku/npu/policy09/archive02_hokoku.html (accessed on 7 February 2022). (In Japanese)
- Procurement Price Calculation Committee Report FY2015. Available online: https://www.meti.go.jp/shingikai/santeii/pdf/report_005_01_00.pdf (accessed on 7 February 2022). (In Japanese)
- Nakano, S.; Washizu, A. Creation and application of the 2011 input-output table for analysis of next-generation energy system. Sangyo Renkan (Input-Output) 2020, 27, 90–105. (In Japanese) [Google Scholar] [CrossRef] [Green Version]
- Agency for Natural Resources and Energy, The 6th Strategic Energy Plan. Available online: https://www.enecho.meti.go.jp/en/category/others/basic_plan/pdf/6th_outline.pdf (accessed on 7 February 2022).
- Nakano, S.; Washizu, A. Creation and Application of the 2015 Input-Output Table for Analysis of Next-Generation Energy Systems: Analysis of the Effects of Introducing Carbon Tax, RIEEM Discussion Paper Series, No.2103. Available online: https://www.waseda.jp/prj-rieem/dp/dp2103.pdf (accessed on 7 February 2022).
- Procurement Price Calculation Committee, the 24th meeting of the FY2016, Document No.1. Available online: https://www.meti.go.jp/shingikai/santeii/pdf/024_01_00.pdf (accessed on 7 February 2022). (In Japanese)
- Procurement Price Calculation Committee, the 23th meeting of the FY2016, Document No.1. Available online: https://www.meti.go.jp/shingikai/santeii/pdf/023_01_00.pdf (accessed on 7 February 2022). (In Japanese)
- Procurement Price Calculation Committee, the 20th meeting of the FY2015, Document No.1. Available online: https://www.meti.go.jp/shingikai/santeii/pdf/020_01_00.pdf (accessed on 7 February 2022). (In Japanese)
- Kimura, K. Solar Power Generation, Japanese Market Is Stable, but Costs Are Declining. Available online: https://www.renewable-ei.org/activities/column/REupdate/20210705.php (accessed on 7 February 2022). (In Japanese).
- Japan Society of Industrial Machinery Manufacturers (JSIM). Research Report on the Wind Power Generation Related Equipment Industry; Japan Society of Industrial Machinery Manufacturers: Tokyo, Japan, 2017. (In Japanese) [Google Scholar]
- IEA. IEA Wind TCP Annual Report 2015. Available online: https://ore.catapult.org.uk/wp-content/uploads/2018/02/2015_IEA_Wind_TCP_Annual_Report.pdf (accessed on 7 February 2022).

| Unit | Energy-Related Taxes Excl. the PCT | Petroleum and Coal Tax (PCT) | Incl. | Simulation Scenario * | |||||
|---|---|---|---|---|---|---|---|---|---|
| Main Tax Rate | TGWC | S1 | S2 | S3 | S4 | ||||
| Crude petroleum | kL | 2800 | 2040 | 760 | 2620 | 7860 | 13,100 | 26,200 | |
| Petroleum refinery product (imported) | kL | 2800 | 2040 | 760 | 2620 | 7860 | 26,200 | ||
| Gasoline | kL | 53,800 | |||||||
| Jet fuel oil | kL | 18,000 | |||||||
| Light oil | kL | 32,100 | |||||||
| LPG (imported) | t | 1860 | 1080 | 780 | 2700 | 8100 | 13,500 | 27,000 | |
| LPG (for motor vehicle) | t | 17,500 | |||||||
| LNG | t | 1860 | 1080 | 780 | 2700 | 8100 | 13,500 | 27,000 | |
| Coal | t | 1370 | 700 | 670 | 2330 | 6990 | 11,650 | 23,300 | |
| Electricity | 106 kWh | 375,000 | |||||||
| Capacity | Generation (MWh/Year) | Utilization Rate | Unit Cost for Construction (Thousand JPY/kW) | Operation Cost (Thousand JPY/kW /Year) | Purchase Price under the FIT (JPY/kWh) | Service Life | ||
|---|---|---|---|---|---|---|---|---|
| Solar power (for residential use) | 4 | kW | 4 | 0.12 | 369.0 | 3.6 | 34.00 | 30 |
| Solar power (for business) | 1200 | kW | 1472 | 0.14 | 307.5 | 6.0 | 27.50 | 30 |
| Onshore wind power | 20,000 | kW | 35,040 | 0.2 | 300.0 | 6.0 | 22.00 | 20 |
| Offshore wind power | 150,000 | kW | 394,200 | 0.3 | 565.0 | 22.5 | 36.00 | 20 |
| Small- and medium-sized hydropower | 199 | kW | 1046 | 0.6 | 800.0 | 75.0 | 25.00 | 40 |
| Flash-type geothermal | 30,000 | kW | 218,124 | 0.83 | 790.0 | 33.0 | 26.00 | 40 |
| Binary-type geothermal | 50 | kW | 394 | 0.9 | 1230.0 | 48.0 | 40.00 | 40 |
| Woody biomass (30,000 kW) | 30,000 | kW | 217,016 | 0.826 | 296.7 | Operation costs are estimated based on each source | 24.00 | 40 |
| Woody biomass (5000 kW) | 5000 | kW | 34,164 | 0.780 | 530.0 | 32.00 | 40 | |
| Woody biomass (2000 kW) | 1990 | kW | 13,474 | 0.773 | 713.6 | 40.00 | 40 | |
| Methane fermentation (raw garbage) | 50 | t/day | 785 | 0.300 | 8034.6 | 39.00 | 30 | |
| Methane fermentation (sewage sludge) | 161 | m3/day | 1486 | 0.355 | 535.8 | 39.00 | 30 | |
| Methane fermentation (livestock manure) | 95 | t/day | 1977 | 0.752 | 2650.0 | 39.00 | 30 | |
| Waste incineration (large-sized city) | 600 | t/day | 26,685 | 0.650 | 4744.3 | 17.00 | 40 | |
| Waste incineration (medium-sized city) | 300 | t/day | 13,350 | 0.650 | 5785.9 | 17.00 | 40 | |
| Rank | Sector | Proportion |
|---|---|---|
| 1 | Self-transport | 17.41% |
| 2 | Miscellaneous mining industry | 5.51% |
| 3 | Electricity (methane fermentation gas (livestock waste)) | 4.94% |
| 4 | Road transport (except self-transport) | 4.21% |
| 5 | Petrochemical basic products | 3.53% |
| 6 | Electricity (thermal power) | 3.39% |
| 7 | Coal products | 2.73% |
| 8 | Air transport | 2.72% |
| 9 | Wooden chips (for power generation) | 2.37% |
| 10 | Private power generation (thermal power) | 2.28% |
| Scenario S1 * | Scenario S2 | |||
| Rank | Sector | Rate | Sector | Rate |
| 1 | Coal products | 2.73% | Coal products | 10.39% |
| 2 | Electricity (thermal power) | 2.20% | Electricity (thermal power) | 8.39% |
| 3 | Private power generation (thermal power) | 1.92% | Private power generation (thermal power) | 7.31% |
| 4 | Petrochemical basic products | 1.64% | Petrochemical basic products | 6.26% |
| 5 | Gas and heat supply | 1.43% | Gas and heat supply | 5.46% |
| 6 | Organic chemical products | 0.73% | Organic chemical products | 2.78% |
| 7 | Self-transport | 0.71% | Self-transport | 2.69% |
| 8 | Synthetic fibers | 0.64% | Synthetic fibers | 2.43% |
| 9 | Synthetic resins | 0.59% | Synthetic resins | 2.25% |
| 10 | Pig iron and crude steel | 0.58% | Pig iron and crude steel | 2.22% |
| Scenario S3 | Scenario S4 | |||
| Rank | Sector | Rate | Sector | Rate |
| 1 | Coal products | 18.05% | Coal products | 37.20% |
| 2 | Electricity (thermal power) | 14.59% | Electricity (thermal power) | 30.06% |
| 3 | Private power generation (thermal power) | 12.69% | Private power generation (thermal power) | 26.16% |
| 4 | Petrochemical basic products | 10.87% | Petrochemical basic products | 22.41% |
| 5 | Gas and heat supply | 9.49% | Gas and heat supply | 19.56% |
| 6 | Organic chemical products | 4.83% | Organic chemical products | 9.95% |
| 7 | Self-transport | 4.68% | Self-transport | 9.65% |
| 8 | Synthetic fibers | 4.22% | Synthetic fibers | 8.71% |
| 9 | Synthetic resins | 3.92% | Synthetic resins | 8.08% |
| 10 | Pig iron and crude steel | 3.86% | Pig iron and crude steel | 7.96% |
| Rank | Sector | Rate |
|---|---|---|
| 1 | Coal products | 1.78% |
| 2 | Electricity (thermal power) | 1.19% |
| 3 | Private power generation (thermal power) | 1.09% |
| 4 | Gas and heat supply | 0.75% |
| 5 | Pig iron and crude steel | 0.35% |
| 6 | Synthetic fibers | 0.29% |
| 7 | Pulp, paper, paperboard, coated and glazed paper | 0.26% |
| 8 | Steel products | 0.25% |
| 9 | Chemical fertilizer | 0.25% |
| 10 | Cast and forged steel products (iron) | 0.23% |
| Scenario S1 * | Scenario S2 | |||
| Rank | Sector | Rate | Sector | Rate |
| 1 | Coal products | 4.50% | Coal products | 12.17% |
| 2 | Electricity (thermal power) | 3.40% | Electricity (thermal power) | 9.59% |
| 3 | Private power generation (thermal power) | 3.01% | Private power generation (thermal power) | 8.40% |
| 4 | Gas and heat supply | 2.19% | Petrochemical basic products | 6.47% |
| 5 | Petrochemical basic products | 1.86% | Gas and heat supply | 6.22% |
| 6 | Organic chemical products | 0.94% | Organic chemical products | 2.99% |
| 7 | Pig iron and crude steel | 0.94% | Synthetic fibers | 2.72% |
| 8 | Synthetic fibers | 0.92% | Self-transport | 2.71% |
| 9 | Pulp, paper, paperboard, coated and glazed paper | 0.76% | Pig iron and crude steel | 2.58% |
| 10 | Chemical fertilizer | 0.75% | Synthetic resins | 2.38% |
| Scenario S3 | Scenario S4 | |||
| Rank | Sector | Rate | Sector | Rate |
| 1 | Coal products | 19.83% | Coal products | 38.98% |
| 2 | Electricity (thermal power) | 15.78% | Electricity (thermal power) | 31.26% |
| 3 | Private power generation (thermal power) | 13.78% | Private power generation (thermal power) | 27.25% |
| 4 | Petrochemical basic products | 11.09% | Petrochemical basic products | 22.63% |
| 5 | Gas and heat supply | 10.25% | Gas and heat supply | 20.32% |
| 6 | Organic chemical products | 5.04% | Organic chemical products | 10.16% |
| 7 | Self-transport | 4.70% | Self-transport | 9.67% |
| 8 | Synthetic fibers | 4.51% | Synthetic fibers | 8.99% |
| 9 | Pig iron and crude steel | 4.21% | Pig iron and crude steel | 8.31% |
| 10 | Synthetic resins | 4.05% | Synthetic resins | 8.21% |
Publisher’s Note: MDPI stays neutral with regard to jurisdictional claims in published maps and institutional affiliations. |
© 2022 by the authors. Licensee MDPI, Basel, Switzerland. This article is an open access article distributed under the terms and conditions of the Creative Commons Attribution (CC BY) license (https://creativecommons.org/licenses/by/4.0/).
Share and Cite
Nakano, S.; Washizu, A. A Study on Energy Tax Reform for Carbon Pricing Using an Input-Output Table for the Analysis of a Next-Generation Energy System. Energies 2022, 15, 2162. https://doi.org/10.3390/en15062162
Nakano S, Washizu A. A Study on Energy Tax Reform for Carbon Pricing Using an Input-Output Table for the Analysis of a Next-Generation Energy System. Energies. 2022; 15(6):2162. https://doi.org/10.3390/en15062162
Chicago/Turabian StyleNakano, Satoshi, and Ayu Washizu. 2022. "A Study on Energy Tax Reform for Carbon Pricing Using an Input-Output Table for the Analysis of a Next-Generation Energy System" Energies 15, no. 6: 2162. https://doi.org/10.3390/en15062162